Article

RANet: A Reliability-Guided Aggregation Network for Hyperspectral and RGB Fusion Tracking

1
College of Information and Communication Engineering, Harbin Engineering University, Harbin 150001, China
2
Key Laboratory of Advanced Marine Communication and Information Technology, Ministry of Industry and Information Technology, Harbin Engineering University, Harbin 150001, China
*
Author to whom correspondence should be addressed.
Remote Sens. 2022, 14(12), 2765; https://doi.org/10.3390/rs14122765
Submission received: 11 April 2022 / Revised: 3 June 2022 / Accepted: 5 June 2022 / Published: 9 June 2022

Abstract

:
Object tracking based on RGB images may fail when the color of the tracked object is similar to that of the background. Hyperspectral images with rich spectral features can provide more information for RGB-based trackers. However, there is no fusion tracking algorithm based on hyperspectral and RGB images. In this paper, we propose a reliability-guided aggregation network (RANet) for hyperspectral and RGB tracking, which guides the combination of hyperspectral information and RGB information through modality reliability to improve tracking performance. Specifically, a dual branch based on the Transformer Tracking (TransT) structure is constructed to obtain the information of hyperspectral and RGB modalities. Then, a classification response aggregation module is designed to combine the different modality information by fusing the response predicted through the classification head. Finally, the reliability of different modalities is also considered in the aggregation module to guide the aggregation of the different modality information. Massive experimental results on the public dataset composed of hyperspectral and RGB image sequences show that the performance of the tracker based on our fusion method is better than that of the corresponding single-modality tracker, which fully proves the effectiveness of the fusion method. Among them, the RANet tracker based on the TransT tracker achieves the best performance accuracy of 0.709, indicating the effectiveness and superiority of the RANet tracker.

Graphical Abstract

1. Introduction

Object tracking has been widely used in remote sensing, such as intelligent monitoring [1,2], military reconnaissance [3], and geographical survey [4]. The purpose is to estimate the status of the object in subsequent frames through the state of the object in the initial frame (e.g., location, size). Many object tracking algorithms are developed based on the RGB image [5,6], but the RGB image is only composed of red, green, and blue color channels, which easily lead to the tracking algorithm based on the RGB image not being able to accurately predict the position of objects when different substances have a similar appearance. Compared with the RGB image, the hyperspectral image (HSI) has rich spectral features, which can provide more discriminative information for distinguishing objects and backgrounds. Therefore, adding hyperspectral information to the tracking process based on the RGB image is conducive to alleviating the problem of limited tracking performance caused by the inherent defects of RGB images. It is regretful that there is no fusion tracking algorithm based on pairs of hyperspectral and RGB image sequences, which promotes our exploration of how to effectively combine the information of hyperspectral and RGB modalities to improve the tracking performance.
RGB images are the main research object in the field of object tracking. Many tracking algorithms have been developed for RGB images [7,8]. Object tracking methods based on RGB images are mainly divided into two kinds—one is using the correlation filter method to achieve tracking [9,10] and the other is using the deep-learning method to predict the object position [11,12]. The features extracted using the deep learning method have strong competitiveness [13], which can obtain more information than that obtained from the correlation filter method (such as handcrafted grayscale features, histogram of oriented gradients (HOG) [9] and other traditional descriptors [14,15]). Due to the better tracking performance, a series of Siamese trackers [16,17,18] based on deep learning has become a research focus in recent years, such as SiamRPN [19], SiamCAR [20], and SiamFC++ [21]. For most Siamese-based trackers, the correlation between the template and the search regions plays a critical role in predicting the object location. However, the correlation network of trackers based on Siamese cannot fully use context information, which leads to a decrease in the accuracy of the tracking algorithms. Unlike the trackers mentioned, Transformer Tracking (TransT) [22] effectively integrates the features of the template patch and the search region by processing the attention module of Transformer, producing more semantic feature maps than correlation. Despite the research of the trackers based on RGB images having acquired achievements, RGB images easily cause the trackers to drift when the color between the tracking object and the background [23] is similar. However, in this case, the deep features of the foreground and background are different.
Compared with RGB images, HSIs include more details, which can reveal inconspicuous content in RGB images [24,25,26,27]. Since HSIs have rich spectral information, object tracking algorithms based on HSIs have gradually been paid attention to in recent years. In particular, the first public hyperspectral dataset significantly promoted the research of hyperspectral object tracking. Many works have been conducted on this dataset, such as MHT [28], MFI-HVT [29], BAE-Net [30], and SST-Net [31]. MHT [28] explores the role of material information, which describes spectral–spatial information and material composition distribution of spectral images through multi-dimensional oriented gradients and abundance features. MFI-HVT [29] deals with feature maps generated by HOG and the VGG-19 network to track the object. MHT and MFI-HVT have a common characteristic, which is to predict the position of the object by selecting specific features. However, the representation ability of specific features is generally lower than that of features extracted by the methods based on deep learning. Therefore, how to apply the deep-learning method to hyperspectral object tracking becomes important. Due to the limited quantity of HSI sequences, the requirement of a large number of training samples for deep learning is not satisfied, which confines the development of the hyperspectral object tracking method based on deep learning. However, BAE-Net [30] and SST-Net [31] break the deadlock by inputting multiple three-channel images generated by the band attention network into the trackers based on deep learning for ensemble tracking. Although the tracking algorithms based on HSIs have achieved initial development, the success rate of hyperspectral object tracking is seriously limited by the inherent defects of hyperspectral modality images, for example, low resolution [32].
Fusion tracking can improve the performance of tracking algorithms by combining the advantage features from different modality images. The fusion tracking task based on hyperspectral and RGB modalities faces three challenges: modality-specific (MS) representations acquisition, multi-modality information combination, and different modality reliability evaluations. Among them, MS representations refer to information obtained from a specific modality. First, fully obtaining MS representations of different modalities is the basis for effectively utilizing multi-modality images for the fusion tracking task. An important factor affecting the acquisition of MS representations is the information transmitted from the template patch to the search region. Most popular single-modality trackers rely on correlation to integrate object information into regions of interest. However, the related operation is the linear transfer of local features between the template patch and the search region, which ignores the nonlinear interaction of global information, limiting the full capture of modality features. Second, effectively combining the information of different modalities is the key to improving the fusion tracking performance. Most fusion tracking methods [23,33,34] have been studied on the dataset which consists of pairs of RGB and infrared image sequences. At present, most of them tend to fuse the features of different modalities for tracking. For example, DsiamFMT [34] and SiamFT [35] are the typical fusion tracking algorithms based on the feature-level, which adaptively fuse the convolution features obtained by processing diverse images with two branches of the Siamese network. However, these methods are prone to generating pseudo-features, which easily leads to object location prediction failure. In addition, effectively evaluating the reliability of different modality images is also an important factor affecting the performance of the fusion tracking task. The reliability of different modality images is inconsistent under different conditions. For example, when the appearance difference between the object and the background is noticeable, the features (such as color and texture) provided by the RGB images are more conducive for tracking, so the RGB modality is more reliable than the hyperspectral modality. However, it is difficult to distinguish the object from the surrounding environment under poor illumination conditions only based on visual information. Thus the HSIs which can provide rich spectral information is more reliable than RGB images. To this end, to ensure that a more reliable modality plays a more important role in multi-modality fusion tracking, it is necessary to evaluate the reliability of different modalities effectively.
To address the mentioned issues, we propose a novel reliability-guided aggregation network (RANet) for hyperspectral and RGB fusion tracking to improve the object tracking performance by efficiently combining the information of different modalities. As far as we know, the tracking method named TransT proposed in [22] is the first method to consider using Transformer for object tracking. It conducts global nonlinear interaction between the information of the template patch and the search region through the attention module in Transformer, thus generating MS representations with richer semantic information. Inspired by the TransT algorithm, we construct a dual TransT branch structure for processing hyperspectral and RGB images to obtain MS representations of different modalities fully. Then, we employ different MS representations to improve the classification ability of the tracking network. In addition, due to the inconsistent reliability of hyperspectral and RGB modality data under different conditions, we also consider the effect of the modality reliability on the tracking performance. This is the first work that performs the tracking task based on hyperspectral and RGB data. Our main contributions are summarized as follows:
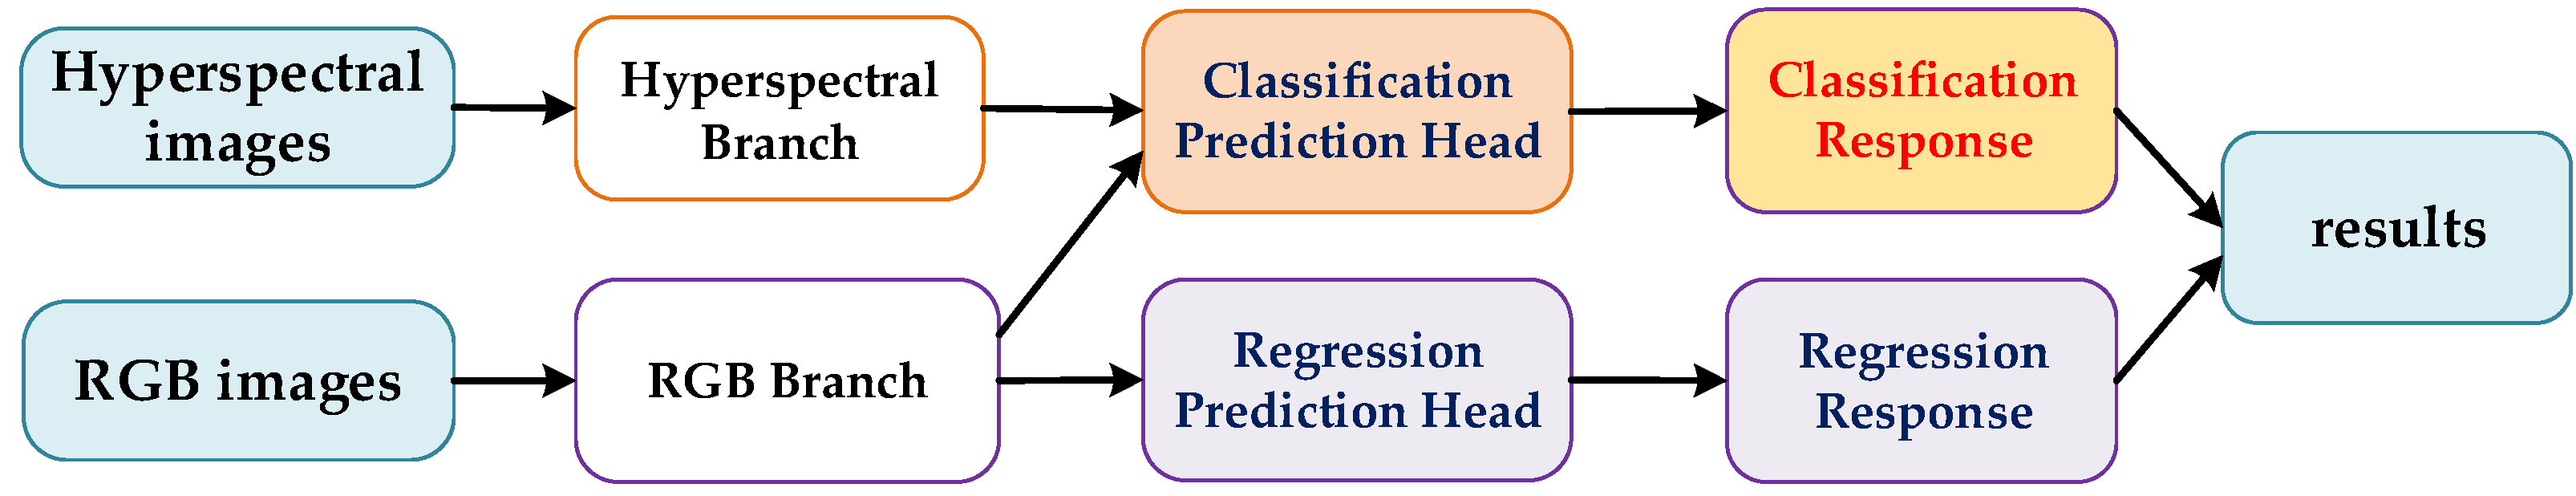
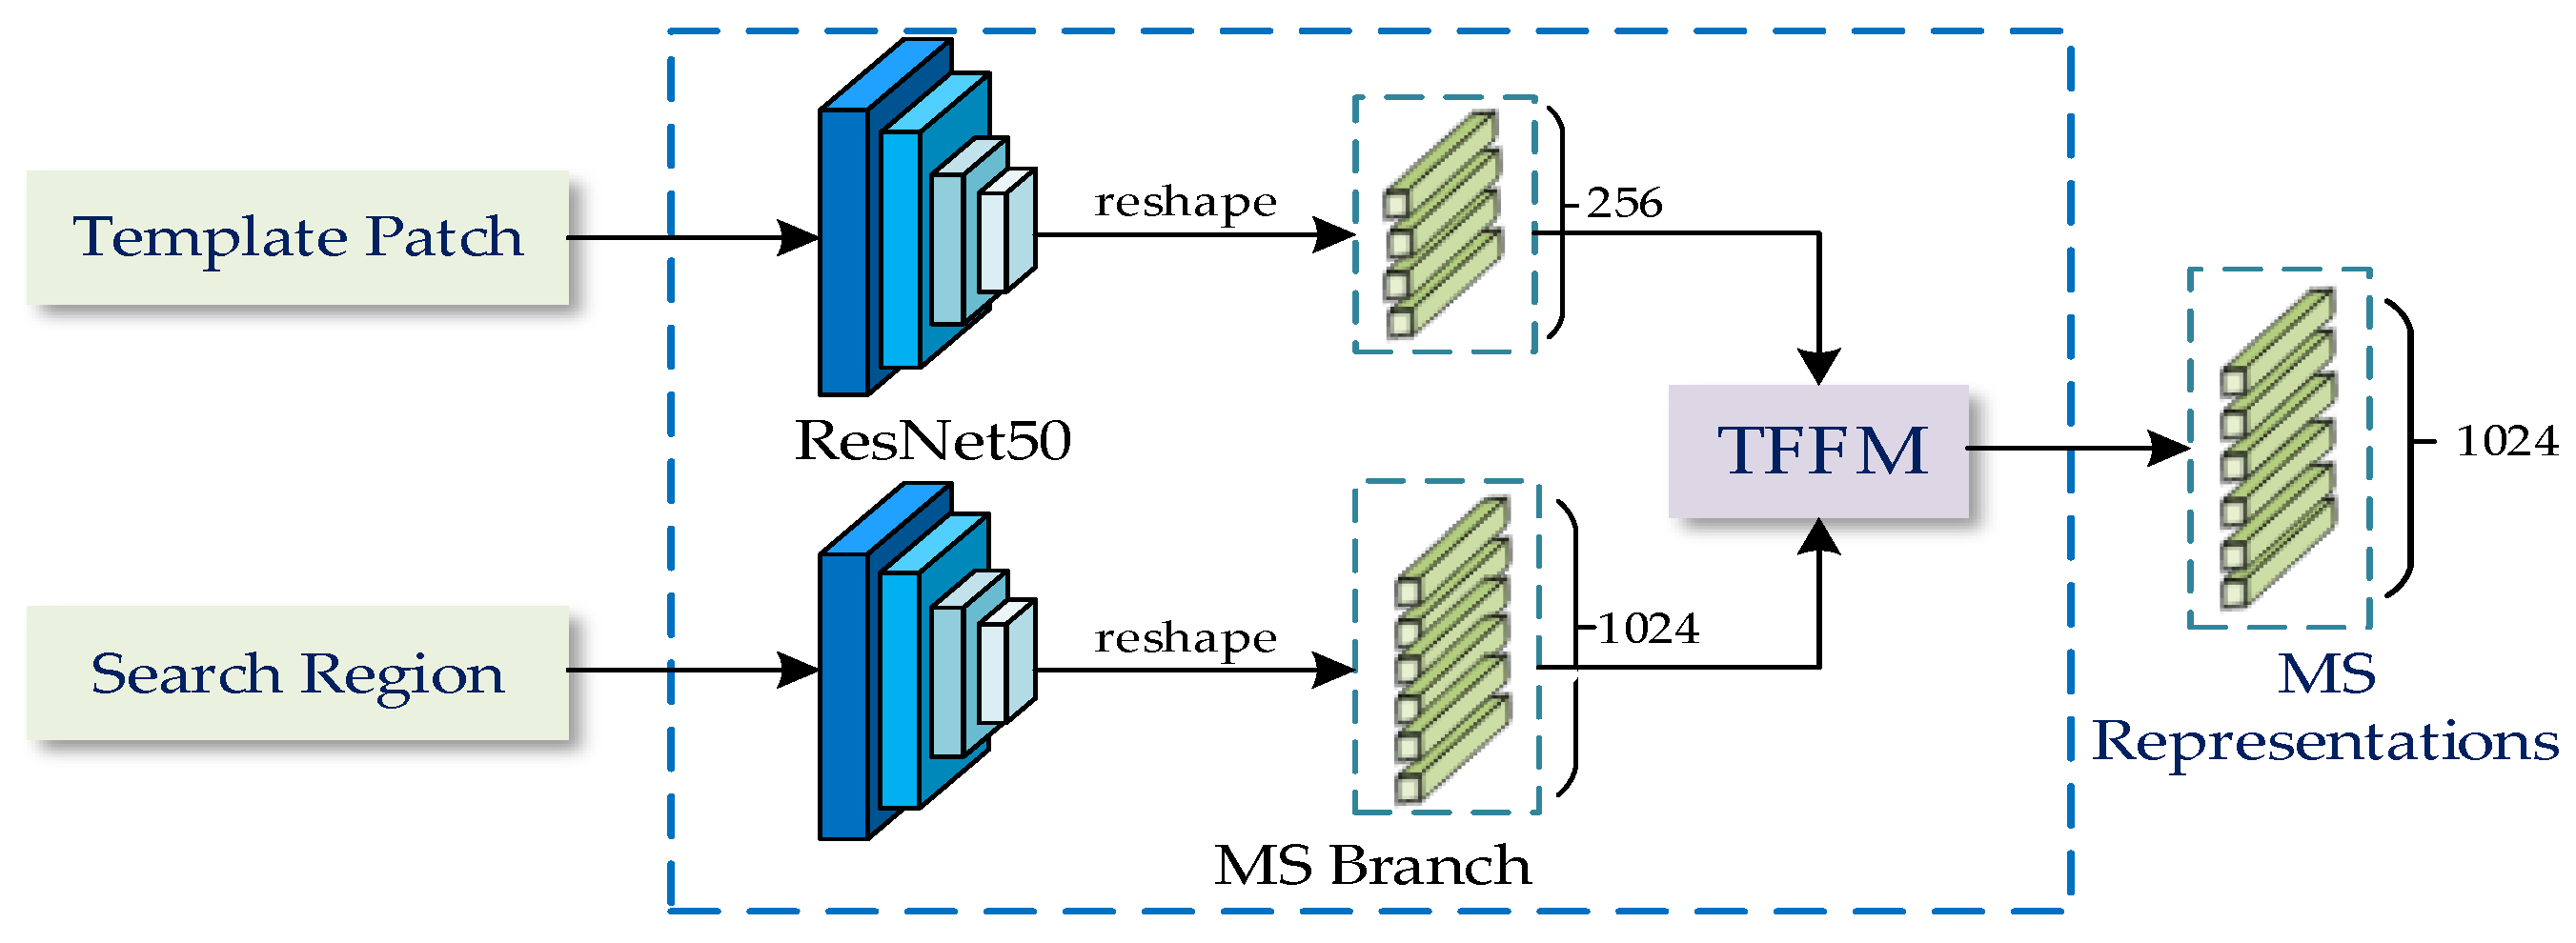
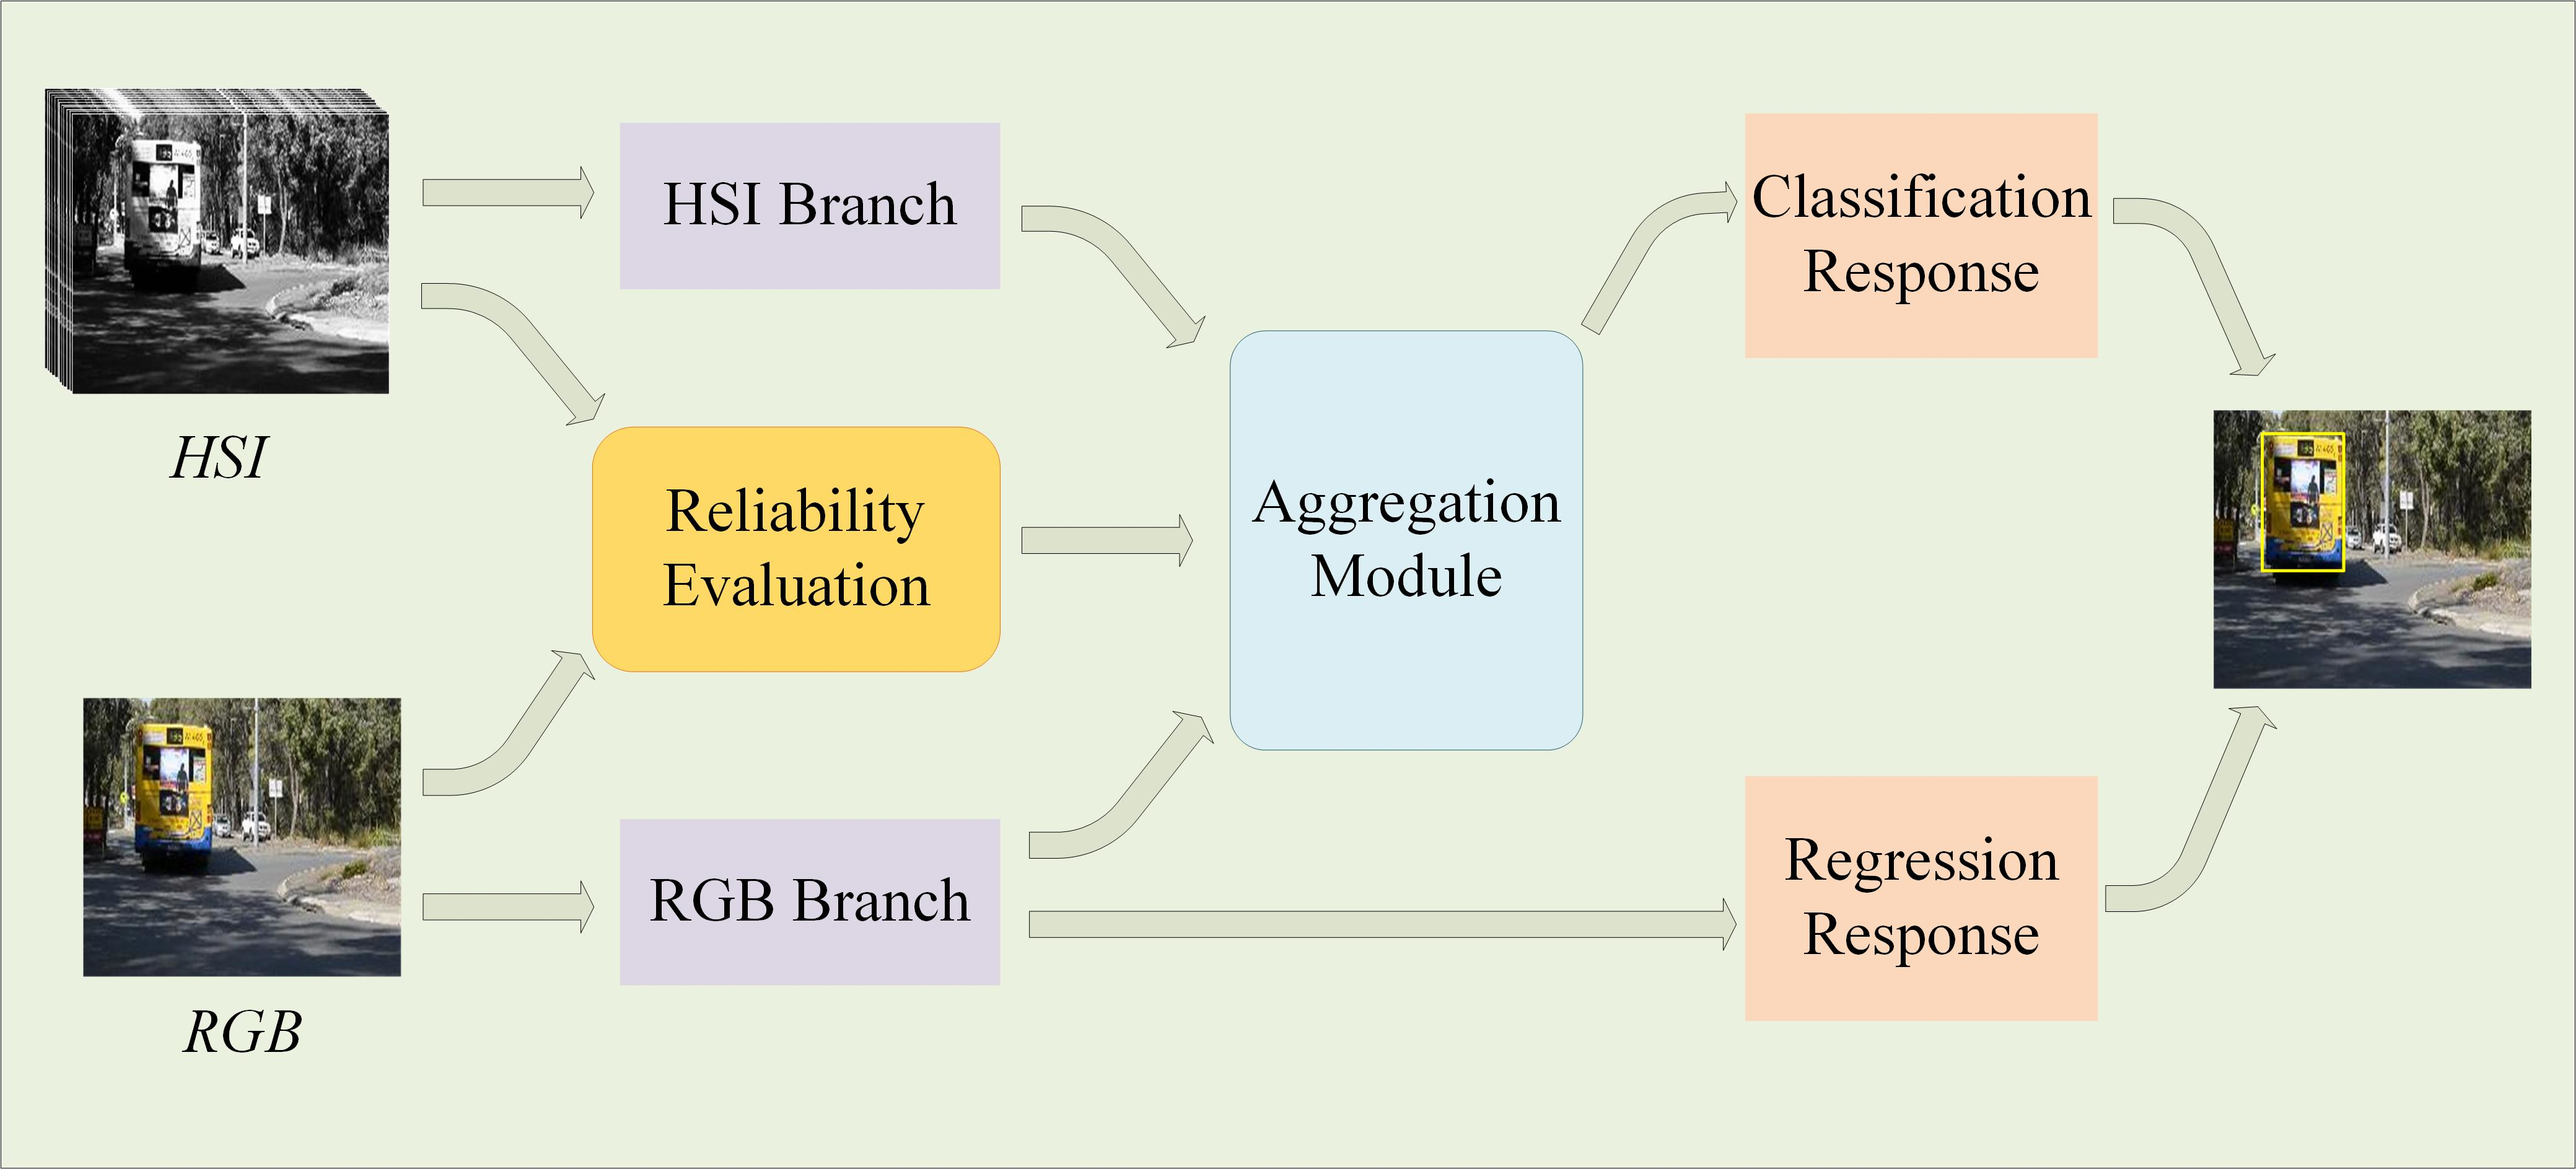
  • We construct a dual TransT structure as MS branches to fully extract semantic features of muti-modality images. Two branches are employed to process hyperspectral and RGB images to obtain MS representations, respectively. To the best of our knowledge, this is the first work that Transformer is introduced into fusion tracking based on hyperspectral and RGB images;
  • We design a classification response aggregation module to combine the complementary information of different modality images effectively. Different responses generated by the MS representations predicted by the classification head are fused as the final classification response. The purpose is to enhance the ability of the tracking network to distinguish objects and backgrounds by using multi-modality information;
  • We propose a method to evaluate the reliability of hyperspectral and RGB modalities to predict the contribution of different modalities for the tracking task. By reducing the noise effect of low-reliability modality data and making a more reliable modality play a greater contribution in the classification task to guide the aggregation of different modality information, which can maximize the aggregation module in improving the tracking performance.
The rest of this paper is organized as follows: Section 2 describes reliability-aware aggregation network in detail. The experimental details and results are presented in Section 3. In Section 4, the ablation study and analysis are presented and the discussion is introduced in Section 5. Finally, Section 6 concludes the paper.

2. Methods

2.1. Network Architecture

In this paper, we propose a network that implements fusion tracking by combining the information of hyperspectral and RGB images. The flowchart of the proposed RANet is shown in Figure 1. The tracking task is divided into two sub-tasks: classification prediction and regression prediction, which are used to obtain the classification results of the object and background and the normalized regression coordinates of the object. Due to the small amount of hyperspectral video data, the generalization ability of the feature extracted based on this modality is poor; overusing these modality features will inhibit the object tracking ability. Therefore, we use multi-modality information to enhance the ability of the tracking network to distinguish between object and background and then use RGB modality features with high generalization ability to predict the object bounding box to maximize the performance of the tracking network.
The network architecture of the proposed RANet is shown in Figure 2. The RANet contains two MS branches, two classification prediction heads, and a regression prediction head, which are used to obtain the MS representations of multi-modality data, predict the object/background, and predict the regression box of the object. As we can see, the template patch and the search region of the hyperspectral image and the RGB image are the input of this network. In general, the first frame image containing the object state in the video is taken as the object frame image. The template patch that includes the object’s information and its local surrounding scene is extended by twice the side length from the center of the object in the object frame image and is reshaped to 128 × 128. The search region covering the range of possible objects in the current frame is expanded four times the side length from the center of the object in the previous frame and is reshaped to 256 × 256. The template patch and the search region are taken as the inputs of the MS branch to extract the MS representations.
Hyperspectral and RGB MS representations are obtained by two MS branches, respectively. To improve the classification ability of the fusion tracking network, we input hyperspectral and RGB MS representations into the proposed classification response aggregation module to generate the fused classification response. Specifically, two MS representations are processed separately by the classification prediction head to obtain the classification response of hyperspectral and RGB, and then combine them to generate the final classification response. In particular, to maximize the role of the aggregation module, we consider the reliability of different modality images to adjust the MS representations used for classification tasks. In addition, the regression prediction head predicts the RGB MS representations to generate the regression response. Eventually, the fused classification response and the regression response jointly predict the object’s state in the current frame. The proposed RANet method is shown in Algorithm 1.
Algorithm 1 Reliability-guided Aggregation Network (RANet)
Input: HSI and RGB sequences and the object state (ground truth) in first frame, and α and β are the contribution values of hyperspectral modality and RGB modality, respectively;
Output: State (position and size) of the object in each frame;
 1:
Tracking:
 2:
for each frame i do
 3:
    if i is first frame then
 4:
        Crop HSI to obtain the HSI template patch H t ;
 5:
        Crop RGB to obtain the RGB template patch C t ;
 6:
        Calculate the HSI reliability H r ;
 7:
        Calculate the RGB reliability C r ;
 8:
    else
 9:
        Crop HSI to obtain the HSI search region H s ;
10:
        Crop RGB to obtain the RGB search region C s ;
11:
        Put H t and H s into the HSI MS branch to obtain the HSI MS representations H m s r ;
12:
        Put C t and C s into the RGB MS branch to obtain the RGB MS representations C m s r ;
13:
        if  H r > C r  then
14:
            α > β and α + β = 1;
15:
        else
16:
            α < β and α + β = 1;
17:
        end if
18:
        Put α × H m s r into the classification prediction head to obtain the HSI classification response H c r ;
19:
        Put β × C m s r into the classification prediction head to obtain the RGB classification response C c r ;
20:
        The classification response F c = H c r + C c r ;
21:
        Put C m s r into the regression prediction head to obtain the regression response F r ;
22:
        The final location of the object is determined by F c and F r ;
23:
    end if
24:
end for

2.2. Modality-Specific Branch

MS branch is the key to effectively obtaining MS representations of different modalities. This branch mainly includes the backbone part for feature extraction and the information transfer part for combining the features of the template patch and the search region. To fully obtain the MS representations, it is necessary to consider the nonlinear interaction between the global information of the template patch and the search region to transfer the modality information fully. TransT proposed in [22] uses the attention module in Transformer to provide a new solution for the nonlinear interaction of global information between the template patch and the search region. Therefore, we construct a dual TransT structure as MS branches to fully obtain MS representations of different modalities. Each branch is designed based on the TransT algorithm, the structure of the MS branch is shown in Figure 3. The ResNet50 presented in [36] is employed as the backbone to extract features, and the features of the template patch and the search region are processed by the Transformer Feature Fusion Network Module (TFFM) to produce the MS representations.
The TFFM using the attention mechanism of the Transformer is the significant component of TransT, mainly including four feature fusion layers and a separate part of feature fusion, as shown in Figure 4. There are two Ego-Context Augment modules and two Cross-Feature Augment modules in each feature fusion layer. The Ego-Context Augment module is employed to enhance the features of the template patch and the search region, and the Cross-Feature Augment module is used to fuse them. In addition, the spatial position-coding provides position information for the Ego-Context Augment module and the Cross-Feature Augment module. By utilizing the attention mechanism of Transformer to establish long-distance associations of the template patch features and the search region features, the MS representations with richer semantic information can be generated.

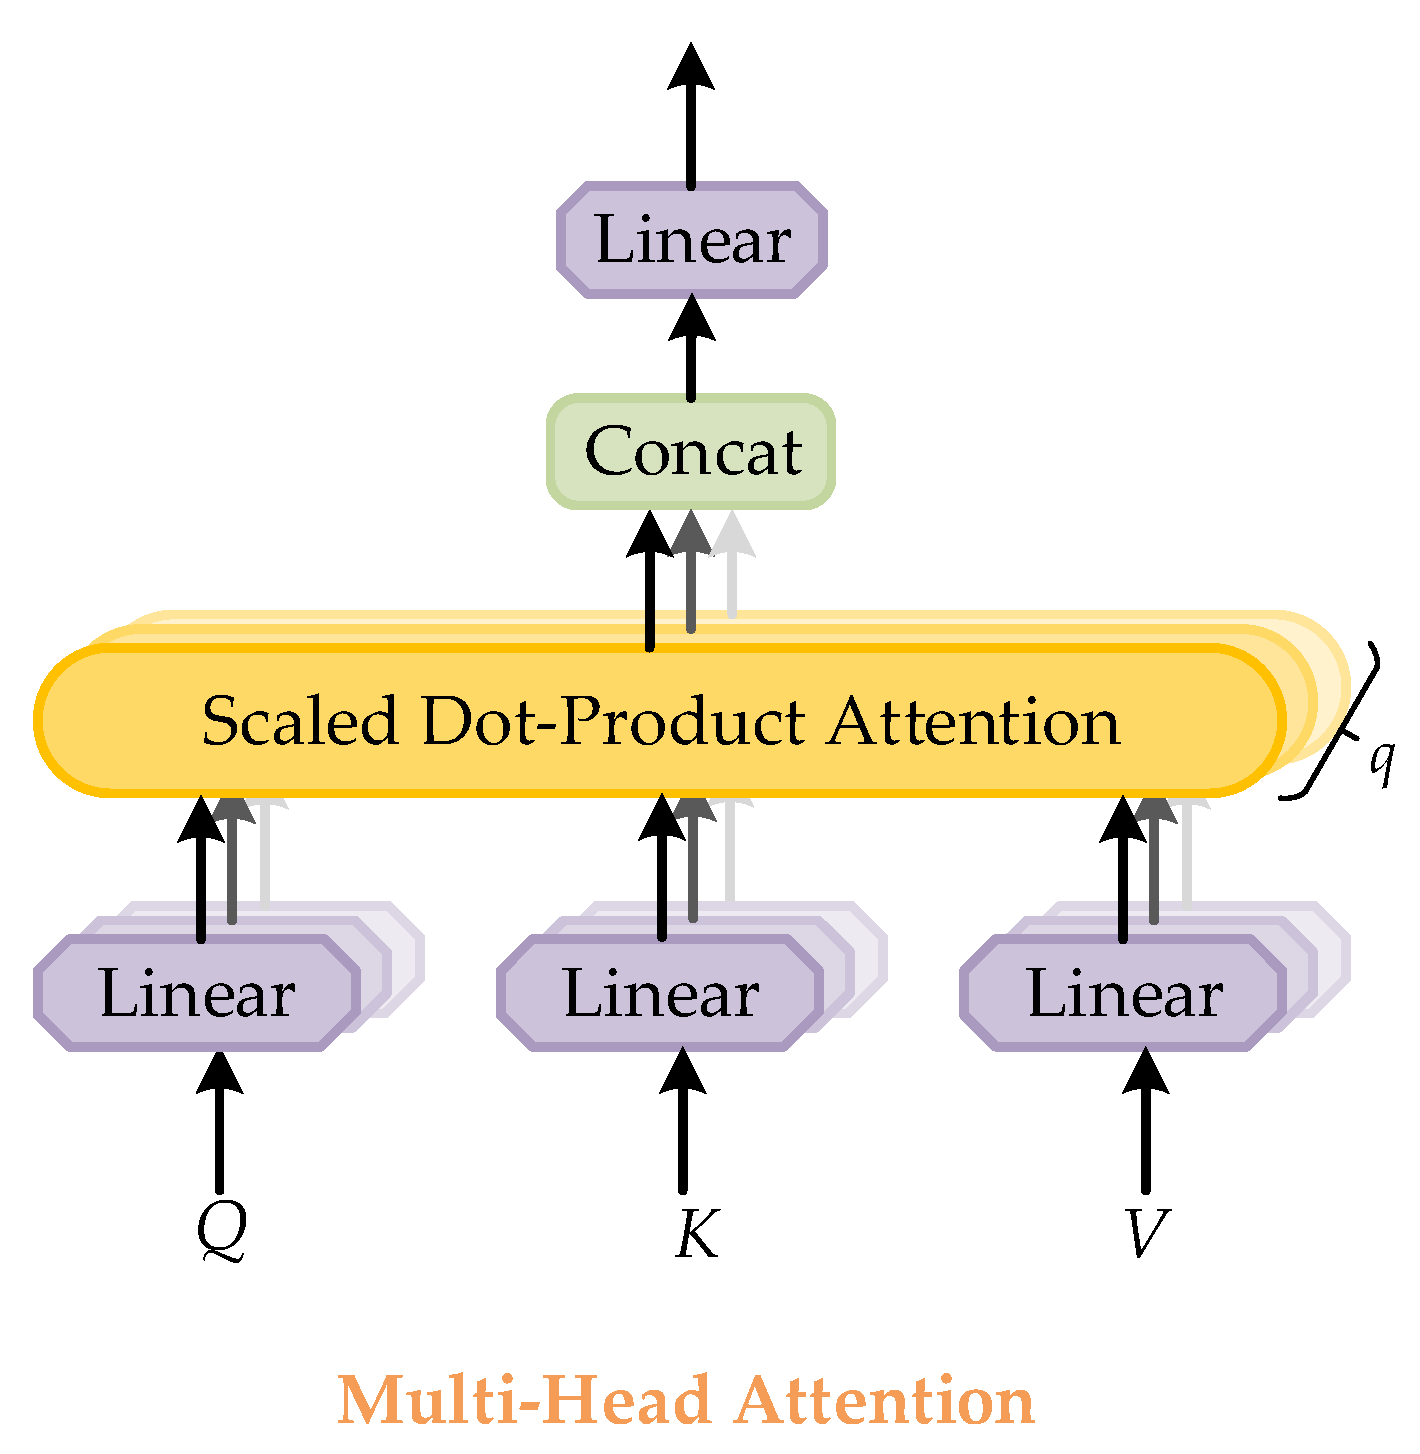
2.2.1. The Attention of Transformer

The attention mechanism in Transformer is the essential component of the Ego-Context Augment module and the Cross-Feature Augment module. An attention function can be described as a mapping query (Q), keys (K), and values (V) to an output. The output is computed as a weighted sum of the values, where the weight assigned to each value is computed by a compatibility function of the query with the corresponding key [37]. The scaled dot-product attention is defined as:
A t t e n t i o n ( Q , K , V ) = s o f t m a x ( Q K T d k ) V ,
where d k represents the dimension of input.
Multi-head attention is used in Transformer to describe the global dependency between input and output. The structure of multi-head attention is shown in Figure 5. Multi-head attention is a global receptive field in the region, which can focus on the information of different subspaces at different locations through multiple heads. All attention distributions are calculated by scale dot-product attention. The multi-headed attention is assumed to contain q heads, which is defined as:
M u l t i H e a d ( Q , K , V ) = C o n c a t ( H 1 , , H q ) W O ,
w h e r e H i = A t t e n t i o n ( Q W i Q , K W i K , V W i V ) ,
where W O represents parameter matrices, W Q , W K , and W V are radiation projections of parameter matrices.

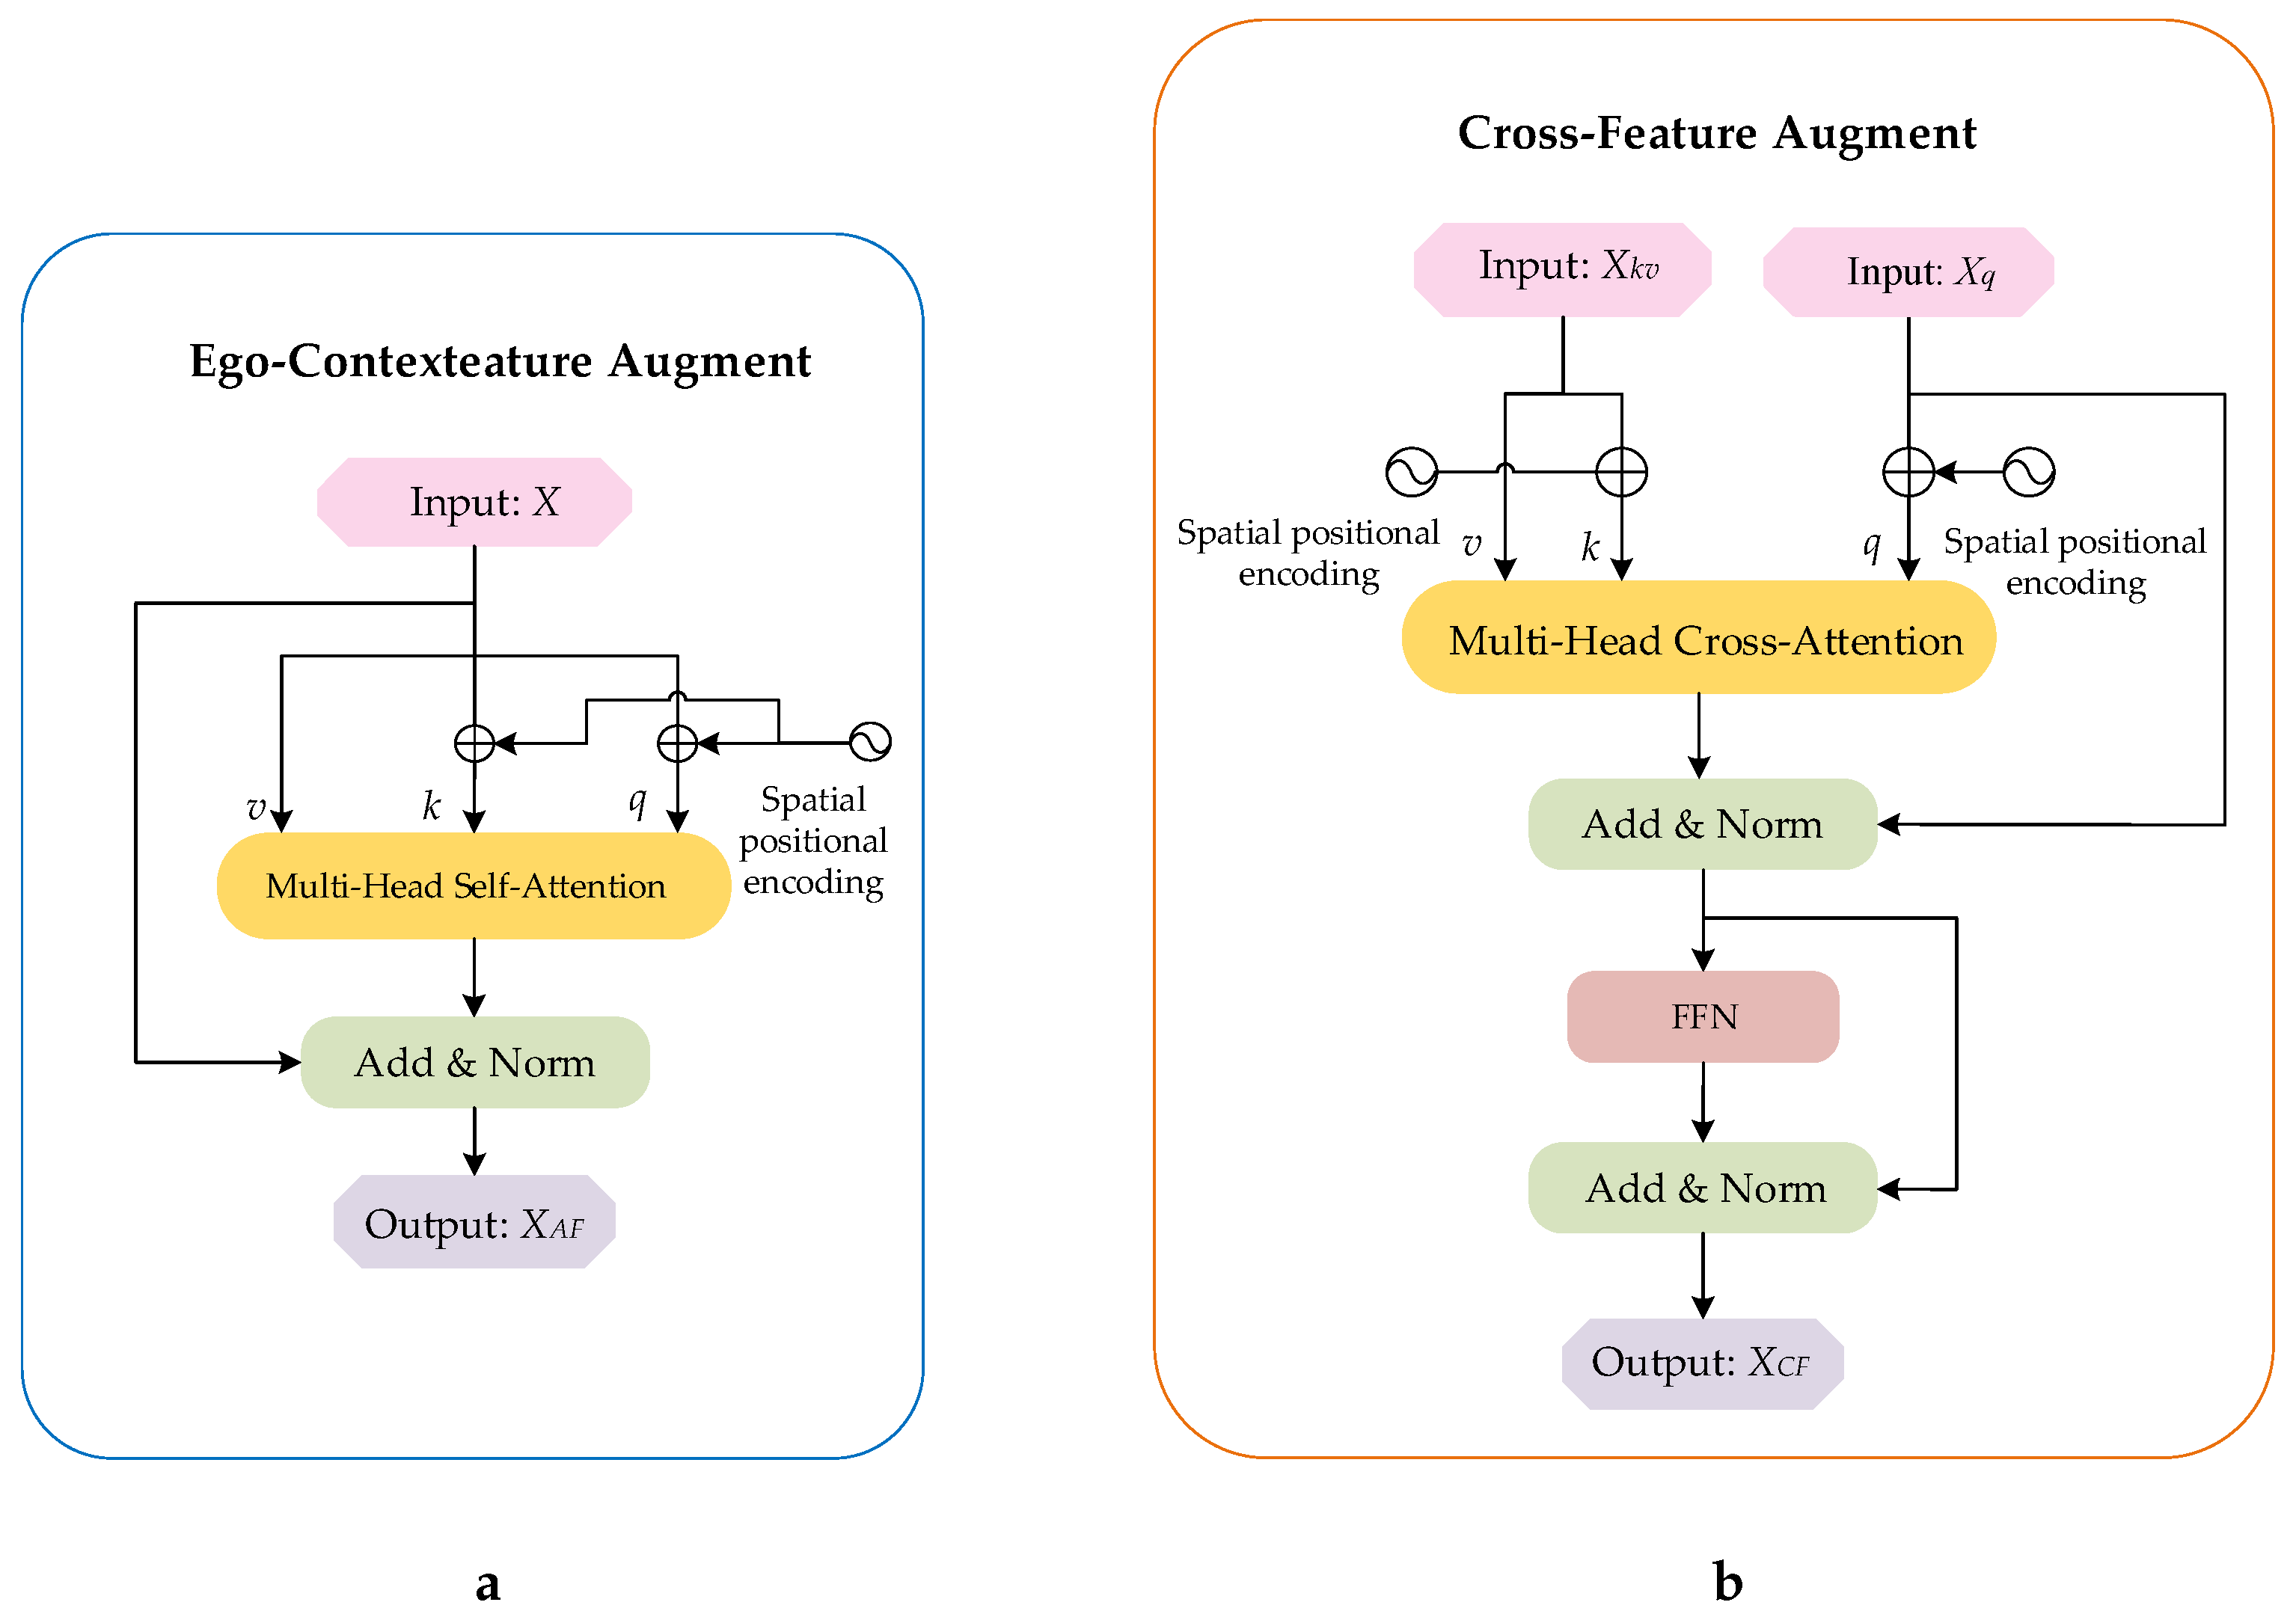
2.2.2. Ego-Context Augment Module

On the left of Figure 6 is the structure of the Ego-Context Augment module. The feature vectors of the template and the search region are adapted to the focus context through the multi-headed self-attention in the form of residuals, respectively. By using this module, the semantic information of images can be better correlated and their feature representations can be enhanced. This module can be defined as:
X A F = X + M u l t i H e a d ( X + P , X + P , X ) ,
where P indicates the spatial coding position and X A F is the enhanced features of the output.

2.2.3. Cross-Feature Augment Module

On the right of Figure 6 is the structure of the Cross-Feature Augment module. The enhanced features of the template and the search region obtained by the Ego-Context Augment module are fused through multi-head cross-attention in the form of residual to transmit the object information better. In addition, the Cross-Feature Augment module also adds a Feed Forward Network (FFN) to increase the fitting ability of the model. This module can be defined as:
X C F = X ^ C F + F F N ( X ^ C F ) ,
X ^ C F = X q + M u l t i H e a d ( X q + P q , X k v + P k v , X k v ) ,
the symbol X q represents the input features of one branch, and P q is the spatial position coding for the coordinate of X q . X k v stands for the input features of the other branch, and P k v is the coordinate encoded by the spatial position of X k v . In addition, FFN is defined as:
F F N ( x ) = R e L U 2 ( m a x ( 0 , R e L U 1 ( x ) ) ) ,
R e L U i ( x ) = W i x + b i .
Please refer to the reference [22] for more detailed descriptions.

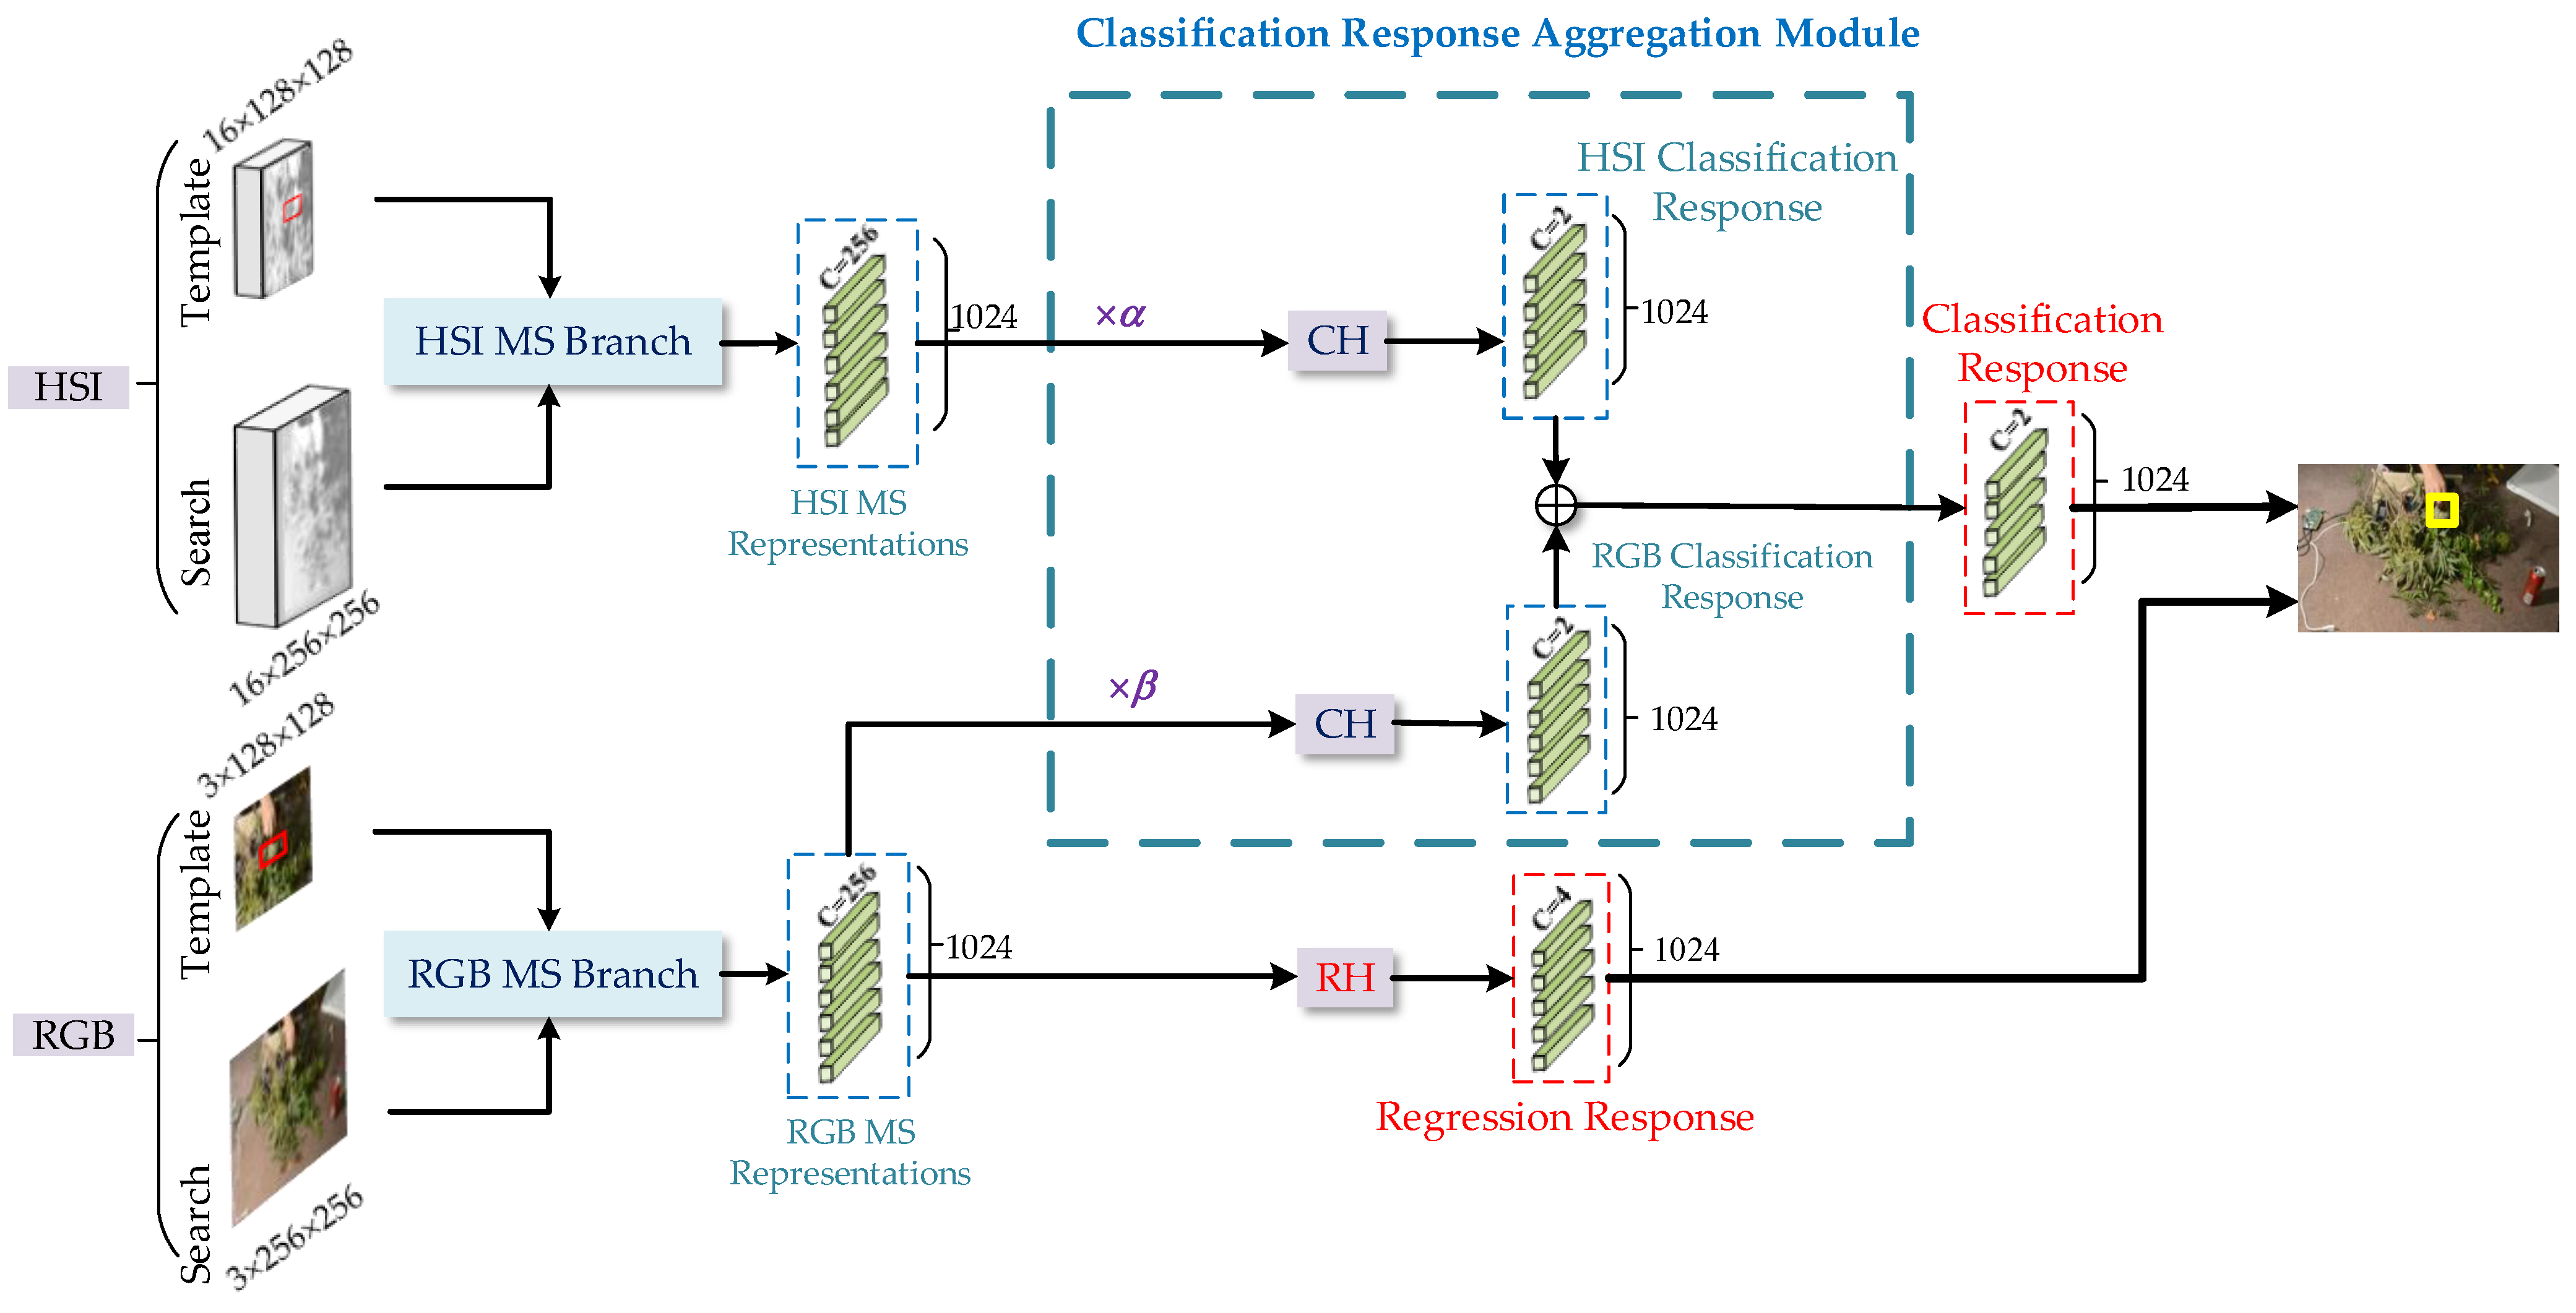
2.3. Classification Response Aggregation Module

How to effectively combine the information of different modalities is an important issue in the field of the fusion tracking task. Therefore, we design a classification response aggregation module to combine the information of hyperspectral and RGB modalities, aiming to improve the tracking performance by enhancing the discrimination between the object and the background. In addition, the reliability of different modality images under different conditions is inconsistent, so the fusion based on the reliability-aware of different modalities can make full use of multi-modality information to improve tracking performance. To reduce the noise effect caused by low-reliability modality data and ensure that a more reliable modality plays a more important role in the multi-mode fusion tracking, we also propose a method to evaluate the reliability of hyperspectral and RGB modalities and guide information fusion through the modality reliability.

2.3.1. The Evaluation Method of Modality Reliability

Since the features of the template patch need to propagate to all subsequent frames, the reliability of different modality template patches is an essential factor affecting the tracking performance. Based on this, we use the reliability of the template patch to represent the modality reliability. In this part, we propose a simple method to evaluate the reliability of the template patch. The evaluation flow is as follows:
First, the gray template patch of different modalities. Readjust the template patch according to the weight calculated by the mean value of each channel in the template patch of different modalities. Then, the processed template patch is superimposed along the channel direction to obtain the gray template patch. In particular, in order to facilitate calculation, the gray template patch of different modalities is standardized.
Second, statistics of the number of different modality gray levels. The gray range of the gray template patch is divided into M gray levels. The number of gray levels is obtained by counting the number of gray levels of pixels not less than N in each modality.
Third, calculate the sharpness of different modality template patches. The sharpness of the template patch is related to the high-frequency component. When the template patch is clear, the high-frequency component is at its highest, and the difference between the mutation pixel and the adjacent pixel becomes larger. We calculate the sharpness of different modality template patches by calculating the square of the difference between each pixel and its horizontal right second nearest neighbor, which can be summarized as:
d ( f ) = y x f ( x + 2 , y ) f ( x , y ) ,
where f ( x , y ) is the gray value of the pixel ( x , y ) corresponding to gray template image f and d ( f ) is the sharpness of gray template image.
Finally, evaluate the reliability of the different modality template patches. The reliability of the different modality template patches R i is calculated as follows:
R i = γ g i d i , if d i > t and d A i > t , γ 1 g i + d i , if d i < t and d A i < t , γ d i , else ,
where A represents the collection of the modality kinds of RGB and hyperspectral, i A represents a modality, γ 1 is the coefficient in reliability, t represents a threshold, g i represents the gray levels number of i template patch, and d i represents the sharpness of i template patch.
If the sharpness of the template patch is greater than a certain threshold, it indicates that the template patch is relatively clear. When both kinds of modality template patches have high sharpness values, we use α times the ratio of the number of gray levels to image sharpness to represent the reliability of template patches. At this time, if one modality template patch contains more gray levels than the other modality template patch, it indicates that the semantic information contained in this kind of modality template patch is richer, so the reliability value of this kind of modality template patch is higher.
On the contrary, if the sharpness of the template patch is less than a certain threshold, it means that the template patch is relatively blurred. When both kinds of template patches are blurred, we use α times the reciprocal of the sum of the gray levels number and the image sharpness to represent the reliability of the template patch. At this time, if one modality template patch contains more gray levels than the other modality template patch, the noise contained in this modality template patch is larger, so the reliability value of this modality template patch is lower.
However, if one kind of modality template patch is clear and the other is blurred, we use α times the sharpness of the template patch to directly represent the reliability of the template patch. Obviously, in this case, the clear template patch has a higher reliability value than the blurred template patch.
Two examples are used to verify the reliability of two modality template patches in Figure 7. The related images of the Coin are at the top of Figure 7, and that of the Rider2 are at the bottom. The RGB template patches are displayed in the second column. Columns 3 and 4 are grayscale images of RGB and hyperspectral template patches, and columns 5 and 6 are the feature thermal images of RGB and hyperspectral template patches, respectively. In this work, M is 500, N is 12, γ is 1, and t is 76.
We can see that the third and fourth images of the video named Coin are very clear, and the fourth image contains more visual information than the third image. Therefore, it can be judged that the reliability of the fourth image is higher than that of the third image, and more useful features can be extracted from it. In addition, it can be seen from the feature thermal images of different modality patches that the feature area displayed in the sixth image is more matched with the object area, and the interference feature around the object is minor, which also shows that the sixth image corresponding to the fourth image is more reliable. The reliability of the third and fourth images of the coin is calculated by the proposed method. The sharpness of the two images is 189 and 96, respectively, which are greater than the threshold, so both images are relatively clearer. The reliability of the fourth image is 4.896, which is higher than that of the third image (1.709), consistent with subjective feelings.
It is easy to observe that the third and fourth images of the video named Rider2 are both blurred. Compared with the fourth image, the third image is more complex, and the quality is poor. It is difficult to extract useful features from it, so the reliability of the third image is low. It can also be verified that the fourth image is more reliable by comparing the feature thermal images shown in the fifth and sixth images of the Rider2 video. From a numerical point of view, the sharpness of the third and fourth images is 66 and 74, respectively, which are both smaller than the threshold, and the reliability of the third image is 2.18 × 10 3 , and that of the fourth image is 2.49 × 10 3 , so the fourth image is more reliable and conforms to the visual characteristics.

2.3.2. Classification Response Aggregation Module

The structure of the classification response aggregation module is shown in Figure 8. To reduce the noise effect caused by low-reliability modality data and to make a more reliable modality play a more important role in the classification task, we use the modality reliability to predict the contribution of different modalities for the classification task and use the contribution value to process the MS representations of the corresponding modality, to maximize the role of the aggregation module in improving tracking performance. We denote the contribution of HSI as α , and the contribution of RGB as β ( α + β = 1). Comparing the reliability of hyperspectral and RGB template patches, if the reliability of the hyperspectral template patch is higher than that of RGB, α > β . On the contrary, if the reliability of the hyperspectral template patch is smaller than that of RGB, α < β . The processed MS representations of different modalities are input into the classification prediction head, respectively, and the classification response of hyperspectral and RGB can be obtained. The final classification response results from the fusion of different modality classification responses. Denote C R e s p o n s e as the final classification response, m s r h as the HSI MS representations, m s r c as the RGB MS representations, ϕ and ϕ as hyperspectral and RGB classification prediction heads, respectively. We utilize the same network for classification prediction, so this study has identical ϕ and ϕ . The final classification response is defined as:
C R e s p o n s e = ϕ ( α × m s r h ) + ϕ ( β × m s r c ) .

3. Experiments

To test the performance of the proposed RANet, experiments are conducted on the dataset composed of hyperspectral and RGB. We compare the performance of the RANet tracker with that of 10 state-of-the-art trackers.

3.1. Dataset and Compared Trackers

The dataset proposed in [28] includes various aligned hyperspectral and RGB video pairs used for the evaluation. As far as we know, this is the first public hyperspectral dataset published in the Hyperspectral Object Tracking Competition 2020. At present, some researchers have carried out work based on this dataset in the field of remote sensing. The hyperspectral image sequences are collected by a snapshot mosaic hyperspectral camera at a video rate. Each image contains 512 pixels and 16 bands in the wavelength from 470 nm to 620 nm. RGB videos are acquired in a close viewpoint as hyperspectral videos. Although the spatial resolution of hyperspectral data is relatively low, it has rich material information, which can provide more object features to separate objects and backgrounds in the case of a similar appearance. Therefore, the effective use of the material information obtained by hyperspectral data and the visual information obtained by RGB data is of great significance in improving tracking performance. The dataset covers eleven challenging factors, including occlusion (OCC), illumination variation (IV), background clutters (BC), scale variation (SV), deformation (DEF), motion blur (MB), fast motion (FM), in-plane rotation (IPR), out-of-plane rotation (OPR), out-of-view (OV), and low resolution (LR). There are 40 video pairs composed of hyperspectral and RGB in the training set and 35 hyperspectral and RGB video pairs in the testing set. Table 1 lists the sequence names and corresponding attributes of the testing set. Table 2 shows the number of sequences corresponding to different attributes in the testing set.
Due to the first hyperspectral-RGB fusion tracking algorithm, to test the performance of the RANet tracker, we compare the RANet tracker with 10 state-of-the-art single-modality trackers, including MHT [28], BAE [30], SST [31], TransT [22], SiamGAT [38], SiamCAR [20], SiamBAN [39], ECO [40], SiamDW [41], and fDDST [42]. These methods can represent the current high level of the single-modality tracker. In these methods, MHT, BAE, and SST are designed for the tracking task based on hyperspectral images, while the others are only developed for the tracking task based on RGB images.

3.2. Implementation Details

All experiments are implemented using a desktop equipped with an Intel(R) Xeon(R) Silver 4210R CPU, NVIDIA RTX 3090 GPU. The contribution of the more reliable modality is set as 0.9, and that of another modality is set as 0.1, that is, if the reliability of the hyperspectral modality is higher than that of the RGB modality, we set α as 0.9. On the contrary, if the reliability of the RGB modality is greater, parameter β is set as 0.9. During the training process, the RGB branch is initialized with the weights that are pretrained on COCO [43], TrackingNet [44], LaSOT [45], and GOT 10 K [46] datasets, and the HSI branch is trained with stochastic gradient descent (SGD) on the hyperspectral training set. The batch size is set as 16, and the learning rate is decayed from 0.001 to 0.0005 over a total of 20 epochs. Weight decay and momentum of the HSI branch are set as 0.0001 and 0.9, respectively. The processing speed of the program is 10.0 fps.

3.3. Evaluation Metrics

The area under the curve (AUC) score of the success rate plot and the precision rate at the threshold of 20 pixels (DP_20) value are utilized to evaluate the performance of fusion tracking in this work [47]. Success means that the overlapping between the bounding box predicted by the algorithm and the groundtruth box is greater than a certain threshold. The overlapping represents Intersection over Union (IOU), which is defined as:
O = | G A | | G A | ,
where G indicates the groundtruth box and A is the predicted bounding box. The symbol of | · | represents the number of pixels in the area. Success rate represents the ratio of successful frames to total frames in a series of frames. The success plot shows the success rate trends when the threshold changes from 0 to 1 at an interval of 0.02. The area under the curve (AUC) of each success rate curve is used to rank the success performance of the tracker.
Precision means that the center position error represented by the average Euclidean distance between the center position of the object algorithm prediction and the groundtruth accurate position is less than a certain threshold. The precision rate represents the ratio of precision frames to total frames in a series of frames. The precision plot shows the trends of precision rate when the threshold changes from a small value to a large value. The precision rate at the threshold of 20 pixels is used to sort the precision performance of the tracker. The center position error formula is as follows:
D = ( x 2 x 1 ) 2 + ( y 2 y 1 ) 2 ,
where ( x 1 , y 1 ) is the center position of prediction and ( x 2 , y 2 ) is the center position of groundtruth.

3.4. Results and Analysis

In this section, we compare the AUC score and the DP_20 value of the RANet tracker with that of 10 advanced trackers and analyze the performance of the RANet tracker from both quantitative and qualitative aspects.

3.4.1. Quantitative Analyze

Table 3 shows the quantitative results of the AUC score and the DP_20 value on each sequence of the RANet tracker and the selected trackers, respectively. In general, the RANet tracker is superior to the selected comparative trackers in the AUC score and the DP_20 value. In addition, it is clear to see that the overall performances of the RANet tracker outstrips all the compared trackers in terms of both success rate and precision rate from Figure 9a,b. The results exhibit the effectiveness of the proposed network in hyperspectral-RGB fusion tracking.
Comparison with the TransT tracker. We can observe from Table 3 that the performance of RANet is superior to TransT, although TransT performs well in the tracking task based on RGB images. As shown in Figure 9, RANet is more competitive than TransT in almost all scenarios, such as LR, IV, OCC, and BC. Especially in the scene of LR, the AUC score and the DP_20 value of RANet are 5.5 and 8.3 percent higher than TransT, respectively. The only exception is that RANet performs slightly worse than TransT when the object moves rapidly. The experimental results show that using both hyperspectral and RGB data can effectively improve the tracking performance.
Comparison with other RGB trackers. We compare the performance of the proposed RANet tracker with that of other RGB trackers. Table 3 shows that the AUC score and the DP_20 value of the overall performance of the RANet tracker are superior to other state-of-the-art RGB trackers. From Figure 9, it is clear to see that the RANet tracker performs better than other RGB trackers in terms of success rate in 11 challenging scenarios. In terms of precision rate, the RANet tracker outperforms almost all RGB trackers in most scenarios except for a slightly worse performance than SiamCAR in the scene of motion blur and fast motion. It is exhibited that hyperspectral images can provide more robust spectral features in some complex situations, such as OCC, IV, and LR. Therefore, the RANet tracker can provide a robust performance under different challenging scenarios.
Comparison with hyperspectral trackers. From Table 3, we can observe that the overall performance of RANet is 7.8 percent higher than that of SST in the AUC score and 3.7 percent higher in the DP_20 value, although SST shows the best performance of the above hyperspectral trackers. It also can be discovered from Figure 9 that the performance of RANet is better than that of hyperspectral trackers in most scenarios such as DEF, OV, and SV. The results show that the proposed RANet makes up for the defect of the low resolution of hyperspectral images using the reliable features provided by RGB images, enhancing the tracking robustness.

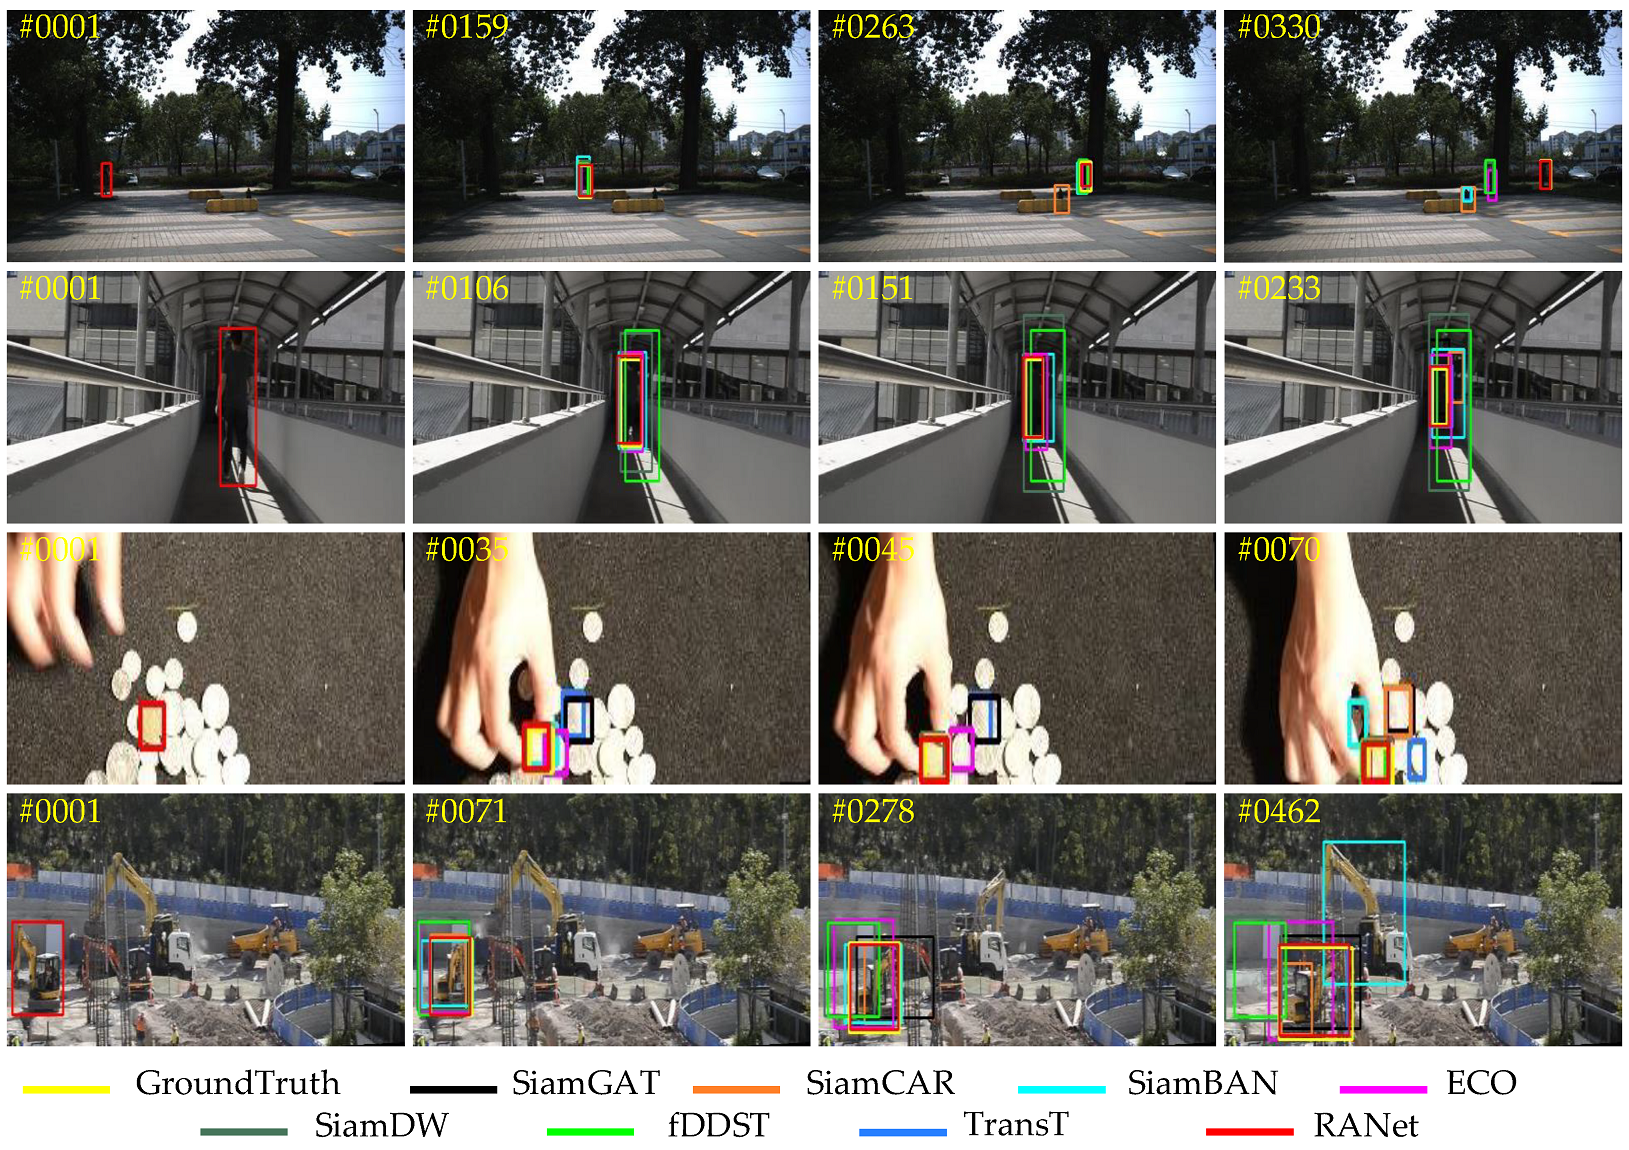
3.4.2. Qualitative Analyze

Figure 10 shows the qualitative tracking results of different trackers in some image sequences, which can intuitively compare the tracking performance of the RANet tracker and other trackers.
Using the Pedestrian2 image sequences, we can intuitively compare the performance of different trackers in tracking low resolution and occluded objects. It can be observed from 159, 263, and 330 frames that, compared with other trackers, the RANet tracker can accurately track objects with low resolution. In addition, it also can be seen from 263 frames that the RANet tracker still has good tracking robustness when obstacles block the object. These show that the RANet tracker can track objects with low resolution and that are occluded.
The video named Student mainly faces the challenge of illumination and scale variations. During the movement, the object’s scale decreases continuously, and the brightness of the object and its surrounding environment darkens gradually. It can be seen from 106, 151, and 233 frames that the RANet tracker can track the object of scale change with good performance. In addition, compared with other trackers, the RANet tracker also has a better tracking performance under poor illumination conditions, as shown in 151 and 233 frames. The above shows that the RANet tracker can sufficiently cope with the challenges of object scale variation and illumination variation.
We mainly consider the problem of background clutter in the image sequences of Coin. In this video, the tracking object is a gold coin, and the tracking background is some silver coins with different denominations. It can be observed from frames 35, 45, and 70 that most trackers are prone to failure due to the interference of the surrounding environment. In contrast, the RANet tracker can still accurately predict the object’s location in this scenario, indicating that the proposed method can effectively reduce the influence of background clutter on the tracking results.
In the image sequences from the video with the name of Excavator, the shape and proportion of the object have changed greatly. It can be seen from frames 71, 278, and 462 that different trackers have different robustness in dealing with the above two scenarios, and the proposed RANet tracker can still successfully track the object even if other trackers lose it. This shows that the RANet tracker is more robust in challenging scenarios of SV and DEF.
It can be clearly seen from the above results that the RANet tracker can effectively deal with various challenging scenarios, such as BC, OCC, LR, and IV, which fully demonstrates the competitive advantage of using complementary multi-modality information in the tracking process.

4. Ablation Study and Analysis

4.1. The Ablation Study of the Fusion Structure

A reasonable fusion structure can effectively combine the information of different modality images. To explore the effects of different fusion structures, we design two trackers by improving the structure of the classification response aggregation module in Figure 2 and keeping other components unchanged. The fusion structure used in the first tracker is single fusion based on MS representation layers, and that of the other tracker is a single fusion based on response layers. Two fusion structures are described as follows:

4.1.1. Single Modality-Specific Representations Layers Fusion

The MS representations of hyperspectral and RGB as the inputs of the aggregation module are processed by the predicted corresponding modality contributions and then fused as the final MS representations. The classification head is used to predict the processed MS representations to obtain the classification response for the fusion tracking task.

4.1.2. Single Response Layers Fusion

The MS representations of hyperspectral and RGB as the input of the aggregation module are directly predicted by two classification heads to obtain two classification responses. Then, two responses are processed by the corresponding modality contributions, and the processed responses are combined as the final classification response to predict the object and background.

4.1.3. Results and Analysis

Ablation studies are used to explore the effects of different fusion structures of trackers. The tracker with single fusion based on MS representations layers is RANet-mf, which combines the multi-modality information by combining processed MS representations of different modalities. The other tracker with single fusion based on response layers is RANet-rf, which combines the multi-modality information by combining processed classification responses of different modalities. The performance of three trackers with different fusion structures is shown in Table 4.
It is obvious that the AUC score and the DP_20 value of the proposed RANet tracker are higher than that of the RANet-mf tracker and the RANet-rf tracker. This is because the single fusion structure based on MS representations layers increases the possibility of generating pseudo-features, which easily causes tracking deviation. Besides, the fusion structure based on the response layers alone is too dependent on the classification vectors, which easily leads to the failure of the tracking task when the classification vectors of a modality data cannot be accurate enough to predict the object and background. The fusion structure of the RANet tracker introduces the different predicted modality contributions to the MS representations layer and combines the information of different modalities in the classification response layer, which not only reduces the dependence on the classification vectors and reduces the probability of pseudo-features but also effectively uses the information of different modality images to improve the performance of the tracking network.

4.2. The Ablation Study of the Contribution Value of Different Modalities

The contribution value of different modalities for the fusion tracking task is predicted based on the modality reliability. The contribution value of the high-reliability modality should be relatively larger. In this work, we set the contribution value of the modality with high reliability as 0.9 and the contribution value of the modality with low reliability as 0.1. To verify the effectiveness of the contribution value we set, we conduct the ablation study. Since the contribution value of the modality with higher reliability is greater than that of the modality with lower reliability, and the sum of the two contribution values is 1, we test the AUC score and the DP_ 20 value when the contribution value of the higher reliability modality changes from 0.5 to 1 at an interval of 0.05, as shown in Table 5.
It can be seen from Table 5 that the AUC score and the DP_ 20 value are the highest when the contribution value of the modality with a higher reliability is set as 0.9, which indicates the effectiveness of the contribution value we set.

5. Discussion

In this paper, we propose a novel reliability-guided aggregation network (RANet) for hyperspectral and RGB fusion tracking. The RANet model is proposed based on the TransT tracker. To further verify the effectiveness of our fusion method, we also designed two RANet models in which the basic trackers of the two models are replaced by the SiamCAR tracker and the SiamGAT tracker, respectively, and tested their performance. The RANet model that used the SiamCAR as the basic tracker is termed SiamCAR_fusion. The RANet model that used the SiamGAT as the basic tracker is termed SiamGAT_fusion. The results are shown in Table 6. It can be seen that the AUC score of the SiamCAR_fusion tracker (64.3%) outperforms that of the SiamCAR tracker (61.3%) by 3%, and the DP_20 value of the SiamCAR_fusion tracker (91.1%) is more than that of the SiamCAR tracker (84.1%) by 7%. It also can be seen that the SiamGAT_fusion tracker outperforms the SiamGAT tracker in terms of the AUC score and the DP_20 value. In addition, the AUC score of the proposed TransT_fusion tracker (70.9%) is higher than that of the TransT tracker which is the basic tracker of TransT_fusion (68.7%), and the DP_20 value of the TransT_fusion tracker (95.2%) is more than that of the TransT tracker (92.0%). Particularly, the TransT_fusion tracker is the proposed RANet tracker. From the above results, we can see that the AUC score and DP_20 value of the three fusion trackers are higher than their corresponding basic trackers, which fully demonstrates the effectiveness of our fusion method. In addition, that the performance of multi-modality trackers (SiamCAR_fusion, SiamGAT_fusion, and TransT_fusion) with multi-modality data is higher than their corresponding single-modality trackers also proves that multi-modality data are effective for improving performance.

6. Conclusions

In this paper, we propose a reliability-guided aggregation network (RANet) for hyperspectral and RGB fusion tracking to improve the tracking performance by aware-aggregating the information of different modalities through the modality reliability. To the best of our knowledge, this is the first time that Transformer has been applied to the field of fusion tracking based on hyperspectral and RGB images. Two TransT-based modality-specific (MS) branches are used to process hyperspectral and RGB modality images, respectively. Then the MS representations of the different modalities are combined by the classification response aggregation module to enhance the ability of the tracking network to distinguish objects and backgrounds. Furthermore, we also consider the reliability of different modality images to maximize the role of the aggregation module in improving the performance of the fusion tracking task. Massive experimental results show that when hyperspectral data are used as a multi-modality information supplement, the performance of the fusion tracker based on our fusion method is better than that of the corresponding single-modality tracker. Among them, the AUC score of the fusion tracker is increased by at least 1.6%, especially the RANet based on the TransT tracker achieving the best performance, which fully confirms the superiority and effectiveness of the RANet algorithm and the multi-modality data. The proposed method improves the tracking performance by calculating two modality information, which will inevitably increase the computational complexity. In the future, we will further improve the method that reduces the computational complexity and improves the performance of hyperspectral and RGB fusion tracking.

Author Contributions

Conceptualization, C.Z. and N.S.; methodology, N.S. and H.L.; software, H.L.; validation, L.W. and C.Z.; formal analysis, C.Z.; data curation, L.W. and Y.Y.; writing—original draft preparation, H.L. and N.S.; writing—review and editing, N.S., Y.Y. and H.L.; funding acquisition, C.Z., L.W. and N.S. All authors have read and agreed to the published version of the manuscript.

Funding

This work was supported by the National Natural Science Foundation of China (No. 62071136, No. 62002083, No. 61971153, No. 61801142) and Heilongjiang Postdoctoral Foundation LBH-Q20085, LBH-Z20051.

Data Availability Statement

The dataset composed of hyperspectral and RGB image sequence pairs is obtained from https://www.hsitracking.com/ in this work, accessed on 5 April 2021.

Conflicts of Interest

The authors declare no conflict of interest.

References

  1. Tian, X.; Liu, J.; Mallick, M.; Huang, K. Simultaneous Detection and Tracking of Moving-Target Shadows in ViSAR Imagery. IEEE Trans. Geosci. Remote Sens. 2021, 59, 1182–1199. [Google Scholar] [CrossRef]
  2. Henke, D.; Mendez Dominguez, E.; Small, D.; Schaepman, M.E.; Meier, E. Moving Target Tracking in Single- and Multichannel SAR. IEEE Trans. Geosci. Remote Sens. 2015, 53, 3146–3159. [Google Scholar] [CrossRef]
  3. Yang, X.; Wang, Y.; Wang, N.; Gao, X. An Enhanced SiamMask Network for Coastal Ship Tracking. IEEE Trans. Geosci. Remote Sens. 2021, 60, 1–11. [Google Scholar] [CrossRef]
  4. Thomas, M.; Kambhamettu, C.; Geiger, C.A. Motion Tracking of Discontinuous Sea Ice. IEEE Trans. Geosci. Remote Sens. 2011, 49, 5064–5079. [Google Scholar] [CrossRef]
  5. Xuan, S.; Li, S.; Han, M.; Wan, X.; Xia, G.S. Object Tracking in Satellite Videos by Improved Correlation Filters with Motion Estimations. IEEE Trans. Geosci. Remote Sens. 2020, 58, 1074–1086. [Google Scholar] [CrossRef]
  6. Wang, Y.; Wang, T.; Zhang, G.; Cheng, Q.; Wu, J. Small Target Tracking in Satellite Videos Using Background Compensation. IEEE Trans. Geosci. Remote Sens. 2020, 58, 7010–7021. [Google Scholar] [CrossRef]
  7. Guo, Q.; Feng, W.; Gao, R.; Liu, Y.; Wang, S. Exploring the Effects of Blur and Deblurring to Visual Object Tracking. IEEE Trans. Image Process. 2021, 30, 1812–1824. [Google Scholar] [CrossRef]
  8. Zhao, F.; Zhang, T.; Song, Y.; Tang, M.; Wang, X.; Wang, J. Siamese Regression Tracking with Reinforced Template Updating. IEEE Trans. Image Process. 2021, 30, 628–640. [Google Scholar] [CrossRef] [PubMed]
  9. Henriques, J.F.; Caseiro, R.; Martins, P.; Batista, J. High-Speed Tracking with Kernelized Correlation Filters. IEEE Trans. Pattern Anal. Mach. Intell. 2015, 37, 583–596. [Google Scholar] [CrossRef] [Green Version]
  10. Shao, J.; Du, B.; Wu, C.; Zhang, L. Can We Track Targets From Space? A Hybrid Kernel Correlation Filter Tracker for Satellite Video. IEEE Trans. Geosci. Remote Sens. 2019, 57, 8719–8731. [Google Scholar] [CrossRef]
  11. Fu, C.; Cao, Z.; Li, Y.; Ye, J.; Feng, C. Onboard Real-Time Aerial Tracking with Efficient Siamese Anchor Proposal Network. IEEE Trans. Geosci. Remote Sens. 2021, 60, 1–13. [Google Scholar] [CrossRef]
  12. Dasari, M.M.; Gorthi, R.K.S.S. IOU—Siamtrack: IOU Guided Siamese Network For Visual Object Tracking. In Proceedings of the 2020 IEEE International Conference on Image Processing (ICIP), Abu Dhabi, United Arab Emirates, 25–28 October 2020; pp. 2061–2065. [Google Scholar]
  13. Sodhro, A.H.; Sennersten, C.; Ahmad, A. Towards Cognitive Authentication for Smart Healthcare Applications. Sensors 2022, 22, 2101. [Google Scholar] [CrossRef] [PubMed]
  14. Danelljan, M.; Khan, F.S.; Felsberg, M.; Van De Weijer, J. Adaptive Color Attributes for Real-Time Visual Tracking. In Proceedings of the IEEE Conference on Computer Vision and Pattern Recognition (CVPR), Columbus, OH, USA, 23–28 June 2014; pp. 1090–1097. [Google Scholar]
  15. Shao, J.; Du, B.; Wu, C.; Zhang, L. Tracking Objects From Satellite Videos: A Velocity Feature Based Correlation Filter. IEEE Trans. Geosci. Remote Sens. 2019, 57, 7860–7871. [Google Scholar] [CrossRef]
  16. Cen, M.; Jung, C. Fully Convolutional Siamese Fusion Networks for Object Tracking. In Proceedings of the IEEE International Conference on Image Processing (ICIP), Athens, Greece, 7–10 October 2018; pp. 3718–3722. [Google Scholar]
  17. Shao, J.; Du, B.; Wu, C.; Gong, M.; Liu, T. HRSiam: High-Resolution Siamese Network, Towards Space-Borne Satellite Video Tracking. IEEE Trans. Image Process. 2021, 30, 3056–3068. [Google Scholar] [CrossRef]
  18. Abdelpakey, M.H.; Shehata, M.S. DP-Siam: Dynamic Policy Siamese Network for Robust Object Tracking. IEEE Trans. Image Process. 2020, 29, 1479–1492. [Google Scholar] [CrossRef] [PubMed]
  19. Li, B.; Yan, J.; Wu, W.; Zhu, Z.; Hu, X. High Performance Visual Tracking with Siamese Region Proposal Network. In Proceedings of the IEEE Conference on Computer Vision and Pattern Recognition (CVPR), Salt Lake City, UT, USA, 18–22 June 2018; pp. 8971–8980. [Google Scholar]
  20. Guo, D.; Wang, J.; Cui, Y.; Wang, Z.; Chen, S. SiamCAR: Siamese Fully Convolutional Classification and Regression for Visual Tracking. In Proceedings of the IEEE Conference on Computer Vision and Pattern Recognition (CVPR), Virtual, 14–19 June 2020; pp. 6268–6276. [Google Scholar]
  21. Xu, Y.; Wang, Z.; Li, Z.; Yuan, Y.; Yu, G. SiamFC++: Towards robust and accurate visual tracking with target estimation guidelines. In Proceedings of the 34th AAAI Conference on Artificial Intelligence (AAAI), New York, NY, USA, 7–12 February 2020; Volume 34, pp. 12549–12556. [Google Scholar]
  22. Chen, X.; Yan, B.; Zhu, J.; Wang, D.; Yang, X.; Lu, H. Transformer tracking. In Proceedings of the IEEE/CVF Conference on Computer Vision and Pattern Recognition (CVPR), Virtual, 19–25 June 2021; pp. 8126–8135. [Google Scholar]
  23. Lan, X.; Zhang, W.; Zhang, S.; Jain, D.K.; Zhou, H. Robust Multi-modality Anchor Graph-based Label Prediction for RGB-Infrared Tracking. IEEE Trans. Ind. Inf. 2019, 1. [Google Scholar] [CrossRef]
  24. Shang, X.; Song, M.; Wang, Y.; Yu, C.; Yu, H.; Li, F.; Chang, C.I. Target-Constrained Interference-Minimized Band Selection for Hyperspectral Target Detection. IEEE Trans. Geosci. Remote Sens. 2021, 59, 6044–6064. [Google Scholar] [CrossRef]
  25. Yu, C.; Han, R.; Song, M.; Liu, C.; Chang, C.I. Feedback Attention-Based Dense CNN for Hyperspectral Image Classification. IEEE Trans. Geosci. Remote Sens. 2021, 60, 1–16. [Google Scholar] [CrossRef]
  26. Yuan, Q.; Zhang, Q.; Li, J.; Shen, H.; Zhang, L. Hyperspectral Image Denoising Employing a Spatial–Spectral Deep Residual Convolutional Neural Network. IEEE Trans. Geosci. Remote Sens. 2019, 57, 1205–1218. [Google Scholar] [CrossRef] [Green Version]
  27. Li, S.; Song, W.; Fang, L.; Chen, Y.; Ghamisi, P.; Benediktsson, J.A. Deep Learning for Hyperspectral Image Classification: An Overview. IEEE Trans. Geosci. Remote Sens. 2019, 57, 6690–6709. [Google Scholar] [CrossRef] [Green Version]
  28. Xiong, F.; Zhou, J.; Qian, Y. Material Based Object Tracking in Hyperspectral Videos. IEEE Trans. Image Process. 2020, 29, 3719–3733. [Google Scholar] [CrossRef] [PubMed]
  29. Zhang, Z.; Qian, K.; Du, J.; Zhou, H. Multi-Features Integration Based Hyperspectral Videos Tracker. In Proceedings of the Workshop Hyperspectral Image Signal Procesing: Evolution in Remote Sensing (WHISPERS), Amsterdam, The Netherlands, 24–26 March 2021; pp. 1–5. [Google Scholar]
  30. Li, Z.; Xiong, F.; Zhou, J.; Wang, J.; Lu, J.; Qian, Y. BAE-Net: A Band Attention Aware Ensemble Network for Hyperspectral Object Tracking. In Proceedings of the IEEE International Conference on Image Processing (ICIP), Abu Dhabi, United Arab Emirates, 25–28 October 2020; pp. 2106–2110. [Google Scholar]
  31. Li, Z.; Ye, X.; Xiong, F.; Lu, J.; Zhou, J.; Qian, Y. Spectral-Spatial-Temporal Attention Network for Hyperspectral Tracking. In Proceedings of the Workshop Hyperspectral Image Signal Processing: Evolution in Remote Sensing (WHISPERS), Amsterdam, The Netherlands, 24–26 March 2021; pp. 1–5. [Google Scholar]
  32. Dian, R.; Li, S.; Fang, L. Learning a Low Tensor-Train Rank Representation for Hyperspectral Image Super-Resolution. IEEE Trans. Neural Netw. Learn. Syst. 2019, 30, 2672–2683. [Google Scholar] [CrossRef]
  33. Lan, X.; Ye, M.; Shao, R.; Zhong, B.; Yuen, P.C.; Zhou, H. Learning Modality-Consistency Feature Templates: A Robust RGB-Infrared Tracking System. IEEE Trans. Ind. Electron. 2019, 66, 9887–9897. [Google Scholar] [CrossRef] [Green Version]
  34. Zhang, X.; Ye, P.; Peng, S.; Liu, J.; Xiao, G. DSiamMFT: An RGB-T fusion tracking method via dynamic Siamese networks using multi-layer feature fusion. Signal Process. Image Commun. 2020, 84, 115756. [Google Scholar] [CrossRef]
  35. Zhang, X.; Ye, P.; Peng, S.; Liu, J.; Gong, K.; Xiao, G. SiamFT: An RGB-Infrared Fusion Tracking Method via Fully Convolutional Siamese Networks. IEEE Access 2019, 7, 122122–122133. [Google Scholar] [CrossRef]
  36. He, K.; Zhang, X.; Ren, S.; Sun, J. Deep Residual Learning for Image Recognition. In Proceedings of the IEEE Conference on Computer Vision and Pattern Recognition (CVPR), Las Vegas, NV, USA, 26 June–1 July 2016; pp. 770–778. [Google Scholar]
  37. Vaswani, A.; Shazeer, N.; Parmar, N.; Uszkoreit, J.; Jones, L.; Gomez, A.N.; Kaiser, I.; Polosukhin, I. Attention is all you need. In Proceedings of the 31st Annual Conference on Neural Information Processing Systems (NIPS), Long Beach, CA, USA, 4–9 December 2017; pp. 5998–6008. [Google Scholar]
  38. Guo, D.; Shao, Y.; Cui, Y.; Wang, Z.; Zhang, L.; Shen, C. Graph Attention Tracking. In Proceedings of the IEEE/CVF Conference on Computer Vision and Pattern Recognition (CVPR), Virtual, 19–25 June 2021; pp. 9543–9552. [Google Scholar]
  39. Chen, Z.; Zhong, B.; Li, G.; Zhang, S.; Ji, R. Siamese Box Adaptive Network for Visual Tracking. In Proceedings of the IEEE Conference on Computer Vision and Pattern Recognition (CVPR), Virtual, 14–19 June 2020; pp. 6667–6676. [Google Scholar]
  40. Danelljan, M.; Bhat, G.; Khan, F.S.; Felsberg, M. ECO: Efficient Convolution Operators for Tracking. In Proceedings of the 30th IEEE Conference on Computer Vision and Pattern Recognition (CVPR), Honolulu, HI, USA, 21–26 July 2017; pp. 6931–6939. [Google Scholar]
  41. Zhang, Z.; Peng, H. Deeper and Wider Siamese Networks for Real-Time Visual Tracking. In Proceedings of the IEEE/CVF Conference on Computer Vision and Pattern Recognition (CVPR), Long Beach, CA, USA, 16–20 June 2019; pp. 4586–4595. [Google Scholar]
  42. Danelljan, M.; Häger, G.; Khan, F.S.; Felsberg, M. Discriminative Scale Space Tracking. IEEE Trans. Pattern Anal. Mach. Intell. 2017, 39, 1561–1575. [Google Scholar] [CrossRef] [Green Version]
  43. Lin, T.Y.; Maire, M.; Belongie, S.J.; Hays, J.; Perona, P.; Ramanan, D.; Dollár, P.; Zitnick, C.L. Microsoft COCO: Common Objects in Context. In Proceedings of the 13th European Conference on Computer Vision (ECCV), Zurich, Switzerland, 6–12 September 2014. [Google Scholar]
  44. Müller, M.; Bibi, A.; Giancola, S.; Al-Subaihi, S.; Ghanem, B. TrackingNet: A Large-Scale Dataset and Benchmark for Object Tracking in the Wild. In Proceedings of the 15th European Conference on Computer Vision, Munich, Germany, 8–14 September 2018. [Google Scholar]
  45. Fan, H.; Lin, L.; Yang, F.; Chu, P.; Deng, G.; Yu, S.; Bai, H.; Xu, Y.; Liao, C.; Ling, H. LaSOT: A High-Quality Benchmark for Large-Scale Single Object Tracking. In Proceedings of the IEEE/CVF Conference on Computer Vision and Pattern Recognition (CVPR), Long Beach, CA, USA, 16–20 June 2019; pp. 5369–5378. [Google Scholar]
  46. Huang, L.; Zhao, X.; Huang, K. GOT-10k: A Large High-Diversity Benchmark for Generic Object Tracking in the Wild. IEEE Trans. Pattern Anal. Mach. Intell. (TPAMI) 2021, 43, 1562–1577. [Google Scholar] [CrossRef] [Green Version]
  47. Wu, Y.; Lim, J.; Yang, M.H. Online Object Tracking: A Benchmark. In Proceedings of the IEEE Conference on Computer Vision and Pattern Recognition (CVPR), Portland, OR, USA, 23–28 June 2013; pp. 2411–2418. [Google Scholar]
Figure 1. The flowchart of the RANet. In this flowchart, the input is hyperspectral and RGB images, and the output is the prediction result of the object position.
Remotesensing 14 02765 g001
Figure 2. The RANet network architecture. CH represents the classification prediction head and RH represents the regression prediction head. In addition, α and β represent the predicted contribution of HSI and RGB, respectively, and the symbol ⊕ represents the merge operation. The object’s final position is determined by the classification and the regression responses.
Remotesensing 14 02765 g002
Figure 3. The MS branch’s structure. The input is the template patch and search region, and the output is the MS representations. Two sub-branches are used to process the template patch and the search region, respectively. Then disseminate the template information to the search information through the Transformer-based Feature Fusion Module (TFFM) to obtain the MS representations.
Remotesensing 14 02765 g003
Figure 4. Structure of the Transformer Fusion Feature Module (TFFM). ECA represents the Ego-Context Augment module and CFA represents the Cross-Feature Augment module. As shown in the dotted box, two ECAs and two CFAs form a fusion layer. The fusion layer is repeated four times, and then a CFA is added to fuse the feature maps of the two branches.
Remotesensing 14 02765 g004
Figure 5. Structure of the multi-head attention module. It consists of several attention layers running in parallel. The symbol q represents the number of attention layers. Each layer takes scaled dot-product attention.
Remotesensing 14 02765 g005
Figure 6. The structure of the Ego-Context Augment module (ECA) is on the left (a), and that of the Cross-Feature Augment module (CFA) is on the right (b). In particular, there is one input in the ECA and two inputs in the CFA.
Remotesensing 14 02765 g006
Figure 7. Examples of the reliability of hyperspectral and RGB modality template patches. The blue box in the (a) column is the initial position of the object. The top images are the related images of the Coin, and the bottom images are the related images of the Rider2. Among them, two images of the (a) column are original images, and that of the (b) column displays the RGB template patches. In addition, columns (c,d) are grayscale images of RGB and hyperspectral template patches, and columns (e,f) are the feature thermal images of RGB and hyperspectral template patches, respectively.
Remotesensing 14 02765 g007
Figure 8. Structure of the classification response aggregation module. α and β represent the predicted contribution of HSI and RGB, respectively. The symbol ⊕ represents the merge operation.
Remotesensing 14 02765 g008
Figure 9. Success plots and precision plots of 11 trackers under overall attributes and different challenge attributes.
Remotesensing 14 02765 g009aRemotesensing 14 02765 g009bRemotesensing 14 02765 g009c
Figure 10. Qualitative comparison of 8 trackers and groundtruth on some videos in some challenging scenarios. Among them, the tracking result of RANet is marked with the red box, and the groundtruth is marked with the yellow box. The video name from top to bottom are Pedestrian2, Student, Coin, and Excavator.
Remotesensing 14 02765 g010
Table 1. Sequence names and attributes of the testing set. The challenge attributes of 35 image sequences are included.
NameAttributeNameAttribute
BallSV, MB, OCCForest2BC, OCC
BasketballFM, MB, OCC, LRFruitBC, OCC
BoardIPR, OPR, BCHandBC, SV, DEF, OPR
BookIPR, DEF, OPRKangarooBC, SV, DEF, OPR, MB
BusLR, BC, FMPaperIPR, DEF, OPR, SV
Bus2IV, SV, OCC, FMPedestrianIV, SV
CampusIV, SV, OCCPedestrian2LR, OCC, IV, DEF
CarSV, IPR, OPRPlayerIPR, DEF, OPR, SV
Car2SV, IPR, OPRPlaygroundSV, OCC
Car3SV, LR, OCC, IVRider1LR, OCC, IV, SV
CardIPR, BC, OCCRider2LR, OCC, IV, SV
CoinBCRubikDEF, IPR, OPR
CokeBC, IPR, OPR, FM, SVStudentIV, SV
DriveBC, IPR, OPR, SVToy1BC, OCC
ExcavatorIPR, OPR, SV, OCC, DEFToy2BC, OCC, SV, IPR, OV, OPR
FaceSV, MB, IPR, OPRTruckOCC, OV, SV
Face2IPR, OPR, SV, OCCworkerSV, LR, BC
ForestBC, OCC
Table 2. Video numbers information of each challenge attribute in the testing set.
AttributeVideo NumbersAttributeVideo Numbers
OCC18FM4
IV8IPR14
BC14OPR15
SV23OV2
DEF8LR7
MB4
Table 3. AUC score and DP_20 value of 11 trackers on 35 sequences. The best three results are labeled in red, green, and blue, respectively.
MHTBAESSTTransTSiamGATSiamCARSiamBANECOSiamDWfDSSTRANet
AUC0.5920.6140.6310.6870.6360.6130.6080.5700.5470.4670.709
DP_200.8820.8760.9150.9200.8640.8410.8330.8400.8540.7250.952
Table 4. AUC score and DP_20 value of three RANet models with different fusion structures. The best results are labeled in the red font.
Fusion StructureAUCDP_20
RANet0.7090.952
RANet-mf0.6930.927
RANet-rf0.7020.942
Table 5. AUC score and the DP_20 value of different contribution values of the modality with higher reliability. The best results are labeled in the red font.
θ 0.50.550.60.650.70.750.80.850.90.951.0
AUC0.6950.6980.6940.6950.6980.7020.7050.7050.7090.7020.699
DP_200.9340.9360.9340.9330.9390.9410.9480.9510.9520.9420.938
θ represent the different contribution value of the modality with higher reliability.
Table 6. AUC score and the DP_20 value of the SiamCAR_fusion tracker, the SiamGAT_fusion tracker, the TransT_fusion tracker, the SiamCAR tracker, the SiamGAT tracker, and the TransT tracker. The best value is labeled in red.
AUCΔ(AUC)DP_20Δ(DP_20)
SiamCAR0.613-0.841-
SiamCAR_fusion0.643↑ 0.0300.911↑ 0.070
SiamGAT0.636-0.864-
SiamGAT_fusion0.652↑ 0.0160.877↑ 0.03
TransT0.687-0.920-
TransT_fusion0.709↑ 0.0220.952↑ 0.032
Publisher’s Note: MDPI stays neutral with regard to jurisdictional claims in published maps and institutional affiliations.

