Article

Infrared and Visible Image Fusion with Deep Neural Network in Enhanced Flight Vision System

1
School of Automation Engineering, University of Electronic Science and Technology of China, Chengdu 611731, China
2
School of Mechatronic Engineering, Southwest Petroleum University, Chengdu 610500, China
3
College of Computer Science, Civil Aviation Flight University of China, Guanghan 618307, China
*
Author to whom correspondence should be addressed.
Remote Sens. 2022, 14(12), 2789; https://doi.org/10.3390/rs14122789
Submission received: 29 April 2022 / Revised: 31 May 2022 / Accepted: 8 June 2022 / Published: 10 June 2022

Abstract

:
The Enhanced Flight Vision System (EFVS) plays a significant role in the Next-Generation low visibility aircraft landing technology, where the involvement of optical sensing systems increases the visual dimension for pilots. This paper focuses on deploying infrared and visible image fusion systems in civil flight, particularly generating integrated results to contend with registration deviation and adverse weather conditions. The existing enhancement methods push ahead with metrics-driven integration, while the dynamic distortion and the continuous visual scene are overlooked in the landing stage. Hence, the proposed visual enhancement scheme is divided into homography estimation and image fusion based on deep learning. A lightweight framework integrating hardware calibration and homography estimation is designed for image calibration before fusion and reduces the offset between image pairs. The transformer structure adopting the self-attention mechanism in distinguishing composite properties is incorporated into a concise autoencoder to construct the fusion strategy, and the improved weight allocation strategy enhances the feature combination. These things considered, a flight verification platform accessing the performances of different algorithms is built to capture image pairs in the landing stage. Experimental results confirm the equilibrium of the proposed scheme in perception-inspired and feature-based metrics compared to other approaches.

Graphical Abstract

1. Introduction

Enhanced Flight Vision System (EFVS) is designed to generate real-time external images through composite sensors, e.g., Forward-Looking Infrared (FLIR) camera, micron wavelength detector, and laser radar [1]. Synthetic Vision (SV) integrates environmental information containing topography, obstacle information, and attitude orientation to EFVS [2]. EFVS with SV strives to address the challenges of Next-Generation air transportation, in which all-weather safely landing capability and daily throughput improvement are primary in the design guidance. Moreover, EFVS lays the foundation for autonomous aircraft operation, i.e., informative terrain scene perception facilitates the auxiliary equipment response rapidly and accurately [3]. For civil aviation, efficient runway tracking and touchdown performance obtained by visual enhancement can broaden the landing minimums, especially in small and medium airports, which are not equipped with advanced guidance and approach systems [4].
The safe landing is comprehensive and requires cooperation between the local control tower and manual operation, and avionics instruments play a critical role. Despite the considerable advantages of penetrating weather, the severe time feedback and dynamic parameter processing conditions restrict the popularization of millimeter-wave radar and laser platforms [5]. Compared with indirect features, the Head-Up Display (HUD) and Head-Down Display (HDD) involving FLIR can provide a perceptual perspective on runways and obstacles [6]. Therefore, the fusion scheme based on infrared sensors has been widely adopted. As illustrated in Figure 1, the pilot is endowed with weather penetrating ability through reading considerable details from the visual system. The fusion strategy injects infrared features into visible images, providing reliable scene monitoring of the surrounding environment [7]. However, the synthetic task for flight scenes is complicated, where the radiation field effortlessly confounds salient features in the visible image near the city and vegetation. In addition, the visual deviation caused by sensor setting affects landing stability, and accurate registration depends on the mechanical calibration present. Another aspect is that the visual landing references are prescribed to be identifiable prominently with human vision, and enhancement is regulated to avoid details and color information loss caused by the synthetic system.
In recent years, airborne electronic equipment provides higher computational power than general edge devices and has become the springboard for popular enhancement algorithms [8]. Without considering visual deviation, optimization-based and deep learning-based frameworks can synthesize comprehensive images with specified details [9,10]. The optimization-based methods rely on spatial and temporal prior information and assume that objectives apply to overall or multi-scale samples. For instance, Gradient Transfer Fusion (GTF) converts the infrared superposition process to total variation (TV) minimization with gradients, and the fusion result can be obtained by the alternating Newton method [11]. Infrared feature extraction and visual information preservation (IFEVIP) is realized through quadtree decomposition, where adaptive filters and maximization functions integrate the background and foreground [12]. Iterative optimization and decomposition have advantages in scene-related features, and the auxiliary tuning can be executed through manually designed functions. Moreover, performance improvement is attainable for the above schemes by reducing imaging quality and iterations when the computational resources are restricted. Deep learning-based fusion has requirements for formulating specific training and inference platforms, but the internal representation between infrared and visible images is learnable, and the fusion strategy is performed on refined feature maps [13]. The predominant deep fusion frameworks are flexible, from classical convolutional neural networks (CNN) [14] to high-profile transformers [15]. The typical dense blocks fusion (DenseFuse) captures compound features with the primary encoder and decoder structure [16]. The unified and unsupervised fusion (U2Fusion) obtains information preservation with adaptive similarity and represents the trend of composite task fusion [17]. Compared with manually designed strategies, deep learning-based methods have the probability of solving scene generalization problems, and the data-driven tenet emphasizes the adaptability to the specific task.
However, several bottlenecks restrain the deployment of the above strategies in airborne systems. The environment during the landing stage is changeable and forces the pilot to focus on essential targets. As revealed in Figure 2, conventional methods have advantages in extracting different features, but the fusion results are not intuitive for observation. The thermal radiation field affects the mainstream fusion network, introducing ineffective information superposition. Moreover, accurate registration between infrared and visible samples is challenging, and the distortion caused by weather and fuselage remains a frequent condition in long-haul flights. Image registration for fusion frameworks is unreasonable to build on manual correction, which assumes that the deviation is constant at different sampling times [18]. Therefore, airborne visual systems require fusion enhancement methods to complete the missing information of critical objects while maintaining feature information for large-area scenes. As a guarantee to improve the fusion quality, a registration scheme to correct the image deviation is ineluctable.
This paper proposes a complete scheme based on deep learning models to tackle these problems. The semi-manual method combined with hardware calibration and homography estimation is adopted for image registration. Navigation and attitude data from the Inertial Measurement Unit (IMU) participate in ground calibration, and a lightweight network compensates for the deviation before landing. The separable autoencoder with unbalanced channel attention is designed for information preservation and fusion, and the spatial transformer is introduced for regional differentiation. Additionally, an integrated measuring system is installed on the training aircraft, and the touchdown samples support the performance experiment.

2. Materials and Methods

2.1. Related Work

The core technologies in EFVS include vision calibration and fusion strategies. In civil aviation, safety requirements cannot be satisfied by independent modules. However, a simplified enhancement system for experimental testing can be constructed by coupling the above two parts together.

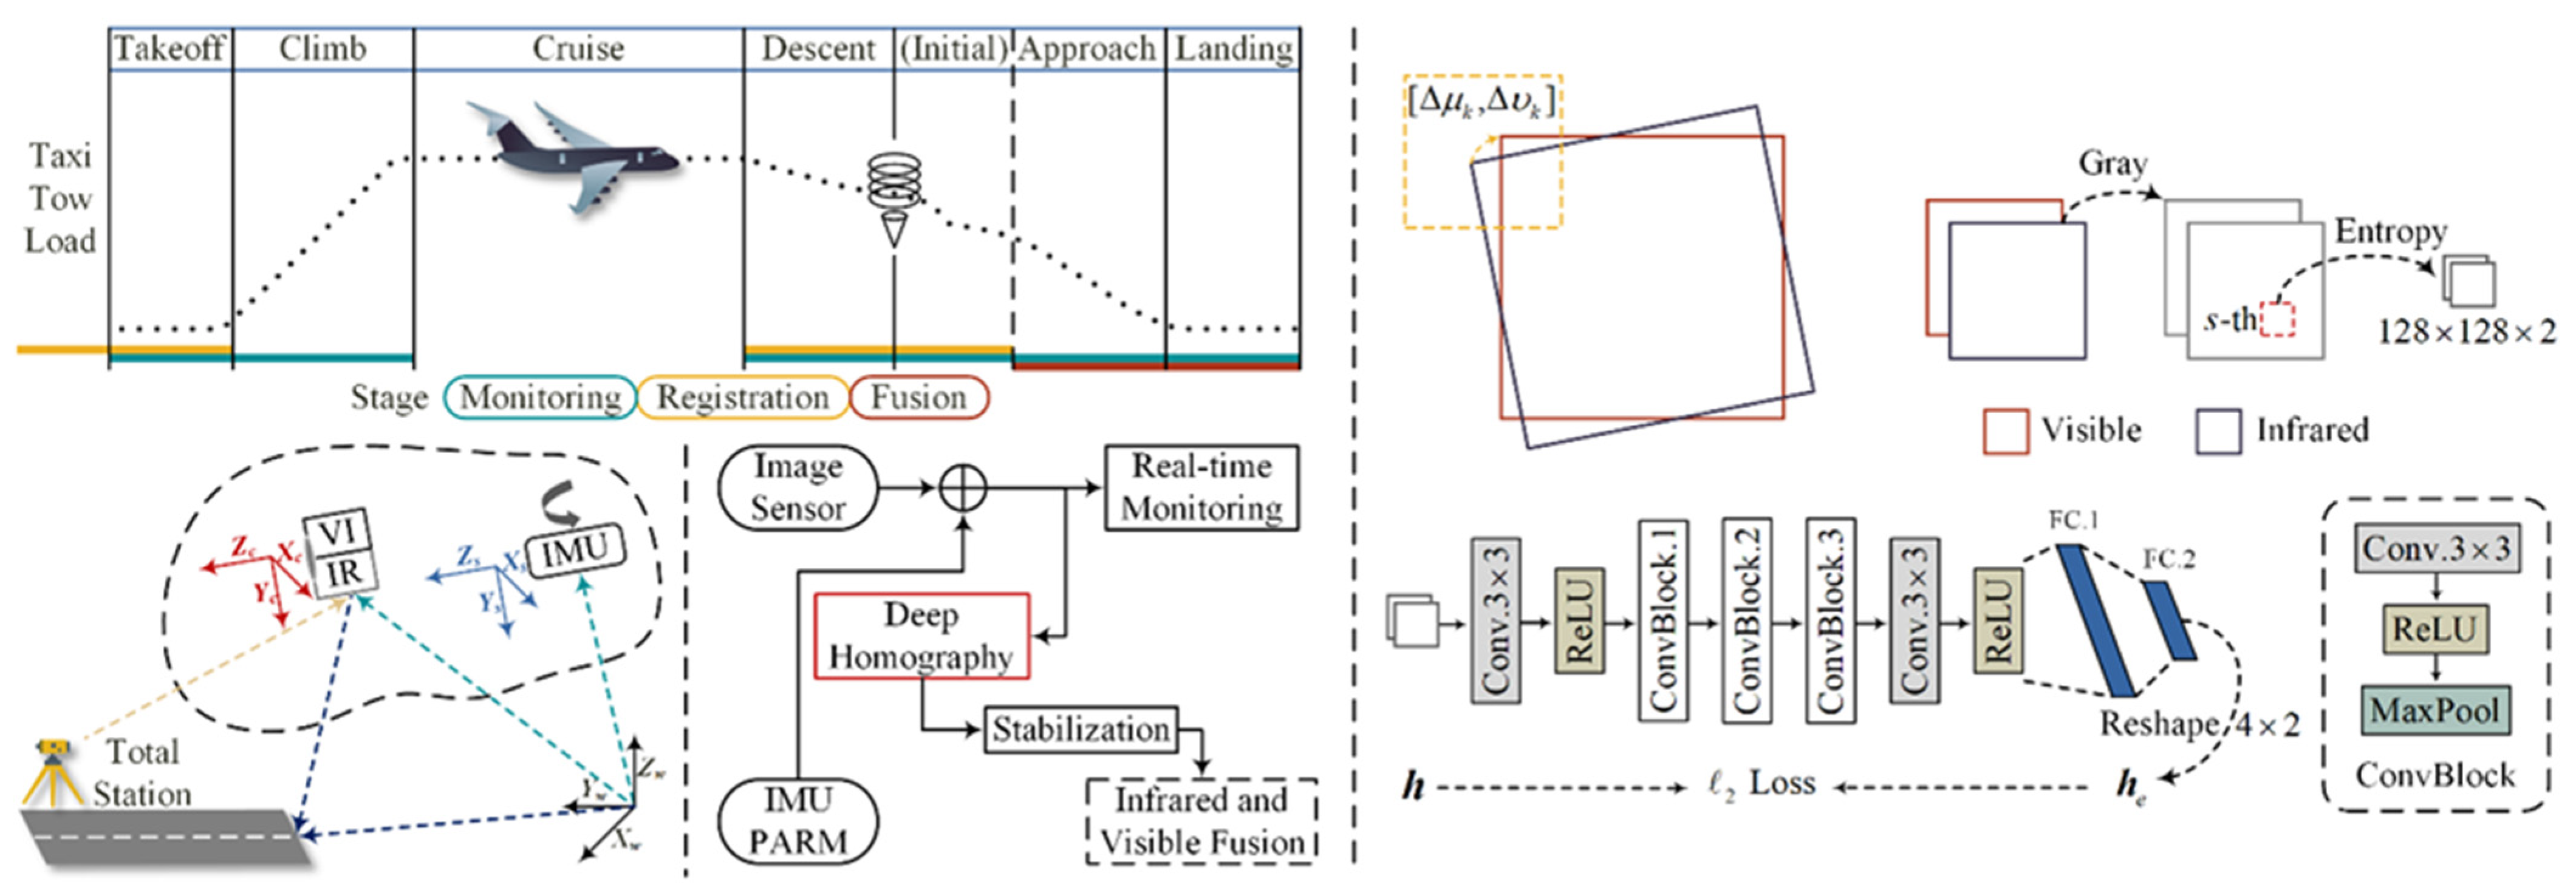
2.1.1. Airborne Vision Calibration

In the integrated system, hardware parameters are fetched into calibration for the airborne system, where the visual deviation is solved by high-speed internal query and compensation. The intrinsic navigation system provides geographic parameters (e.g., coordinates) and minimizes the displacement for image matching [19]. The corresponding transformation matrix can eliminate the deviation when the host reads the air-to-ground information corresponding to the visual sensor. Through the coordination of a high precision terrain database, the infrared results are indirectly corrected by three-dimensional geographic information [4]. However, the reference source for the avionics and software is discontinuities. The solid option for calibration can synthesize various sensor parameters and establish an image association model [8], in which the visual angle and the aircraft remain are assumed to be stable. The advantages of hardware calibration are off-line simulation and debugging, but the communication overhead and error overlap between devices are inevitable.
The soft correction is practical to preserve calibration accuracy and mainly functions during flights. Assuming that only rigid deformation exists between infrared modules, and hardware calibration makes the observation window in the rational position, homography estimation is frequently adopted in airborne registration. The conventional category is the feature-based method, which mainly extracts local invariant features with key points and descriptors. The renowned algorithms, such as Scale Invariant Feature Transform (SIFT) [20], Speeded Up Robust Features (SURF) [21], and Oriented FAST & rotated BRIEF (ORB) [22], describe the orientation of points, and Random Sample Consensus (RANSAC) [23] can assist in the screening and matching to achieve a homography estimation. However, feature-based methods depend on the quality of image pairs, and the searching is invalid with insufficient feature points or nonuniform distribution. Hence, area-matching algorithms based on deep learning are proposed to detect the corresponding regions in image pairs. The CNN backbone and proprietary operator design broadly represent developments in deep homography estimation [24]. For instance, the cascaded Lucas–Kanade network (CLKN) guides multi-channel maps with densely-sampled feature descriptors and parameterizes homography with the motion model [25]. The intervention of the intensity error metric motivates the supervised learning task, and the direct linear transform and grid generators make training independent of the ground truth [26]. Deep homography estimation follows feature extraction, matching areas through loss construction, and variation correspondence to visually align the image pair [27]. Networks are insensitive to datasets, but estimation errors are obstinately incurable in real-time processing, and excessive deviations cannot be reversed without hardware initialization.

2.1.2. Infrared and Visible Fusion

Image fusion is the pervasive enhancement paradigm in EFVS and has flexible deployment modes in edge devices. Conventional fusion methods are divided into composite transformation and optimization iteration [28]. Despite the space cost, the multi-resolution singular value decomposition (MSVD) [29] and Cross Bilateral Filter (CBF) [30] present the basic decomposition process, in which different levels of images can be processed separately. The anisotropic diffusion fusion (ADF) refines the decomposition into approximation and detailed layers [31]. The guided filter context enhancement (GFCE) determines the perceptual saliency with multiscale spectral features [32]. Moreover, Two-Scale Image Fusion (TIF) [33], IFEVIP [12], and Multi-scale Guided Fast Fusion (MGFF) [34] fuse images with alternative levels, matching human visual characteristics. However, fine-grained deconstruction introduces spatial complexity and increases complexity in the fusion stage. Hence, the Fourth-Order Partial Differential Equation (FPDE) extracts through high order features, where the design of the cost function improves specific indicators of integration and realizes convergence with the optimization theory [35]. Gradient information and structural similarity are emphasized in GTF, and the registration problem is introduced with the spatial transformation [11]. The visual saliency map and weighted least square (VSMWLS) can reduce the halo at fusion edges and be realized by the max-absolute rule of the pixel intensity [36]. Without considering the limitation of manual iteration, the calculation time of the optimization algorithm is unstable, the calculation acceleration of which is unachievable.
The deep learning method has advantages in inference speed, and the mainstream technology for fusion is the autoencoder. DenseFuse uses weighted average and 1 regularization for intermediate features and simplifies the fusion strategy [16]. Despite the structural complexity and space overhead, the nest connection fusion (NestFuse) enriches the connection mode of feature nodes by skips and attention, which preserves the information from previous layers [37]. However, the application of traditional spatial and channel attention mechanisms is controversial, where salient areas are not necessarily determinable in the shallow layers. As an alternative, masks superimposed on infrared images effectively detect conspicuous areas but reduce the generalization performance [38]. In Dual-branch fusion (DualFuse), the extra semantic encoder is adopted to extract semantic and structural information [39]. Recently, unsupervised learning has experienced widespread adoption because of the no-reference metrics and reducing redundant information for fusion tasks. The fusion based on the generative adversarial network (FusionGAN) replaces the fusion process with the generator and utilizes the discriminator to evaluate the texture performance [40]. The dual-discriminator conditional generative adversarial network (DDcGAN) improves FusionGAN with a structure difference evaluation and deconvolution layers [41]. U2Fusion introduces information preservation to avoid designing fusion rules [17]. In addition, deep learning-based models can be combined with conventional methods, where deep fusion (DeepFuse) processes multi-layer features according to decomposition transformation and smoothing algorithms [42]. The fusion methods are summarized in Table 1. Conventional methods mainly run on the central processing unit (CPU) or Field Programmable Gate Array (FPGA), and parallel acceleration on the graphics processing unit (GPU) is difficult to achieve.

2.2. Multi-Modal Image Calibration

The observation window for pilots is required to be relatively stable, and the ground is taken as the reference. Before takeoff, the vision sensor can be roughly calibrated through the attitude. Although the acquisition of hardware parameters in the flight system can directly query the airborne equipment, the following assumptions are established to simplify the scheme: (1) only the fixed-rigid deviation exists between the visible camera and the infrared sensor; (2) the temperature drift of IMU is ignored; and (3) devices are considered as points. Despite visual errors, the non-planar impact on the landing is limited because the focus is on the runway or horizon. The temperature level of the test field is stable, and the sensor package is intact, which makes the temperature drift attenuated. In external measurement, the volume of the sensor is considered 0.
The procedure of calibration is illustrated in Figure 3. The image registration process is suspended when the visual enhancement stage is turned on. In the ground calibration, infrared and visual images can be roughly calibrated. First, the visible image is projected to the world coordinate x w to preserve essential information in the middle of the pilot vision. Because IMU provides accelerations and rotational velocities in real-time, the points ( x c v and x s ) from the visible camera and IMU have
{ x s = P s x w + A s x c v = P c x s + A c ,
where P and A represent the position and attitude, respectively. With the compensation mode, P s and A s for translation can be calculated from IMU. In order to obtain an accurate measurement, P s and A s are not readable and require the aided measurement with the total station. When the aircraft is in non-working condition, the three-point method can determine P c and A c within a specific error [43]. The position of the total station is set to the origin of the world coordinate. An additional anchor is required to determine the auxiliary coordinate in the single instrument measurement. The total station can obtain the sensor position parameters through the three-dimensional conversion with three coordinates. Thus, manual correction is based on
x c v = P x w + A ,
where P = P c P s and A = P c A s + A c . Under the balance of IMU parameters, the observation field and the physical position of the aircraft can be calibrated.
The measurement takes the visible camera as the reference, but the deviation caused by lens and installation exists between infrared and visible images in flight. Before the fusion stage, image pairs are additionally aligned to eliminate ghosting or confusion. Without considering non-rigid distortion (the z -axis is set to 0), the homography transformation based on the non-singular matrix H 3 × 3 can align image pairs. Specifically, the planar projective mapping for x c i x c v is defined as
[ μ υ 1 ] = H [ x c i , 1 ] T = [ H 11 H 12 H 13 H 21 H 22 H 23 H 31 H 32 H 33 ] [ μ υ 1 ] ,
in which ( μ , υ ) x c v , and x c i represents the image pixel from the infrared sensor. When h 33 0 , the mapping matrix is rewritten as
H   : = 1 H 33 H ,
and the degree of freedom is 8 . The scalar multiplication has no impact on the transformation and means that [ x c v , 1 ] T = H [ x c i , 1 ] T . Thus, the registration problem between infrared and visible images is converted into finding the corresponding { x c v , x c i } k (for k = 1 , 2 , 3 , 4 ). If { x c v , x c i } k satisfies the non-collinear condition, H holds the unique solution.
The homography estimation is a fine-tuning based on the hardware calibration, and the accuracy and scale of the network can be appropriately reduced. The supervised pre-trained model [26] is modified to accomplish the task, where the number of convolution layers is reduced, and the data preprocessing is changed. Because of the error fluctuations in backpropagation, the coordinates of pixels are unstable to predict. Hence, the network estimates the pixel deviation of the infrared image by taking the visible image as the reference. As indicated in Figure 3, the deviation is defined as h k = [ Δ μ k , Δ υ k ] , where Δ μ k = μ k μ k and Δ υ k = υ k υ k . Direct Linear Transform (DLT) algorithm is adopted to solve h k H [44]. The network consists of convolutional layers and fully connected (FC) layers. Convolutional layers are designed to extract the features of image pairs, and the kernel size of 3 × 3 is used. Rectified Linear Units (ReLU) operate in the activation module with nonlinearity. The FC layer directly outputs the estimated result h e 4 × 2 , which represents the deviated pixels. Let the ground truth h = [ h 1 T , , h k T ] T , and the loss function is defined as
H = 1 2 h h e 2 2 .
The network takes the grayscale image pair (cropped to 128 × 128 × 2 ) as input to optimize the storage space and inference speed. I s v and I s i (the s -th window) are obtained by sliding and windowing over the image pairs. The objective function can select the combination with extensive details:
arg   max s E ( I s v i ) + E ( I s i r ) .
E ( I ) represents the image entropy (EN) and is defined as
E ( I ) = i = 0 255 P I ( i ) log 2 ( P I ( i ) ) ,
where P I is the probability associated with the bins of the histogram. Instead of reducing the image to the specified size, continuous extraction has the possibility to anchor continuous regions when the flight is stable. In order to avoid jittering caused by the drastic changes of h e , additional constraints are applied. Considering the discrete time, the homography deviation corresponding to each infrared picture is h e ( t ) . Suppose that the image mismatch between infrared and visible images changes slightly during flight, and h ( 0 ) can be obtained in hardware calibration. The stability enhancement of continuous frames is achieved by minimizing the weighted objective function, i.e.,
h ( t ) = arg   max h h h ( 0 ) 2 2 + λ t f Ω ω t , f h h e ( f ) 2 2 .
where Ω represents the neighborhood of the t -th frame, and λ t is the regularization parameter changing with the fusion stage. ω t , f is the weight satisfied half-normal distribution with ω t , f > ω t , f 1 . The optimization inhibits the network deviates from the reference, while the weighted term enables the registration to dispose of the real-time deformation caused by mechanical displacement and environment. Because the dislocation is unavoidable, the deviation error on corners is acceptable within 10 pixels [26].

2.3. Infrared and Visible Fusion with Transformer

A rational fusion strategy is extracting the conspicuous information from multi-source images to complement while maintaining high fidelity. Convolutional Block Attention Module (CBAM) [45] or the synthetic mask [38] is infeasible in the airborne scene because complex environments cannot be manually segmented, and attention characterization on convolutional layers is atrophied. The recent Vision Transformer (ViT) learns the relationship between sequence elements and can capture long-distance characteristics and global information [46]. Attention mechanisms can alleviate the influence of the thermal radiation field in the fusion stage. However, the self-attention module in ViT has the probability of recognizing the positional information of the compound scene and inherits the time bottleneck in training overhead and inference speed simultaneously. Hence, the autoencoder structure incorporating the transformer is designed based on the imbalance in the traditional channel attention. The purpose of the model is to maintain a concise structure while deploying the transformer to obtain spatial relationships.
The procedure of the proposed fusion method is indicated in Figure 4. The network consists of two branches in offline training, i.e., the traditional densely connected autoencoder and the spatial module with the self-attention mechanism. Given the aligned infrared and visible images denoted by I i r and I v i , the training goal of the autoencoder branch is to reconstruct the input image. The weight sharing does not apply to encoders for infrared and visible samples, but the feature output size is consistent. The encoder E v i , composed of dense convolutional layers, extracts concatenated features, and the channel attention module exerts inter-channel relationships on the intermediate output. Therefore, the visible encoder process can be summarized as
F v i = C ( F v i ) F v i ,
where F v i h × w × c is the intermediate feature map and can be obtained by E v i : I v i F v i . C 1 × 1 × c represents the channel attention map computed with the multi-layer perceptron (MLP) and has
C ( F ) = σ MLP ( AvgPool ( F ) + MaxPool ( F ) ) ,
where σ is the sigmoid function. The infrared diversion has
F i r = S ( F i r ) F i r ,
and S h × w is the spatial attention map obtained by ViT. As an alternative to traditional spatial attention, the infrared input with pooling is grouped into grids of nonoverlapped patches before positional embedding. The self-attention mechanism with multi-heads explores the representation subspace, and the general procedure is defined as
{ Attention i   : = Softmax ( Q i K i T d ) V i Multi - head   : = Concat ( Attention i , ) W .
d is the vector dimension, and W is the linear projection matrix. Q , K , and V refer to query, key, and value representations, respectively, and correspond to weight matrices required to be trained. After the refining of up-sampling and the convolutional layer, S is obtained. The infrared and visible branches share the same decoder responsible for reconstructing the intermediate features to the original input, i.e.,
D ( { F i r , F v i } ) { I i r , I v i } .
Hence, the loss function between the original image I and the output I is defined as
R = I I 2 2 + λ s ( 1 SSIM ( I , I ) ) ,
where λ s controls the loss balance, and SSIM represents the structural similarity index measure (SSIM) [47]. Different branches are updated alternately in the training phase to achieve global convergence.
Theoretically, the channel attention mechanism suppresses non-critical feature maps by assigning weights. In the flight scene, the resolution of the network is weak to characterize outright, causing the polarization of weights in C . However, the extreme distribution of channel coefficients is meaningful to guide the combination of feature maps in the fusion strategy. With defining a threshold θ , the inactive feature index of F v i can be written as
c = { i : C i < θ , f o r i = 1 , 2 , , c } .
The decoder refers to the channel attention results from the visible branch, which means that the decoder can reconstruct the approximate result even if the partial features are deleted. As compensation, the features from the infrared branch are directly inserted for replacement, i.e.,
F = { F v i | i     F i r | j : i c , j c } .
The infrared and visible features are stacked, and the decoder generates the fusion result, i.e., D ( F ) I f u . Compared with norm-based or weighted fusion methods, the hyper-parameter θ only regulates the participation of infrared features. Without average stacking and manual masks, the long-distance information given by the self-attention mechanism can extract the active regions of infrared features and realize the selective fusion strategy.

3. Experiments

In this section, details on the construction of the flight verification platform are disclosed. The continuous dataset with the critical stages of landing is collected and processed. The comprehensive experiment includes calibration and fusion, and the results of fusion algorithms are constructed with homography estimation. The qualitative and quantitative results provide different perspectives for evaluating integration strategies.

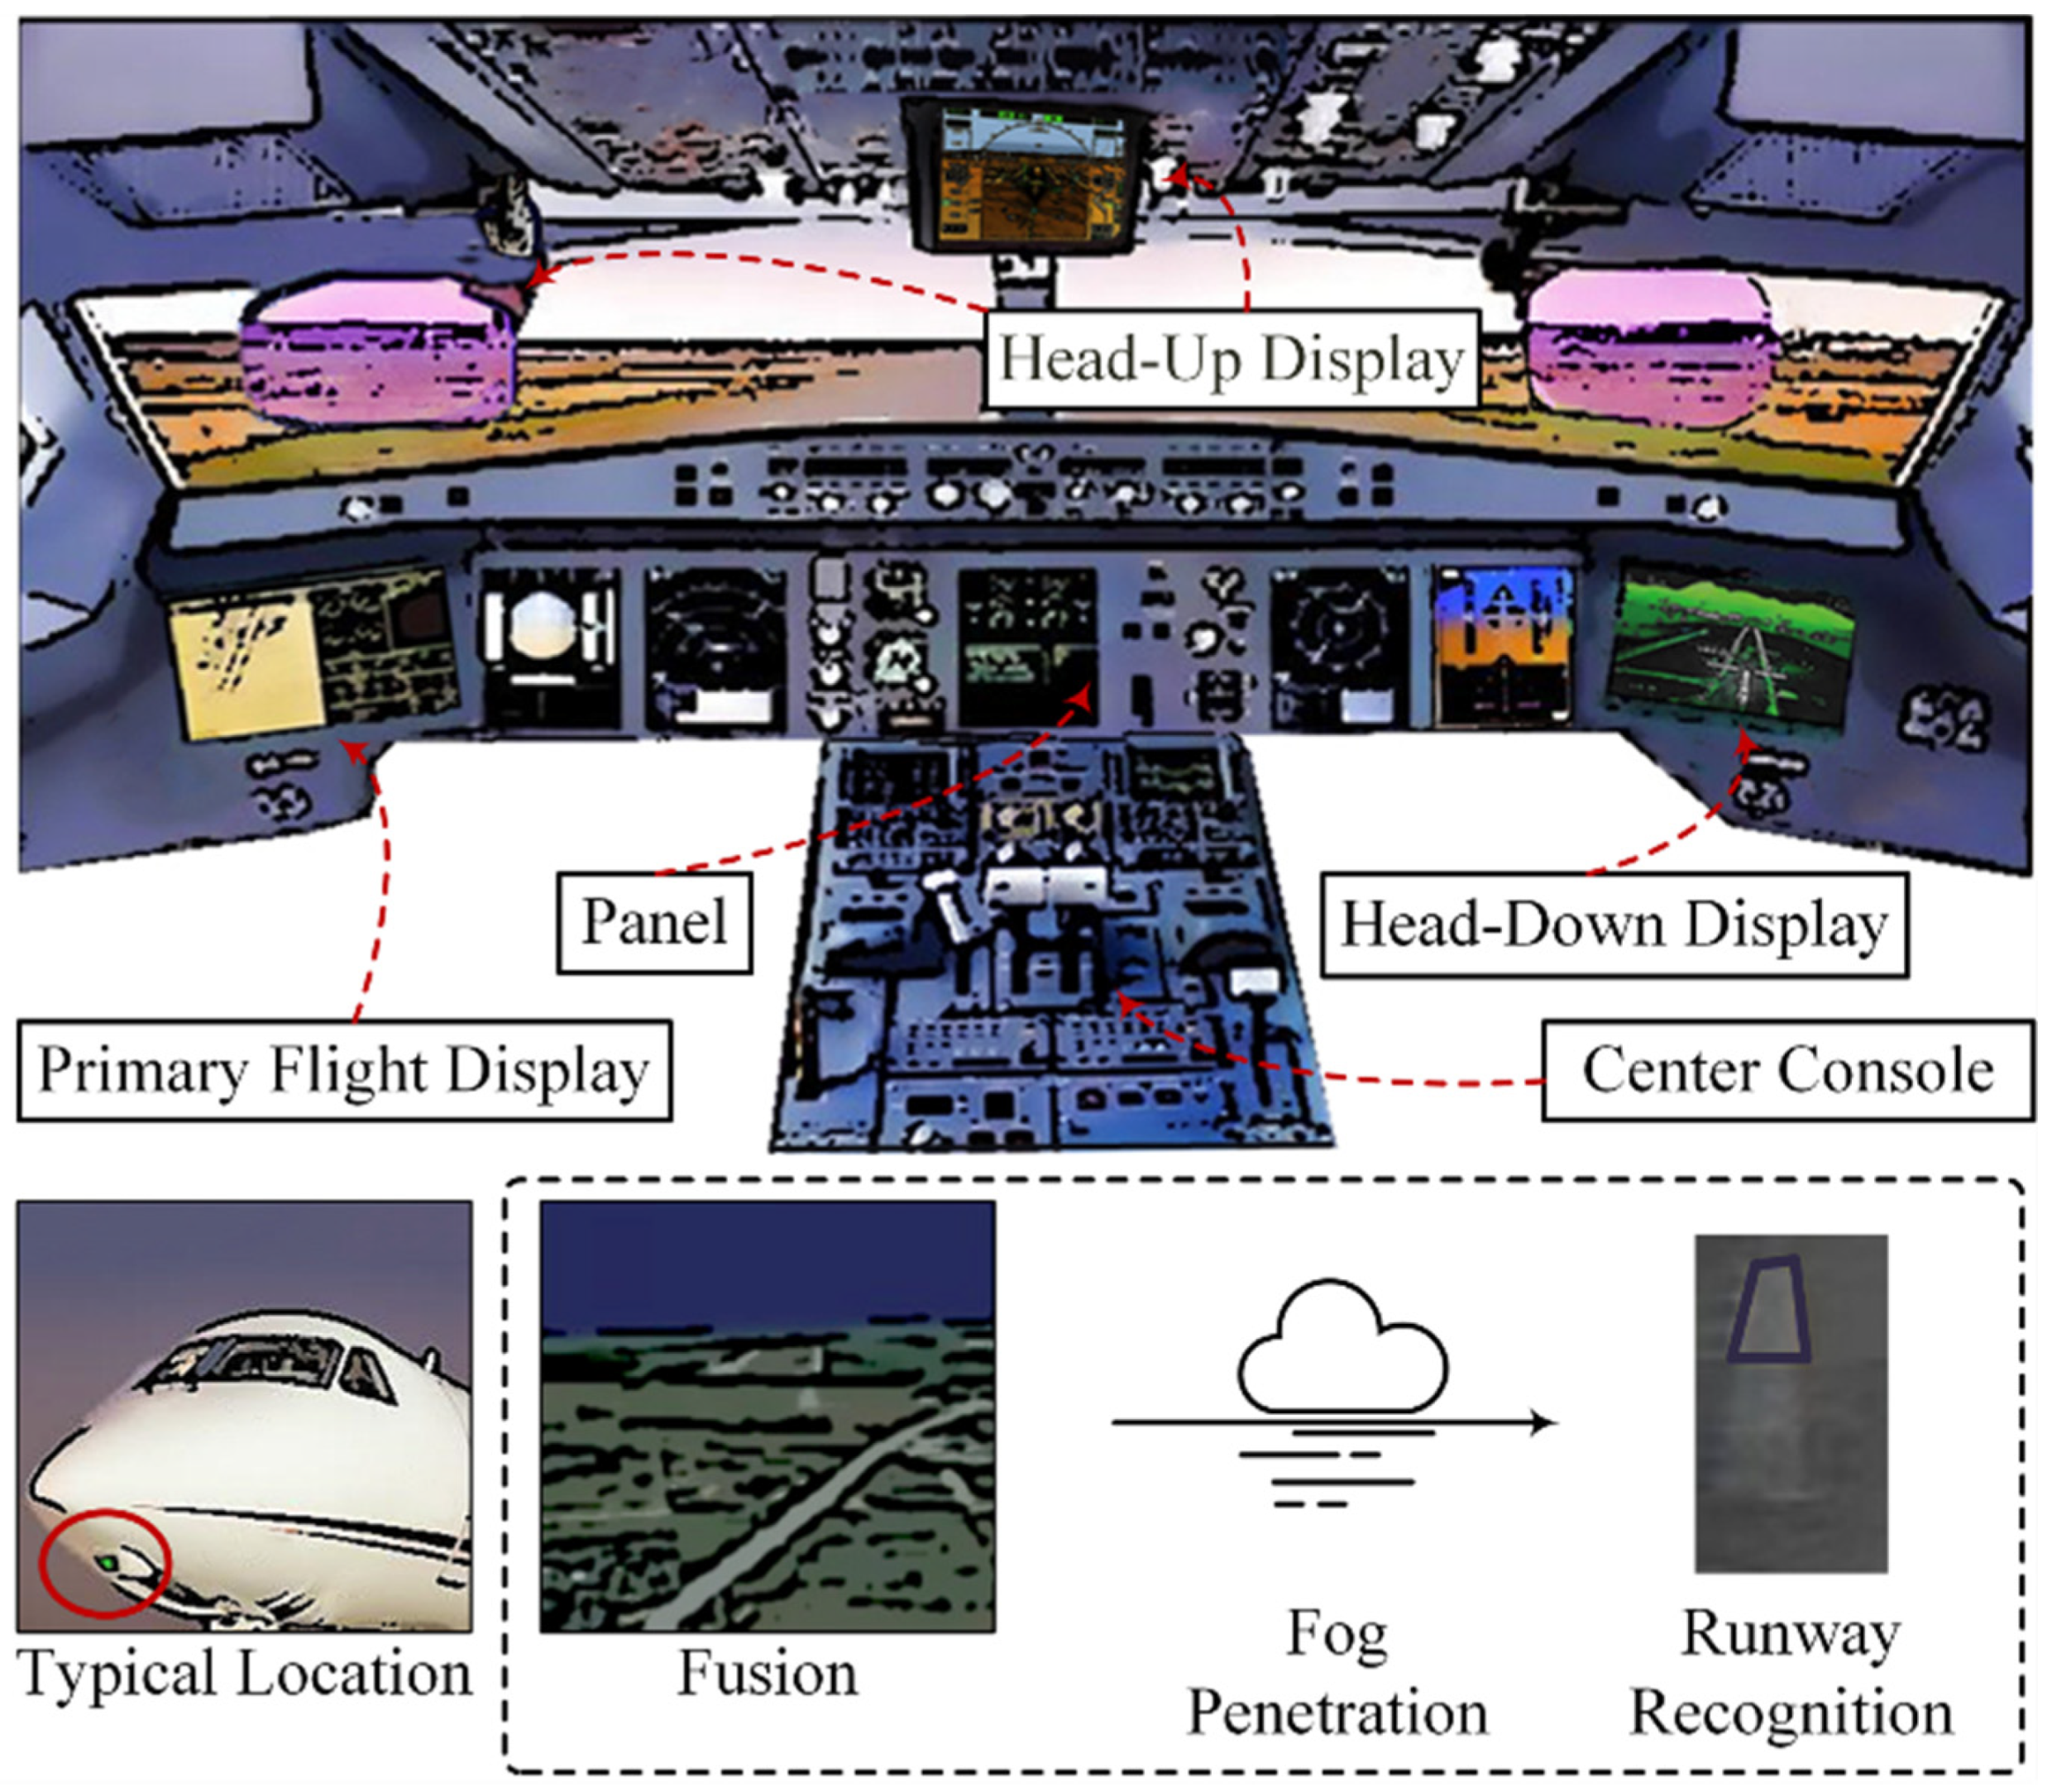
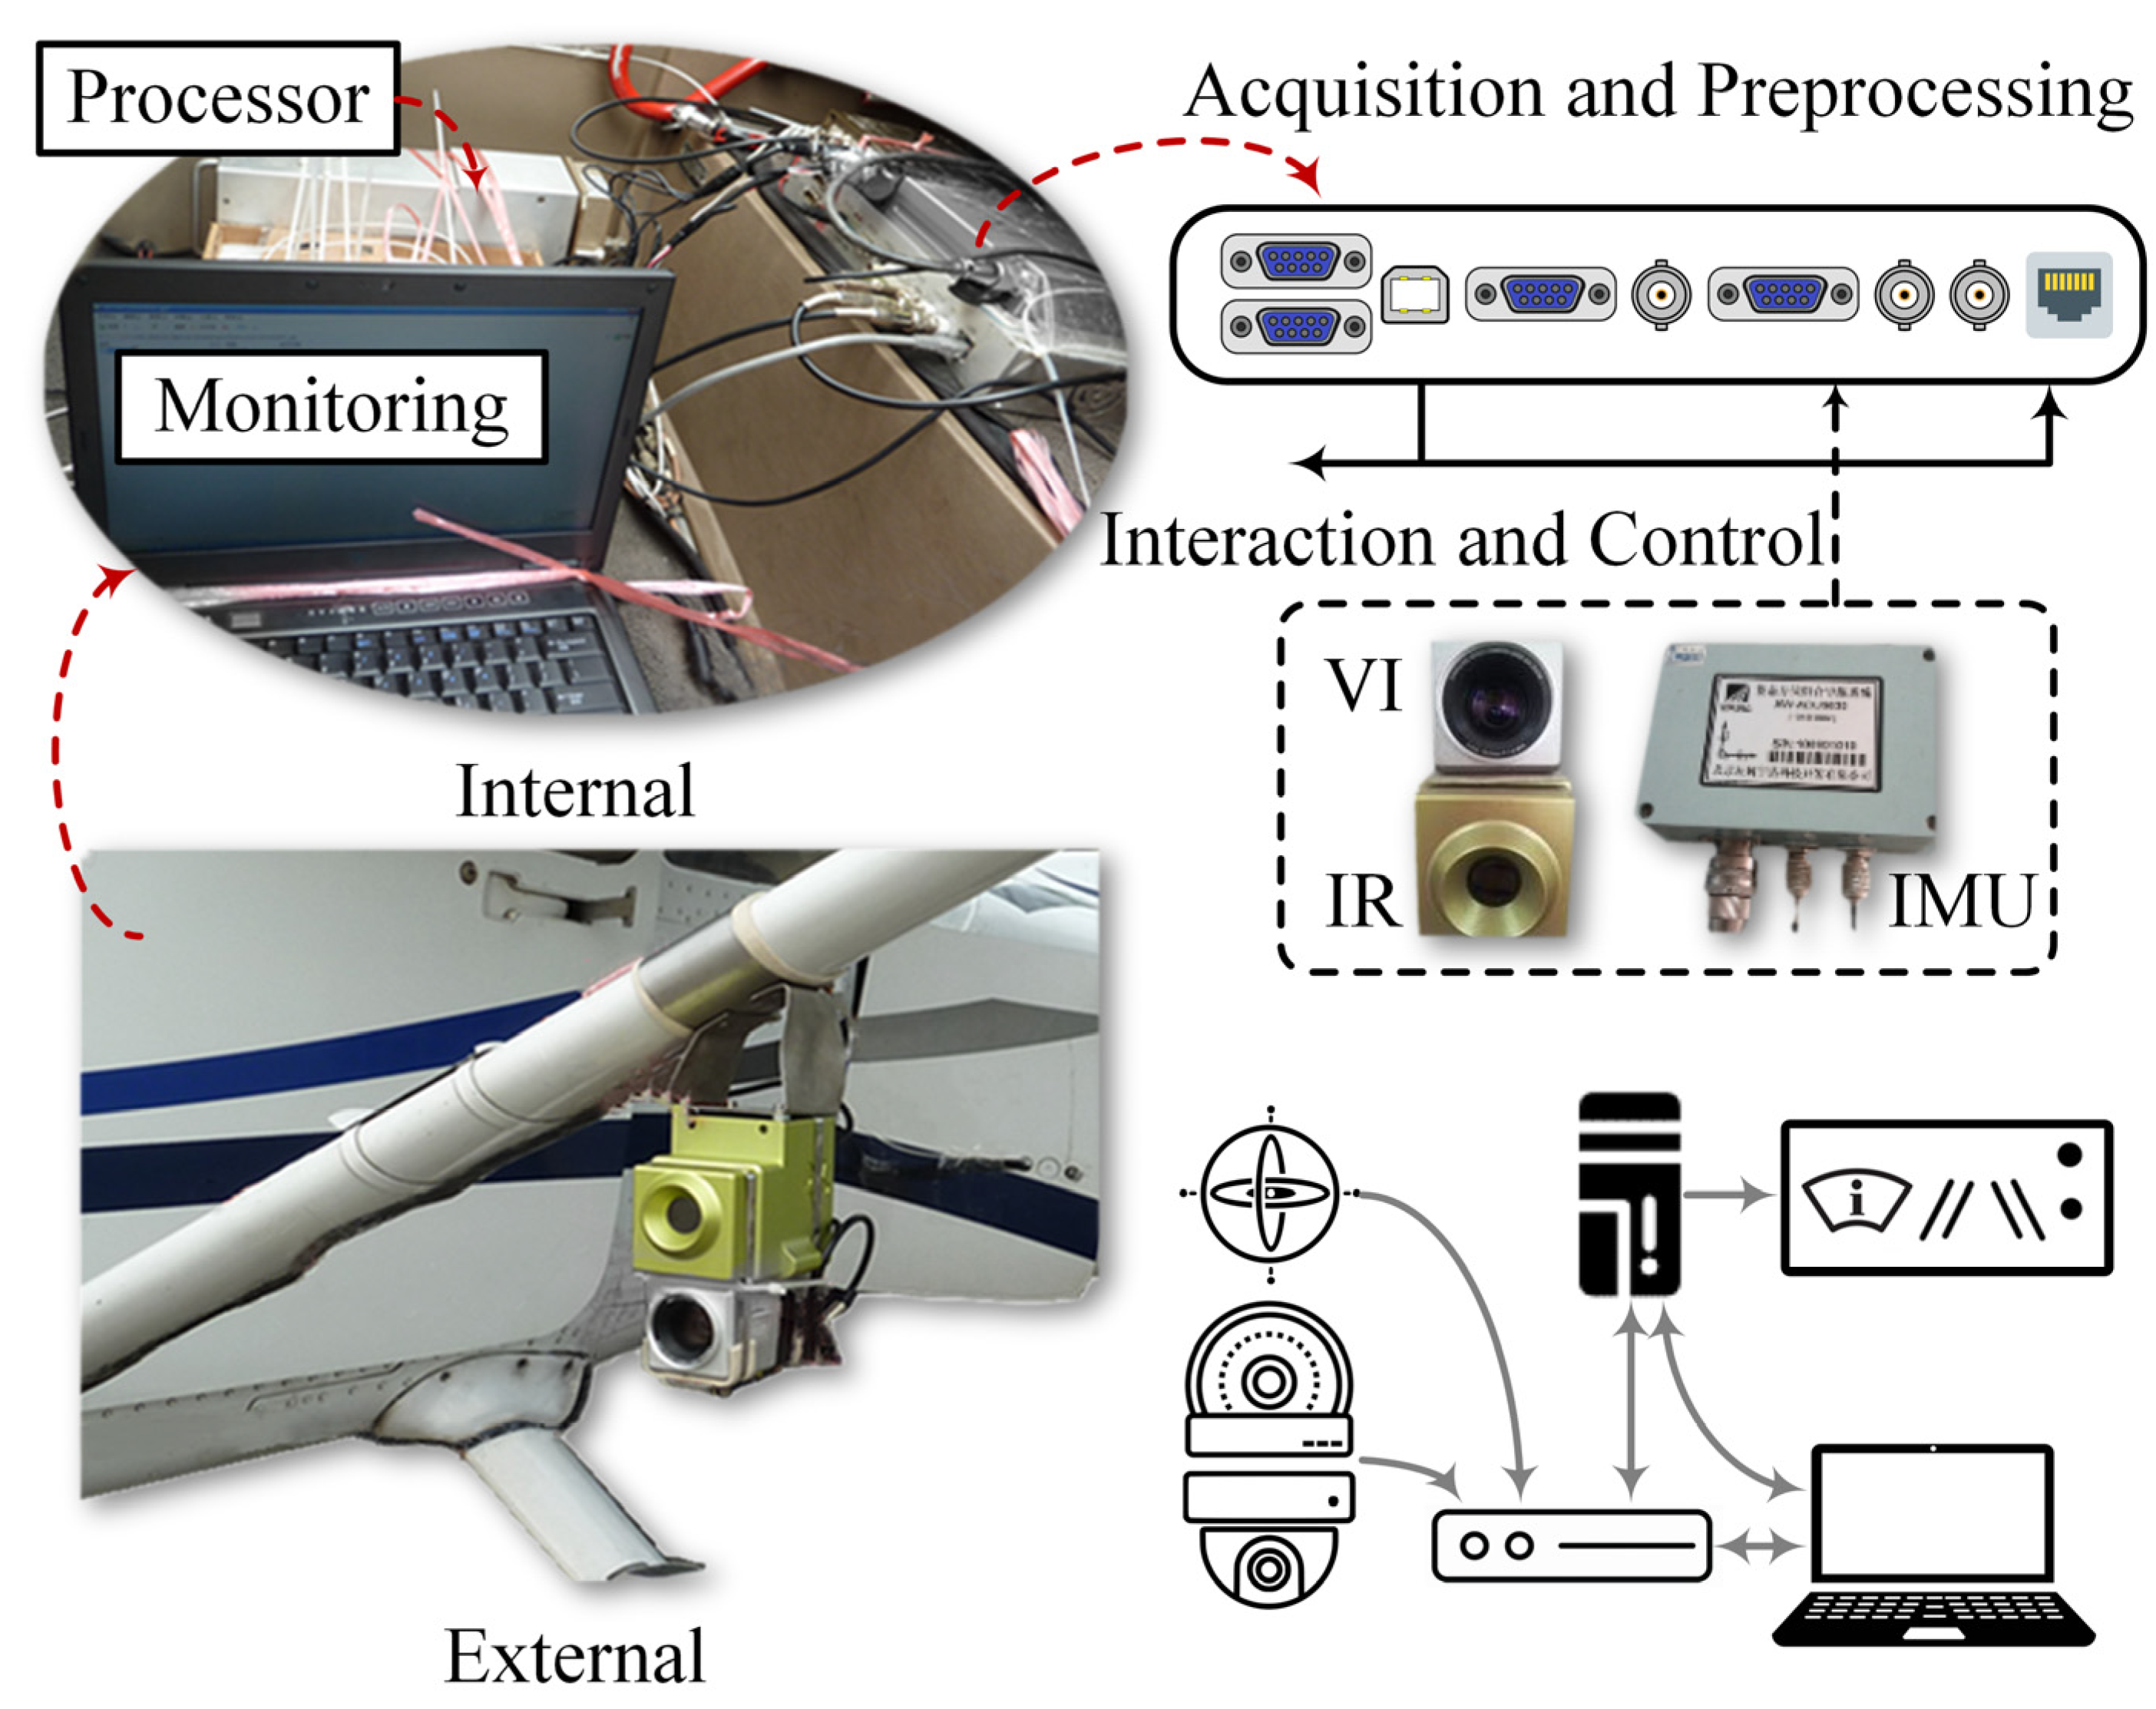
3.1. Flight Test Platform

The flight experiments were conducted in Sichuan Province, China. The flight time was concentrated in spring and summer. The airspace around the fields has frequent fog, clouds, and the absence of wind with a high relative humidity. In particular, the filler of the runway is an improved material and has thermal radiation. The test aircraft was Cessna 172 (C172), mainly employed in Undergraduate Pilot Training (UPT). The weather at the airport was cloudy but satisfied the minimum flight conditions. The aircraft was equipped with the integrated Global Positioning System (GPS)/attitude and heading reference system (AHRS), which delivers the inherent attitude data solution unit and heading information. However, GPS/AHRS depends on the magnetic field for initialization and experiences the problem of angle drift. The independent IMU was introduced to solve the hardware correction jointly, and the specific model was XW-ADU5630. The speed accuracy of IMU was 0.1 m/s, and the data update rate was 100 Hz. If the satellite signal cannot be received, IMU enters the inertial navigation mode with the high-precision micro-electro-mechanical systems (MEMS) to maintain the measurement accuracy. Because IMU provides the in-car mode, the vehicle equipped with IMU performs the field trial and cross-calibration with GPS/AHRS before departure. IMU offers accurate attitude information in the airborne mode with a high-precision inertial unit and carrier measurement technology. As indicated in Figure 5, the visible Charge-coupled Device (CCD) and FLIR sensor were installed under the wing by stacking. The visible CCD was refitted from a civil surveillance camera module (28–70 mm, F/ 2.8   L ). The autofocus of the module was shielded to obtain the stability of monitoring. The infrared component was the uncooled infrared focal-plane array (centered at 8 ~ 14   μ m ), and the Noise Equivalent Temperature Difference (NETD) was 80   mK ( < 25   ° C ). Because of the low resolution of the infrared sensor, the picture frame of the visible CCD was manually regulated to 720 × 576 , which was matched to the infrared vision.
The image and attitude sensor information were processed and distributed by the front-end system composed of the digital signal processor (DSP) and FPGA, where the data stream was transmitted through the EIA-422 bus and differential signaling. The communication rate of IMU was significantly higher than image acquisition, and the clock in FPGA was captured to establish the synchronization timestamp during preprocessing. Moreover, the corresponding data were transmitted bi-directionally through the Ethernet interface to the computer for debugging and the airborne processing host. The monitoring computer regulated the processing process and issues operation instructions. The airborne processor adopted the NVIDIA Quadro RTX 4000 GPU ( × 4 ) with 32 GB VRAM, where the algorithms were executed in parallel. The Frames Per Second (FPS) of the system was in the range of 20 24 , and this study focused on the algorithm performance in the approach and landing stages (1855 image pairs, about 75 s). In the experiment, the pilot had an auxiliary navigation system to ensure the landing, and the tower assisted in runway alignment and avoiding obstacles.

3.2. Experimental Settings

3.2.1. Training Details

In homography estimation, the data samples were processed into gray, and rigid deformations were added manually to achieve the supervised training. The initialization on shallow convolution layers applied pre-trained weights to accelerate the convergence [26]. In order to ensure the calculation of image entropy, the sample was resized to 480 × 384 , and the cropped image window was 128 × 128 × 2 with a sliding step of five . The range of λ t was 0.1 1 , and λ t reached the maximum near the landing. The 10 frames before the current image were used to constitute the stable term, and the value of ω t , f followed the equivalence principle.
The autoencoder aimed to reconstruct the input, and the monitoring data in high visibility was used to train the network backbone, where the weight initialization and pre-training datasets followed DenseFuse and U2Fusion. The image samples were processed according to the RGB channel without clipping before the encoder and decoder, constituting the fusion framework. After training on the backbone was completed, the visible samples without fog were used are used to fine-tune the visible branches. At this time, the weight of the encoder was frozen, and the learning rate of the decoder was reduced to maintain stability. The complete training of ViT is time-consuming, and the fine-granularity on the infrared branch is unnecessary. On the infrared branch represented in Figure 4, the down-sampling constructed by average pooling warped the input to 384 × 384 , and the feature maps obtained by the transformer were consistent with the infrared encoder through convolutional and up-sampling layers. Therefore, the pre-trained ViT-base model [46] can be deployed to extract attention features, which avoids the retraining for the infrared branch. In the loss function, λ s for SSIM was set to 0.001, where MSE is dominant, to maintain the reconstruction accuracy. The threshold θ for controlling the proportion was set to 0.5. Therefore, the fine-tuning of the infrared branch was translated into updating the convolution layer and the decoder. The shared decoder could be achieved through alternate training. The visible and infrared branches in alternating training adopted different learning rates, and the update step of the infrared branch was relatively small. Because SSIM loss was manually reduced, the network could converge based on pre-trained models and fine-tuning. The training was implemented on an NVIDIA Tesla V100 ( × 2) with 32 GB VRAM. The visual enhancement experiment was implemented in the fog environment, and satisfied the flight safety requirements.

3.2.2. Comparison Algorithms and Evaluation Metrics

The registration baseline in the airborne system was the SIFT-based algorithm because of the implementation difficulty and operator optimization. The SIFT descriptor [20] combined with RANSAC [23] was tested on behalf of the traditional scheme. In addition, the registration based on the You Only Look Once (YOLO) algorithm was considered [8], and detection anchors acted as the feature points to participate in homography estimation. The manually calculated deviations in the descent stage were used as the ground truth to evaluate the performance ( 120 pairs). The mean squared error (MSE) metric measures the registration error with non-collinear points corresponding to the homography matrix.
The algorithms summarized in Table 1 were implemented for comparison in fusion experiments. The corresponding parameters were set according to the publicly available reports. Moreover, fusion methods such as GTF, NestFuse, and DualFuse, which are incapable of reproducing in the RGB version, were compared with gray samples. For the operation efficiency, compound strategies in DenseFuse and DualFuse were abandoned, where the addition fusion processes intermediate features. U2Fusion is tailored to the single task mode. The implementation of the fusion algorithm is based on deep homography estimation, and the image pairs are not completely registered. The image dislocation correction by fusion algorithms was not considered in this study.
Numerous evaluation metrics for image fusion include intrinsic information, structural property, and feature analysis. The metrics calculated for image information were Cross-Entropy (CE), EN, and Mutual Information (MI), which evaluate the richness quality of fusion. Detail retention is intuitively assessed by the peak signal-to-noise ratio (PSNR). SSIM and Root mean squared error (RMSE) depict the structural relation between the input and fusion results. Average Gradient (AG), Gradient-based fusion performance ( Q AB / F ), Edge Intensity (EI), and Variance (VA), respectively, reflect the sharpness of the fused image. Spatial Frequency (SF) provides a similar assessment perspective at the frequency level. The open-source Visible and Infrared Image Fusion Benchmark (VIFB) toolkit [28] implements the above indicators. Different from the conventional vision task, specific metrics are calculated on infrared and visible samples, respectively.
Additionally, manually designed metrics were introduced to enrich the evaluation. Tsallis Entropy ( Q TE ) was embedded in MI to improve divergence properties [48]. The Chen–Blum metric ( Q CB ) utilizes contrast sensitivity filtering (CSF) to solve the global quality map [49]. The Chen–Varshney metric ( Q CV ) and the Q CB -mixed version ( Q CV / B ) measure the quality of the local region [49,50]. Nonlinear Correlation Information Entropy ( Q NCIE ) is used for feature correlation measurement [51]. The Yang metric ( Q Y ) compensates for the singleness from SSIM, where fusion tendency can be identified [52]. Visual information fidelity ( Q VIF ) measures the complementary fidelity between images and obtains the loss of information [53]. Additionally, color quality ( Q C ) was introduced to adapt the flight vision system [54].

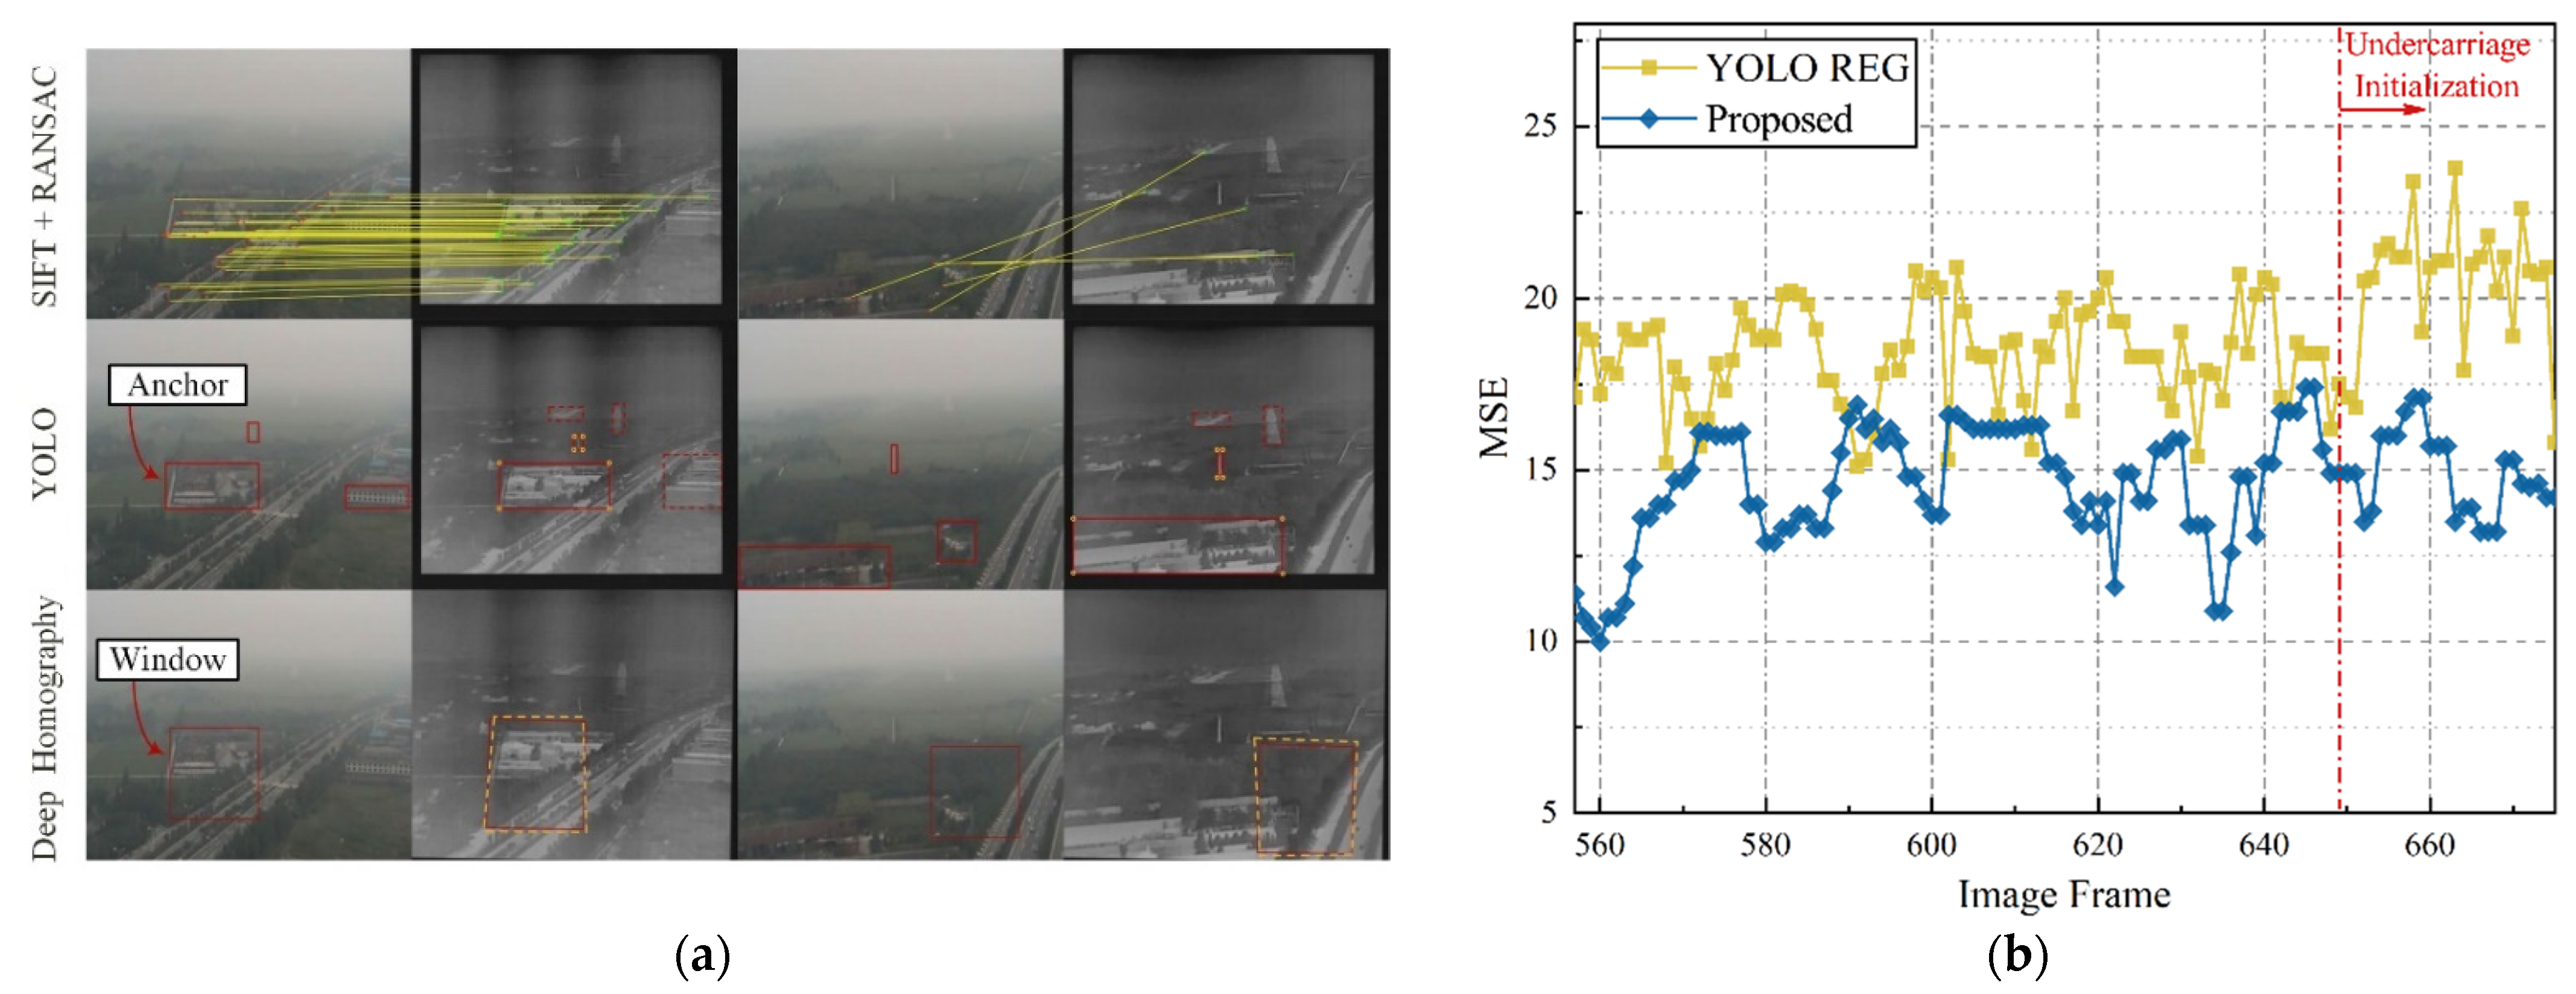
3.3. Visual Calibration Evaluation

Figure 6a demonstrates the results of visible calibration and registration. Despite the fog, the vision can maintain an appropriate field at different stages after hardware calibration. Because the measurement was based on the visible CCD, the images from the infrared sensor have evident scaling and rotation deviations. SIFT can extract operation points from image pairs near urban areas and build the screening foundation for RANSAC to calculate the transformation matrix ( 5.01 MSE 9.35 ). However, SIFT fails in the landing stage because of insufficient matching points, while the execution of RANSAC initiates vision distortion. The scheme based on deep networks has the probability of finding different objects to sustain the operation. Relatively, anchors in YOLO introduce additional instability with the deformable setting. Similarly, the proposed entropy window leads to a particular estimation deviation in the corner dominated by the background. Figure 6b shows the performance comparison in the critical landing stage, in which SIFT is invalid. YOLO and the proposed method can operate with accuracy loss, and the registration error is acceptable for fusion algorithms. The proposed scheme with initial regulation and stability terms is more stable than YOLO.

3.4. Fusion Enhancement Evaluation

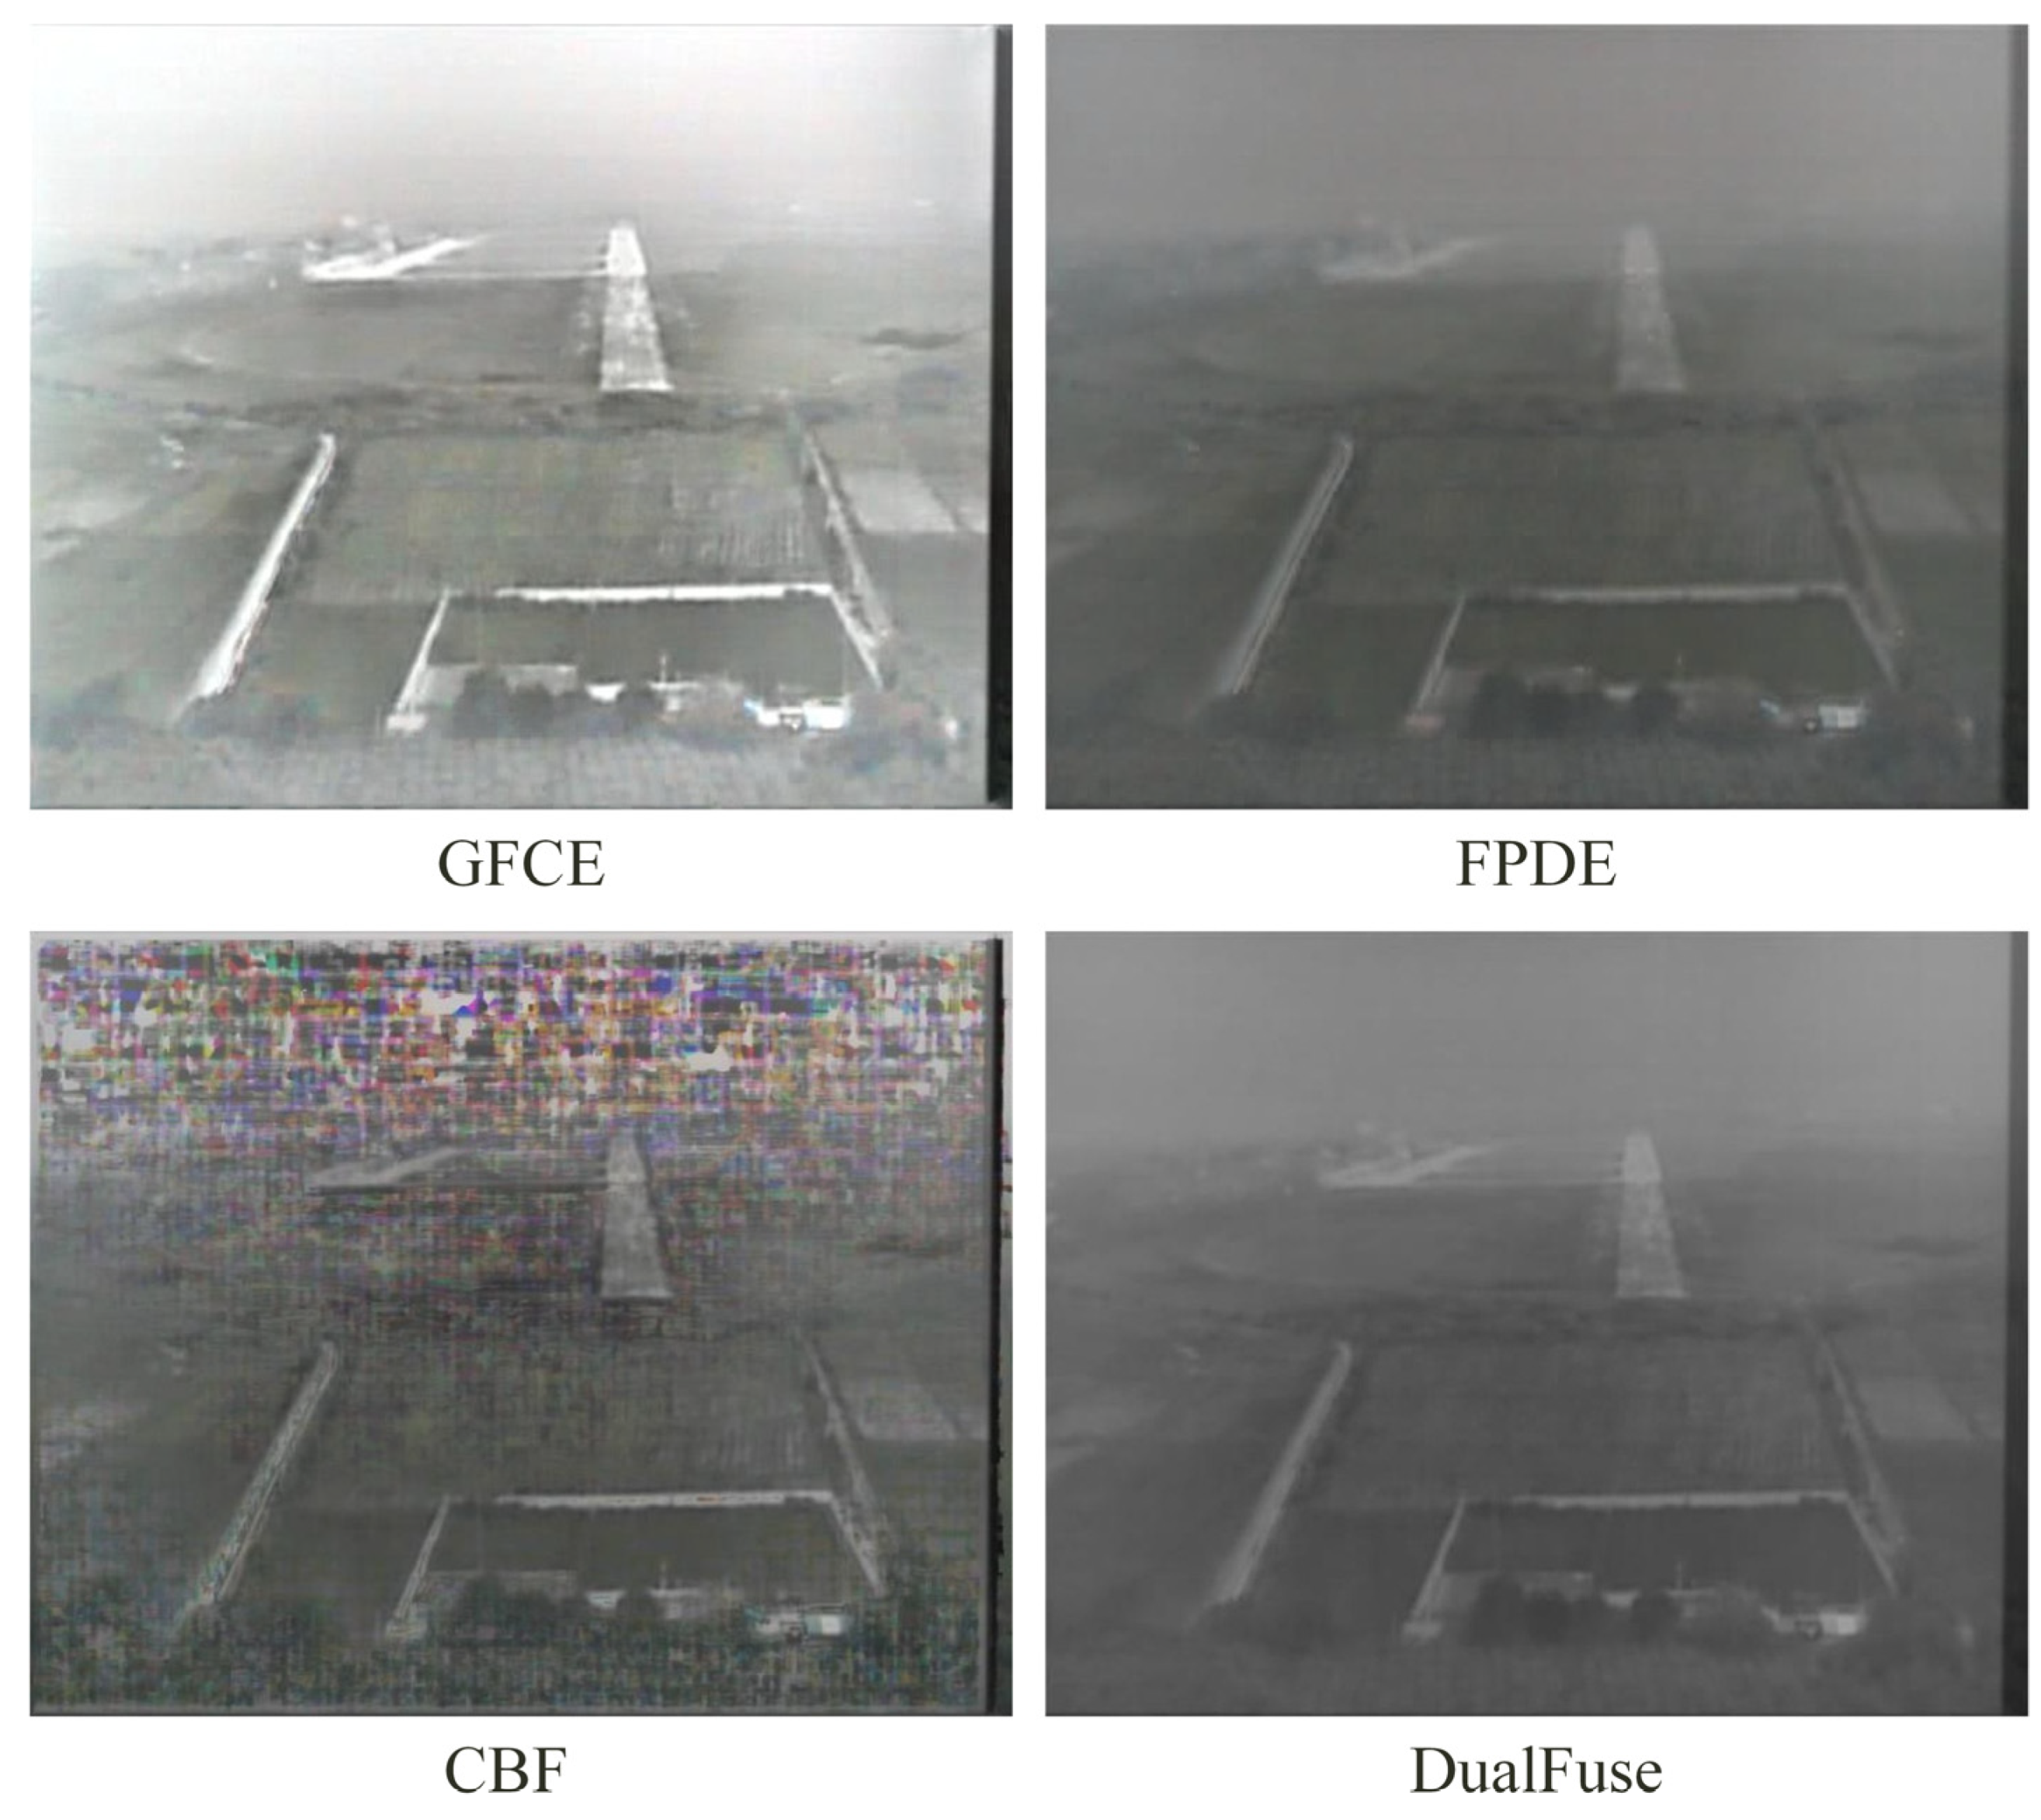
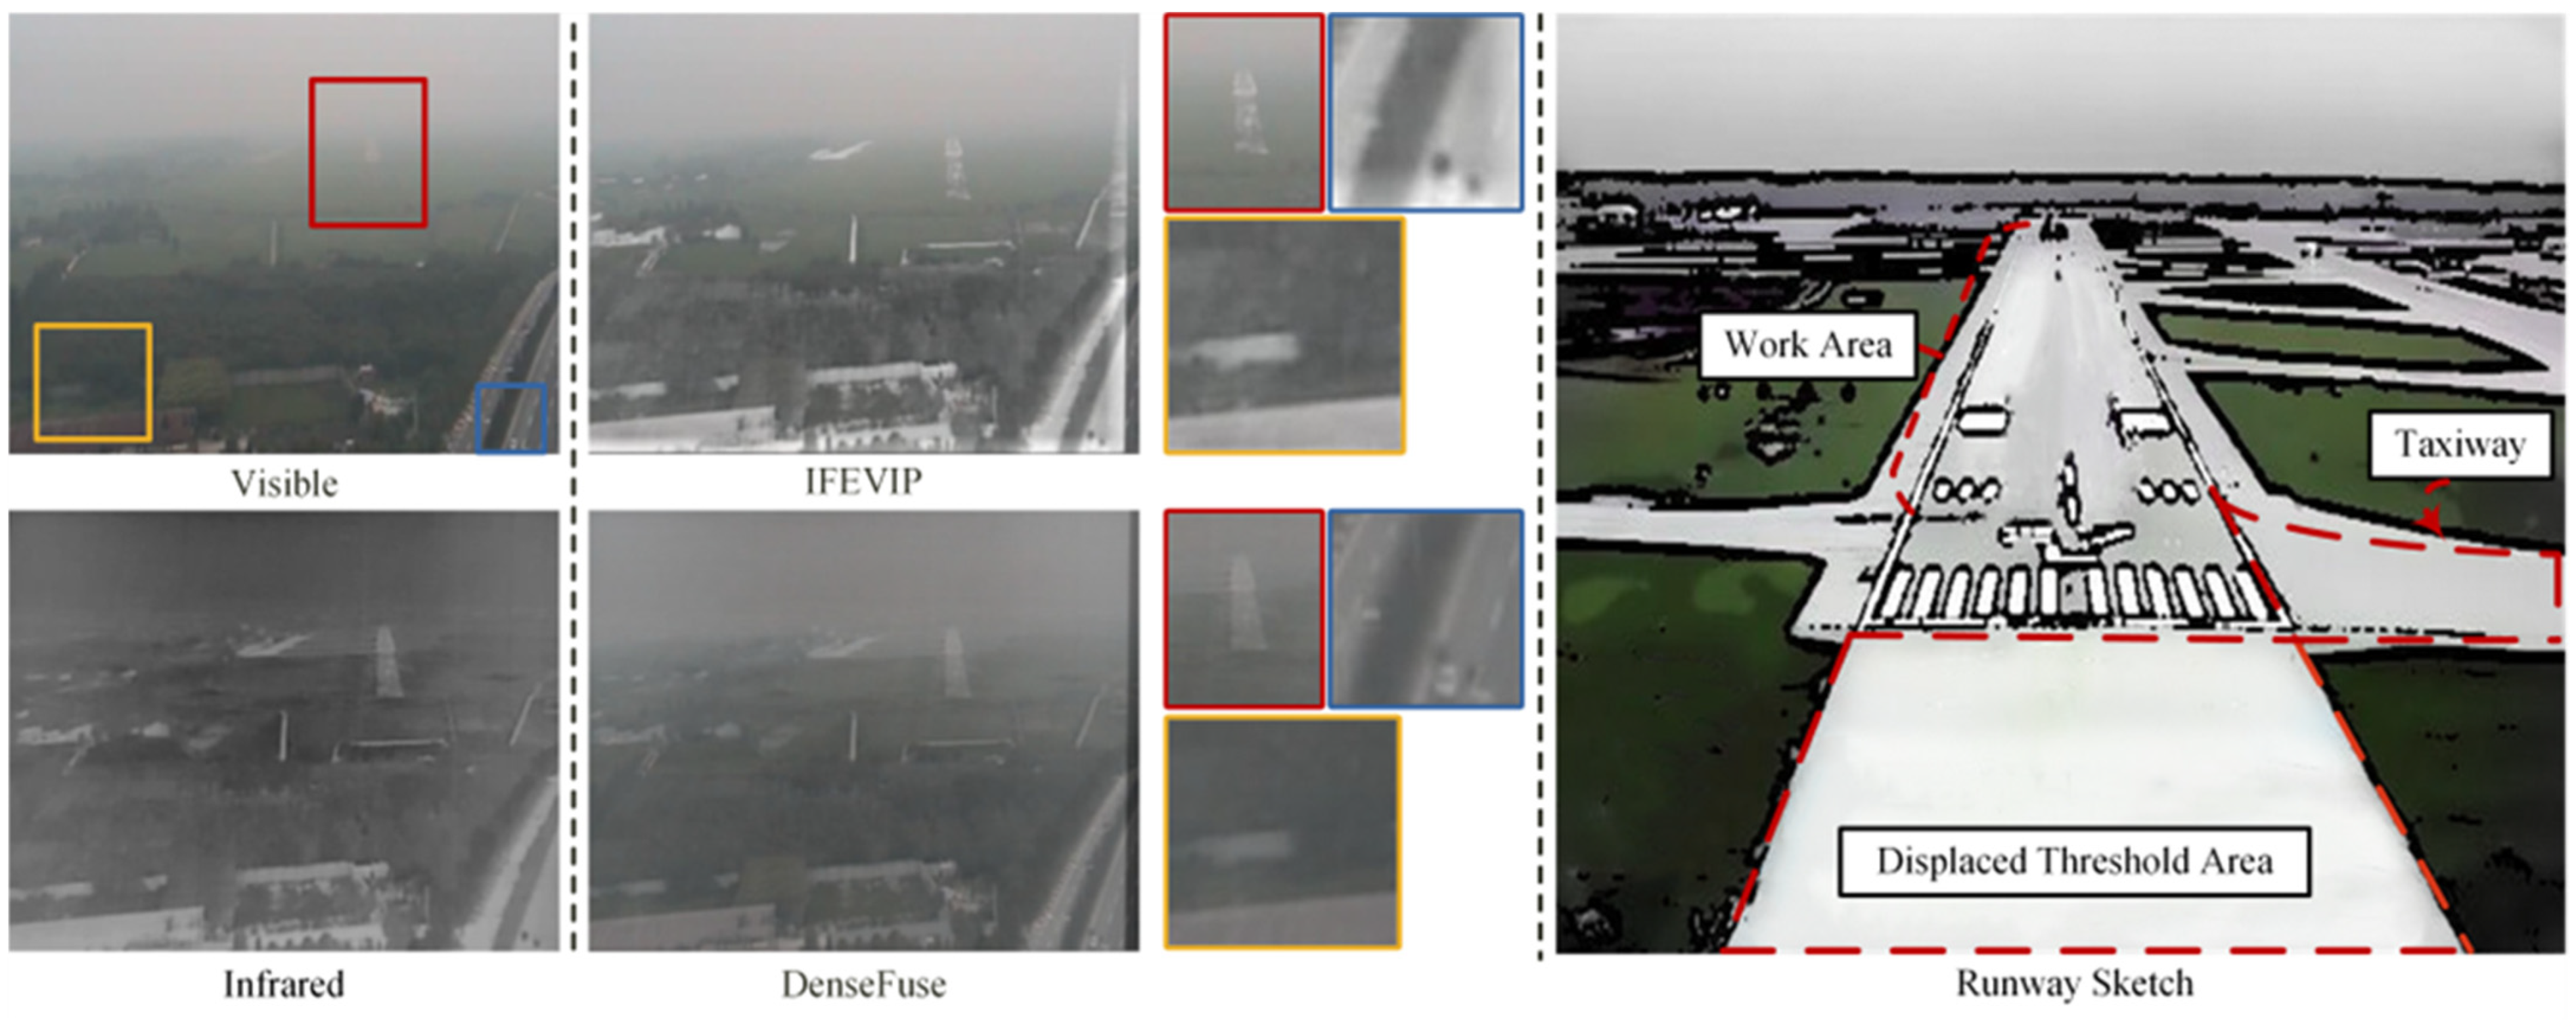
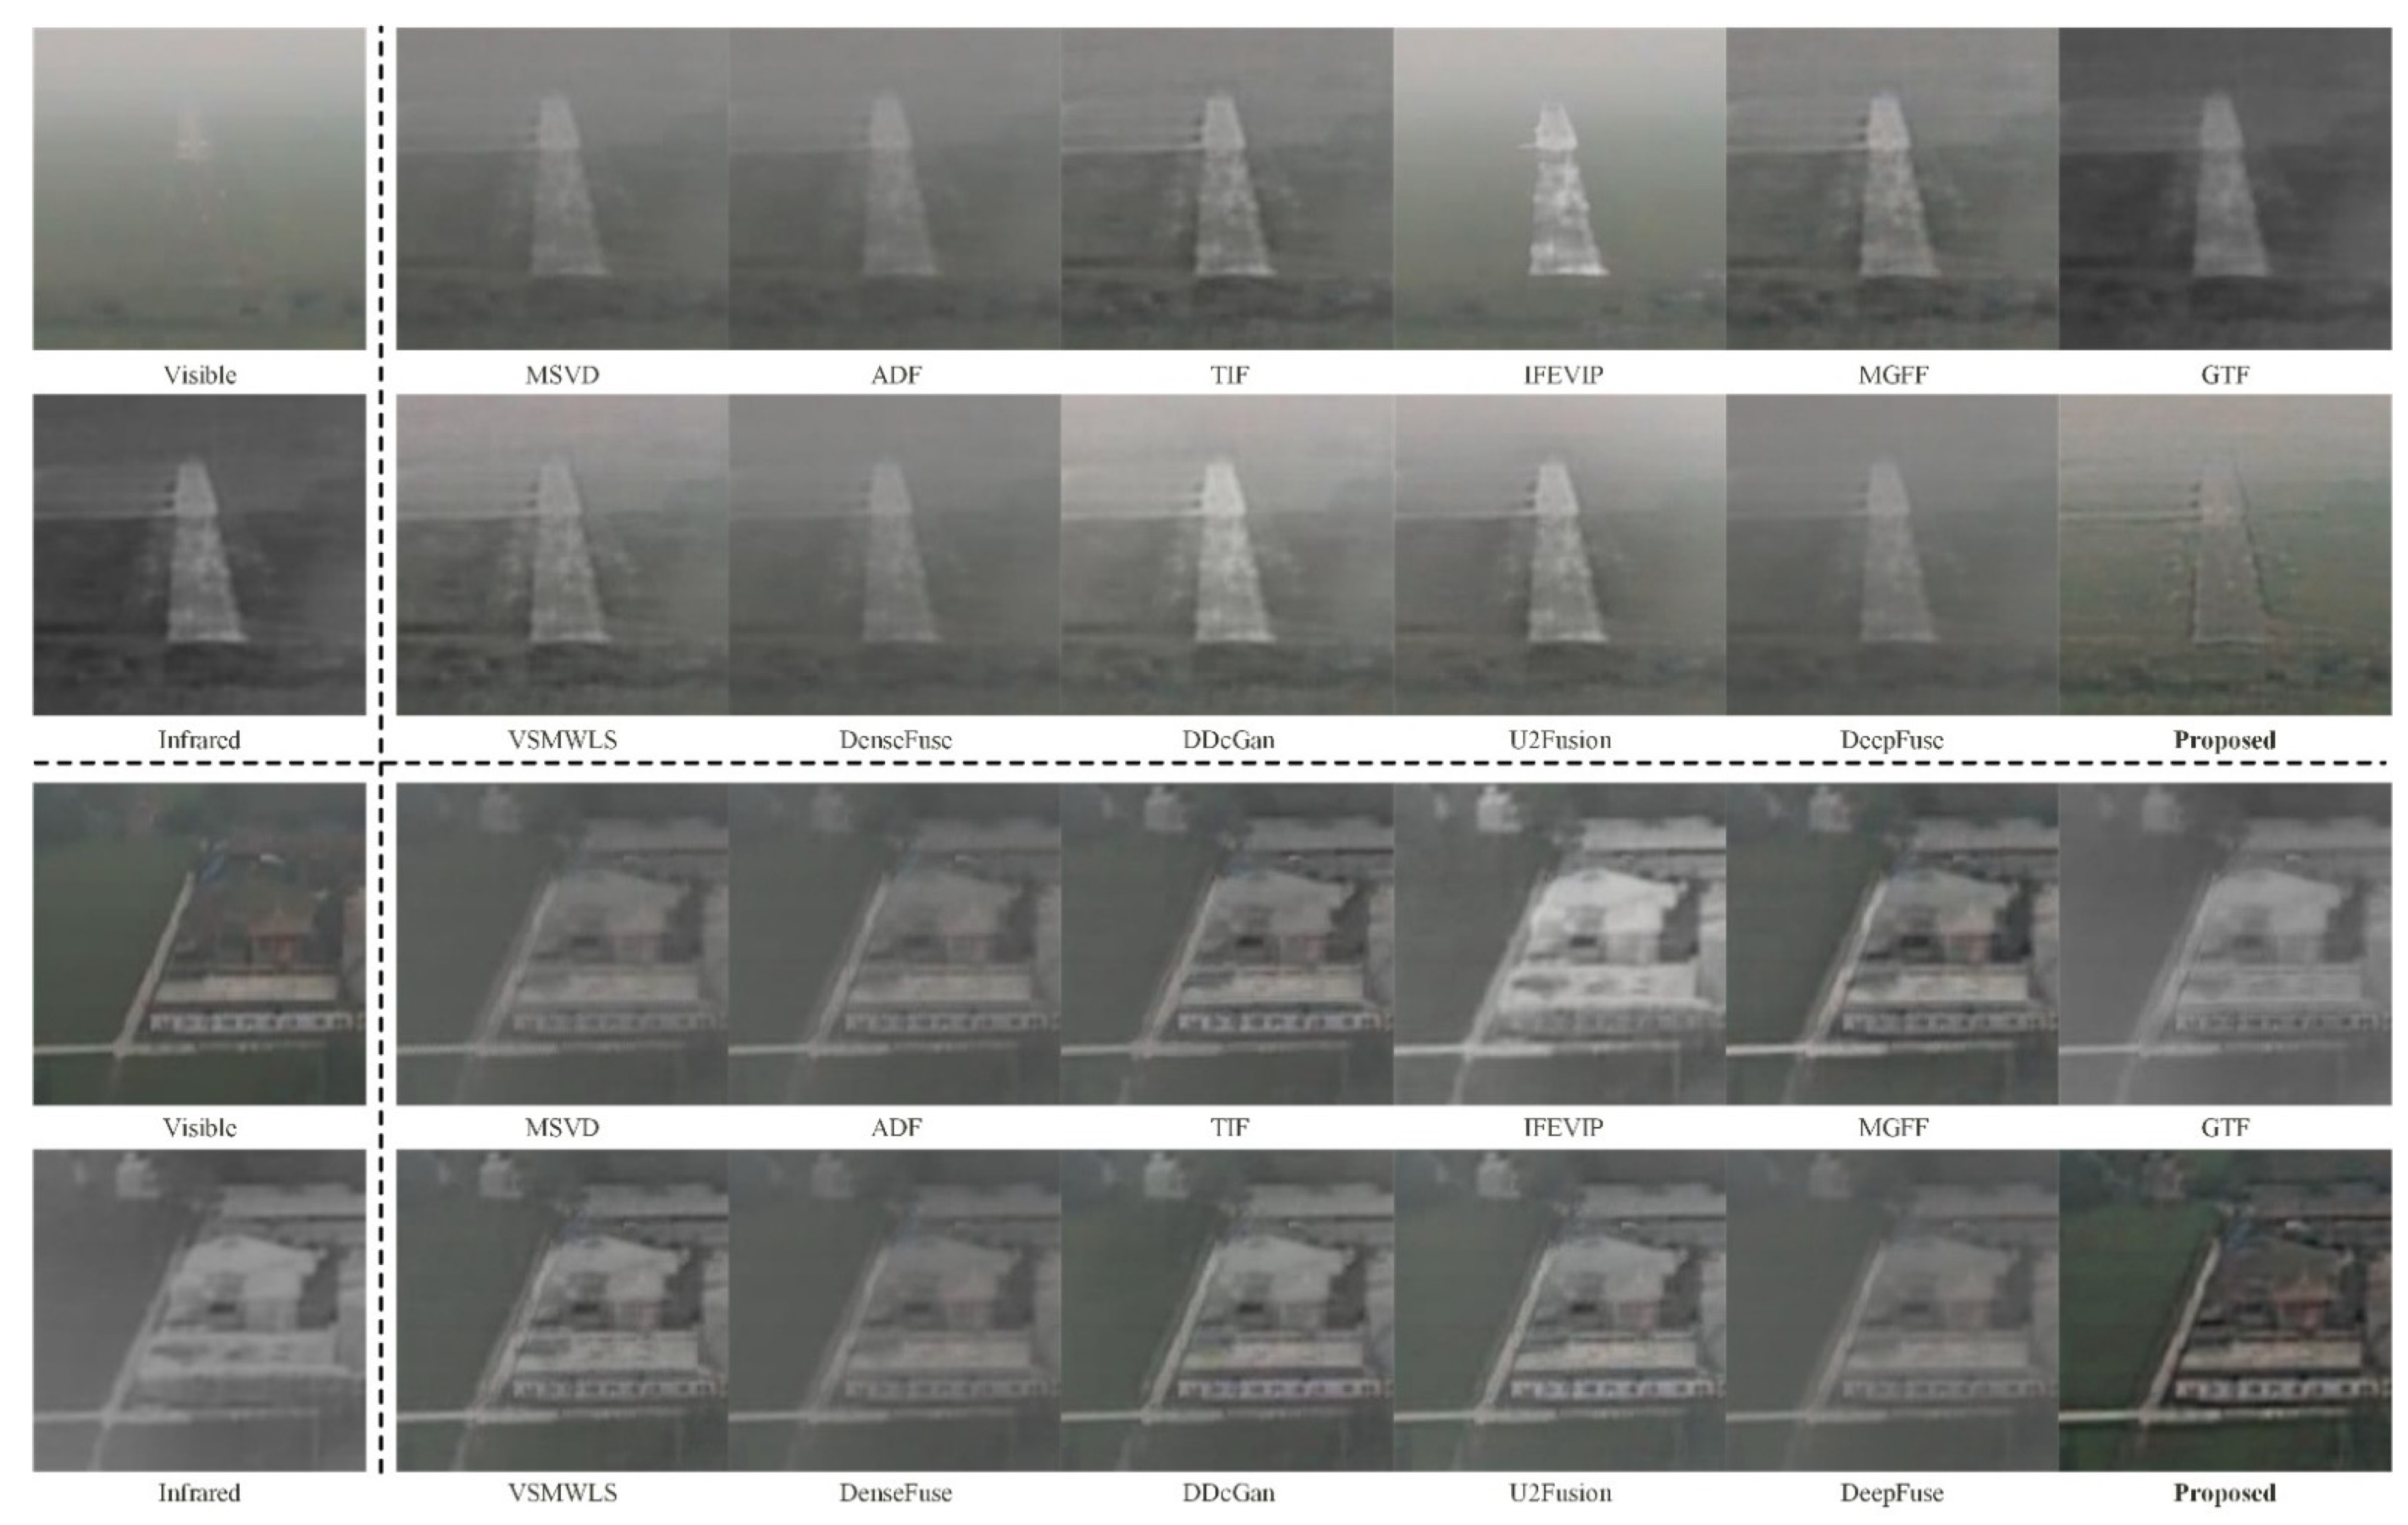
3.4.1. Qualitative Analysis

Figure 7 reveals the qualitative comparison results of fusion algorithms in different flight stages. Because of the overexposure and color spots, CBF, GFCE, FPDE, and NestFuse were excluded from the qualitative comparison (See Appendix A). In the initial landing stage, the combined action of atmospheric illumination and thermal radiation leads to an inevitable spline noise in infrared images. The algorithms with the superposition category cannot avoid the spline in the fusion result except for IFEVIP. However, the infrared feature extraction from IFEVIP loses the runway information, where the bright relationship is exclusively considered. The proposed method does not directly conduct superposition but promotes the decoder to reconstruct the reconstructed feature maps and avoid infrared defects. Meanwhile, visual attention is not significant in analyzing the long-range runway when the urban background is involved. With the reduction in height, IFEVIP, VSMWLS, and DDcGan are partially contaminated by infrared radiation information, where the white area masks visible features. In order to obtain the gradient optimal, the optimization results of GTF tend to preserve correlation with infrared samples, while the regularization terms are unbalanced with finite iterations. The fusion results of DenseFuse and DeepFuse are blurred, and the vegetation background is confused. In contrast, U2Fusion and the proposed algorithm can reserve the details of the visible image, and the fusion with attention is in accord with human visual perception.
Additional qualitative analysis was provided by amplifying local details represented in Figure 8. The pivotal runway information could be observed after the proposed fusion strategy. In Figure 2, the composition of the landing runway is hierarchical, which means that the aircraft is required to land accurately in the designated area. Although the threshold area is paved without auxiliary radiation materials, observing the boundary from infrared samples is difficult, especially when the temperature difference is non-significant. TIF and VSMWLS reconstruct sufficient texture information, while noisy points deteriorate the imaging quality. IFEVIP can separate the runway from the background but reduces fine-grained resolution. The proposed fusion method can intuitively distinguish the landing runway, taxi area, and threshold area. In addition, in integrating non-landing information, U2Fusion and the proposed scheme have advantages in imaging. Considering the details of the house and roads’ inherited registration error, the self-registration in GTF and Deepfuse is invalid, where the calibration blurs the edge features of the object. In comparison, information measurement from U2Fusion improves the feature extraction performance and stabilizes the details. The proposed method improves the texture significantly while avoiding the infrared mask covering the landscape. During landing, the pilot cannot observe the complicated environment scene, which means that the outline of objects is expected to be precise.

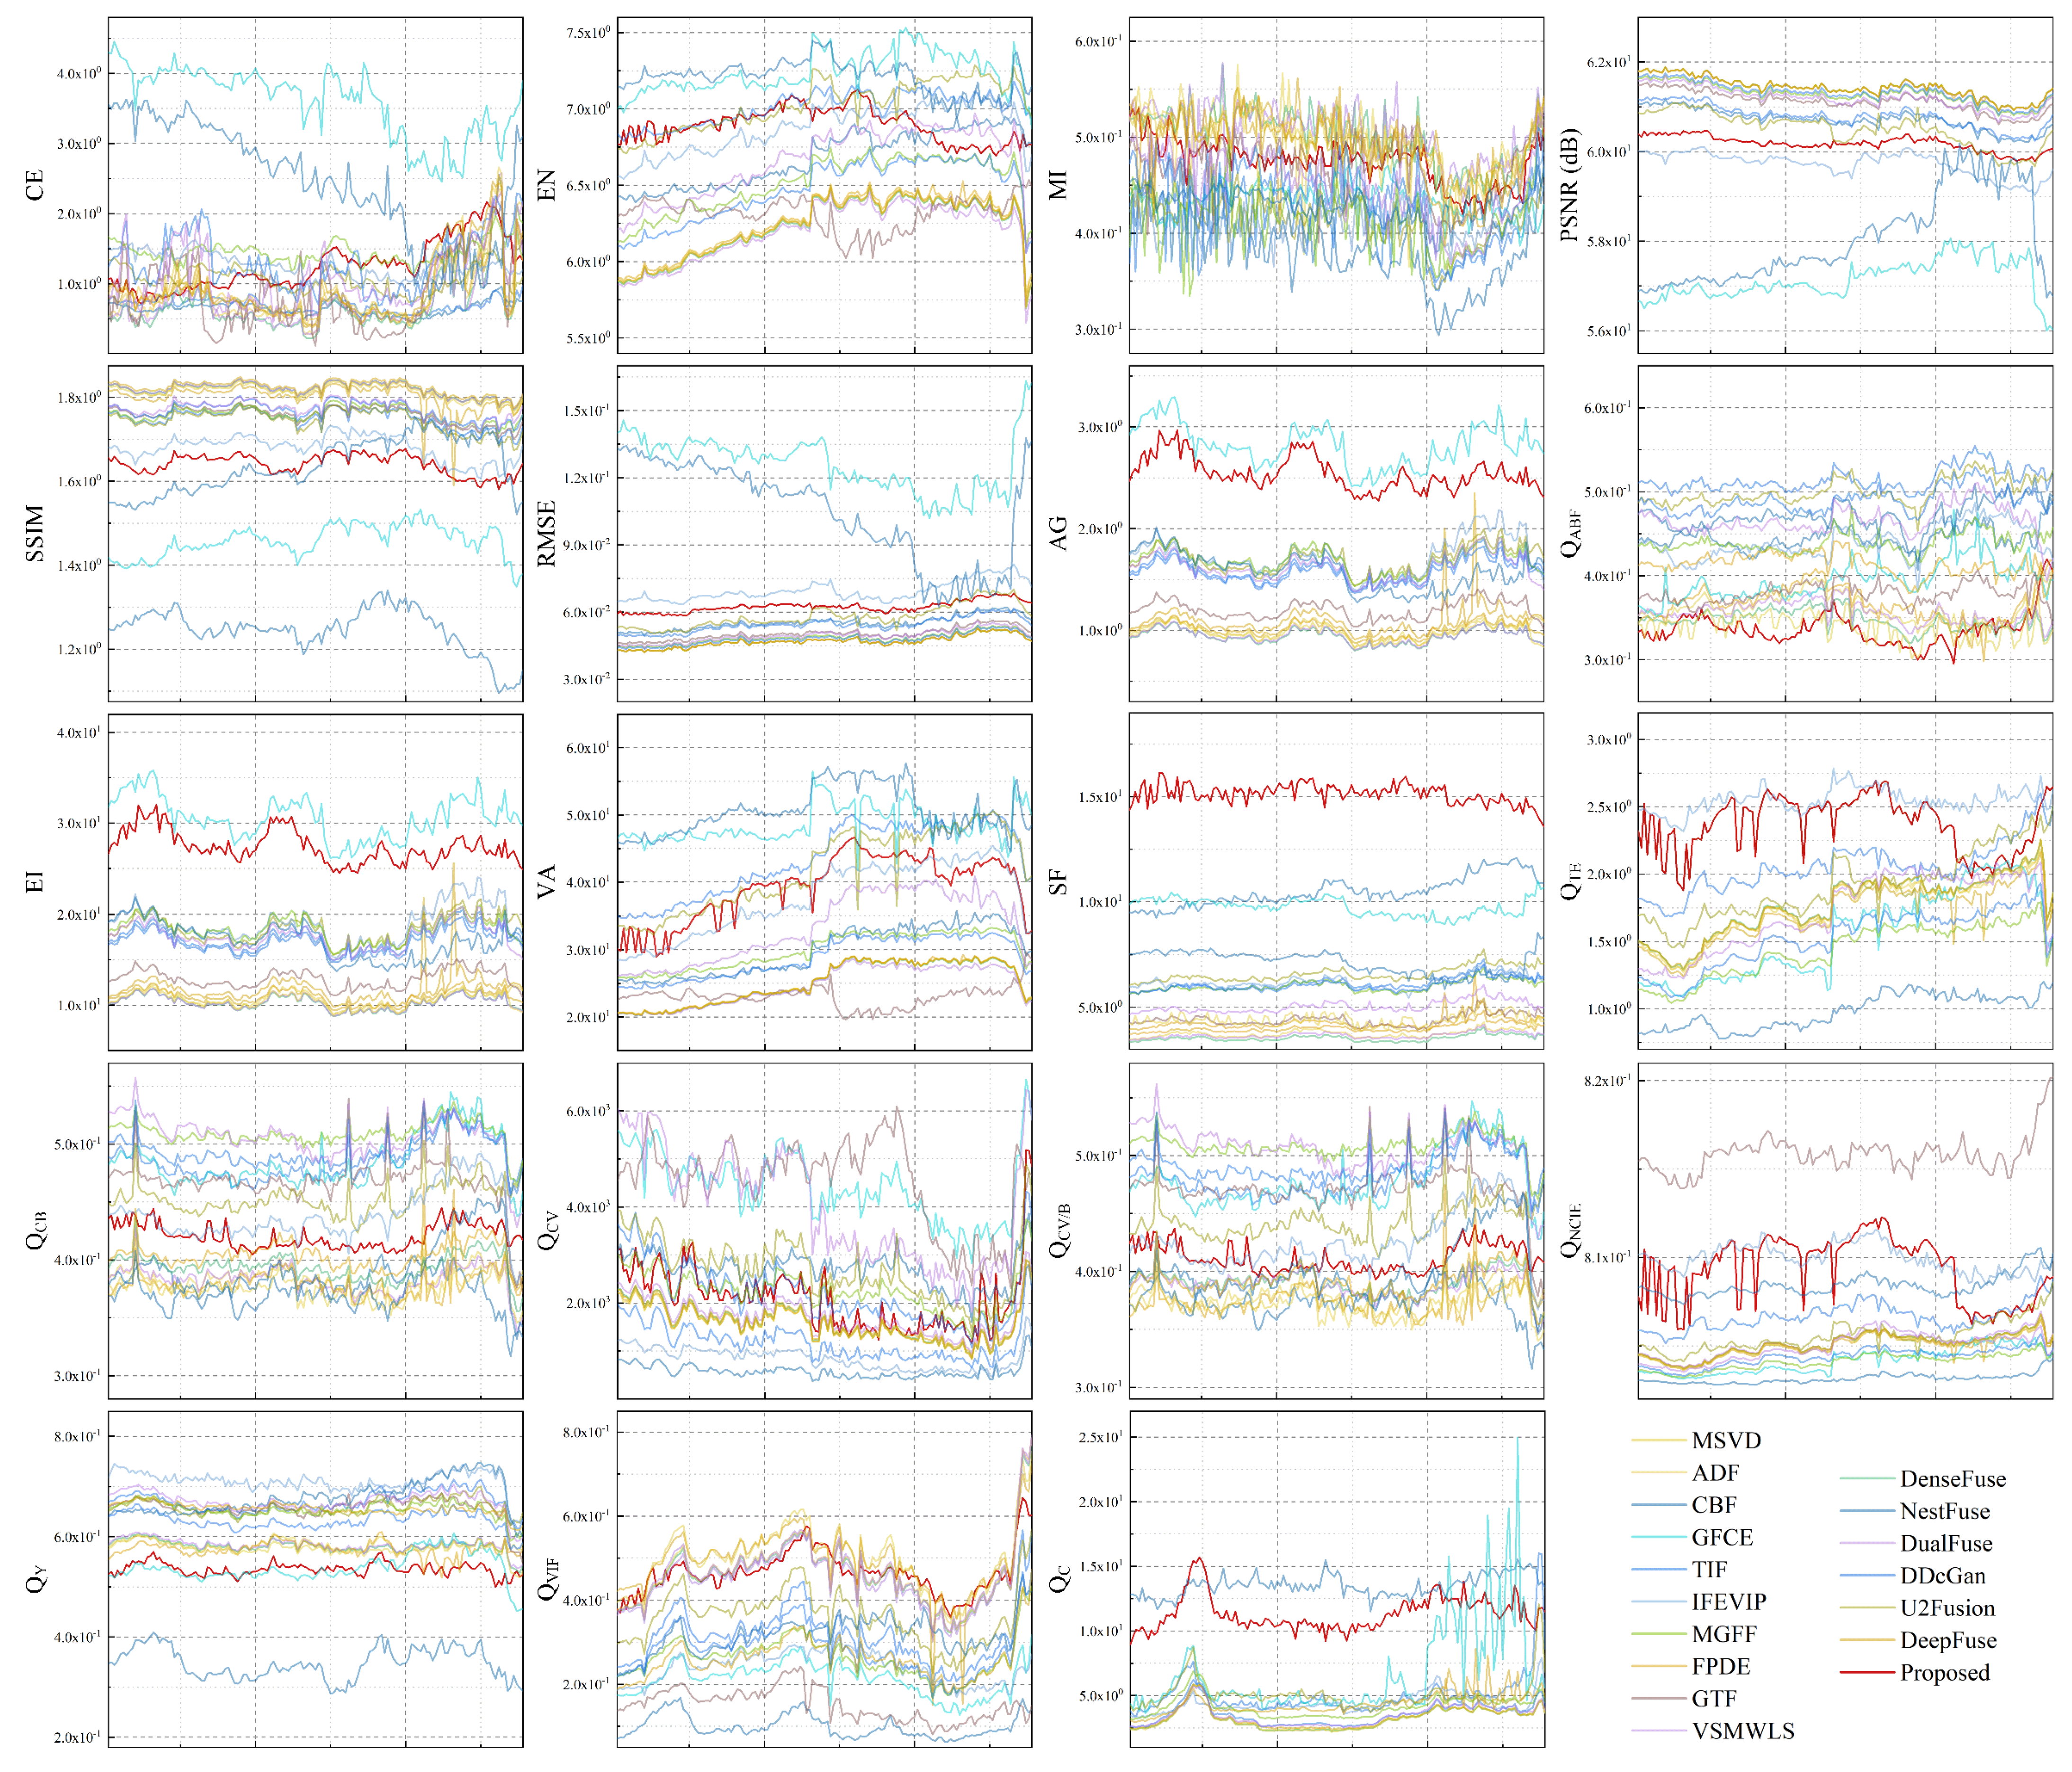
3.4.2. Quantitative Analysis

The comparisons were performed on 139 image pairs sampled with 10 frame intervals (except for the decelerating stage). The metrics requiring RGB output are skipped on GTF, NestFuse, and DualFuse. Because of the noise interference, CBF was absent from the AG and EI calculation. The average quantitative results of the entire process are summarized in Table 2. The PSNR of more than 60 dB shows that different algorithms (except for GFCE, IFEVIP, and NestFuse) can reconstruct the foundational information with the input samples. Without calculating input images, the high EN in GFCE and NestFuse is caused by overexposure, introducing redundant elements or textures. Because of the feature superposition strategy and end-to-end reconstruction mode, DenseFuse retains the information from visible and infrared samples and predominately performs in corresponding metrics (CE, MI, and SSIM). Naturally, the proposed method and NestFuse utilizing spatial weights have lackluster performance in joint entropy evaluation, where local infrared information is inevitably suppressed. However, the proposed strategy has advantages in gradient and edge (AG and EI). The compound algorithms (e.g., DDcGan and U2Fusion) obtain the fidelity of overlapped edge information reflected by Q AB / F . On the contrary, subjective edge features are blurred in the proposed method and replaced by the edge synthesized from the decoder. Simultaneously, the relatively moderate VA indirectly proves that the design process is reasonable. The proposed method preserves the high contrast with SSIM and SF, especially when the fusion results integrate without significant noise or spots.
Manually designed metrics provide subdivided perspectives to evaluate the fusion results. Compared with MI, Q TE reflects the transmission of sufficient information; i.e., the modified divergence measure avoids the superposition of repeated features. On this basis, although IFEVIP wastes the background features, the result is not entirely ineffective because of the valid transmission. The evaluation of Q TE is applicable to the proposed algorithm and DDcGan, where the learning and generation on the decoder are feasible. However, deep learning-based algorithms perform worse integrally than traditional fusion algorithms in the perceptual quality measure for image fusion ( Q CB , Q CV , and Q CV / B ). A plausible explanation for the difference is that the unsophisticated decomposition and transformation inconspicuously change the internal features in image pairs. The concatenation of convolution makes the output deviate from the original samples, although the network controls a similar structure with a low MSE. The proposed method had the third highest value in Q NCIE , which reflects the general relationship with multi-scale observation. Q Y and Q VIF represent the tendency and fidelity of fusion results. The proposed solution maintains the similarity of visible images and reduces the laterality between different features. The color distribution can indirectly explain the permeability, and the average Q C of visible samples was 5.493 . Regarding the noise error in CBF and GFCE, the proposed algorithm improves the color performance. The intermediate features from the infrared branch are partially integrated into the visible branch, and the fusion result preserves visible ingredients. The tendency leads to the loss of information, where the proposed method performs poorly in information-based metrics. However, the definition of images is improved with the self-attention mechanism and structural constraints. This fusion strategy indirectly improves the color restoration of the image, which is affected by the fog during landing. Different fusion strategies have particular advantages according to conventional and manually designed metrics, but the proposed method has better comprehensive performance than other algorithms.
Because landing is a dynamic process, the continuous changes of different metrics deserve attention. If the algorithm works appropriately, the changing trend under the same measure is similar in theory, which provides an additional reference for measuring stability and feasibility. The results of different metrics in the flight process are represented in Figure 9. According to CE, PSNR, RMSE, and Q C , GFCE and NestFuse have outlier features, which means that the confidence of imaging results is low. Additionally, the algorithm diversity introduced by PSNR, RMSE, and Q VIF is inconspicuous. The trend of CE demonstrates that the proposed method performs marginally in urban areas but ameliorates fusion near the landing runway. Even if the attention suppresses the infrared background feature, the ranking of the proposed algorithm is medium according to EN, where the background thermal radiation is adverse to the fusion result. The fluctuation of structural metrics (SSIM and Q Y ) can reflect the reliability; i.e., the algorithm consistent with the trend is feasible for visible structure. In the non-dominant metrics (MI, Q CB , and Q CV / B ), stability is guaranteed with the proposed method essentially. Regrettably, the edge information concerned in Q AB / F is incapable of being obtained with the proposed algorithm throughout the process. Moreover, the fluctuations reflected in Q Te and Q NCIE are noteworthy. The divergence in Q Te and the nonlinear correlation coefficient in Q NCIE are sensitive to high-frequency features and impulsive distribution. The reconstruction in general convolutional networks tends to be low-frequency, determined by the observation field, although the intermediate fusion strategy applies superposition or norm regularization. Instead, the attention mechanism and feature reorganization (with the channel attention) can forcibly supplement hidden textures to the decoding branch. The cost is that the fusion with nonlinear information entropy and fine-grained shows instability. Different algorithms have corresponding advantages for image fusion, and the practical strategies have trade-offs in metrics. Compared with other schemes, the proposed algorithm complies with the landing requirements, where the visible textures are enhanced, and the incomplete object information is reconstructed.

3.5. Implement Efficiency Evaluation

Because the productivity of the airborne processor is higher than the conventional edge device, and the data in the VRAM can be read, written, and executed in parallel, the operation efficiency of the algorithm limits the fusion delay. A video delay below 1 1.5 s is acceptable for flight safety, which expands the boundary of feasible algorithms. For a homography estimation with the convolutional network, the quantization and deployment can be implemented on FPGA while DSP performs the stabilization process. The software registration is processed after the acquisition and transmission for performance and stability reasons, which compromises real-time efficiency. The iterative optimization leads to the unstable running time of GTF, and the constant iteration is manually set to 5 . The backbone of DeepFuse is flexible, and the mobile neural architecture search (MNAS) network [55] is selected considering the efficiency in actual deployment. In the implementation, the time overhead of ViT and cascaded modules was ineluctable, and therefore the number of the transformer module ( l in Figure 4) was set to three, considering performance loss and operating efficiency.
The efficiency comparison results of different algorithms are summarized in Table 3. Images are parallelized on the airborne processor for acceleration. Because of the mature optimization scheme, the traditional SIFT and RANSAC can achieve the fastest running speed, especially with identifiable characteristics. In the case of a computationally similar structure, the efficiency of the YOLO scheme is higher than the proposed method. However, compared with the stability improvement and fusion stages, the cost of registration is acceptable. In offline testing, traditional methods and deep learning-based algorithms have different advantages. The choreographed decomposition and optimizer make MSVD, IFEVIP, and VSMWLS significantly improve efficiency. DeepFuse is unable to utilize the network model to reduce the computational complexity. On the contrary, the conventional transformation of the intermediate features without parallelization reduces the efficiency, even if the lightweight backbone is used for feature extraction. DenseFuse, NestFuse, and the proposed method compress the running time below 1 s in the network algorithms. In the deployment of the avionics system, IFEVIP and DenseFuse have the probability of satisfying the real-time FPS within a specific demonstration. The proposed method has optimization space but is limited by the manual modification of relevant operators in the transformer.

3.6. Mechanism Analysis

Intuitively, the mask or attention mechanism can alleviate the influence of infrared background information. As described in previous research [38], traditional CBAM cannot distinguish the pivotal information of compound scenes. Figure 10 shows the intermediate fusion steps with the attention mechanism, where NestFuse constructs the cross-attention module on spatial and channel attention models. The rollout technology generates the attention map from ViT and has relative distortion. In different scenarios, spatial attention in NestFuse is problematic in capturing information. Because the representation ability of the decoder is dominant, spatial attention tends to give balanced weights to maintain the fidelity of global information. Additionally, NestFuse suppresses the infrared edge, resulting in the insufficient edge information (AG and EI) of the fusion results, but VA increases with the direct superposition from the background.
Although the transformer reduces the fine-grained characterization with the segmentation of patches, the background information on the infrared branch is repressed after the up-sampling and convolution. The correlation of long-range information screens out the spline noise in infrared samples, while the runway level is significantly divided. However, the tendency of the training dataset makes the transformer highlight the object in accordance with human vision from a distant view (such as houses and highways). The decoder in the infrared branch is weakened because the final fusion exclusively uses intermediate feature maps, which alleviates the training convergence problem caused by background loss. Simultaneously, the imbalance in channel attention exists in different methods, where the proportion of feature maps containing fundamental texture details is limited. When the threshold is set to 0.5 (i.e., half of the visible features are deleted), the decoder can reconstruct the image compatible with natural human vision.
In the proposed model, the attention threshold θ affects the fusion result, and the adjustment changes the proportion of infrared components. Moreover, l for the attention module affects the running efficiency and observation granularity on the infrared branch. Figure 11 illustrates the fluctuation in metrics as the hyper-parameter changes. The threshold increase improves the infrared texture of the result and promotes SF performance. However, the excessive tendency to infrared images is unrelated to improving the information entropy. Instead, the infrared radiation background can reduce the clarity of visible images. The slight increase of SF indicates that the texture information in the infrared samples is concentrated in a few feature maps. The effective regulation interval of the threshold is 0.4 0.65 , which corresponds to the channel weight distribution in Figure 10. The layers of the transformer module are positively correlated with the runtime, while profound attention can promote SF. The infrared branch with high stacking layers can generate fine-grained mask features, but the performance improvement has marginal effects, and sacrificing running time in exchange for metrics improvement is limited. The layer advantage in the flight task ends at the eighth layer, and the stacking of modules can no further improve fine-grained metrics. Because of the image resolution, the shallow model is enough to provide appropriate intermediate features.

4. Discussion

The influence of weather on the experimental results is dominant. Because of the basin climate of the test field, fog and low visibility are unavoidable. In limited flight tests, complicated weather mainly results in the low imaging quality of the visible sensor. The automatic calibration is mismatched with inadequate information in visible images (e.g., anchors and corners). On the contrary, the FLIR sensor ensures the clarity of infrared features, and the boundary of the object is distinguished. In addition, nighttime landings obscure the proposed framework, where the visible features are insufficient to participate in the fusion. The direct reason is the disability of visible sensors, and the image sample can only capture the auxiliary lights of the runway.
Another problem is that the proposed deep homography estimation is based on rigid transformation and ignores non-rigid lens distortion and non-planar objects. As shown in Figure 8, the runway is calibrated and enhanced by registration and fusion, but the ghosts caused by distortion exist in the synthetic buildings. GTF with the matching tolerant cannot eliminate the effects of radiation field and distortion at the same time. Instead, the priority mechanism in U2Fusion mitigates the impact of non-critical information. The proposed algorithm maintains the visible texture with the self-attention mechanism. Therefore, the enhancement method depends on weather conditions and error tolerance.
For early test systems, the proposed scheme can complete the flight experiment and verify the effectiveness of deep learning algorithms with low instrument costs. In future work, the stability and applicability of the proposed framework need to be further extended. The first is acquiring registered images with an unbiased sensor group. Real-time registration is transformed into replaceable items to avoid instability in flight. The second is to establish the dehazing and night vision of the enhancement scheme. At the same time, the speed of online inference can be further improved, where the network backbone has the potential for streamlining.

5. Conclusions

In this study, an integral flight vision enhancement scheme is designed, in which calibration and fusion methods for infrared and visible images are deployed based on deep learning algorithms. The hardware calibration and homography optimization lay the foundation for the fusion and overcome the complexity of manual annotation. The strategy based on feature embedding and the self-attention mechanism is introduced to solve radiation dispersion and background ambiguity from flight fusion. The comparative experiments are executed on the independent flight test platform. In general, the proposed method complies with the requirements of aviation enhancement with reasonable overhead and efficiency.

Author Contributions

Conceptualization, X.G.; methodology, X.G.; software, X.G.; validation, X.G. and Q.Z.; formal analysis, X.G.; investigation, Y.W.; resources, Y.W.; data curation, Y.W.; writing—original draft preparation, X.G.; writing—review and editing, X.G. and Y.S.; visualization, X.G.; supervision, Q.F. and Y.W.; project administration, Q.F. and Y.W.; funding acquisition, Y.W. All authors have read and agreed to the published version of the manuscript.

Funding

This work is funded by the National Key R&D Program of China (2021YFF0603904), the National Natural Science Foundation of China (U2033213), and the Sichuan Science and Technology Program (2021YFS0319).

Data Availability Statement

The data used to support the findings of this study are available from the corresponding author upon request.

Acknowledgments

The authors would like to acknowledge Yiduo Guo and Kai Du for their comments on improving the algorithm.

Conflicts of Interest

The authors declare no conflict of interest.

Appendix A

Figure A1 complements low-quality imaging results. The imaging from GFCE and CBF has overexposure and light spots, respectively. FPDE reduces the imaging resolution, and DenseFuse can replace DualFuse.
Figure A1. Controversial fusion results.
Remotesensing 14 02789 g0a1

References

  1. Kramer, L.J.; Etherington, T.J.; Severance, K.; Bailey, R.E.; Williams, S.P.; Harrison, S.J. Assessing Dual-Sensor Enhanced Flight Vision Systems to Enable Equivalent Visual Operations. J. Aerosp. Inf. Syst. 2017, 14, 533–550. [Google Scholar] [CrossRef]
  2. Fadhil, A.F.; Kanneganti, R.; Gupta, L.; Eberle, H.; Vaidyanathan, R. Fusion of Enhanced and Synthetic Vision System Images for Runway and Horizon Detection. Sensors 2019, 19, 3802. [Google Scholar] [CrossRef] [PubMed] [Green Version]
  3. Cross, J.; Schneider, J.; Cariani, P. MMW radar enhanced vision systems: The Helicopter Autonomous Landing System (HALS) and Radar-Enhanced Vision System (REVS) are rotary and fixed wing enhanced flight vision systems that enable safe flight operations in degraded visual environments. In Proceedings of the Degraded Visual Environments: Enhanced, Synthetic, and External Vision Solutions 2013, Baltimore, MA, USA, 1 May 2013; p. 87370G. [Google Scholar] [CrossRef]
  4. Shelton, K.J.; Kramer, L.J.; Ellis, K.; Rehfeld, S.A. Synthetic and Enhanced Vision Systems (SEVS) for NextGen simulation and flight test performance evaluation. In Proceedings of the 2012 IEEE/AIAA 31st Digital Avionics Systems Conference (DASC), Williamsburg, VA, USA, 14–18 October 2012; pp. 2D5-1–2D5-12. [Google Scholar] [CrossRef] [Green Version]
  5. Goshi, D.S.; Rhoads, C.; McKitterick, J.; Case, T. Millimeter wave imaging for fixed wing zero visibility landing. In Proceedings of the Passive and Active Millimeter-Wave Imaging XXII, Baltimore, MA, USA, 13 May 2019; p. 1099404. [Google Scholar] [CrossRef]
  6. Iradukunda, K.; Averyanova, Y. Cfit Prevention with Combined Enhanced Flight Vision System and Synthetic Vision System. Adv. Aerosp. Technol. 2021, 87, 12–17. [Google Scholar] [CrossRef]
  7. Cheng, Y.; Li, Y.; Han, W.; Liu, Z.; Yu, G. Infrared Image Enhancement by Multi-Modal Sensor Fusion in Enhanced Synthetic Vision System. J. Phys. Conf. Ser. 2020, 1518, 012048. [Google Scholar] [CrossRef]
  8. Zhang, L.; Zhai, Z.; Niu, W.; Wen, P.; He, L. Visual–inertial fusion-based registration between real and synthetic images in airborne combined vision system. Int. J. Adv. Robot. Syst. 2019, 16, 1729881419845528. [Google Scholar] [CrossRef] [Green Version]
  9. Zhang, X.; Ye, P.; Leung, H.; Gong, K.; Xiao, G. Object fusion tracking based on visible and infrared images: A comprehensive review. Inf. Fusion 2020, 63, 166–187. [Google Scholar] [CrossRef]
  10. Ma, J.; Ma, Y.; Li, C. Infrared and visible image fusion methods and applications: A survey. Inf. Fusion 2019, 45, 153–178. [Google Scholar] [CrossRef]
  11. Ma, J.; Chen, C.; Li, C.; Huang, J. Infrared and visible image fusion via gradient transfer and total variation minimization. Inf. Fusion 2016, 31, 100–109. [Google Scholar] [CrossRef]
  12. Zhang, Y.; Zhang, L.; Bai, X.; Zhang, L. Infrared and visual image fusion through infrared feature extraction and visual information preservation. Infrared Phys. Technol. 2017, 83, 227–237. [Google Scholar] [CrossRef]
  13. Liu, Y.; Chen, X.; Wang, Z.; Wang, Z.J.; Ward, R.K.; Wang, X. Deep learning for pixel-level image fusion: Recent advances and future prospects. Inf. Fusion 2018, 42, 158–173. [Google Scholar] [CrossRef]
  14. Liu, Y.; Chen, X.; Cheng, J.; Peng, H.; Wang, Z. Infrared and visible image fusion with convolutional neural networks. Int. J. Wavelets Multiresolut. Inf. Process. 2018, 16, 1850018. [Google Scholar] [CrossRef]
  15. Li, W.; Cao, D.; Peng, Y.; Yang, C. MSNet: A Multi-Stream Fusion Network for Remote Sensing Spatiotemporal Fusion Based on Transformer and Convolution. Remote Sens. 2021, 13, 3724. [Google Scholar] [CrossRef]
  16. Li, H.; Wu, X.J. DenseFuse: A Fusion Approach to Infrared and Visible Images. IEEE Trans. Image Process. 2019, 28, 2614–2623. [Google Scholar] [CrossRef] [PubMed] [Green Version]
  17. Xu, H.; Ma, J.; Jiang, J.; Guo, X.; Ling, H. U2Fusion: A Unified Unsupervised Image Fusion Network. IEEE Trans. Pattern Anal. Mach. Intell. 2022, 44, 502–518. [Google Scholar] [CrossRef]
  18. Jia, X.; Zhu, C.; Li, M.; Tang, W.; Zhou, W. LLVIP: A Visible-infrared Paired Dataset for Low-light Vision. In Proceedings of the 2021 IEEE/CVF International Conference on Computer Vision Workshops (ICCVW), Montreal, BC, Canada, 11–17 October 2021; pp. 3489–3497. [Google Scholar] [CrossRef]
  19. Lebedev, M.A.; Stepaniants, D.G.; Komarov, D.V.; Vygolov, O.V.; Vizilter, Y.V.; Zheltov, S.Y. A real-time photogrammetric algorithm for sensor and synthetic image fusion with application to aviation combined vision. ISPRS Int. Arch. Photogramm. Remote Sens. Spat. Inf. Sci. 2014, XL-3, 171–175. [Google Scholar] [CrossRef] [Green Version]
  20. Lowe, D.G. Distinctive Image Features from Scale-Invariant Keypoints. Int. J. Comput. Vis. 2004, 60, 91–110. [Google Scholar] [CrossRef]
  21. Bay, H.; Tuytelaars, T.; Van Gool, L. SURF: Speeded Up Robust Features. In Proceedings of the European Conference on Computer Vision, Berlin, Heidelberg, 7–13 May 2006; pp. 404–417. [Google Scholar] [CrossRef]
  22. Rublee, E.; Rabaud, V.; Konolige, K.; Bradski, G. ORB: An efficient alternative to SIFT or SURF. In Proceedings of the 2011 International Conference on Computer Vision, Barcelona, Spain, 6–13 November 2011; pp. 2564–2571. [Google Scholar] [CrossRef]
  23. Fischler, M.A.; Bolles, R.C. Random sample consensus: A paradigm for model fitting with applications to image analysis and automated cartography. Commun. ACM 1981, 24, 381–395. [Google Scholar] [CrossRef]
  24. Tustison, N.J.; Avants, B.B.; Gee, J.C. Learning image-based spatial transformations via convolutional neural networks: A review. Magn. Reson. Imaging 2019, 64, 142–153. [Google Scholar] [CrossRef]
  25. Chang, C.H.; Chou, C.N.; Chang, E.Y. CLKN: Cascaded Lucas-Kanade Networks for Image Alignment. In Proceedings of the 2017 IEEE Conference on Computer Vision and Pattern Recognition (CVPR), Honolulu, HI, USA, 21–26 July 2017; pp. 3777–3785. [Google Scholar] [CrossRef]
  26. Nguyen, T.; Chen, S.W.; Shivakumar, S.S.; Taylor, C.J.; Kumar, V. Unsupervised Deep Homography: A Fast and Robust Homography Estimation Model. IEEE Robot. Autom. Lett. 2018, 3, 2346–2353. [Google Scholar] [CrossRef] [Green Version]
  27. Zhao, Q.; Ma, Y.; Zhu, C.; Yao, C.; Feng, B.; Dai, F. Image stitching via deep homography estimation. Neurocomputing 2021, 450, 219–229. [Google Scholar] [CrossRef]
  28. Zhang, X.; Ye, P.; Xiao, G. VIFB: A Visible and Infrared Image Fusion Benchmark. In Proceedings of the 2020 IEEE/CVF Conference on Computer Vision and Pattern Recognition Workshops (CVPRW), Seattle, WA, USA, 14–19 June 2020; pp. 468–478. [Google Scholar] [CrossRef]
  29. Malini, S.; Moni, R.S. Image Denoising Using Multiresolution Singular Value Decomposition Transform. Procedia Comput. Sci. 2015, 46, 1708–1715. [Google Scholar] [CrossRef] [Green Version]
  30. Shreyamsha Kumar, B.K. Image fusion based on pixel significance using cross bilateral filter. Signal Image Video Process. 2015, 9, 1193–1204. [Google Scholar] [CrossRef]
  31. Bavirisetti, D.P.; Dhuli, R. Fusion of Infrared and Visible Sensor Images Based on Anisotropic Diffusion and Karhunen-Loeve Transform. IEEE Sens. J. 2016, 16, 203–209. [Google Scholar] [CrossRef]
  32. Zhou, Z.; Dong, M.; Xie, X.; Gao, Z. Fusion of infrared and visible images for night-vision context enhancement. Appl. Opt. 2016, 55, 6480–6490. [Google Scholar] [CrossRef]
  33. Bavirisetti, D.P.; Dhuli, R. Two-scale image fusion of visible and infrared images using saliency detection. Infrared Phys. Technol. 2016, 76, 52–64. [Google Scholar] [CrossRef]
  34. Bavirisetti, D.P.; Xiao, G.; Zhao, J.; Dhuli, R.; Liu, G. Multi-scale Guided Image and Video Fusion: A Fast and Efficient Approach. Circuits Syst. Signal Process. 2019, 38, 5576–5605. [Google Scholar] [CrossRef]
  35. Bavirisetti, D.P.; Xiao, G.; Liu, G. Multi-sensor image fusion based on fourth order partial differential equations. In Proceedings of the 20th International Conference on Information Fusion (Fusion), Xi’an, China, 10–13 July 2017; pp. 1–9. [Google Scholar] [CrossRef]
  36. Ma, J.; Zhou, Z.; Wang, B.; Zong, H. Infrared and visible image fusion based on visual saliency map and weighted least square optimization. Infrared Phys. Technol. 2017, 82, 8–17. [Google Scholar] [CrossRef]
  37. Li, H.; Wu, X.J.; Durrani, T. NestFuse: An Infrared and Visible Image Fusion Architecture Based on Nest Connection and Spatial/Channel Attention Models. IEEE Trans. Instrum. Meas. 2020, 69, 9645–9656. [Google Scholar] [CrossRef]
  38. Ma, J.; Tang, L.; Xu, M.; Zhang, H.; Xiao, G. STDFusionNet: An Infrared and Visible Image Fusion Network Based on Salient Target Detection. IEEE Trans. Instrum. Meas. 2021, 70, 1–13. [Google Scholar] [CrossRef]
  39. Fu, Y.; Wu, X.J. A Dual-Branch Network for Infrared and Visible Image Fusion. In Proceedings of the 2020 25th International Conference on Pattern Recognition (ICPR), Milan, Italy, 10–15 January 2021; pp. 10675–10680. [Google Scholar] [CrossRef]
  40. Ma, J.; Yu, W.; Liang, P.; Li, C.; Jiang, J. FusionGAN: A generative adversarial network for infrared and visible image fusion. Inf. Fusion 2019, 48, 11–26. [Google Scholar] [CrossRef]
  41. Ma, J.; Xu, H.; Jiang, J.; Mei, X.; Zhang, X.P. DDcGAN: A Dual-Discriminator Conditional Generative Adversarial Network for Multi-Resolution Image Fusion. IEEE Trans. Image Process. 2020, 29, 4980–4995. [Google Scholar] [CrossRef] [PubMed]
  42. Li, H.; Wu, X.; Kittler, J. Infrared and Visible Image Fusion using a Deep Learning Framework. In Proceedings of the 2018 24th International Conference on Pattern Recognition (ICPR), Beijing, China, 20–24 August 2018; pp. 2705–2710. [Google Scholar] [CrossRef] [Green Version]
  43. Yang, T.; Li, G.; Li, J.; Zhang, Y.; Zhang, X.; Zhang, Z.; Li, Z. A Ground-Based Near Infrared Camera Array System for UAV Auto-Landing in GPS-Denied Environment. Sensors 2016, 16, 1393. [Google Scholar] [CrossRef] [PubMed] [Green Version]
  44. Abdel-Aziz, Y.I.; Karara, H.M.; Hauck, M. Direct Linear Transformation from Comparator Coordinates into Object Space Coordinates in Close-Range Photogrammetry. Photogramm. Eng. Remote Sens. 2015, 81, 103–107. [Google Scholar] [CrossRef]
  45. Woo, S.; Park, J.; Lee, J.-Y.; Kweon, I.S. CBAM: Convolutional Block Attention Module. In Proceedings of the European Conference on Computer Vision (ECCV), Munich, Germany, 8–14 September 2018; pp. 3–19. [Google Scholar] [CrossRef] [Green Version]
  46. Dosovitskiy, A.; Beyer, L.; Kolesnikov, A.; Weissenborn, D.; Zhai, X.; Unterthiner, T.; Dehghani, M.; Minderer, M.; Heigold, G.; Gelly, S. An image is worth 16x16 words: Transformers for image recognition at scale. arXiv 2020. [Google Scholar] [CrossRef]
  47. Zhou, W.; Bovik, A.C.; Sheikh, H.R.; Simoncelli, E.P. Image quality assessment: From error visibility to structural similarity. IEEE Trans. Image Process. 2004, 13, 600–612. [Google Scholar] [CrossRef] [Green Version]
  48. Cvejic, N.; Canagarajah, C.N.; Bull, D.R. Image fusion metric based on mutual information and Tsallis entropy. Electron. Lett. 2006, 42, 626–627. [Google Scholar] [CrossRef]
  49. Chen, Y.; Blum, R.S. A new automated quality assessment algorithm for image fusion. Image Vis. Comput. 2009, 27, 1421–1432. [Google Scholar] [CrossRef]
  50. Chen, H.; Varshney, P.K. A human perception inspired quality metric for image fusion based on regional information. Inf. Fusion 2007, 8, 193–207. [Google Scholar] [CrossRef]
  51. Wang, Q.; Shen, Y.; Zhang, J.Q. A nonlinear correlation measure for multivariable data set. Phys. D Nonlinear Phenom. 2005, 200, 287–295. [Google Scholar] [CrossRef]
  52. Shanshan, L.; Richang, H.; Xiuqing, W. A novel similarity based quality metric for image fusion. In Proceedings of the International Conference on Audio, Language and Image Processing, Shanghai, China, 7–9 July 2008; pp. 167–172. [Google Scholar] [CrossRef]
  53. Sheikh, H.R.; Bovik, A.C. Image information and visual quality. IEEE Trans. Image Process. 2006, 15, 430–444. [Google Scholar] [CrossRef]
  54. Hasler, D.; Suesstrunk, S.E. Measuring colorfulness in natural images. In Proceedings of the Human Vision and Electronic Imaging VIII, Santa Clara, CA, USA, 17 June 2003; pp. 87–95. [Google Scholar] [CrossRef] [Green Version]
  55. Tan, M.; Chen, B.; Pang, R.; Vasudevan, V.; Sandler, M.; Howard, A.; Le, Q.V. MnasNet: Platform-Aware Neural Architecture Search for Mobile. In Proceedings of the 2019 IEEE/CVF Conference on Computer Vision and Pattern Recognition (CVPR), Long Beach, CA, USA, 15–20 June 2019; pp. 2815–2823. [Google Scholar] [CrossRef] [Green Version]
Figure 1. Diagram of the flight deck with visual instruments (The module location and quantity are not fixed in actual systems, and the figure on the lower left corner shows the installation on Gulfstream G450).
Remotesensing 14 02789 g001
Figure 2. Experimental results of existing fast algorithms and landing composition diagram.
Remotesensing 14 02789 g002
Figure 3. Graphic of flight stages and deep homography estimation (The calibration process is mainly implemented on the ground and before landing).
Remotesensing 14 02789 g003
Figure 4. Proposed fusion framework (CA: channel attention; h: height; w: weight; c: channel).
Remotesensing 14 02789 g004
Figure 5. Flight test platform and interaction diagram.
Remotesensing 14 02789 g005
Figure 6. Registration results. (a) Registration in different stages; (b) real-time estimation errors.
Remotesensing 14 02789 g006
Figure 7. Qualitative fusion results of different algorithms.
Remotesensing 14 02789 g007
Figure 8. Comparison of fusion details.
Remotesensing 14 02789 g008
Figure 9. Dynamic changing trends with different metrics (the horizontal axis represents the image frame).
Remotesensing 14 02789 g009
Figure 10. Comparison of attention mechanisms (NestFuse and the proposed fusion; the histogram represents the channel weight of the visible branch with the corresponding input pair).
Remotesensing 14 02789 g010
Figure 11. Ablation on the threshold and transformer ( Q Y →1/0: result tends to the visible/infrared sample; the default runtime unit is seconds). (a) Propensity performance. (b) Efficiency performance.
Remotesensing 14 02789 g011
Table 1. Summary of fusion algorithms.
MethodCategoryRGB 1REG 2Device
MSVDSingular Value × CPU/GPU
CBFFilter and Weight × × CPU
ADFKarhunen–Loeve × CPU
GFCEFilter and Weight × CPU
TIFFilter and Weight × CPU
IFEVIPQuadtree × CPU
MGFFFilter and Saliency × CPU
FPDEManual Feature × CPU/FPGA
GTF 1 -TV CPU
VSMWLSLS and Saliency × CPU
DenseFuseDense Block × GPU
NestFuseNest Connection × GPU
DualFuseDual-branch × × GPU
DDcGanAdversarial Game GPU
U2FusionPre-trained Model × GPU
DeepFusePre-trained Model CPU/GPU
1  : RGB; × : Gray Scale; : RGB in theory, only Gray Scale can be adopted. 2  : Misregistration is acceptable; × : Image pairs must be registered.
Table 2. Quantitative comparisons of fusion methods.
Method CE ( )   2 EN ( + ) MI ( + ) PSNR ( + ) SSIM ( + ) RMSE ( ) AG ( + ) Q AB / F ( + ) EI ( + ) VA ( + ) SF ( + ) Q TE ( + ) Q CB ( + ) Q CV ( ) Q CV / B ( ) Q NCIE ( + ) Q Y ( 0.5 ) Q VIF ( + ) Q c ( + )
MSVD0.9116.2300.49761.4311.8140.0430.9840.33910.50225.0674.4111.7530.3751561.8420.3710.8050.5760.4633.205
ADF0.8216.2310.49461.4431.8160.0440.9950.36210.72725.0833.7531.7510.3841571.3920.3790.8050.5840.4973.270
CBF0.6436.6780.38260.7121.2460.055-0.445-29.83210.4810.9800.3762692.5380.3780.8030.3480.09913.511
GFCE3.597-0.43557.1431.4570.1262.8190.39430.601-9.7571.5500.4864430.8110.4790.8040.5390.2126.633
TIF1.3226.4640.43561.3261.7690.0481.5740.49016.98428.8166.0451.5230.4951187.9340.4920.8040.6330.2823.554
IFEVIP1.2606.8720.41359.7201.6800.0701.7250.44018.90837.666.2012.5470.439842.1880.4260.8100.7100.2394.384
MGFF1.4616.5090.41461.2871.7600.0481.6900.44118.429.8926.0111.4340.5092252.8510.5090.8040.6540.2634.123
FPDE0.8706.2530.49461.4261.8010.0461.1000.36711.85225.1444.2691.7000.3801561.0040.3740.8050.5750.4923.368
GTF 10.8936.3160.46961.1211.7590.0501.2020.37912.9223.0354.399-0.4684520.7890.4710.8160.6580.151-
VSMWLS1.1006.6510.45061.1971.7710.0491.6210.46617.60133.2535.0401.7190.5064027.630.5070.8050.6710.4653.469
DenseFuse0.6976.2210.49961.4331.8170.0470.9450.34710.29724.9907.5231.7680.3941593.6960.3910.8050.5810.4593.227
NestFuse2.4737.2080.43158.0381.6380.1051.5830.47117.14750.5618.118-0.386576.6140.3980.8080.6780.316-
DualFuse0.7396.190.50561.4271.8190.0470.9500.35610.32124.6263.654-0.3831710.180.3890.8050.5840.453-
DDcGan0.7027.0070.41660.7931.7490.0541.6080.51417.40643.3316.1542.0510.4862216.0640.4830.8070.6700.3165.004
U2Fusion1.0707.0260.41560.5051.7450.0581.7000.50118.39141.8526.5791.9110.4532736.1030.4430.8060.6590.3625.015
DeepFuse0.9316.2300.48761.4321.8240.0471.0160.41410.97025.0834.0021.7680.4041617.5840.3920.8050.6560.2604.401
Proposed1.2537.1950.47561.4381.8410.0622.5450.33727.41839.19915.1302.3700.4212094.5800.4110.8090.5350.46611.341
1 The fusion result of the algorithm is a gray image. 2 Red: the best; Blue: the second best; Yellow: the third best; (+): a higher value is better; (−): a lower value is better; (0:5) a value close to 0.5 is better.
Table 3. Efficiency comparison of registration and fusion.
Method/Runtime
SIFT + RANSAC0.008 ± 0.002
YOLO0.023
Proposed (H) 10.092
MSVD0.443MGFF1.485DenseFuse0.621
ADF1.231FPDE4.299NestFuse0.732
CBF22.297GTF8.914DualFuse1.521
GFCE3.342VSMWLS0.662DDcGan1.043
TIF1.297DeepFuse (Base)11.508U2Fusion1.415
IFEVIP0.126DeepFuse (Tiny)9.782Proposed (F)0.998
Method/Inference FPS
IFEVIP23~24
DenseFuse19~22
Proposed16~20
1 (H) is homography estimation, and (F) is fusion.
Publisher’s Note: MDPI stays neutral with regard to jurisdictional claims in published maps and institutional affiliations.

