Correction: Marchese et al. Mt. Etna Paroxysms of February–April 2021 Monitored and Quantified through a Multi-Platform Satellite Observing System. Remote Sens. 2021, 13, 3074
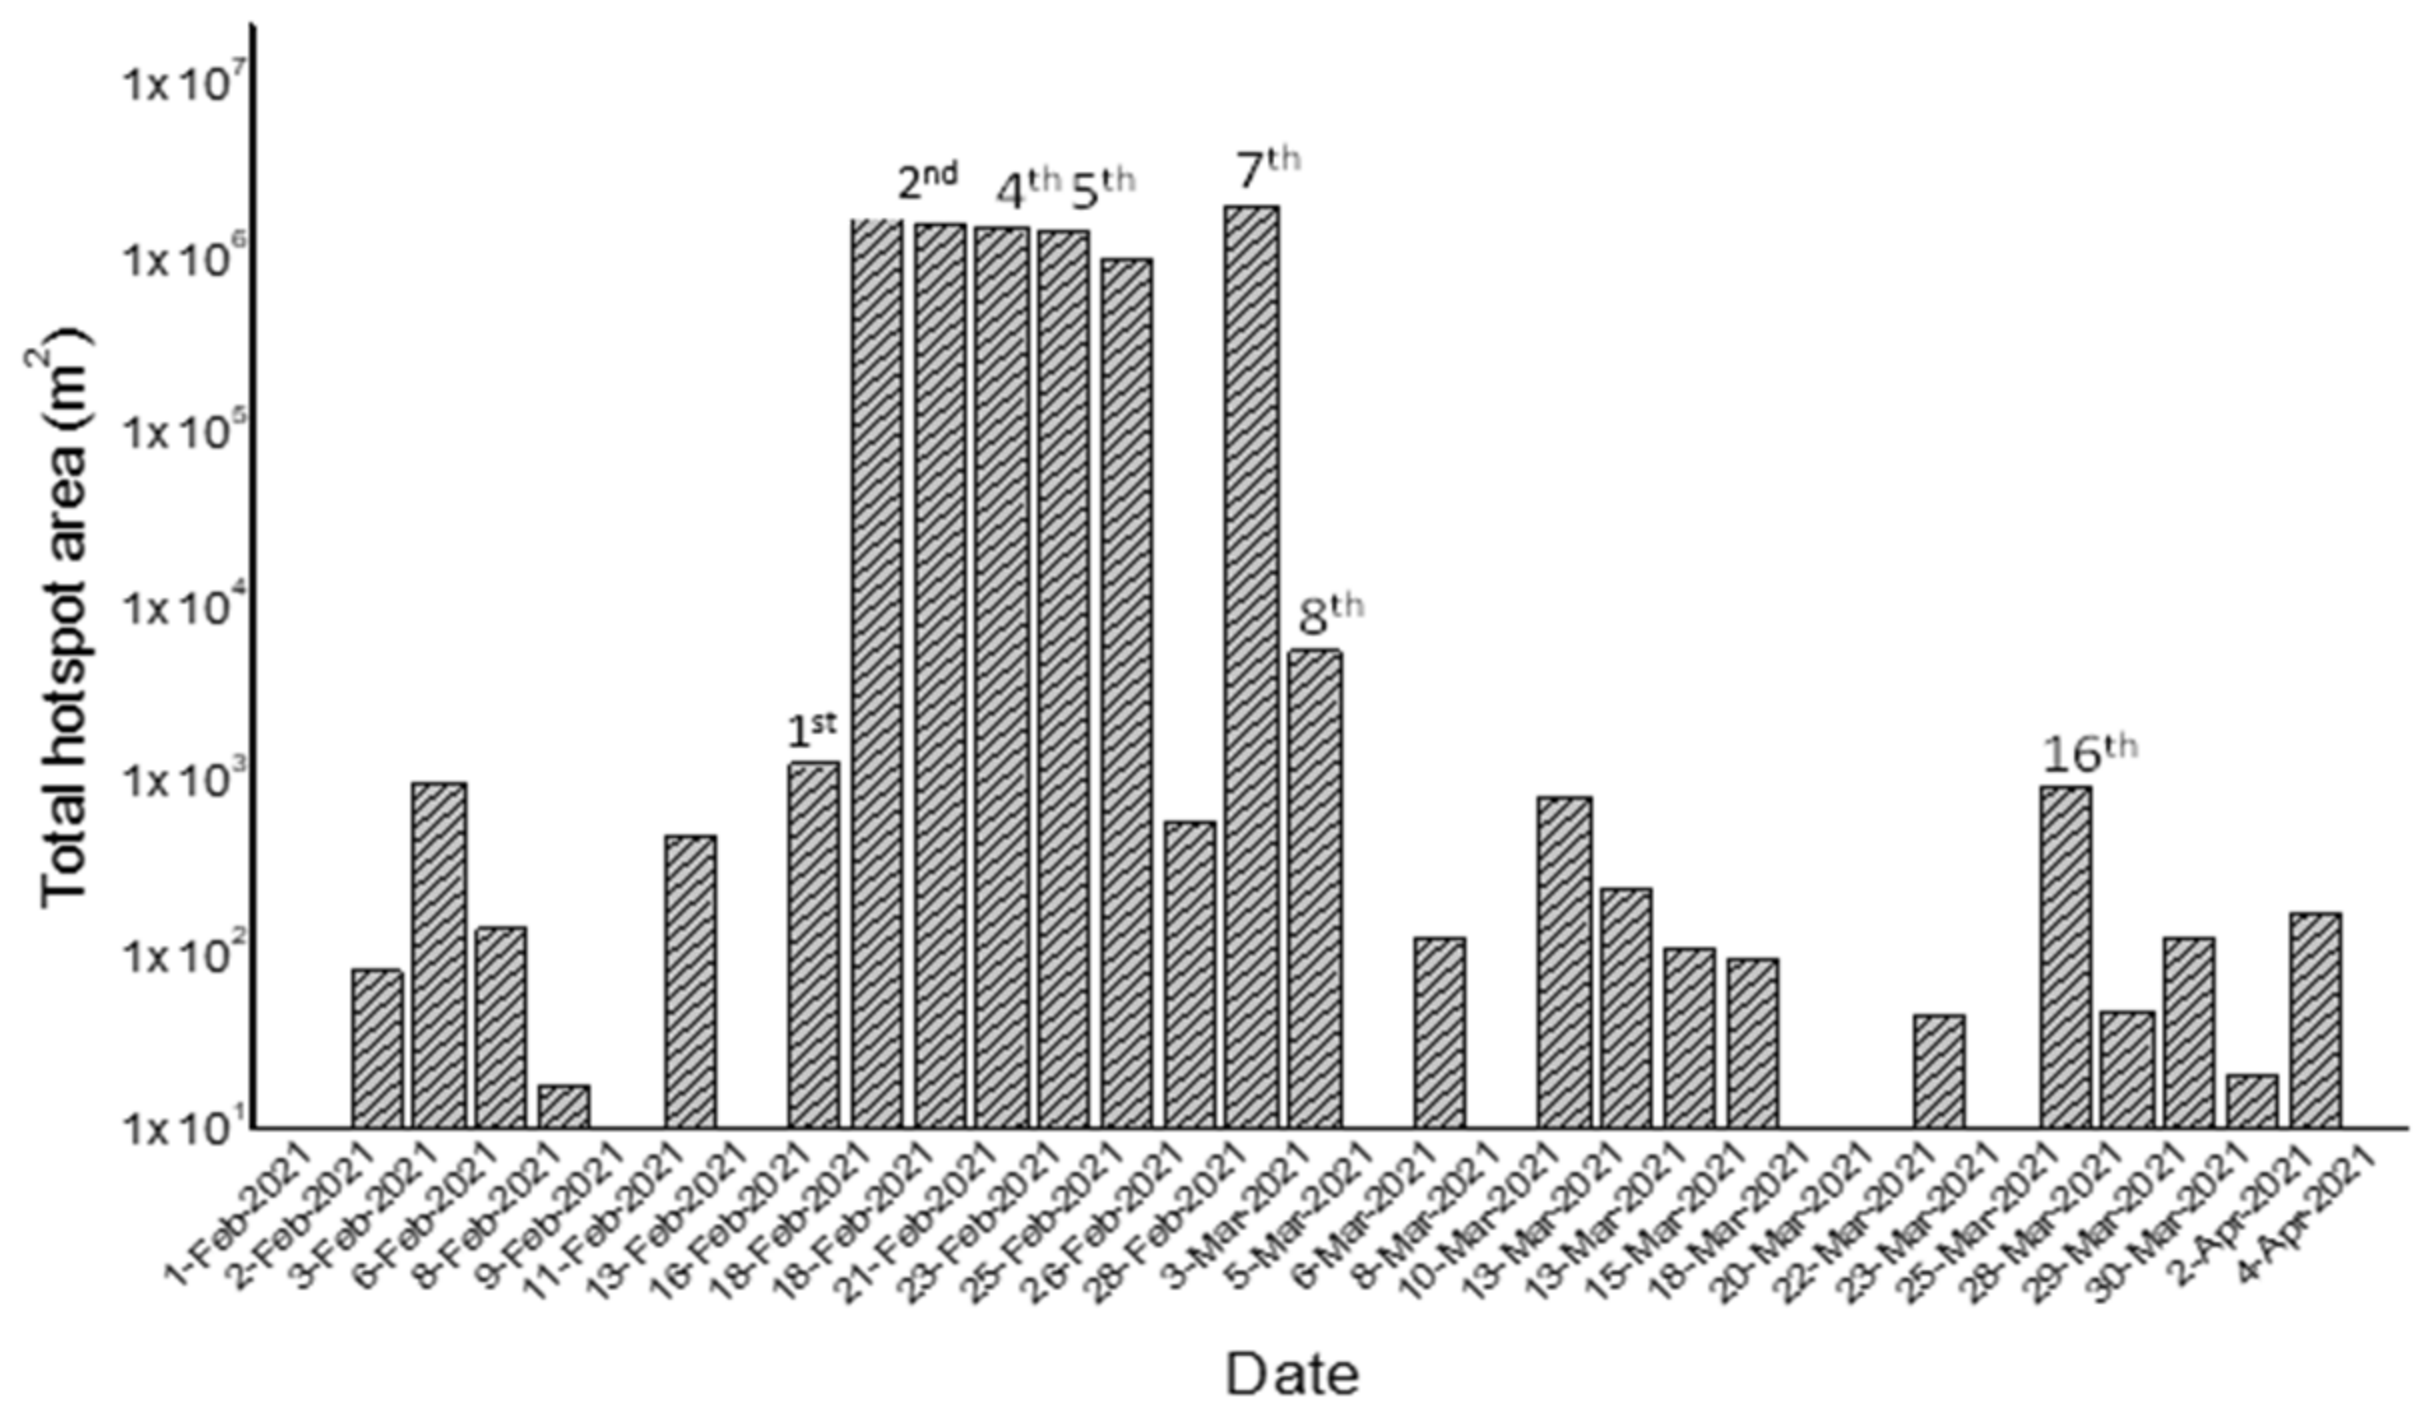
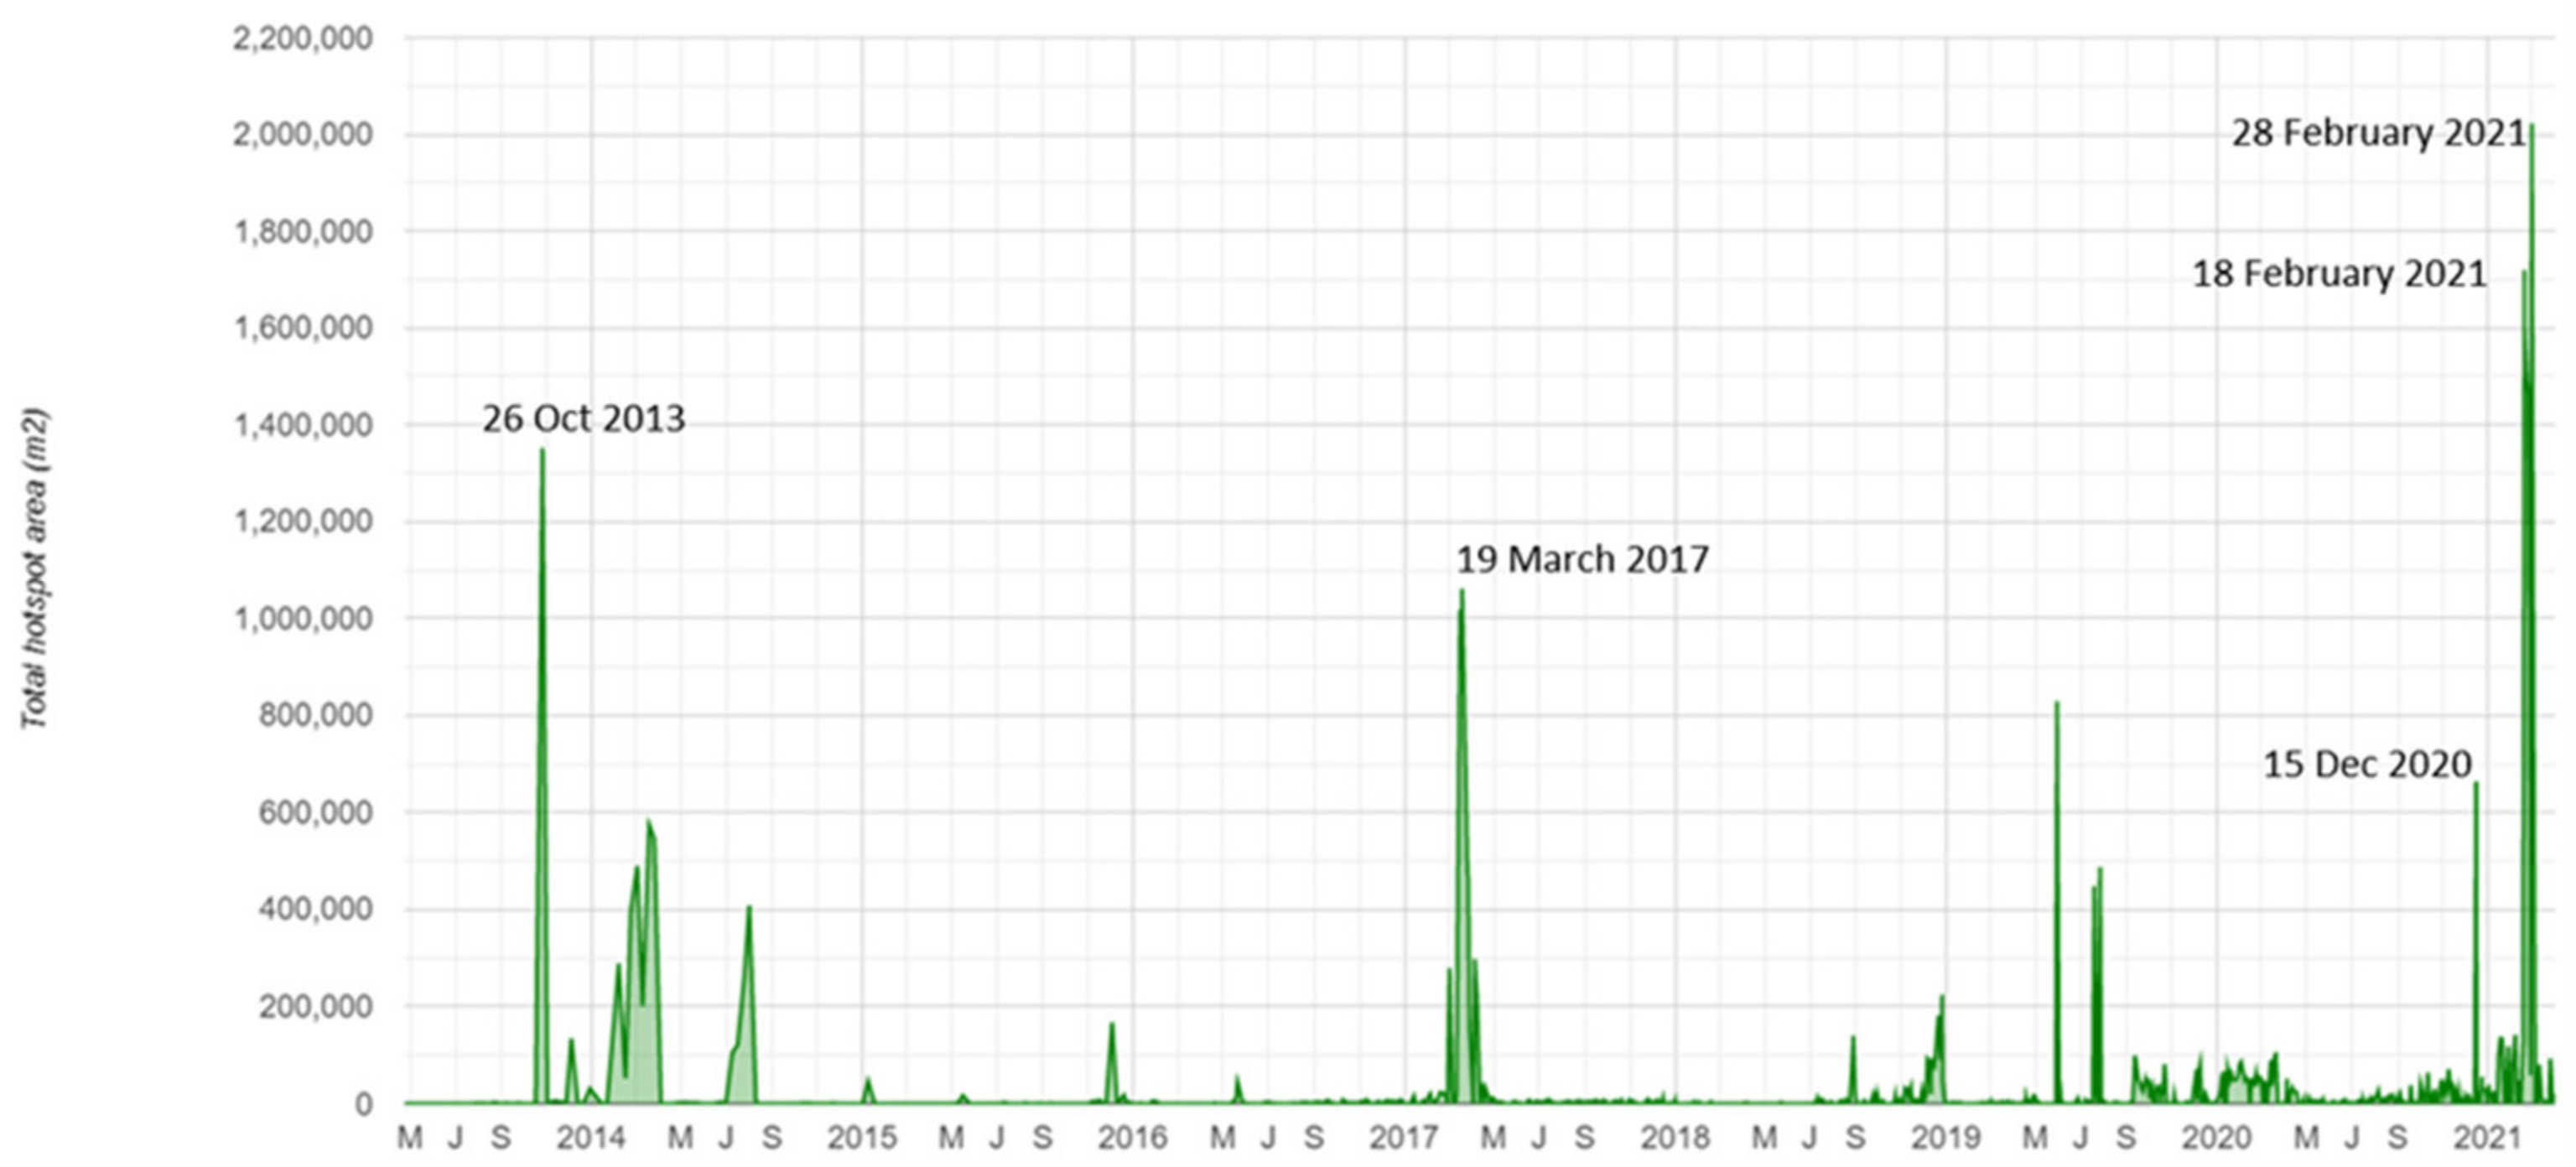
1. Error in Figures


2. Text Correction
2.1. Correction in Section ‘Abstract’
“…Results retrieved from Advanced Very High Resolution Radiometer (AVHRR), Moderate Resolution Imaging Spectroradiometer (MODIS), starting from outputs of the Robust Satellite Techniques for Volcanoes (RSTVOLC), indicate that the 17th paroxysm (31 March–1 April) was the most intense in terms of radiative power, with values estimated around 14 GW…”
“…according to the Normalized Hotspot Indices (NHI) tool, the 2nd (17–18 February) and 7th (28 February) paroxysm generated the largest thermal anomaly at Mt. Etna after April 2013, when Landsat-8 OLI data became available…”
2.2. Correction in Section ‘Discussion’
“…Therefore, by combining information from MODIS (Figure 5) and SEVIRI (Figure 9) data, we can assert that the 17th paroxysm was among the most significant events and probably radiated the largest amount of energy…”
2.3. Correction in Section ‘Conclusions’
“…The latter indicates that the 17th paroxysm, leading to values of radiative power up to about 14 GW from MODIS data (e.g., we retrieved VRP values up to 4 GW during the paroxysms of May 2016 [17]), was probably the most energetic of the time series as indicated by SEVIRI…”
“…Additionally, based on the information retrieved from L8-OLI and S2-MSI data, the 2nd and 7th paroxysm generated the largest thermal anomaly at Mt. Etna after 26 October 2013…”
Reference
- Marchese, F.; Filizzola, C.; Lacava, T.; Falconieri, A.; Faruolo, M.; Genzano, N.; Mazzeo, G.; Pietrapertosa, C.; Pergola, N.; Tramutoli, V.; et al. Mt. Etna Paroxysms of February–April 2021 Monitored and Quantified through a Multi-Platform Satellite Observing System. Remote Sens. 2021, 13, 3074. [Google Scholar] [CrossRef]
Publisher’s Note: MDPI stays neutral with regard to jurisdictional claims in published maps and institutional affiliations. |
© 2022 by the authors. Licensee MDPI, Basel, Switzerland. This article is an open access article distributed under the terms and conditions of the Creative Commons Attribution (CC BY) license (https://creativecommons.org/licenses/by/4.0/).
Share and Cite
Marchese, F.; Filizzola, C.; Lacava, T.; Falconieri, A.; Faruolo, M.; Genzano, N.; Mazzeo, G.; Pietrapertosa, C.; Pergola, N.; Tramutoli, V.; et al. Correction: Marchese et al. Mt. Etna Paroxysms of February–April 2021 Monitored and Quantified through a Multi-Platform Satellite Observing System. Remote Sens. 2021, 13, 3074. Remote Sens. 2022, 14, 2746. https://doi.org/10.3390/rs14122746
Marchese F, Filizzola C, Lacava T, Falconieri A, Faruolo M, Genzano N, Mazzeo G, Pietrapertosa C, Pergola N, Tramutoli V, et al. Correction: Marchese et al. Mt. Etna Paroxysms of February–April 2021 Monitored and Quantified through a Multi-Platform Satellite Observing System. Remote Sens. 2021, 13, 3074. Remote Sensing. 2022; 14(12):2746. https://doi.org/10.3390/rs14122746
Chicago/Turabian StyleMarchese, Francesco, Carolina Filizzola, Teodosio Lacava, Alfredo Falconieri, Mariapia Faruolo, Nicola Genzano, Giuseppe Mazzeo, Carla Pietrapertosa, Nicola Pergola, Valerio Tramutoli, and et al. 2022. "Correction: Marchese et al. Mt. Etna Paroxysms of February–April 2021 Monitored and Quantified through a Multi-Platform Satellite Observing System. Remote Sens. 2021, 13, 3074" Remote Sensing 14, no. 12: 2746. https://doi.org/10.3390/rs14122746
APA StyleMarchese, F., Filizzola, C., Lacava, T., Falconieri, A., Faruolo, M., Genzano, N., Mazzeo, G., Pietrapertosa, C., Pergola, N., Tramutoli, V., & Neri, M. (2022). Correction: Marchese et al. Mt. Etna Paroxysms of February–April 2021 Monitored and Quantified through a Multi-Platform Satellite Observing System. Remote Sens. 2021, 13, 3074. Remote Sensing, 14(12), 2746. https://doi.org/10.3390/rs14122746


