Next Article in Journal
Evaluation of GRACE/GRACE Follow-On Time-Variable Gravity Field Models for Earthquake Detection above Mw8.0s in Spectral Domain
Next Article in Special Issue
A Model for Expressing Industrial Information Based on Object-Oriented Industrial Heat Sources Detected Using Multi-Source Thermal Anomaly Data in China
Previous Article in Journal
Comparison of Machine-Learning and CASA Models for Predicting Apple Fruit Yields from Time-Series Planet Imageries
 
 
Correction published on 8 June 2022, see Remote Sens. 2022, 14(12), 2746.
Article

Mt. Etna Paroxysms of February–April 2021 Monitored and Quantified through a Multi-Platform Satellite Observing System

1
National Research Council, Institute of Methodologies for Environmental Analysis, 85050 Potenza, Italy
2
School of Engineering, University of Basilicata, 85100 Potenza, Italy
3
Osservatorio Etneo, Istituto Nazionale di Geofisica e Vulcanologia, Piazza Roma, 2 95125 Catania, Italy
*
Author to whom correspondence should be addressed.
Remote Sens. 2021, 13(16), 3074; https://doi.org/10.3390/rs13163074
Submission received: 25 June 2021 / Revised: 30 July 2021 / Accepted: 31 July 2021 / Published: 5 August 2021 / Corrected: 8 June 2022

Abstract

:
On 16 February 2021, an eruptive paroxysm took place at Mt. Etna (Sicily, Italy), after continuous Strombolian activity recorded at summit craters, which intensified in December 2020. This was the first of 17 short, but violent, eruptive events occurring during February–April 2021, mostly at a time interval of about 2–3 days between each other. The paroxysms produced lava fountains (up to 1000 m high), huge tephra columns (up to 10–11 km above sea level), lava and pyroclastic flows, expanding 2–4 km towards East and South. The last event, which was characterised by about 3 days of almost continuous eruptive activity (30 March–1 April), generated the most lasting lava fountain (8–9 h). During some paroxysms, volcanic ash led to the temporary closure of the Vincenzo Bellini Catania International Airport. Heavy ash falls then affected the areas surrounding the volcano, in some cases reaching zones located hundreds of kilometres away from the eruptive vent. In this study, we investigate the Mt. Etna paroxysms mentioned above through a multi-platform satellite system. Results retrieved from Advanced Very High Resolution Radiometer (AVHRR), Moderate Resolution Imaging Spectroradiometer (MODIS), starting from outputs of the Robust Satellite Techniques for Volcanoes (RSTVOLC), indicate that the 17th paroxysm (31 March–1 April) was the most intense in terms of radiative power, with values estimated around 14 GW. Moreover, by the analysis of SEVIRI data, we found that the 5th and 17th paroxysms were the most energetic. The Multispectral Instrument (MSI) and the Operational Land Imager (OLI), providing shortwave infrared (SWIR) data at 20/30 m spatial resolution, enabled an accurate localisation of active vents and the mapping of the areas inundated by lava flows. In addition, according to the Normalized Hotspot Indices (NHI) tool, the 2nd (17–18 February) and 7th (28 February) paroxysm generated the largest thermal anomaly at Mt. Etna after April 2013, when Landsat-8 OLI data became available. Despite the impact of clouds/plumes, pixel saturation, and other factors (e.g., satellite viewing geometry) on thermal anomaly identification, the used multi-sensor approach allowed us to retrieve quantitative information about the 17 paroxysms occurring at Mt. Etna. This approach could support scientists in better interpreting changes in thermal activity, which could lead to future and more dangerous eruptions.

Graphical Abstract

1. Introduction

The Advanced Very High Resolution Radiometer (AVHRR), the Moderate Resolution Imaging Spectroradiometer (MODIS), and the Spinning Enhanced Visible and Infrared Imager (SEVIRI) are some of the instruments most largely used to study and monitor thermal volcanic activity from space (e.g., [1,2,3,4,5,6,7,8,9]). Those sensors, providing Medium Infrared (MIR) and Thermal Infrared (TIR) data at high-temporal resolution (e.g., 15 min for SEVIRI), enable the identification and monitoring of volcanic thermal anomalies and their quantitative characterisation (e.g., [10,11,12]). MODIS data, which are analysed operationally by the MODIS Volcano Thermal Alert System (MODVOLC) and the Middle InfraRed Observation of Volcanic Activity (MIROVA) systems, were often coupled with the Advanced Spaceborne Thermal Emission and Reflection Radiometer (ASTER) TIR observations (90 m spatial resolution) to assess subtle hotspots (e.g., [13,14,15,16]). On the other hand, recent studies exploited visible/near-infrared (VNIR) and shortwave Infrared (SWIR) observations, at 20/30 m spatial resolution, from the Multispectral Instrument (MSI) and Operational Land Imager (OLI) to better map high-temperature targets (e.g., lava lakes/flows [17,18,19,20]).
In this work, we assess the advantages and limitations of a multi-platform observing system, integrating data at different spatial, temporal, and spectral resolutions from low- (LEO) and geo- (GEO) orbiting satellite sensors, in monitoring and characterising the Mt. Etna (Sicily, Italy) paroxysms, i.e., intense short-lived eruptions occurring with Strombolian activity, lava fountaining, lava overflows, and tephra columns.
Mt. Etna (Figure 1) is the highest and most active volcano in Europe. Its eruptive activity frequently occurs from summit craters, although some intense flank eruptions, which are usually more dangerous for both infrastructures and population in the presence of eruptive fissures opening at low altitudes, occurred in recent years [21,22,23].
In the last decade, several paroxysms took place at the summit craters [24]. During January 2011–December 2013, 46 eruptive episodes were recorded [25]. The paroxysms of January–July 2011 yielded the growth of the New South-East Crater (NSEC) at the eastern base of the ‘old’ South-East Crater (SEC, born in 1971 [26]), continuing in 2013 [27,28]. In 2015, other powerful paroxysms occurred at the Voragine crater (VOR), generating a high eruptive column (up to 15 km above sea level) [29]. In recent years, a brief lateral eruption took place on 24–27 December 2018. A huge movement of the eastern flank of the volcano and a seismic crisis (up to Mw 4.9) caused damages in a vast urbanised area of the eastern flank of Etna [12]. After this brief but intense flank eruption, the South-East Crater complex (SEC) awoke on 30 May 2019 and then reactivated on 18 and 27 July 2019, producing Strombolian activity. On 12 September 2019, the VOR crater came into activity with Strombolian explosions and intra-crater lava overflow, and then again, the SEC reactivated in the spring of 2020, with frequent Strombolian eruptions culminating in four major episodes (December 2020), and finally in 17 eruptive paroxysms recorded during February-April 2021, which mostly occurred at intervals of around 2–2.5 days between each other [30]. During the night of 18–19 May, a series of new eruptive paroxysms started and are still ongoing at the time of writing this article.
Here, we investigate the 17 Mt. Etna paroxysms of February–April 2021 through the outputs of the Robust Satellite Techniques for Volcanoes (RSTVOLC) [31], the RASTer (RST on ASTER [32]) system, and the Normalized Hotspots Indices (NHI) tool [33]. To our knowledge, this is one of the first studies focusing on those events, which were highly spectacular and particularly intense, receiving special attention from international, national, and social media.

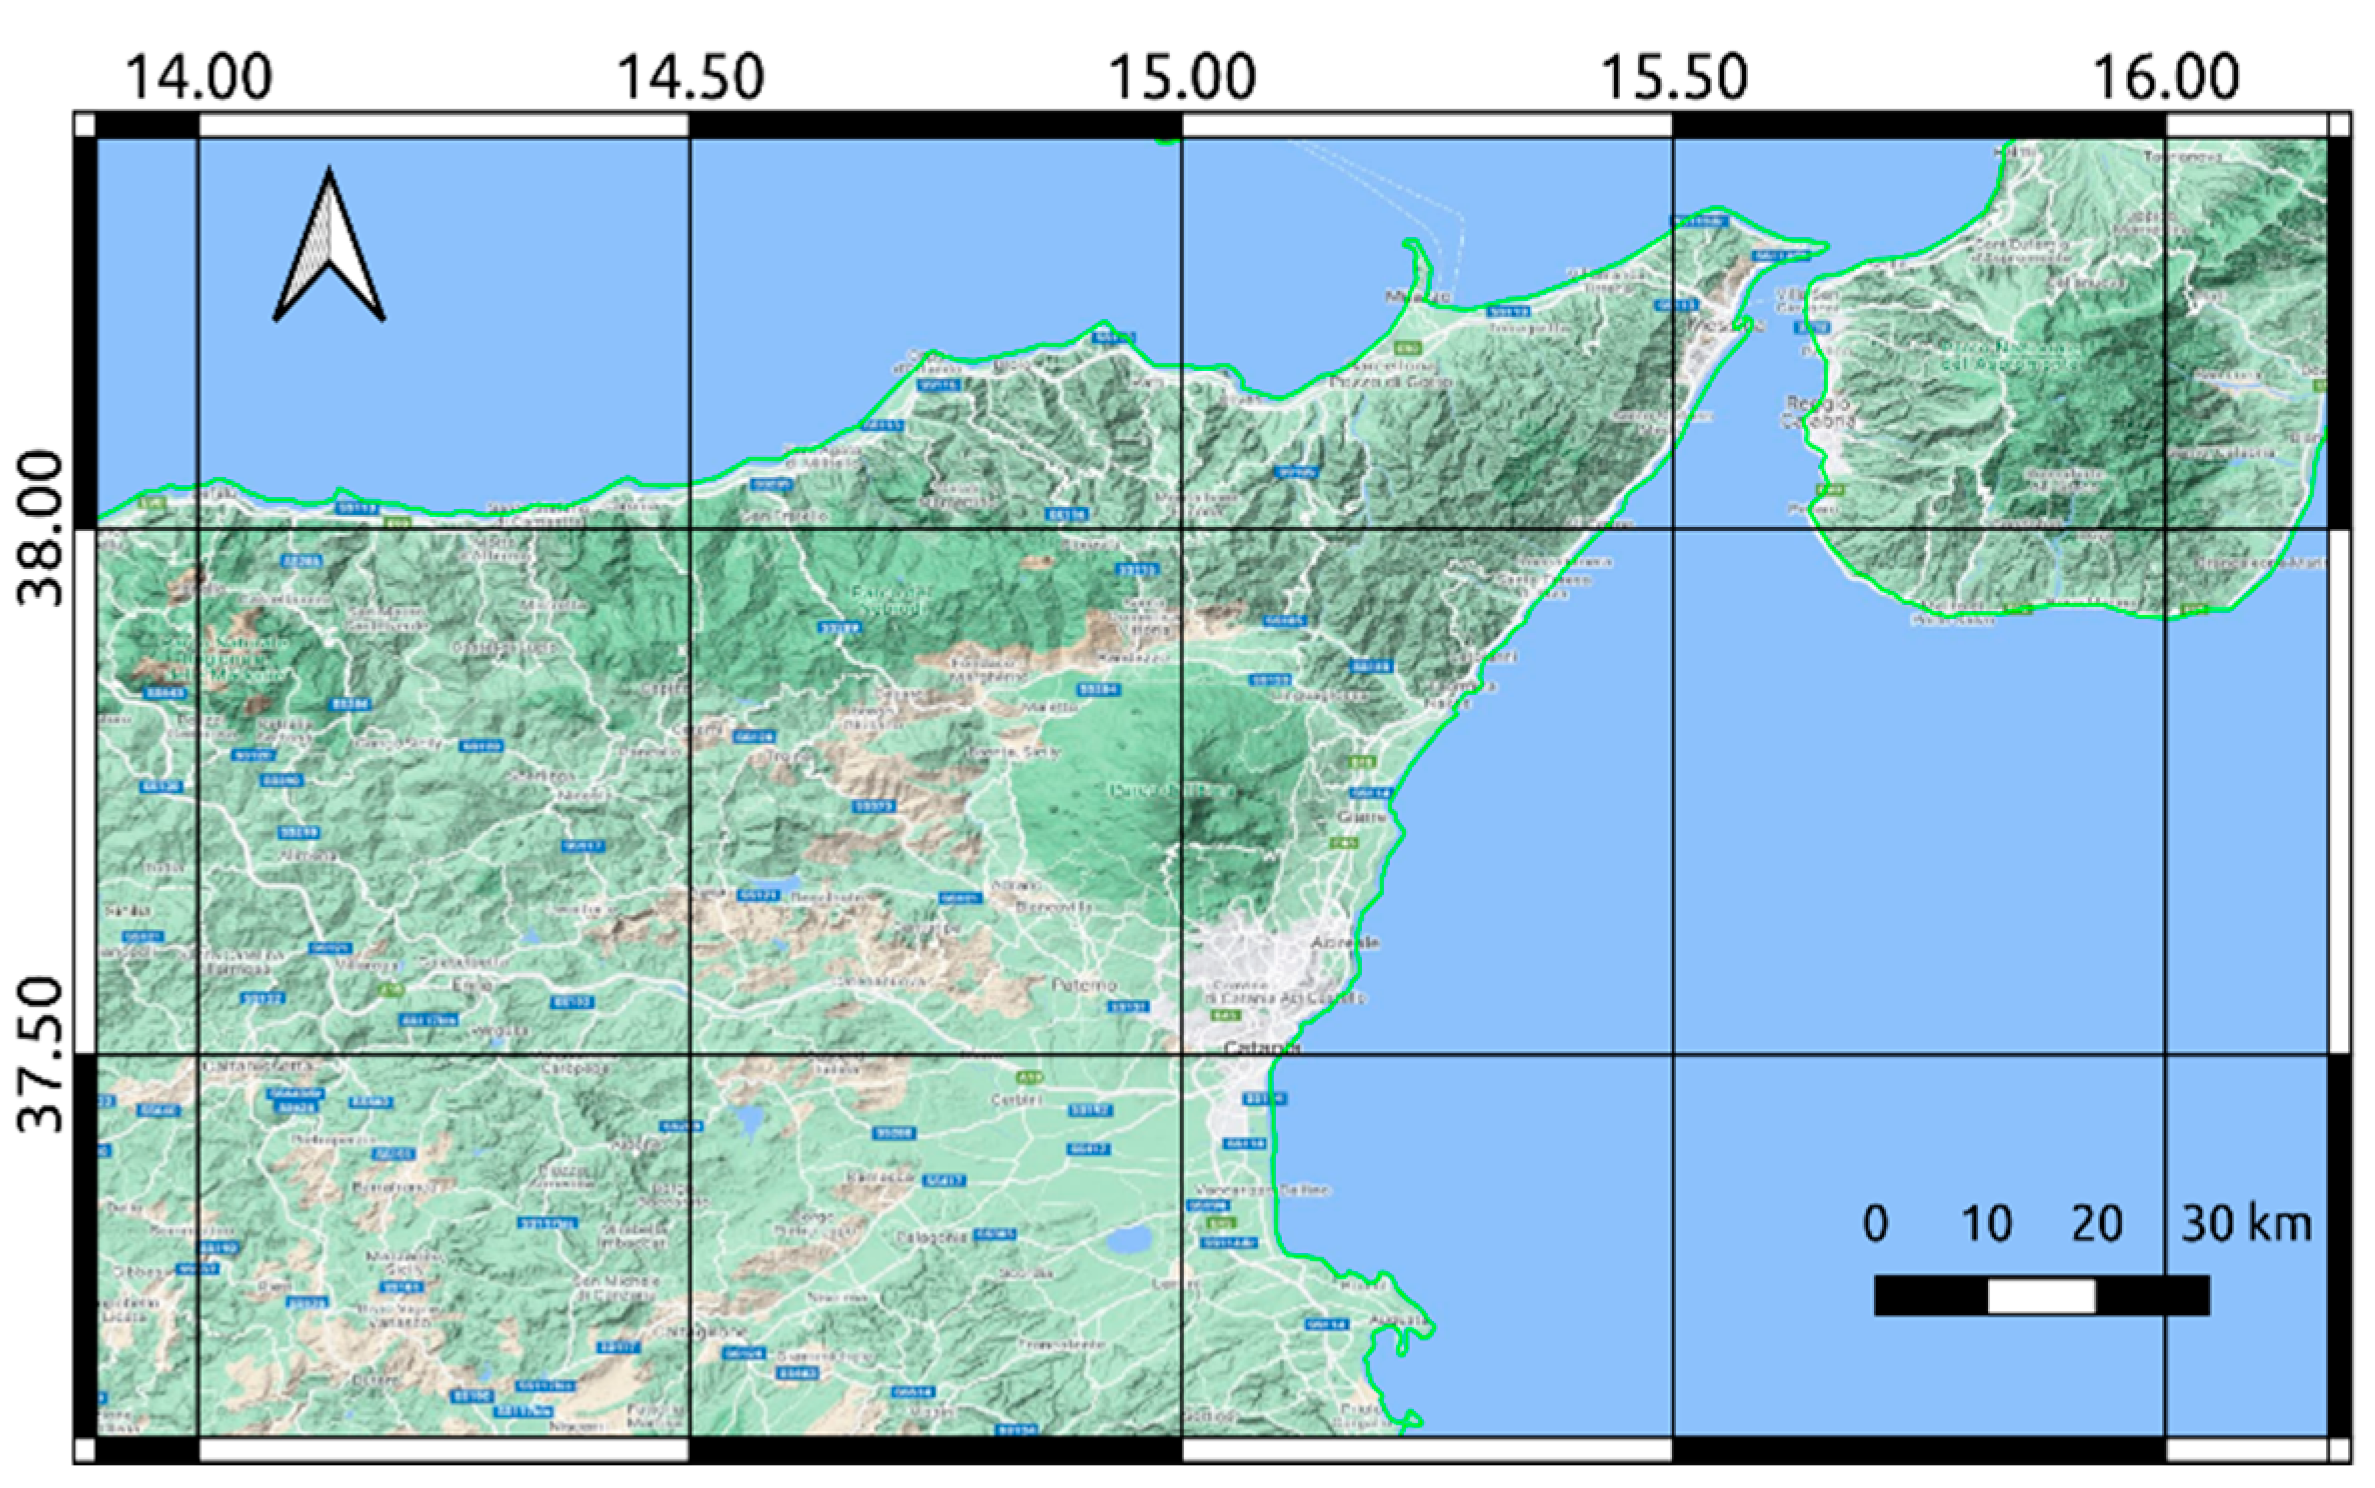
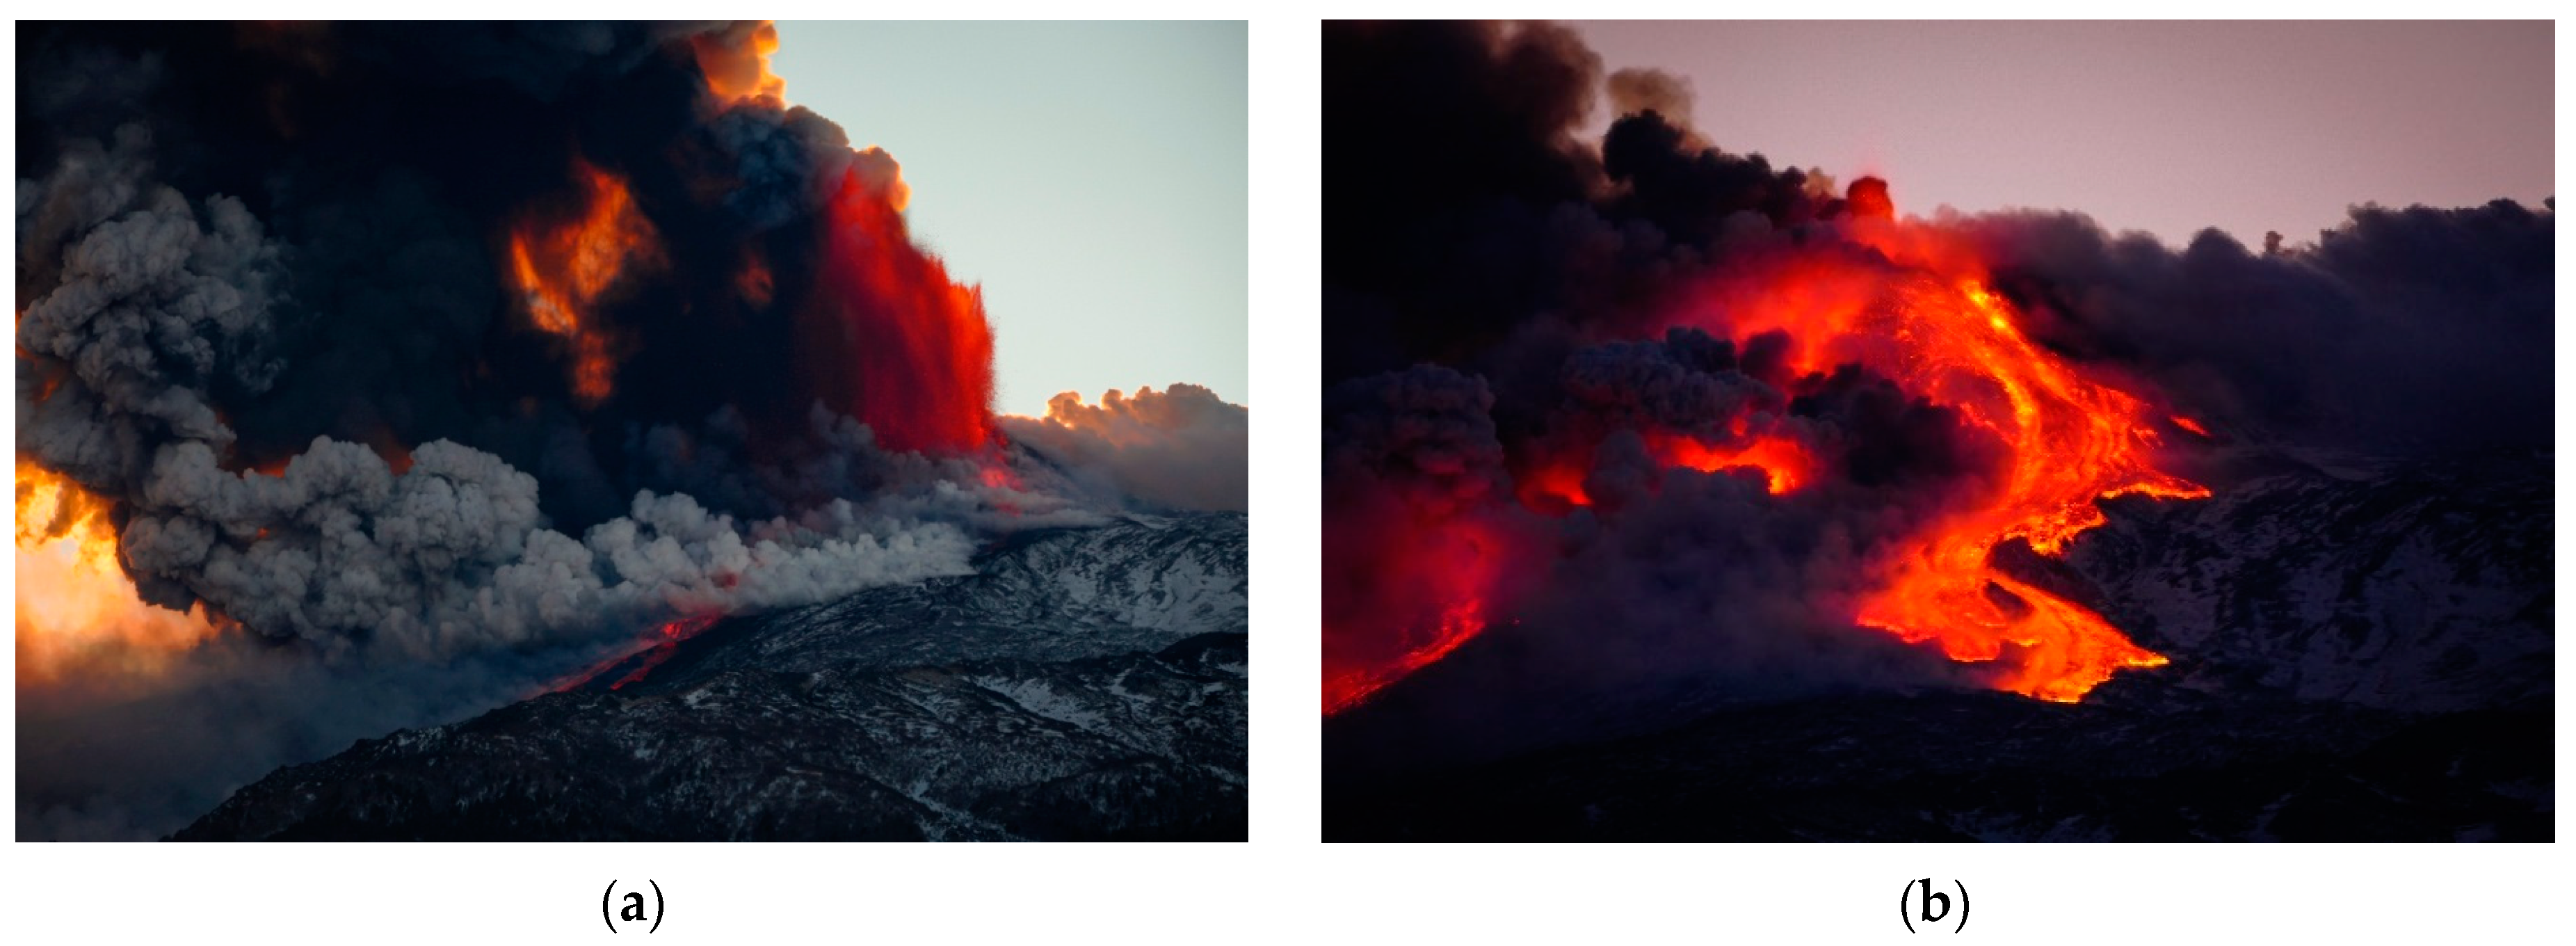
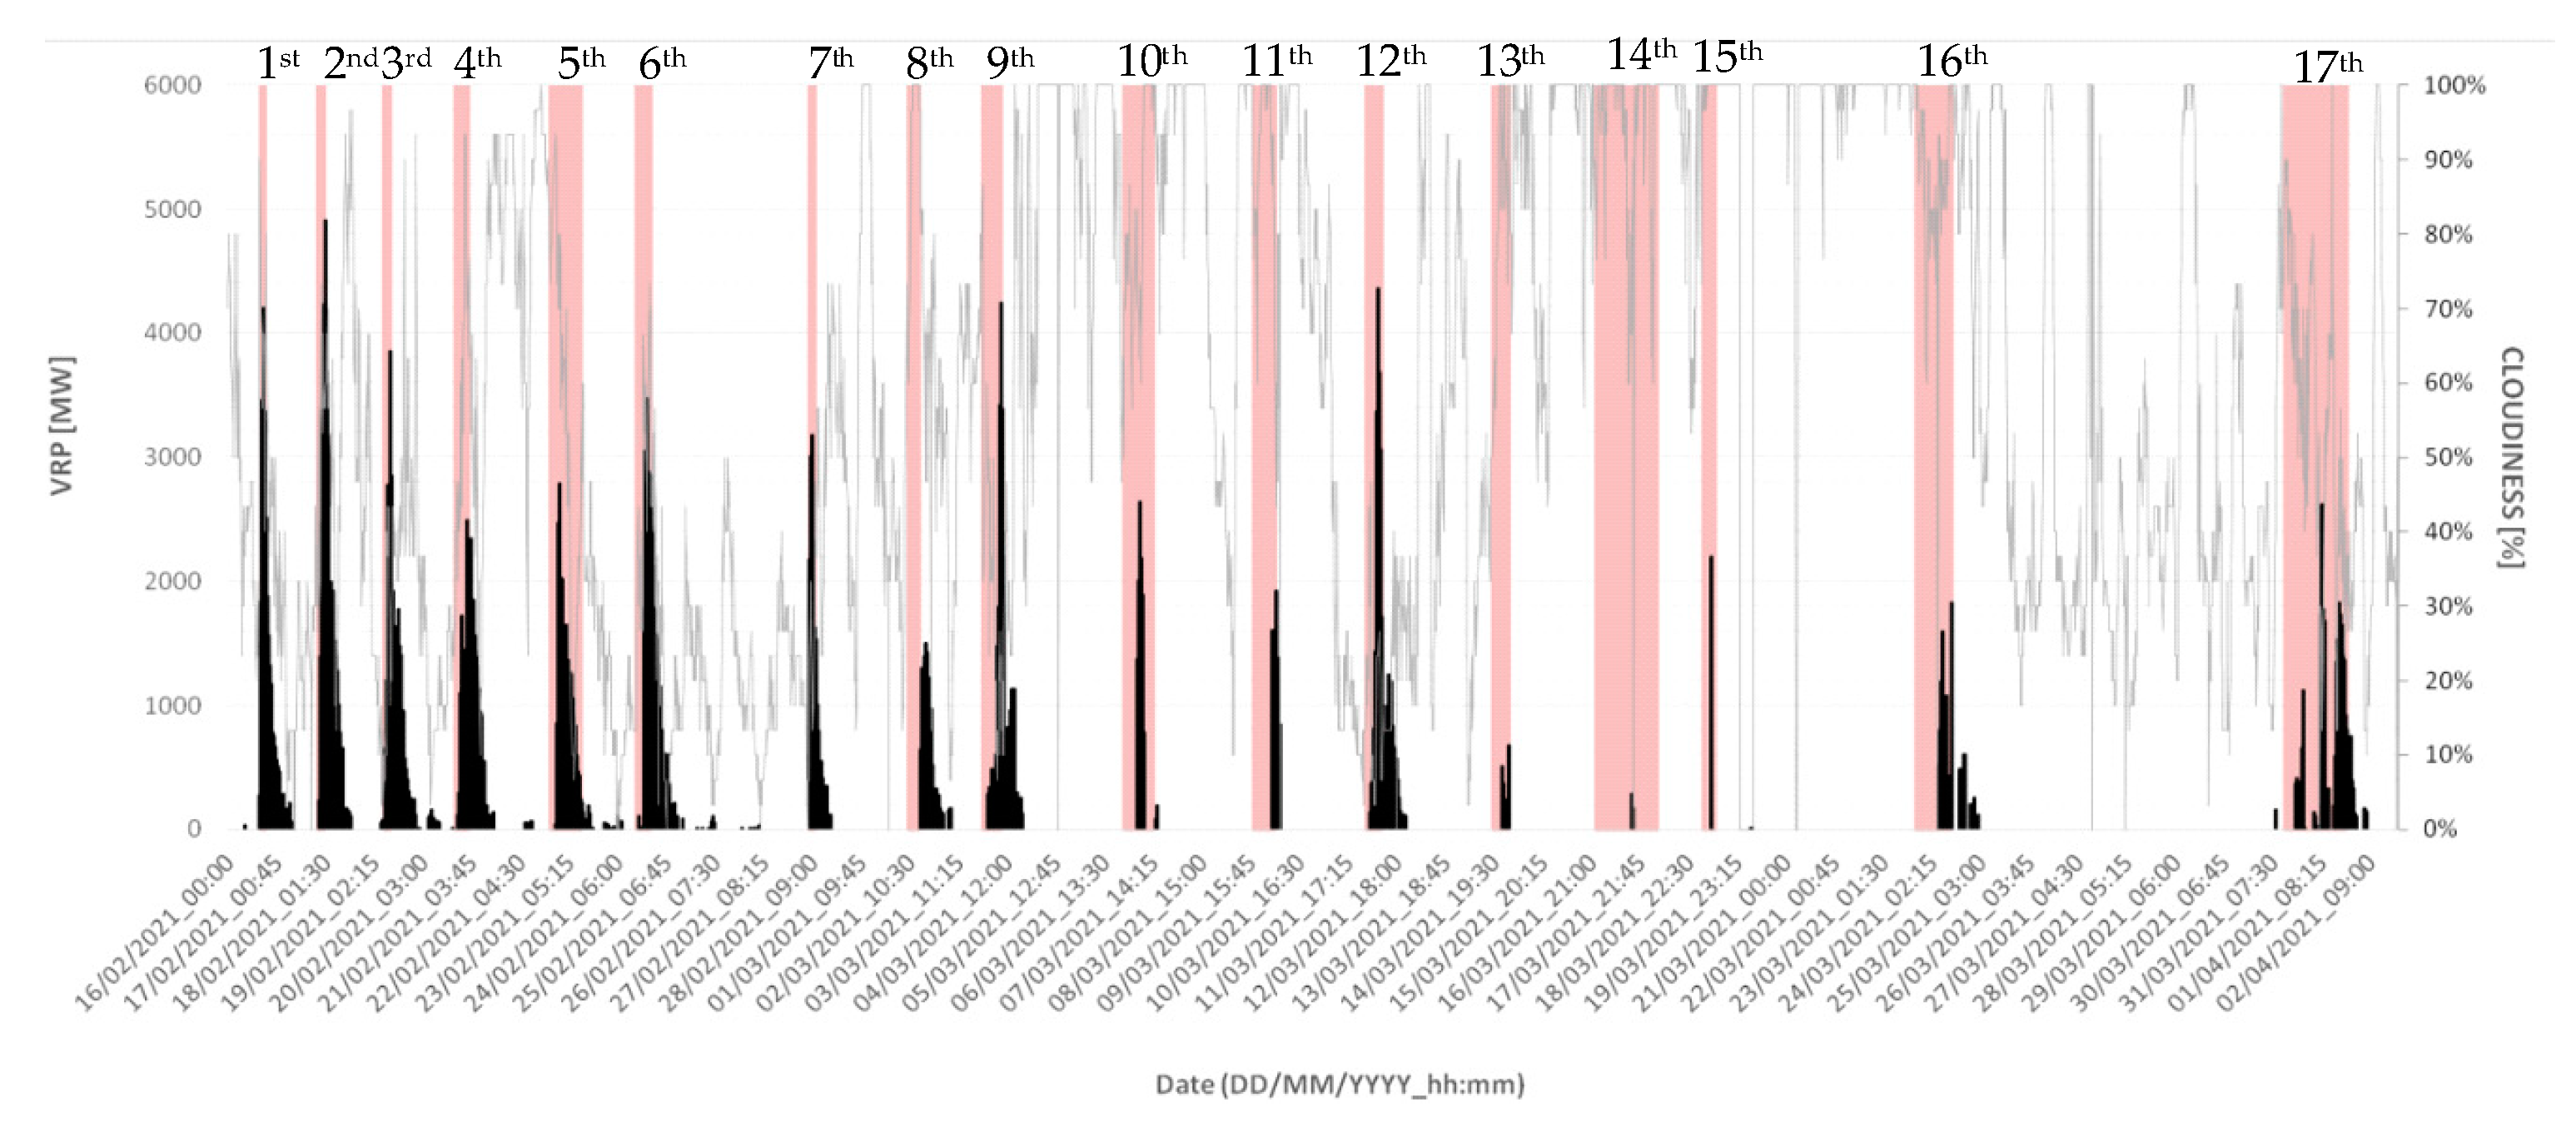
2. Mt. Etna Paroxysms of February–April 2021

On 16 February 2021 (Figure 2), after an almost continuous Strombolian activity recorded in the previous months at Mt. Etna summit craters, which culminated with the major Strombolian episodes of 13–14, 21 and 22 December 2020, a sequence of powerful paroxysms took place at SEC. Table A1 (see Appendix A) details the 17 paroxysms, which, until 1 April, followed one another with intervals ranging from 32 h to over 6 days, providing information about eruption features.
The 17th paroxysm was the longest of the time series (with lava fountains of 540 min duration), the eruptive column was usually high, up to 11 km above sea level (a.s.l.) (e.g., the 6th paroxysm), and lava flows moved towards Valle del Bove and the southern flank (see Table A1).
During the eruptive events, primitive magma, which is compositionally similar to the source magma that forms in the Earth's mantle at a depth of over 40 km [34], very rich in gas, was expelled (e.g., [35]). The coarser and heavier material fell by gravity around the eruptive vent and therefore on the flanks of the SEC, which through this continuous contribution has systematically changed shape and size in each of the 17 eruptions. The lighter portion of the fragmented magma, however, continued to rise in the atmosphere for kilometres, until it reached the 'floating' altitude, around 8–10 km above sea level, where ashes and lapilli were taken over by the winds of the high troposphere and then transported to areas very far from the volcano, up to many hundreds of kilometres. Therefore, most of the Etna urban centres were repeatedly covered by a heavy mantle of ashes and lapilli. A phenomenon that is only apparently harmless. Indeed, the fallout of the coarser volcanic material, with bombs larger than 10–15 cm falling over 7 km away from the eruptive vent, can injure people and animals, damage and burn vegetation, break crystals, and damage car bodyworks. Volcanic ash makes roads slippery and dangerous for road traffic. The passage of cars on the roads covered with lapilli further fragments the volcanic material, making it microscopic in size (up to PM10 size), easily inhaled, and therefore dangerous for human health. Finally, when the material falls on Catania, Sigonella, and Reggio Calabria airports, they must temporarily close, to ensure the safety of flights and clean the runways. Multiplying these problems 17 times in 44 days, we can understand the hardship faced by the population as well as the difficulties that the authorities have had to face.

3. Data

The AVHRR sensor, aboard NOAA (National Oceanic and Atmospheric Administration) satellites, provides data in five spectral channels, from visible to thermal infrared. The AVHRR3, flying on the MetOp (Meteorological Operational)-A, B, and C satellites, scans the Earth’s surface in six spectral bands, including the channel 3A (1.6 µm) operating in daytime [36]. MODIS, on board the Aqua and Terra satellites, acquires VIS and TIR data four times per day in 36 spectral bands (e.g., [3]). SEVIRI, aboard Meteosat Second Generation (MSG) geostationary satellites, provides data in four VNIR (0.4–1.6 µm) and eight IR channels (3.9–13.4 µm), with a temporal sampling up to 5 min in the Rapid Scanner mode [37]. ASTER, aboard the Terra platform, operates in 14 spectral bands from VNIR to TIR (15 m to 90 m spatial resolution), with a repeat cycle of 16 days. OLI, aboard the Landsat-8 satellite (16-day revisit time), acquires VNIR to SWIR data in nine spectral channels [38]. The MSI instrument, aboard the Sentinel-2 constellation (5 day revisit time at the equator in cloud-free conditions), acquires data in 13 spectral bands from VNIR to SWIR, with a spatial resolution ranging from 10 m to 60 m [39].
Satellite data from those sensors (Table 1) were used to monitor and quantify the Mt. Etna paroxysms, using the hotspot detection methods described in detail in the next section.

4. Methods

4.1. Hotspot Detection

4.1.1. RSTVOLC Algorithm

The RSTVOLC algorithm is an optimised configuration of the Robust Satellite Techniques (RST) for volcanological applications (see [31,40] for details).
RSTVOLC uses two indices in combination, based on the Absolutely Local Index of Change of the Environment (ALICE [41]), to detect thermal anomalies [41]. The ⊗MIR(x,y,t) index, which is computed using the AVHRR channel 3B, the MODIS channel 21/22, and the SEVIRI channel 4 (see Table 1), is highly sensitive to hot magmatic features. The ⊗MIR-TIR(x,y,t) index, by exploiting also TIR data (i.e., AVHRR channel 4, MODIS channel 31, and SEVIRI channel 9), is used to increase the confidence level of detection [40]. Since RSTVOLC is a tuneable technique, different cutting levels of those indices (e.g., ⊗MIR(x,y,t) > 3 ANDMIR-TIR(x,y,t) > 3) are used to identify volcanic hotspots [31].
Those indices are calculated by processing pluriannual time series of homogeneous (i.e., same spectral channel/s, same month, and overpass times) cloud-free satellite records. The One-channel Cloudy-radiance-detection Approach (OCA [42]), and a standard cloud-masking procedure, from the European Organization for the Exploitation of Meteorological Satellites (EUMETSAT), are used to filter out cloudy pixels from SEVIRI data [43].
The RST detection scheme applied to ASTER TIR data, under Google Earth Engine (GEE) platform, is widely described in [32].

4.1.2. NHI Algorithm

The NHI multichannel algorithm uses two normalised indices to identify and map high-temperature features through satellite data at mid-high spatial resolution [44]. Those indices analyse the TOA (Top of the Atmosphere) radiance (W m–2 sr–1 µm–1) measured in the SWIR (at 1.6 µm and 2.2 µm) and NIR (Near Infrared) (0.8 µm) bands of MSI and OLI. The algorithm, whose wide description can be found in [44], flags as 'hot' the pixels with positive values of one or both the above-mentioned indices.
NHI was tested with success over different volcanic areas using data also from previous sensors such as TM (Thematic Mapper), ETM + (Enhanced Thematic Mapper, Plus), and ASTER [45], whose SWIR observations were available until April 2008 due to the failure of the SWIR instrument [46].
The NHI tool (https://sites.google.com/view/nhi-tool (accessed on 23 June 2021)), by exploiting the high computational resources and the extended data archive of the GEE platform, enables the analysis of volcanic thermal anomalies at the global scale. The tool includes some additional spectral tests to increase the accuracy in mapping hot targets minimising false detections. The latter are mainly associated with the multispectral misregistration of Sentinel-2 MSI imagery, affecting also other recent hotspot detection methods (e.g., [47]). A detailed description of the NHI tool performance can be found in [33].

4.2. Radiative Power Estimation

4.2.1. AVHRR Estimations

To estimate the radiative power from infrared AVHRR data [48], starting from the outputs of the dual band three-component method, we used the following formulation:
Q r a d   = i = 1 n ε   σ   A i     [ p c i   T c i 4 + p h i   T h i 4 ]
where Q r a d is the radiative power [W], n is the number of detected hot pixels, A i is the lava flow area for the pixel i having a crusted and molten portion p c i and p h i with temperatures T c i and T h i , and σ is the Stefan–Boltzmann constant (5.67 × 10⁻⁸ Wm–2 K–4) [48]. In this study, we assumed ε = 0.98 (e.g., [49,50]) as representative of the Etnean lava flows to calculate the radiative power (mean value from lower and upper limit; T c = 100 °C; 500 °C), without correcting data for atmospheric effects to cross-compare results with the MODIS ones.

4.2.2. SEVIRI and MODIS Estimations

To retrieve the radiative power from SEVIRI and MODIS data, starting from thermal anomalies flagged by RSTVOLC, we used the formulation proposed in previous studies to characterise thermal anomalies with temperatures ranging in between 600 and 1500 K [51,52], and largely used in literature (e.g., [53,54]):
V R P = A p i x e l τ M I R ( σ ε f h a ε f , M I R ) ( L M I R L b , M I R )
In Equation (2), Apixel is the pixel area (km2) at relative scan angle ( A p i x e l from MODIS data was calculated as ∆S × ∆T, where ∆S and ∆T are the along-scan and along-track pixel size [52,55], τMIR is the atmospheric transmittance in the MIR band, σ is the Stefan–Boltzmann constant, εf is the hotspot emissivity over all wavelengths, εf,MIR is the hotspot emissivity in the MIR band, LMIR (W m–2sr–1µm–1) is the MIR spectral radiance from the hot target, Lb,MIR is the background radiance, and a is a sensor-dependent constant (Table 2).
By assuming εf =εf,MIR (gray body), the above-mentioned equation may be simplified [52].
In this work, L b , M I R from MODIS data refers to the temporal mean of the spatial average calculated over a 7 × 7 pixel box located at the Mt. Etna southern area (i.e., at a distance of about 10 km). The OCA method was used to discard cloudy pixels from this computation. To retrieve L b , M I R from SEVIRI data, we first calculated the temporal mean of the MIR radiance, i.e., μ L M I R ( x , y , t ) , for each pixel of the scene at the observation time t (96 time slots) by analysing a long-time series of LMIR data [41]. For each hotspot pixel detected by RSTVOLC, the background radiance represents the spatial average of μ L M I R ( x , y , t ) retrieved over a 7 × 7 pixel window (about 91 × 91 km2), around the pixel (x,y). To compute the spatial average, we excluded both sea and no-data pixels.
We estimated the radiative power from infrared MODIS and SEVIRI data by assuming τ M I R = 1 in equation (2), as in previous independent studies (e.g., [55,56]).

5. Results

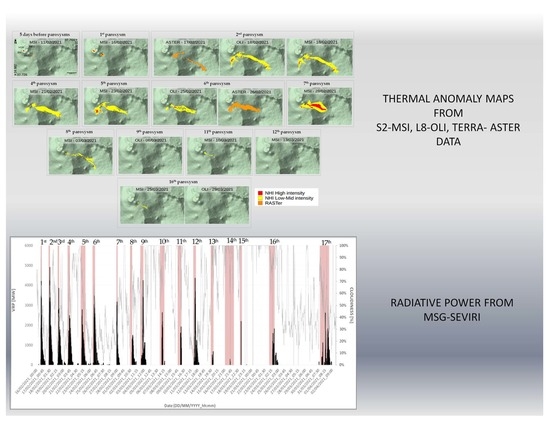
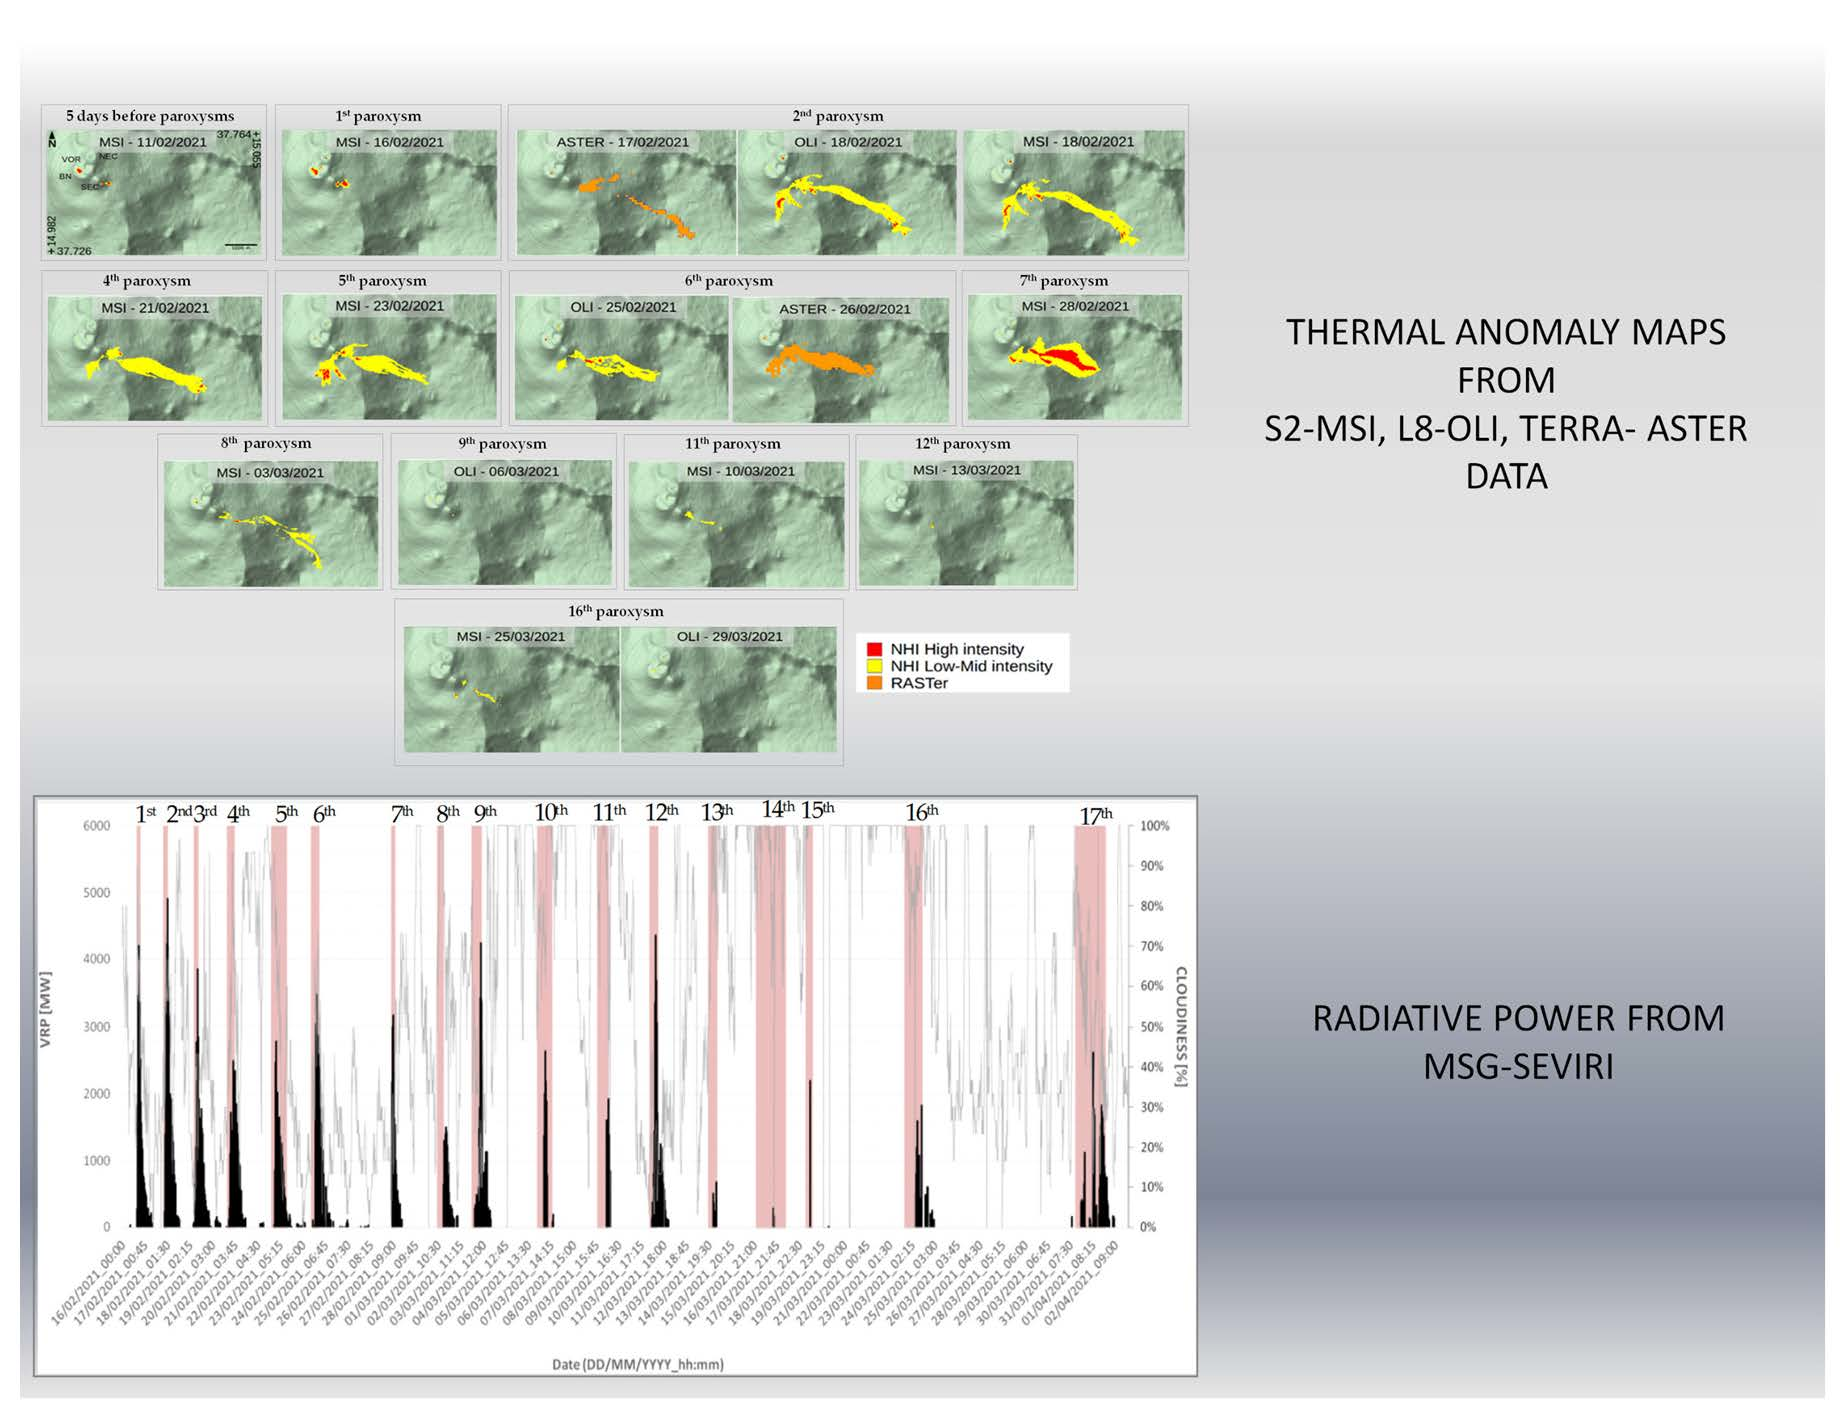
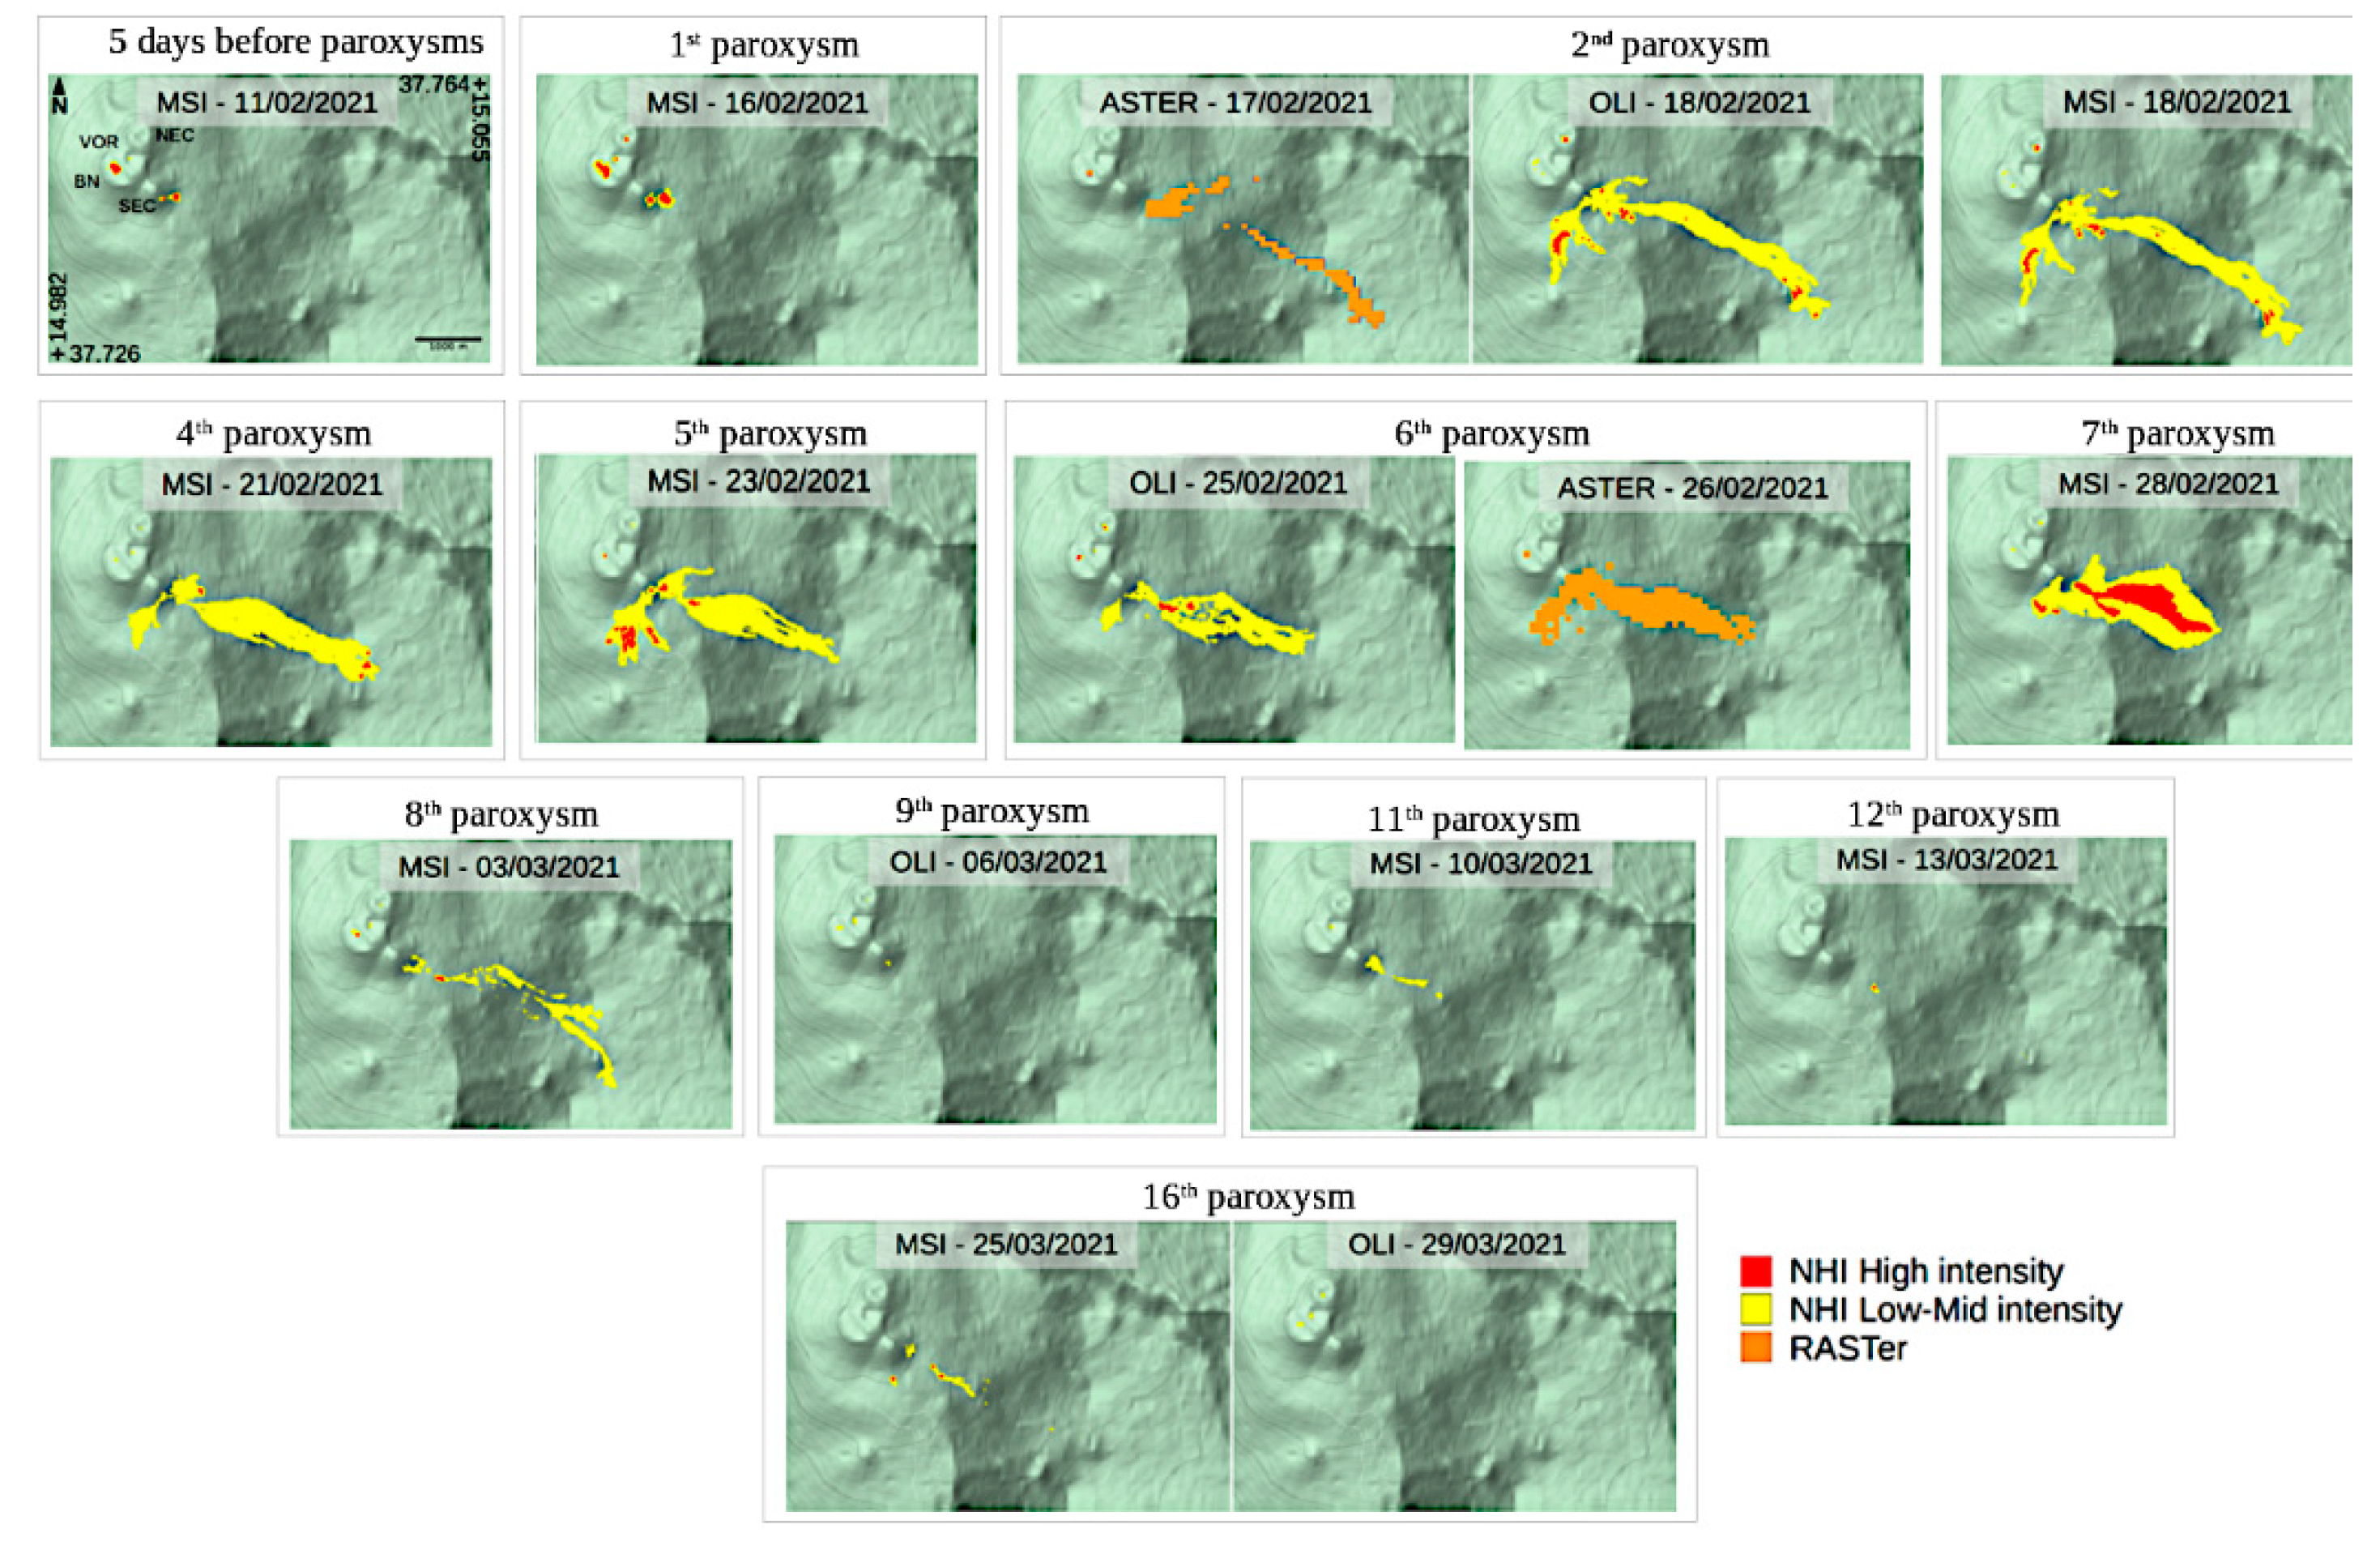
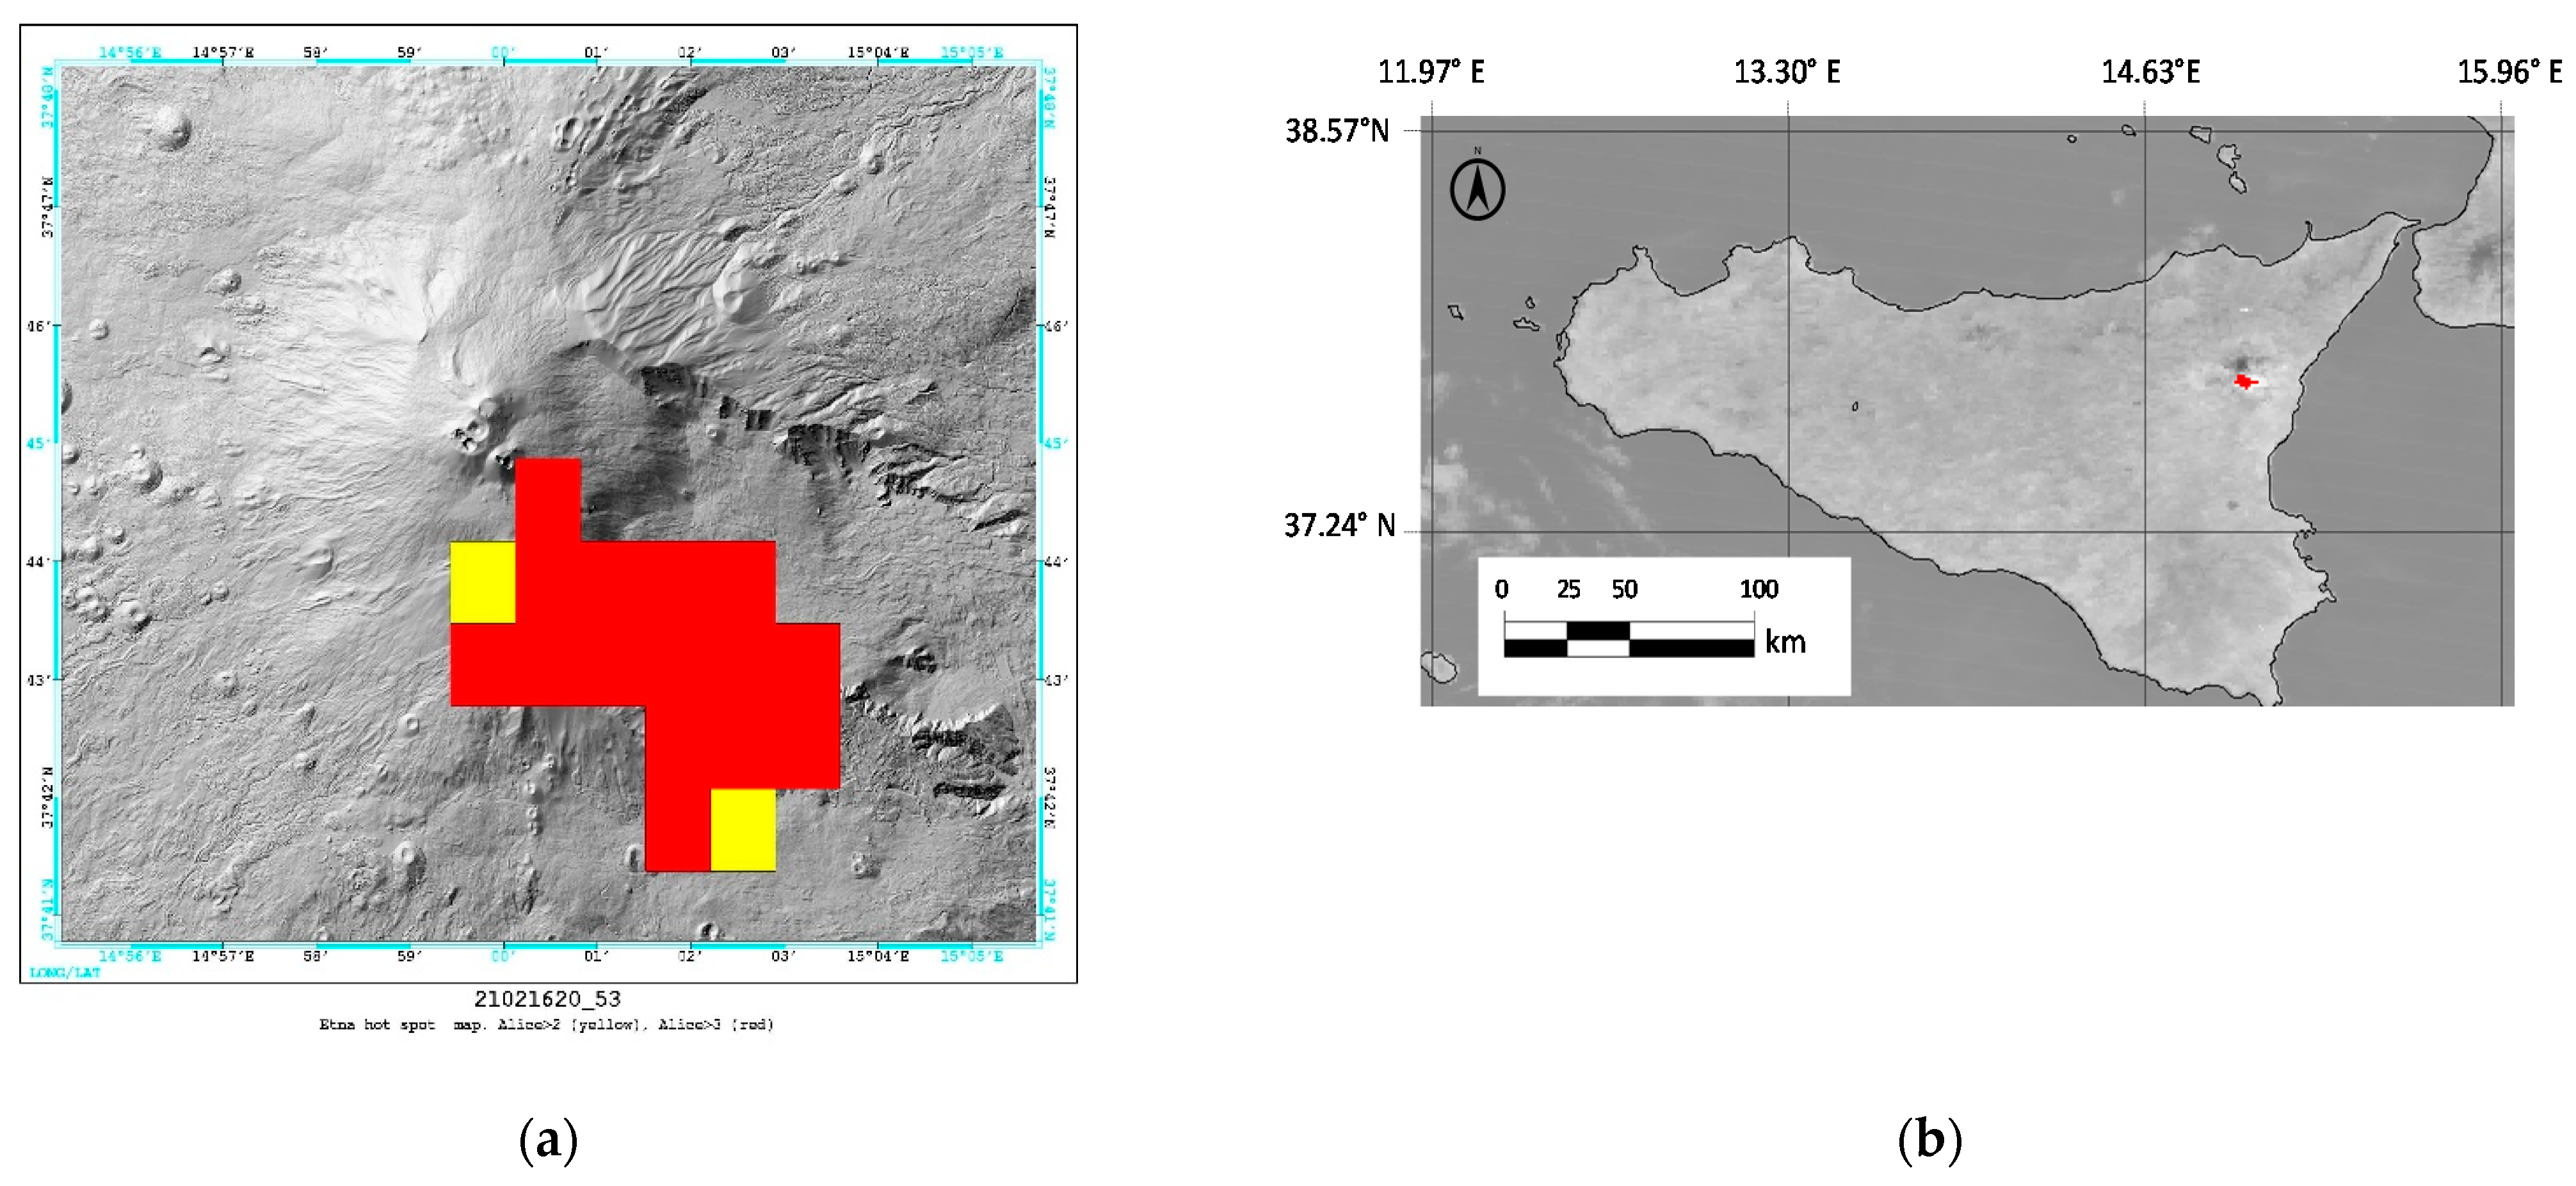
5.1. Thermal Anomaly Identification and Mapping

In Figure 3, we show some thermal anomaly maps, referring to the period 16 February–10 March 2021, generated through the NHI tool and the RASTer system. Maps display the hotspot pixels in different colours. Regarding the NHI detections, red and yellow pixels indicate the areas where volcanic thermal emissions were strong or less intense, respectively.
After a gradual increase in Strombolian activity and volcanic tremor recorded by the Istituto Nazionale di Geofisica e Vulcanologia (INGV) surveillance network, a lava overflow started on 16 February at around 17:05 UTC. The lava overflow caused the partial collapse of the cone at the eastern eruptive vents of SEC, generating a pyroclastic flow along the western wall of the Valle del Bove (see Table A1). Soon after, an intense lava fountaining (500–600 m high, 45 min lasting) occurred, generating a tall (≈10 km above sea level) eruptive column [30]. A few hours before the start of the paroxysm, a thermal anomaly, which was spatially more extended than previous days, affected the Mt. Etna crater area, as indicated by hot pixels flagged by NHI over VOR-BN and SEC (see the S2-MSI map of 16 February). The RASTer map, from ASTER TIR data of 17 February, shows that the lava flow emitted during the first paroxysmal event affected the Valle del Bove, moving towards the E-SE direction (see orange pixels).
The second paroxysm took place during the night of 17–18 February, i.e., 33 h after the previous eruptive episode. This event was similar to the previous one and generated a lava flow travelling towards the Valle del Bove, in the NE and SE, and on the high southern flank of Etna, in the SW direction [57]. The S2-MSI and L8-OLI maps of 18 February provided the same information about the shape and spatial extent of lava flows, revealing the occurrence of a thermal activity also at NEC. Figure 3 shows that the first flow moved in the SW direction reaching an altitude of about 2840 m, while the second flow extended up to about 1680 m in the Valle del Bove. The maps of 21 and 23 February display the lava flows associated with the 4th and 5th paroxysm, which mostly affected the same areas. The fourth paroxysm started in the late afternoon of 20 February and was preceded by a weak Strombolian activity. At around 21:30 UTC, a small lava overflow occurred; explosive activity then increased, and a lava fountain activity began at 22:00 UTC, becoming more intense in the following hours. This activity, generating an eruptive column extending up to about 10 km a.s.l., decreased starting from 01:10 UTC [30]. The fifth paroxysm took place during 22–23 February with lava fountains lasting about 50 min, and the emission of a high eruptive column. It had a time duration of about 14 h, including also the Strombolian phase preceding the fountain (Table 1A).
The L8-OLI and Terra-ASTER maps of 25 and 26 February display the thermal anomaly associated with the sixth paroxysm, which took place on 24 February, lasting about six hours. Lava fountain activity fed a new lava flow expanding towards SW [58], which was well detected by satellite, as indicated by the NHI and RASTer maps.
Lava flow associated with the 7th paroxysm was identified almost in concomitance with the end of the eruptive event (i.e., from the S2-MSI scene of 28 February at 09:44 UTC). Consequently, the lava flow, extending up to an altitude of about 2000 m in the Valle del Bove, appeared particularly intense (see the high number of red pixels). The seventh paroxysm occurred after a three-and-a-half-day break and was preceded by a weak Strombolian, having started on 28 February at around 08:10 UTC, rapidly evolving to lava fountains, lasting 54 min. The paroxysm also produced a lava flow moving towards East, and a tall eruptive column (11 km a.s.l.) causing the ash fall-out in the East direction.
The thermal anomaly map from the S2-MSI scene of 3 March at 09:51 UTC displays the lava flow associated with the 8th paroxysm, which had occurred the day before with lava fountains, lasting about two hours, and an eruptive column dispersing in the South direction. Thermal anomaly associated with the paroxysm was partially detected by satellite (as indicated by the manual inspection of satellite imagery), due to possible lava cooling effects. In general, those effects such as clouds/plumes had a significant impact on thermal anomaly identification, as for the maps of 6 and 10 March. On 4 March, the 9th paroxysm occurred. It was preceded by a Strombolian activity increasing 22 min after midnight, reaching the climax phase about two hours later. The lava fountain lasted just over two hours. The 10th paroxysm started on 7 March between 00:00 and 01:00 UTC and lasted about 10 h, emitting a small lava flow from a vent opening at the base of SEC. Activity then evolved to lava fountains at 06:00 UTC lasting 60 min, generating a high eruptive column, dispersing in the East direction, and causing the ash fall-out over the neighbour villages [59]. The map of 6 March, referring to the period in between the 9th and 10th paroxysm, was strongly affected by cloud coverage, while the map of 10 March shows the lava flow emitted the day before, during the 11th paroxysm, from a vent located at the S base of the SEC [60], which was masked by clouds mainly in the distal part.
The map from the S2-MSI scene of 13 March shows a small thermal anomaly detected after the end of the 12th paroxysm. This event, which was preceded by a weak Strombolian activity occurring on 12 March since 03:20 UTC, generated lava fountaining lasting 175 min, and an eruptive column extending up about 9–10 km a.s.l. (Table A1). Lava flow from SEC reached about 2000 m elevation in the Valle del Bove [61]. Clouds and possible lava cooling effects affected once again the thermal anomaly identification.
The NHI map from the S2-MSI scene of 25 March displays the lava flow emitted during the 16th paroxysm, which took place between 23 and 24 March. In detail, after a weak Strombolian activity from SEC, recorded since 23 March at 19:05 UTC, sustained lava fountains occurred during the night, lasting about 8 h. The eruption, ending on 24 March at 11:55 UTC [62,63], generated an ash column moving in the SSO-SE directions, and a lava flow moving towards the Valle del Bove. The NHI map indicates that the lava flow extended up to about 2600 m elevation. On the other hand, the analysis of the false colour composite imagery revealed that this feature was spatially more extended than that indicated by NHI. The latter did not detect the lava flow in the distal part (where it was less radiant in the SWIR bands), due to possible effects of lava cooling.
Finally, the map of 30 March shows that a low-to-moderate thermal activity was in progress at the summit craters, some hours before the occurrence of the 17th paroxysm. This event was preceded by an intense Strombolian activity occurring since 14:30 UTC [64]. A small lava emission was noticed through INGV thermal surveillance cameras, emitted from the SEC's eastern base at 13:00 UTC on 31 March. Lava fountains started a few hours later and lasted 540 min. The eruptive column reached 9–10 km a.s.l., dispersing in the SSW direction. Lava flows expanded towards E, SE, and SSE (in Valle del Bove) and towards S and SW (on the southern flank) down to 1820 m a.s.l.
Hence, on the one hand, S2-MSI, L8-OLI, and Terra-ASTER data provided detailed information about active vents and emitted lava flows, particularly when they were less affected by cloud/volcanic plumes. On the other hand, they did not enable the continuous monitoring of Mt. Etna activity, despite the advantages of data integration, which guarantees a temporal sampling of 2–3 days on average over the Mt. Etna area (see Figure 4).
Therefore, thermal activity associated with the paroxysms of February–April 2021 required the use of high temporal resolution satellite data to be monitored and quantified in a more efficient way from space, as shown and discussed in detail in the next sections.

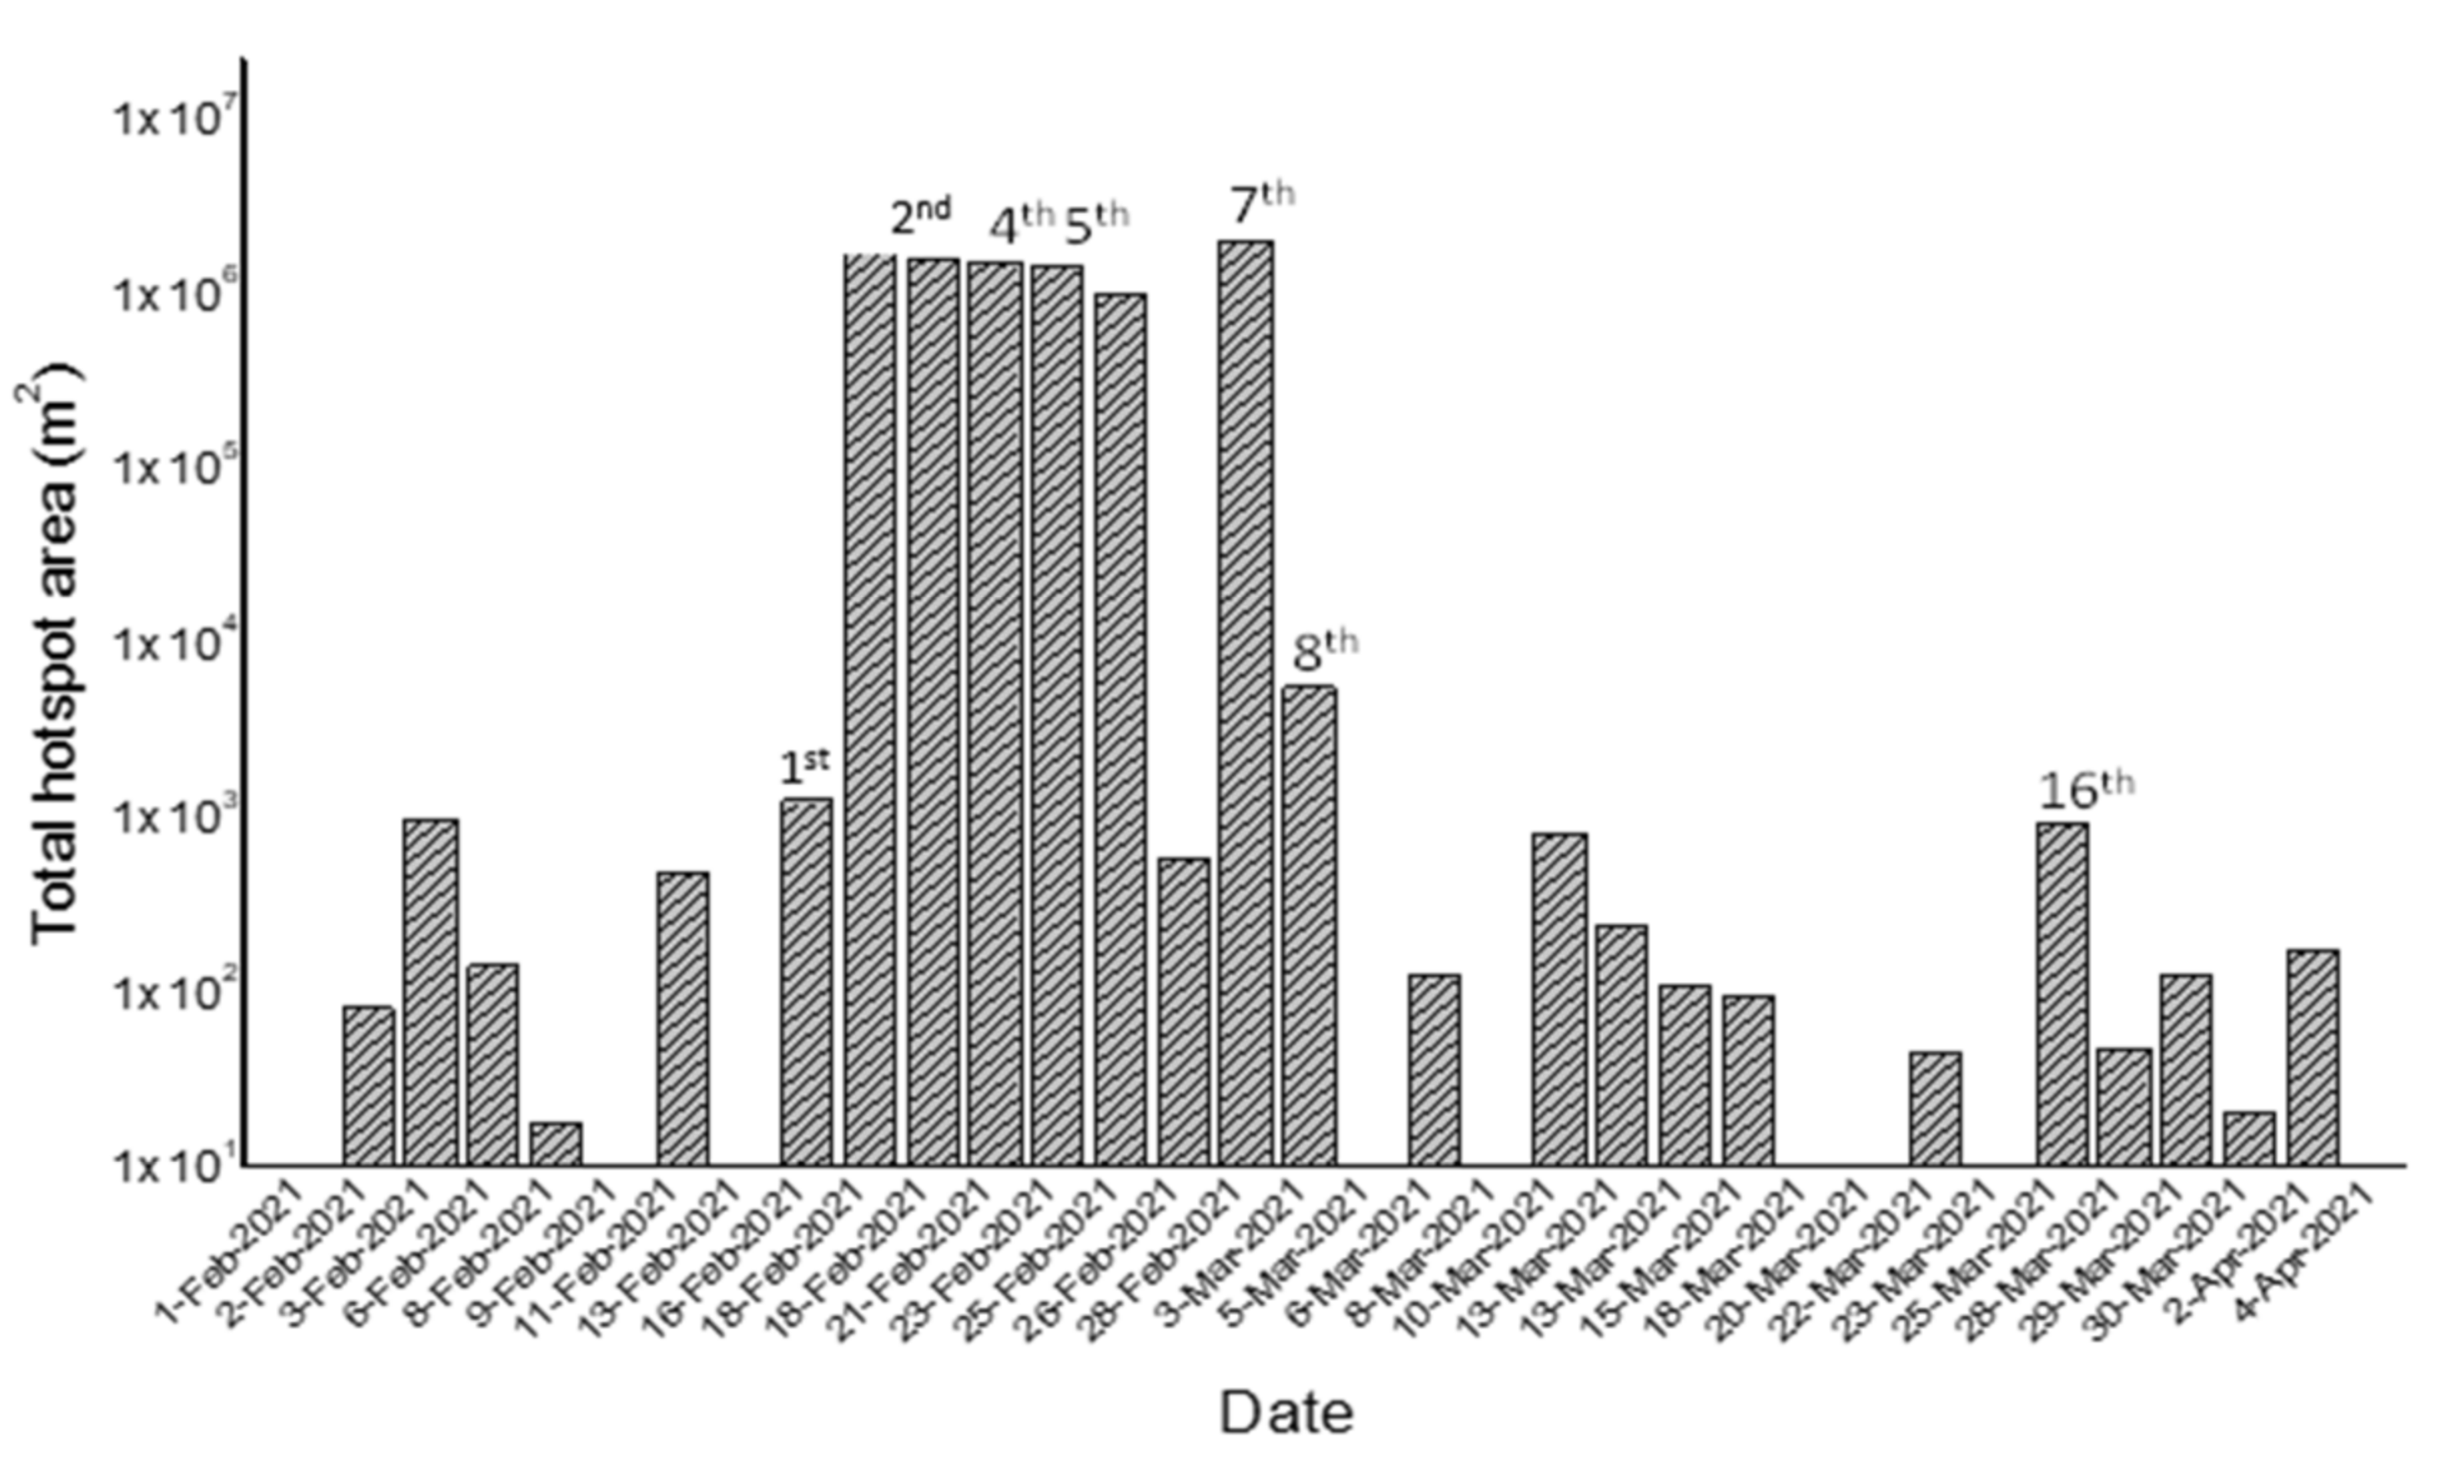
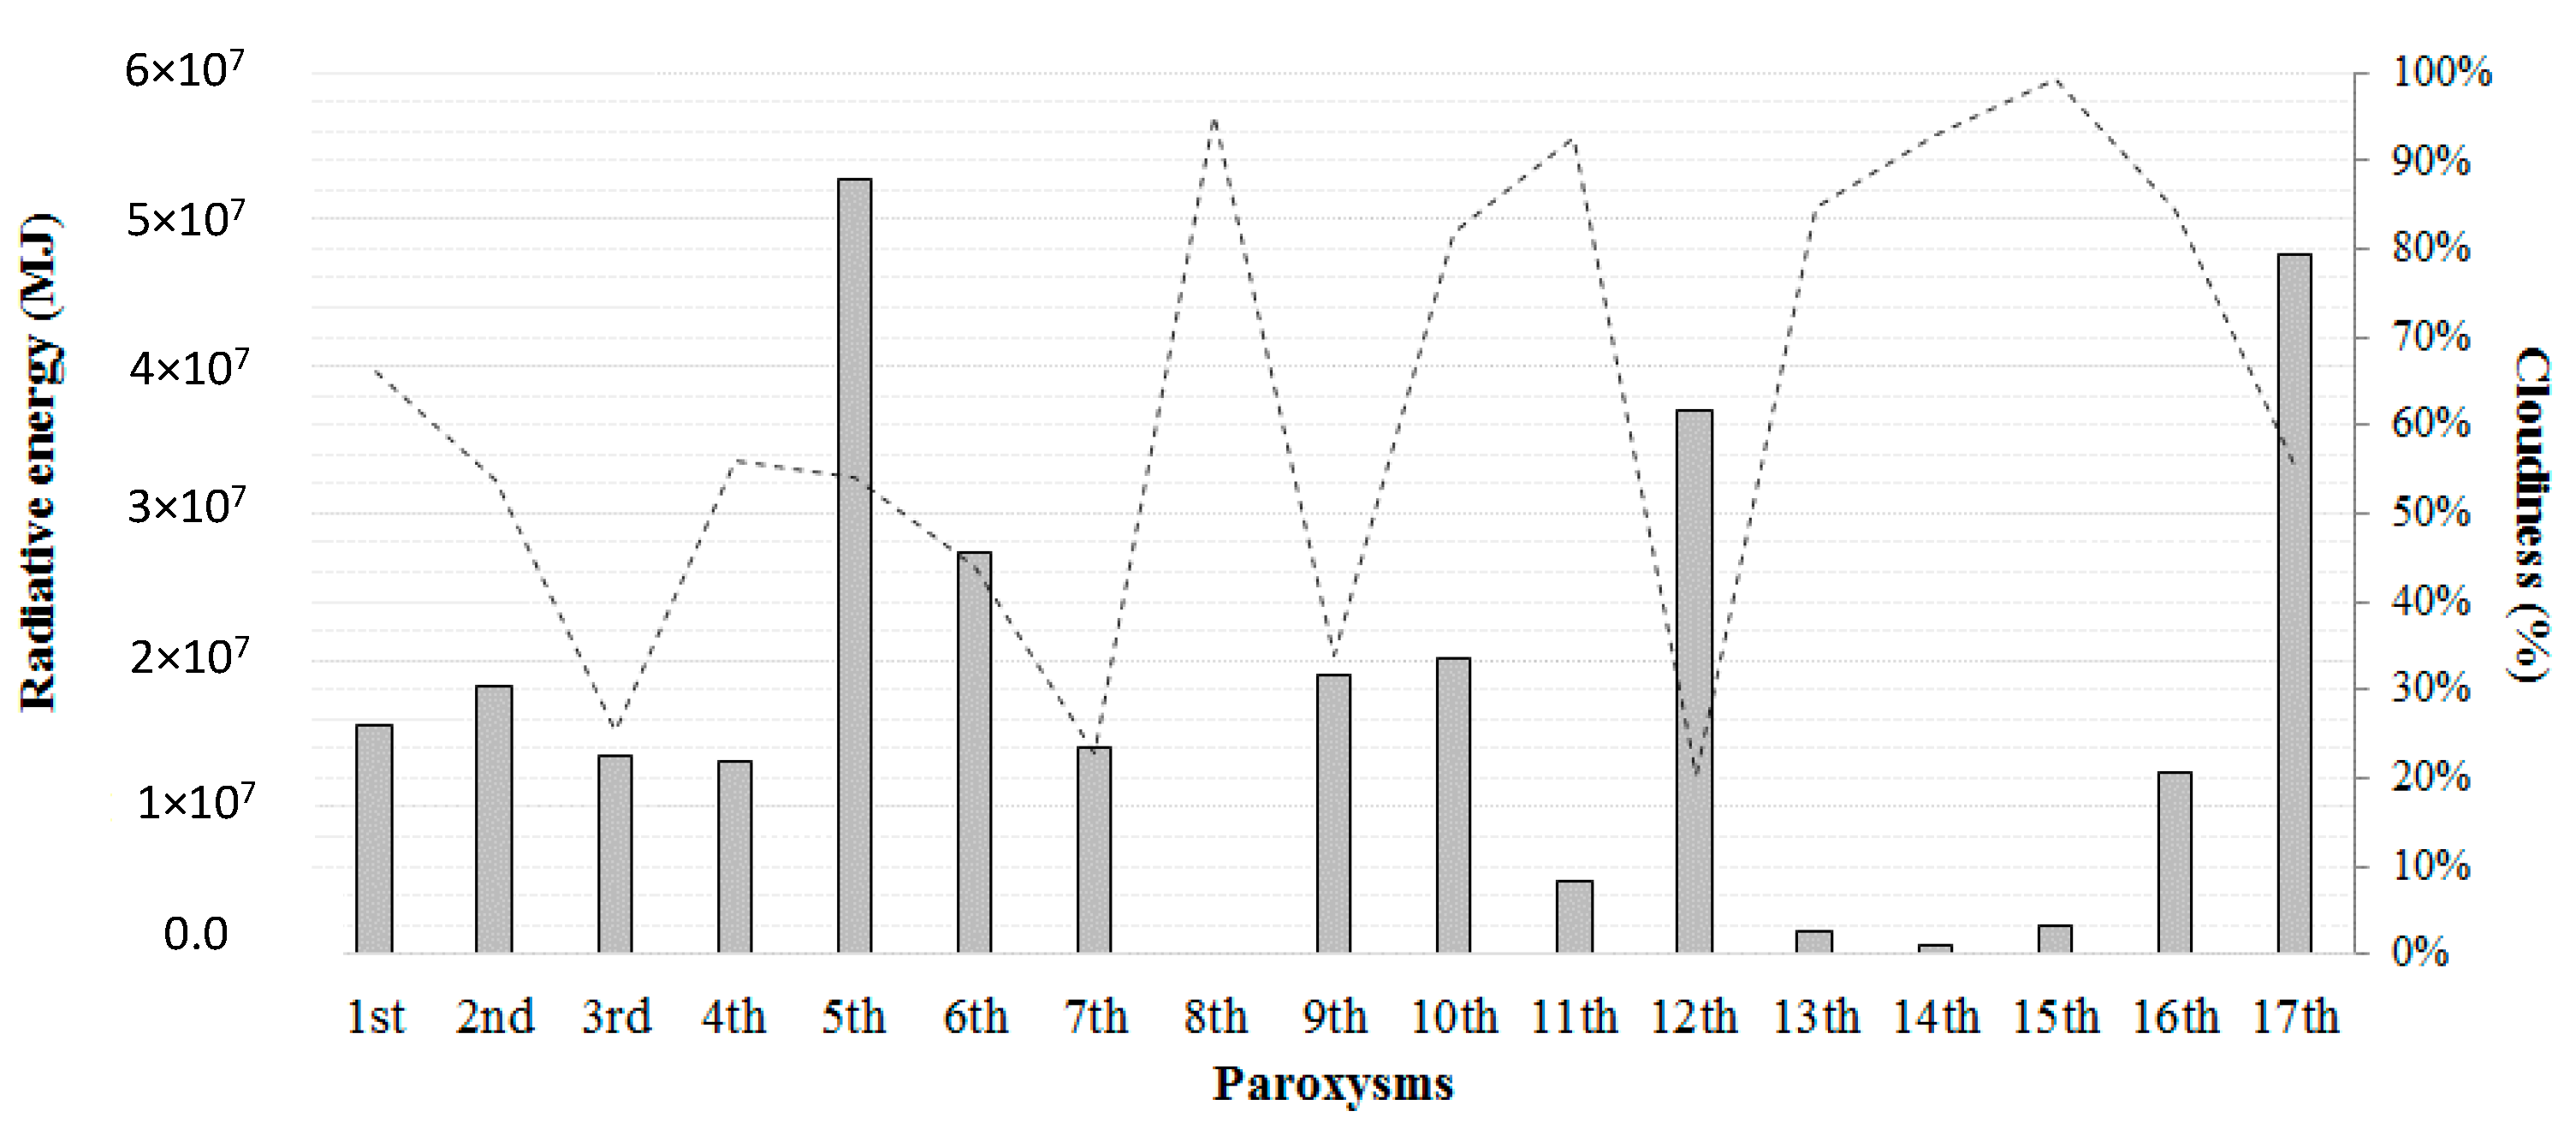
5.2. Monitoring and Quantifying Mt. Etna Paroxysms

5.2.1. AVHRR and MODIS Observations

The RSTVOLC system performs the near-real-time monitoring of Italian volcanoes through infrared AVHRR and MODIS data, directly acquired and processed at the Institute of Methodologies for Environmental Analysis (IMAA) of the National Research Council (CNR). Data integration currently guarantees up to nine satellite observations per day (AVHRR-3 data are not analysed in the daytime because of channel 3A). The system generates thermal anomaly products (i.e., maps and ASCII files), available within a few minutes after the sensing time [31], which may be delivered to the users upon request.
Figure 5 displays the temporal trend of radiative power retrieved over the period 16 February–1 April 2021, integrating results from the above-mentioned sensors, starting from the RSTVOLC detections.
The figure shows that AVHRR provided relevant information especially about the 1st, 4th, and 9th event, due to satellite overpass times fitting with the time of paroxysms. On the other hand, the other eruptive episodes (e.g., the 3rd, 8th, 12th, 15th, and 17th paroxysms), mostly occurring in the daytime, were better identified using MODIS. The integration of AVHRR and MODIS observations indicates that some eruptive events were particularly intense (see the 1st, 3rd, and 17th paroxysms). Among them, the 17th paroxysm appeared as the most powerful, with a value of radiative power reaching about 14 GW (from the daytime MODIS scene of 1 April at 09:33 UTC; see the thermal anomaly in Figure 6b). Figure 5 then shows the progressive increase/decrease in thermal volcanic activity recorded before/after some eruptive events (e.g., see the 1st and 12th paroxysms), and the identification of a subtle thermal anomaly also between the 16th and 17th paroxysms.
These results corroborate the advantages of AVHRR and MODIS data integration in monitoring Mt. Etna activity (see also [17]). Nonetheless, Figure 5 shows that some eruptive events (e.g., the 2nd, 6th, 10th, and 11th paroxysms) were monitored in a less efficient way, because of their time duration. SEVIRI data processed through the RSTVOLC algorithm enabled the promptly identification of thermal anomalies and the continuous monitoring of volcanic activity (see next section).

5.2.2. SEVIRI Observations
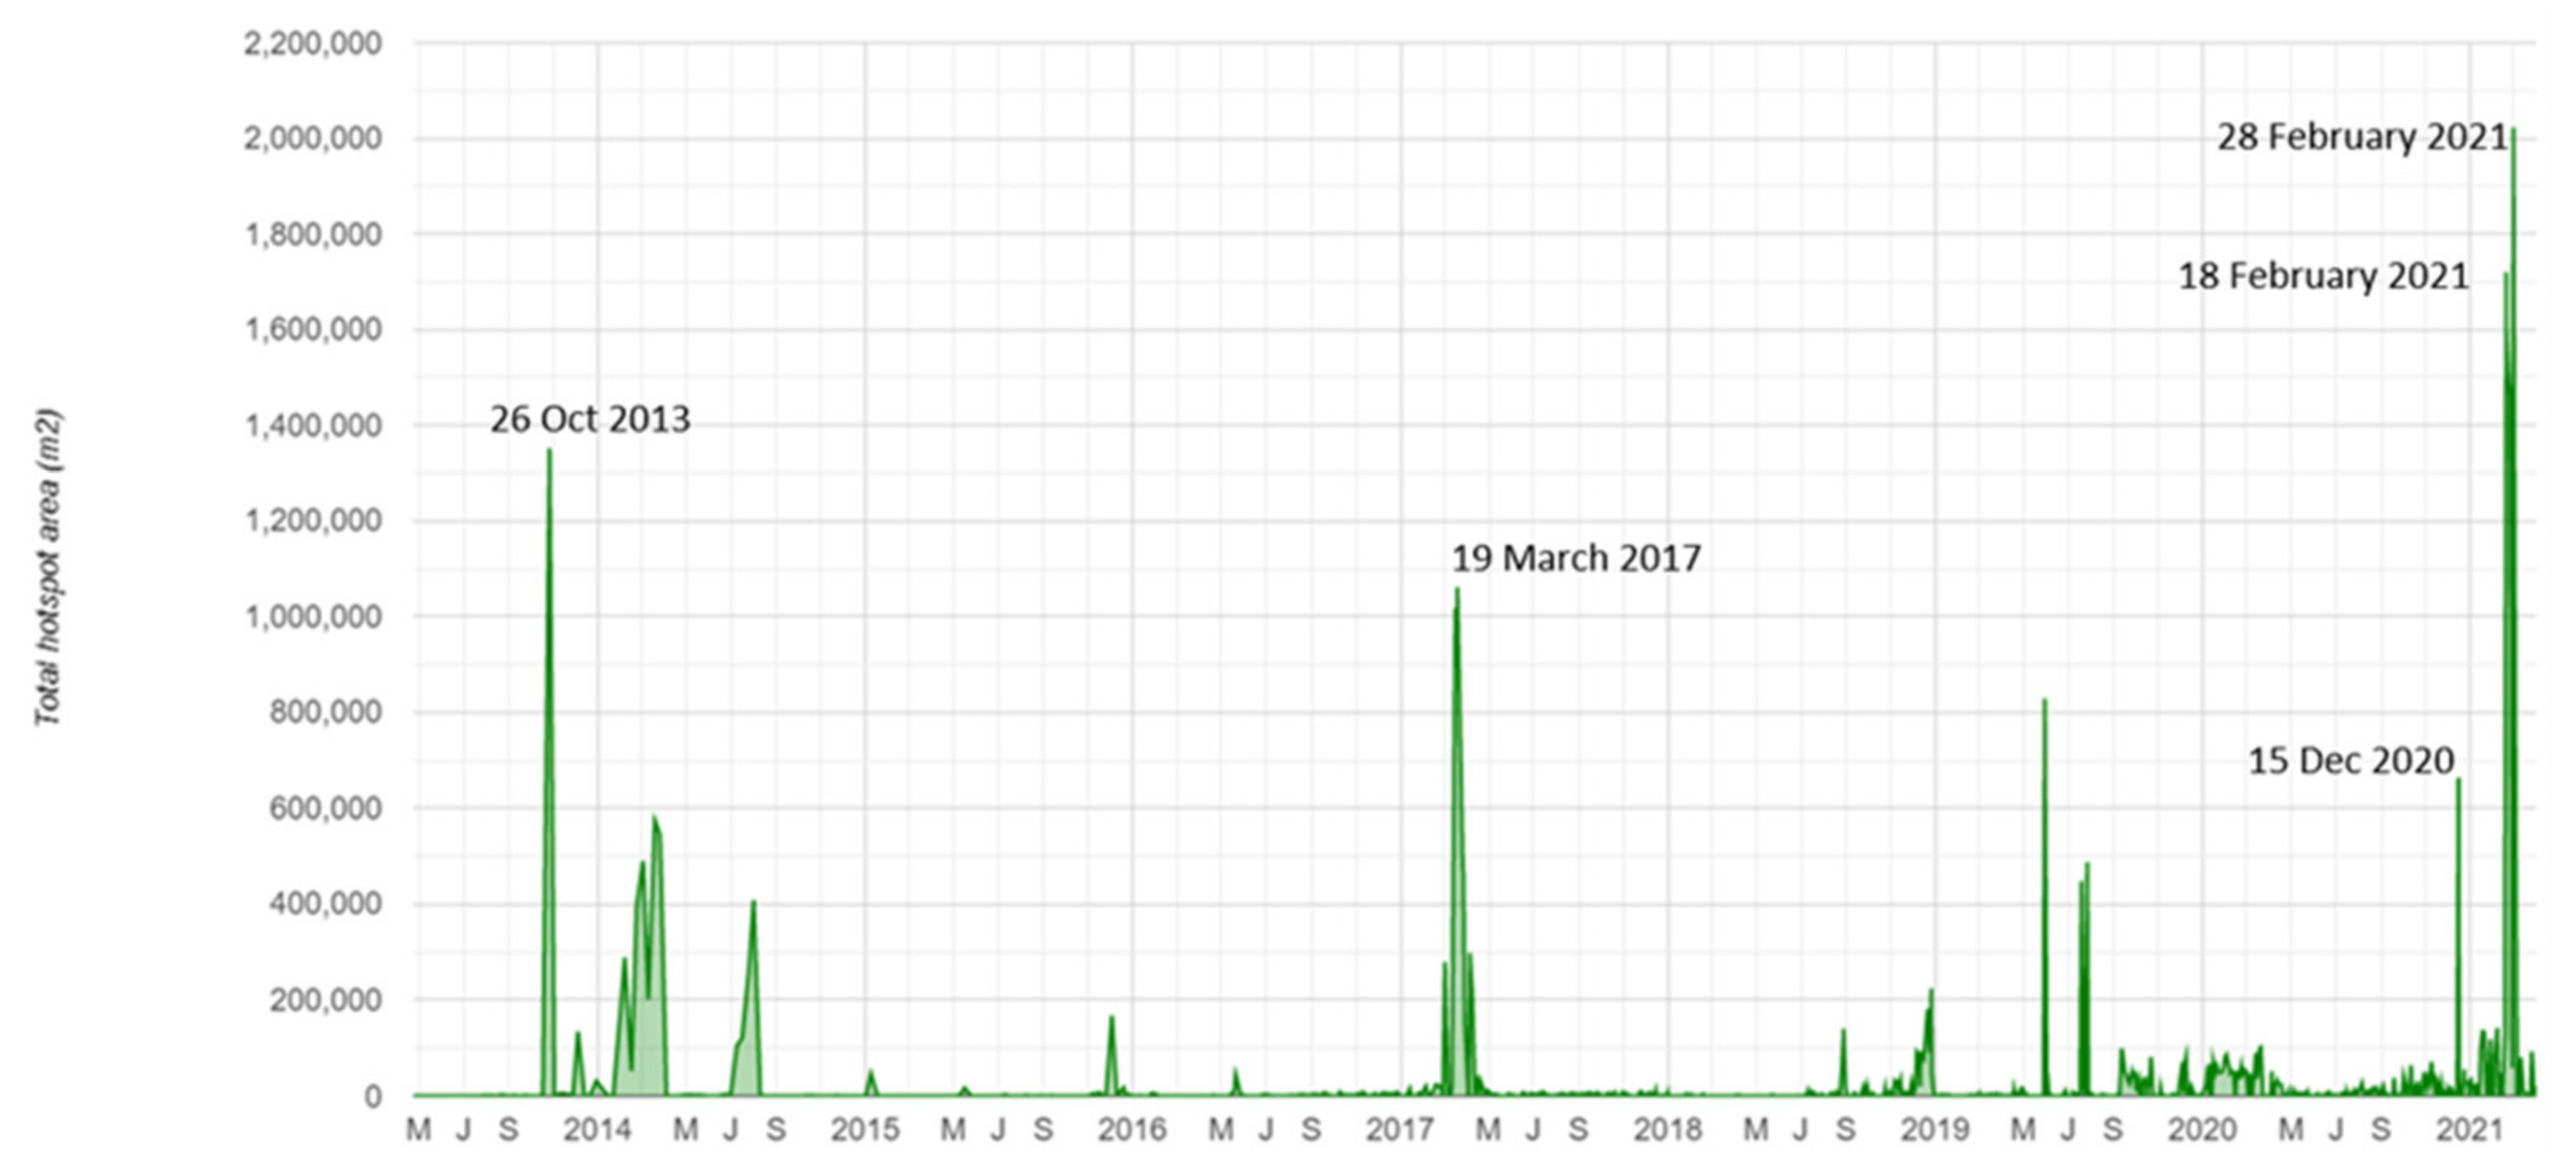
Figure 7 displays the temporal trend of radiative power retrieved from infrared SEVIRI data (at 15 min time interval; acquired at the School of Engineering of University of Basilicata) of 16 February–2 April 2021. The plot also shows the time interval of each paroxysm (in pink), and the cloudiness (grey line) retrieved using the cloud-masking procedure described in the ‘methods’ section.
The figure shows that, after the identification of a subtle thermal anomaly (≈30 MW) in the morning of 16 February (i.e., at 08:30 UTC), a first increment of the thermal volcanic activity occurred at 16:00 UTC (VRP ≈ 280 MW). One hour later, the radiative power abruptly increased up to about 3.5 GW, marking the start of the lava overflow. At 17:45 UTC, the peak of radiative power was recorded, around 4.2 GW. Lower values of this parameter were then retrieved until 17 February at 08:30 UTC due to possible lava cooling effects. From the evening of the same day (at 22:15 UTC), a moderated-to-low thermal activity occurred (VRP ≈ 238 MW), becoming suddenly more intense at 22:45 UTC (VRP ≈ 1.3 GW). The increase in thermal emissions marked the start of the second paroxysm, leading to values of radiative power up to about 5 GW, on 18 February at 01:15 UTC. Thermal volcanic activity then progressively decreased, and, from 14:30 UTC, no thermal anomaly affected the target area. A subtle thermal anomaly (≈50 MW) was then identified on 19 February at 06:15 UTC. On that day, the 3rd paroxysm occurred (between 08:45 and 08:50 UTC), with a lava fountaining activity that was recorded after a lava overflow occurring since 07:55 UTC. This paroxysm, ending at 10:10 UTC, generated a dense ash plume dispersing towards SE direction, and causing the ash-fall over Zafferana Etnea and Acireale villages [30]. Based on RSTVOLC detections, thermal anomaly of 19 February became more intense between 08:30 and 08:45 UTC, marking the start of the paroxysm. At 10:30 UTC, i.e., soon after the end of the eruptive event, volcanic radiative power was estimated around 3.8 GW. After the discontinuous identification of weak thermal activity in the morning of 20 February (between 06:00 and 08:30 UTC), a new phase of thermal unrest occurred at 21:00 UTC preceding the fourth paroxysm. Thermal anomaly, identified two days later, at 22:45 UTC, marked the start of the fifth paroxysm. The latter, based on information inferred from SEVIRI data, started at 23:30 UTC and reached the peak (≈2.8 GW) a few hours later (i.e., on 23 February at 00:45 UTC). On 24 February, RSTVOLC detected a subtle thermal anomaly between 06:00 and 07:45 UTC and at 16:30 UTC, preceding the sixth paroxysm. The latter reached the peak at 20:45 UTC. While the identification of the thermal anomaly associated with the 8th paroxysm was strongly affected by clouds (the radiative power was estimated after the end of the paroxysm), during the period 28 February at 18:15 UTC–2 March at 16:00 UTC, a short quiescence period occurred, in agreement with field observations (see Table A1).
On the other hand, another phase of thermal unrest was identified on 2 March, starting from 16:15 UTC, i.e., before the start of the ninth paroxysm. The following two events were less intense in terms of VRP (with values below 3 GW), whereas the 12th paroxysm was among the most powerful. Clouds then strongly affected the crater area, impacting on the identification of thermal anomaly associated with the 13th, 14th, and 15th paroxysms (see high cloudiness values in Figure 7). The 13th paroxysmal event started on 14 March at 20:10 UTC, with the increase in Strombolian activity at SEC. The lava fountaining occurred a few minutes after midnight and ceased by 02:43 UTC [65]. The following event (the 14th of the time series) began on 17 March when the Strombolian activity recorded at 00:30 UTC increased in intensity, changing into lava fountaining at around 02:15 UTC. The paroxysm ended at 06:00 UTC [66,67]. Explosions at SEC and the lava flow in the Valle del Bove persisted until the evening of 18 March, when weather conditions improved. The 15th paroxysm occurred on 19 March with lava fountains recorded since 08:35 UTC, lasting about 120 min. This event followed the same pattern of previous events, with the increase in volcanic tremor, a Strombolian activity evolving to lava fountains, and the lava flow emission [66].
Figure 7 shows that a subtle thermal anomaly was then identified by RSTVOLC before the 16th paroxysm. From the night of 25 March, and over more than 150 h, the system did not flag any hotspot over the target area. This quiescence period was the longest recorded between two consecutive paroxysms. Thermal anomaly detected from 31 March at 18:45 UTC marked the start of a new lava fountaining. The 17th paroxysm appeared, however, much less intense than that indicated by the analysis of infrared MODIS data (e.g., VRP ≈ 2.6 GW on 1 April at 08:45 UTC). The intensity of thermal emissions then progressively decreased, and a subtle hotspot affected the Mt. Etna area until 2 April at 07:30 UTC. This information agrees with field observations, indicating that in the late morning of 1 April, explosive activity at SEC was almost exhausted, unlike the effusive activity, which gradually ran out during the night of 1–2 April.

6. Discussion

We investigated the Mt. Etna paroxysms of February–April 2021 through a multi-platform observing system, retrieving information about location, size, shape, and relative intensity level of thermal anomalies detected by satellite.
Figure 8 displays the plot of the total hotspot area retrieved from S2-MSI and L8-OLI scenes of June 2013–March 2021 using the NHI tool. The figure shows that, although other significant thermal anomalies (e.g., 26 October 2013, 18 March 2017) affected the target area before the eruptive events investigated in this work, those associated with the paroxysms of 16–18 February 2021 were the largest in size. It should be pointed out, however, that the low temporal sampling of the analysed satellite data, such as other factors (e.g., clouds/eruptive plumes), probably affected the results of Figure 8.
Despite those limitations, L8-OLI, S2-MSI, and Terra-ASTER data allowed us to investigate also changes in thermal volcanic activity occurring at Mt. Etna. This is indicated, for instance, by the small thermal anomaly identified soon after the lava effusion of 15 December 2020 [68], becoming spatially more extended after mid-January 2021. This detection reveals a general increase in thermal volcanic activity at the summit craters about one month before the start of the first paroxysmal event of 2021 (see Figure 8).
The latter, such as the following paroxysms, was better monitored and quantified using satellite data at high temporal resolution (see Section 5.2). Indeed, especially SEVIRI data enabled the prompt identification and the continuous monitoring of thermal volcanic activity (e.g., [5,7,69]), except when clouds/plumes partially or completely obscured the target area (e.g., the 8th paroxysm). Figure 7 shows that the percentage of cloudy pixels was generally high (i.e., above 50%). Because of clouds/plumes, some eruptive events (e.g., the 8th, 11th, and 16th paroxysms) were identified later than field observations, while other paroxysms (e.g., the 13th, 14th, and 15th paroxysms) were partially identified by satellite. Clouds affected less than 30% of the analysed sub-scenes (a circle area of 12 km in radius centred over the Mt. Etna craters) when SEVIRI data were fully exploited (e.g., the 3rd and 12th paroxysm).
Regarding the radiative power, values retrieved from SEVIRI data appeared underestimated when compared to temporally coincident MODIS observations. In addition, even with filtering MODIS data for low values of the satellite zenith angle, to take the poor viewing conditions (e.g., [11,20,70,71]) into account, differences in terms of VRP recorded especially during the 17th paroxysm were particularly high (≈12.5 GW). Those differences were less significant when weak thermal activities occurred. The MIR channel saturation, having a lower impact on results from MODIS data (we used channel 21, offering a high dynamic range when channel 22 saturated) and the overestimation of cloudy pixels observed on a number of SEVIRI scenes, due to the used cloud-masking procedure, were the main factors affecting the estimates of VRP. It should be mentioned, however, that the radiative power may be underestimated also because of the digital filter and the geometric resampling applied to SEVIRI raw data before their delivery via EUMETCast [72]. An overestimation of this parameter may instead occur due to the Point Spread Function (PSP), which is so large that even a small lava flow within a single pixel may generate significant effects on the measured radiance [73]. Finally, the impact of atmospheric effects on estimates of radiative power should be also considered (e.g., we recorded an increase in VRP up to ~1 GW from SEVIRI data by setting a mean τMIR value of 0.82, for a mid-latitude winter atmosphere).
Despite those factors, SEVIRI allowed us to characterise the Mt. Etna paroxysms also in terms of radiated energy. Figure 9 displays the plot of this parameter, which was calculated by time integrating the values of radiative power for each paroxysmal event, and the mean cloudiness values (dotted line). Based on the information provided by SEVIRI, the eruptive events of 22–23 February (the 5th paroxysm) and 31 March–1 April (the 17th paroxysm) were the most energetic (the 8th paroxysm was not quantified in terms of radiated energy also because of cloudy pixel overestimation). Therefore, by combining information from MODIS (Figure 5) and SEVIRI (Figure 9) data, we can assert that the 17th paroxysm was among the most significant events and probably radiated the largest amount of energy. These results confirm the importance of using a multi-sensor approach in investigating and quantifying thermal volcanic activity.
From a volcanological point of view, between mid-February and the first days of April 2021, Mt. Etna produced 17 paroxysmal eruptions in just 44 days. Short but violent eruptions (capable of emitting a total of 40–50 million cubic meters of magma) occurred, which, on the whole, can be assimilated almost to a single eruptive event of considerable size: huge pyroclastic columns elevated over ten kilometres to the upper limit of the troposphere; lava flows 3–4 km long distributed on the east and south high flanks. Those eruptions were produced by the SEC, which doubled in size between 2011 and 2015. However, although summit eruptions are the most frequent at Mt. Etna, as shown in Figure 10, displaying the map of the areas more frequently affected by thermal anomalies retrieved from L8-OLI and S2-MSI data of 2013–2021, they do not represent the most dangerous eruptive events for this volcano.
Indeed, lateral eruptions are potentially much more dangerous, because they open vents at low altitudes, and therefore near or inside cities, generating lava flows that can destroy large urban areas in a short time [22,23]. But summit eruptions can be the prelude to lateral eruptions and must be analysed with extreme care.
After the brief but dynamically violent lateral eruption of 24–27 December 2018 [12,24,74], Etna first produced a modest and discontinuous summit activity, which increased in the second half of 2020, culminating first in almost continuous Strombolian activity at the SEC (January 2021), and then in the 17 eruptive paroxysms of February–April 2021. Numerous other paroxysmal events started from the night of 18–19 May 2021 and not yet finished at the time of writing. This is a succession of events similar to that recorded during 2000–2001 when over 70 eruptive paroxysms were the prelude to two violent and dangerous flank eruptions [75,76].
The increase in the intensity of the summit eruptions mentioned above was perfectly recorded by the set of satellite observations, at different temporal, spatial, and spectral resolutions, analysed in this work. They alerted possibly in advance of imminent phenomena and provided information also about the time duration and the energy released during the different paroxysms. Both those aspects are of great relevance for imagining the possible eruptive scenarios.

7. Conclusions

The paroxysms of 16 February–1 April 2021 were among the most intense eruptive events occurring at Mt. Etna during the last decade, as indicated by the results of this work.
The latter indicates that the 17th paroxysm, leading to values of radiative power up to about 14 GW from MODIS data (e.g., we retrieved VRP values up to 4 GW during the paroxysms of May 2016 [17]), was probably the most energetic of the time series as indicated by SEVIRI. Additionally, based on the information retrieved from L8-OLI and S2-MSI data, the 2nd and 7th paroxysm generated the largest thermal anomaly at Mt. Etna after 26 October 2013. However, this information needs to be better assessed, also because of the low temporal sampling of analysed data especially before June 2015, when S2-MSI data were not available.
This study demonstrates the efficiency of the used multi-platform system in monitoring and quantifying Mt. Etna activity, despite the impact of a number of factors (e.g., clouds/plumes, pixel saturation, satellite viewing geometry, and atmospheric effects) on the identification and mapping of volcanic thermal anomalies from space. This system may provide reliable information also about subtle phases of thermal unrest (e.g., those preceding intense eruptions), contributing to the volcanic risk mitigation also in other areas.

Author Contributions

F.M. and M.N. conceived the work; F.M. and C.F. wrote the paper; F.M., A.F., C.F., C.P., G.M., T.L., N.G., and M.F. conducted the experiments; M.N., N.P., and V.T. reviewed the paper. All authors have read and agreed to the published version of the manuscript.

Funding

This research received no external funding.

Data Availability Statement

S2-MSI, L8-OLI, and Terra-ASTER data analysed in this study are available under the Google Earth Engine platform.

Acknowledgments

The authors wish to thank EUMETSAT and the Aeronautica Militare Italiana for its support to have access to MSG-SEVIRI data used in this work.

Conflicts of Interest

The authors declare no conflict of interest.

Appendix A

Table A1. Summary of the Mt. Etna paroxysms of 16 February–1 April 2021.
Date of the Paroxysmal EventStart and End TimesEruption Features
1st (16 Feb)17:05–18:00 UTCLava fountains (duration 45 min; 500–600 m high), eruptive column (10 km a.s.l.), lava and pyroclastic flows moving towards Valle del Bove and Valle del Leone.
2nd (17–18 Feb)22:30–00:40 UTCLava fountains (duration 35 min; 600–700 m high), eruptive column and ash impact on the ESE sector, lava flow moving towards NE, SE (Valle del Bove) and SW (southern flank).
3rd (19 Feb)07:55–10:10 UTCLava fountains from 4–5 vents (duration 65 min; 600–700 m high), eruptive column (10 km a.s.l.), ash impact on the SE sector, lava flows towards E (Valle del Bove) and SW (southern flank), hydromagmatic explosions (lava–snow interaction).
4th (20–21 Feb)20:00–01:20 UTCLava fountains (duration 180 min, up to 1000 m high), eruptive column (10 km a.s.l.), ash impact on the SW sector, small (in length and volume) lava flows towards E (Valle del Bove) and SW (southern flank).
5th (22–23 Feb)20:30–10:38 UTCLava fountains (duration 50 min), Strombolian activity and lava overflow, eruptive column (more than 10 km a.s.l.), ash impact on the NW sector.
6th (24 Feb)16:00–22:20 UTCLava fountains (duration 140 min; 500 m high), eruptive column (11 km a.s.l.), lava flows towards E (Valle del Bove) and SW (southern flank).
7th (28 Feb)08:10–09:33 UTCLava fountains (duration 54 min; 700 m high), eruptive column (11 km a.s.l.), ash impact on the E sector, lava flows towards E (Valle del Bove).
8th (2 March)10:45–14:50 UTCLava fountains (duration 120 min), eruptive column (beyond clouds, up to 9 km a.s.l), ash impact on the S sector.
9th (4 March)00:20–08:30 UTCLava fountains (duration 130 min; 300 m high), eruptive column (11 km a.s.l.), ash impact on the NE sector, small lava flow, Strombolian activity at Voragine Crater.
10th (7 March)00:00–14:00 UTCLava fountains (duration 60 min), eruptive column (10 km a.s.l.), ash impact on the E sector, lava flows towards E (Valle del Bove, down to 2700 m a.s.l.).
11th (9–10 March)18:00–03:30 UTCLava fountains (duration 163 min; 500 m high), eruptive column (up to 9–10 km a.s.l.), ash impact on the E sector, lava flows towards E (Valle del Bove, down to 1770 m a.s.l.), discontinuous Strombolian activity persists even after the end of the paroxysm, until the next one.
12th (12 March)03:20–10:00 UTCLava fountains (duration 175 min; 500 m), eruptive column (up to 9–10 km a.s.l.), ash impact on the E sector, lava flows towards E (Valle del Bove), discontinuous Strombolian activity persists even after the end of the paroxysm, until the next one.
13th (14–15 March)20:10–02:50 UTCLava fountains (duration 170 min), eruptive column and ash impact on the E sector, lava flows towards E (Valle del Bove) and S (southern flank), discontinuous Strombolian activity persists even after the end of the paroxysm, until the next one.
14th (17–18 March)00:30–06:00 UTCLava fountains (duration 170 min), eruptive column and ash impact on the SE sector, lava flows towards E (Valle del Bove, down to 2200 m a.s.l.), Strombolian activity persists even after the end of the paroxysm, until the next one.
15th (19 March)06:34–11:20 UTCLava fountain (duration 120 min), eruptive column and ash impact on the ESE sector, lava flows towards E (Valle del Bove), Strombolian activity persists even after the end of the paroxysm, until the next one.
16th (23–24 March)19:05–11:55 UTCLava fountains, (duration 480 min), eruptive column (up to 6–7 km a.s.l.), ash impact on the SSO-SE sector, lava flows towards E (Valle del Bove) and S (southern flank), Strombolian activity and discontinuous lava effusions persist after the end of the paroxysm, until the next one.
17th (31 March–
1 April)
14:30–21:00 UTCThe paroxysm was preceded by an intense Strombolian activity occurring on March 30th. Lava fountains, (time duration 540 min), eruptive column (9–10 km a.s.l.), ash impact on the SSW sector, lava flows towards E, SE, SSE (Valle de Bove) and S, SW (southern flank) up to 3.3 km long down to 1820 m a.s.l.

References

  1. Higgins, J.; Harris, A. VAST: A program to locate and analyse volcanic thermal anomalies automatically from remotely sensed data. Comput. Geosci. 1997, 23, 627–645. [Google Scholar] [CrossRef]
  2. Dean, K.; Servilla, M.; Roach, A.; Foster, B.; Engle, K. Satellite monitoring of remote volcanoes improves study efforts in Alaska. Eos Trans. AGU 1998, 79, 413–423. [Google Scholar] [CrossRef]
  3. Wright, R.; Flynn, L.; Garbeil, H.; Harris, A.; Pilger, E. Automated volcanic eruption detection using MODIS. Remote Sens. Environ. 2002, 82, 135–155. [Google Scholar] [CrossRef] [Green Version]
  4. Pergola, N.; Marchese, F.; Tramutoli, V. Automated detection of thermal features of active volcanoes by means of infrared AVHRR records. Remote Sens. Environ. 2004, 93, 311–327. [Google Scholar] [CrossRef]
  5. Pergola, N.; Marchese, F.; Tramutoli, V.; Filizzola, C.; Ciampa, M. Advanced satellite technique for volcanic activity monitoring and early warning. Ann. Geophys. 2008, 51. [Google Scholar] [CrossRef]
  6. Hirn, B.; Di Bartola, C.; Ferrucci, F. Combined use of SEVIRI and MODIS for detecting, measuring, and monitoring active lava flows at erupting volcanoes. IEEE Trans. Geosci. Remote Sens. 2009, 47, 2923–2930. [Google Scholar] [CrossRef]
  7. Gouhier, M.; Harris, A.; Calvari, S.; Labazuy, P.; Guéhenneux, Y.; Donnadieu, F.; Valade, S. Lava discharge during Etna's January 2011 fire fountain tracked using MSG-SEVIRI. Bull. Volcanol. 2012, 74, 787–793. [Google Scholar] [CrossRef]
  8. Coppola, D.; Laiolo, M.; Massimetti, F.; Cigolini, C. Monitoring endogenous growth of open-vent volcanoes by balancing thermal and SO2 emissions data derived from space. Sci. Rep. 2019, 9, 1–12. [Google Scholar] [CrossRef] [Green Version]
  9. Tsutsumi, R.; Hattori, K.; Yoshino, C.; Genzano, N. Detection of Thermal Changes Related to the 2011 Shinmoedake Volcano Activity and Japan: Spatiotemporal Variation of Singularity of MODIS Data after Discriminating False Changes Due to Cloud. Remote Sens. 2020, 12, 2637. [Google Scholar] [CrossRef]
  10. Coppola, D.; Piscopo, D.; Laiolo, M.; Cigolini, C.; Delle Donne, D.; Ripepe, M. Radiative heat power at Stromboli volcano during 2000–2011: Twelve years of MODIS observations. J. Volcanol. Geotherm. Res. 2012, 215, 48–60. [Google Scholar] [CrossRef] [Green Version]
  11. Marchese, F.; Lacava, T.; Pergola, N.; Hattori, K.; Miraglia, E.; Tramutoli, V. Inferring phases of thermal unrest at Mt. Asama (Japan) from infrared satellite observations. J. Volcanol. Geotherm. Res. 2012, 237, 10–18. [Google Scholar] [CrossRef]
  12. Calvari, S.; Bilotta, G.; Bonaccorso, A.; Caltabiano, T.; Cappello, A.; Corradino, C.; Del Negro, C.; Ganci, G.; Neri, M.; Pecora, E.; et al. The VEI 2 Christmas 2018 Etna Eruption: A Small But Intense Eruptive Event or the Starting Phase of a Larger One? Remote Sens. 2020, 12, 905. [Google Scholar] [CrossRef] [Green Version]
  13. Murphy, S.W.; Wright, R.; Oppenheimer, C.; Souza Filho, C.R. MODIS and ASTER synergy for characterizing thermal volcanic activity. Remote Sens. Environ. 2013, 131, 195–205. [Google Scholar] [CrossRef]
  14. Ramsey, M.S. Synergistic use of Satellite Thermal Detection and Science: A Decadal Perspective using ASTER. In Detecting, Modelling and Responding to Effusive Eruptions; Harris, A., De Groeve, T., Garel, F., Carn, S., Eds.; Geological Society of London: London, UK, 2016; pp. 115–136. [Google Scholar] [CrossRef] [Green Version]
  15. Ramsey, M.S.; Flynn, I.T. The spatial and spectral resolution of ASTER infrared image data: A paradigm shift in volcanological remote sensing. Remote Sens. 2020, 12, 738. [Google Scholar] [CrossRef] [Green Version]
  16. Flower, V.J.; Kahn, R.A. Twenty years of NASA-EOS multi-sensor satellite observations at Kīlauea volcano (2000–2019). J. Volcanol. Geotherm. Res. 2021, 415, 107247. [Google Scholar] [CrossRef]
  17. Marchese, F.; Neri, M.; Falconieri, A.; Lacava, T.; Mazzeo, G.; Pergola, N.; Tramutoli, V. The contribution of multi-sensor infrared satellite observations to monitor Mt. Etna (Italy) activity during May to August 2016. Remote Sens. 2018, 10, 1948. [Google Scholar] [CrossRef] [Green Version]
  18. Massimetti, F.; Diego, C.; Marco, L.; Sébastien, V.; Cigolini, C.; Ripepe, M. Volcanic Hot-Spot Detection Using SENTINEL-2: A Comparison with MODIS–MIROVA Thermal Data Series. Remote Sens. 2020, 12, 820. [Google Scholar] [CrossRef] [Green Version]
  19. Plank, S.; Marchese, F.; Genzano, N.; Nolde, M.; Martinis, S. The short life of the volcanic island New Late’iki (Tonga) analyzed by multi-sensor remote sensing data. Sci. Rep. 2020, 10, 1–15. [Google Scholar] [CrossRef]
  20. Plank, S.; Massimetti, F.; Soldati, A.; Hess, K.U.; Nolde, M.; Martinis, S.; Dingwell, D.B. Estimates of lava discharge rate of 2018 Kīlauea Volcano, Hawaiʻi eruption using multi-sensor satellite and laboratory measurements. Int. J. Remote Sens. 2021, 42, 1492–1511. [Google Scholar] [CrossRef]
  21. Acocella, V.; Neri, M. What makes flank eruptions? The 2001 Etna eruption and its possible triggering mechanisms. Bull. Volcanol. 2003, 65, 517–529. [Google Scholar] [CrossRef]
  22. Neri, M.; Acocella, V.; Behncke, B.; Giammanco, S.; Mazzarini, F.; Rust, D. Structural analysis of the eruptive fissures at Mount Etna (Italy). Ann. Geophys. 2011, 54. [Google Scholar] [CrossRef]
  23. Del Negro, C.; Cappello, A.; Neri, M.; Bilotta, G.; Hérault, A.; Ganci, G. Lava flow hazards at Mount Etna: Constraints imposed by eruptive history and numerical simulations. Sci. Rep. 2013, 3, 3493. [Google Scholar] [CrossRef] [Green Version]
  24. De Beni, E.; Cantarero, M.; Neri, M.; Messina, A. Lava flows of Mt Etna, Italy: The 2019 eruption within the context of the last two decades (1999–2019). J. Maps 2020. [Google Scholar] [CrossRef]
  25. Global Volcanism Program, Bulletin of the Global Volcanism Network, Report on Etna (Italy); Smithsonian Institution: Washington, DC, USA, 2013. [CrossRef]
  26. Behncke, B.; Neri, M.; Pecora, E.; Zanon, V. The exceptional activity and growth of the Southeast Crater, Mount Etna (Italy), between 1996 and 2001. Bull. Volcanol. 2006, 69, 149–173. [Google Scholar] [CrossRef]
  27. De Beni, E.; Behncke, B.; Branca, S.; Nicolosi, I.; Carluccio, R.; Caracciolo, F.A.; Chiappini, M. The continuing story of Etna's New Southeast Crater (2012–2014): Evolution and volume calculations based on field surveys and aerophotogrammetry. J. Volcanol. Geotherm. Res. 2015, 303, 175–186. [Google Scholar] [CrossRef]
  28. Giuffrida, M.; Viccaro, M. Three years (2011–2013) of eruptive activity at Mt. Etna: Working modes and timescales of the modern volcano plumbing system from micro-analytical studies of crystals. Earth-Sci. Rev. 2017, 171, 289–322. [Google Scholar] [CrossRef]
  29. Corsaro, R.A.; Andronico, D.; Behncke, B.; Branca, S.; Caltabiano, T.; Ciancitto, F.; Cristaldi, A.; De Beni, E.; La Spina, A.; Lodato, L.; et al. Monitoring the December 2015 summit eruptions of Mt. Etna (Italy): Implications on eruptive dynamics. J. Volcanol. Geotherm. Res. 2017, 341, 53–69. [Google Scholar] [CrossRef]
  30. Istituto Nazionale di Geofisica e Vulcanologia. Bollettino Settimanale Etna, 15/02/2021–21/02/2021. Publication Date: 23/02/2021. Available online: https://www.ct.ingv.it/index.php/monitoraggio-e-sorveglianza/prodotti-del-monitoraggio/bollettini-settimanali-multidisciplinari/473-bollettino-settimanale-sul-monitoraggio-vulcanico-geochimico-e-sismico-del-vulcano-etna20210223/file (accessed on 23 June 2021). (In Italian).
  31. Pergola, N.; Coviello, I.; Filizzola, C.; Lacava, T.; Marchese, F.; Paciello, R.; Tramutoli, V. A Review of RSTVOLC, An Original Algorithm for Automatic Detection and Near-Real-Time Monitoring of Volcanic Hotspots from Space. In Detecting, Modelling and Responding to Effusive Eruptions; Harris, A., De Groeve, T., Garel, F., Carn, S., Eds.; Geological Society of London: London, UK, 2016; pp. 55–72. [Google Scholar] [CrossRef]
  32. Genzano, N.; Marchese, F.; Neri, M.; Pergola, N.; Tramutoli, V. Implementation of Robust Satellite Techniques for Volcanoes on ASTER Data under the Google Earth Engine Platform. Appl. Sci. 2021, 11, 4201. [Google Scholar] [CrossRef]
  33. Genzano, N.; Pergola, N.; Marchese, F. A Google Earth Engine tool to investigate, map and monitor volcanic thermal anomalies at global scale by means of mid-high spatial resolution satellite data. Remote Sens. 2020, 12, 3232. [Google Scholar] [CrossRef]
  34. Neri, M.; Rivalta, E.; Maccaferri, F.; Acocella, V.; Cirrincione, R. Etnean and Hyblean volcanism shifted away from the Malta Escarpment by crustal stresses. Earth Planet Sci. Lett. 2018, 486, 15–22. [Google Scholar] [CrossRef] [Green Version]
  35. Corsaro, R.; Miraglia, L. Lapilli e ceneri: Il magma primitivo dell’Etna non ha segreti. Blog INGVvulcani 2021. Available online: https://ingvvulcani.com/2021/02/22/lapilli-e-ceneri-il-magma-primitivo-delletna-non-ha-segreti/ (accessed on 23 June 2021). (In Italian).
  36. European Space Agency. About AVHRR/3. Available online: http://www.esa.int/Applications/Observing_the_Earth/Meteorological_missions/MetOp/About_AVHRR_3 (accessed on 23 June 2021).
  37. Schmid, J. The SEVIRI Instrument. 2000. Available online: https://www-cdn.eumetsat.int/files/2020-04/pdf_ten_msg_seviri_instrument.pdf (accessed on 23 June 2021).
  38. Roy, D.P.; Kovalskyy, V.; Zhang, H.K.; Vermote, E.F.; Yan, L.; Kumar, S.S.; Egorov, A. Characterization of Landsat-7 to Landsat-8 reflective wavelength and normalized difference vegetation index continuity. Remote Sens. Environ. 2016, 185, 57–70. [Google Scholar] [CrossRef] [PubMed] [Green Version]
  39. Martimort, P.; Fernandez, V.; Kirschner, V.; Isola, C.; Meygret, A. Sentinel-2 MultiSpectral imager (MSI) and calibration/validation. In Proceedings of the IEEE International Geoscience and Remote Sensing Symposium, Munich, Germany, 22–27 July 2012; pp. 6999–7002. [Google Scholar] [CrossRef]
  40. Marchese, F.; Filizzola, C.; Genzano, N.; Mazzeo, G.; Pergola, N.; Tramutoli, V. Assessment and improvement of a robust satellite technique (RST) for thermal monitoring of volcanoes. Remote Sens. Environ. 2011, 115, 1556–1563. [Google Scholar] [CrossRef]
  41. Tramutoli, V. Robust satellite techniques (RST) for natural and environmental hazards monitoring and mitigation: Theory and applications. In Proceedings of the International Workshop on the Analysis of Multi-temporal Remote Sensing Images, Leuven, Belgium, 18–20 July 2007. [Google Scholar] [CrossRef]
  42. Cuomo, V.; Filizzola, C.; Pergola, N.; Pietrapertosa, C.; Tramutoli, V. A self-sufficient approach for GERB cloudy radiance detection. Atmos. Res. 2004, 72, 39–56. [Google Scholar] [CrossRef]
  43. Filizzola, C.; Corrado, R.; Marchese, F.; Mazzeo, G.; Paciello, R.; Pergola, N.; Tramutoli, V. RST-FIRES, an exportable algorithm for early-fire detection and monitoring: Description, implementation, and field validation in the case of the MSG-SEVIRI sensor. Remote Sens. Environ. 2017, 192, e2–e25. [Google Scholar] [CrossRef]
  44. Marchese, F.; Genzano, N.; Neri, M.; Falconieri, A.; Mazzeo, G.; Pergola, N. A Multi-channel algorithm for mapping volcanic thermal anomalies by means of Sentinel-2 MSI and Landsat-8 OLI data. Remote Sens. 2019, 11, 2876. [Google Scholar] [CrossRef] [Green Version]
  45. Mazzeo, G.; Ramsey, M.S.; Marchese, F.; Genzano, N.; Pergola, N. Implementation of the NHI (Normalized Hot Spot Indices) Algorithm on Infrared ASTER Data: Results and Future Perspectives. Sensors 2021, 21, 1538. [Google Scholar] [CrossRef]
  46. National Aeronautics and Space Administration, Jet Propulsion Laboratory, ASTER–Advanced Spaceborne Thermal Emission and Reflection Radiometer. Available online: https://asterweb.jpl.nasa.gov/swir-alert.asp (accessed on 23 June 2021).
  47. Liu, Y.; Zhi, W.; Xu, B.; Xu, W.; Wu, W. Detecting high-temperature thermal anomalies from Sentinel-2 MSI images. ISPRS J. Photogramm. Remote Sens. 2021, 177, 174–193. [Google Scholar] [CrossRef]
  48. Harris, A.J.; Blake, S.; Rothery, D.A.; Stevens, N.F. A chronology of the 1991 to 1993 Mount Etna eruption using advanced very high resolution radiometer data: Implications for realtime thermal volcano monitoring. J. Geophys. Res. Solid Earth 1997, 102, 7985–8003. [Google Scholar] [CrossRef]
  49. Piscini, A.; Lombardo, V. Volcanic hot spot detection from optical multispectral remote sensing data using artificial neural networks. Geophys. J. Int. 2014, 196, 1525–1535. [Google Scholar] [CrossRef] [Green Version]
  50. Buongiorno, M.F.; Realmuto, V.J.; Doumaz, F. Recovery of spectral emissivity from thermal infrared multispectral scanner imagery acquired over a mountainous terrain: A case study from Mount Etna Sicily. Remote Sens. Environ. 2002, 79, 123–133. [Google Scholar] [CrossRef]
  51. Wooster, M.J.; Zhukov, B.; Oertel, D. Fire radiative energy for quantitative study of biomass burning from the BIRD experimental satellite and comparison to MODIS fire products. Remote Sens. Environ. 2003, 86, 83–107. [Google Scholar] [CrossRef]
  52. Wooster, M.J.; Roberts, G.; Perry, G.L.W.; Kaufman, Y.J. Retrieval of biomass combustion rates and totals from fire radiative power observations: FRP derivation and calibration relationships between biomass consumption and fire radiative energy release. J. Geophys. Res. 2005, 110. [Google Scholar] [CrossRef]
  53. Li, F.; Zhang, X.; Kondragunta, S.; Csiszar, I. Comparison of fire radiative power estimates from VIIRS and MODIS observations. J. Geophys. Res. Atmos. 2018, 123, 4545–4563. [Google Scholar] [CrossRef]
  54. Giglio, L.; Schroeder, W.; Hall, J.V.; Justice, C.O. MODIS Collection 6 Active Fire Product User’s Guide, Revision B. 2018. Available online: https://modis-fire.umd.edu/files/MODIS_C6_Fire_User_Guide_B.pdf (accessed on 23 June 2021).
  55. Giglio, L.; Schroeder, W.; Justice, C.O. The collection 6 MODIS active fire detection algorithm and fire products. Remote Sens. Environ. 2016, 178, 31–41. [Google Scholar] [CrossRef] [Green Version]
  56. Coppola, D.; Laiolo, M.; Cigolini, C.; Massimetti, F.; Delle Donne, D.; Ripepe, M.; Arias, H.; Barsotti, S.; Bucarey Parra, C.; Centeno, R.G.; et al. Thermal remote sensing for global volcano monitoring: Experiences from the MIROVA system. Front. Earth Sci. 2020, 7, 362. [Google Scholar] [CrossRef] [Green Version]
  57. Global Volcanism Program. Report on Etna (Italy). Weekly Volcanic Activity Report; Sennert, S.K., Ed.; Smithsonian Institution and US Geological Survey: Washington, DC, USA 17–23 February 2021. Available online: https://volcano.si.edu/showreport.cfm?doi=GVP.WVAR20210217-211060 (accessed on 23 June 2021).
  58. Istituto Nazionale di Geofisica e Vulcanologia. Bollettino Settimanale Etna, 22/02/2021–28/02/2021. Publication Date: 02/03/2021. Available online: https://www.ct.ingv.it/index.php/monitoraggio-e-sorveglianza/prodotti-del-monitoraggio/bollettini-settimanali-multidisciplinari/474-bollettino-settimanale-sul-monitoraggio-vulcanico-geochimico-e-sismico-del-vulcano-etna20210302/file (accessed on 23 June 2021). (In Italian).
  59. Istituto Nazionale di Geofisica e Vulcanologia. Bollettino Settimanale Etna, 01/03/2021–07/03/2021. Publication Date: 09/03/2021. Available online: https://www.ct.ingv.it/index.php/monitoraggio-e-sorveglianza/prodotti-del-monitoraggio/bollettini-settimanali-multidisciplinari/476-bollettino-settimanale-sul-monitoraggio-vulcanico-geochimico-e-sismico-del-vulcano-etna20210309/file (accessed on 23 June 2021). (In Italian).
  60. Istituto Nazionale di Geofisica e Vulcanologia. Etna, 9–10 Marzo 2021. Undicesimo Parossismo del Vulcano. Available online: https://www.ingv.it/it/stampa-e-urp/stampa/comunicati-stampa/4784-etna-9-10-marzo-2021-undicesimo-parossismo-del-vulcano (accessed on 23 June 2021). (In Italian).
  61. Istituto Nazionale di Geofisica e Vulcanologia. Etna, 12 Marzo 2021. Dodicesimo Parossismo del Vulcano. Available online: https://www.ingv.it/it/stampa-e-urp/stampa/comunicati-stampa/4786-etna-12-marzo-2021-dodicesimo-parossismo-del-vulcano (accessed on 23 June 2021). (In Italian).
  62. Global Volcanism Program. Report on Etna (Italy). Weekly Volcanic Activity Report; Sennert, S.K., Ed.; Smithsonian Institution and US Geological Survey: Washington, DC, USA 17–23 February 2021. Available online: https://volcano.si.edu/showreport.cfm?doi=GVP.WVAR20210317-211060 (accessed on 23 June 2021).
  63. Istituto Nazionale Geofisica e Vulcanologia. Etna, 23–24 Marzo 2021. Sedicesimo Parossismo al Cratere di Sud-Est. Available online: https://ingvvulcani.com/2021/03/24/etna-23-24-marzo-2021-sedicesimo-parossismo-al-cratere-di-sud-est/ (accessed on 23 June 2021). (In Italian).
  64. Global Volcanism Program. Report on Etna (Italy). Weekly Volcanic Activity Report; Sennert, S.K., Ed.; Smithsonian Institution and US Geological Survey: Washington, DC, USA 31 March 2021–6 April 2021. Available online: https://volcano.si.edu/showreport.cfm?doi=GVP.WVAR20210331-211060 (accessed on 23 June 2021).
  65. Istituto Nazionale di Geofisica e Vulcanologia. Bollettino settimanale Etna, 15/03/2021–21/03/2021. Publication date: 23/03/2021. Available online: https://www.ct.ingv.it/index.php/monitoraggio-e-sorveglianza/prodotti-del-monitoraggio/bollettini-settimanali-multidisciplinari/480-bollettino-settimanale-sul-monitoraggio-vulcanico-geochimico-e-sismico-del-vulcano-etna20210323/file (accessed on 23 June 2021). (In Italian).
  66. Volcano Discovery. Etna Volcano–Eruption Update. Available online: https://www.volcanodiscovery.com/etna/current-activity.html (accessed on 23 June 2021).
  67. Istituto Nazionale di Geofisica e Vulcanologia. Etna 19 Marzo 2021, il Quindicesimo Parossismo in un Mese. Available online: https://ingvvulcani.com/2021/03/19/etna-19-marzo-2021-il-quindicesimo-parossismo-in-un-mese/ (accessed on 23 June 2021). (In Italian).
  68. Behncke, B. Etna parossismo al cratere di Sud Est nel giorno di Santa Lucia. Blog INGVvulcani 2020. Available online: https://ingvvulcani.com/2020/12/15/etna-parossismo-al-cratere-di-sud-est-nel-giorno-di-santa-lucia/ (accessed on 23 June 2021).
  69. Ganci, G.; Cappello, A.; Bilotta, G.; Herault, A.; Zago, V.; Del Negro, C. Mapping volcanic deposits of the 2011–2015 Etna eruptive events using satellite remote sensing. Front. Earth Sci. 2018, 6, 83. [Google Scholar] [CrossRef]
  70. Coppola, D.; James, M.R.; Staudacher, T.; Cigolini, C. A comparison of field-and satellite-derived thermal flux at Piton de la Fournaise: Implications for the calculation of lava discharge rate. Bull. Volcanol. 2010, 72, 341–356. [Google Scholar] [CrossRef]
  71. Harris, A.; De Groeve, T.; Garel, F.; Carn, S. Detecting, Modelling and Responding to Effusive Eruptions; Geological Society of London: London, UK, 2016; p. 426. [Google Scholar] [CrossRef]
  72. Wooster, M.J.; Roberts, G.; Freeborn, P.H.; Xu, W.; Govaerts, Y.; Beeby, R.; He, J.; Lattanzio, A.; Fisher, D.; Mullen, R. LSA SAF meteosat FRP products—Part 1: Algorithms, product contents and analysis. Atmos. Chem. Phys. 2015, 15, 13217–13239. [Google Scholar] [CrossRef] [Green Version]
  73. Barnie, T.; Oppenheimer, C. Extracting High Temperature Event radiance from satellite images and correcting for saturation using Independent Component Analysis. Remote Sens. Environ. 2015, 158, 56–68. [Google Scholar] [CrossRef] [Green Version]
  74. De Novellis, V.; Atzori, S.; De Luca, C.; Manzo, M.; Valerio, E.; Bonano, M.; Cardaci, C.; Castaldo, R.; Di Bucci, D.; Manunta, M.; et al. DInSAR analysis and analytical modeling of Mount Etna displacements: The December 2018 volcano-tectonic crisis. Geophys. Res. Lett. 2019, 46, 5817–5827. [Google Scholar] [CrossRef] [Green Version]
  75. Allard, P.; Behncke, B.; D’Amico, S.; Neri, M.; Gambino, S. Mount Etna 1993–2005: Anatomy of an Evolving Eruptive Cycle. Earth-Sci. Rev. 2006, 78, 85–114. [Google Scholar] [CrossRef]
  76. Neri, M.; Casu, F.; Acocella, V.; Solaro, G.; Pepe, S.; Berardino, P.; Sansosti, E.; Caltabiano, T.; Lundgren, P.; Lanari, R. Deformation and eruptions at Mt. Etna (Italy): A lesson from 15 years of observations. Geophys. Res. Lett. 2009, 36, L02309. [Google Scholar] [CrossRef]
Figure 1. Mt. Etna (Sicily, Italy) geographic location.
Remotesensing 13 03074 g001
Figure 2. 16 February 2021, h:16:32–16:55 UTC (17:32–17:55 local time); shooting of the first paroxysmal eruption of Etna in the period February–April 2021, captured from north-east. (a) The jets of incandescent magma are expelled above the eruptive vent up to 300–400 m high, while the dark eruptive cloud expands to the east. (b) In the lower centre, the lava overflows erupted from the Southeast Crater can be seen. Photos by Giò Giusa.
Remotesensing 13 03074 g002
Figure 3. Thermal anomaly maps generated using the NHI tool (red/yellow pixels) and the RASTer (orange pixels) system. Maps show the thermal anomaly at the summit craters, and the detected lava flows associated with paroxysms at SEC.
Remotesensing 13 03074 g003
Figure 4. Temporal trend of the total hotspot area (m2) retrieved using NHI tool, by integrating L8-OLI and S2-MSI observations over the period 1 February–4 April 2021, with the indication of the relative paroxysm.
Remotesensing 13 03074 g004
Figure 5. Temporal trend of radiative power retrieved from AVHRR (mean value from two end-members) and MODIS observations, starting from RSTVOLC detections, with the indication of the Mt. Etna paroxysms.
Remotesensing 13 03074 g005
Figure 6. (a) Thermal anomaly map automatically generated at IMAA-CNR from the night-time AVHRR overpass of 16 February at 20:51 UTC (i.e., after the end of the 1st paroxysm), red and yellow pixels, respectively, indicate the areas where thermal emissions were stronger or less intense; (b) The thermal anomaly (in red) detected by RSTVOLC over the Mt. Etna area on the daytime MODIS scene of 1 April at 09:33 UTC (channel 22 in the background) leading to the peak of radiative power in Figure 5.
Remotesensing 13 03074 g006
Figure 7. Temporal trend of VRP retrieved from SEVIRI (in black) data (at 15 min time interval) starting from RSTVOLC detections with the indication of the number of the Mt. Etna paroxysms. Paroxysms’ time duration (light pink bars) and cloudiness percentage (light grey line) are represented as well.
Remotesensing 13 03074 g007
Figure 8. Plot of hotspot area generated through the NHI tool, integrating L8-OLI (from April 2013 onwards) and S2-MSI observations (from June 2015 onwards).
Remotesensing 13 03074 g008
Figure 9. Radiative energy retrieved from infrared SEVIRI data of 16 February–1 April 2021 with the indication of paroxysms and cloudiness (dotted line).
Remotesensing 13 03074 g009
Figure 10. Map of the areas affected by thermal anomalies (number of L8-OLI and S2-MSI scenes) at Mt. Etna, generated by analysing satellite data of 2013–2021 through the NHI algorithm, under the GEE platform. Google terrain is in the background. Note the highest values (from red to purple) retrieved over summit craters and the Valle del Bove.
Remotesensing 13 03074 g010
Table 1. Satellite data used in this work, key use of each exploited band, spatial resolution, hotspot detection algorithm.
SatelliteSensorUsed Spectral Bands
(Wavelength Range in µm)
Band Key UseSpatial
Resolution
(Nadir)
Hotspot Detection Algorithm
Terra/AquaMODIS1 (0.620–0.670)
21/22 (3.929–3.989)
31 (10.780–11.280)
32 (11.770–12.270)
Cloud detection
Hotspot detection
Hotspot detection
Cloud detection
1 kmRSTVOLC
NOAA/MetOpAVHRR1 (0.58–0.68)
3B (3.55–3.93)
4 (10.5–11.5)
Cloud detection
Hotspot detection
Cloud/hotspot detection
1.1 kmRSTVOLC
MSGSEVIRI1 (0.56–0.71)
4 (3.48–4.36)
9 (9.8–11.8)
Cloud detection
Hotspot detection
Cloud/hotspot detection
3 kmRSTVOLC
TerraASTER12 (8.925–9.275)
13 (10.250–10.950)
Hotspot detection
Cloud/hotspot detection
90 mRASTer
Landsat-8OLI5 (0.851–0.879)
6 (1.566–1.651)
7 (2.107–2.)
Hotspot detection30 mNHI
Sentinel-2MSI8A (0.854–0.875)
11 (1.568–1.659)
12 (2.115–2.290)
Hotspot detection20 mNHI
Table 2. Sensor-dependent constants [51,52,53].
Sensora × 10–9 (Wm–2sr–1µm–1K–4)
SEVIRI3.06
MODIS3.0
Publisher’s Note: MDPI stays neutral with regard to jurisdictional claims in published maps and institutional affiliations.

