
Forest Habitat Fragmentation in Mountain Protected Areas Using Historical Corona KH-9 and Sentinel-2 Satellite Imagery

 , ,
, ,  , , and
Abstract
:
1. Introduction
2. Materials and Methods
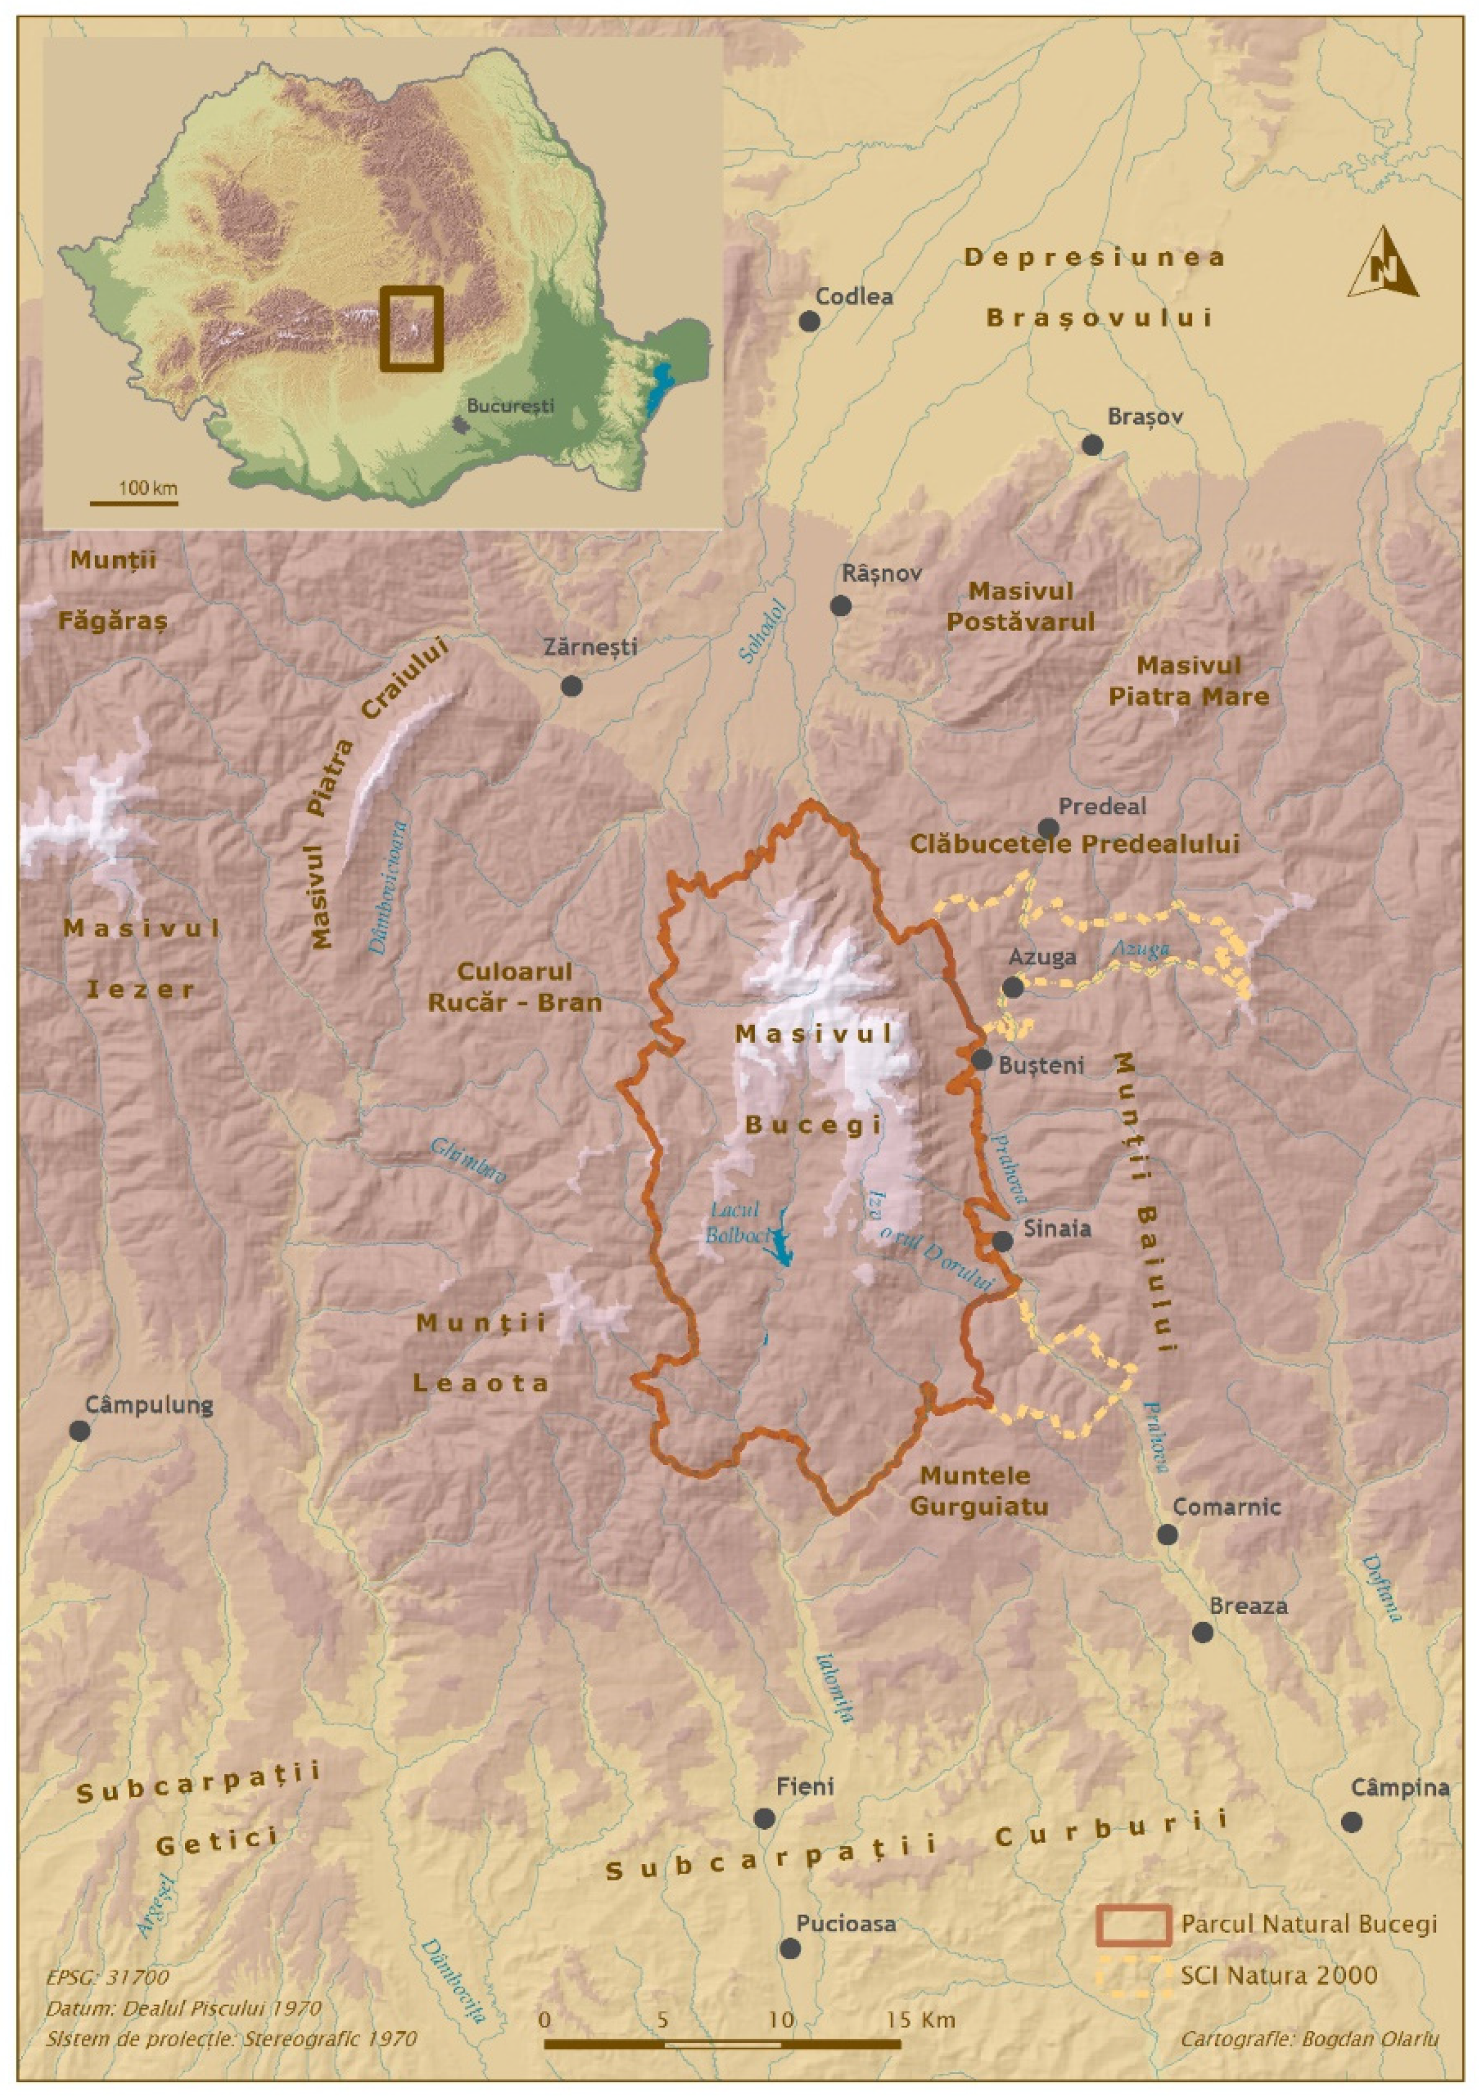
2.1. Study Area
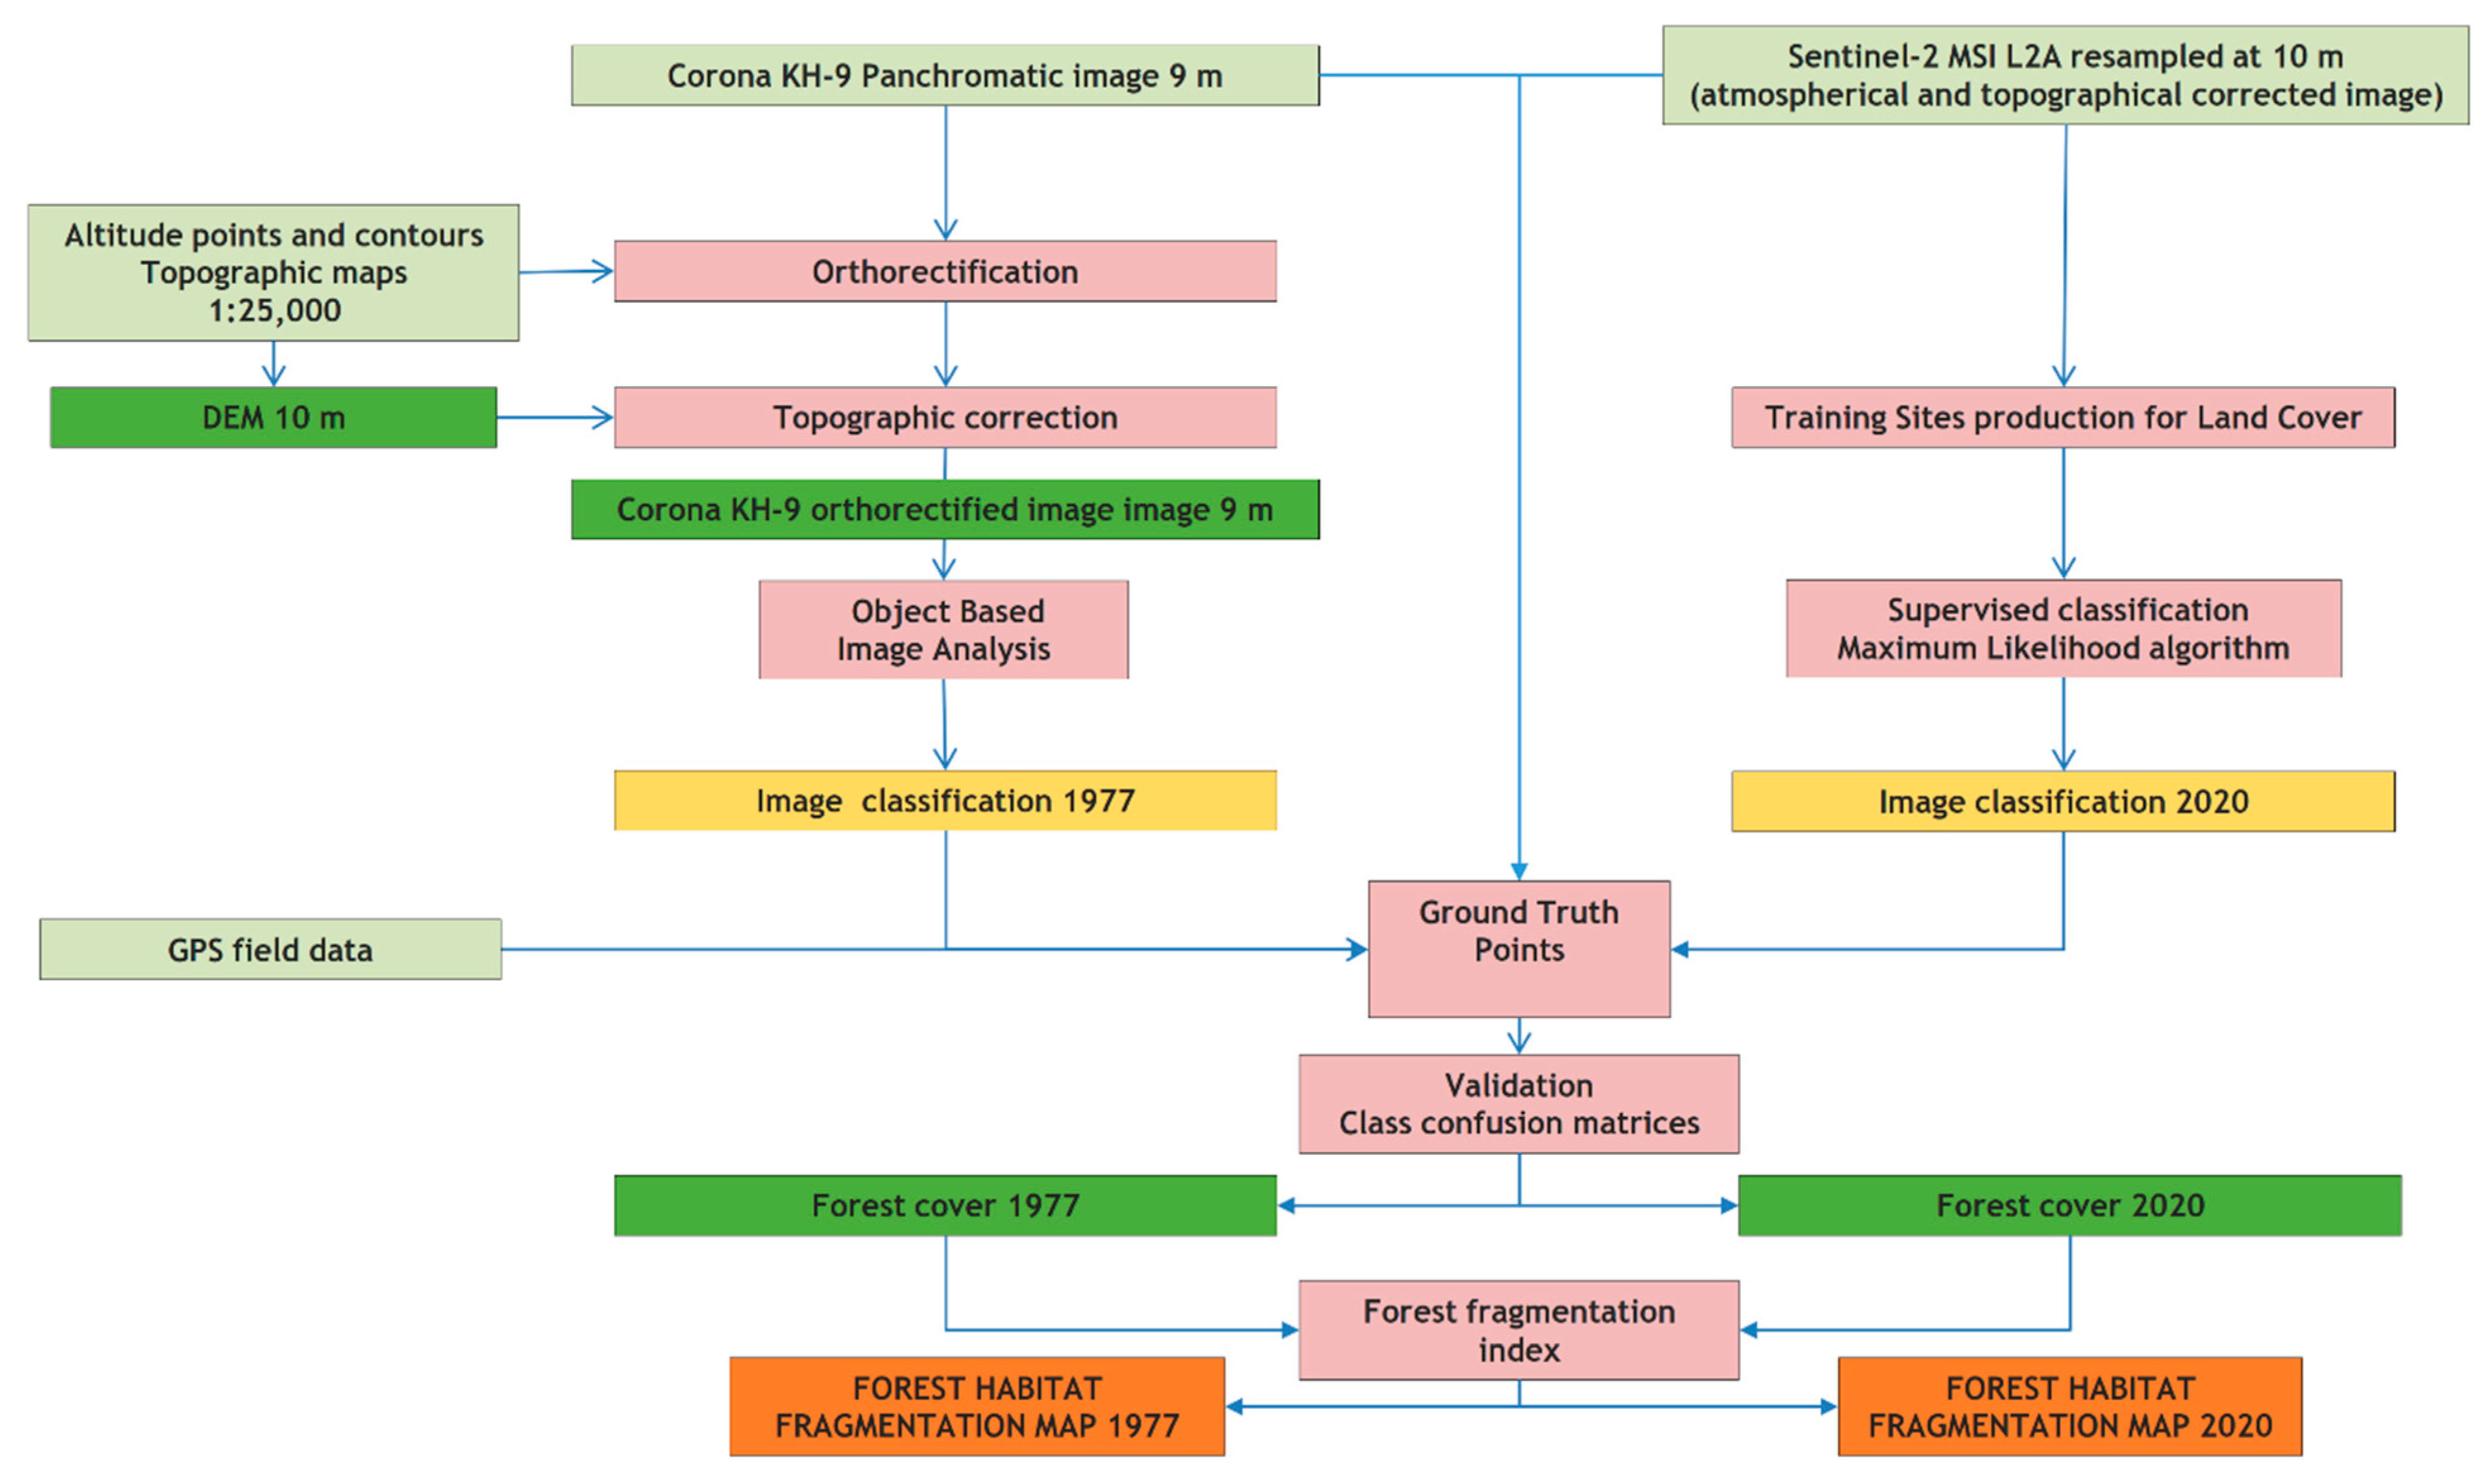
2.2. Methodology
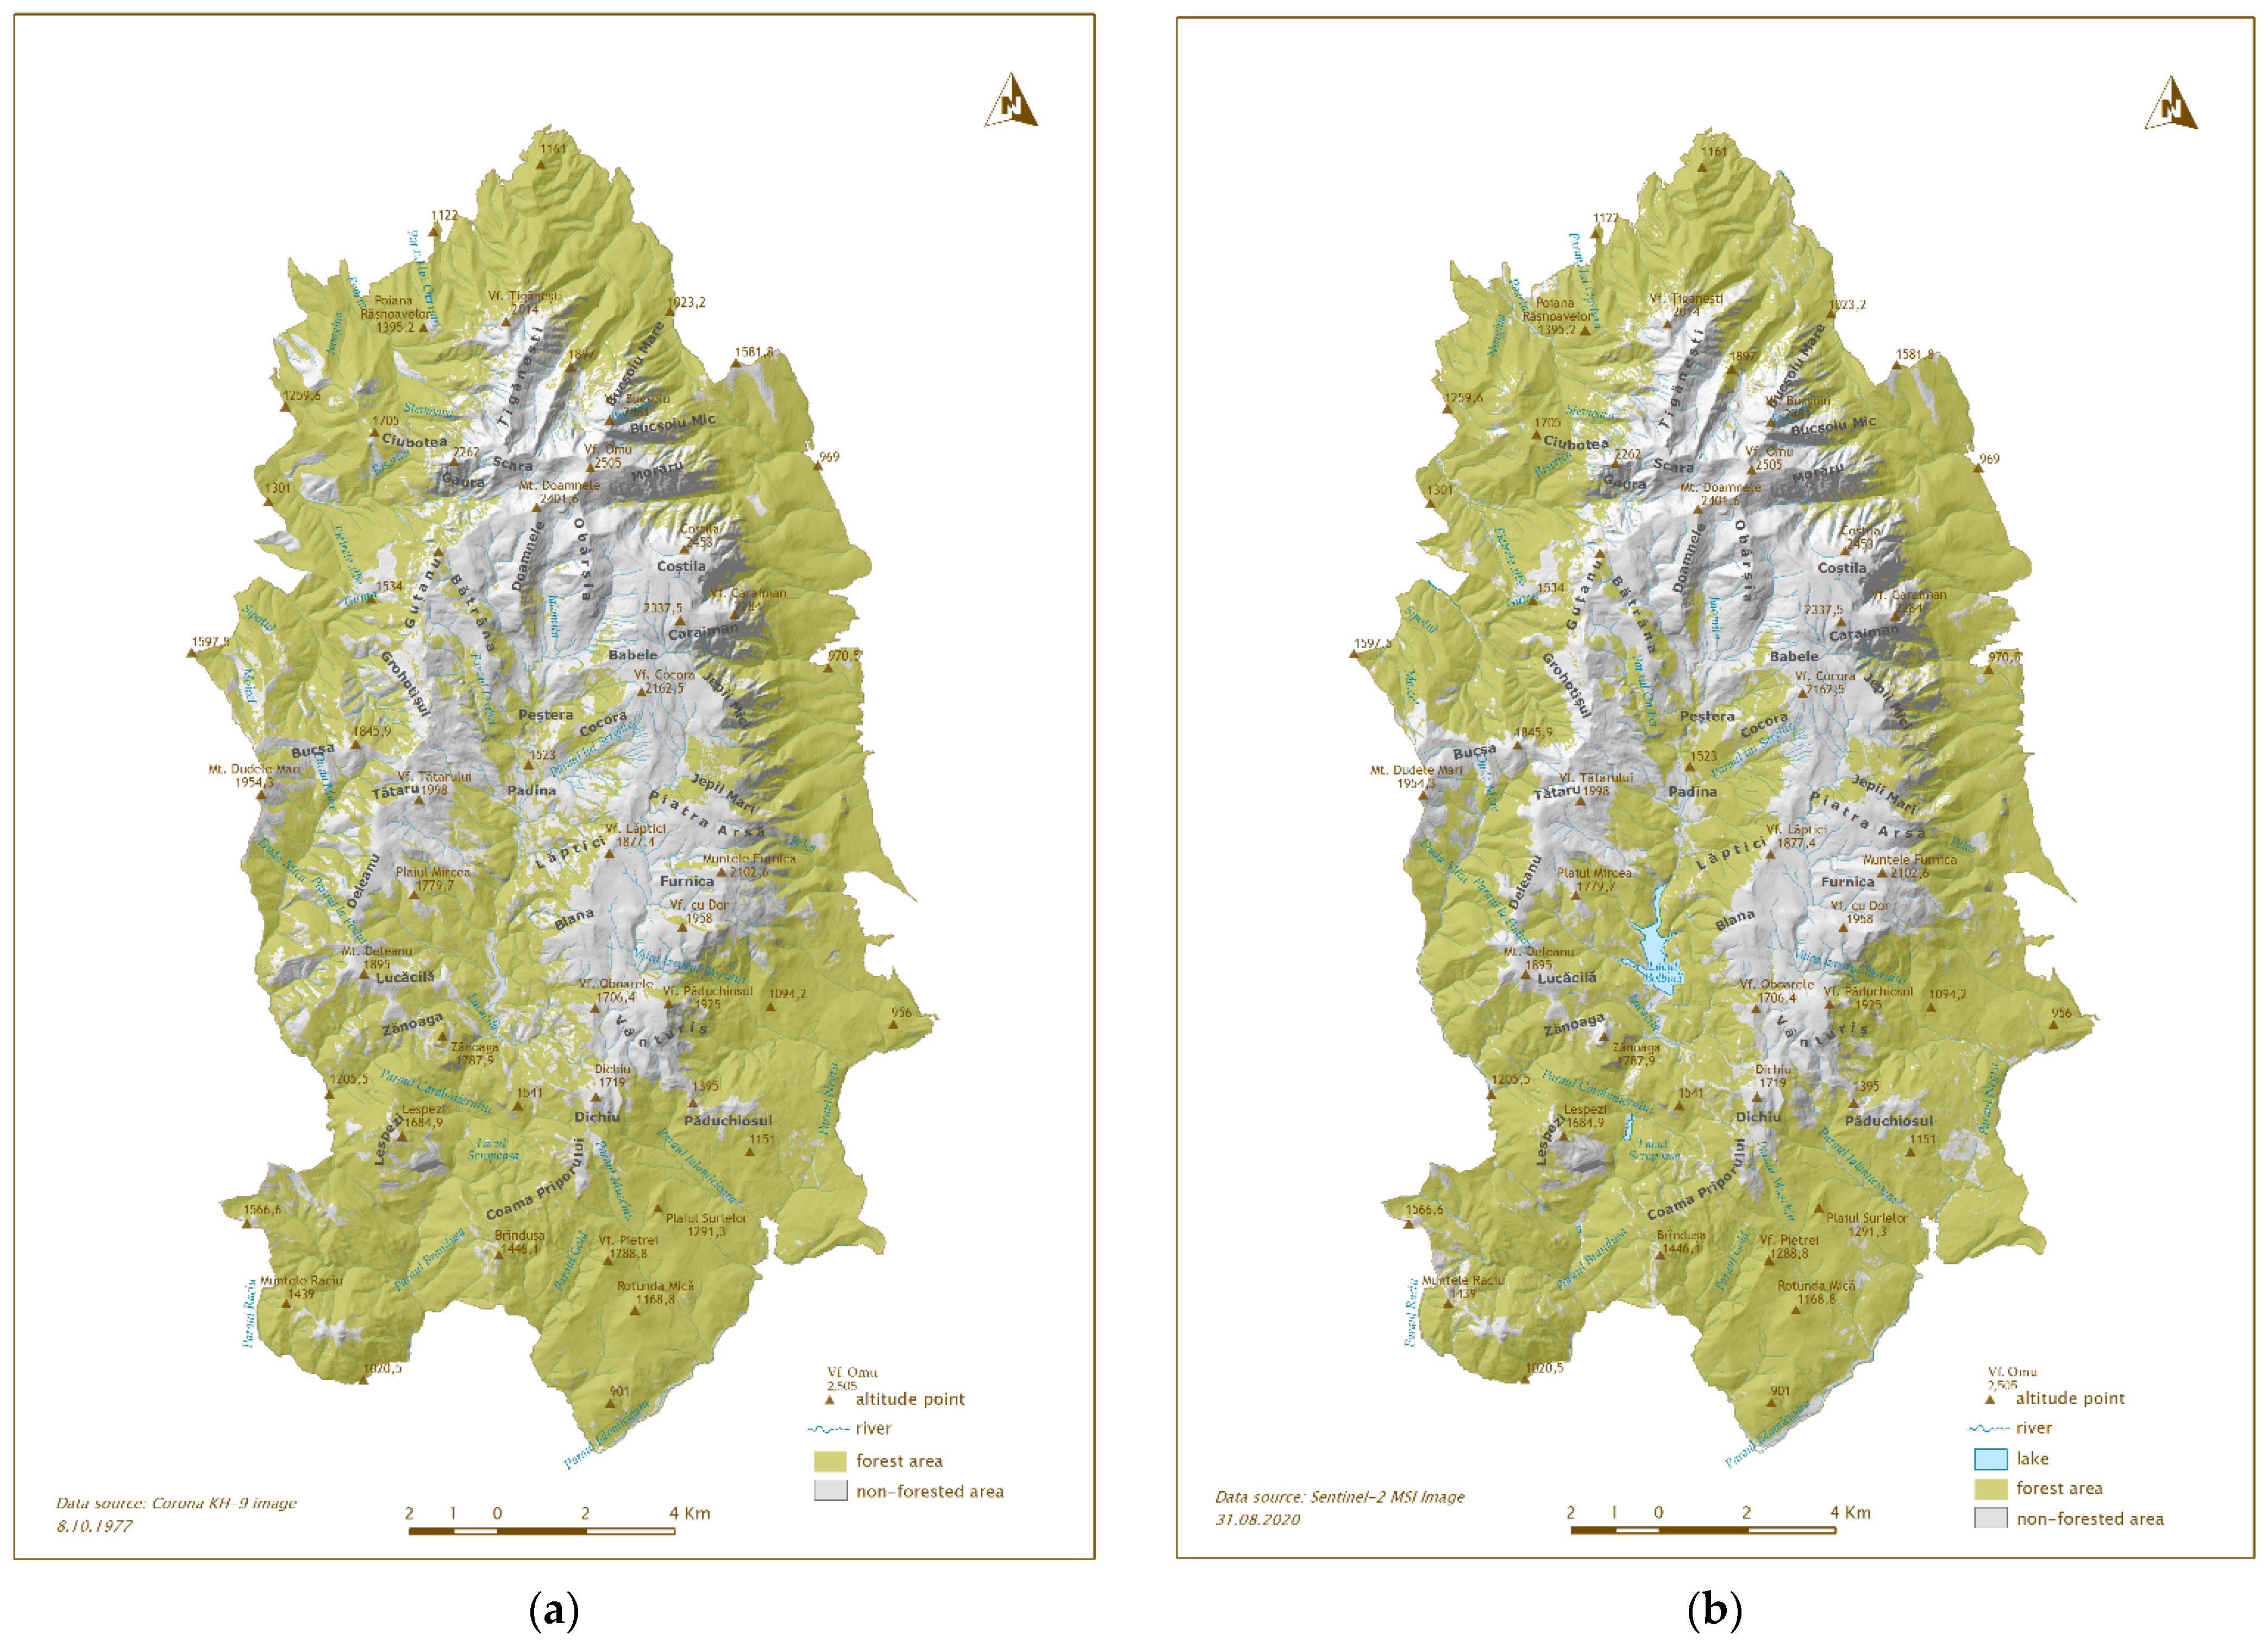
3. Results
4. Discussion
4.1. Accuracy Assessment of the Images Classifications
4.2. Landscape Metrics in Forest Habitat Fragmentation
4.3. Study Limitations and Future Perspectives
5. Conclusions
Author Contributions
Funding
Data Availability Statement
Acknowledgments
Conflicts of Interest
References
- Kerr, J.T.; Ostrovsky, M. From space to species: Ecological applications for remote sensing. Trends Ecol. Evol. 2003, 18, 299–305. [Google Scholar] [CrossRef]
- Linke, J.; Betts, M.; Lavrige, M.; Franklin, S. Structure, Function and Change of Forest Landscapes. In Understanding Forest Disturbance and Spatial Pattern. Remote Sensing and GIS Approaches; Wulder, M., Franklin, S., Eds.; CRC Press: Boca Raton, FL, USA, 2006; pp. 1–29. [Google Scholar]
- Rose, R.; Byler, D.; Eastman, J.; Fleishman, E.; Geller, G.; Goetz, S.; Guild, L.; Hamilton, H.; Hansen, M.; Headley, R.; et al. Ten Ways Remote Sensing Can Contribute to Conservation. Conserv. Biol. 2014, 29, 350–359. [Google Scholar] [CrossRef] [Green Version]
- Long, J.A.; Nelson, T.A.; Wulder, M.A. Characterizing forest fragmentation: Distinguishing change in composition from configuration. Appl. Geogr. 2010, 30, 426–435. [Google Scholar] [CrossRef] [Green Version]
- Innes, J.L.; Koch, B. Forest Biodiversity and Its Assessment by Remote Sensing. Glob. Ecol. Biogeogr. Lett. 1998, 7, 397–419. [Google Scholar] [CrossRef]
- Healey, S.P.; Cohen, W.B.; Yang, Z.; Kenneth Brewer, C.; Brooks, E.B.; Gorelick, N.; Hernandez, A.J.; Huang, C.; Joseph Hughes, M.; Kennedy, R.E.; et al. Mapping forest change using stacked generalization: An ensemble approach. Remote Sens. Environ. 2018, 204, 717–728. [Google Scholar] [CrossRef]
- Newton, A.C.; Hill, R.A.; Echeverría, C.; Golicher, D.; Rey Benayas, J.M.; Cayuela, L.; Hinsley, S.A. Remote sensing and the future of landscape ecology. Prog. Phys. Geogr. Earth Environ. 2009, 33, 528–546. [Google Scholar] [CrossRef] [Green Version]
- Rogan, J.; Miller, J. Integrating GIS and Remotely Sensed Data for Mapping Forest Disturbance and Change. In Understanding Forest Disturbance and Spatial Pattern. Remote Sensing and GIS Approaches; Wulder, M., Franklin, S., Eds.; CRC Press: Boca Raton, FL, USA, 2006; pp. 133–172. [Google Scholar]
- Ghosh, A.; Munshi, M.; Areendran, G.; Joshi, P.K. Pattern Space Analysis of Landscape Metrics for Detecting Changes in Forests of Himalayan Foothills. Asian J. GeoInform. 2012, 12. [Google Scholar]
- Heilman, G.E.; Strittholt, J.R.; Slosser, N.C.; Dellasala, D.A. Forest Fragmentation of the Conterminous United States: Assessing Forest Intactness through Road Density and Spatial Characteristics: Forest fragmentation can be measured and monitored in a powerful new way by combining remote sensing, geographic information systems, and analytical software. BioScience 2002, 52, 411–422. [Google Scholar] [CrossRef] [Green Version]
- Wulder, M.A.; White, J.C.; Cranny, M.; Hall, R.J.; Luther, J.E.; Beaudoin, A.; Goodenough, D.G.; Dechka, J.A. Monitoring Canada’s forests. Part 1: Completion of the EOSD land cover project. Can. J. Remote Sens. 2008, 34, 549–562. [Google Scholar] [CrossRef]
- Singh, J.S.; Roy, P.S.; Murthy, M.S.R.; Jha, C.S. Application of landscape ecology and remote sensing for assessment, monitoring and conservation of biodiversity. J. Indian Soc. Remote Sens. 2010, 38, 365–385. [Google Scholar] [CrossRef]
- Reddy, C.S.; Sreelekshmi, S.; Jha, C.S.; Dadhwal, V.K. National assessment of forest fragmentation in India: Landscape indices as measures of the effects of fragmentation and forest cover change. Ecol. Eng. 2013, 60, 453–464. [Google Scholar] [CrossRef]
- Turner, W.; Spector, S.; Gardiner, N.; Fladeland, M.; Sterling, E.; Steininger, M. Remote sensing for biodiversity science and conservation. Trends Ecol. Evol. 2003, 18, 306–314. [Google Scholar] [CrossRef]
- Duro, D.C.; Coops, N.C.; Wulder, M.A.; Han, T. Development of a large area biodiversity monitoring system driven by remote sensing. Prog. Phys. Geogr. Earth Environ. 2007, 31, 235–260. [Google Scholar] [CrossRef]
- Strand, H.; Hoft, R.; Strittholt, J.; Horning, N.; Miles, L.; Fosnight, E.; Turner, W. (Eds.) Sourcebook on Remote Sensing and Biodiversity Indicators; CBD Technical Series No. 32; Secretariat of the Convention on Biological Diversity, NASA-NGO Biodiversity Working Group and the World Conservation Monitoring Centre of the United Nations Environment: Montreal, QC, Canada, 2007. [Google Scholar]
- Pettorelli, N.; Wegmann, M.; Skidmore, A.; Mücher, S.; Dawson, T.P.; Fernandez, M.; Lucas, R.; Schaepman, M.E.; Wang, T.; O’Connor, B.; et al. Framing the concept of satellite remote sensing essential biodiversity variables: Challenges and future directions. Remote Sens. Ecol. Conserv. 2016, 2, 122–131. [Google Scholar] [CrossRef]
- Wulder, M.A.; Franklin, S.E. Understanding Forest Disturbance and Spatial Pattern: Remote Sensing and GIS Approaches, 1st ed.; CRC Press: Boca Raton, FL, USA, 2006. [Google Scholar]
- Paganini, M.; Leidner, A.K.; Geller, G.; Turner, W.; Wegmann, M. The role of space agencies in remotely sensed essential biodiversity variables. Remote Sens. Ecol. Conserv. 2016, 2, 132–140. [Google Scholar] [CrossRef]
- Garcia, C.A.; Feintrenie, L. Beyond the Mirror: Tropical Forest Fragmentation and Its Impact on Rural Livelihoods. In Global Forest Fragmentation; CABI: Wallingford, UK, 2014; pp. 115–131. [Google Scholar] [CrossRef]
- Coops, N.C.; Wulder, M.A.; White, J.C. Identifying and Describing Forest Disturbance and Spatial Pattern: Data Selection Issues and Methodological Implications. In Understanding Forest Disturbance and Spatial Pattern. Remote Sensing and GIS Approaches; Wulder, M., Franklin, S., Eds.; CRC Press: Boca Raton, FL, USA, 2006; pp. 31–62. [Google Scholar]
- Gillanders, S.N.; Coops, N.C.; Wulder, M.A.; Gergel, S.E.; Nelson, T. Multitemporal remote sensing of landscape dynamics and pattern change: Describing natural and anthropogenic trends. Prog. Phys. Geogr. Earth Environ. 2008, 32, 503–528. [Google Scholar] [CrossRef]
- Geller, G.N.; Halpin, P.N.; Helmuth, B.; Hestir, E.L.; Skidmore, A.; Ambrams, M.; Aguirre, N.; Blair, M.; Botha, E.; Colloff, M.; et al. Remote Sensing for Biodiversity. In The GEO Handbook on Biodiversity Observation Networks; Walters, M., Scholes, R., Eds.; Springer: Cham, Switzerland, 2017. [Google Scholar]
- Skole, D.; Tucker, C. Tropical Deforestation and Habitat Fragmentation in the Amazon: Satellite Data from 1978 to 1988. Science 1993, 260, 1905–1910. [Google Scholar] [CrossRef] [Green Version]
- Wickham, J.D.; O’Neill, R.V.; Jones, K.B. Forest fragmentation as an economic indicator. Landsc. Ecol. 2000, 15, 171–179. [Google Scholar] [CrossRef]
- Vogelmann, J.E. Assessment of Forest Fragmentation in Southern New England Using Remote Sensing and Geographic Information Systems Technology. Conserv. Biol. 1995, 9, 439–449. [Google Scholar] [CrossRef]
- Wulder, M. Optical remote-sensing techniques for the assessment of forest inventory and biophysical parameters. Prog. Phys. Geogr. 1998, 22, 449–476. [Google Scholar] [CrossRef]
- Frohn, R.C. Remote Sensing for Landscape Ecology: New Metric Indicators for Monitoring, Modeling, and Assessment of Ecosystems, 1st ed.; CRC Press: Boca Raton, FL, USA, 1997. [Google Scholar]
- Jorge, L.A.B.; Garcia, G.J. A study of habitat fragmentation in Southeastern Brazil using remote sensing and geographic information systems (GIS). For. Ecol. Manag. 1997, 98, 35–47. [Google Scholar] [CrossRef]
- Saura, S. Effects of remote sensor spatial resolution and data aggregation on selected fragmentation indices. Landsc. Ecol. 2004, 19, 197–209. [Google Scholar] [CrossRef]
- Langford, W.; Gergel, S.; Dietterich, T.; Cohen, W. Map Misclassification Can Cause Large Errors in Landscape Pattern Indices: Examples from Habitat Fragmentation. Ecosystems 2006, 9, 474–488. [Google Scholar] [CrossRef]
- Gergel, S.E. New directions in landscape pattern analysis and linkages with remote sensing. In Understanding Forest Disturbance and Spatial Pattern. Remote Sensing and GIS Approaches; Wulder, M., Franklin, S., Eds.; CRC Press: Boca Raton, FL, USA, 2006; pp. 173–208. [Google Scholar]
- Coops, N.C.; Gillanders, S.N.; Wulder, M.A.; Gergel, S.E.; Nelson, T.; Goodwin, N.R. Assessing changes in forest fragmentation following infestation using time series Landsat imagery. Forest Ecol. Manag. 2010, 259, 2355–2365. [Google Scholar] [CrossRef]
- Jha, C.S.; Goparaju, L.; Tripathi, A.; Gharai, B.; Raghubanshi, A.S.; Singh, J.S. Forest fragmentation and its impact on species diversity: An analysis using remote sensing and GIS. Biodivers. Conserv. 2005, 14, 1681–1698. [Google Scholar] [CrossRef]
- Roy, P.; Roy, A.; Kushwaha, S.; Singh, S.; Karnatak, H.; Saran, S.; Kushwaha, D.; Porwal, M.C.; Padalia, H.; Nandy, S.; et al. Forest fragmentation in India. Curr. Sci. 2013, 105, 774–780. [Google Scholar]
- Tapia-Armijos, M.F.; Homeier, J.; Espinosa, C.I.; Leuschner, C.; de la Cruz, M. Deforestation and Forest Fragmentation in South Ecuador since the 1970s—Losing a Hotspot of Biodiversity. PLoS ONE 2015, 10, e0133701. [Google Scholar] [CrossRef] [Green Version]
- Batistella, M.; Robeson, S.; Moran, E. Settlement Design, Forest Fragmentation, and Landscape Change in Rondônia, Amazônia. Photogramm. Eng. Remote Sens. 2003, 69, 805–812. [Google Scholar] [CrossRef] [Green Version]
- Carranza, M.L.; Frate, L.; Acosta, A.T.R.; Hoyos, L.; Ricotta, C.; Cabido, M. Measuring forest fragmentation using multitemporal remotely sensed data: Three decades of change in the dry Chaco. Eur. J. Remote Sens. 2014, 47, 793–804. [Google Scholar] [CrossRef]
- Ramachandra, T.V.; Setturu, B.; Chandran, S. Geospatial analysis of forest fragmentation in Uttara Kannada District, India. For. Ecosyst. 2016, 3, 10. [Google Scholar] [CrossRef] [Green Version]
- Gong, C.; Yu, S.; Joesting, H.; Chen, J. Determining socioeconomic drivers of urban forest fragmentation with historical remote sensing images. Landsc. Urban Plan 2013, 117, 57–65. [Google Scholar] [CrossRef]
- Zhou, W.; Zhang, S.; Yu, W.; Wang, J.; Wang, W. Effects of Urban Expansion on Forest Loss and Fragmentation in Six Megaregions, China. Remote Sens. 2017, 9, 991. [Google Scholar] [CrossRef] [Green Version]
- Bryan-Brown, D.N.; Connolly, R.M.; Richards, D.R.; Adame, F.; Friess, D.A.; Brown, C.J. Global trends in mangrove forest fragmentation. Sci. Rep. 2020, 10, 7117. [Google Scholar] [CrossRef] [PubMed]
- Hermosilla, T.; Wulder, M.A.; White, J.C.; Coops, N.C.; Pickell, P.D.; Bolton, D.K. Impact of time on interpretations of forest fragmentation: Three-decades of fragmentation dynamics over Canada. Remote Sens. Environ. 2019, 222, 65–77. [Google Scholar] [CrossRef]
- Armenteras, D.; González, T.M.; Retana, J. Forest fragmentation and edge influence on fire occurrence and intensity under different management types in Amazon forests. Biol. Conserv. 2013, 159, 73–79. [Google Scholar] [CrossRef]
- Reddy, C.S.; Kurian, A.; Srivastava, G.; Singhal, J.; Varghese, A.O.; Padalia, H.; Ayyappan, N.; Rajashekar, G.; Jha, C.S.; Rao, P.V.N. Remote sensing enabled essential biodiversity variables for biodiversity assessment and monitoring: Technological advancement and potentials. Biodivers. Conserv. 2021, 30, 1–14. [Google Scholar] [CrossRef]
- Sahana, M.; Sajjad, H.; Ahmed, R. Assessing spatio-temporal health of forest cover using forest canopy density model and forest fragmentation approach in Sundarban reserve forest, India. Model. Earth Syst. Environ. 2015, 1, 49. [Google Scholar] [CrossRef]
- Lawley, V.; Lewis, M.; Clarke, K.; Ostendorf, B. Site-based and remote sensing methods for monitoring indicators of vegetation condition: An Australian review. Ecol. Indic. 2016, 60, 1273–1283. [Google Scholar] [CrossRef] [Green Version]
- Renó, V.; Novo, E.; Escada, M. Forest Fragmentation in the Lower Amazon Floodplain: Implications for Biodiversity and Ecosystem Service Provision to Riverine Populations. Remote Sens. 2016, 8, 886. [Google Scholar] [CrossRef] [Green Version]
- Harper, G.; Steininger, M.; Tucker, C.; Juhn, D.; Hawkins, F. Fifty Years of Deforestation and Forest Fragmentation in Madagascar. Environ. Conserv. 2007, 34, 325–333. [Google Scholar] [CrossRef]
- Gil, A.; Lobo, A.; Abadi, M.; Silva, L.; Calado, H. Mapping invasive woody plants in Azores Protected Areas by using very high-resolution multispectral imagery. Eur. J. Remote Sens. 2013, 46, 289–304. [Google Scholar] [CrossRef] [Green Version]
- Hernando, A.; Velázquez, J.; Valbuena, R.; Legrand, M.; García-Abril, A. Influence of the resolution of forest cover maps in evaluating fragmentation and connectivity to assess habitat conservation status. Ecol. Indic. 2017, 79, 295–302. [Google Scholar] [CrossRef]
- Taubert, F.; Fischer, R.; Groeneveld, J.; Lehmann, S.; Müller, M.S.; Rödig, E.; Wiegand, T.; Huth, A. Global patterns of tropical forest fragmentation. Nature 2018, 554, 519–522. [Google Scholar] [CrossRef] [PubMed]
- Tappan, G.; Hadj, A.; Wood, E.; Lietzow, R.W. Use of Argon, Corona, and Landsat Imagery to Assess 30 Years of Land Resource Changes in West-Central Senegal. Photogramm. Eng. Remote Sens. 2000, 66, 727–735. [Google Scholar]
- Quanjun, J.; Bing, Z.; Liangyun, L. The feasibility of landscape pattern analysis within the alpine steppe of the Yellow River source based on historical CORONA panchromatic imagery. Proc. SPIE 2012, 8538, 85381N. [Google Scholar]
- Rendenieks, Z.; Nita, M.D.; Nikodemus, O.; Radeloff, V.C. Half a century of forest cover change along the Latvian-Russian border captured by object-based image analysis of Corona and Landsat TM/OLI data. Remote Sens. Environ. 2020, 249, 112010. [Google Scholar] [CrossRef]
- Munteanu, C.; Senf, C.; Nita, M.D.; Sabatini, F.M.; Oeser, J.; Seidl, R.; Kuemmerle, T. Using historical spy satellite photographs and recent remote sensing data to identify high-conservation-value forests. Conserv. Biol. 2021, 36, e13820. [Google Scholar] [CrossRef]
- Mihai, A.B.; Nedelcu, A.; Buterez, C.; Cruceru, I.; Olariu, B.; Rujoiu-Mare, M.R.; Savulescu, I.; Tudose, I. Județul Prahova. Spațiu, Societate, Economie, Mediu; Editura Academiei Române: Bucharest, Romania, 2016. [Google Scholar]
- Nistor, C.; Vîrghileanu, M.; Carlan, I.; Mihai, B.-A.; Toma, L.; Olariu, B. Remote Sensing-Based Analysis of Urban Landscape Change in the City of Bucharest, Romania. Remote Sens. 2021, 13, 2323. [Google Scholar] [CrossRef]
- Klimetzek, D.; Stăncioiu, P.T.; Paraschiv, M.; Niță, M.D. Ecological Monitoring with Spy Satellite Images—The Case of Red Wood Ants in Romania. Remote Sens. 2021, 13, 520. [Google Scholar] [CrossRef]
- Nagendra, H.; Lucas, R.; Honrado, J.P.; Jongman, R.H.G.; Tarantino, C.; Adamo, M.; Mairota, P. Remote sensing for conservation monitoring: Assessing protected areas, habitat extent, habitat condition, species diversity, and threats. Ecol. Indic. 2013, 33, 45–59. [Google Scholar] [CrossRef]
- Soverel, N.O.; Coops, N.C.; White, J.C.; Wulder, M.A. Characterizing the forest fragmentation of Canada’s national parks. Environ. Monit. Assess. 2010, 164, 481–499. [Google Scholar] [CrossRef] [PubMed]
- Gounaridis, D.; Zaimes, G.; Koukoulas, S. Quantifying spatio-temporal patterns of forest fragmentation in Hymettus Mountain, Greece. Comput. Environ. Urban Syst. 2014, 46, 35–44. [Google Scholar] [CrossRef]
- Giriraj, A.; Murthy, M.S.; Beierkuhnlein, C. Evaluating forest fragmentation and its tree community composition in the tropical rain forest of Southern Western Ghats (India) from 1973 to 2004. Environ. Monit. Assess. 2010, 161, 29–44. [Google Scholar] [CrossRef] [PubMed]
- Sharma, K.; Robeson, S.; Thapa, P.; Saikia, A. Land-use/land-cover change and forest fragmentation in the Jigme Dorji National Park, Bhutan. Phys. Geogr. 2016, 38, 1–18. [Google Scholar] [CrossRef]
- Cheţan, M.A.; Dornik, A.; Urdea, P. Analysis of recent changes in natural habitat types in the Apuseni Mountains (Romania), using multi-temporal Landsat satellite imagery (1986–2015). Appl. Geogr. 2018, 97, 161–175. [Google Scholar] [CrossRef]
- Huzui, A.; Abdelkader, A.; Patru-Stupariu, I. Analysing urban dynamics using multi-temporal satellite images in the case of a mountain area, Sinaia (Romania). Int. J. Digit. Earth 2013, 6, 563–579. [Google Scholar] [CrossRef]
- Rujoiu-Mare, M.-R.; Olariu, B.; Mihai, B.-A.; Nistor, C.; Săvulescu, I. Land cover classification in Romanian Carpathians and Subcarpathians using multi-date Sentinel-2 remote sensing imagery. Eur. J. Remote Sens. 2017, 50, 496–508. [Google Scholar] [CrossRef] [Green Version]
- Toader, T.; Dumitru, I. Pădurile României—Parcuri Naționale și Parcuri Naturale; Regia Națională a Pădurilor: Bucharest, Romania, 2004. [Google Scholar]
- PNB. Parcul Natural Bucegi—Plan de Management; Regia Națională a Pădurilor—Romsliva: Bucharest, Romania, 2018. [Google Scholar]
- NRO. HEXAGON American’s Eyes in Space Fact Sheet; National Reconnaissance Office, Center for the Study of National Reconnaissance: Chantilly, VA, USA, 2011. [Google Scholar]
- Galiatsatos, N.; Donoghue, D.N.; Philip, G. High resolution elevation data derived from stereoscopic CORONA imagery with minimal ground control. Photogramm. Eng. Remote Sens. 2007, 73, 1093–1106. [Google Scholar] [CrossRef] [Green Version]
- Surazakov, A.; Aizen, V. Positional accuracy evaluation of declassified Hexagon KH-9 mapping camera imagery. Photogramm. Eng. Remote Sens. 2010, 76, 603–608. [Google Scholar] [CrossRef] [Green Version]
- Drusch, M.; Del Bello, U.; Carlier, S.; Colin, O.; Fernandez, V.; Gascon, F.; Hoersch, B.; Isola, C.; Laberinti, P.; Martimort, P.; et al. Sentinel-2: ESA’s Optical High-Resolution Mission for GMES Operational Services. Remote Sens. Environ. 2012, 120, 25–36. [Google Scholar] [CrossRef]
- ESA. Sentinel-2 User Handbook; European Space Agency (ESA): Paris, France, 2015. [Google Scholar]
- Fletcher, K. Sentinel-2: ESA’s Optical High-Resolution Mission for GMES Operational Services; ESA Communications: Noordwijk, The Netherlands, 2012. [Google Scholar]
- USGS. Declassified Intelligence Satellite Photographs Summary of Satellite Missions; USGS: Reston, VA, USA, 2008. [Google Scholar]
- Burnett, M.G. Hexagon (KH-9) Mapping Program and Evolution; Center for the Study of National Reconnaissance: Chantilly, VA, USA, 1982. [Google Scholar]
- McGlone, J.C.; Mikhail, E.M.; Bethel, J.S.; Mullen, R. Manual of Photogrammetry, 5th ed.; American Society for Photogrammetry and Remote Sensing: Baton Rouge, LA, USA, 2004. [Google Scholar]
- ASPRS. New Asprs Positional Accuracy Standards for Digital Geospatial Data Released. Photogramm. Eng. Remote Sens. 2015, 81, 277. [Google Scholar] [CrossRef]
- Nita, M.D.; Munteanu, C.; Gutman, G.; Abrudan, I.V.; Radeloff, V.C. Widespread forest cutting in the aftermath of World War II captured by broad-scale historical Corona spy satellite photography. Remote Sens. Environ. 2018, 204, 322–332. [Google Scholar] [CrossRef]
- Luscier, J.D.; Thompson, W.L.; Wilson, J.M.; Gorham, B.E.; Dragut, L.D. Using digital photographs and object-based image analysis to estimate percent ground cover in vegetation plots. Front. Ecol. Environ. 2006, 4, 408–413. [Google Scholar] [CrossRef] [Green Version]
- Lewis, H.G.; Brown, M. A generalized confusion matrix for assessing area estimates from remotely sensed data. Int. J. Remote Sens. 2001, 22, 3223–3235. [Google Scholar] [CrossRef]
- Gómez, C.; White, J.C.; Wulder, M.A. Optical remotely sensed time series data for land cover classification: A review. ISPRS J. Photogramm. Remote Sens. 2016, 116, 55–72. [Google Scholar] [CrossRef] [Green Version]
- McGarigal, K.; Marks, B.J. FRAGSTATS. Spatial pattern analysis program for quantifying landscape structure. Version 2.0. In Forest Science Department; Oregon State University: Corvallis, OH, USA, 1994; p. 67. [Google Scholar]
- McGarigal, K.S.; Cushman, S.; Neel, M.; Ene, E. FRAGSTATS: Spatial Pattern Analysis Program for Categorical Maps; Landscape Ecology Lab, University of Massachusetts: Amherst, MA, USA, 2002. [Google Scholar]
- Yang, Z.; Kennedy, R.; Cohen, W.; Healey, S. Remotely Sensed Data in the Mapping of Forest Harvest Patterns. In Understanding Forest Disturbance and Spatial Pattern; CRC Press: Boca Raton, FL, USA, 2006; pp. 63–84. [Google Scholar]
- Affek, A.; Degórski, M.; Wolski, J.; Solon, J.; Kowalska, A.; Roo-Zielińska, E.; Grabińska, B.; Kruczkowska, B. Chapter 3—Methods. In Ecosystem Service Potentials and Their Indicators in Postglacial Landscapes; Affek, A., Degórski, M., Wolski, J., Solon, J., Kowalska, A., Roo-Zielińska, E., Grabińska, B., Kruczkowska, B., Eds.; Elsevier: Amsterdam, The Netherlands, 2020; pp. 97–111. [Google Scholar]
- Comănescu, L.; Nedelea, A. Public perception of the hazards affecting geomorphological heritage—Case study: The central area of Bucegi Mts. (Southern Carpathians, Romania). Environ. Earth Sci. 2015, 73, 8487–8497. [Google Scholar] [CrossRef]
- Cucu, L.A.; Niculae, M.-I.; Pătroescu, M. Hierarchical analysis of the threats for Species of Community Interest in the Iron Gates Natural Park, Romania. Forum Geogr. 2013, XII, 52–58. [Google Scholar] [CrossRef]
- Ioja, C.I.; Patroescu, M.; Rozylowicz, L.; Popescu, V.D.; Verghelet, M.; Zotta, M.L.; Felciuc, M. The efficacy of Romania’s protected areas network in conserving biodiversity. Biol. Conserv. 2010, 143, 2468–2476. [Google Scholar] [CrossRef]
- Knorn, J.A.N.; Kuemmerle, T.; Radeloff, V.C.; Keeton, W.S.; Gancz, V.; BiriŞ, I.-A.; Svoboda, M.; Griffiths, P.; Hagatis, A.; Hostert, P. Continued loss of temperate old-growth forests in the Romanian Carpathians despite an increasing protected area network. Environ. Conserv. 2012, 40, 182–193. [Google Scholar] [CrossRef] [Green Version]
- Olariu, B. Metode de analiză a calității mediilor montane în ariile protejate. In Studiu de Caz: Parcul Natural Bucegi; University of Bucharest: Bucharest, Romania, 2019. [Google Scholar]
- Huebner, C.D.; Randolph, J.C.; Parker, G.R. Environmental Factors Affecting Understory Diversity in Second-Growth Deciduous Forests. Am. Midl. Nat. 1995, 134, 155–165. [Google Scholar] [CrossRef]
- Fischer, R.; Taubert, F.; Müller Michael, S.; Groeneveld, J.; Lehmann, S.; Wiegand, T.; Huth, A. Accelerated forest fragmentation leads to critical increase in tropical forest edge area. Sci. Adv. 2021, 7, eabg7012. [Google Scholar] [CrossRef] [PubMed]
- Batar, A.K.; Shibata, H.; Watanabe, T. A Novel Approach for Forest Fragmentation Susceptibility Mapping and Assessment: A Case Study from the Indian Himalayan Region. Remote Sens. 2021, 13, 4090. [Google Scholar] [CrossRef]
- Nagendra, H.; Mairota, P.; Marangi, C.; Lucas, R.; Dimopoulos, P.; Honrado, J.P.; Niphadkar, M.; Mücher, C.A.; Tomaselli, V.; Panitsa, M.; et al. Satellite Earth observation data to identify anthropogenic pressures in selected protected areas. Int. J. Appl. Earth Obs. Geoinf. 2015, 37, 124–132. [Google Scholar] [CrossRef]
- Cavender-Bares, J.; Schneider, F.D.; Santos, M.J.; Armstrong, A.; Carnaval, A.; Dahlin, K.M.; Fatoyinbo, L.; Hurtt, G.C.; Schimel, D.; Townsend, P.A.; et al. Integrating remote sensing with ecology and evolution to advance biodiversity conservation. Nat. Ecol. Evol. 2022, 6, 506–519. [Google Scholar] [CrossRef] [PubMed]
- Muhammed, A.; Elias, E. Class and landscape level habitat fragmentation analysis in the Bale mountains national park, southeastern Ethiopia. Heliyon 2021, 7, e07642. [Google Scholar] [CrossRef]
- Narmada, K.; Dhanusree, G.D.; Bhaskaran, G. Landscape metrics to analyze the forest fragmentation of Chitteri Hills in Eastern Ghats, Tamil Nadu. J. Civ. Eng. Environ. Sci. 2021, 7, 001–007. [Google Scholar] [CrossRef]
- Pyngrope, O.R.; Kumar, M.; Pebam, R.; Singh, S.K.; Kundu, A.; Lal, D. Investigating forest fragmentation through earth observation datasets and metric analysis in the tropical rainforest area. SN Appl. Sci. 2021, 3, 705. [Google Scholar] [CrossRef]
- Halbgewachs, M.; Wegmann, M.; da Ponte, E. A Spectral Mixture Analysis and Landscape Metrics Based Framework for Monitoring Spatiotemporal Forest Cover Changes: A Case Study in Mato Grosso, Brazil. Remote Sens. 2022, 14, 1907. [Google Scholar] [CrossRef]
- Mengist, W.; Soromessa, T.; Feyisa, G.L. Forest fragmentation in a forest Biosphere Reserve: Implications for the sustainability of natural habitats and forest management policy in Ethiopia. Resour. Environ. Sustain. 2022, 8, 100058. [Google Scholar] [CrossRef]
- Da Silva, A.L.; de Nunes, A.J.N.; Marques, M.L.; Ribeiro, A.Í.; Longo, R.M. Assessing the fragility of forest remnants by using landscape metrics. Comparison between river basins in Brazil and Portugal. Environ. Monit. Assess. 2021, 193, 172. [Google Scholar] [CrossRef]
- Solano, F.; Praticò, S.; Piovesan, G.; Chiarucci, A.; Argentieri, A.; Modica, G. Characterizing historical transformation trajectories of the forest landscape in Rome’s metropolitan area (Italy) for effective planning of sustainability goals. Land Degrad. Dev. 2021, 32, 4708–4726. [Google Scholar] [CrossRef]
- Kowe, P.; Mutanga, O.; Dube, T. Advancements in the remote sensing of landscape pattern of urban green spaces and vegetation fragmentation. Int. J. Remote Sens. 2021, 42, 3797–3832. [Google Scholar] [CrossRef]
- De Keersmaecker, W.; Rodríguez-Sánchez, P.; Milencović, M.; Herold, M.; Reiche, J.; Verbesselt, J. Evaluating recovery metrics derived from optical time series over tropical forest ecosystems. Remote Sens. Environ. 2022, 274, 112991. [Google Scholar] [CrossRef]
- Coops, N.C.; Tompalski, P.; Goodbody, T.R.H.; Achim, A.; Mulverhill, C. Framework for near real-time forest inventory using multi source remote sensing data. For. Int. J. For. Res. 2022, cpac015. [Google Scholar] [CrossRef]
- Badea, O. Cercetări Ecologice pe Termen Lung în Ecosisteme Forestiere Reprezentatie din Parcul Natural Bucegi; Badea, O., Ed.; Editura Silvică: Voluntari, Romania, 2013. [Google Scholar]


| Dataset | Acquired Date | Spatial Resolution | Sensor | Description | Source |
|---|---|---|---|---|---|
| KH-9 Hexagon | 8 October 1977 | 9 m | Frame camera | 1-band scanned grayscale image, 8 bit | USGS digital archives 1 |
| Sentinel-2 MSI | 31 August 2020 | 10 and 20 m | Multispectral | 13-band scene covering the visible and infrared spectra, 16 bit | ESA Copernicus SciHub 2 |
| No. | Land Cover Class | Number of Samples | Areas Used for Validation |
|---|---|---|---|
| 1 | Coniferous forest | 24 | √ |
| 2 | Deciduous forest | 49 | √ |
| 3 | Dwarf pine (Pinus mugo) | 26 | √ |
| 4 | Mixed forest | 10 | √ |
| 5 | Pasture | 52 | X |
| 6 | Cliff area | 37 | X |
| 7 | Water | 29 | X |
| 8 | Built-up area | 51 | X |
| Image Forest Classification | Total Accuracy | Kappa Coefficient |
|---|---|---|
| KH-9 hexagon | 99% | 0.977 |
| Sentinel-2 MSI | 88.5% | 0.7 |
| No. | Class Metrics | Algorithm | UM | Reference Interval | Forest | |
|---|---|---|---|---|---|---|
| 1977 | 2020 | |||||
| 1 | Number of patches (NP) | NP = N | n/a | NP > 1 | 1493 | 716 |
| 2 | Patch density (PD) | nr/100 ha | PD > 0 | 69,848 | 33,676 | |
| 3 | Landscape shape index (LSI) | n/a | LSI ≥ 1 | 362,246 | 323,408 | |
| 4 | Connectance index (CONNECT)—1000 M | % | 0 < CONNECT < 100 | 28,102 | 25,429 | |
| 5 | Euclidian nearest-neighbour index—mean ( | m | ENN_MN ≥ 0 | 404,573 | 421,778 | |
| 6 | Total area (CA/TA) | ha | CA ≥ 0 | 213,750,400 | 212,614,000 | |
| 7 | Largest patch index (LPI) | n max(aij) | % | 0 < LPI < 100 | 946,208 | 979,289 |
| 8 | Patch area—mean (AREA_MN) | ha | AREA_MN > 0 | 143,168 | 296,947 | |
| 9 | Perimeter-area index—area-weighted mean (PARA_AM) | n/a | PARA_AM > 0 | 991,409 | 887,411 | |
| 10 | Proximity index—area-weighted mean (PROX_AM) | m | PROX_AM > 0 | 123,309,768 | 48,952,960 | |
Publisher’s Note: MDPI stays neutral with regard to jurisdictional claims in published maps and institutional affiliations. |
© 2022 by the authors. Licensee MDPI, Basel, Switzerland. This article is an open access article distributed under the terms and conditions of the Creative Commons Attribution (CC BY) license (https://creativecommons.org/licenses/by/4.0/).
Share and Cite
Olariu, B.; Vîrghileanu, M.; Mihai, B.-A.; Săvulescu, I.; Toma, L.; Săvulescu, M.-G. Forest Habitat Fragmentation in Mountain Protected Areas Using Historical Corona KH-9 and Sentinel-2 Satellite Imagery. Remote Sens. 2022, 14, 2593. https://doi.org/10.3390/rs14112593
Olariu B, Vîrghileanu M, Mihai B-A, Săvulescu I, Toma L, Săvulescu M-G. Forest Habitat Fragmentation in Mountain Protected Areas Using Historical Corona KH-9 and Sentinel-2 Satellite Imagery. Remote Sensing. 2022; 14(11):2593. https://doi.org/10.3390/rs14112593
Chicago/Turabian StyleOlariu, Bogdan, Marina Vîrghileanu, Bogdan-Andrei Mihai, Ionuț Săvulescu, Liviu Toma, and Maria-Gianina Săvulescu. 2022. "Forest Habitat Fragmentation in Mountain Protected Areas Using Historical Corona KH-9 and Sentinel-2 Satellite Imagery" Remote Sensing 14, no. 11: 2593. https://doi.org/10.3390/rs14112593
APA StyleOlariu, B., Vîrghileanu, M., Mihai, B.-A., Săvulescu, I., Toma, L., & Săvulescu, M.-G. (2022). Forest Habitat Fragmentation in Mountain Protected Areas Using Historical Corona KH-9 and Sentinel-2 Satellite Imagery. Remote Sensing, 14(11), 2593. https://doi.org/10.3390/rs14112593