
Using UAV Survey, High-Density LiDAR Data and Automated Relief Analysis for Habitation Practices Characterization during the Late Bronze Age in NE Romania


Abstract
:
1. Introduction
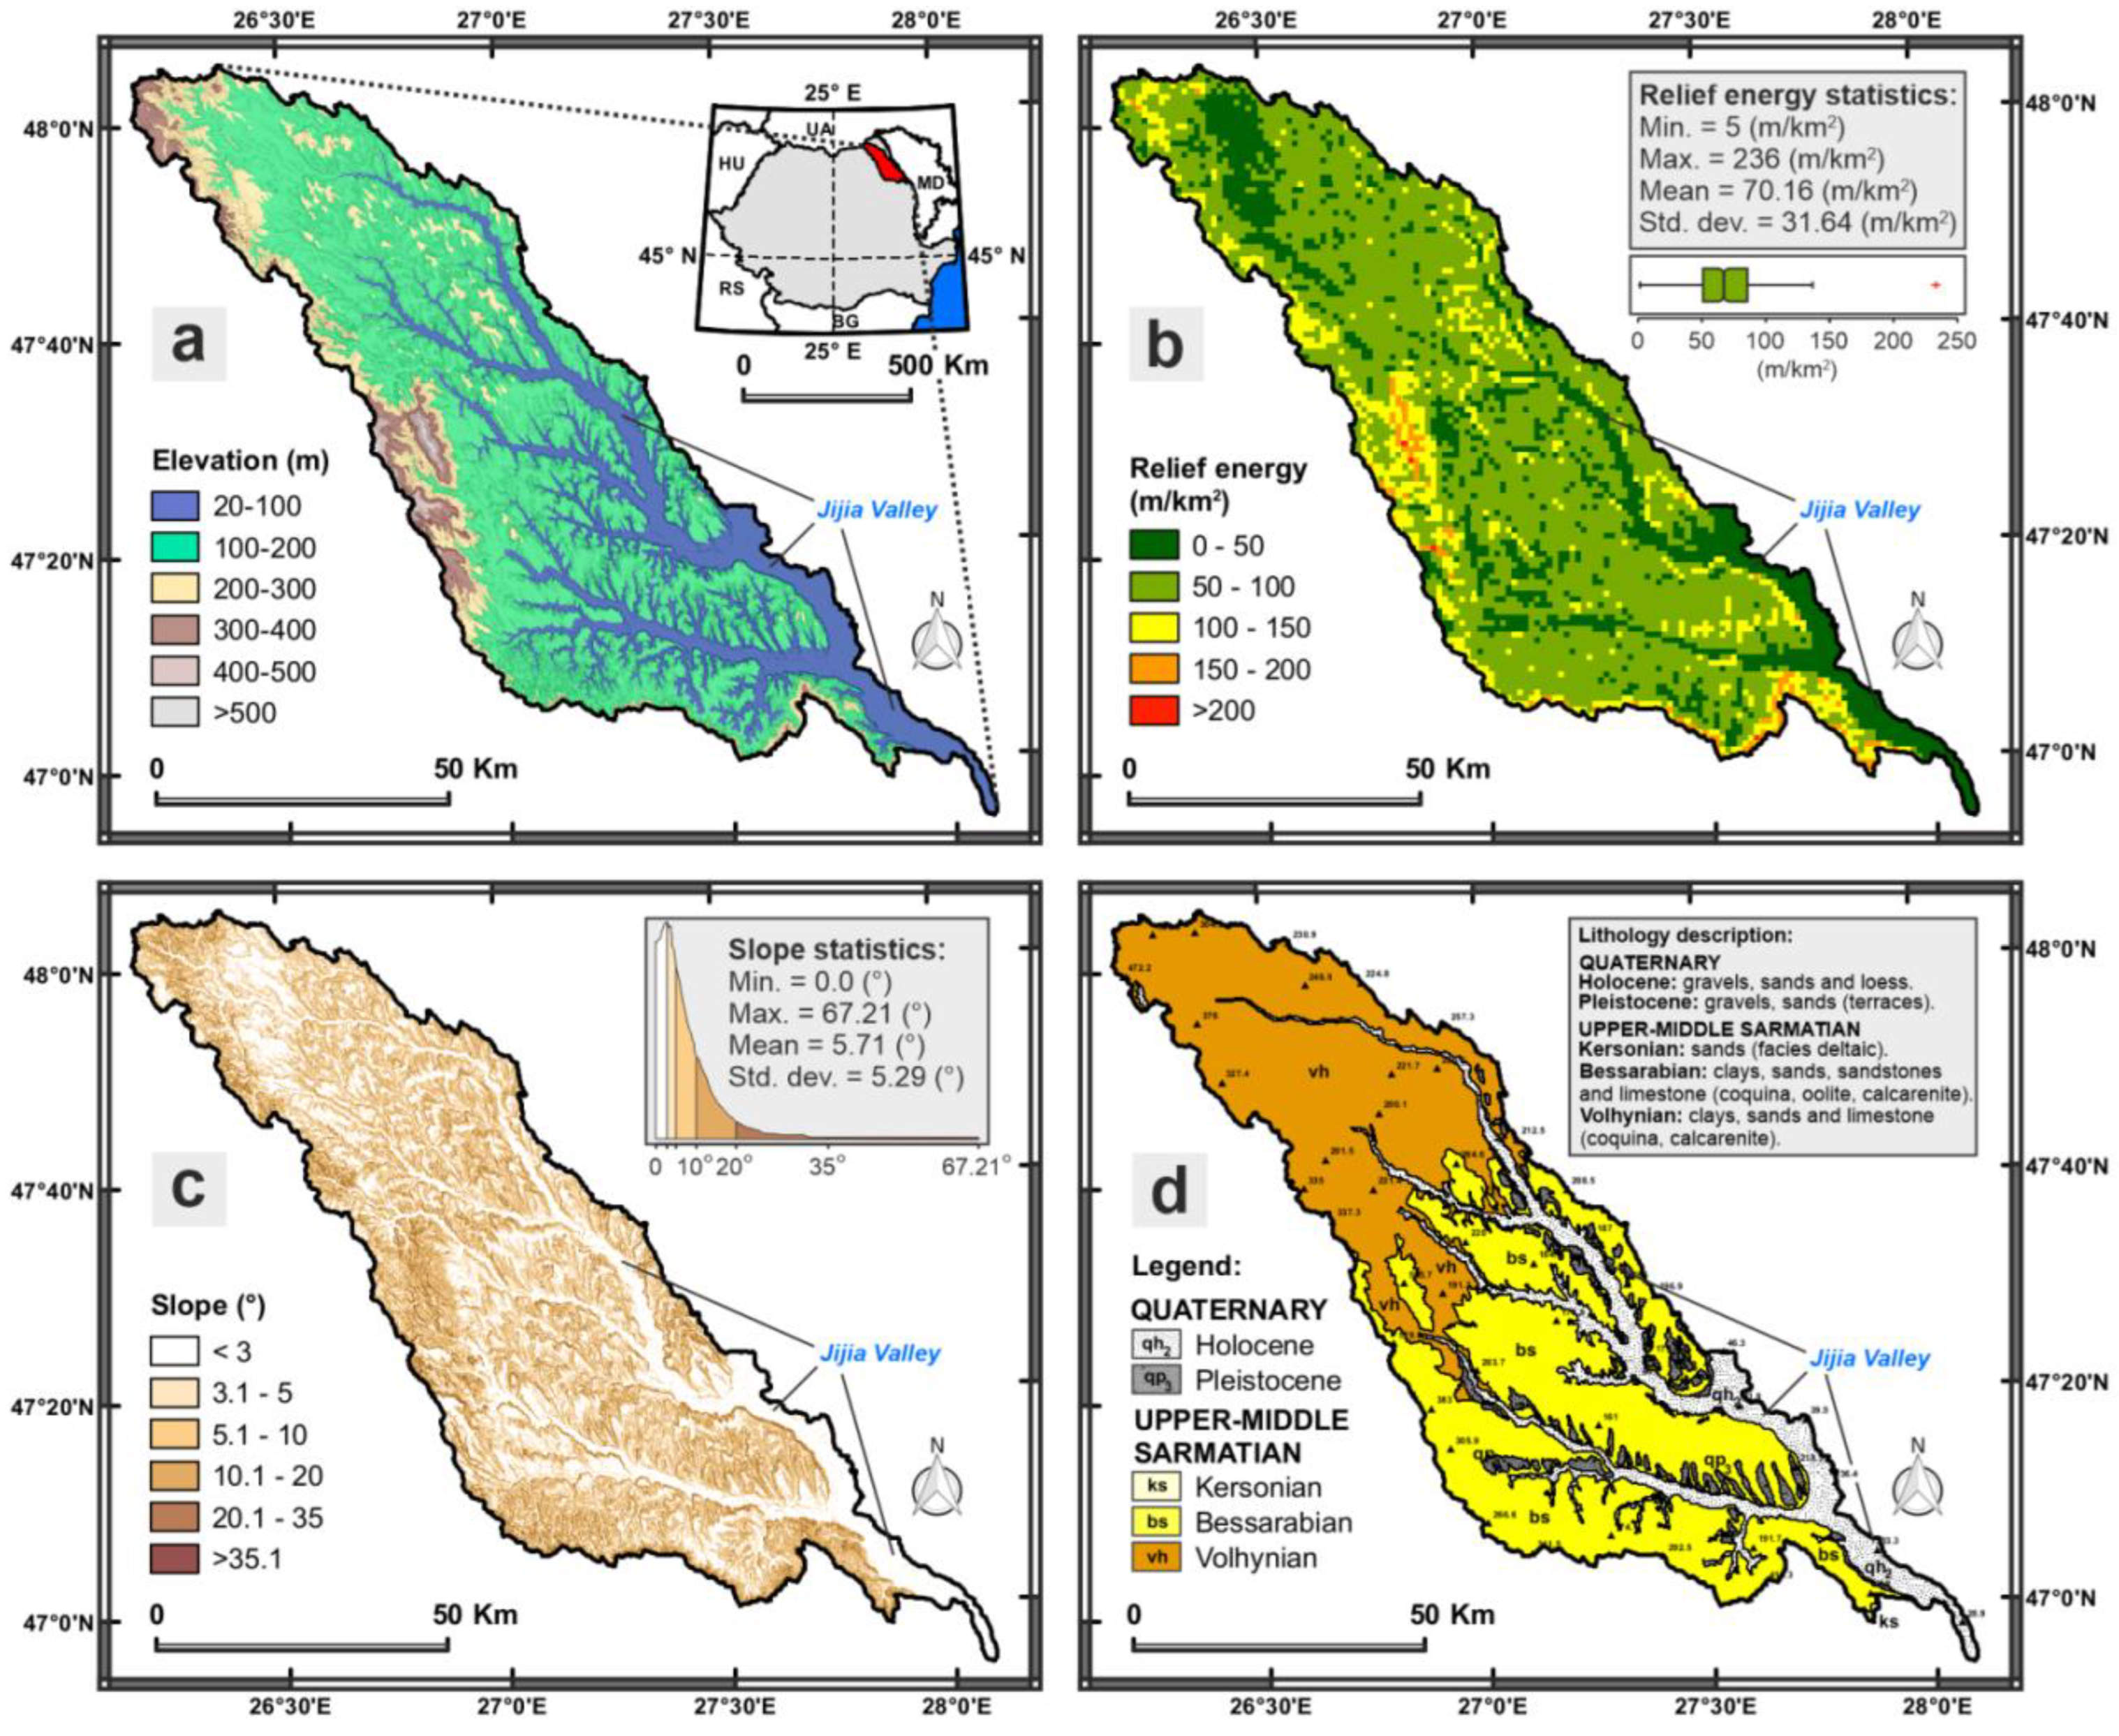
2. Study Area
2.1. Geography of the Jijia Catchment
2.2. Archaeological Context: Late Bronze Age—Noua Culture
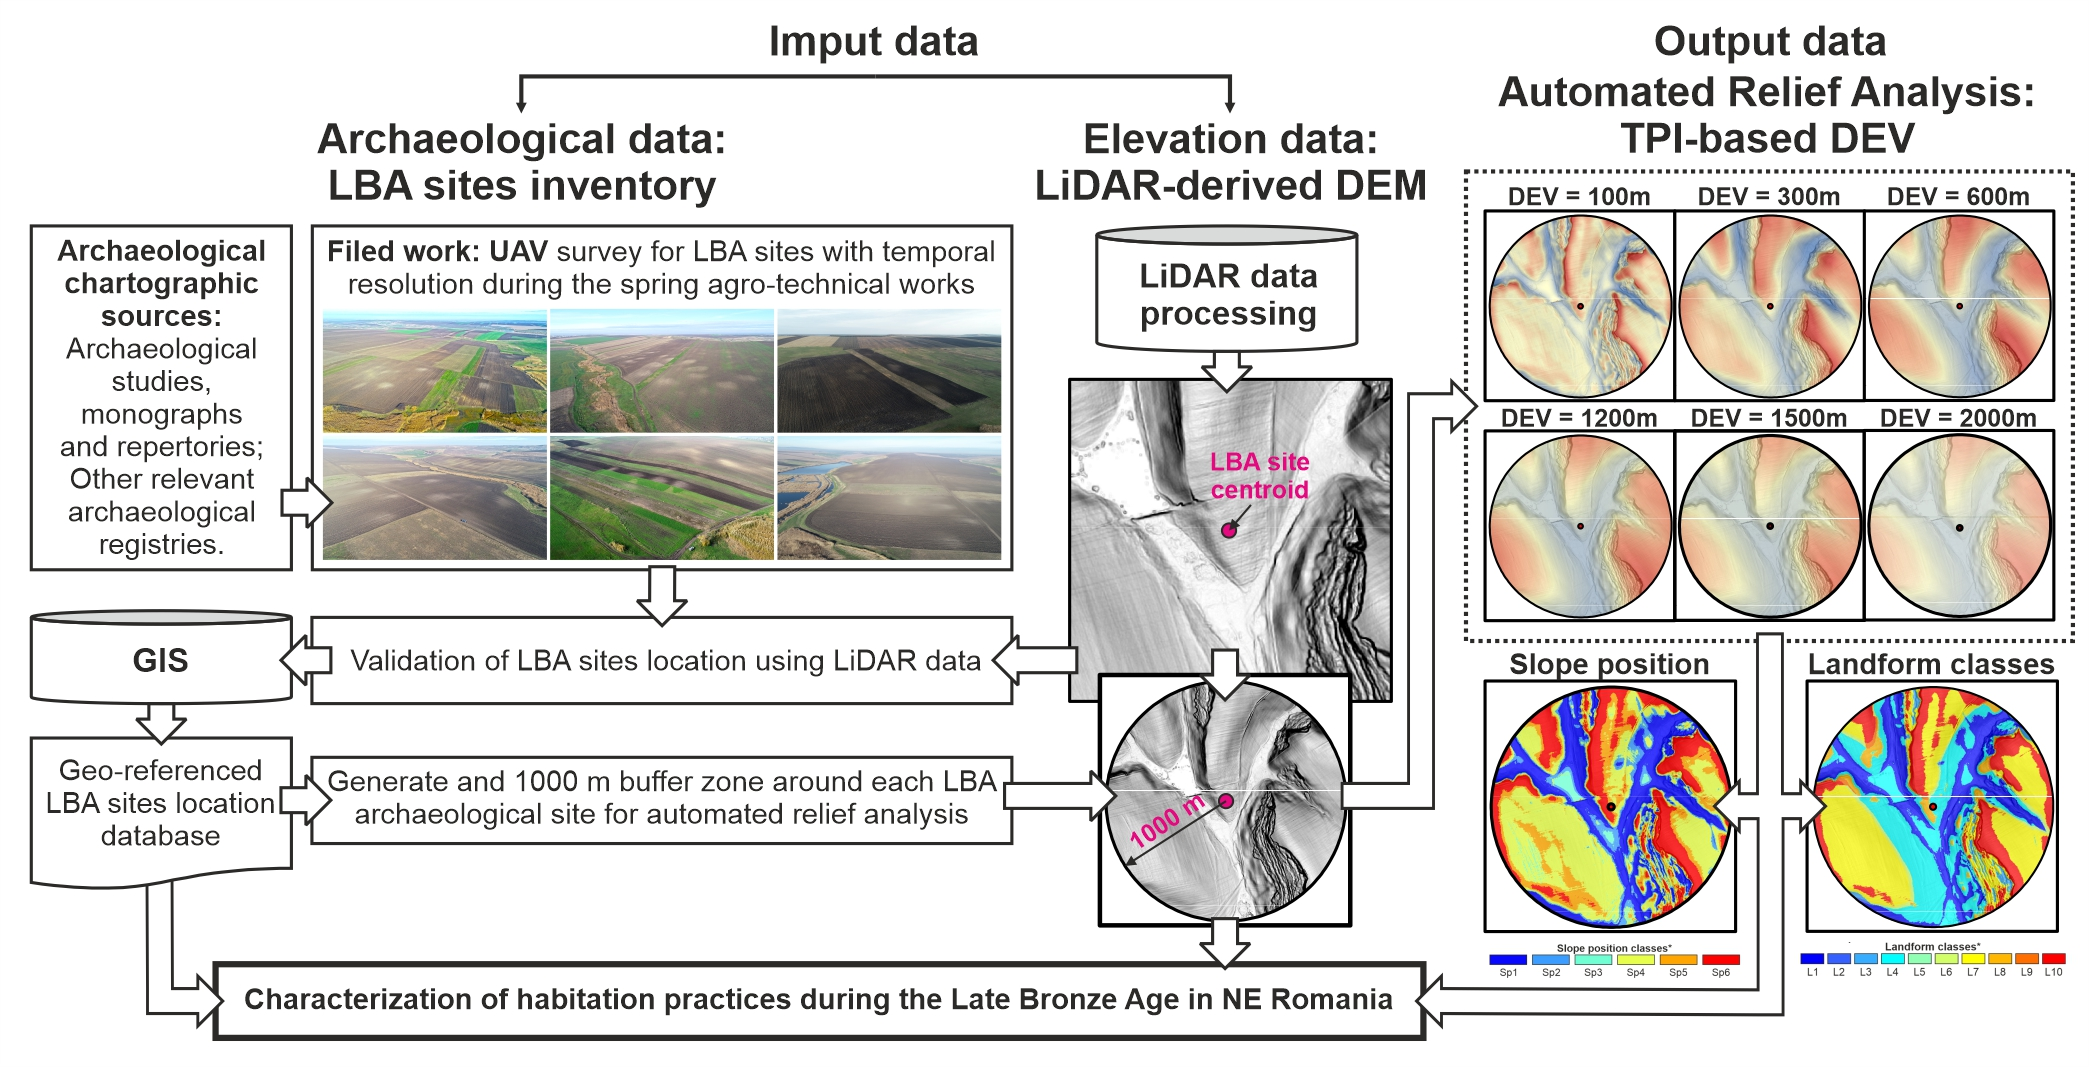
3. Data and Methods
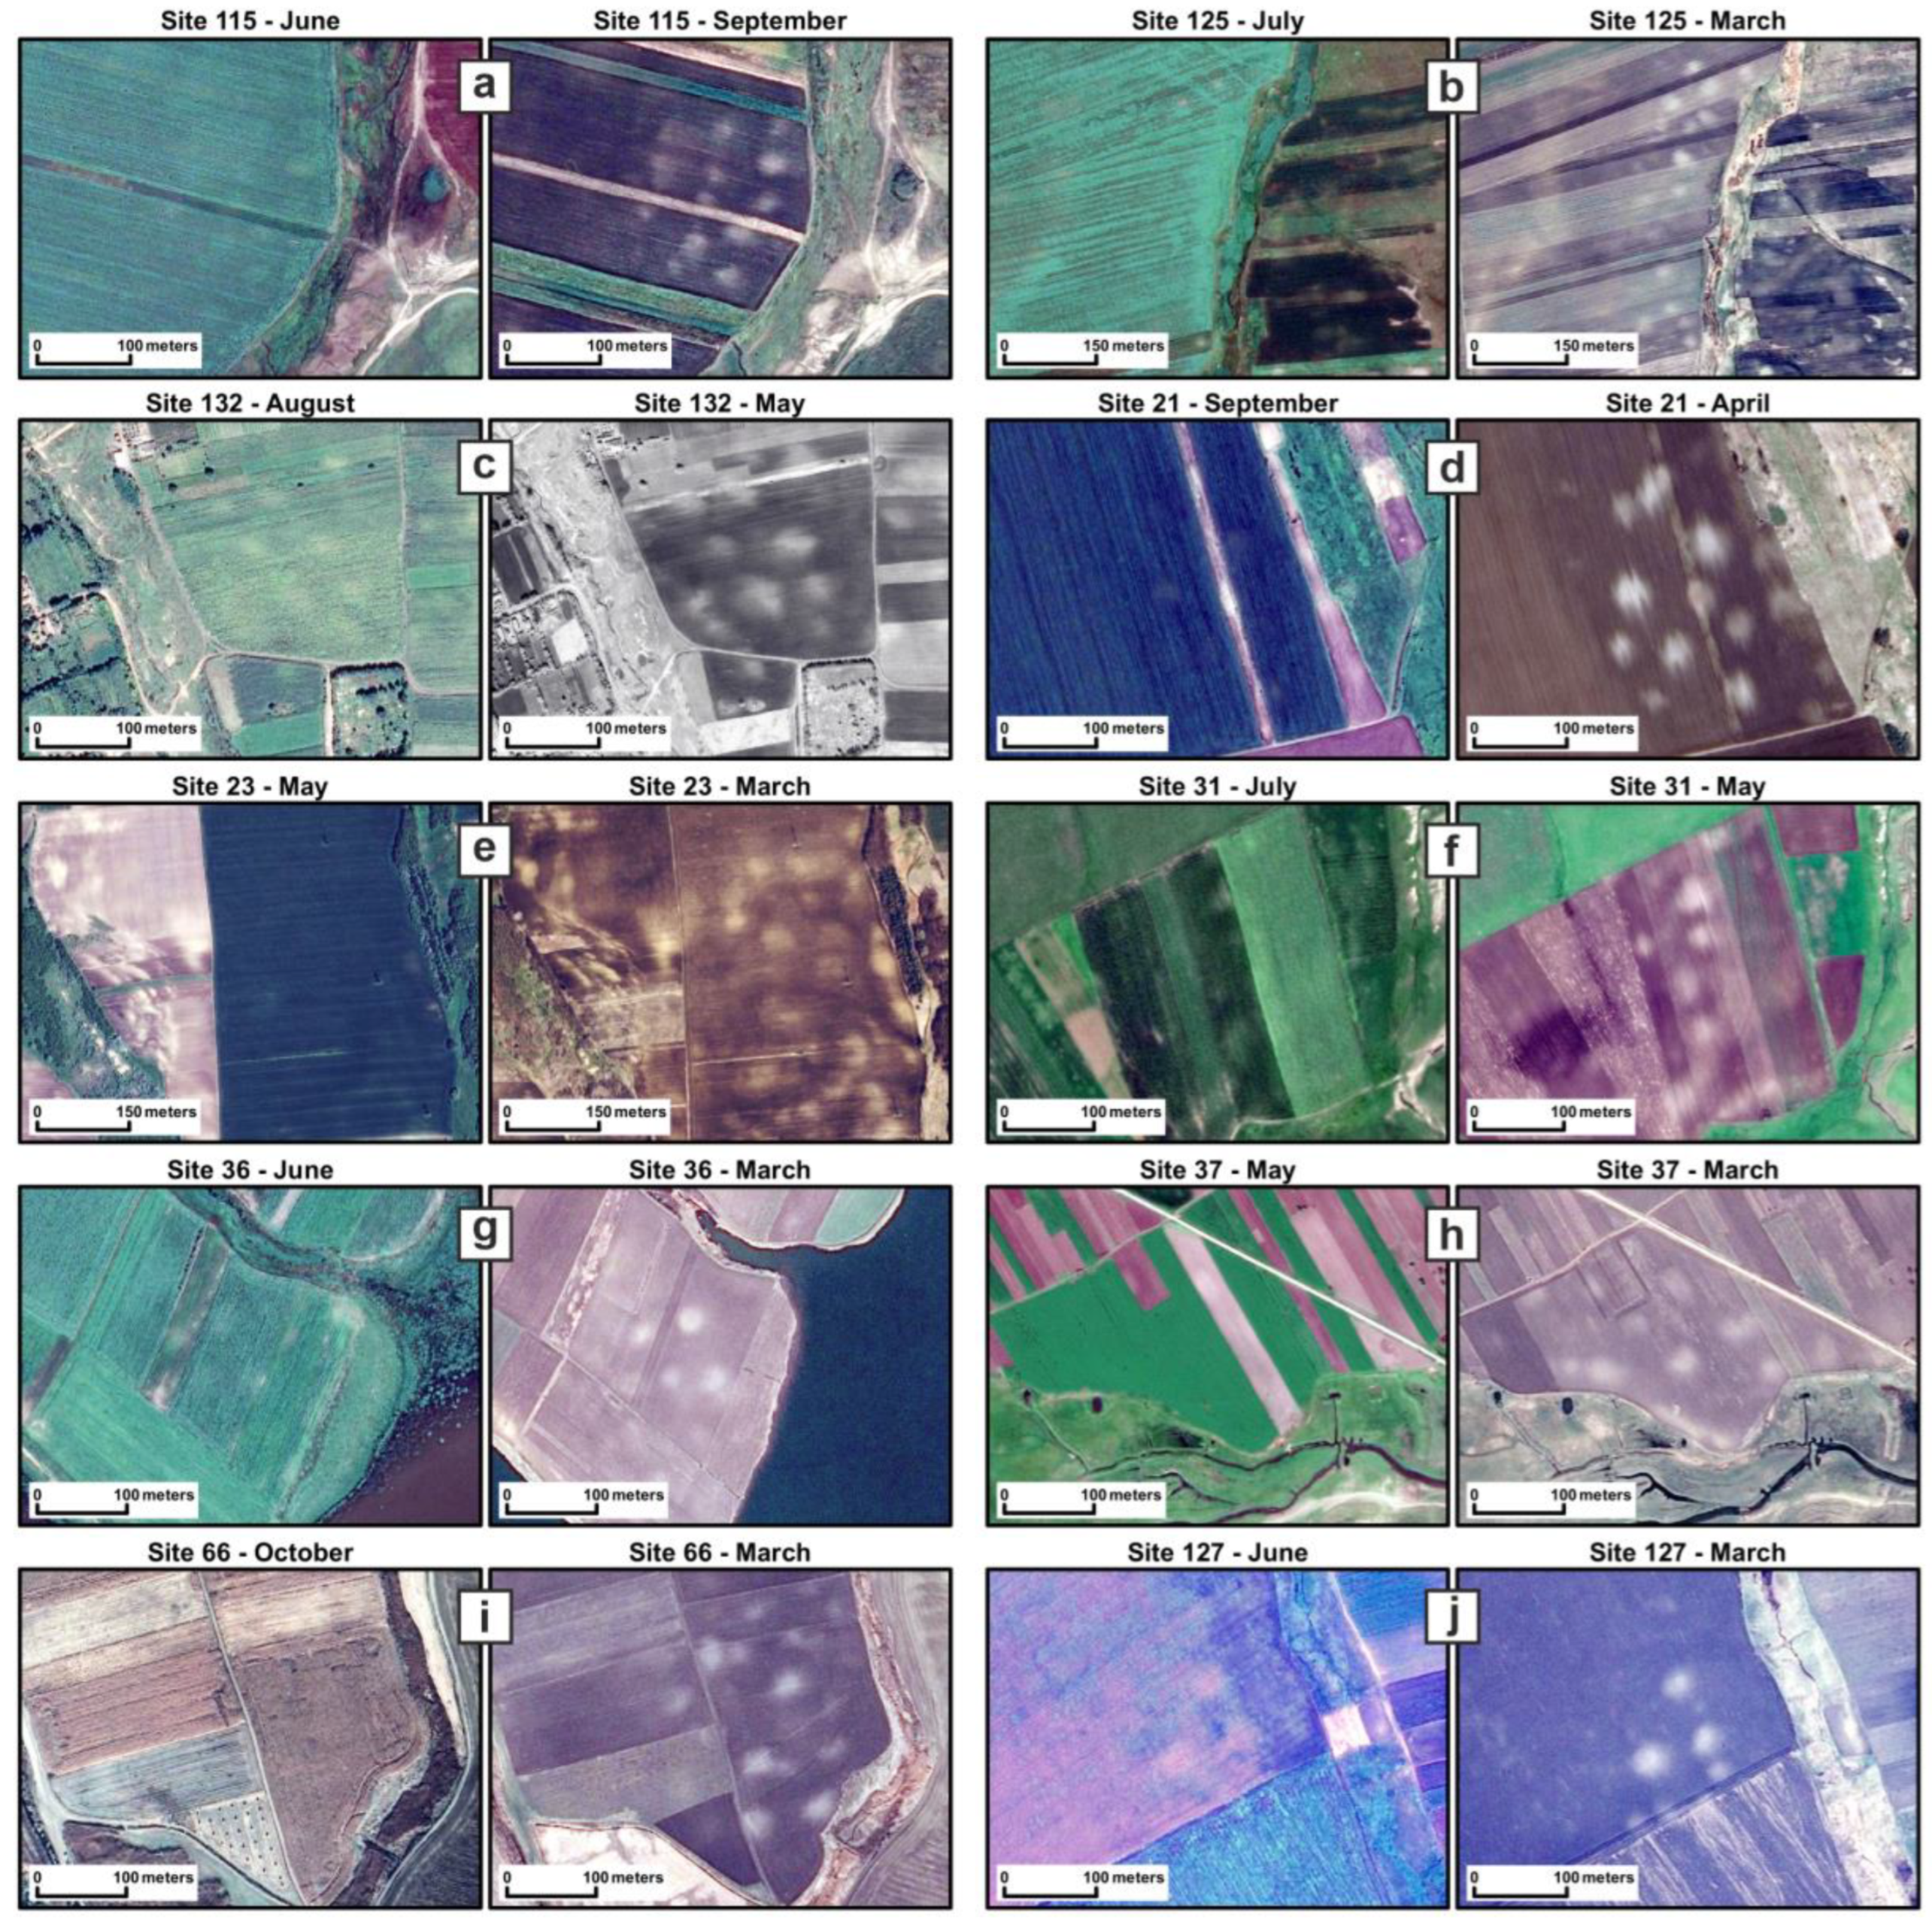
3.1. Archaeological Data: LBA Sites Inventory
3.2. Elevation Data: LiDAR-Derived DEM
3.3. Automated Relief Analysis: TPI-Based DEV
4. Results
4.1. Landform Classification Accuracy and Optimal Neighborhood Sizes Combination
4.2. Slope Position Classification of LBA Sites’ Locations
4.3. Landform Classification of LBA Sites’ Locations
5. Discussion
5.1. Characterization of Habitation Practices during the Late Bronze Age
5.2. Automated Relief Analysis: Applicability and Limitations for Archaeological Studies
6. Conclusions
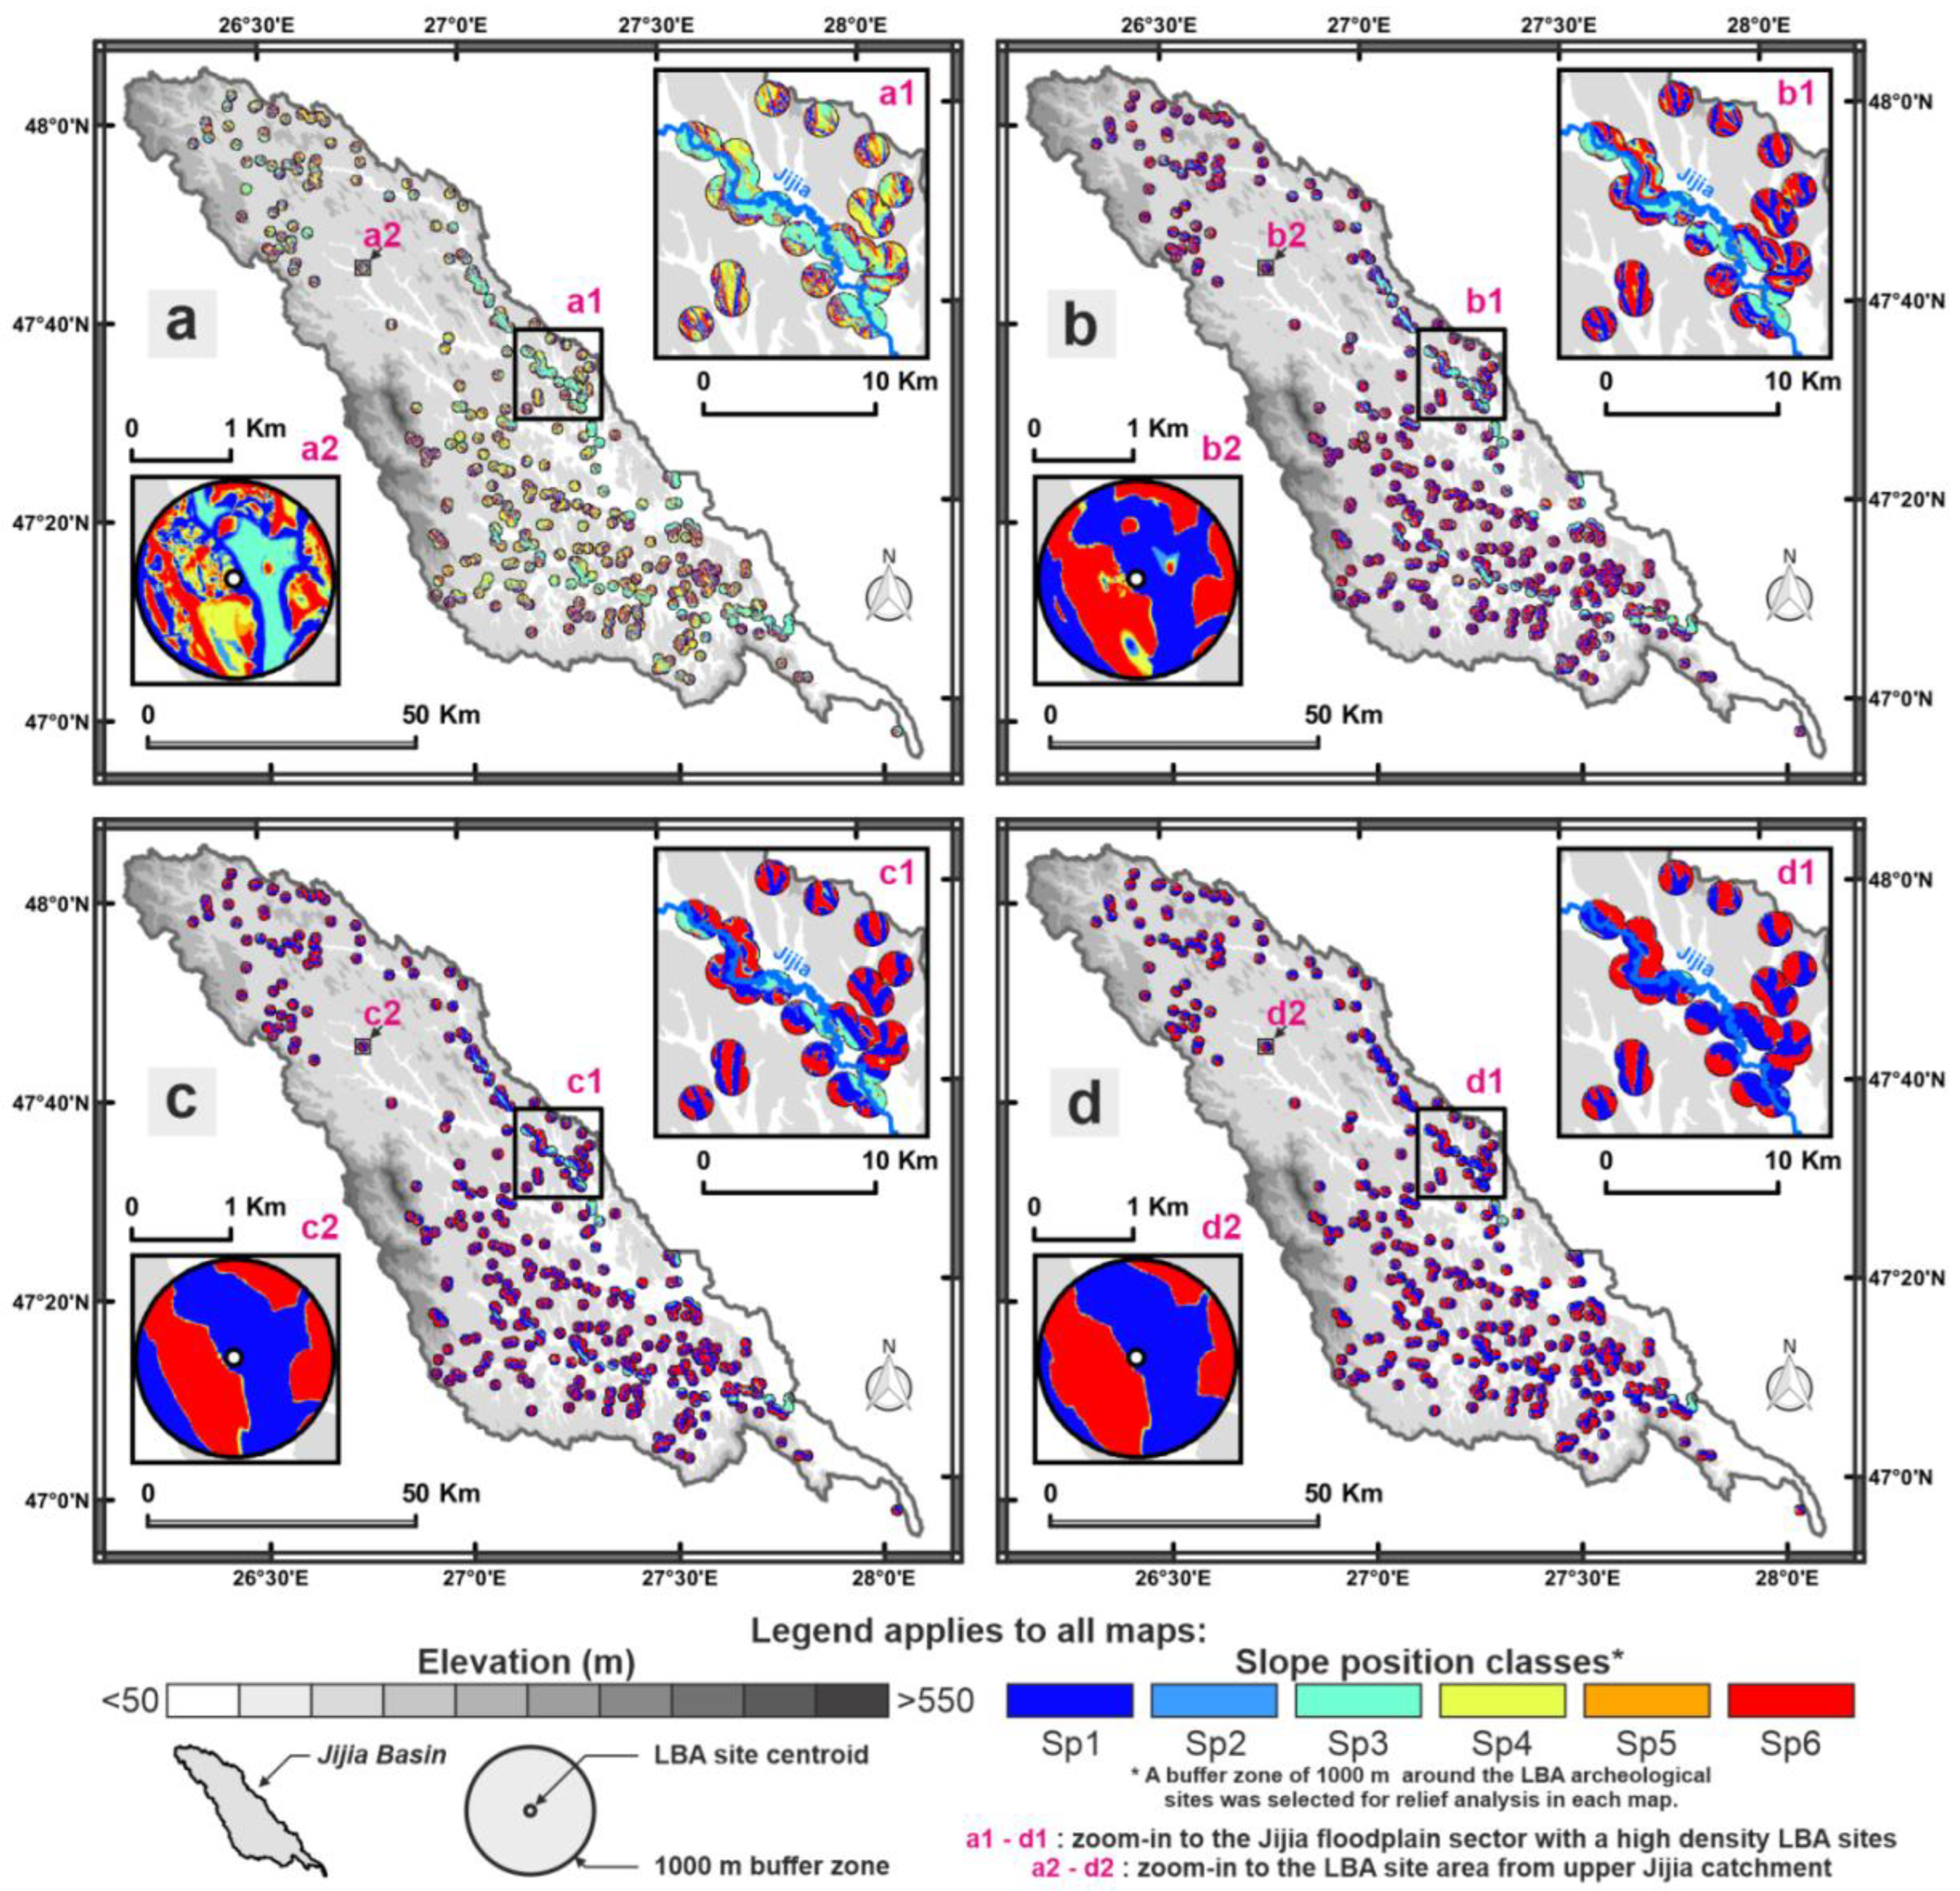
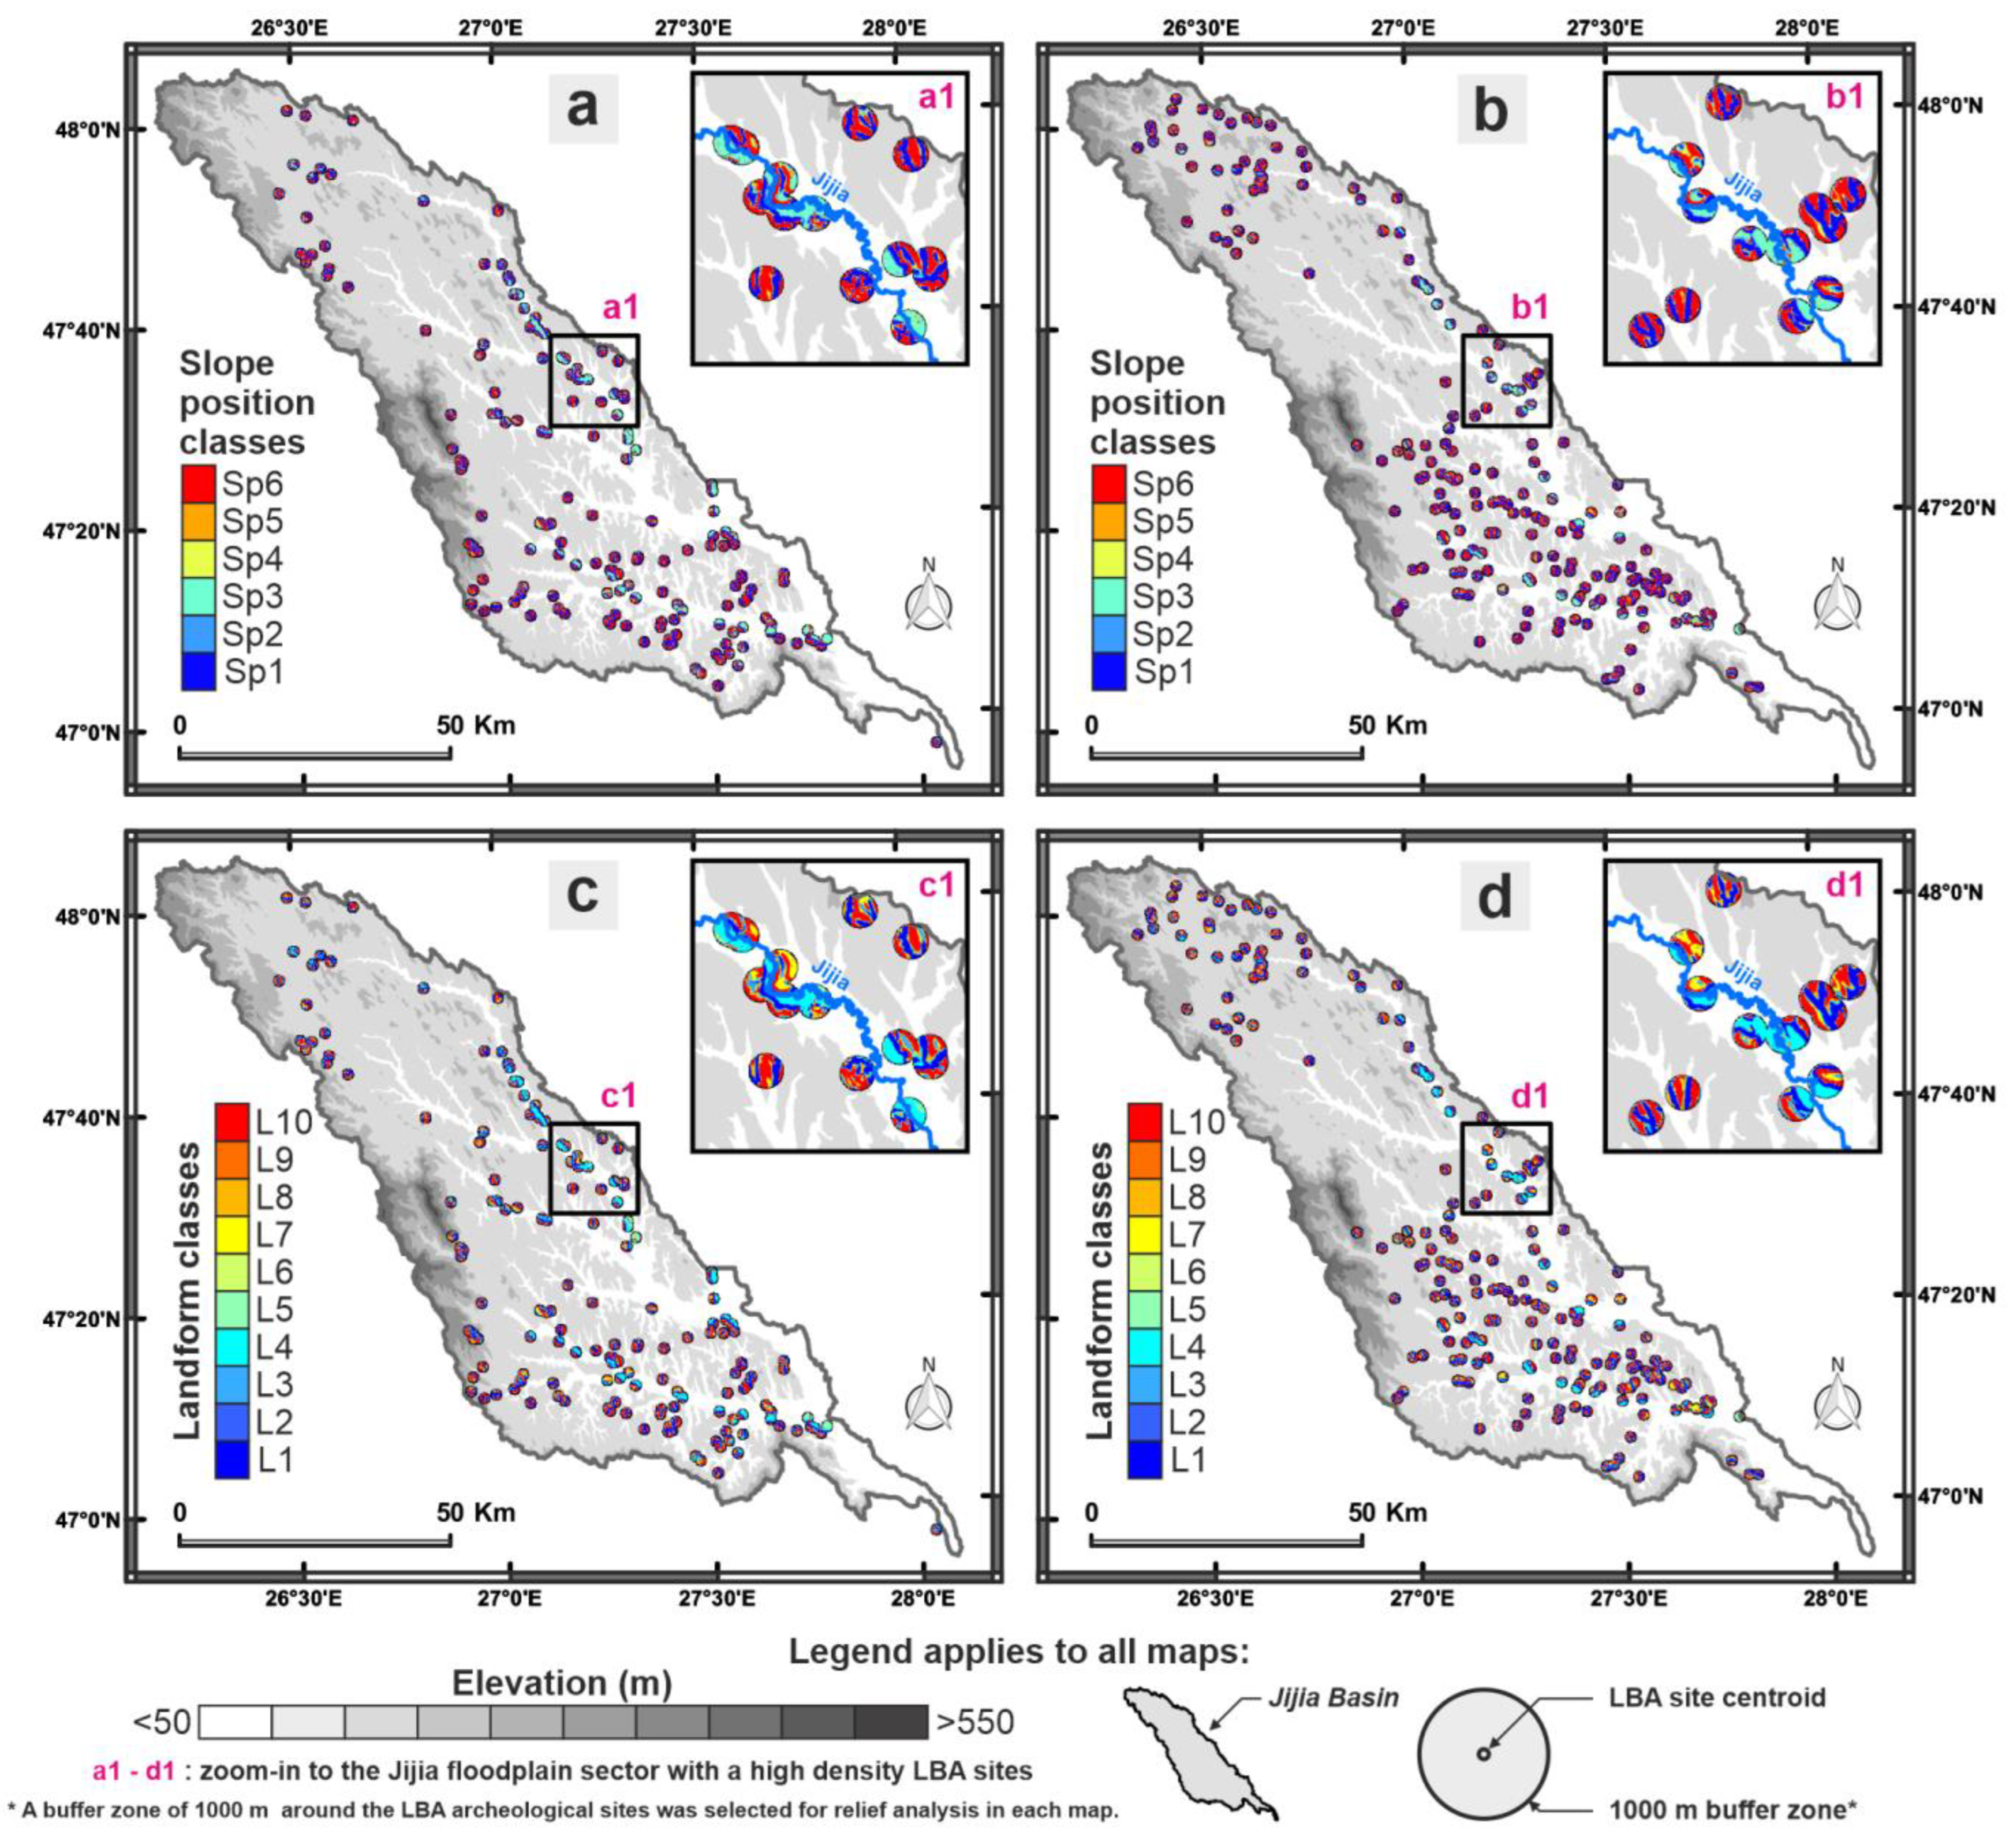
- According to the slope position classification (first method) resulting from R = 300 m of TPI-based DEV and LiDAR-derived slope combination, over 38% of LBA settlements were placed on the concave landforms (Sp1—valleys and Sp2—lower slope); 7.45% of LBA sites were located on the Sp3—flat areas (≤5°); and over 54% of LBA settlements were placed on the convex landforms (Sp4—middle slope, Sp5—upper slope and Sp6—ridges, tops of the hills).
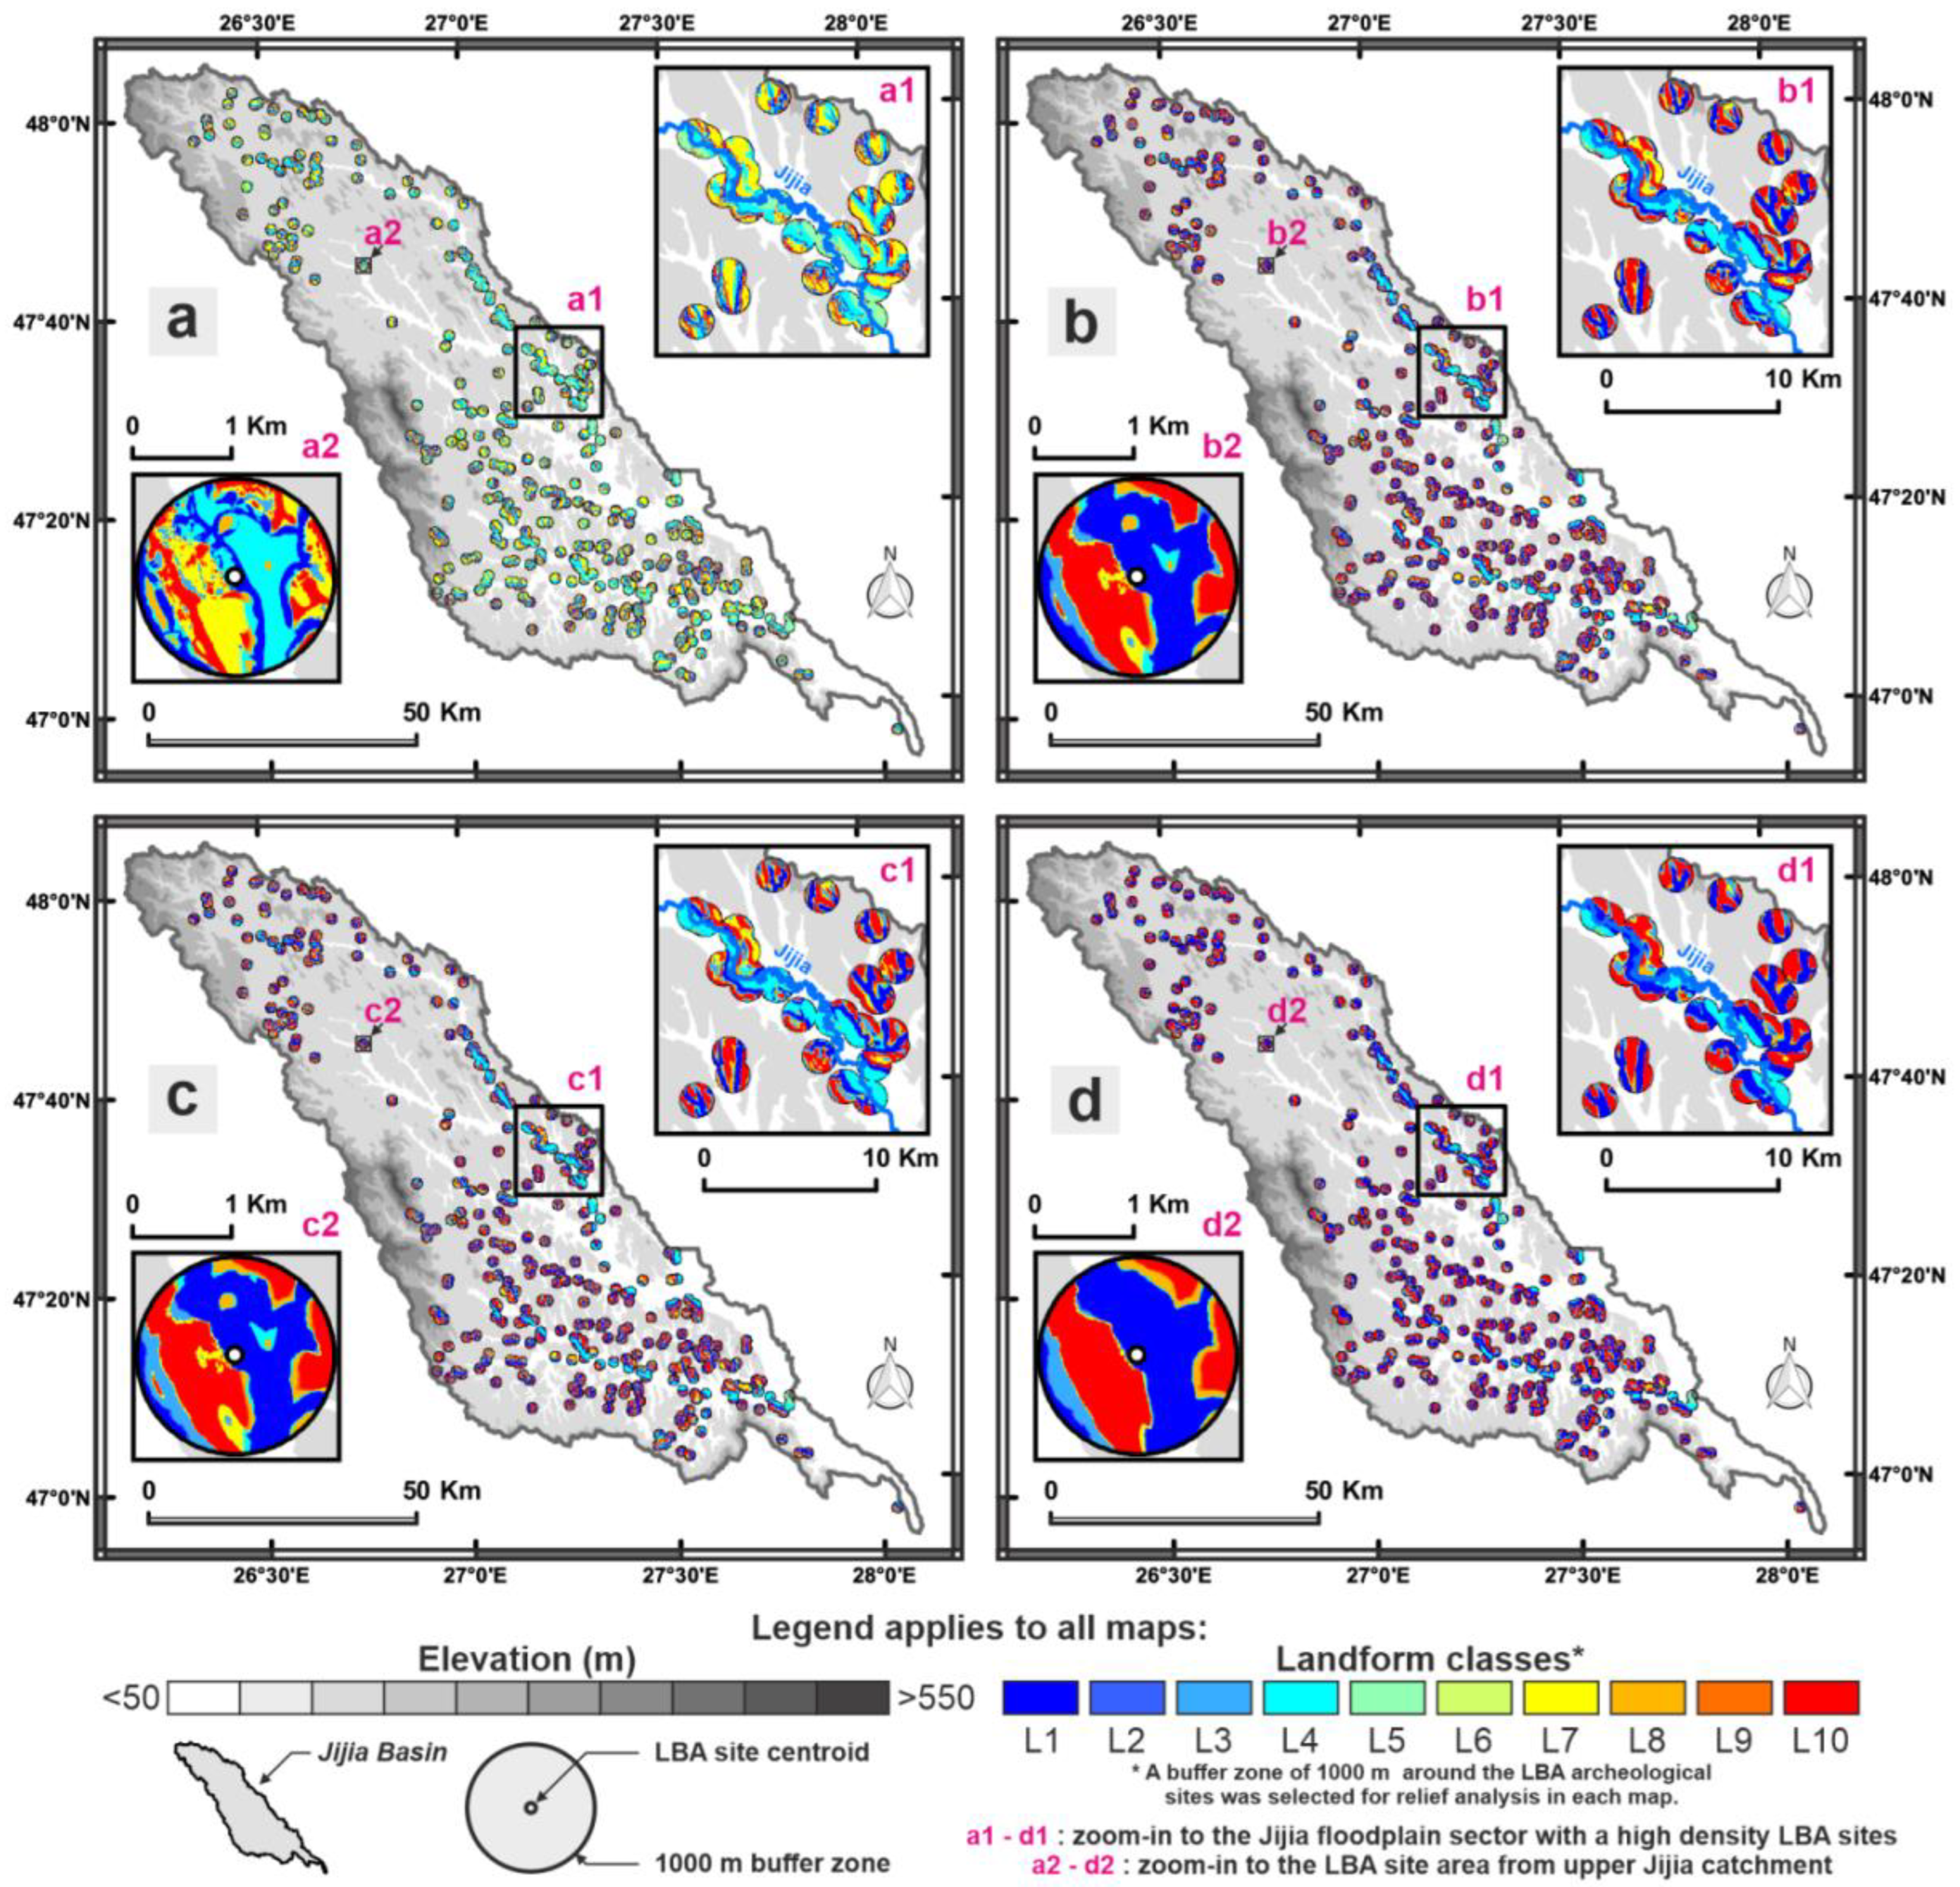
- According to the TPI-based DEV landform classification using small-DEV 300 m and large-DEV 1200 m combined neighborhood sizes, over 47% of LBA sites were located on convex landforms (L10—hilltops, high ridges, L9—middle slope ridges, small hills in the plains, L8—local ridges/hills in valleys and L7—upper slopes), 1.38% of the LBA settlements were located on the flat or gentle slope areas (L5—plains/flat areas and L6—open slopes) and 50.82% of LBA sites were located on the concave landforms (L4—U-shaped valleys, L3—upland drainages/headwaters, L2—middle slope drainages/shallow valleys and L1—deeply incised streams).
- The very high-density of NC sites located just on the four specific landforms, of which two are convex landforms (L10—hilltops, high ridges and L8—local ridges/hills in valleys) and two are concave landforms (L4—U-shaped valleys and L1—deeply incised streams), indicates habitation practices based on agro-pastoral activities manly induced by the suitability of the local topography. Additionally, the landform patterns highlight a specific eco-cultural niche just for the LBA communities, different from those of the other prehistoric cultures (e.g., Precucuteni-Cucuteni Culture) which flourished in the same workspace.
Supplementary Materials
Author Contributions
Funding
Acknowledgments
Conflicts of Interest
Abbreviations
| GIS | Geographic Information System |
| TPI | Topographic Position Index |
| SD | Standard Deviation |
| DEV | Standard Deviation of Topographic Position Index |
| LiDAR | Light Detection and Ranging |
| DEM | Digital Elevation Model |
| IDW | Inverse Distance Weighting |
| R | Radius |
| Average elevation pixels for various candidate radii | |
| Central pixel elevation for various candidate radii | |
| BA | Bronze Age |
| LBA | Late Bronze Age |
| NC | NOUA Culture |
| NARW-PBWA | Romanian Waters–Prut-Bîrlad Water Administration |
| PBRB | Prut–Bîrlad River Basin |
| UAV | Unmanned Aerial Vehicle |
| Sp1 | Slope position class: Valley |
| Sp2 | Slope position class: Lower slope |
| Sp3 | Slope position class: Flat area |
| Sp4 | Slope position class: Middle slope |
| Sp5 | Slope position class: Upper slope |
| Sp6 | Slope position class: Ridge |
| L1 | Landform class: Deeply incised streams |
| L2 | Landform class: Middle slope drainage, shallow valley |
| L3 | Landform class: Upland drainage, headwaters |
| L4 | Landform class: U-shaped valleys |
| L5 | Landform class: Plains, flat areas (<5°) |
| L6 | Landform class: Open slopes (>5°) |
| L7 | Landform class: Upper slopes |
| L8 | Landform class: Local ridges/hills in valley |
| L9 | Landform class: Middle slope ridges, small hills in plains |
| L10 | Landform class: Hill tops, high ridges |
References
- Butzer, K.W. Challenges for a cross-disciplinary geoarchaeology: The intersection between environmental history and geomorphology. Geomorphology 2008, 101, 402–411. [Google Scholar] [CrossRef]
- Verhagen, P.; Drăguț, L. Object-based landform delineation and classification from DEMs for archaeological predictive mapping. J. Archaeol. Sci. 2012, 39, 698–703. [Google Scholar] [CrossRef]
- Nicu, I.C.; Mihu-Pintilie, A.; Williamson, J. GIS-Based and Statistical Approaches in Archaeological Predictive Modelling (NE Romania). Sustainability 2019, 11, 5969. [Google Scholar] [CrossRef] [Green Version]
- Biscione, M.; Danese, M.; Masini, N. A framework for cultural heritage management and research: The Cancellara case study. J. Maps 2018, 14, 576–582. [Google Scholar] [CrossRef] [Green Version]
- Gioia, D.; Bavusi, M.; Di Leo, P.; Giammatteo, T.; Schiattarella, T. Geoarchaeology and geomorphology of the Metaponto area, Ionian coastal belt, Italy. J. Maps 2020, 16, 117–125. [Google Scholar] [CrossRef] [Green Version]
- Piloyan, A.; Konečný, M. Semi-Automated Classification of Landform Elements in Armenia Based on SRTM DEM using K-Means Unsupervised Classification. Quaest. Geogr. 2017, 36, 93–103. [Google Scholar] [CrossRef] [Green Version]
- Simensen, T.; Halvorsen, R.; Erikstad, L. Methods for landscape characterization and mapping: A systematic review. Land Use Policy 2018, 75, 557–569. [Google Scholar] [CrossRef]
- Deumlich, D.; Schmidt, R.; Sommer, M. A multiscale soil-landform relationship in the glacial-drift area based on digital terrain analysis and soil attributes. J. Plant. Nutr. Soil Sci. 2010, 173, 843–851. [Google Scholar] [CrossRef]
- Illés, G.; Kovács, G.; Heil, B. Comparing and evaluating digital soil mapping methods in a Hungarian forest reserve. Can. J. Soil Sci. 2011, 91, 615–626. [Google Scholar] [CrossRef]
- Mora-Vallejo, A.; Claessens, L.; Stoorvogel, J.; Heuvelink, G.B.M. Small scale digital soil mapping in southeastern Kenya. Catena 2008, 76, 44–53. [Google Scholar] [CrossRef]
- Pracilio, G.; Smettem, K.; Bennett, D.; Harper, R.; Adams, M. Site assessment of a woody crop where a shallow hardpan soil layer constrained plant growth. Plant Soil 2006, 288, 113–125. [Google Scholar] [CrossRef]
- Dębniak, K.; Mège, D.; Gurgurewicz, J. Geomorphology of Ius Chasma, Valles Marineris, Mars. J. Maps 2017, 13, 260–269. [Google Scholar] [CrossRef] [Green Version]
- Drăguț, L.; Blaschke, T. Automated classification of landform elements using object-based image analysis. Geomorphology 2006, 81, 330–344. [Google Scholar] [CrossRef]
- McGarigal, K.; Tagil, S.; Cushman, S. Surface metrics: An alternative to patch metrics for the quantification of landscape structure. Landsc. Ecol. 2009, 24, 433–450. [Google Scholar] [CrossRef]
- Tagil, S.; Jenness, J. GIS-based automated landform classification and topographic, landcover and geologic attributes of landforms around the Yazoren Polje, Turkey. J. App. Sci. 2008, 8, 910–921. [Google Scholar] [CrossRef] [Green Version]
- Wilson, M.F.J.; O’Connell, B.; Brown, C.; Guinan, J.C.; Grehan, A.J. Multiscale terrain analysis of multibeam bathymetry data for habitat mapping on the continental slope. Mar. Geod. 2007, 30, 3–35. [Google Scholar] [CrossRef] [Green Version]
- Wright, D.J.; Heyman, W.D. Introduction to the special issue: Marine and coastal GIS for geomorphology, habitat mapping, and marine reserves. Mar. Geod. 2008, 31, 223–230. [Google Scholar] [CrossRef]
- Zieger, S.; Stieglitz, T.; Kininmonth, S. Mapping reef features from multibeam sonar data using multiscale morphometric analysis. Mar. Geod. 2009, 264, 209–217. [Google Scholar] [CrossRef]
- Lesschen, J.P.; Kok, K.; Verburg, P.H.; Cammeraat, L.H. Identification of vulnerable areas for gully erosion under different scenarios of land abandonment in southeast Spain. Catena 2007, 71, 110–121. [Google Scholar] [CrossRef]
- Liu, H.; Bu, R.; Liu, J.; Leng, W.; Hu, Y.; Yang, L.; Liu, H. Predicting the wetland distributions under climate warming in the Great Xing’an Mountains, northeastern China. Ecol. Res. 2011, 26, 605–613. [Google Scholar] [CrossRef]
- Bunn, A.; Hughes, M.; Salzer, M. Topographically modified tree-ring chronologies as a potential means to improve paleoclimate inference. Clim. Change 2011, 105, 627–634. [Google Scholar] [CrossRef]
- Guitet, S.; Cornu, J.-F.; Brunaux, O.; Betbeder, J.; Carozza, J.-M.; Richard-Hansen, C. Landform and landscape mapping, French Guiana (South America). J. Maps 2013, 9, 325–335. [Google Scholar] [CrossRef] [Green Version]
- Fei, S.; Schibig, J.; Vance, M. Spatial habitat modeling of American chestnut at Mammoth Cave National Park. For. Ecol. Manag. 2007, 252, 201–207. [Google Scholar] [CrossRef]
- Argyriou, A.V.; Teeuw, R.M.; Sarris, A. GIS-based landform classification of Bronze Age archaeological sites on Crete Island. PLoS ONE 2017, 12, e0170727. [Google Scholar] [CrossRef] [PubMed] [Green Version]
- Mihu-Pintilie, A.; Nicu, I.C. GIS-based Landform Classification of Eneolithic Archaeological Sites in the Plateau-plain Transition Zone (NE Romania): Habitation Practices vs. Flood Hazard Perception. Remote Sens. 2019, 11, 915. [Google Scholar] [CrossRef] [Green Version]
- De Reu, J.; Bourgeois, J.; De Smedt, P.; Zwertvaegher, A.; Antrop, M.; Bats, M.; De Maeyer, P.; Finke, P.; Van Meirvenne, M.; Verniers, J.; et al. Measuring the relative topographic position of archaeological sites in the landscape, a case study on the Bronze Age barrows in northwest Belgium. J. Archaeol. Sci. 2011, 38, 3435–3446. [Google Scholar] [CrossRef]
- Noviello, M.; Cafarelli, B.; Calculli, C.; Sarris, A.; Mairota, P. Investigating the distribution of archaeological sites: Multiparametric vs probability models and potentials for remote sensing data. Appl. Geogr. 2018, 95, 34–44. [Google Scholar] [CrossRef]
- Schmaltz, E.; Märker, M.; Rosner, H.-J.; Kandel, A.W. The integration of landscape processes in archaeological site prediction in the Mugello basin (Tuscany/Italy). In Proceedings of the 42nd Annual Conference on Computer Applications and Quantitative Methods in Archaeology CAA; Giligny, F., Djindjian, F., Costa, L., Moscati, P., Robert, S., Eds.; Paris 1 Panthéon-Sorbonne University: Paris, France, 2014; pp. 451–458. [Google Scholar]
- Verhagen, P.; Whitley, T.G. Integrating Archaeological Theory and Predictive Modeling: A Live Report from the Scene. J. Archaeol. Method Theory 2012, 19, 49–100. [Google Scholar] [CrossRef] [Green Version]
- Gioia, D.; Bavusi, M.; Di Leo, P.; Giammatteo, T.; Schiattarella, M. A geoarchaeological study of the Metaponto coastal belt, southern Italy, based on geomorphological mapping and GIS-supported classification of landforms. Geogr. Fis. E Din. Quat. 2016, 39, 137–148. [Google Scholar] [CrossRef]
- Asăndulesei, A. Inside a Cucuteni Settlement: Remote Sensing Techniques for Documenting an Unexplored Eneolithic Site from Northeastern Romania. Remote Sens. 2017, 9, 41. [Google Scholar] [CrossRef] [Green Version]
- Brigan, R.; Weller, O. Neo-Eneolithic settlement pattern and salt exploitation in Romanian Moldavia. J. Archaeol. Sci. Rep. 2018, 17, 68–78. [Google Scholar] [CrossRef]
- Dietrich, L. Die Mittlere und Späte Bronzezeit und die Ältere Eisenzeit in Südostsiebenbürgen Aufgrund der Siedlung von Rotbav; European Verlag Dr. Rudolf Habelt GMBH: Bonn, Germany, 2014. [Google Scholar]
- Huţanu, E.; Mihu-Pintilie, A.; Urzica, A.; Paveluc, L.E.; Stoleriu, C.C.; Grozavu, A. Using 1D HEC-RAS Modeling and LiDAR Data to Improve Flood Hazard Maps Accuracy: A Case Study from Jijia Floodplain (NE Romania). Water 2020, 12, 1624. [Google Scholar] [CrossRef]
- Stoleriu, C.C.; Urzica, A.; Mihu-Pintilie, A. Improving flood risk map accuracy using high-density LiDAR data and the HEC-RAS river analysis system: A case study from north-eastern Romania. J. Flood Risk Manag. 2020, 13, e12572. [Google Scholar] [CrossRef]
- Bacauanu, V. Câmpia Moldovei. Studiu Geomorfologic; Editura Academiei Romane: Bucuresti, Romania, 1968; pp. 1–222. [Google Scholar]
- Niculiță, M.; Mărgărint, M.C.; Santangelo, M. Archaeological evidence for Holocene landslide activity in the eastern Carpathian lowland. Quat. Int. 2016, 415, 175–189. [Google Scholar] [CrossRef]
- Haase, D.; Fink, J.; Haase, G.; Ruske, R.; Pécsi, M.; Richter, H.; Altermann, M.; Jäger, K.-D. Loess in Europe—its spatial distribution based on a European loess map, scale 1:250,000. Quat. Sci. Rev. 2007, 26, 1301–1312. [Google Scholar] [CrossRef]
- Romanescu, G.; Cîmpianu, C.I.; Mihu-Pintilie, A.; Stoleriu, C.C. Historic flood events in NE Romania (post-1990). J. Maps 2017, 13, 787–798. [Google Scholar] [CrossRef]
- Mărgărint, M.C.; Niculiță, M. Landslide Type and Pattern in Moldavian Plateau, NE Romania. In Landform Dynamics and Evolution in Romania; Radoane, M., Vespremeanu-Stroe, A., Eds.; Springer Geography, Springer: Cham, Switzerland, 2017; pp. 271–304. [Google Scholar] [CrossRef]
- Nicu, I.C. Is overgrazing really influencing soil erosion? Water 2018, 10, 1077. [Google Scholar] [CrossRef] [Green Version]
- Nicu, I.C. Natural risk assessment and mitigation of cultural heritage sites in North-eastern Romania (Valea Oii river basin). Area 2019, 51, 142–154. [Google Scholar] [CrossRef]
- Florescu, A.C. Contribuții la cunoașterea culturii Noua. Arheol. Mold. 1964, II–III, 143–216. [Google Scholar]
- Dascălu, L. Bronzul Mijlociu și Târziu în Câmpia Moldovei; Editura Trinitas: Iași, Romania, 2007. [Google Scholar]
- Sava, E. Așezări din Perioada târzie a Epocii Bronzului în Spațiul Pruto-Nistrean (Noua-Sabatinovka); Biblioteca Tyragetia: Chișinău, Moldova, 2014; Volume XXVI. [Google Scholar]
- Zaretskyi, I.A. Za-metka o drevnostyakh Khar’kovskoy gub. Bogodukhovskogo uyezda, slobody Likha-chevki. Khar’kovskiy Sb. 1888, 2, 229. [Google Scholar]
- Gorodčov, V.A. Dnev-nik arkheologicheskikh issledovaniy v Zen’kovskom uyezde Poltavskoy guber- nii v 1906 g. Issledovaniye Bel’skogo gorodishcha. Tr. 14 Arkheologi-Cheskogo S”Yezda V Chernigove 1911, 3, 93–161. [Google Scholar]
- Petrescu-Dîmbovița, M. Contribuții la problema sfîrșitului epocii bronzului și începutului epocii fierului în Moldova. Stud. Și Cercet. De Istor. Veche Și Arheol. 1953, IV, 443–486. [Google Scholar]
- Motzoi-Chicideanu, I. Cenușar. In Enciclopedia Arheologiei și Istoriei Vechi a României, I; Preda, C., Ed.; Editura Enciclopedică: București, Romania, 1994. [Google Scholar]
- Gerškovič, J.P. Fenomen zol’nikov belogrodovskogo tipa. Ross. Arheol. 2004, 4, 104–113. [Google Scholar]
- Comșa, E. L’évolution des types d’habitation du territoire de la Roumanie (depuis l’énéolithique jusqu’à la fin de l’ âge du bronze). In Dritter Internationaler Thrakologischer Kongress zu Ehren W. Tomascheks, 2–6 Juni 1980 Wien; Peschew, A., Popov, D., Jordanov, K., Fol, A., Eds.; Swjat: Sofia, Bulgaria, 1984; pp. 121–137. [Google Scholar]
- Berezanskaja, S.S. Komarówskaja kul’tura. Arheol. Ukrajn’skoj RSR 1985, I, 428–437. [Google Scholar]
- Arnăut, T. Spații sacre și Practici Funerare din Mileniul I a.Chr. în Arealul Carpato-Balcanic; Casa Editorial-Poligrafică Bons Offices: Chișinău, Moldova, 2014. [Google Scholar]
- Pieniąžek, M. Kultische Landschaften in der Steppe. Zu den Anfängen sakraler Architektur im Nordpontikum. Prähistorische Z. 2011, 86, 8–30. [Google Scholar] [CrossRef]
- Sava, E.; Kaiser, E. Poselenie s „Zolnicami” u Acela Odaia-Miciurin, Respublica Moldova (Arheologhicesne i Estestvennonaucinie issledovaniia) / Die Siedlung mit „Aschenhügeln” Beim Dorf Odaia-Miciurin, Republik Moldova (Archäologische und Naturwissenschaftliche Untersuchungen); Biblioteca Tyragetia: Chișinău, Moldova, 2011; Volume XIX. [Google Scholar]
- SMIS-CSNR 17945 (Water Administration Prut—Bîrlad, Romania) Works for Reducing the Flood Risk in Prut—Bîrlad Basin. Available online: http://www.romair.ro (accessed on 28 March 2022).
- Diaconu, V. Cultura Noua în Regiunea Vestică a Moldovei. Ph.D. Thesis, Institute of Archaeology, Romanian Academy, Iași, Romania, 2014. [Google Scholar]
- Florescu, A.C. Repertoriul culturii Noua-Coslogeni din România. In Cultură și Civilizație la Dunărea de Jos; Museum of Dunarea de Jos: Călăraşi, Romania, 1991; Volume IX. [Google Scholar]
- Chirica, V.; Tanasachi, M. Repertoriul Arheologic al Județului Iași, I; Institutul de Istorie și Arheologie ‘A. D. Xenopol’: Iași, Romania, 1984. [Google Scholar]
- Chirica, V.; Tanasachi, M. Repertoriul Arheologic al Județului Iași, II; Institutul de Istorie și Arheologie ‘A. D. Xenopol’: Iași, Romania, 1985. [Google Scholar]
- Păunescu, A.; Șadurschi, P.; Chirica, V. Repertoriul Arheologic al Județului Botoșani; CIMEC: București, Romania, 1976. [Google Scholar]
- Șovan, O.L. Repertoriul Arheologic al Județului Botoșani, 2nd ed.; CIMEC: Botoșani, Romania, 2016. [Google Scholar]
- Themistocleous, K. The Use of UAVs for Cultural Heritage and Archaeology. In Remote Sensing for Archaeology and Cultural Landscapes; Chini, M., Ehlers, M., Lakshmi, V., Mueller, N., Refice, A., Rocca, F., Skidmore, A., Vadrevu, K., Eds.; Springer: Cham, Switzerland, 2020; pp. 241–269. [Google Scholar] [CrossRef]
- Muzirafuti, A.; Cascio, M.; Lanza, S. UAV Photogrammetry-based Mapping the Pocket Beach of Isola Bella, Taormina (Northeastern Sicily). In Proceedings of the 2021 IEEE International Workshop on Metrology for the Sea (MetroSea 2021), Reggio Calabria, Italy, 4–6 October 2021. [Google Scholar] [CrossRef]
- Manfreda, S.; McCabe, M.F.; Miller, P.E.; Lucas, R.; Madrigal, V.P.; Mallinis, G.; Dor, E.B.; Helman, D.; Estes, L.; Ciraolo, G.; et al. On the Use of Unmanned Aerial Systems for Environmental Monitoring. Remote Sens. 2018, 10, 641. [Google Scholar] [CrossRef] [Green Version]
- Zimmerman, D.; Pavlik, C.; Ruggles, A.; Armstrong, M.P. An experimental comparison of ordinary and universal Kriging and Inverse Distance Weighting. Math. Geol. 1999, 31, 375–390. [Google Scholar] [CrossRef]
- Lu, G.Y.; Wong, D.W. An adaptive inverse-distance weighting spatial interpolation technique. Comput. Geosci. 2008, 34, 1044–1055. [Google Scholar] [CrossRef]
- Zhou, T.; Popescu, S.; Malambo, L.; Zhao, K.; Krause, K. From LiDARWaveforms to Hyper Point Clouds: A Novel Data Product to Characterize Vegetation Structure. Remote Sens. 2018, 10, 1949. [Google Scholar] [CrossRef] [Green Version]
- Doneus, M. Openness as visualization technique for interpretative mapping of airborne LiDAR derived digital terrain models. Remote Sens. 2013, 5, 6427–6442. [Google Scholar] [CrossRef] [Green Version]
- Weiss, A.D. Topographic Position and Landforms Analysis. In Proceedings of the ESRI User Conference, San Diego, CA, USA, 9–13 July 2001; pp. 227–245. Available online: http://www.jennessent.com/downloads/TPIposter-TNC_18x22.pdf (accessed on 28 March 2022).
- Jenness, J. Topographic Position Index (tpi_jen.avx) Extension for ArcView 3.x, v. 1.2. Jenness Enterprises. Available online: http://www.jennessent.com/arcview/tpi.htm (accessed on 28 March 2022).
- De Reu, J.; Bourgeois, J.; Bats, M.; Zwertvaegher, A.; Gelorini, V.; De Smedt, P.; Chu, W.; Antrop, M.; De Maeyer, P.; Finke, P.; et al. Application of the topographic position index to heterogeneous landscapes. Geomorphology 2013, 186, 39–49. [Google Scholar] [CrossRef]
- Watanabe, S.; Hajima, T.; Sudo, K.; Nagashima, T.; Takemura, T.; Okajima, H.; Nozawa, T.; Kawase, H.; Abe, M.; Yokohata, M.; et al. MIROC-ESM 2010: Model description and basic results of CMIP5-20c3m experiments. Geosci. Model Dev. 2011, 4, 845–872. [Google Scholar] [CrossRef] [Green Version]
- Hijmans, R.J.; Cameron, S.E.; Parra, J.L.; Jones, P.G.; Jarvis, A. Very High Resolution Interpolated Climate Surfaces for Global Land Areas. Int. J. Climatol. 2005, 25, 1965–1978. [Google Scholar] [CrossRef]
- Ivanova, M.; De Cupere, B.; Ethier, J.; Marinova, E. Pioneer farming in Southeast Europe during the early sixth millennium BC: Climate-related adaptations in the exploitation of plants and animals. PLoS ONE 2018, 13, e0197225. [Google Scholar] [CrossRef] [Green Version]
- Fick, S.E.; Hijmans, R.J. WorldClim 2: New 1km spatial resolution climate surfaces for global land areas. Int. J. Climatol. 2017, 37, 4302–4315. [Google Scholar] [CrossRef]
- Gent, P.R.; Danabasoglu, G.; Donner, L.J.; Holland, M.M.; Hunke, E.C.; Jayne, S.R.; Lawrence, D.M.; Neale, R.B.; Rasch, F.J.; Vertenstein, M.; et al. The Community Climate System Model Version 4. J. Climate 2011, 24, 4973–4991. [Google Scholar] [CrossRef]
- Serjeantson, D. Intensification of animal husbandry in the Late Bronze Age? The contribution of sheep and pigs. In The Earlier Iron Age in Britain and the Near Continent; Haselgrove, C., Pope, R., Eds.; Oxbow Books: Oxford, UK, 2017; pp. 80–93. [Google Scholar] [CrossRef]
- Brașoveanu, C. Perioada târzie a Epocii Bronzului în bazinul Jijiei (România). Habitat și materialitate. Ph.D. Thesis, Alexandru Ioan Cuza University of Iași, Iași, Romania, 2021. [Google Scholar]


| Slope Position Classes Description 1 | DEV Threshold | Landform Classes Abbreviation |
|---|---|---|
| Ridge | TPI > 1 SD | Sp6 |
| Upper slope | 0.5 SD < TPI ≤ 1 SD | Sp5 |
| Middle slope | −0.5 SD < TPI ≤ 0.5 SD | Sp4 |
| Flat area | −0.5 SD < TPI ≤ 0.5 SD | Sp3 |
| Lower slope | −1 SD < TPI ≤ −0.5 SD | Sp2 |
| Valley | TPI ≤ −1 SD | Sp1 |
| Landform Classes Description 1 | Small-DEV Neighborhood Size | Large-DEV Neighborhood Size | Landform Classes Abbreviation |
|---|---|---|---|
| Hill tops, high ridges | Z0 > SD | Z0 > SD | L10 |
| Middle slope ridges, small hills in plains | Z0 > SD | 0 ≤ Z0 ≤ SD | L9 |
| Local ridges/hills in valley | Z0 > SD | Z0 < −SD | L8 |
| Upper slopes | −SD ≤ Z0 ≤ SD | Z0 > SD | L7 |
| Open slopes (>5°) | −SD ≤ Z0 ≤ SD | 0 ≤ Z0 ≤ SD | L6 |
| Plains, flat areas (<5°) | −SD ≤ Z0 ≤ SD | −SD ≤ Z0 < 0 | L5 |
| U-shaped valleys | −SD ≤ Z0 ≤ SD | Z0 < −SD | L4 |
| Upland drainage, headwaters | Z0 < −SD | Z0 > SD | L3 |
| Middle slope drainage, shallow valley | Z0 < −SD | 0 ≤ Z0 ≤ SD | L2 |
| Deeply incised streams | Z0 < −SD | −SD ≤ Z0 < 0 | L1 |
| 1 Slope Position Classes Description | DEV Threshold | Landform Code | 2 R = 100 m | 2 R = 300 m | 2 R = 600 m | 2 R = 1200 m |
|---|---|---|---|---|---|---|
| Sp6: Ridge | TPI > 1 SD | Sp6 | 86 | 153 | 126 | 107 |
| Sp5: Upper slope | 0.5 SD < TPI ≤ 1 SD | Sp5 | 42 | 22 | 7 | 4 |
| Sp4: Middle slope | −0.5 SD < TPI ≤ 0.5 SD | Sp4 | 102 | 22 | 16 | 7 |
| Sp3: Flat area | −0.5 SD < TPI ≤ 0.5 SD | Sp3 | 66 | 27 | 7 | 5 |
| Sp2: Lower slope | −1 SD < TPI ≤ −0.5 SD | Sp2 | 30 | 23 | 7 | 6 |
| Sp1: Valley | TPI ≤ −1 SD | Sp1 | 36 | 115 | 199 | 233 |
| 1 Landform Classes Description | Small-DEV Neighborhood Size | Large-DEV Neighborhood Size | Combined 2 Small-DEV and 3 Large-DEV | |||
|---|---|---|---|---|---|---|
| 100 m and 600 m | 300 m and 1200 m | 300 m and 2000 m | 600 m and 2000 m | |||
| L10: Hill tops, high ridges | Z0 > SD | Z0 > SD | 50 | 77 | 81 | 85 |
| L9: Middle slope ridges, small hills in plains | Z0 > SD | 0 ≤ Z0 ≤ SD | 3 | 4 | 5 | 5 |
| L8: Local ridges/hills in valley | Z0 > SD | Z0 < −SD | 33 | 72 | 67 | 36 |
| L7: Upper slopes | −SD ≤ Z0 ≤ SD | Z0 > SD | 71 | 20 | 12 | 8 |
| L6: Open slopes (>5°) | −SD ≤ Z0 ≤ SD | 0 ≤ Z0 ≤ SD | 22 | 2 | 5 | 2 |
| L5: Plains, flat areas (<5°) | −SD ≤ Z0 ≤ SD | −SD ≤ Z0 < 0 | 11 | 3 | 9 | 3 |
| L4: U-shaped valleys | −SD ≤ Z0 ≤ SD | Z0 < −SD | 136 | 69 | 68 | 24 |
| L3: Upland drainage, headwaters | Z0 < −SD | Z0 > SD | 5 | 20 | 14 | 24 |
| L2: Middle slope drainage, shallow valley | Z0 < −SD | 0 ≤ Z0 ≤ SD | 1 | 4 | 3 | 3 |
| L1: Deeply incised streams | Z0 < −SD | −SD ≤ Z0 < 0 | 30 | 91 | 98 | 172 |
| 1 Landform Classes Description | 2 Small-DEV Neighborhood Size | 3 Large-DEV Neighborhood Size | Relative Frequency (%) | |
|---|---|---|---|---|
| Noua Culture (Late Bronze Age) | Precucuteni–Cucuteni Culture (Eneolithic) | |||
| L10: Hill tops, high ridges | Z0 > SD | Z0 > SD | 21.27 | 45.86 |
| L9: Middle slope ridges, small hills in plains | Z0 > SD | 0 ≤ Z0 ≤ SD | 1.10 | 2.51 |
| L8: Local ridges/hills in valley | Z0 > SD | Z0 < −SD | 19.89 | 10.05 |
| L7: Upper slopes | −D ≤ Z0 ≤ SD | Z0 > SD | 5.52 | 4.92 |
| L6: Open slopes (>5°) | −SD ≤ Z0 ≤ SD | 0 ≤ Z0 ≤ SD | 0.55 | 0.73 |
| L5: Plains, flat areas (<5°) | −SD ≤ Z0 ≤ SD | −SD ≤ Z0 < 0 | 0.83 | 0.73 |
| L4: U-shaped valleys | −SD ≤ Z0 ≤ SD | Z0 < −SD | 19.06 | 7.84 |
| L3: Upland drainage, headwaters | Z0 < −SD | Z0 > SD | 5.52 | 2.62 |
| L2: Middle slope drainage, shallow valley | Z0 < −SD | 0 ≤ Z0 ≤ SD | 1.10 | 0.63 |
| L1: Deeply incised streams | Z0 < −SD | −SD ≤ Z0 < 0 | 25.14 | 24.09 |
| 1 Slope Position Classes Description | 2 DEV Threshold | Landform Code | Number of LBA Sites | Number of LBA Sites with Ashmounds |
|---|---|---|---|---|
| Sp6: Ridge | TPI > 1 SD | Sp6 | 60 (35.93%) | 93 (47.69%) |
| Sp5: Upper slope | 0.5 SD < TPI ≤ 1 SD | Sp5 | 10 (5.99%) | 12 (6.15%) |
| Sp4: Middle slope | −0.5 SD < TPI ≤ 0.5 SD | Sp4 | 9 (5.39%) | 13 (6.67%) |
| Sp3: Flat area | −0.5 SD < TPI ≤ 0.5 SD | Sp3 | 20 (11.98%) | 7 (3.59%) |
| Sp2: Lower slope | −1 SD < TPI ≤ −0.5 SD | Sp2 | 15 (8.98%) | 8 (4.1%) |
| Sp1: Valley | TPI ≤ −1 SD | Sp1 | 53 (31.74%) | 62 (31.79%) |
| 1 Landform Classes Description | 2 Small-DEV Neighborhood Size | 3 Large-DEV Neighborhood Size | Number of LBA Sites | Number of LBA Sites with Ashmounds |
|---|---|---|---|---|
| L10: Hill tops, high ridges | Z0 > SD | Z0 > SD | 41 (24.55%) | 40 (20.51%) |
| L9: Middle slope ridges, small hills in plains | Z0 > SD | 0 ≤ Z0 ≤ SD | 2 (1.2%) | 3 (1.54%) |
| L8: Local ridges/hills in valley | Z0 > SD | Z0 < −SD | 17 (10.18%) | 50 (25.65%) |
| L7: Upper slopes | −SD ≤ Z0 ≤ SD | Z0 > SD | 6 (3.59%) | 6 (3.08%) |
| L6: Open slopes (>5°) | −SD ≤ Z0 ≤ SD | 0 ≤ Z0 ≤ SD | 3 (1.8%) | 2 (1.03%) |
| L5: Plains, flat areas (<5°) | −SD ≤ Z0 ≤ SD | −SD ≤ Z0 < 0 | 5 (2.99%) | 4 (2.05%) |
| L4: U-shaped valleys | −SD ≤ Z0 ≤ SD | Z0 < −SD | 40 (23.95%) | 28 (14.36%) |
| L3: Upland drainage, headwaters | Z0 < −SD | Z0 > SD | 8 (4.79%) | 6 (3.08%) |
| L2: Middle slope drainage, shallow valley | Z0 < −SD | 0 ≤ Z0 ≤ SD | 1 (0.6%) | 2 (1.03%) |
| L1: Deeply incised streams | Z0 < −SD | −SD ≤ Z0 < 0 | 44 (26.35%) | 54 (27.69%) |
Publisher’s Note: MDPI stays neutral with regard to jurisdictional claims in published maps and institutional affiliations. |
© 2022 by the authors. Licensee MDPI, Basel, Switzerland. This article is an open access article distributed under the terms and conditions of the Creative Commons Attribution (CC BY) license (https://creativecommons.org/licenses/by/4.0/).
Share and Cite
Mihu-Pintilie, A.; Brașoveanu, C.; Stoleriu, C.C. Using UAV Survey, High-Density LiDAR Data and Automated Relief Analysis for Habitation Practices Characterization during the Late Bronze Age in NE Romania. Remote Sens. 2022, 14, 2466. https://doi.org/10.3390/rs14102466
Mihu-Pintilie A, Brașoveanu C, Stoleriu CC. Using UAV Survey, High-Density LiDAR Data and Automated Relief Analysis for Habitation Practices Characterization during the Late Bronze Age in NE Romania. Remote Sensing. 2022; 14(10):2466. https://doi.org/10.3390/rs14102466
Chicago/Turabian StyleMihu-Pintilie, Alin, Casandra Brașoveanu, and Cristian Constantin Stoleriu. 2022. "Using UAV Survey, High-Density LiDAR Data and Automated Relief Analysis for Habitation Practices Characterization during the Late Bronze Age in NE Romania" Remote Sensing 14, no. 10: 2466. https://doi.org/10.3390/rs14102466
APA StyleMihu-Pintilie, A., Brașoveanu, C., & Stoleriu, C. C. (2022). Using UAV Survey, High-Density LiDAR Data and Automated Relief Analysis for Habitation Practices Characterization during the Late Bronze Age in NE Romania. Remote Sensing, 14(10), 2466. https://doi.org/10.3390/rs14102466