Article

Soil Moisture Influence on the FTIR Spectrum of Salt-Affected Soils

1
Institute of Geography, Vietnam Academy of Science and Technology (VAST), Hanoi 100000, Vietnam
2
Graduate University of Science and Technology, Vietnam Academy of Science and Technology (VAST), Hanoi 100000, Vietnam
3
Flemish Institute for Technological Research (VITO), 2400 Mol, Belgium
4
Department of Earth and Environmental Sciences, Faculty of Bioscience Engineering, Katholieke Universiteit Leuven, 3001 Leuven, Belgium
*
Author to whom correspondence should be addressed.
Remote Sens. 2022, 14(10), 2380; https://doi.org/10.3390/rs14102380
Submission received: 7 April 2022 / Revised: 6 May 2022 / Accepted: 9 May 2022 / Published: 15 May 2022

Abstract

:
Soil salinity has a major impact on agricultural production. In a changing climate with rising sea-levels, low-lying coastal areas are increasingly inundated whereby saltwater gradually contaminates the soil. Drought prone areas may suffer from salinity due to high evapotranspiration rates in combination with the use of saline irrigation water. Salinity is difficult to monitor because soil moisture affects the soil’s spectral signature. We conducted Fourier-transform infrared spectroscopy on alluvial and sandy soil samples in the coastal estuary of the Red River Delta. The soils are contaminated with NaCl, Na2CO3 and Na2SO4 salts. In an experiment of salt contamination, we established that three ranges of the spectrum were strongly influenced by both salt and moisture content in the soil, at wavenumbers 3200–3400 cm−1 (2.9–3.1 µm); 1600–1700 cm−1 (5.9–6.3 µm); 900–1100 cm−1 (9.1–11.1 µm). The Na2CO3 contaminated soil and the spectral value had a linear relationship between wavelengths 6.9 and 7.4 µm. At wavelength 6.99 µm, there was no relationship between absorbance and soil moisture, but the absorbance was proportional to the salt content (R2 = 0.85; RMSE = 0.68 g) and electrical conductivity (R2 = 0.50; RMSE = 3.8 dS/m). The relationship between soil moisture and spectral absorbance value was high at wavelengths below 6.7 µm, resulting in a quadratic relation between soil moisture and absorbance at wavelength 6.13 µm (R2 = 0.80; RMSE = 5.2%). The spectral signatures and equations might be useful for mapping salt-affected soils, particularly in difficult to access locations. Technological advances in thermal satellite sensors may offer possibilities for monitoring soil salinity.

1. Introduction

Salinity is one of the most serious environmental stresses in the 21st Century, since it largely affects agricultural production through decreasing cultivated areas, productivity and the quality of agricultural products [1,2,3]. An estimated 20% of the total cultivated area and 33% of irrigated agricultural land worldwide are affected by high salinity levels [3,4]. In addition, more than 50% of the arable land is projected to be at risk of salinization by the year 2050, which necessitates breeding salt-tolerant crops to address food security [5,6,7].
Salt accumulates in the soil due to natural processes and occurs in drylands due to a combination of high evapotranspiration rates and erratic rainfall, and the natural presence of soluble salts. In coastal areas, soil salinity occurs due to seawater intrusion into the surface water, groundwater and wetlands, and subsequently enters agricultural fields, as observed in southeast Vietnam [8,9]. Seawater intrusion can be caused by tides, waves during storms and storm surges, which are projected to increase due to sea levels rising in a changing climate. The accumulation of salt in coastal environments due to natural processes is called primary salinity, and occurs over a time scale of about 100,000 years or longer [10]. Soil salinity can also occur in a secondary form and can be human-induced in irrigated areas. Primary salt-affected soils are estimated globally at about 955–1070 Mha during 1986–2016, while secondary salinization affects around 77 Mha, with 58% of these in irrigated areas [4,11]. Secondary salinization occurs especially in arid areas, which have high evaporation rates such as in the drier provinces of southeast Vietnam [8,9,12]. In coastal areas, the salinity of cultivated land is affected by aquaculture and, in particular, by shrimp cultivation, where seawater is deliberately pumped into the fields. Currently, this activity is expanding rapidly in Vietnam and therefore, soil salinity has increased accordingly [8]. Sea level rise is a serious climate threat and leads to severe salinity intrusion and tidal inundation in coastal areas [8,9,12]. Torrential rainfall contributes to flooding by rivers in many coastal and estuarine areas [13], and adds to spreading salinity in low-lying areas.
Salt-affected soils have a high content of soluble salts that interfere with plant growth [14], and are referred to as saline, saline-sodic and sodic, depending on the total salt concentration, the amount of sodium present and the soil reaction [15]. Sodium salts are capable of alkaline hydrolysis, particularly Na2CO3, and have also been termed ‘alkali’ [16]. Soil salinity is assessed by its influence on crop yield and quality, and measured as the electrical conductivity (EC) of the saturation extract (ECe) in the root zone [16]. Soil salinity can be classified into five levels depending on the influence on the plants [16,17]: non-saline: 0–2 dS/m; slightly saline: 2–4 dS/m; moderately saline: 4–8 dS/m; strongly saline: 8–16 dS/m; and very strongly saline: >16 dS/m. Other studies have classified saline soils with values exceeding 4 dS/m (approximately 40 mM NaCl) at 25 °C and having an exchangeable sodium percentage of 15% [6,18,19].
The mineralogy of carbonate, sulfate and chloride salts can be determined by the presence or absence of absorbance features in the electromagnetic spectrum. The V–NIR–SWIR absorbance bands in the spectrum of salt minerals are largely associated with the vibration of the anion groups HOH, OH, CO and SO4 [11,20,21]. The soil salinity state has been identified using laboratory spectroscopy in the visible (550–770 nm) and NIR (900–1030 nm, 1270–1520 nm, 1940–2150 nm, 2150–2300 nm and 2330–2400 nm) parts of the spectrum [22,23]. In arid soils, the reflectance spectra of saline soils produced distinct spectral absorbances [24,25,26], where crusting and salt residues were associated with high reflectance in the visible and near-infrared spectrum [24,27,28]. Spectral signatures of pure halite crystals (NaCl) do not show absorbance in the visible, infrared and thermal regions [29], and absorbances near the 1400, 1900 and 2250 nm were attributed to moisture associated with the salt [30,31,32,33]. The continuous spectra of halite (NaCl) and cinnite (KCl) show an absorbance at 1440 and 1933 nm, while soil samples treated with MgCl2 (Bischofite) showed absorbance at 1190 and 1824 nm [23,33]. Overall, an increased absorbance was associated with an increased salt content in soils [32,33].
The presence of water darkens the soil [34], mainly due to a change in the refractive index (n) of the environment [35]. This reduces the contrast of soil particles and increases scatter and spectral absorbance [36]. Soil moisture and salt, depending on type, have similar effects on the soil reflectance spectrum, and may therefore cause erroneous salinity predictions from remote sensing data and increase the difficulty of monitoring saline soils over time [4,22,37,38,39]. Although hyperspectral remote sensing has been widely applied, only a few studies have concentrated on the effects of soil moisture in estimating salt from spectral reflectance [40,41,42,43]. Moisture resistance estimation methods are used for the early detection and rapid monitoring of large-scale salinity intrusion, and observing moisture changes in space and time [39,44]. Detection of soil salinity with remote sensing offers possibilities for soil salinity monitoring, and an exploration beyond the near-infrared spectrum may offer possibilities for monitoring with newly planned long-wave and thermal infrared satellite sensors [45].
Estuarine and coastal areas suffer from increased salinity risks due to sea level rise, while drought prone areas may suffer from salinity due to high evapotranspiration rates in combination with the use of saline irrigation water [12,46]. Therefore, the development of methods to monitor salinity is important. The advent of novel thermal satellite sensor technologies will enable new applications and monitoring of the difficult to access terrains. We hypothesized that salinity can be detected without interference from soil moisture in the spectral range of 2.5 to 15.4 µm. The main objective was to find spectra in which salt contamination can be detected without the influence of soil moisture, to estimate salt content from absorbance peaks and to explore possibilities for monitoring saline and sodic soils in areas at risk, that also have a high soil moisture content and/or are difficult to access when taking soil samples. We used Fourier-Transform InfraRed (FTIR) spectroscopy to build a spectral database of saline soils with salinity levels, based on salt contamination with NaCl, Na2SO4 and Na2CO3. The corresponding electrical conductivity of the 1:5 soil to water extract was assessed in combination with changes in soil moisture levels from dry to fully-saturated.

2. Materials and Methods

2.1. Soil Sampling Sites

The study area is the coastal area of Hai Phong-Thai Binh located in the Red River Delta, with four estuaries (Figure 1): Van Uc (1), Thai Binh (2), Tra Ly (3) and Red River (4), that are strongly affected by sediment transport and tidal dynamics. According to the WRB reference soil groups [14], there are four main reference soil groups in the study area: Fluvisol (FL), Gleysol (GL), Arenosol (AR), and Cambisol (CM). According to the soil maps, soil salinity accounts for about 27 % of the total area in Hai Phong, Thai Binh and Nam Dinh. The process of soil salinization is affecting not only Fluvisols, but also Gleysols and Arenosols.
Soil samples were taken of Fluvisols and Arenosols with an electrical conductivity (EC1:5) below 1 dS/m. The sampling method followed the Vietnamese protocol of soil sampling in agricultural areas TCVN 4046-85 [47]. Samples were collected from 11 separate points (Figure 1). At each point, soil was taken from 20 adjacent positions and mixed together, amounting to a weight of 1 kg. Samples were taken at a depth of 0–10 cm and stored in a labelled bag. The samples were brought to the laboratory and pre-treated according to ISO 11464:2006 [48]. The soil samples were air-dried in a cool place. Gravel and plant roots were removed. The samples were crushed with a ceramic mortar, sieved through a 2 mm sieve and mixed prior to physical and chemical analysis and spectroscopic research.

2.2. Laboratory Experimental Design

2.2.1. Analysis of Soil Characteristics in the Laboratory

The moisture content of the soil collected in the field and the moisture content of the soil samples in the laboratory were determined according to laboratory standard TCVN 4080:2011 [49]. A total of 5 g of air-dried soil sample was weighed on an analytical balance, and put into a weight-fixed aluminum box. The box was oven-dried at a temperature of 105 °C to constant mass weight. The sample was cooled in a desiccator for about 20 to 30 min, and the mass was determined with an analytical balance. The moisture content of the sample was subsequently determined.
The particle size distribution (PSD) of soil samples was determined according to laboratory standard TCVN 8567:2010 [50]. The air-dried soil sample was processed through a 2 mm sieve to determine the PSD. Soil samples were soaked with a mixture of sodium pyro phosphate (Na4P2O7) and sodium carbonate (Na2CO3) at the ratio of 1:2 (w/v), left to disperse overnight, and passed through a 0.02 mm sieve to determine the sand. The suspension was subsequently brought to a 1 L cylinder for the determination of silt and clay particles by the pipette method.
The results of the textural composition of the soil samples in the coastal estuaries of Hai Phong-Thai Binh (Table 1) shows a USDA textural class variability from Sand in Kien Thuy 2 to Clay Loam in Tien Lang 2. The following soil samples were selected for further salinity experimentation: Tien Lang 2 sample (symbol: TL2) represents an alluvial soil and Kien Thuy 2 sample (Symbol: KT2) represents a sandy soil from a river bank.
The electrical conductivity of the soil samples collected in the field and soil samples generated in the laboratory was determined according to the laboratory standard TCVN 6650:2000 (ISO 11265:1994) [51]. A sample of the air-dried soil was pre-processed in accordance with ISO 11464:2006 [48] to prepare a 1:5 (w/v) ratio of soil to water extract. KCl solutions at concentrations of 0.1 mol/L, 0.02 mol/L, 0.01 mol/L were used for calibration.

2.2.2. Soil Salinity Experiment

The electrical conductivity in a 1:5 (w/v) soil to water extract of the 11 soil samples was evaluated from slightly to strongly saline (Table 1). Two samples were taken for further experiments: Tien Lang 2 (TL2) and Kien Thuy 2 (KT2). The selected soil samples had an electrical conductivity (EC1:5) of 0.51 and 0.12 dS/m, which corresponds to a calculated ECe of 7.5 and 2.2 dS/m (Table 2), and were therefore classified as moderately saline and slightly saline soils, according to [16,17].
We subsequently conducted a salinity experiment on these two selected soils, whereby water and salt were added in controlled laboratory circumstances to obtain 56 different mixtures of soil (2), salt type (7) and salt amount (4). Seven salt types were prepared in the laboratory to obtain mixtures of: a: NaCl; b: Na2SO4; c: Na2CO3; d: NaCl: Na2SO4= 1:1; e: NaCl: Na2SO4= 1:5; f: NaCl: Na2SO4= 1:10; and g: NaCl: Na2SO4: Na2CO3= 1:1:1. From each of these salt mixtures 0.35 g, 1.75 g, 3.5 g and 7 g were weighed, mixed into 100 gr of air-dried and sieved soil, and subsequently brought to saturation level.
The following mixtures were prepared:
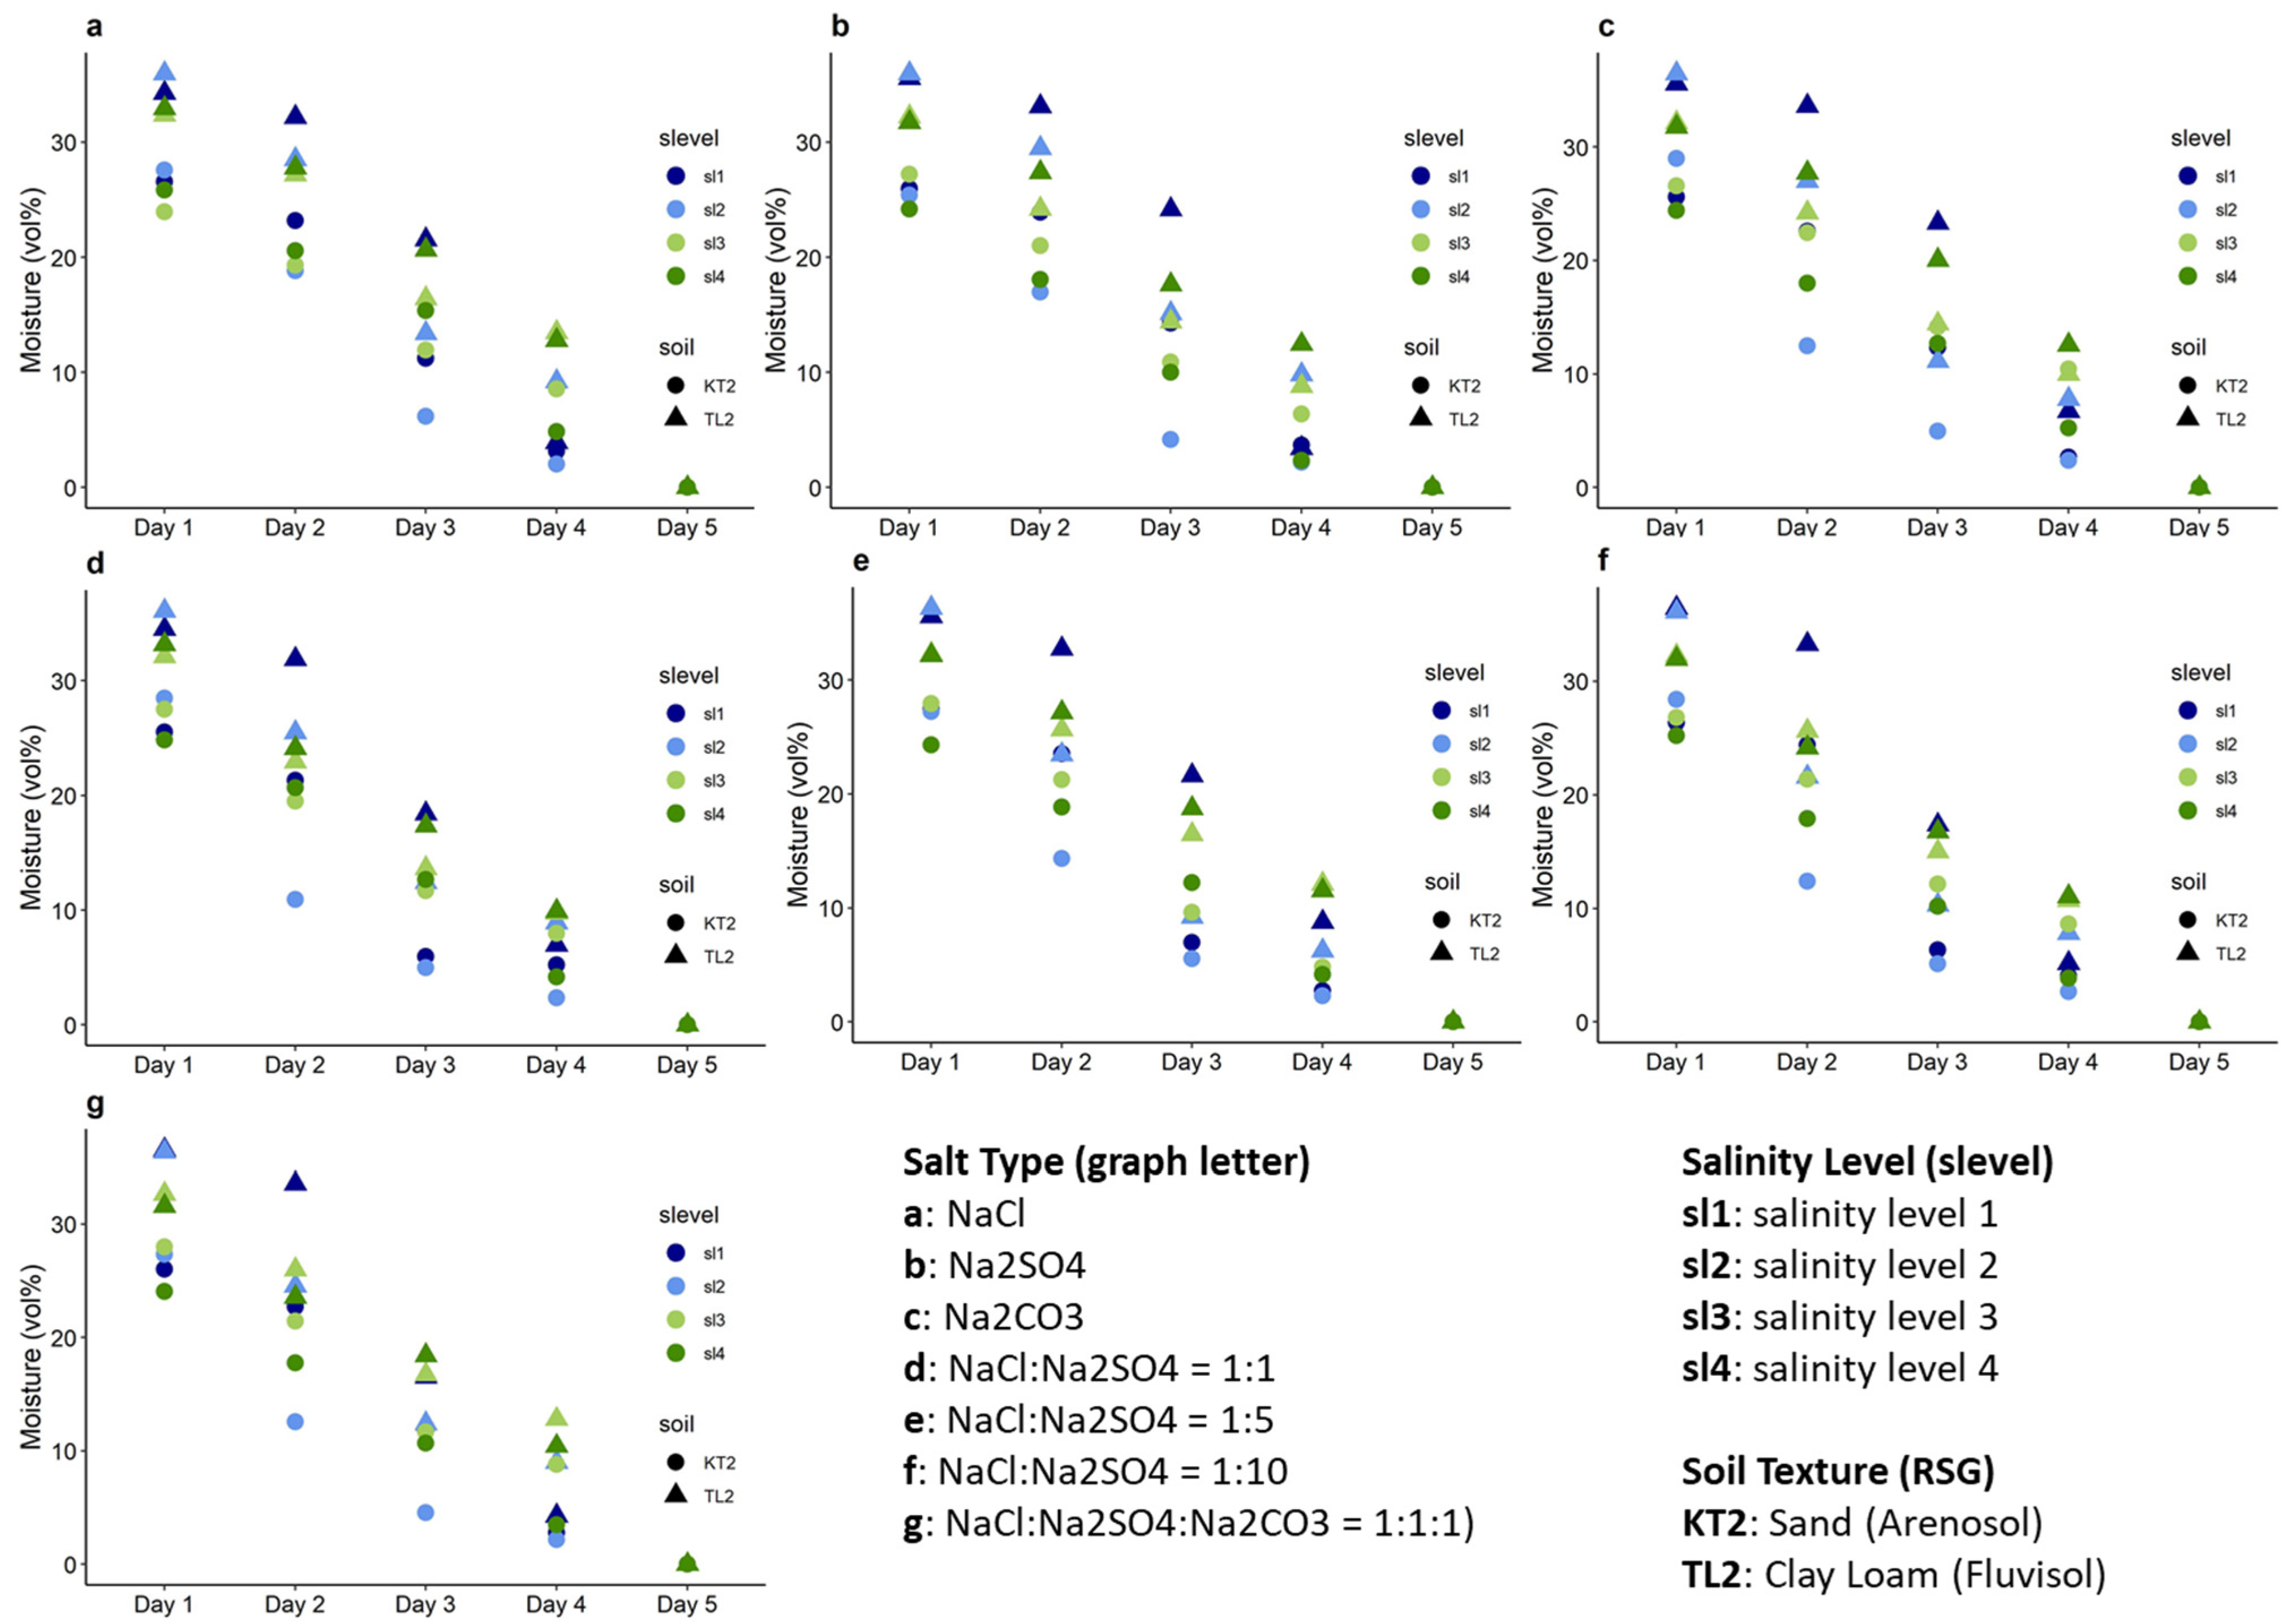
  • Salinity level 1 (slevel 1): 100 g of air-dried and sieved soil, to which 0.35 g salt was added (NaCl or Na2SO4 or Na2CO3 or a mixture of salts). Water was added until saturated soil moisture content;
  • Salinity level 1 (slevel 2): 100 g air-dried and sieved soil, to which 1.75 g salt was added (NaCl or Na2SO4 or Na2CO3 or a mixture of salts). Water was added until saturated soil moisture content;
  • Salinity level 1 (slevel 3): 100 gr air-dried and sieved soil, to which 3.5 g salt was added (NaCl or Na2SO4 or Na2CO3 or a mixture of salts). Water was added until saturated soil moisture content;
  • Salinity level 1 (slevel 4): 100 g of air-dried and sieved soil, to which 7 g salt was added (NaCl or Na2SO4 or Na2CO3 or a mixture of salts). Water was added until saturated soil moisture content.

2.2.3. Soil Spectral Measurements and Analysis

Field soil samples and laboratory soil samples were measured spectroscopically with a diamond-faced probe. These samples were pressed directly on the instrument Agilent Cary 630 FTIR of Agilent Technologies. Data processing was achieved with the MicroLab PC spectrometer software and Agilent Resolution spectrometer software.
The soil moisture monitoring and spectroscopy measurements were conducted during five sampling days:
  • Sampling day 1: The soil samples were saturated with water. The soil moisture and FTIR spectrum were measured;
  • Sampling days 2–4: The soil samples were left to air-dry. The soil moisture and FTIR spectrum were measured. The duration from 1st to 2nd day, 2nd to 3rd and 3rd to 4th was one day and night;
  • Sampling days 5–6: The soil samples were dried at 105 °C until constant weight. The soil moisture, FTIR spectrum and electrical conductivity were measured. The duration from the 4th to 5th day was 2 days and nights.
The database is hosted on a website with a general introduction on the determination of salinity level of surface soil for agricultural cultivation in some areas near the coastal estuaries of Hai Phong-Thai Binh. Alluvial and sandy soils were measured in the laboratory and some spectral samples were measured in the field. The spectral data provide information on the FTIR spectroscopy measured in the laboratory samples. Transmittance measurements, i.e., the percentage of incident light which is transmitted, were converted to absorbance using Equation (1). Conversion of wavenumbers into wavelength, commensurate with satellite sensor specifications, was accomplished using Equation (2).
A = 2 log 10 ( % T )
W L = 10 7 1 W N
where %T is transmittance in percentage, A is absorbance, WN is wavenumber (cm−1) and WL is wavelength (nm).
The database includes 280 FTIR spectral samples measured in the laboratory of a Fluvisol (TL2) and Arenosol (KT2) contaminated with: NaCl, Na2SO4, Na2CO3 or a mixture of: NaCl:Na2SO4 in 1:1 proportion; NaCl:Na2SO4 in the proportion of 1:5; NaCl:Na2SO4 in the proportion 1:10; NaCl:Na2SO4:Na2CO3 in the proportion of 1:1:1 with four increasing salinity levels. The samples were monitored and measured at five different moisture levels. The electrical conductivity (EC1:5) was determined in a 1:5 (w/v) soil to water extract after the salts were added. The experiments were repeated three times, the results presented are the averages; the coefficient of variation was lower than 1.3%. A two-way analysis of variance was conducted in R [52] to compare the main effects of soil, salinity level and sampling time and the interaction effect of soil, salinity level and sampling time on the moisture content. Tests for normality were performed using the R packages nortest [53] and rstatix [54], while ggpubr [55] was used for preparing factorial plots.

3. Results

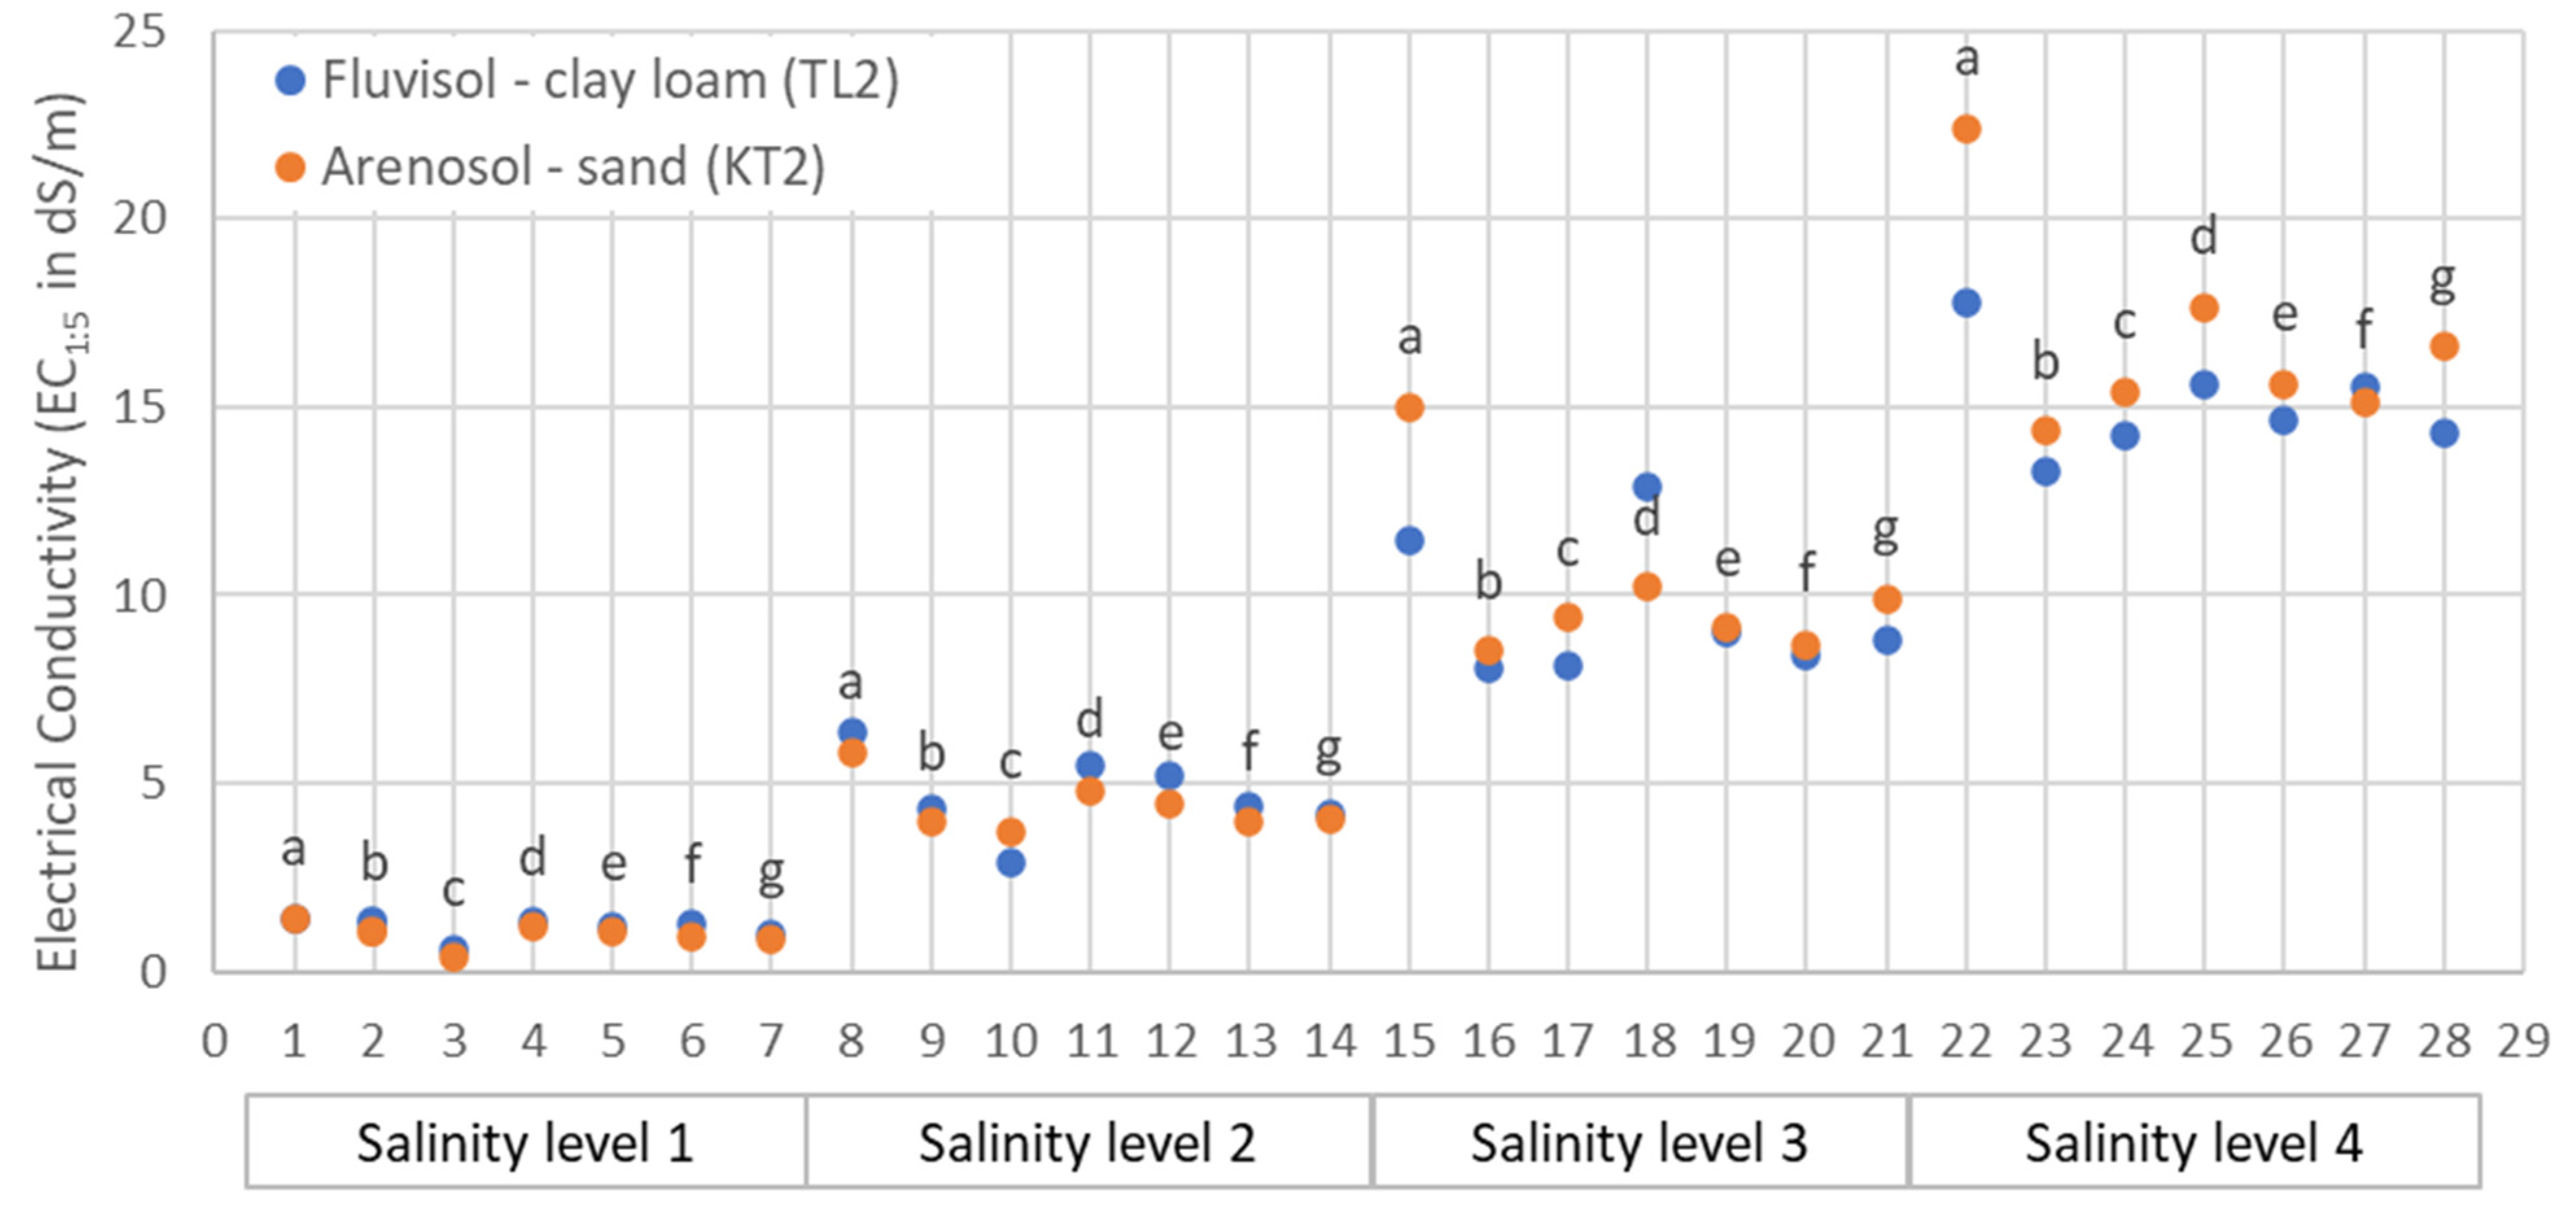
3.1. Salinity and Moisture Characteristics

The initial spectral profiles of a field sample of a clay loam topsoil (Fluvisol) and a sand topsoil (Arenosol) are shown in Figure 2.
The salinity characteristics of the two soils contaminated with NaCl, Na2SO4, Na2CO3, as mono-salt in mixture, clearly demonstrate the effect of NaCl on the electrical conductivity of each of the 56 soil samples (Figure 3). The four levels of salt amounts added to the soil corresponded to a different electrical conductivity (EC1:5). EC1:5 ranged from 0.35–1.41 dS/m for salinity level 1, 2.90–6.34 dS/m for salinity level 2, 8.04–12.90 dS/m for salinity level 3, and 13.30–22.40 dS/m for salinity level 4 (Figure 3). The EC1:5 of the sand soil sample (KT2-a), to which more than 3.5 g NaCl was added, was higher.
Clear differences were observed between the moisture levels at different salt concentration levels for each of the two soils (Figure 4). Two soil types were included (sand, clay loam), the salinity included four levels and the sampling time consisted of five sampling days (Figure 4). All effects were statistically significant at the <.001 level. The main effect yielded an F ratio of F(1, 240) = 1064, p < 0.001 for soil, F(3, 240) = 84, p < 0.001 for salinity level, and F(4, 240) = 4189, p < 0.001 for sampling time, indicating a significant difference between soils, salinity levels and sampling times. All of the interaction effects were significant, ranging from the interaction between the soil, salinity level and sampling time on soil moisture with an F ratio of F(12, 240) = 7.1, p < 0.001 to the interaction of the soil and sampling time on soil moisture with an F ratio of F(4, 240) = 79, p < 0.001. A model incorporating the salt type together with the soil type, salinity level and sampling time, but without considering interaction effects, did not have a significant influence on soil moisture, where F(6, 265) = 0.639, p = 0.699. Though differences were observed between salt types with respect to soil moisture, these were not significant. Overall, the higher the salinity level, irrespective of the salt type, the higher the soil moisture. This effect was more pronounced at lower moisture levels: for sand, the effect occurred from the second sampling day onwards and for clay loam, from the third sampling day onwards.

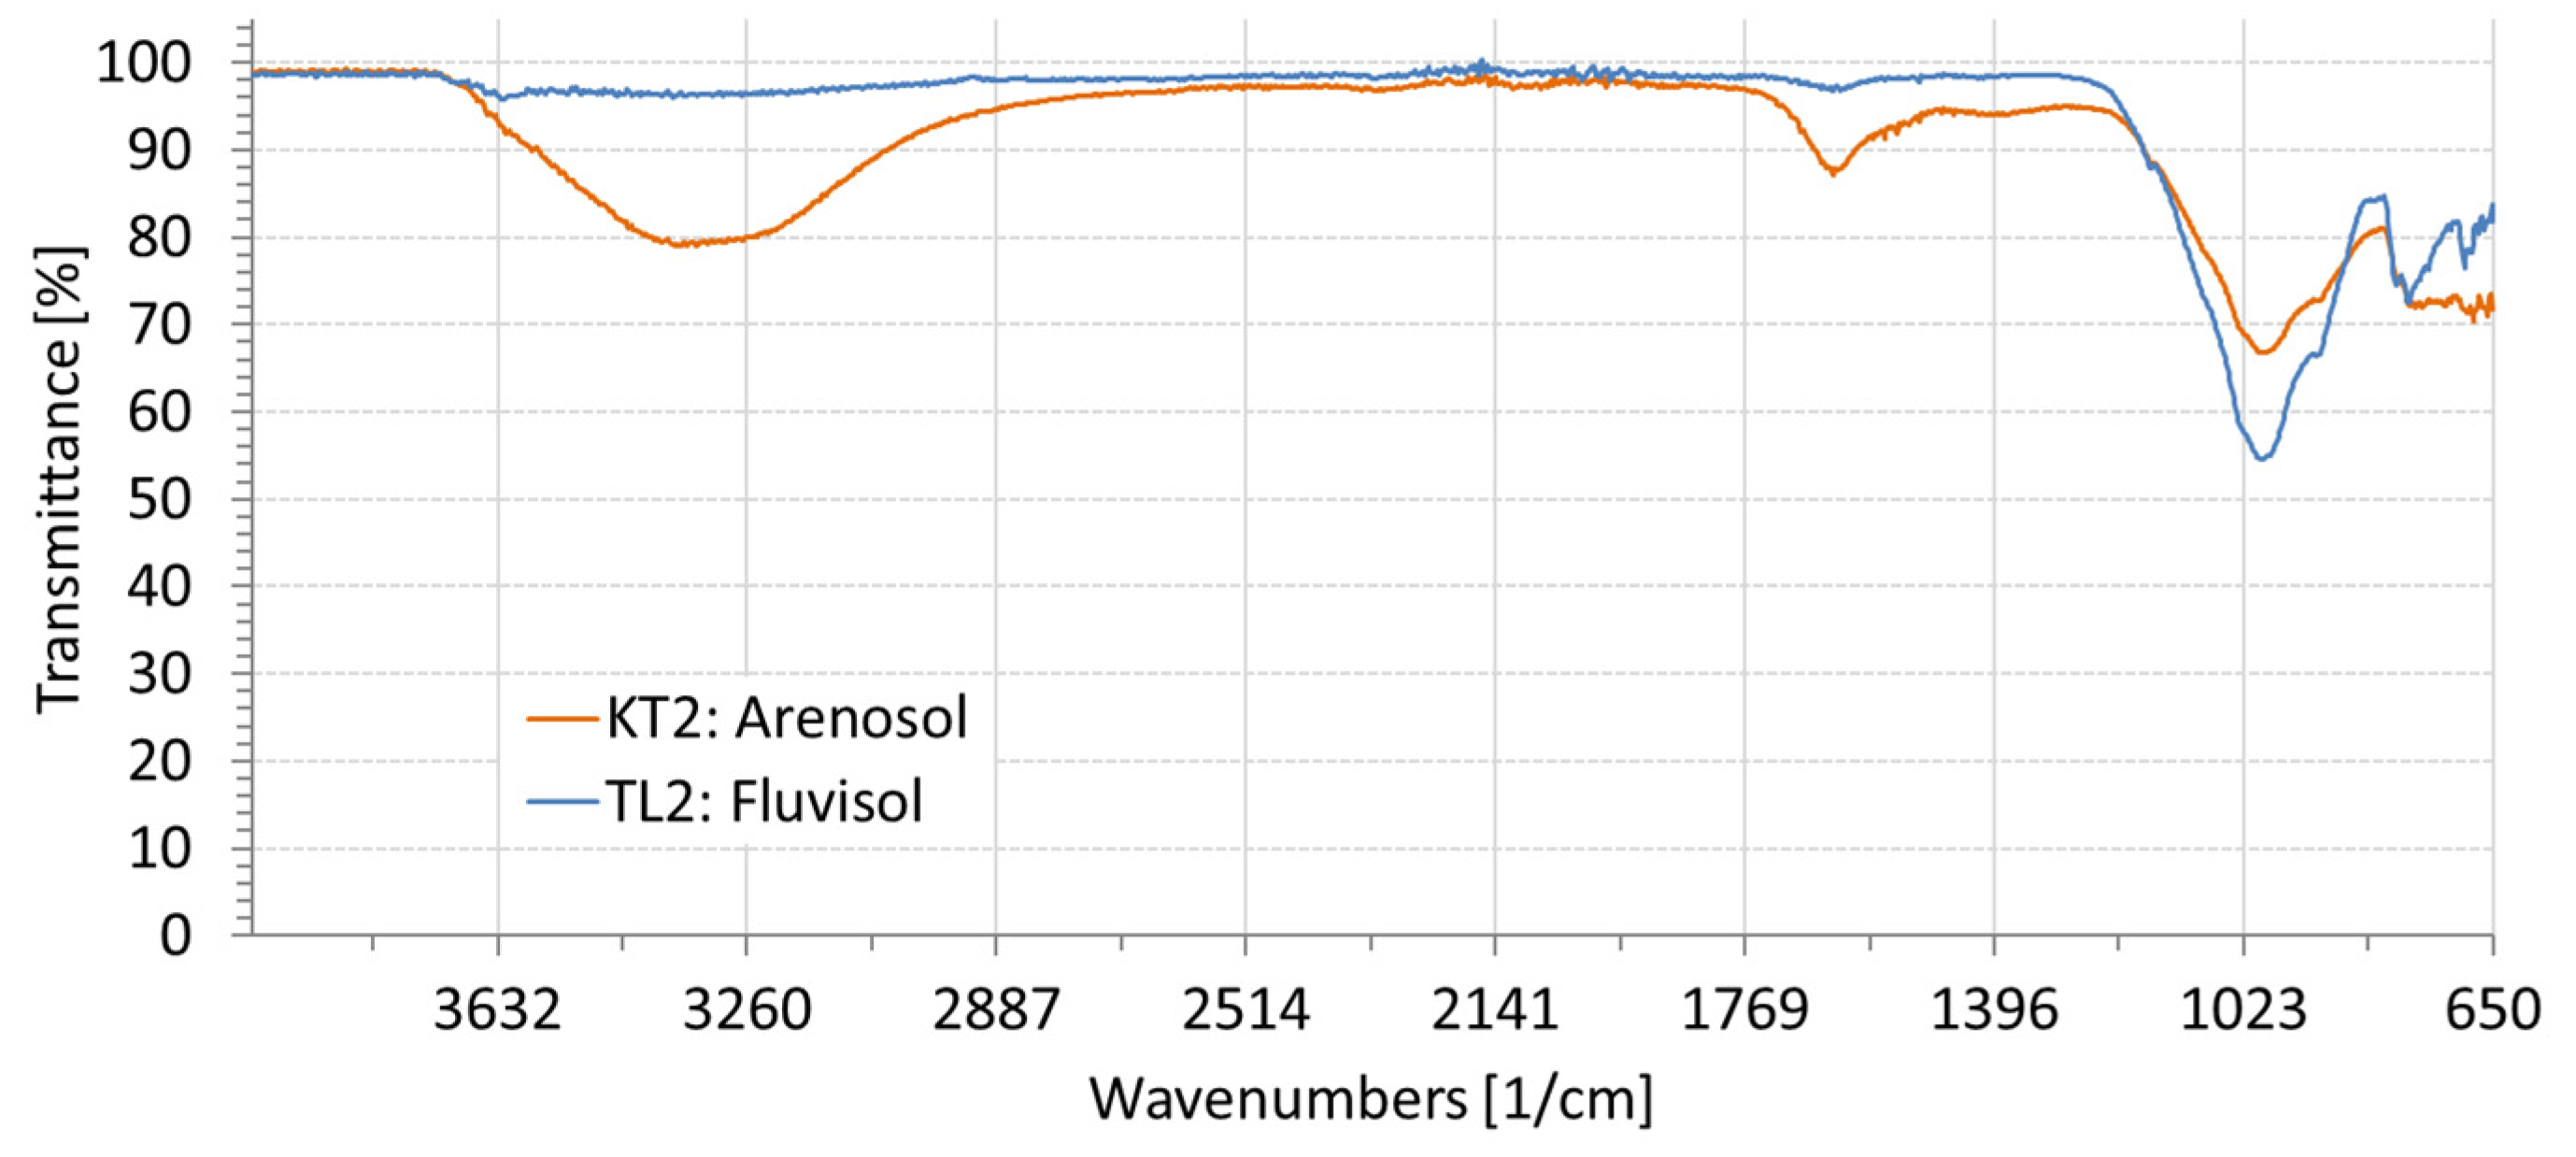
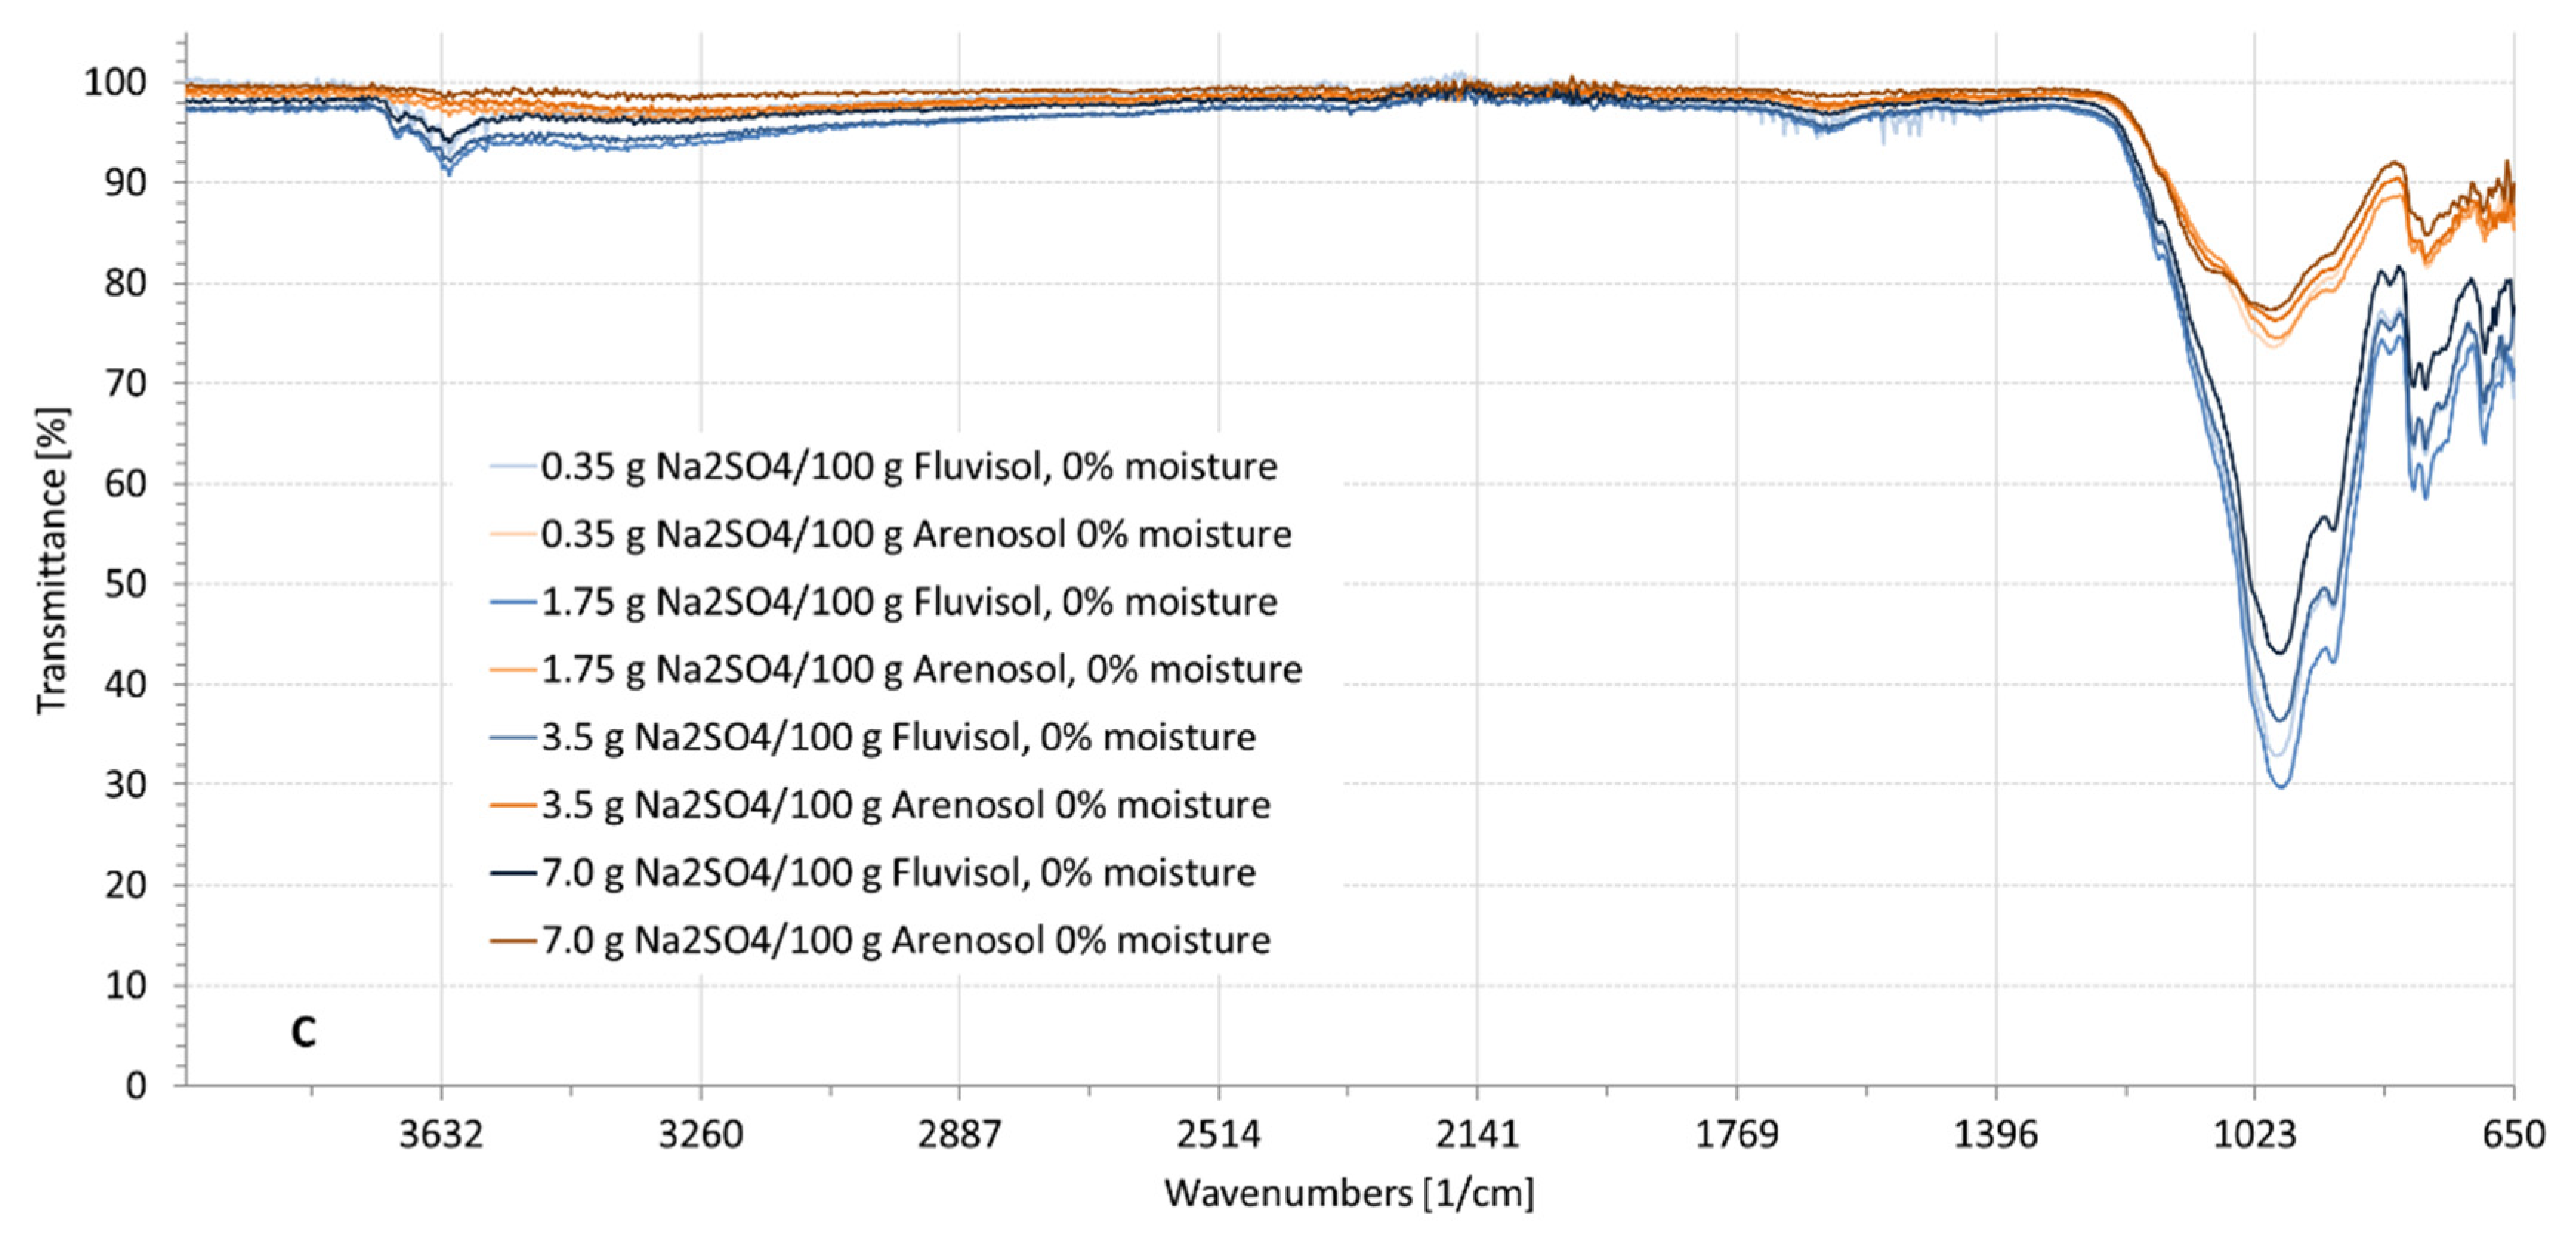
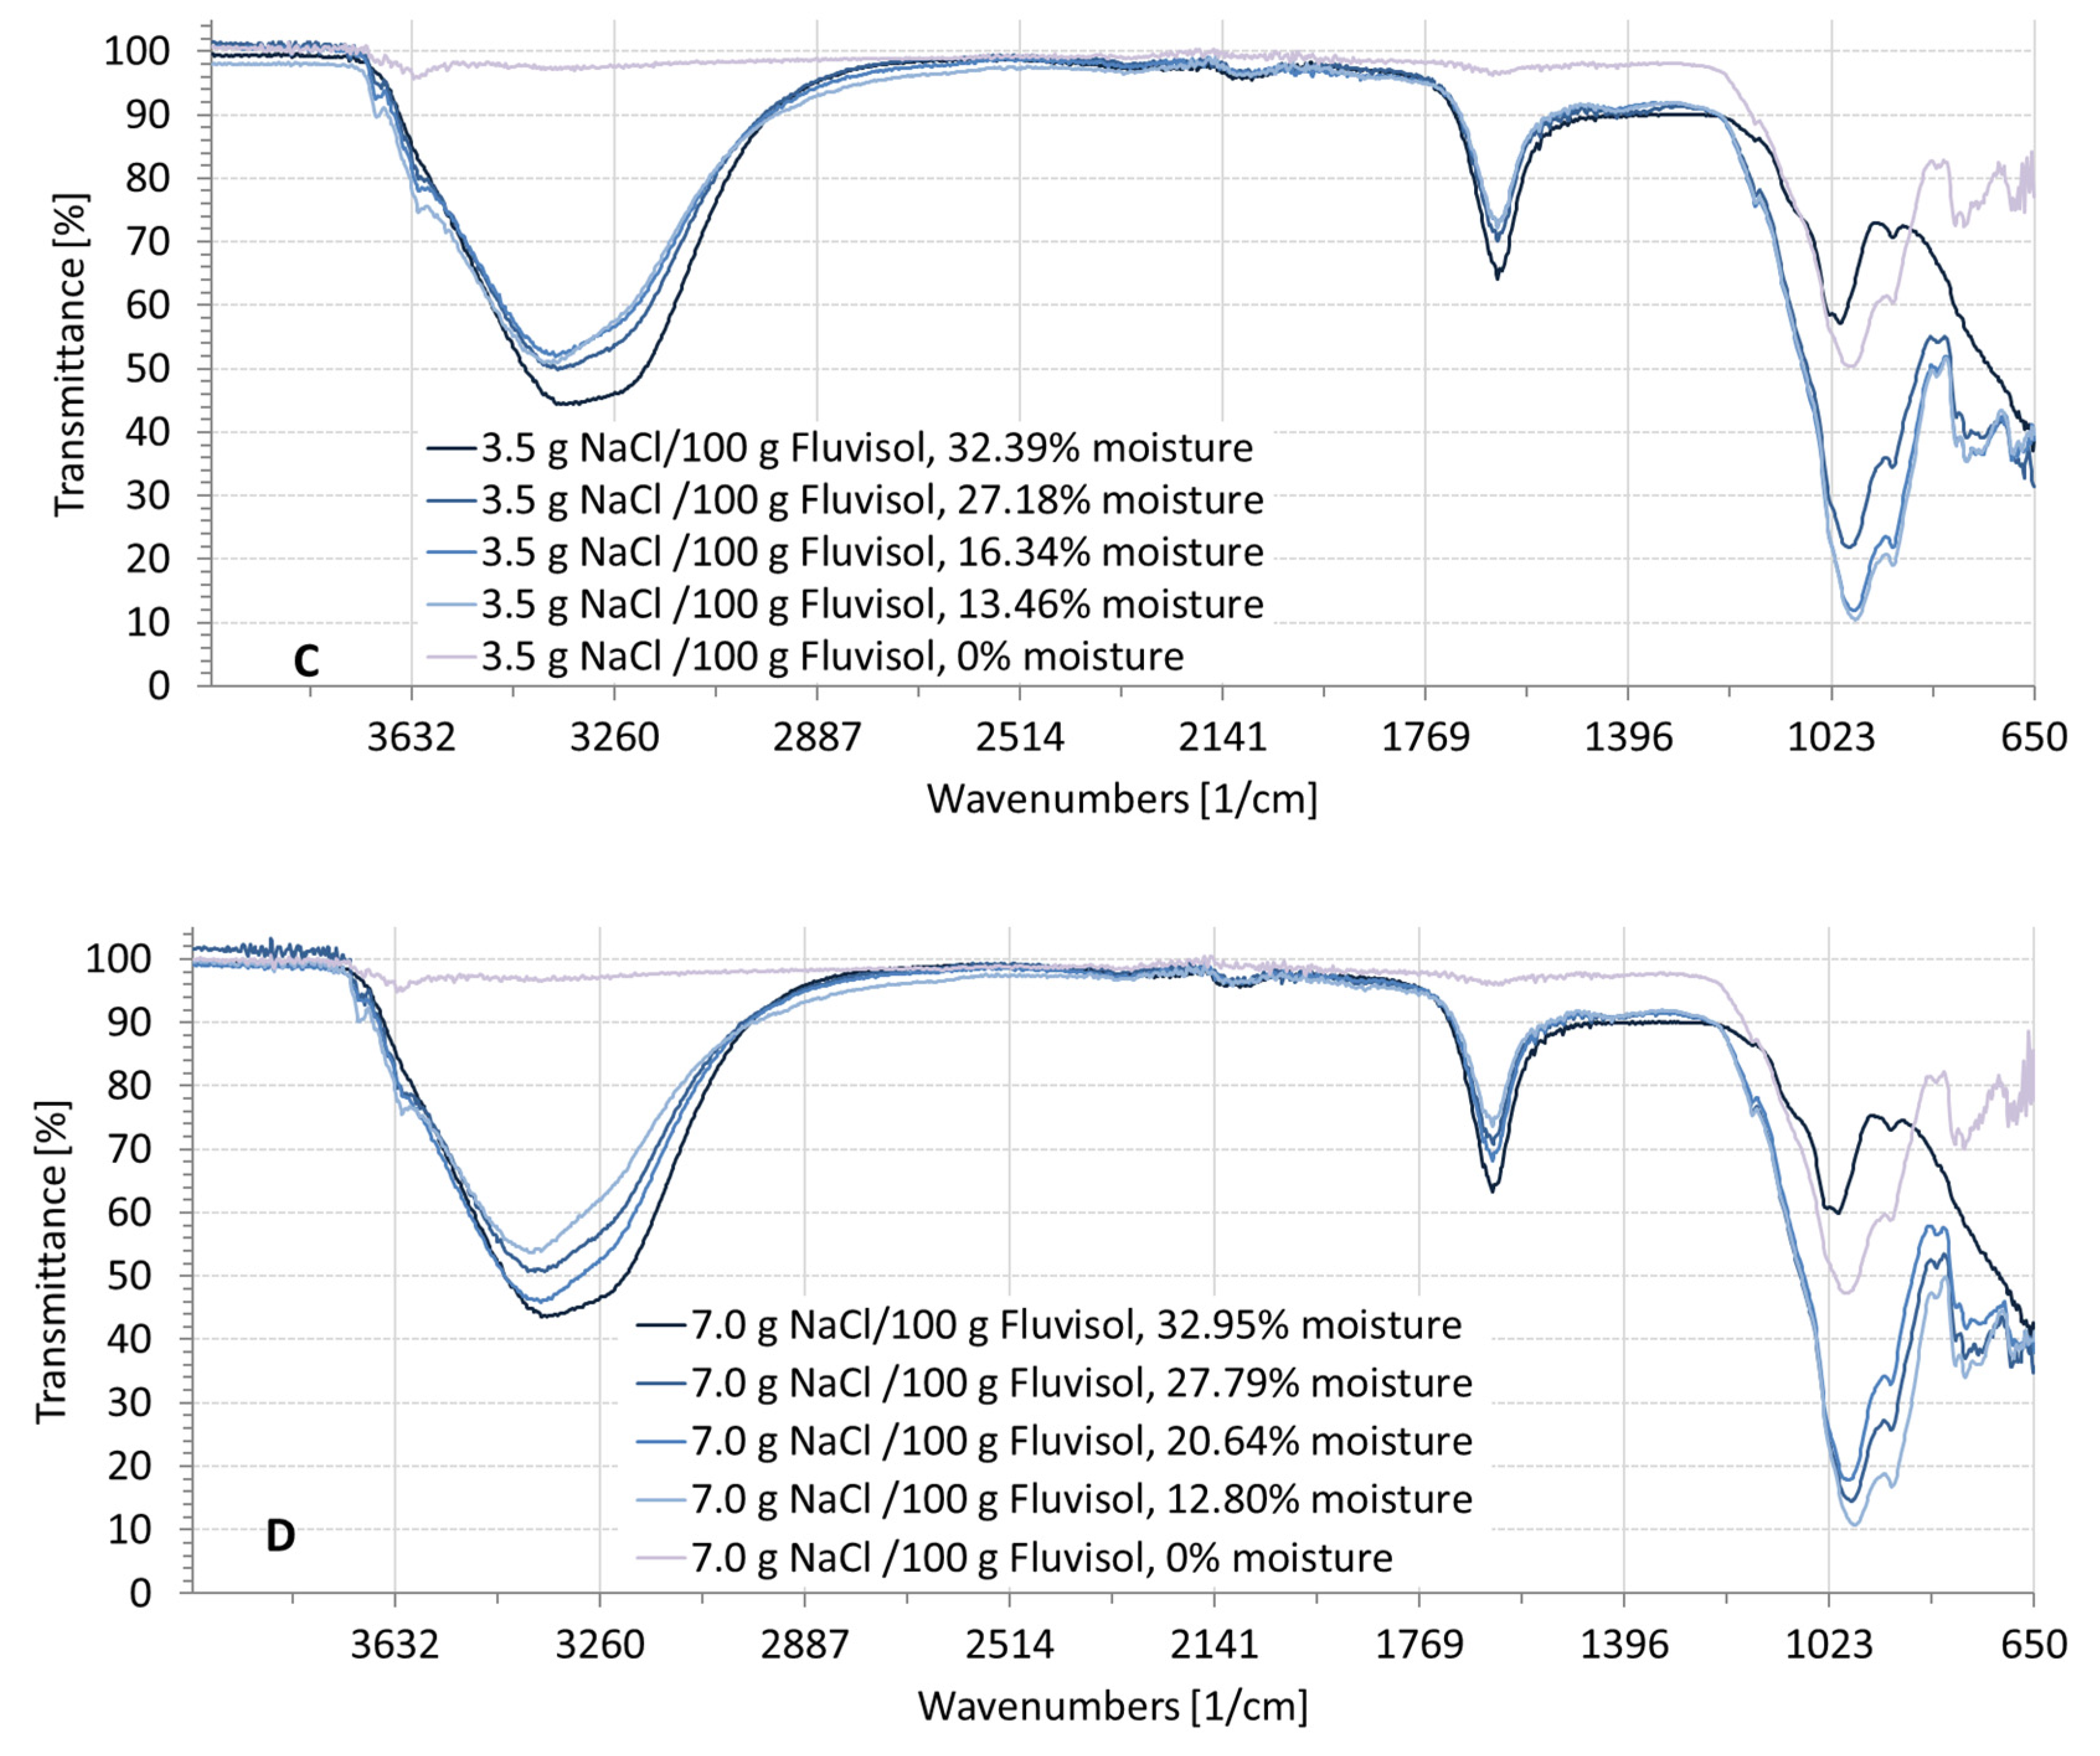
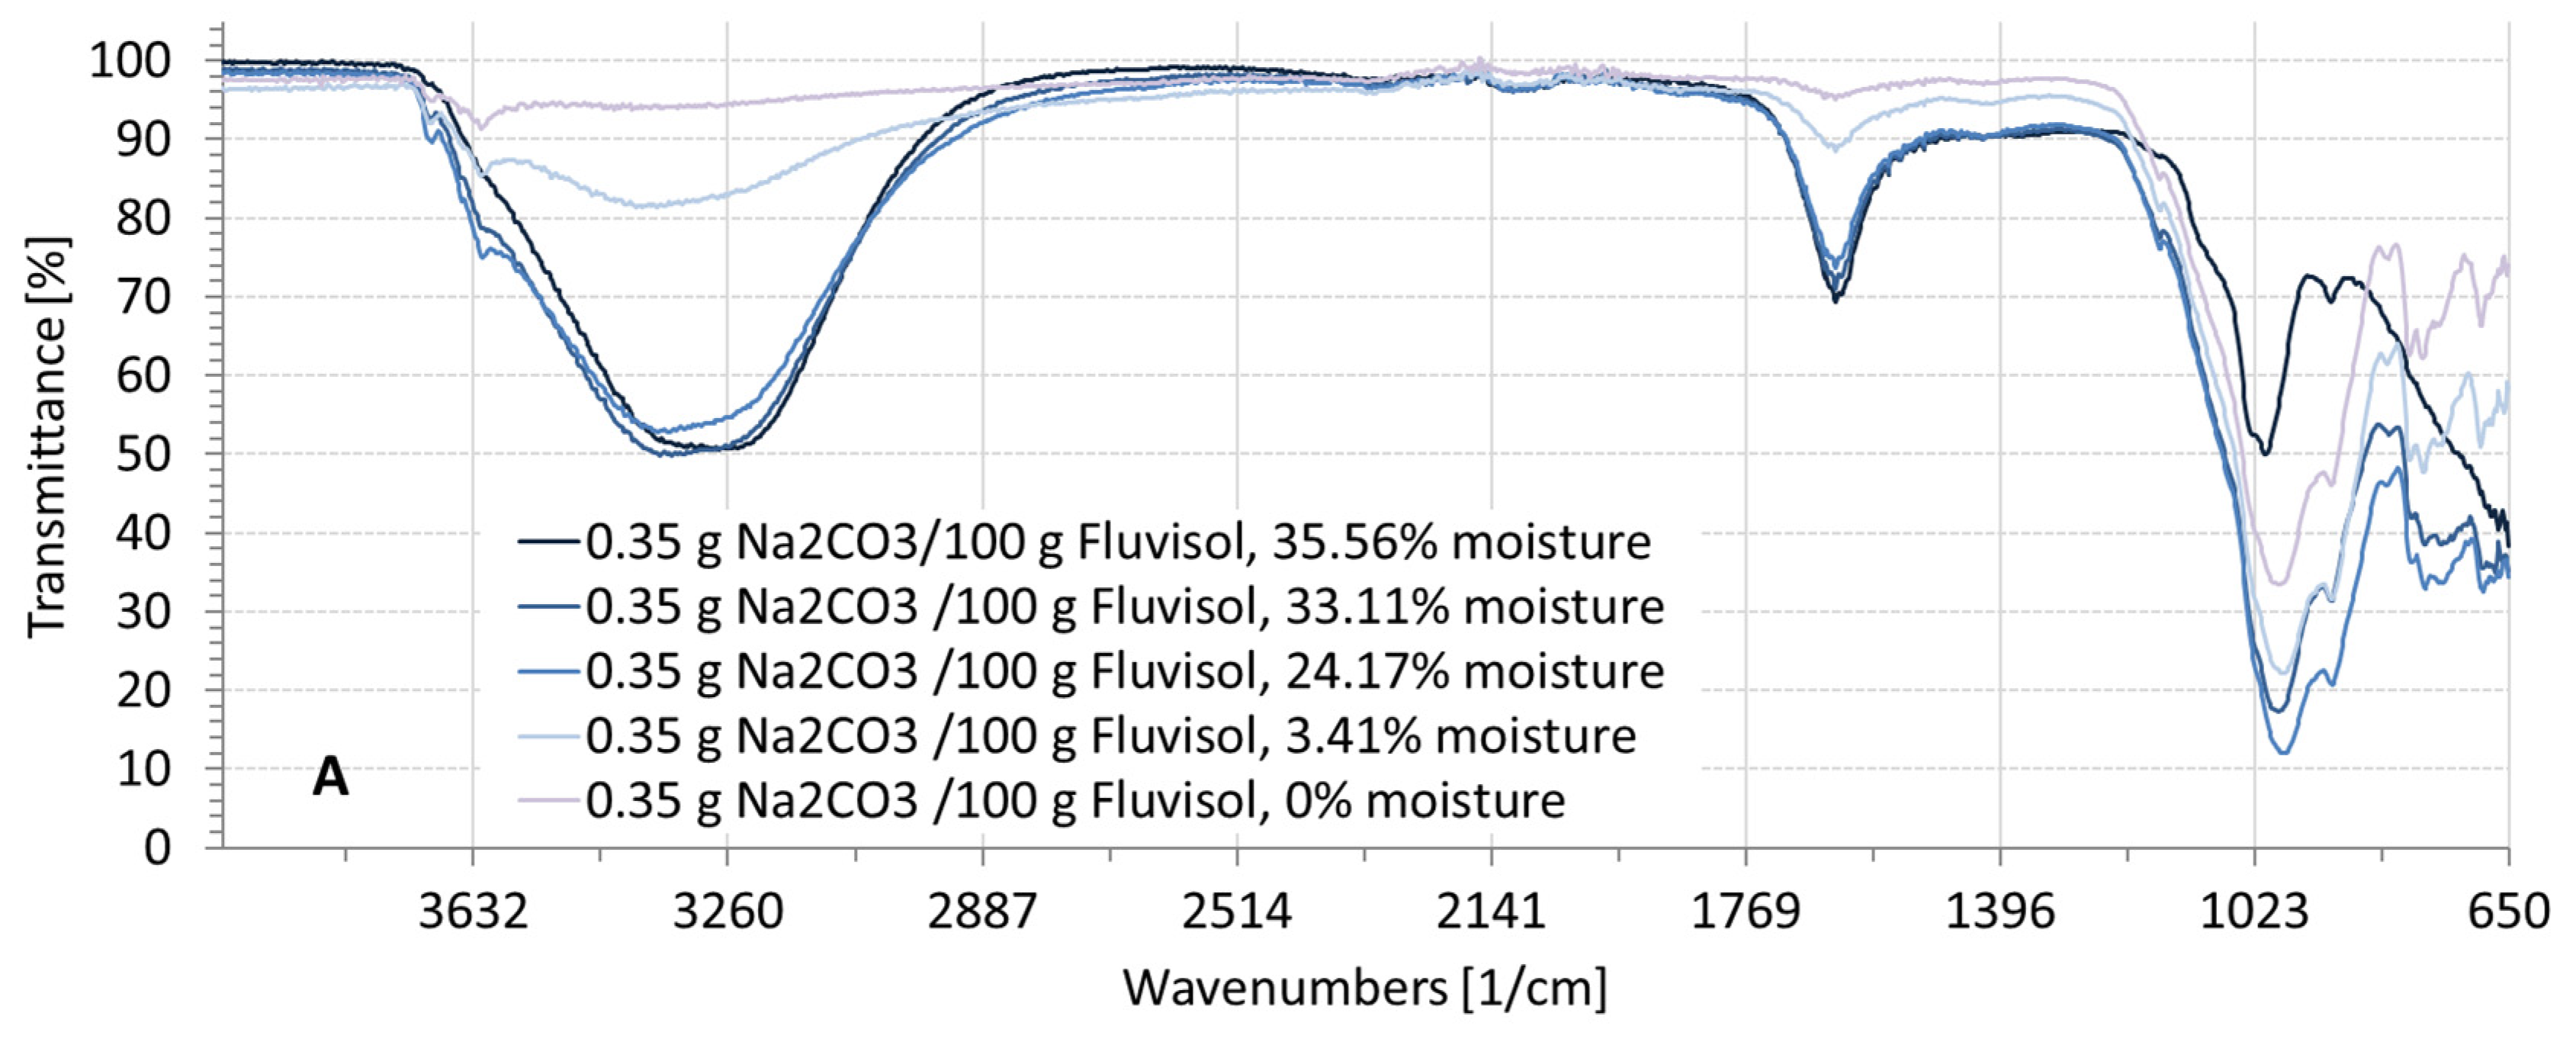
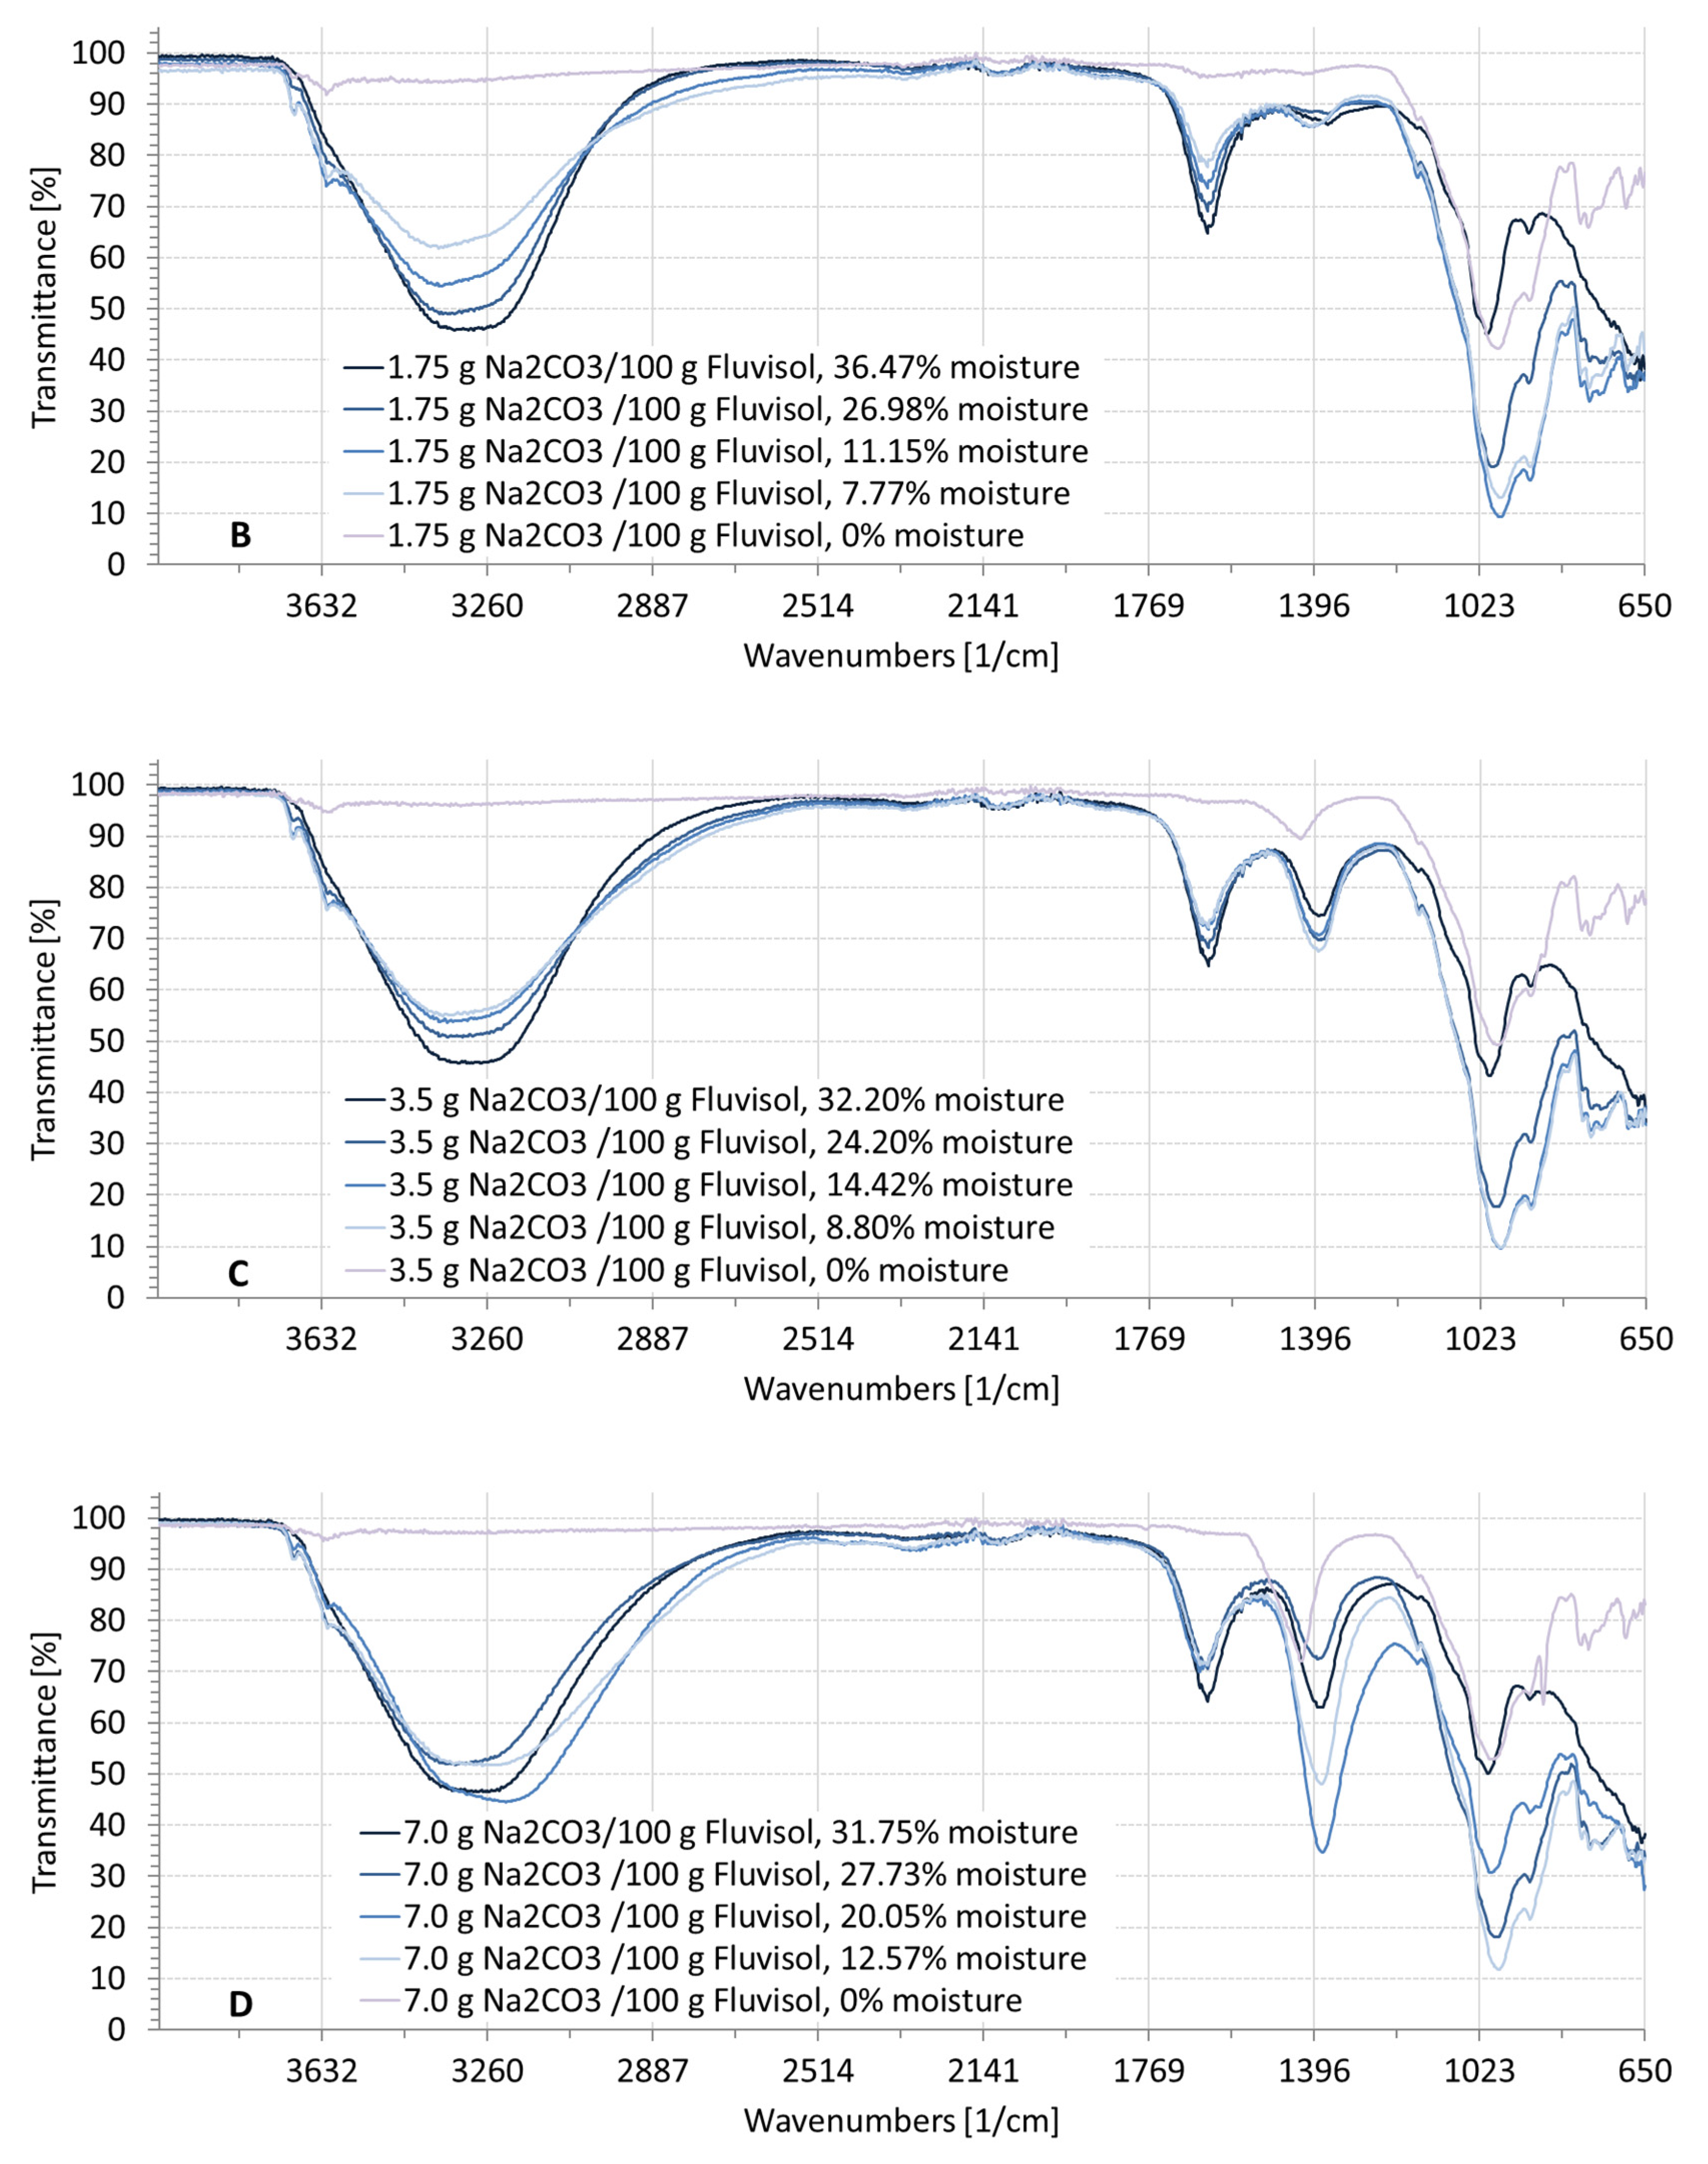
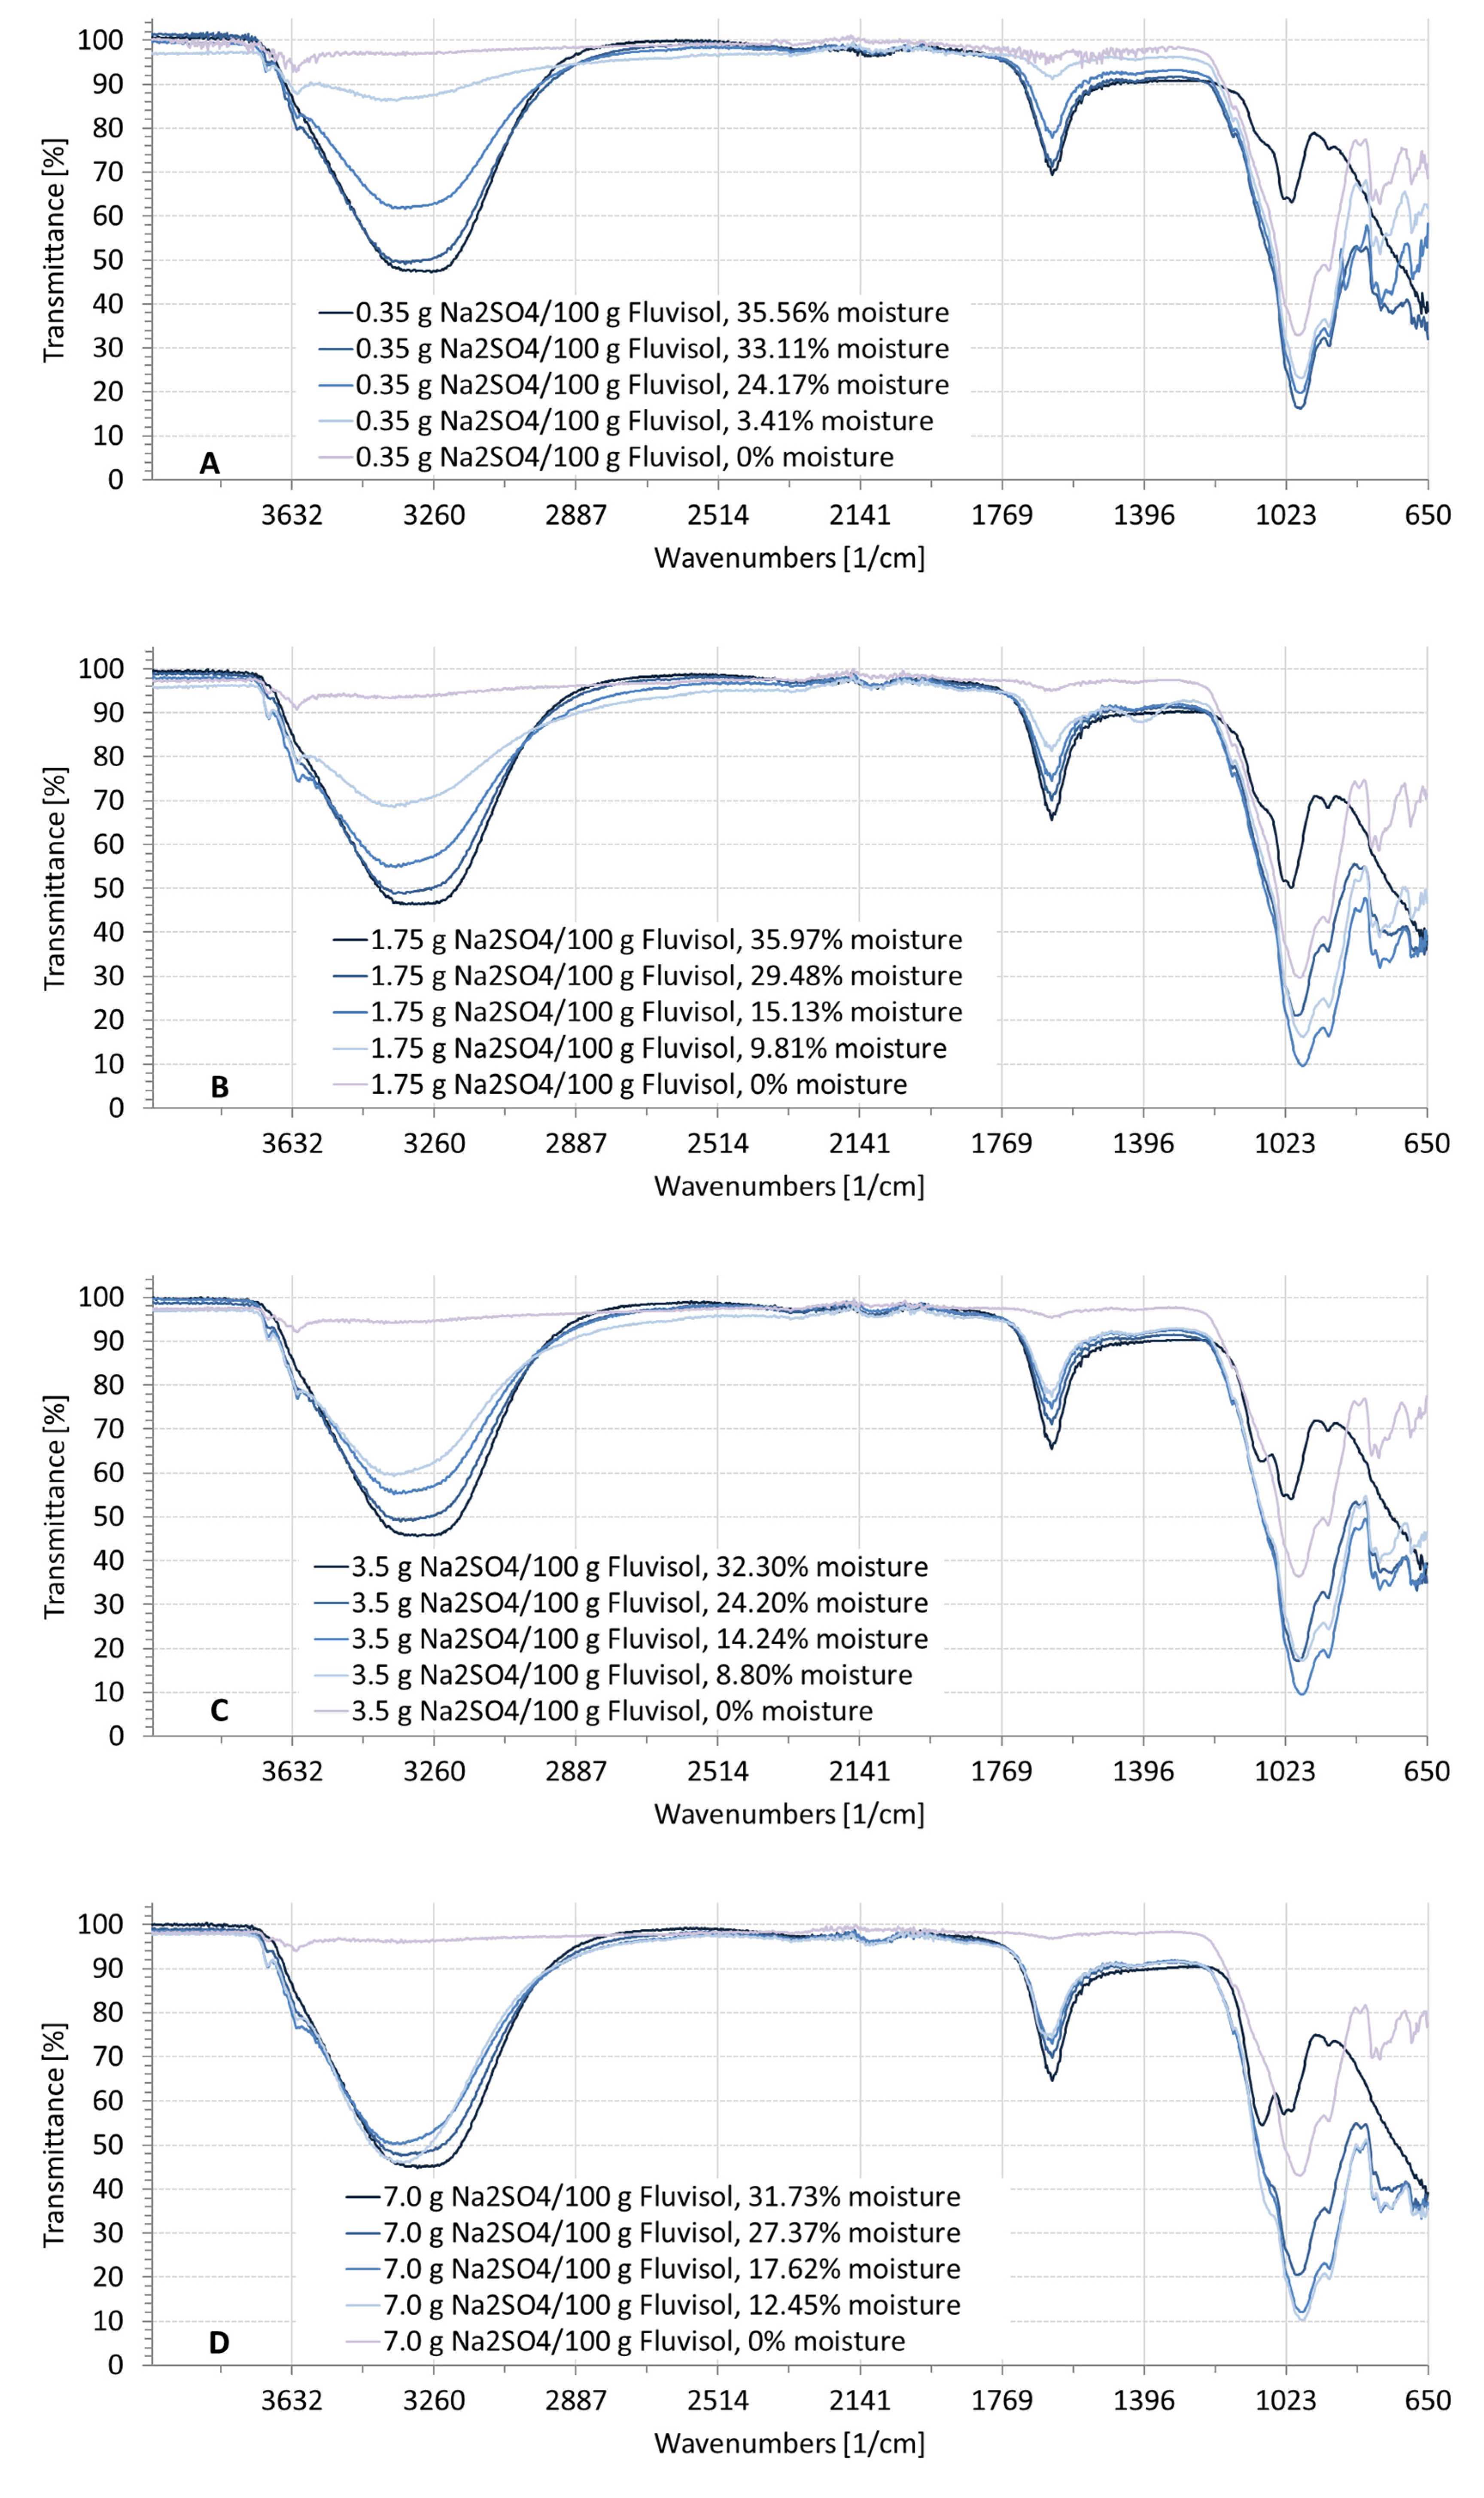
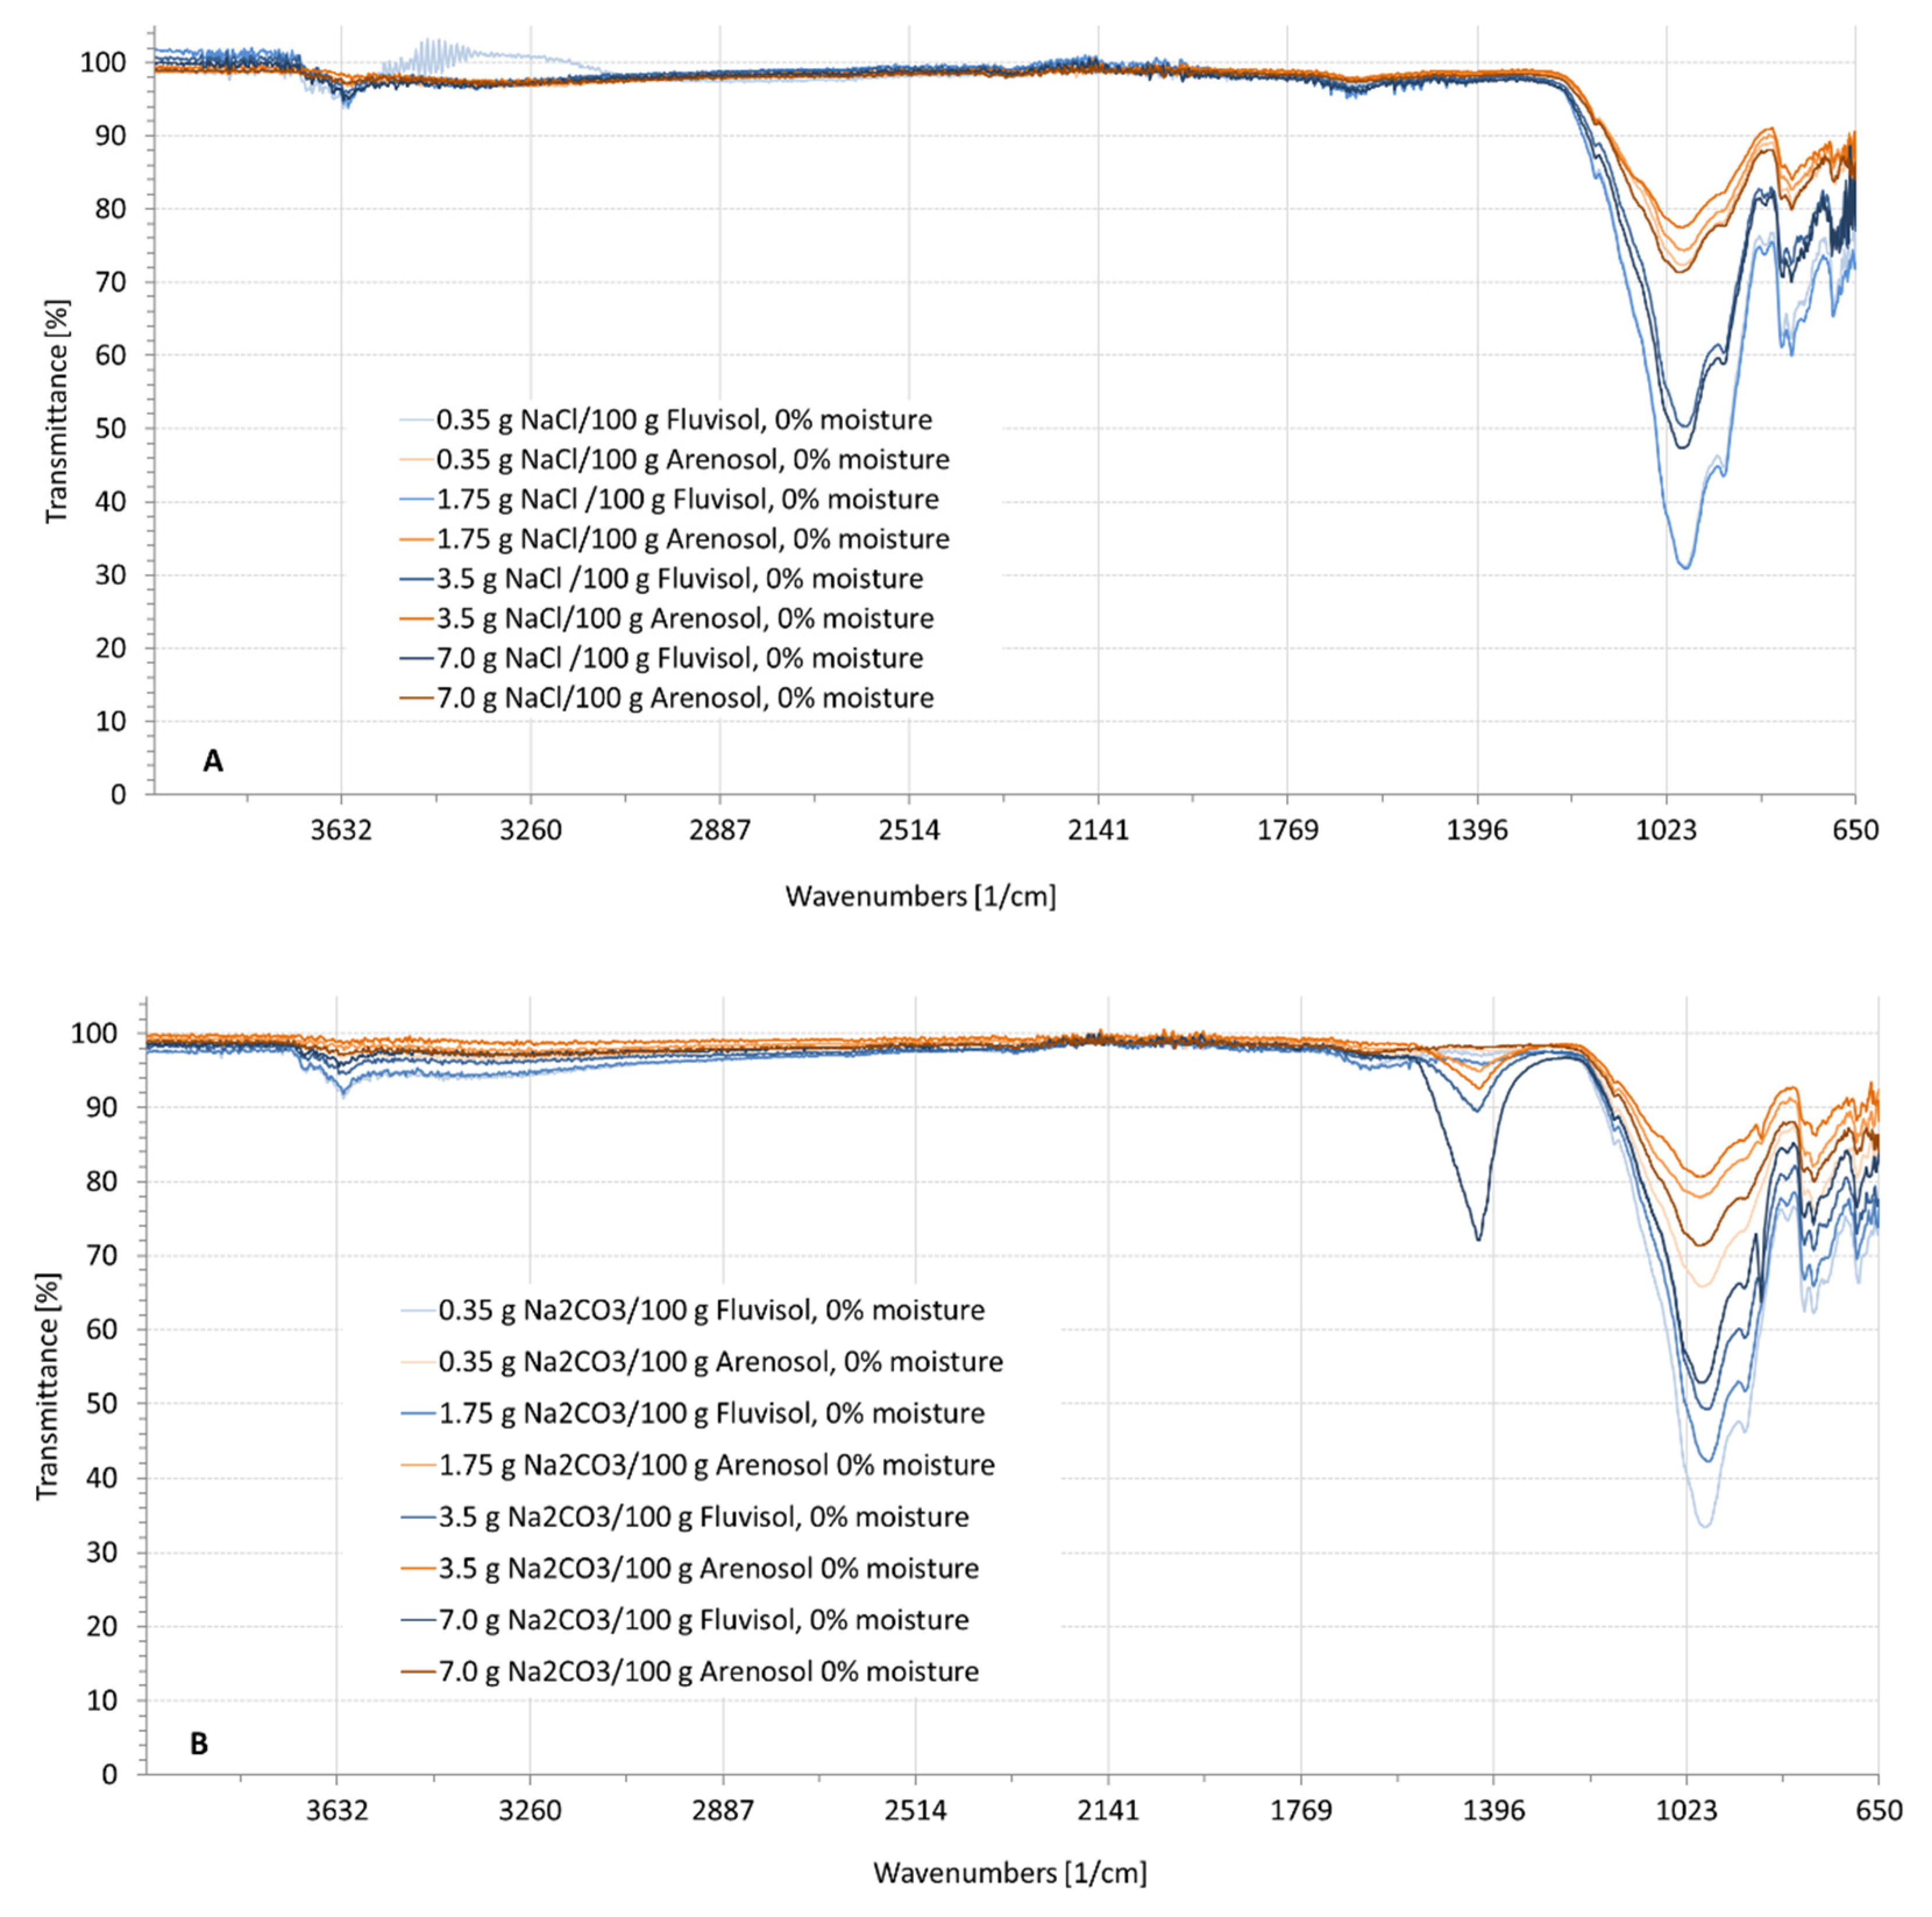
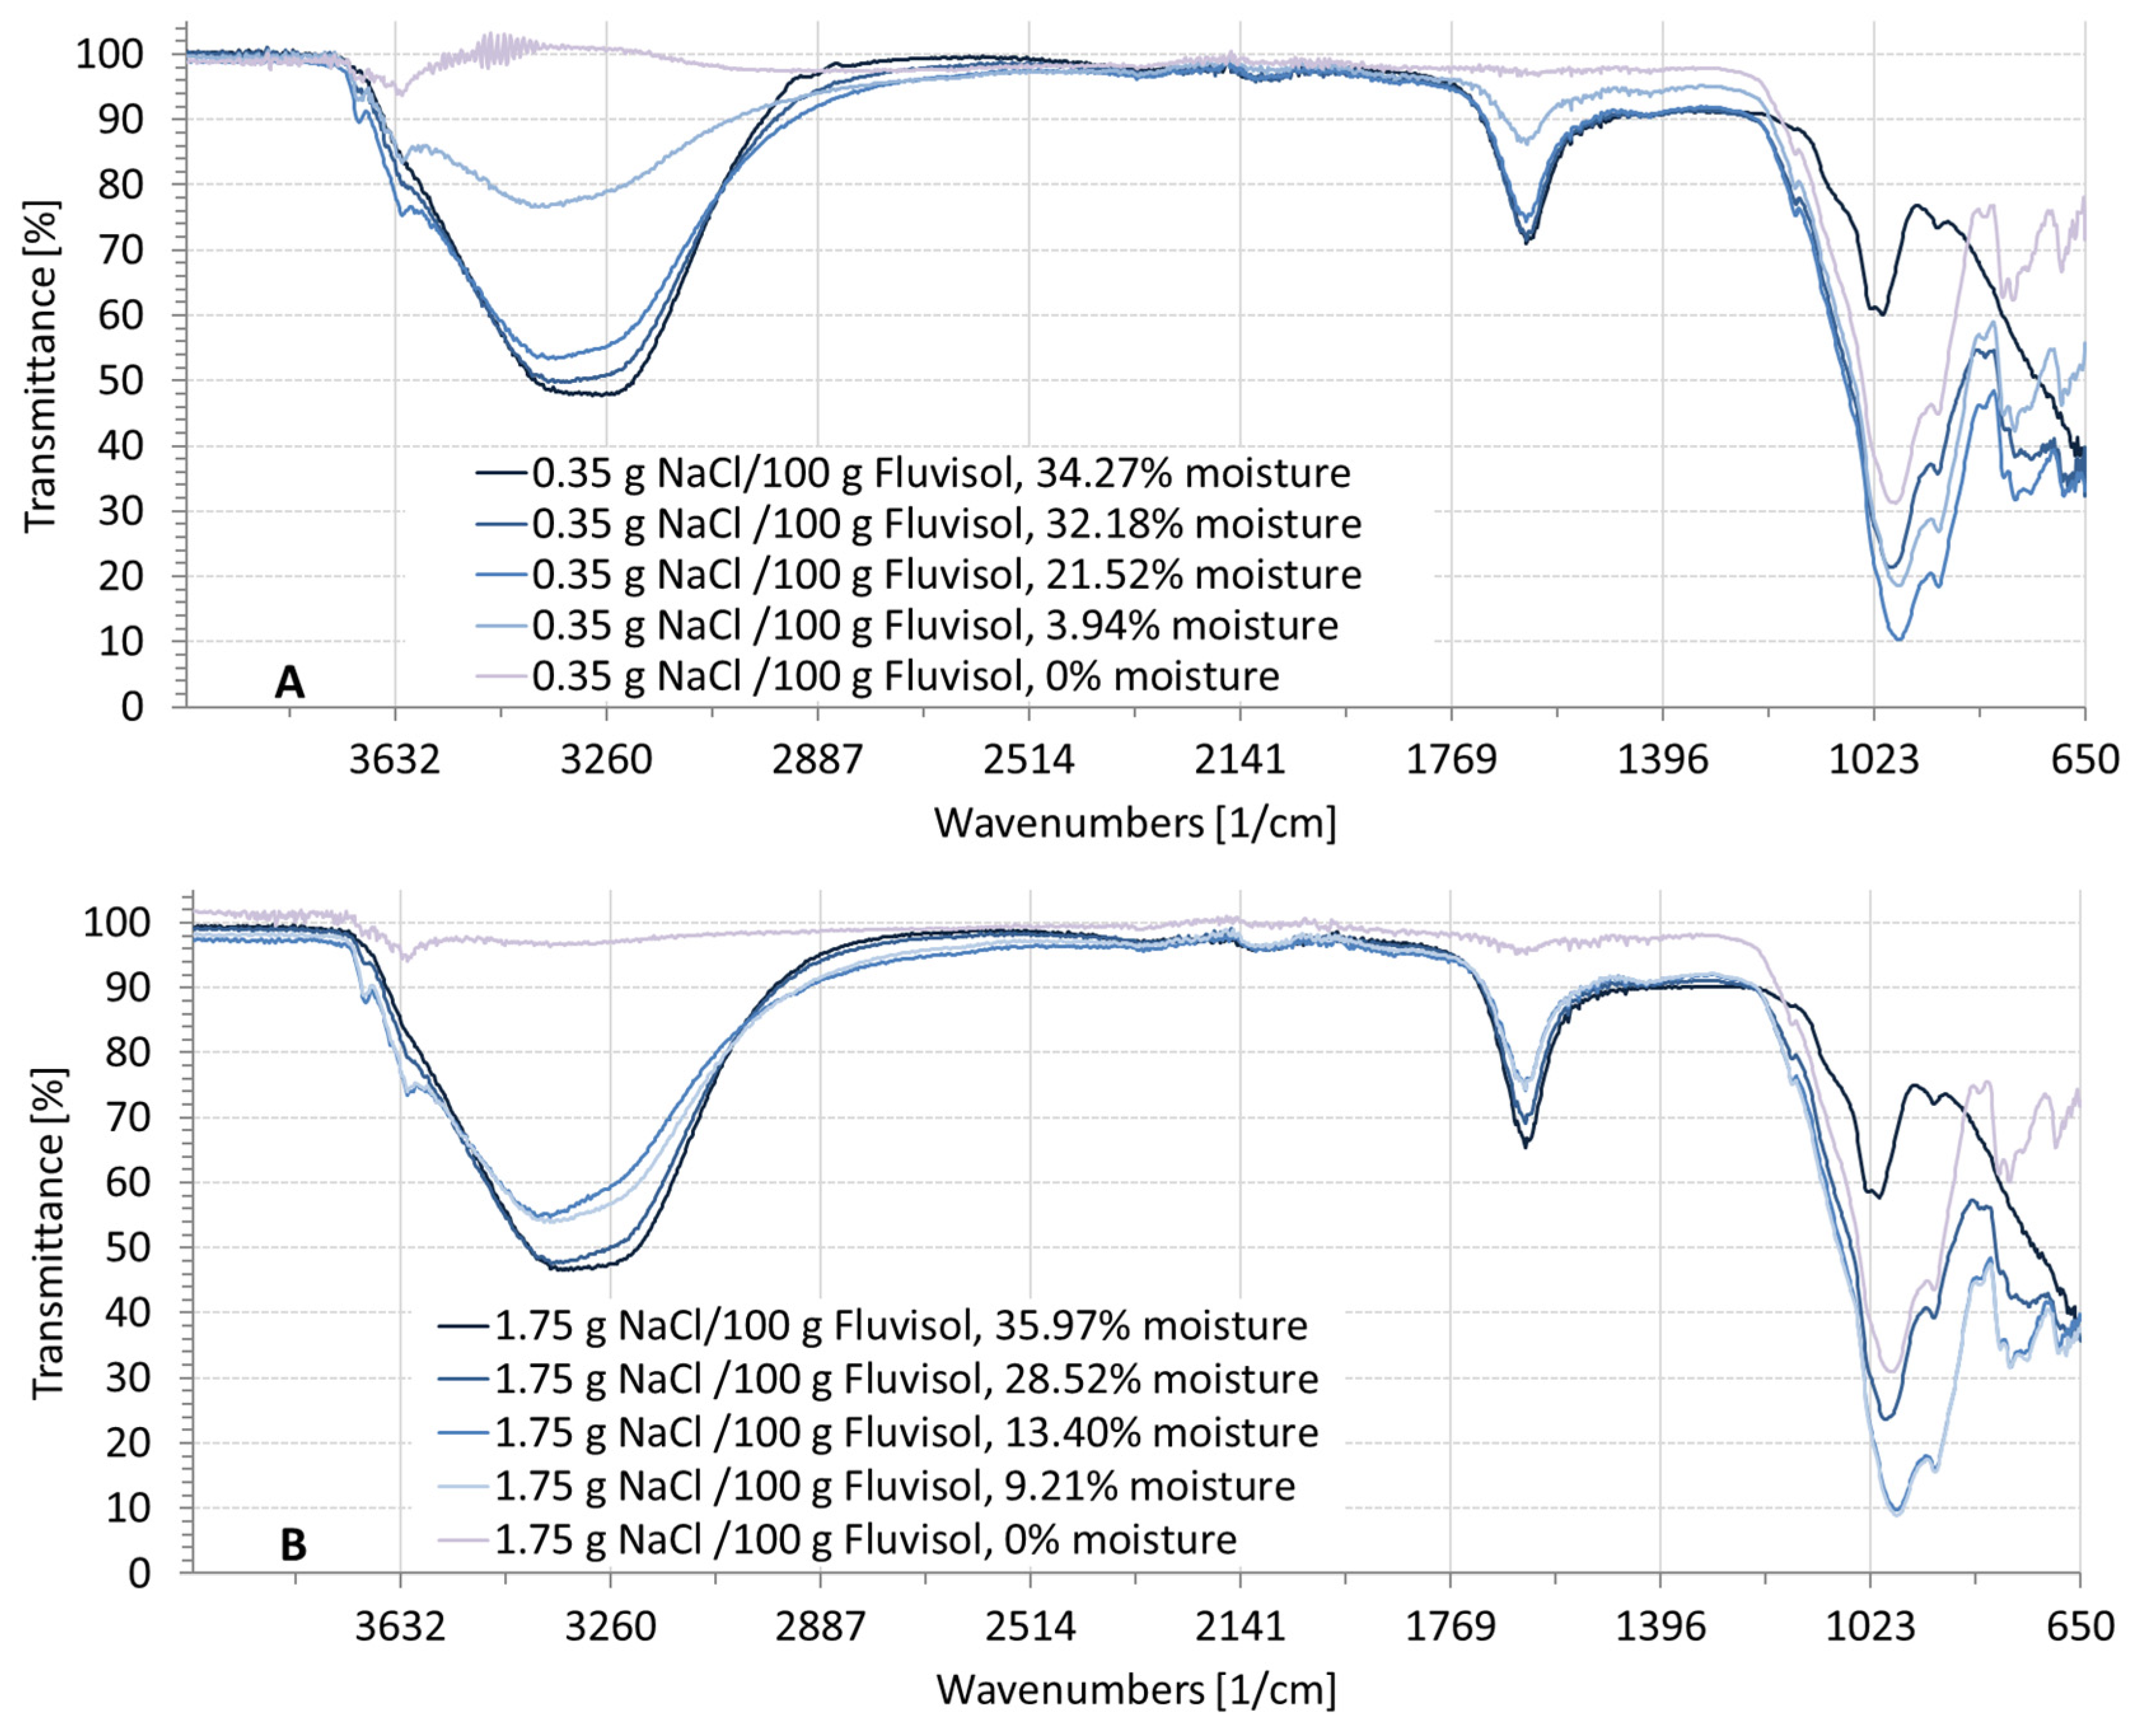
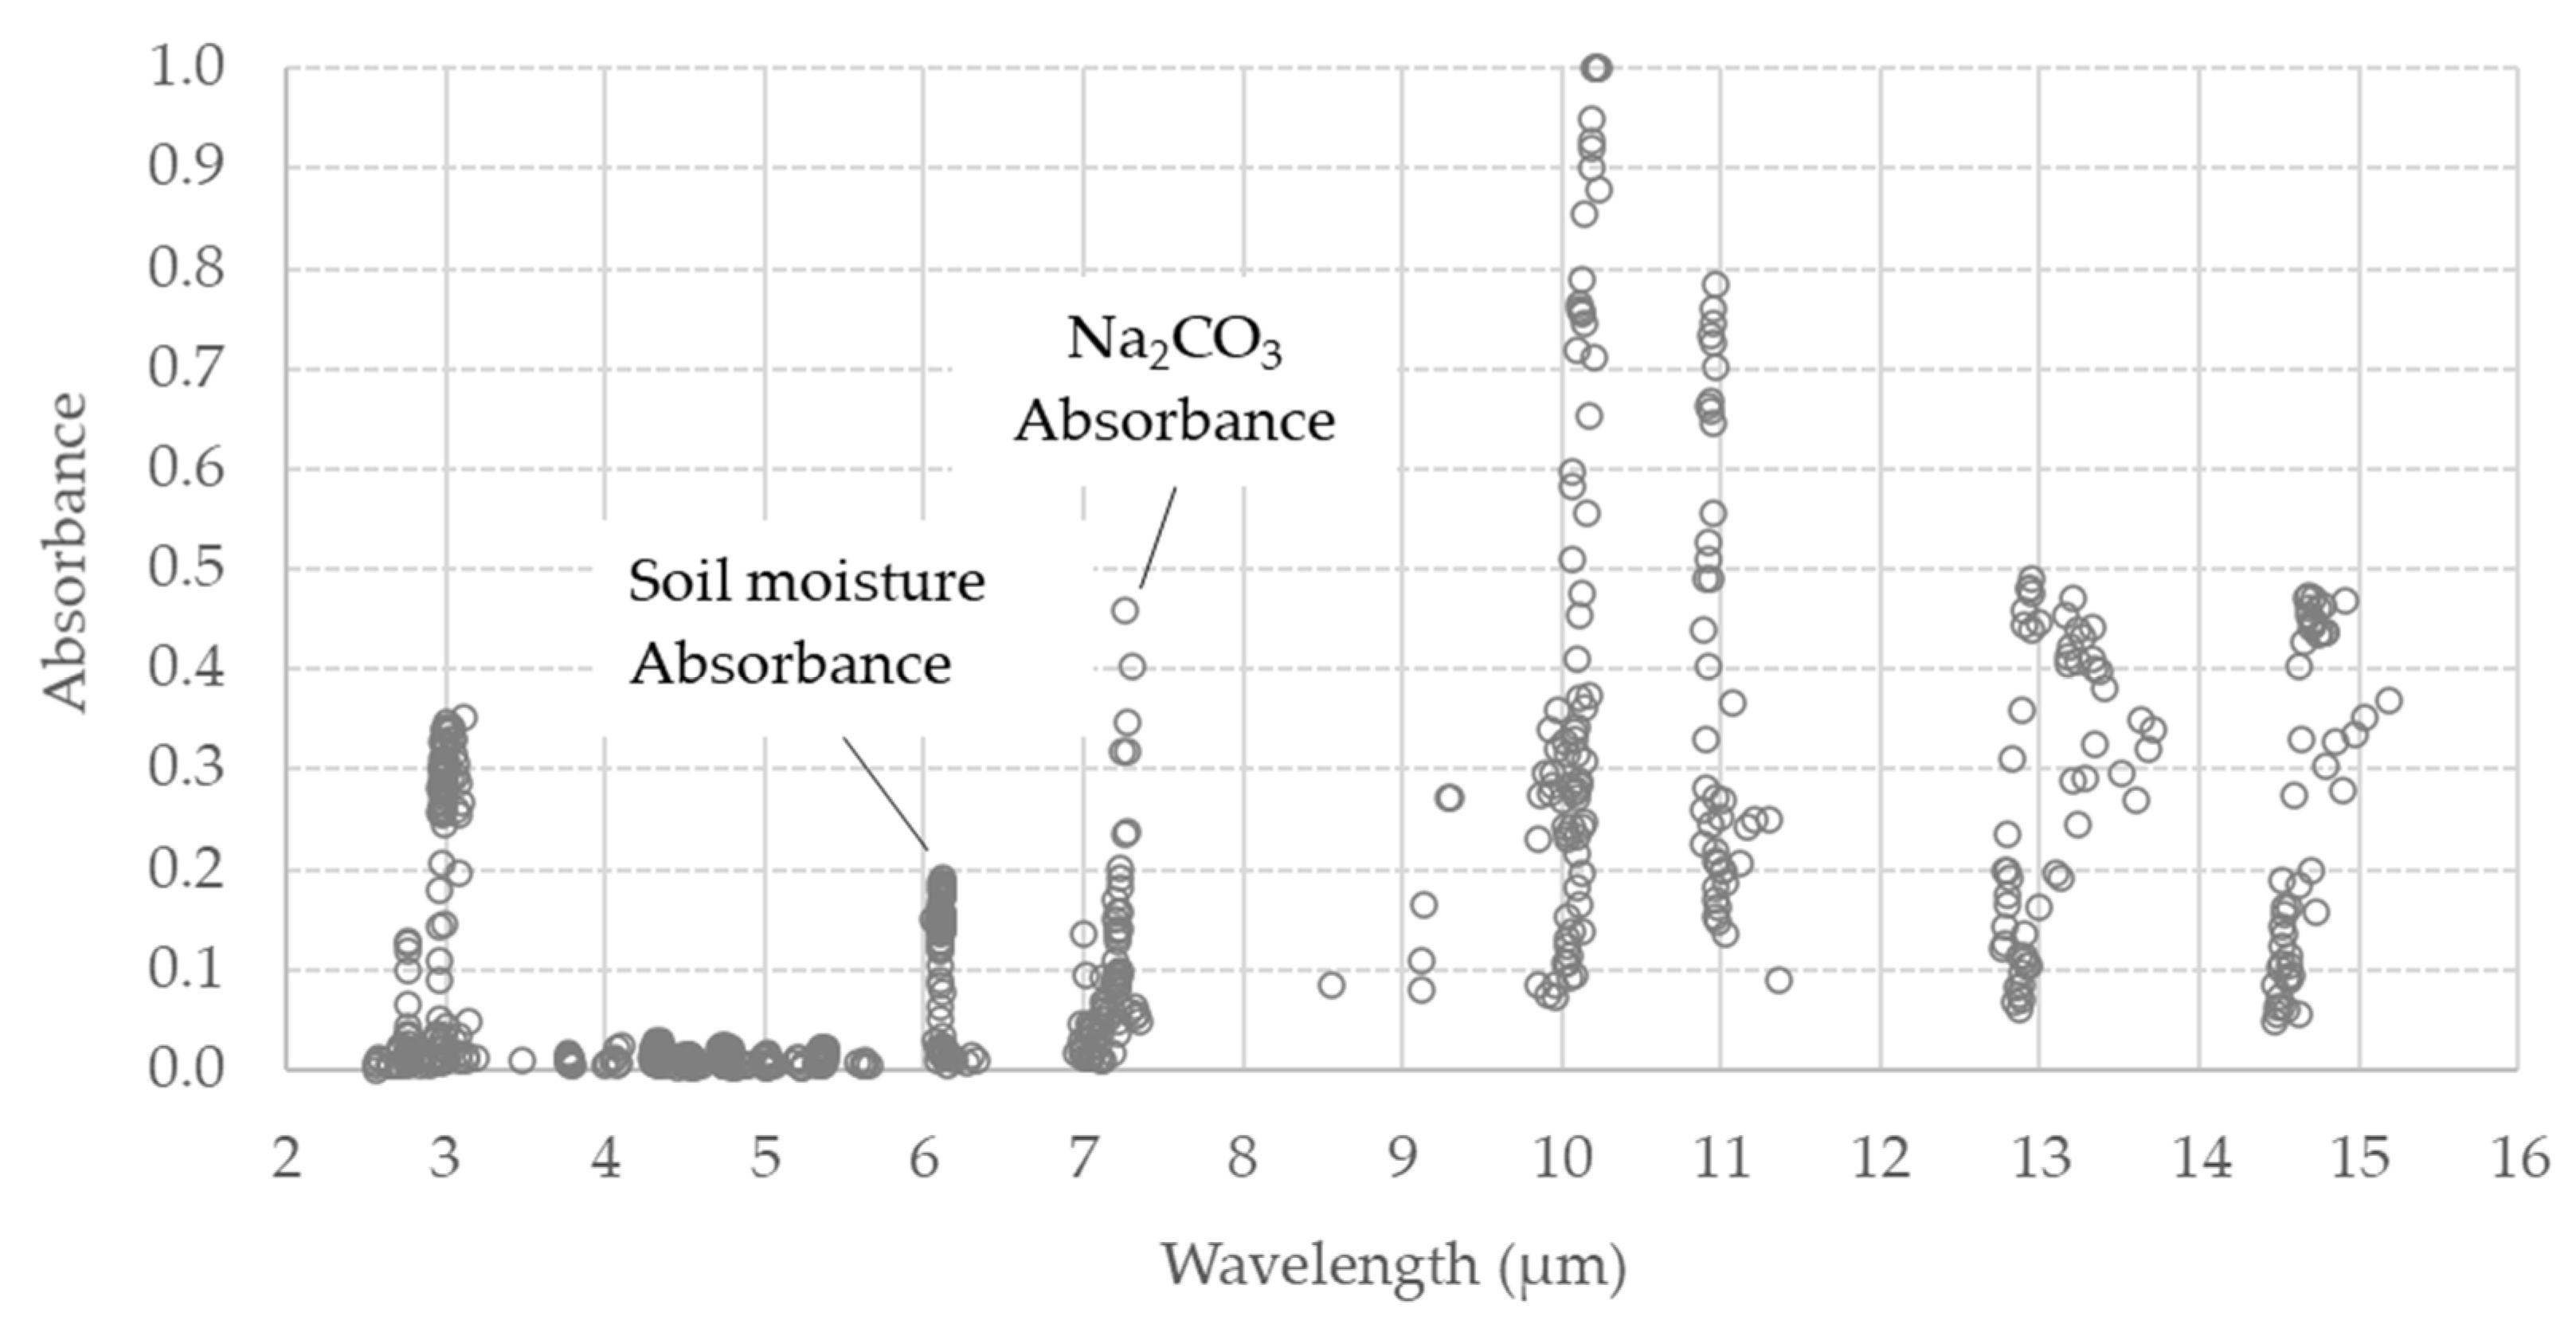
3.2. Spectral Characteristics of Soil Samples Contaminated with NaCl, Na2SO4, Na2CO3

The spectral signatures of the Fluvisol and Arenosol soil samples showed that these were strongly affected by soil moisture. The results are discussed in terms of transmittance and absorbance patterns. We expressed spectral measurements in % transmittance projected on an infrared range from 4000 to 650 cm−1 wavenumber equivalent to wavelengths from 2.5 µm (near infrared) to 15.4 µm (thermal infrared).
Figure 5 represents the soil spectrum for the dry soil samples containing NaCl, Na2CO3 or Na2SO4. When the soil was dry, the spectral images showed some fluctuation in the wavenumber, ranging from 650 cm−1 to 1200 cm−1 (8.33–15.4 µm), with a major spectral absorbance around 1000 cm−1 (10 µm) (Figure 5). Figure 5B shows an additional absorbance from 1200 to 1500 cm−1 (6.67–8.33 µm), with a peak spectral absorbance around 1300 cm−1 (7.69 µm) that represented dry soil contaminated with Na2CO3.
The transmittance was fluctuating in the wavenumber ranges from 3600 to 2900 cm−1 (2.78–3.45 µm) and strongly fluctuating from 1700 to 1500 cm−1 (5.88–6.67 µm), due to the influence of moisture in the soil (Figure 6, Figure 7 and Figure 8). The higher the moisture, the deeper the absorbance. These fluctuations did not appear when the soil was dry for a wavelength range from 1200 to 650 cm−1 (8.33–15.38 µm). Figure 6 represents the soil spectral signature at different moisture levels and contaminated with Na2CO3. Three absorbance bands were similar to the spectrum of soil contaminated with NaCl (Figure 5) or Na2SO4 (Figure 8), ranging from 3600 to 2900 cm−1; from 1700 to 1500 cm−1; and from 1200 to 650 cm−1. An additional absorbance peak appeared in the wavelength range from 1500 to 1200 cm−1 (Figure 7). This wavenumber range displayed a deep absorbance depending on the salt concentration, that also appeared when the soil was dry and not affected by soil moisture.
Spectral characteristics of the soils contaminated with NaCl are depicted in Figure 6. The spectra of the NaCl saline soils were the same as when the soil was dry for different salinity levels, not showing a difference in the spectral absorbance at 775 cm−1 and 911 cm−1. When the soil had different moisture levels and the same salinity level (Figure 6), the higher the moisture content, the higher the spectral absorbance around 775 cm−1 and 911 cm−1. When the moisture was at saturation, the spectral shape from 680 cm−1 to about 1200 cm−1 changed.
The characteristics of the soil spectrum contaminated with Na2CO3 are depicted in Figure 7. In the highly and severely Na2CO3 contaminated soils, a spectral absorbance appeared in the wavenumber range 1240–1480 cm−1, and more specifically around 1380 cm−1, whereby the depth differed with soil moisture. In the soils contaminated with NaCl (Figure 6), this absorbance does not appear, but in the soils contaminated with Na2CO3 the higher the salinity level, the higher the absorbance or lower the transmittance (Figure 7). This spectral interval proved important for detecting the Na2CO3 content in the soil.
The spectral characteristics of the soil contaminated with Na2SO4 (Figure 8) depended on the soil moisture. In comparison to the general spectral characteristics described for the Na2CO3 contaminated soil (Figure 7), the Na2SO4 contaminated soil (Figure 8) did not show any additional absorbance peak. However, there was no clear difference between the samples of the dry soil spectrum with different salinity levels (Figure 5). Absorbance occurred when the soil was moist. The higher the soil moisture, the lower the transmittance or the higher the absorbance (Figure 8).
Spectral signatures of mixed salts (Figure 9) were similar to the spectra of single salt-contaminated soils. Soil mixtures with Na2CO3 salt had absorbances from 1240 to 1480 cm−1 and multiple absorbance/transmittances at different wavelengths depending on the moisture and salt content. An additional absorbance occurred between 1364 and 1430 cm−1 (Figure 9).

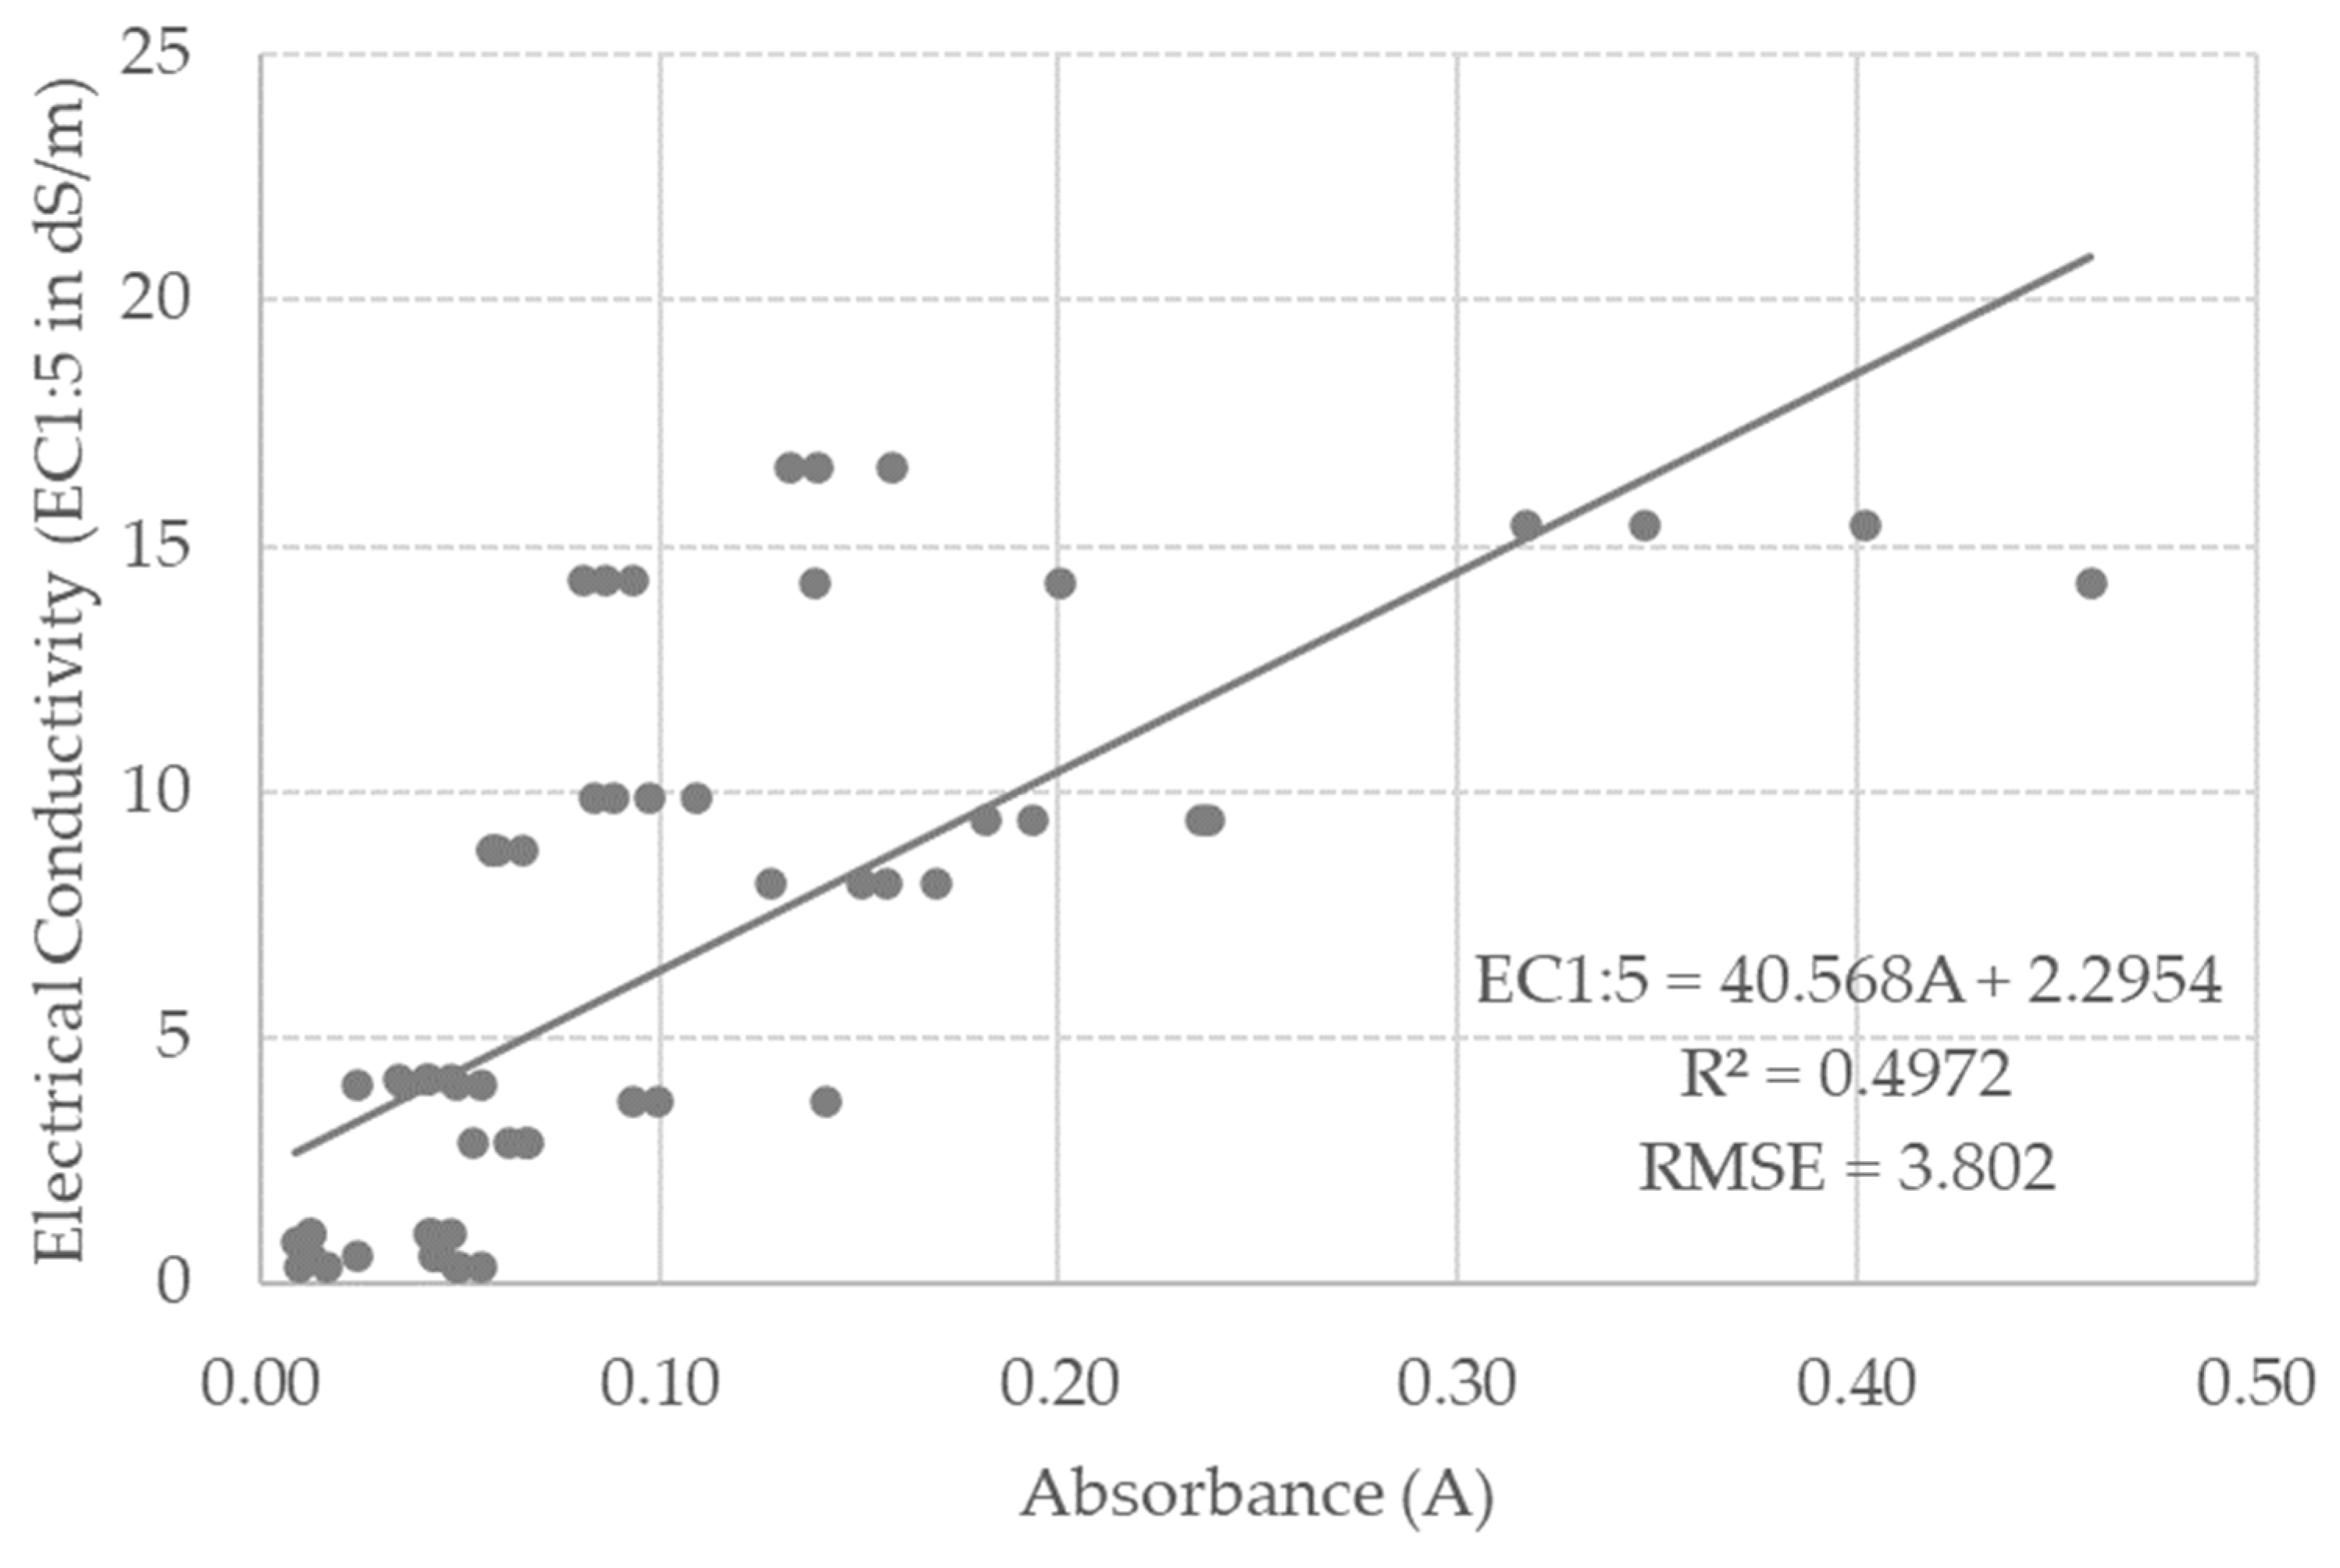
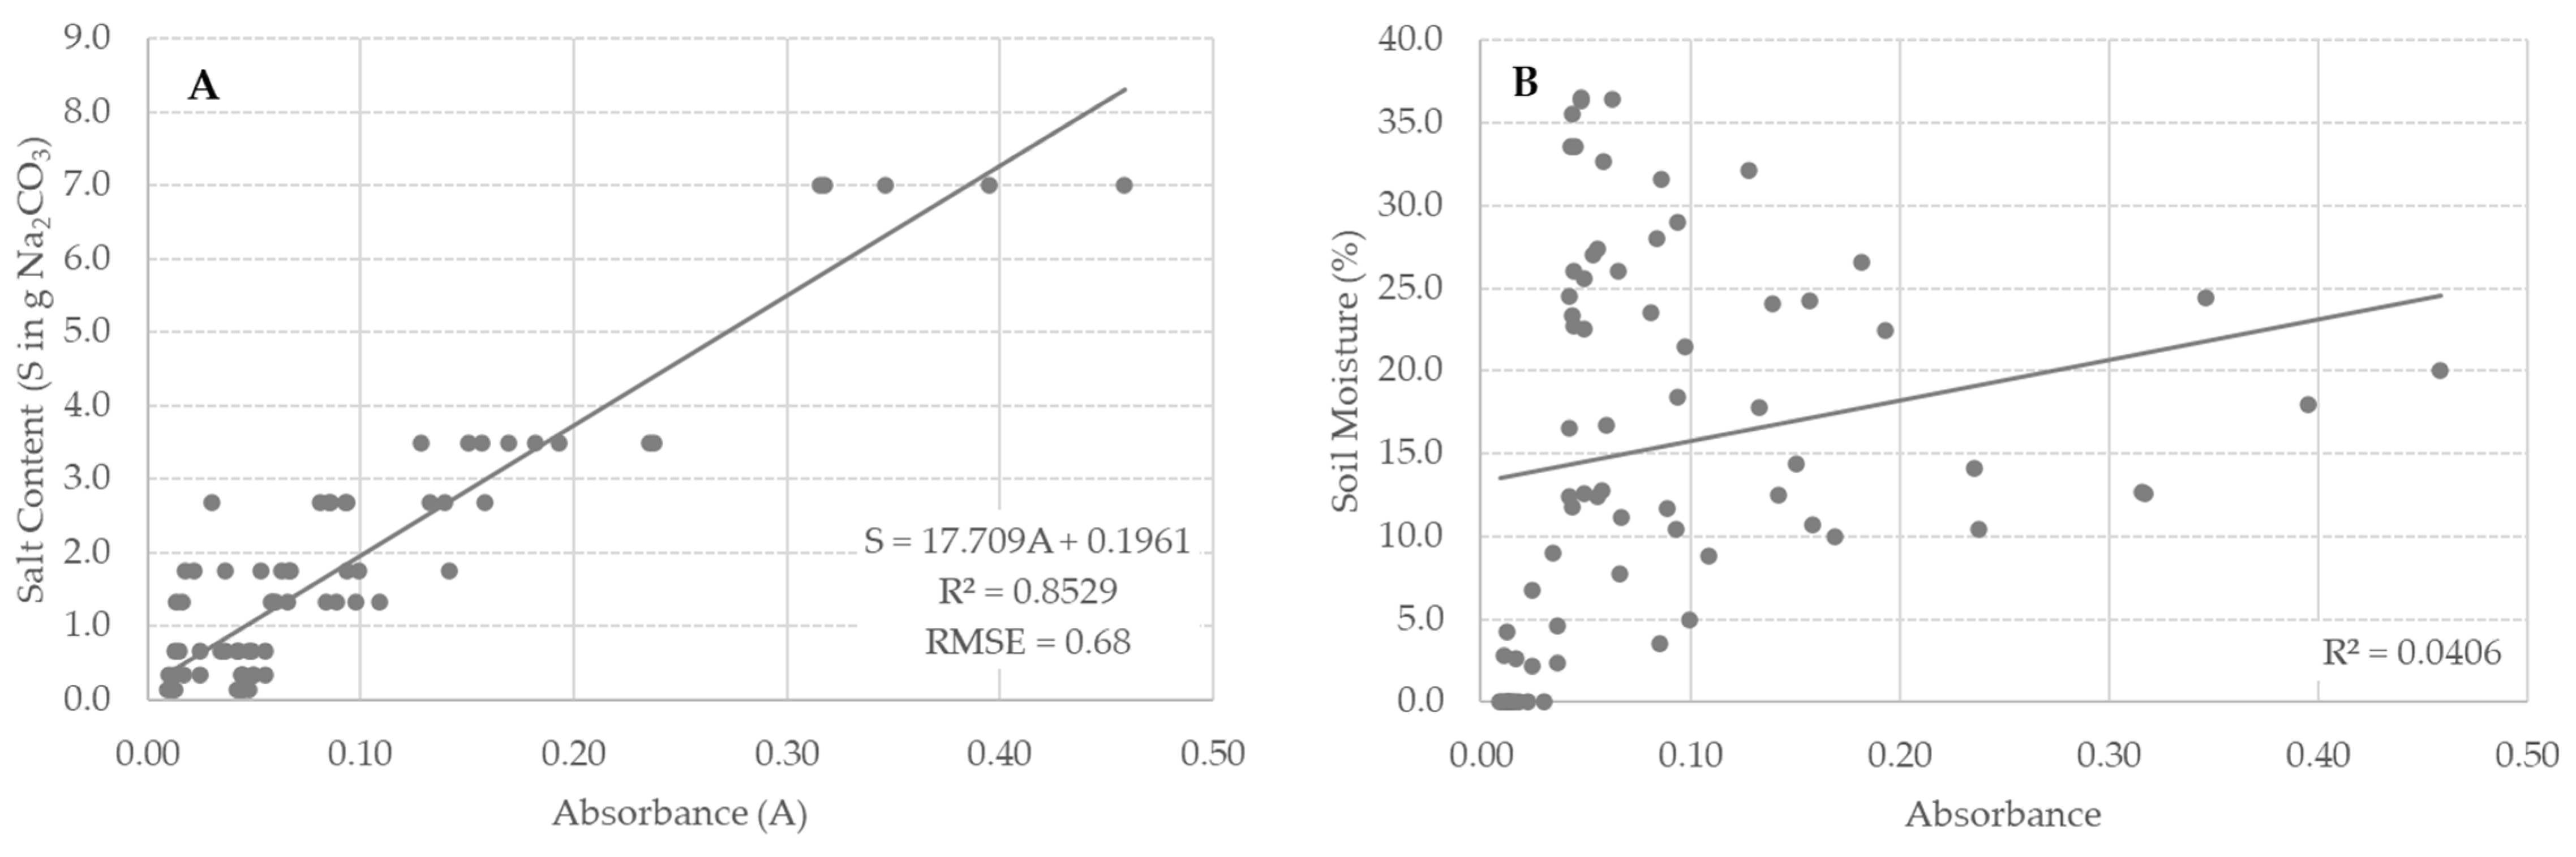
3.3. Model Calibration

The spectra of the soil samples contaminated with Na2CO3 at different concentrations, combined with different moisture levels from saturated to dry, showed that the spectral absorbance depended on both the salt and moisture contents of the soil. Almost all of the absorbances were concentrated at specific wavenumbers. Absorbance peaks related to changes in soil moisture occurred at wavenumbers 1000 cm−1 (10 µm) and 1630 cm−1 (6.13 µm) (Figure 10). Absorbance peaks related to the occurrence and changes in Na2CO3 content were concentrated in the wavenumber range from 1370 to 1420 cm−1 (7.0–7.3 µm) (Figure 10).
The relationship between the absorbance peaks and the change in salt content occurred between wavelengths 6.9 and 7.4 µm, with a peak at 6.99 µm. Between the Na2CO3 contaminated soil and the spectral absorbance value was a linear relationship (Figure 11A) with R2 > 0.5 between wavelengths 6.9 and 7.4 µm and a maximum of R2 = 0.85 at 6.99 µm. Moreover, at these wavelengths, the relationship between the soil moisture and the spectral absorbance value showed very low correlations, R2 = 0.0406 (Figure 11B). The relationship between the Na2CO3 contaminated soil and spectral absorbance is at wavenumber 1431 cm−1 (wavelength 6.99 µm) and can be used to predict the salt content in the moist soils of delta areas.
The absorbance peaks between wavelengths 6.9 and 7.4 µm had a clear relationship with the change in Na2CO3 salt content that was also found with electrical conductivity (EC1:5 in dS/m) as a measure for salt content in the soil (Figure 12).
The relationship between soil moisture and spectral absorbance value was high at wavelengths below 6.7 µm with R2 > 0.5 between wavelengths 5.7 and 6.6 µm, reaching a quadratic relation between soil moisture and absorbance at wavelength 6.13 µm (R2 = 0.7979; Figure 13).

4. Discussion

The experiment was conducted on two soil types, Folic Fluvisol and Fluvic Arenosol, which are the two dominant soil types in the coastal and estuarine areas in Vietnam, such as the Red River delta. Arenosols are among the most extensive soils in the world, covering about 900 million hectares or seven percent of the land surface [14]. In the humid tropics, Arenosols are either young soils in coarsely textured alluvial, lacustrine or aeolian deposits, or they are very old soils in residual acid rock weathering that lost all primary minerals other than (coarse grained) quartz in the course of an impressive pedogenetic history [56].
The spectral features of the salts commonly found in soils are different from the spectral signals from soils contaminated with these salts, particularly for mono-salts. Mono-salts that commonly occur in soils include halite (NaCl), thenardite (Na2SO4), nahcolite (NaHCO3), calcium carbonate (CaCO3) and gypsum (CaSO4.2H2O). The spectral absorbance of Na2SO4 g is similar to gypsum at 1.978 µm, making it difficult to distinguish between them [32]. Absorbances at 1.4, 1.9 and 2.25 µm were attributed to moisture [30,31,32,33,39,44]. Dissolved salts dominate the spectrum, e.g., in soils with NaHCO3 and CaCO3, NaHCO3 dominates the spectral signature with absorbances at 1.334, 1.472, and 1.997 µm [32,44,57].
In our experiments, no specific spectral absorbance region was found for NaCl and Na2SO4 contaminated soil in the wavenumbers ranging from 650 to 4500 cm−1 (2.2–15.4 µm), but a clear absorbance for Na2CO3 contaminated soils was found. The strength of the absorbance was related to the salt content in the soil. The depth of spectral absorbances was different when both the soil moisture and salt concentration changed, which was confirmed by [32,33]. In general, the spectral absorbances of salts are influenced by water molecules [28,44].
Besides the influence of moisture and soluble salts, absorbance spectra are also influenced by the soil’s physico-chemical characteristics, such as clay and organic matter content [58,59]. We found that the Fluvisol had stronger absorbances than the Arenosol. The relationship between the spectral absorbance and the added mass of Na2CO3 (in g) is better (R2 = 0.85) than with the electrical conductivity (R2 = 0.50), which can be explained by the physico-chemical soil characteristics and the dynamics in the soil solution [59]. There is a need for physico-chemical analysis of initial and altered salt compositions following the addition of dry salt mixtures to the soil, to elucidate the soil’s salinity dynamics. Further research will be needed to establish whether the accuracy of salt prediction is influenced by soil colloid characteristics in the spectral range of 2.2 to 15.4 µm.
Most research has focused on the remote sensing detection of soil salinity in the visible spectrum and near- to shortwave infrared [11,60,61,62]. Current satellite sensors offering data in the spectra beyond the near-infrared spectrum have ground sampling distances ranging from 100 m for Landsat and Aster to 1 km for Modis and Sentinel-3 [45]. Despite low spatial and temporal resolutions of the current satellite sensors, detection of soil salinity in the long-wave and thermal spectrum offers possibilities for soil salinity monitoring [4,63]. Newly planned thermal infrared satellite constellations will enable a revisit time of a few days and a resolution below 100 m.

5. Conclusions

Soil moisture had a large impact on the soil spectrum. The impact of salt contamination was located in three main wavelength ranges: 3400–3200 cm−1, 1700–1600 cm−1 and 1100–900 cm−1. The salt-contaminated soils did not have the same diagnostic absorbance as the spectral signatures of the salt minerals. The spectra of soil contaminated with NaCl and Na2SO4 salts was similar to the spectra of soils that were not contaminated with salt. The spectra of soil contaminated with Na2CO3 salt showed clear signs of spectral absorbance in the wavenumbers ranging from 1360 to 1464 cm−1. At wavelength 6.99 µm, there was no relationship between the absorbance and soil moisture, but the absorbance was proportional to the salt content (R2 = 0.8529; RMSE = 0.68 g) and electrical conductivity (R2 = 0.4972; RMSE = 3.8 dS/m). Therefore, these spectra could be used to estimate Na2CO3 salt content in moist soil. Moreover, these wavelengths were not affected by soil moisture. The relationship between the soil moisture and spectral absorbance value was high at wavelengths below 6.7 µm, resulting in a quadratic relation between soil moisture and absorbance at wavelength 6.13 µm (R2 = 0.7979; RMSE = 5.2%). Advances in thermal infrared sensor technologies may offer possibilities for soil salinity monitoring in difficult to access locations.

Author Contributions

Conceptualization, L.T.T.H. and A.G.; methodology, L.T.T.H. and A.G.; validation, L.T.T.H., A.G., D.T.L., D.T.Q., N.T.H., N.N.T., N.T.B., V.T.K.D. and P.H.L.; investigation, L.T.T.H., A.G., D.T.L., D.T.Q., N.T.H., N.N.T., N.T.B., V.T.K.D. and P.H.L.; resources, L.T.T.H., D.T.L., D.T.Q., N.T.H., N.N.T., N.T.B., V.T.K.D. and P.H.L.; data curation, L.T.T.H., A.G., D.T.L., D.T.Q., N.T.H., N.N.T., N.T.B., V.T.K.D. and P.H.L.; writing—original draft preparation, L.T.T.H. and A.G.; writing—review and editing, A.G.; visualization, L.T.T.H., A.G., N.N.T. and P.H.L.; supervision, L.T.T.H. and A.G.; project administration, L.T.T.H. and A.G.; funding acquisition, L.T.T.H. and A.G. All authors have read and agreed to the published version of the manuscript.

Funding

This work has been funded by the Vietnam Academy of Science and Technology (VAST) under the “Determination of salinity level of surface soil for agricultural cultivation in some areas near coastal estuaries of Hai Phong-Thai Binh by hyperspectral remote sensing imagery”, with the project code: VAST01.02/17-18. This article was supported by the Vietnam–Belgium bilateral project: “Monitoring Climate Impact and Disaster Resilience of Vietnamese Agro-ecosystems” (MINERVA). Vietnam Ministry of Science and Technology (MOST): NDT.96.BE/20; and Belgian Federal Science Policy Office (BELSPO): BL/67/VT44.

Data Availability Statement

Spectral data are available on the website https://speclib.ga/labspectral.php (accessed on 6 April 2022).

Conflicts of Interest

The authors declare no conflict of interest. The funders had no role in the design of the study; in the collection, analyses, or interpretation of data; in the writing of the manuscript, or in the decision to publish the results.

References

  1. Shahbaz, M.; Ashraf, M. Improving Salinity Tolerance in Cereals. Crit. Rev. Plant Sci. 2013, 32, 237–249. [Google Scholar] [CrossRef]
  2. Yamaguchi, T.; Blumwald, E. Developing Salt-Tolerant Crop Plants: Challenges and Opportunities. Trends Plant Sci. 2005, 10, 615–620. [Google Scholar] [CrossRef] [PubMed]
  3. Machado, R.M.A.; Serralheiro, R.P. Soil Salinity: Effect on Vegetable Crop Growth. Management Practices to Prevent and Mitigate Soil Salinization. Horticulturae 2017, 3, 30. [Google Scholar] [CrossRef]
  4. Ivushkin, K.; Bartholomeus, H.; Bregt, A.K.; Pulatov, A.; Kempen, B.; de Sousa, L. Global Mapping of Soil Salinity Change. Remote Sens. Environ. 2019, 231, 111260. [Google Scholar] [CrossRef]
  5. Gupta, A.; Shaw, B.P. Biochemical and Molecular Characterisations of Salt Tolerance Components in Rice Varieties Tolerant and Sensitive to NaCl: The Relevance of Na+ Exclusion in Salt Tolerance in the Species. Funct. Plant Biol. 2021, 48, 72. [Google Scholar] [CrossRef] [PubMed]
  6. Jamil, A.; Riaz, S.; Ashraf, M.; Foolad, M.R. Gene Expression Profiling of Plants under Salt Stress. Crit. Rev. Plant Sci. 2011, 30, 435–458. [Google Scholar] [CrossRef]
  7. Butcher, K.; Wick, A.F.; DeSutter, T.; Chatterjee, A.; Harmon, J. Soil Salinity: A Threat to Global Food Security. Agron. J. 2016, 108, 2189–2200. [Google Scholar] [CrossRef]
  8. Gobin, A.; Hien, L.T.T.; Hai, L.T.; Linh, P.H.; Thang, N.N.; Vinh, P.Q. Adaptation to Land Degradation in Southeast Vietnam. Land 2020, 9, 302. [Google Scholar] [CrossRef]
  9. Hai, L.T.; Gobin, A.; Hens, L. Risk Assessment of Desertification for Binh Thuan Province, Vietnam. Hum. Ecol. Risk Assess. Int. J. 2013, 19, 1544–1556. [Google Scholar] [CrossRef]
  10. Herbert, E.R.; Boon, P.; Burgin, A.J.; Neubauer, S.C.; Franklin, R.B.; Ardón, M.; Hopfensperger, K.N.; Lamers, L.P.; Gell, P. A Global Perspective on Wetland Salinization: Ecological Consequences of a Growing Threat to Freshwater Wetlands. Ecosphere 2015, 6, 1–43. [Google Scholar] [CrossRef]
  11. Metternicht, G.I.; Zinck, J.A. Remote Sensing of Soil Salinity: Potentials and Constraints. Remote Sens. Environ. 2003, 85, 1–20. [Google Scholar] [CrossRef]
  12. Hien, L.T.T.; Gobin, A.; Huong, P.T.T. Spatial Indicators for Desertification in Southeast Vietnam. Nat. Hazards Earth Syst. Sci. 2019, 19, 2325–2337. [Google Scholar] [CrossRef] [Green Version]
  13. Gobin, A.; Nguyen, H.T.; Pham, V.Q.; Pham, H.T.T. Heavy Rainfall Patterns in Vietnam and Their Relation with ENSO Cycles: Heavy Rainfall Patterns in Vietnam. Int. J. Climatol. 2016, 36, 1686–1699. [Google Scholar] [CrossRef] [Green Version]
  14. Food and Agriculture Organization. World Reference Base for Soil Resources 2014: International Soil Classification System for Naming Soils and Creating Legends for Soil Maps; FAO: Rome, Italy, 2014; ISBN 978-92-5-108369-7. [Google Scholar]
  15. Food and Agriculture Organization. Mapping of Salt-Affected Soils. Technical Specifications and Country Guidelines; FAO: Rome, Italy, 2020. [Google Scholar]
  16. Abrol, I.P.; Yadav, J.S.P.; Massoud, F.I. Salt-Affected Soils and Their Management; FAO: Rome, Italy, 1988. [Google Scholar]
  17. Paul, B.K.; Rashid, H. Climatic Hazards in Coastal Bangladesh. Sci. Dir. 2017, 153–182. [Google Scholar]
  18. Munns, R. Genes and Salt Tolerance: Bringing Them Together. N. Phytol. 2005, 167, 645–663. [Google Scholar] [CrossRef]
  19. Shrivastava, P.; Kumar, R. Soil Salinity: A Serious Environmental Issue and Plant Growth Promoting Bacteria as One of the Tools for Its Alleviation. Saudi J. Biol. Sci. 2015, 22, 123–131. [Google Scholar] [CrossRef] [Green Version]
  20. Hunt, G.R. Visible and Near-Infrared Spectra of Minerals and Rocks: IV. Sulphides and Sulphates. Mod. Geol. 1971, 3, 1–14. [Google Scholar]
  21. Hunt, G.R.; Salisbury, J.W. Visible and near Infrared Spectra of Minerals and Rocks. II. Carbonates. Mod. Geol. 1971, 2, 23–30. [Google Scholar]
  22. Csillag, F.; Pásztor, L.; Biehl, L.L. Spectral Band Selection for the Characterization of Salinity Status of Soils. Remote sens. Environ. 1993, 43, 231–242. [Google Scholar] [CrossRef]
  23. Farifteh, J.; van der Meer, F.; van der Meijde, M.; Atzberger, C. Spectral Characteristics of Salt-Affected Soils: A Laboratory Experiment. Geoderma 2008, 145, 196–206. [Google Scholar] [CrossRef]
  24. Beck, R.H. Spectral Characteristics of Soils Related to the Interaction of Soil Moisture, Organic Carbon, and Clay Content; Paper 100; LARS Technical Reports: West Lafayette, IN, USA, 1975. [Google Scholar]
  25. Condit, H.R. The Spectral Reflectance of American Soils. Photogramm. Eng. 1970, 36, 955–966. [Google Scholar]
  26. Everitt, J.H.; Escobar, D.E.; Gerbermann, A.H.; Alaniz, M.A. Detecting Saline Soils with Video Imagery. Photogramm. Eng. Remote Sens. 1988, 54, 1283–1287. [Google Scholar]
  27. Melendez-Pastor, I.; Navarro-Pedreño, J.; Gómez, I.; Koch, M. Identifying Optimal Spectral Bands to Assess Soil Properties with VNIR Radiometry in Semi-Arid Soils. Geoderma 2008, 147, 126–132. [Google Scholar] [CrossRef]
  28. Mahajan, G.R.; Das, B.; Gaikwad, B.; Murgaonkar, D.; Desai, A.; Morajkar, S.; Patel, K.P.; Kulkarni, R.M. Monitoring Properties of the Salt-Affected Soils by Multivariate Analysis of the Visible and near-Infrared Hyperspectral Data. CATENA 2021, 198, 105041. [Google Scholar] [CrossRef]
  29. Hunt, G.R. Visible and Near-Infrared Spectra of Minerals and Rocks: V. Halides, Phosphates, Arsenates, Venadates and Borates. Mod. Geol. 1972, 3, 121–132. [Google Scholar]
  30. Crowley, J.K. Visible and Near-Infrared (0.4–2.5 Μm) Reflectance Spectra of Playa Evaporite Minerals. J. Geophys. Res. Solid Earth 1991, 96, 16231–16240. [Google Scholar] [CrossRef]
  31. Mougenot, B.; Pouget, M.; Epema, G.F. Remote Sensing of Salt Affected Soils. Remote Sens. Rev. 1993, 7, 241–259. [Google Scholar] [CrossRef]
  32. Howari, F.M.; Goodell, P.C.; Miyamoto, S. Spectral Properties of Salt Crusts Formed on Saline Soils. J. Environ. Qual. 2002, 31, 1453–1461. [Google Scholar] [CrossRef]
  33. Farifteh, J. Imaging Spectroscopy of Salt-Affected Soils: Model-Based Integrated Method. Doctoral Dissertation 143, Utrecht University, Utrecht, The Netherlands, ITC (Faculty of Geo-Information Science and Earth Observation, University of Twente), Enschede, The Netherlands, May 2007. [Google Scholar]
  34. Gobin, A.; Campling, P.; Deckers, J.; Feyen, J. Quantifying Soil Morphology in Tropical Environments Methods and Application in Soil Classification. Soil Sci. Soc. Am. J. 2000, 64, 1423–1433. [Google Scholar] [CrossRef] [Green Version]
  35. Twomey, S.A.; Bohren, C.F.; Mergenthaler, J.L. Reflectance and Albedo Differences between Wet and Dry Surfaces. Appl. Opt. 1986, 25, 431. [Google Scholar] [CrossRef]
  36. Lobell, D.B.; Asner, G.P. Moisture Effects on Soil Reflectance. Soil Sci. Soc. Am. J. 2002, 66, 722–727. [Google Scholar] [CrossRef]
  37. Ben-Dor, E.; Chabrillat, S.; Demattê, J.A.M.; Taylor, G.R.; Hill, J.; Whiting, M.L.; Sommer, S. Using Imaging Spectroscopy to Study Soil Properties. Remote Sens. Environ. 2009, 113, S38–S55. [Google Scholar] [CrossRef]
  38. Liu, W.; Baret, F.; Gu, X.; Zhang, B.; Tong, Q.; Zheng, L. Evaluation of Methods for Soil Surface Moisture Estimation from Reflectance Data. Int. J. Remote Sens. 2003, 24, 2069–2083. [Google Scholar] [CrossRef]
  39. Peng, J.; Biswas, A.; Jiang, Q.; Zhao, R.; Hu, J.; Hu, B.; Shi, Z. Estimating Soil Salinity from Remote Sensing and Terrain Data in Southern Xinjiang Province, China. Geoderma 2019, 337, 1309–1319. [Google Scholar] [CrossRef]
  40. Ben-Dor, E.; Patkin, K.; Banin, A.; Karnieli, A. Mapping of Several Soil Properties Using DAIS-7915 Hyperspectral Scanner Data-a Case Study over Clayey Soils in Israel. Int. J. Remote Sens. 2002, 23, 1043–1062. [Google Scholar] [CrossRef]
  41. Ben-Dor, E.; Heller, D.; Chudnovsky, A. A Novel Method of Classifying Soil Profiles in the Field Using Optical Means. Soil Sci. Soc. Am. J. 2008, 72, 1113–1123. [Google Scholar] [CrossRef]
  42. Muller, E.; Decamps, H. Modeling Soil Moisture–Reflectance. Remote Sens. Environ. 2001, 76, 173–180. [Google Scholar] [CrossRef] [Green Version]
  43. Zeng, W.; Zhang, D.; Fang, Y.; Wu, J.; Huang, J. Comparison of Partial Least Square Regression, Support Vector Machine, and Deep-Learning Techniques for Estimating Soil Salinity from Hyperspectral Data. J. Appl. Rem. Sens. 2018, 12, 1. [Google Scholar] [CrossRef]
  44. Peng, X.; Xu, C.; Zeng, W.; Wu, J.; Huang, J. Elimination of the Soil Moisture Effect on the Spectra for Reflectance Prediction of Soil Salinity Using External Parameter Orthogonalization Method. J. Appl. Remote Sens. 2016, 10, 015014. [Google Scholar] [CrossRef]
  45. Blommaert, J.; Lesschaeve, S.; Tavares, J.L.; Nuyts, D.; Delaure, B.; Gobin, A.; Dries, J.C.; De Vos, L. Satirim: Towards a Thermal IR Small Satellites Constellation. In Proceedings of the 2021 IEEE International Geoscience and Remote Sensing Symposium IGARSS, Brussels, Belgium, 11 July 2021; IEEE: Brussels, Belgium, 2021; pp. 1765–1768. [Google Scholar]
  46. Hoa, P.; Giang, N.; Binh, N.; Hai, L.; Pham, T.-D.; Hasanlou, M.; Tien Bui, D. Soil Salinity Mapping Using SAR Sentinel-1 Data and Advanced Machine Learning Algorithms: A Case Study at Ben Tre Province of the Mekong River Delta (Vietnam). Remote Sens. 2019, 11, 128. [Google Scholar] [CrossRef] [Green Version]
  47. TCVN 4046-85; Soil—Method of Sampling. State Science and Technology Committee: Hanoi, Vietnam, 1985.
  48. ISO 11464:2006; Soil Quality—Pretreatment of Samples for Physico-Chemical Analysis. ISO: Geneva, Switzerland, 2006.
  49. TCVN 4080:2011; Soil Quality—Determination of Moisture and Absolute Dryness Coefficient. Ministry of Science and Technology: Hanoi, Vietnam, 2011.
  50. TCVN 8567:2010; Soil Quality—Method for Determination of Particle Size Dístribution. Ministry of Science and Technology: Hanoi, Vietnam, 2010.
  51. ISO 11265:1994; Soil Quality—Determination of the Specific Electrical Conductivity. ISO: Geneva, Switzerland, 1994.
  52. R Core Team. A Language and Environment for Statistical Computing; R Foundation for Statistical Computing: Vienna, Austria, 2021. [Google Scholar]
  53. Gross, J.; Ligges, U. Tests for Normality. R Package Version 1.0-4. 2015. Available online: https://rdrr.io/cran/nortest/ (accessed on 6 April 2022).
  54. Kassambara, A. Rstatix: Pipe-Friendly Framework for Basic Statistical Tests. R Package Version 0.7.0. 2021. Available online: https://cran.r-project.org/web/packages/rstatix/index.html (accessed on 6 April 2022).
  55. Kassambara, A. Ggpubr: “ggplot2” Based Publication Ready Plots. R Package Version 0.4.0. 2020. Available online: https://cran.r-project.org/web/packages/ggpubr/index.html (accessed on 6 April 2022).
  56. Gobin, A.M.; Campling, P.; Deckers, J.A.; Poesen, J.; Feyen, J. Soil Erosion Assessment at the Udi-Nsukka Cuesta (Southeastern Nigeria). Land Degrad. Dev. 1999, 10, 141–160. [Google Scholar] [CrossRef]
  57. Stoner, E.R.; Baumgardner, M.F. Characteristic Variations in Reflectance of Surface Soils. Soil Sci. Soc. Am. J. 1981, 45, 1161–1165. [Google Scholar] [CrossRef] [Green Version]
  58. Corwin, D.L.; Lesch, S.M. Apparent Soil Electrical Conductivity Measurements in Agriculture. Comput. Electron. Agric. 2005, 46, 11–43. [Google Scholar] [CrossRef]
  59. Visconti, F.; Miguel de Paz, J. Prediction of the Soil Saturated Paste Extract Salinity from Extractable Ions, Cation Exchange Capacity, and Anion Exclusion. Soil Res. 2012, 50, 536. [Google Scholar] [CrossRef] [Green Version]
  60. Mandal, A.K. The Need for the Spectral Characterization of Dominant Salts and Recommended Methods of Soil Sampling and Analysis for the Proper Spectral Evaluation of Salt Affected Soils Using Hyper -Spectral Remote Sensing. Remote Sens. Lett. 2022, 13, 588–598. [Google Scholar] [CrossRef]
  61. Allbed, A.; Kumar, L.; Sinha, P. Mapping and Modelling Spatial Variation in Soil Salinity in the Al Hassa Oasis Based on Remote Sensing Indicators and Regression Techniques. Remote Sens. 2014, 6, 1137–1157. [Google Scholar] [CrossRef] [Green Version]
  62. Alqasemi, A.S.; Ibrahim, M.; Fadhil Al-Quraishi, A.M.; Saibi, H.; Al-Fugara, A.; Kaplan, G. Detection and Modeling of Soil Salinity Variations in Arid Lands Using Remote Sensing Data. Open Geosci. 2021, 13, 443–453. [Google Scholar] [CrossRef]
  63. Shahrayini, E.; Noroozi, A.A. Modeling and Mapping of Soil Salinity and Alkalinity Using Remote Sensing Data and Topographic Factors: A Case Study in Iran. Environ. Model. Assess. 2022. [Google Scholar] [CrossRef]
Figure 1. The study area: Hai Phong-Thai Binh coastal area, Vietnam. (1) Van Uc estuary; (2) Thai Binh estuary; (3) Tra Ly estuary; (4) Red River estuary.
Remotesensing 14 02380 g001
Figure 2. Spectral profile of a field sample of a clay loam topsoil (Fluvisol, TL2) and a sand topsoil (Arenosol, KT2).
Remotesensing 14 02380 g002
Figure 3. Electrical conductivity (EC1:5 in dS/m) measured in a 1:5 (w/v) soil to water extract of two soil samples (TL2, KT2), four salinity levels and seven different salt types, where a: NaCl; b: Na2SO4; c: Na2CO3; d: NaCl:Na2SO4 = 1:1; e: NaCl:Na2SO4 = 1:5; f: NaCl:Na2SO4 = 1:10; g: NaCl:Na2SO4:Na2CO3 = 1:1:1).
Remotesensing 14 02380 g003
Figure 4. Soil moisture changes for seven salt types, four salinity levels, five sampling days and two reference soil groups.
Remotesensing 14 02380 g004
Figure 5. Spectral profile of dry soil samples contaminated with (A): NaCl; (B): Na2CO3; and (C): Na2SO4 at four different salinity levels.
Remotesensing 14 02380 g005aRemotesensing 14 02380 g005b
Figure 6. Spectral profile of a NaCl contaminated Fluvisol (clay loam) at different moisture levels and an increasingly higher salinity level from (AD).
Remotesensing 14 02380 g006aRemotesensing 14 02380 g006b
Figure 7. Spectral profile of a Na2CO3 contaminated Fluvisol (clay loam) at different moisture levels and an increasingly higher salinity level from (AD).
Remotesensing 14 02380 g007aRemotesensing 14 02380 g007b
Figure 8. Spectral profile of a Na2SO4 contaminated Fluvisol (clay loam) at different moisture levels and an increasingly higher salinity level from (AD).
Remotesensing 14 02380 g008
Figure 9. Spectral sample of a Fluvisol (clay loam) contaminated with NaCl: Na2SO4: Na2CO3= 1:1:1 at 18.43% moisture and with NaCl: Na2SO4 = 1:10 at 11.03% moisture.
Remotesensing 14 02380 g009
Figure 10. Absorbance peaks in spectra of soils contaminated with Na2CO3.
Remotesensing 14 02380 g010
Figure 11. Relationship between peak spectral absorbance at 6.99 µm and (A) Na2CO3 (in g added to the soil samples); and (B) soil moisture (%).
Remotesensing 14 02380 g011
Figure 12. Relationship between electrical conductivity (EC1:5 in dS/m) and spectral absorbance at wavenumber 1430 cm−1 (wavelength 6.99 µm). Only Na2CO3 contaminated soils were included.
Remotesensing 14 02380 g012
Figure 13. Relationship between soil moisture and spectral absorbance at wavenumber 1630 cm−1 (wavelength 6.13 µm).
Remotesensing 14 02380 g013
Table 1. Soil texture, USDA soil textural class and electrical conductivity (EC1:5) of topsoil samples at the coast of Hai Phong-Thai Binh. Reference soil groups are classified according to [14]. The locations are shown in Figure 1.
IDLocationClay
(%)
Silt
(%)
Sand
(%)
EC1:5
(dS/m)
Moisture (%)Textural ClassRSG
gt1Giao Thuy10.4010.2679.340.3020.1Sandy LoamFluvisol
gt2Giao Thuy9.521.2489.240.2421.8Loamy SandFluvisol
gt3Giao Thuy8.762.5288.720.2821.9Loamy SandFluvisol
vb1Vinh Bao25.4440.3234.240.5431.4LoamFluvisol
tl1Tien Lang28.8228.1043.080.3233.9Clay LoamArenosol
tl2Tien Lang37.0838.8224.100.5134.5Clay LoamFluvisol
th1Tien Hai8.021.5290.460.6520.4SandArenosol
th2Tien Hai9.382.4688.160.4428.2Loamy SandFluvisol
kt1Kien Thuy19.819.8260.380.6024.2Sandy LoamArenosol
kt2Kien Thuy9.140.2490.620.1221.1SandArenosol
tt1Thai Thuy18.5818.0263.400.2925.1Sandy LoamFluvisol
Table 2. Electrical conductivity (EC1:5) in soils at Tien Lang (TL2) and Kien Thuỵ (KT2).
IDEC1:5 (dS/m)ECe (dS/m)Temperature (°C)Salinity Class
TL20.517.523.6Moderately saline
KT20.122.223.6Slightly saline
Publisher’s Note: MDPI stays neutral with regard to jurisdictional claims in published maps and institutional affiliations.

