Article

Spatial and Temporal Drought Characteristics in the Huanghuaihai Plain and Its Influence on Cropland Water Use Efficiency

1
College of Resources and Environment, Anhui Agricultural University, Hefei 230036, China
2
Key Laboratory of JiangHuai Arable Land Resources Protection and Eco-Restoration, Anhui Agricultural University, Hefei 230036, China
3
School of Resource and Environmental Sciences, Wuhan University, 129 Luoyu Road, Wuhan 430079, China
*
Author to whom correspondence should be addressed.
Remote Sens. 2022, 14(10), 2381; https://doi.org/10.3390/rs14102381
Submission received: 5 April 2022 / Revised: 10 May 2022 / Accepted: 13 May 2022 / Published: 15 May 2022

Abstract

:
Understanding the relationship between drought and the water use efficiency (WUE) in terrestrial ecosystems can help reduce drought risk. It remains unclear what the correlation between the cropland water use efficiency (CWUE) and drought during drought events. We aim to identify the spatiotemporal relationship between drought and the CWUE and to ensure the service capacity of cultivated land ecosystems. In this study, the cubist algorithm was used to establish a monthly integrated surface drought index (mISDI) dataset for the Huang–Huai–Hai Plain (HHHP), and the run theory was used to identify drought events. We assessed the spatio-temporal variations of drought in the HHHP during 2000–2020 and its influence on the CWUE. The research results were as follows: from the overall perspective of the HHHP, the mISDI showed a downward trend. Drought had an enhanced effect on the CWUE of the HHHP, and the enhancement of the CWUE in the eastern hilly area was more significant. The CWUE response to drought had a three-month lag period and a significant positive correlation, and it was shown that the cultivated land ecosystems in this area had strong drought resistance ability. This study provides a new framework for understanding the response of the CWUE to drought and formulating reasonable vegetation management strategies for the HHHP.

1. Introduction

As the global climate warms, the water cycle accelerates, and extreme weather events such as droughts and floods have become more frequent and severe [1]. A drought is a disaster that causes major agricultural losses [2]. Recently, drought frequency has increased, and China’s annual economic losses caused by droughts are as high as billions of dollars, which has a large impact on its national economy [3]. Compared to other forms of natural disasters, droughts always cause huge losses. Drought has become an important factor influencing global terrestrial ecosystems. Drought has a significant impact on global carbon and water cycles, which in turn affects human production and life. With the development of drought research, the relationship between the water use efficiency (WUE) and droughts has gradually become the focus of examination. The WUE is an important indicator of the carbon–water cycle coupling and plays a crucial role in ecosystem management [4,5]. Therefore, the impact of drought on the ecosystem WUE has become a hot research topic, which can improve the current understanding of the relationship between droughts and the ecosystem’s carbon–water cycle.
An increasing number of scholars have explored the WUE. There are many definitions of the WUE [6,7], the more common of which are the net primary productivity (NPP)/evapotranspiration (ET) and gross primary production (GPP)/ET. The time scale of the WUE can also be divided as instantaneous, daily, seasonal, and annual [8]. Spatially, the variation characteristics of the WUE can be studied using multiple spatial scales, such as latitude (LAT), altitude [9], ecosystem type [10], and biome [11]. Several previous studies have successfully demonstrated the obvious spatial heterogeneity of the WUE [7,9,10,11]. Some researchers investigated the WUEs of different ecosystems and found that changes in different species are affected by the structure of plants. Under the same external conditions, the WUE increased in areas with closed shrubs and woody sparse trees but decreased in all other grassland types [12]. Moreover, related research on the WUE in mixed plantations provided a reference for the rational use of water resources in forest ecosystems [13]. However, cultivated land is different from other natural ecosystems, because it is managed by humans and is closely related to human development. Chinese agriculture uses only 7% of the world’s cultivated land to feed approximately 22% of the global population [14]. As the main grain-producing area in China, the Huang–Huai–Hai Plain (HHHP) has contributed to 45% of the total grain production in China over the past 30 years. Studies have shown that droughts in the winter and spring in the HHHP impact the yields of winter wheat and summer maize [15,16]. Climate change and ecosystems are closely related to drought [17]. Therefore, to better predict the response of cropland ecosystems to climate change, it is necessary to explore the relationship between the cropland water use efficiency (CWUE) and drought.
Droughts are a traditional topic of research that has gained increasing attention in recent years [18]. Accurately reflecting drought characteristics and identifying drought events remain difficult tasks. With advances in drought research and improved accuracy in drought-characteristics measurement methods, the use of multi-source data combined with data mining technology to monitor droughts has become a new approach for drought research [19,20,21,22]. The optimized drought index provides a possibility for an in-depth study of droughts and an ecosystem’s carbon–water cycle. Most previous studies indicate variations in the WUE response to drought on an annual scale [23] and have shown a significant discrepancy in different regions and ecosystems. Based on climate divisions, there is a negative correlation between the WUE and drought in arid regions, while in humid regions, WUE has both positive and negative correlations with drought [7]. According to geographic divisions, drought has an enhancement effect on WUE in Southwest China [23]. The WUE is negatively correlated with drought in Northeast China and Central Inner Mongolia, while it is positively correlated with drought in Central China [6]. Based on different ecosystems, droughts have lagged effects on the WUEs of shrubs and sparse vegetation, presenting marked differences compared with forest ecosystems [24]. Current research on the WUE is quite successful at both time and spatial scales. However, to date, few studies in the world have focused on the correlation between CWUE and drought during drought events in the HHHP.
Based on meteorological station data, remote sensing data, and other data, this study used the Cubist algorithm to establish the monthly integrated surface drought index (mISDI) dataset in the HHHP and used the run theory to identify drought events. The correlation analysis between drought events and the CWUE (CWUE = GPP/ET) based on mISDI in the HHHP from 2001 to 2020 will help farmers to establish climate-induced disaster risk awareness, develop advanced vegetation strategies based on empirical knowledge and reduce the damage caused by abrupt environmental changes. The results of this study may assure food production and reduce the impact of drought disasters by analyzing the temporal and spatial trends of droughts and their impact on the CWUE.

2. Materials and Methods
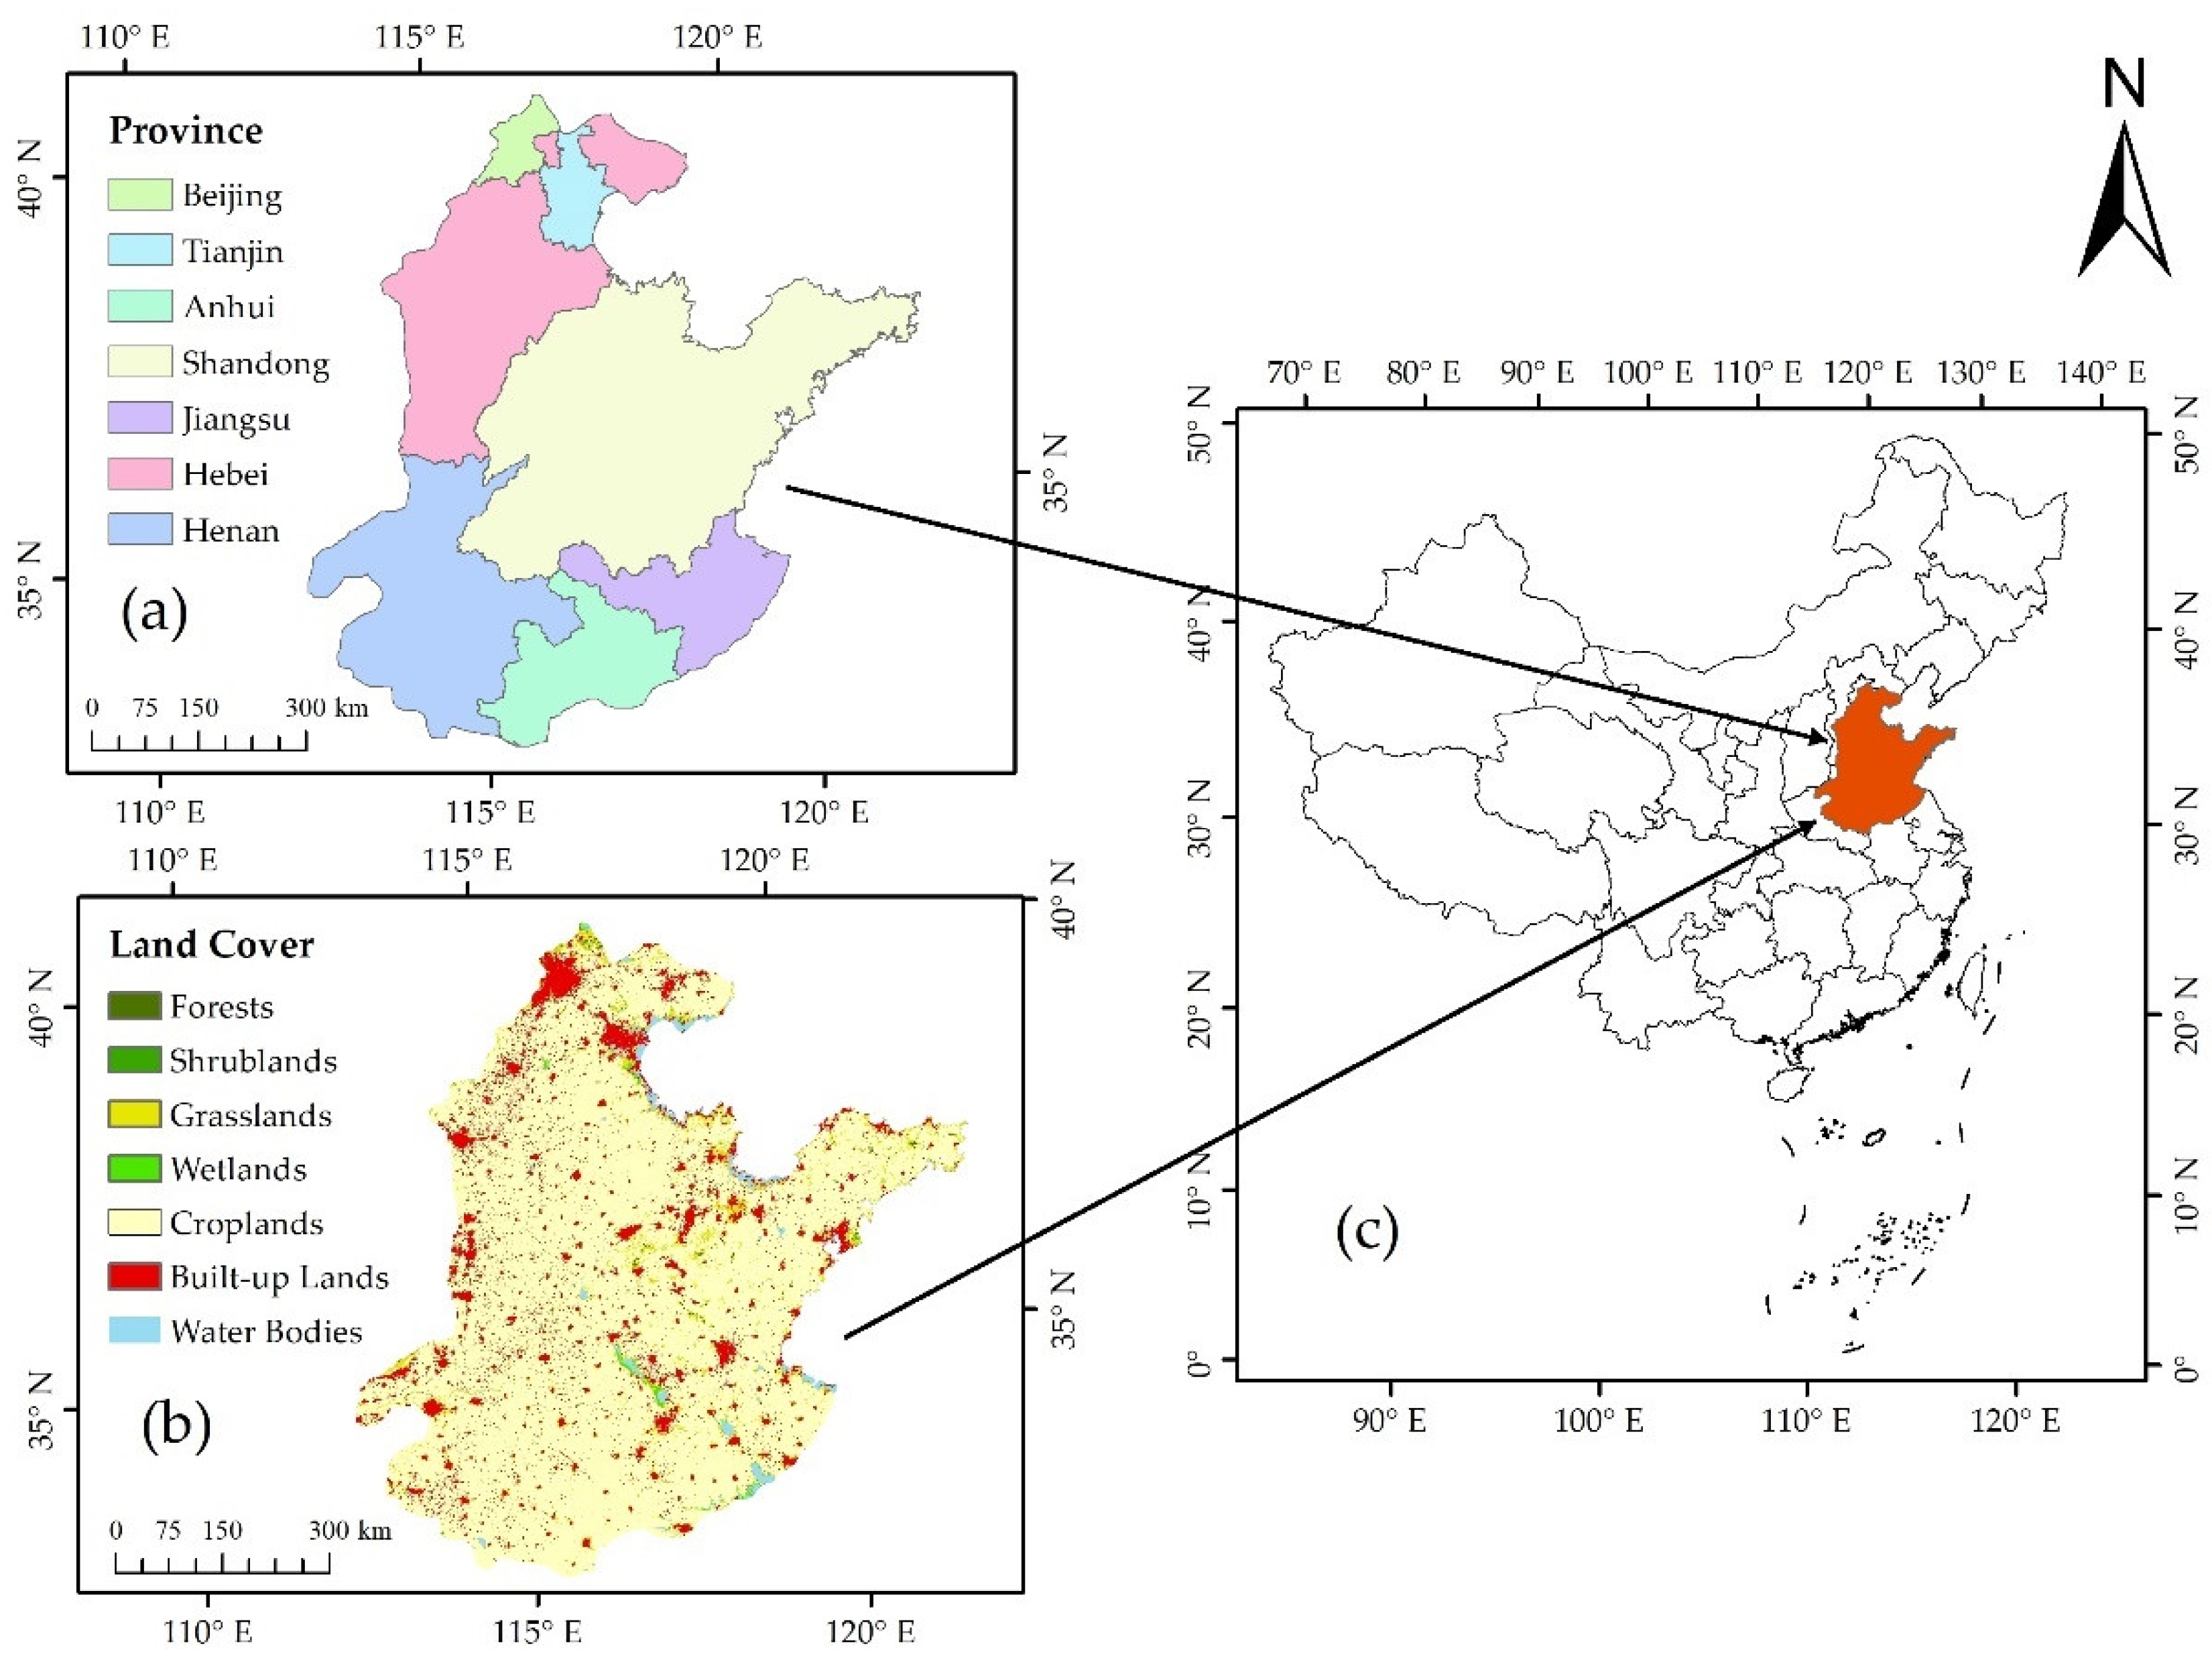
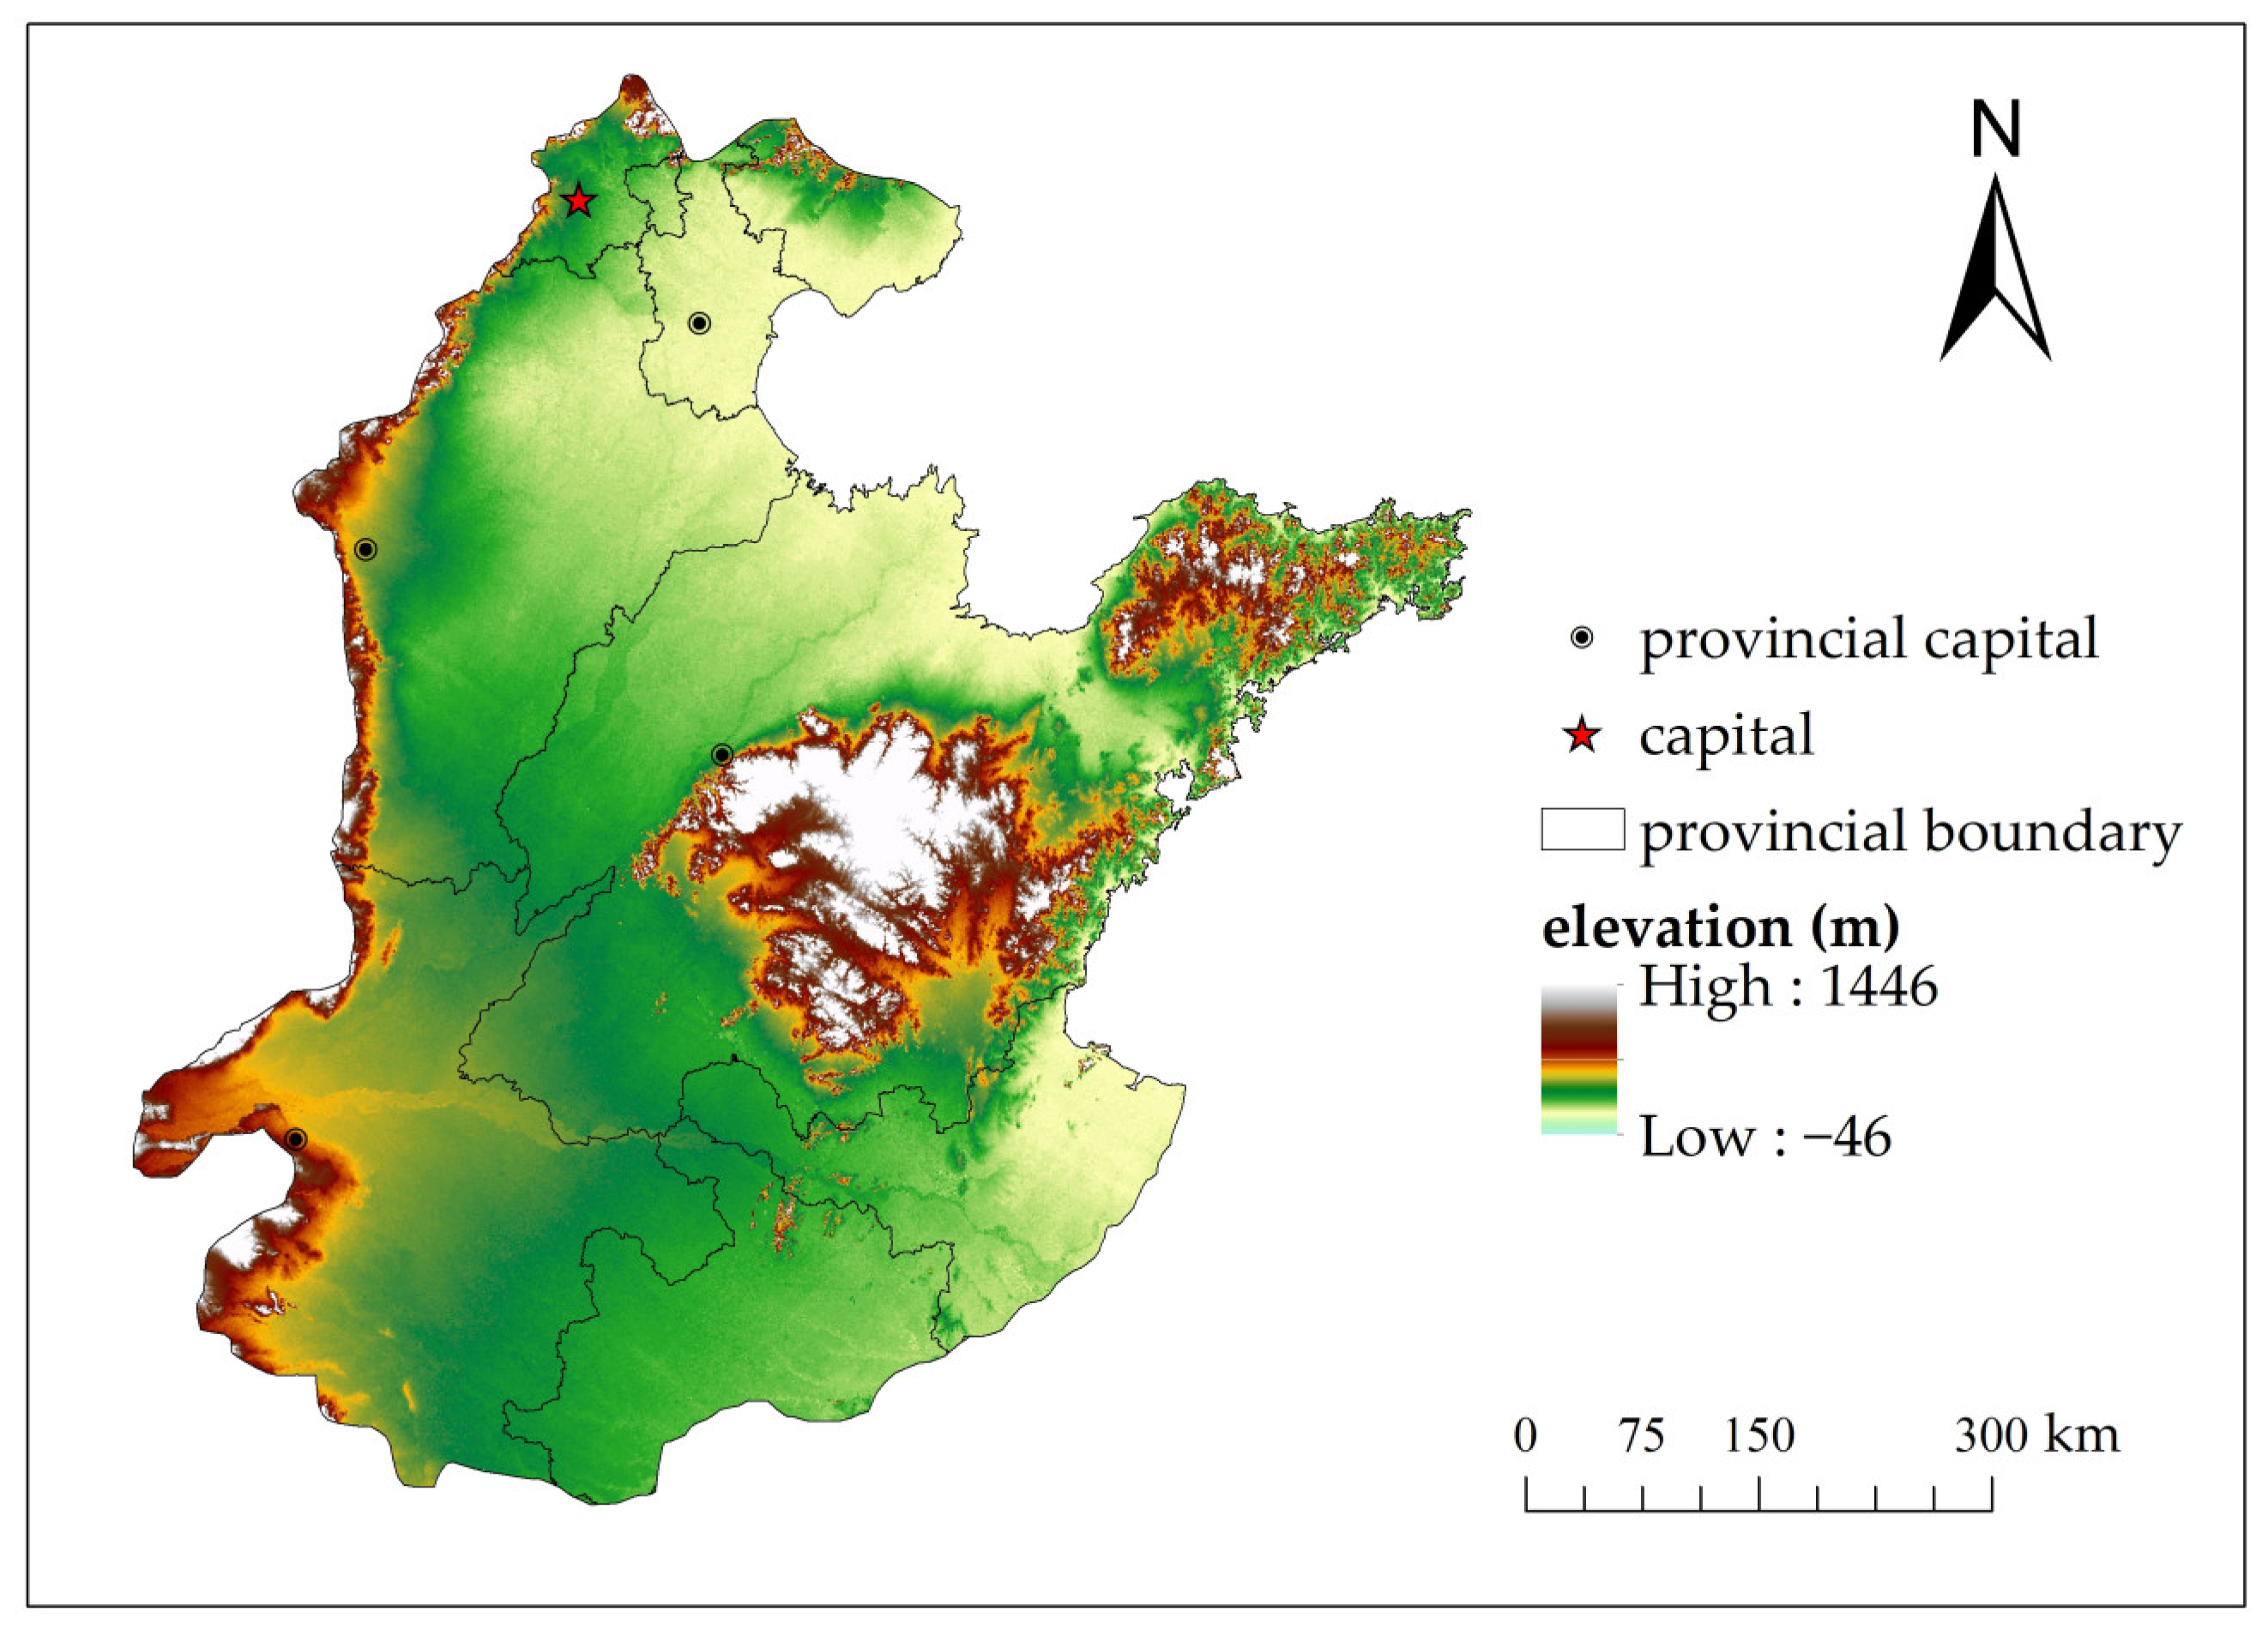
2.1. Study Area

The HHHP spans five provinces and two cities, which include Beijing, Tianjin, and Shandong Provinces, most of Hebei Province, and Henan Province (Figure 1a), as well as the Huaihe River Basin in Jiangsu and Anhui. The HHHP is the largest plain in China formed by the alternate deposition of the lower reaches of the Yellow River, the Huaihe River, and the Haihe River. It belongs to the warm temperate semi-humid monsoon climate zone in terms of climate division. The climatic conditions and natural geographical advantages make it one of the birthplaces of the traditional agriculture and farming civilization in China. The cultivated land in the HHHP accounts for approximately 83% of the total (Figure 1b) [17], and its main cultivation method is winter wheat–summer maize rotation [25,26,27]. The uneven distribution of precipitation due to the monsoon climate increases the frequency of drought in the region.

2.2. Data Source and Processing

2.2.1. Meteorological Data

The meteorological data required for this study were the daily value dataset (V3.0) of China’s surface climate data from the China Meteorological Data Network. The daily temperature and precipitation data from 47 meteorological stations from 2001 to 2020 were downloaded from the China Meteorological Data Sharing Service Center.

2.2.2. Remote Sensing Data

Remote sensing data included eight-day land surface temperature (LST) data (MOD11A2), monthly synthetic normalized difference vegetation index (NDVI) data (MOD13A3), annual synthetic land cover (LC) data (MCD12Q1), eight-day synthetic GPP data (MOD17A2HGF), and eight-day synthetic ET data (MOD16A2GF), which are all derived from the EOS data center of the NASA Land Processes Distributed Active Archive Center (LPDAAC) in the United States. MOD11A2 misses two images in 2001, but it has no effect on synthetic monthly-scale LST data. MCD12Q1 lacks the data of 2020. Owing to the small change in MCD12Q1, the data of 2019 were selected to simulate the data of the 2020 year. All remote sensing data were preprocessed using the MODIS data (Table 1) processing software MRT for image stitching, resampling (uniform spatial resolution of 1000 m), and projection conversion. The time range was from 2001 to 2020, and the spatial range was the HHHP.

2.2.3. Other Data

Digital elevation model (DEM) data: The data on elevation (Figure 2) came from the radar topography mapping the Shuttle Radar Topography Mission (SRTM) data of the US Space Shuttle Endeavor. The dataset was generated by resampling based on the latest SRTM V4.1 data, including one map data of the whole country with three precisions of 1 km, 500 m, and 250 m. The data were projected using a WGS84 ellipsoid. This study selected the 1 km-precision data for unified resolution.
Available water capacity (AWC): The data came from the Harmonized World Soil Database (HWSD) v1.2. AWC data (Table 2) were extracted from the HWSD soil database using ArcGIS 10.2.
Asian irrigated area map (2000–2010): This product updates previous estimates of irrigated areas using MODIS satellite data and uses relatively higher resolution imagery and classification based on the vegetation seasonal profile method, significantly improving the results. In this study, the Asian irrigation area data for 2010 were clipped using ArcGIS 10.2, and the nearest neighbor interpolation method was resampled to 1 km for data processing.

2.3. Research Methods

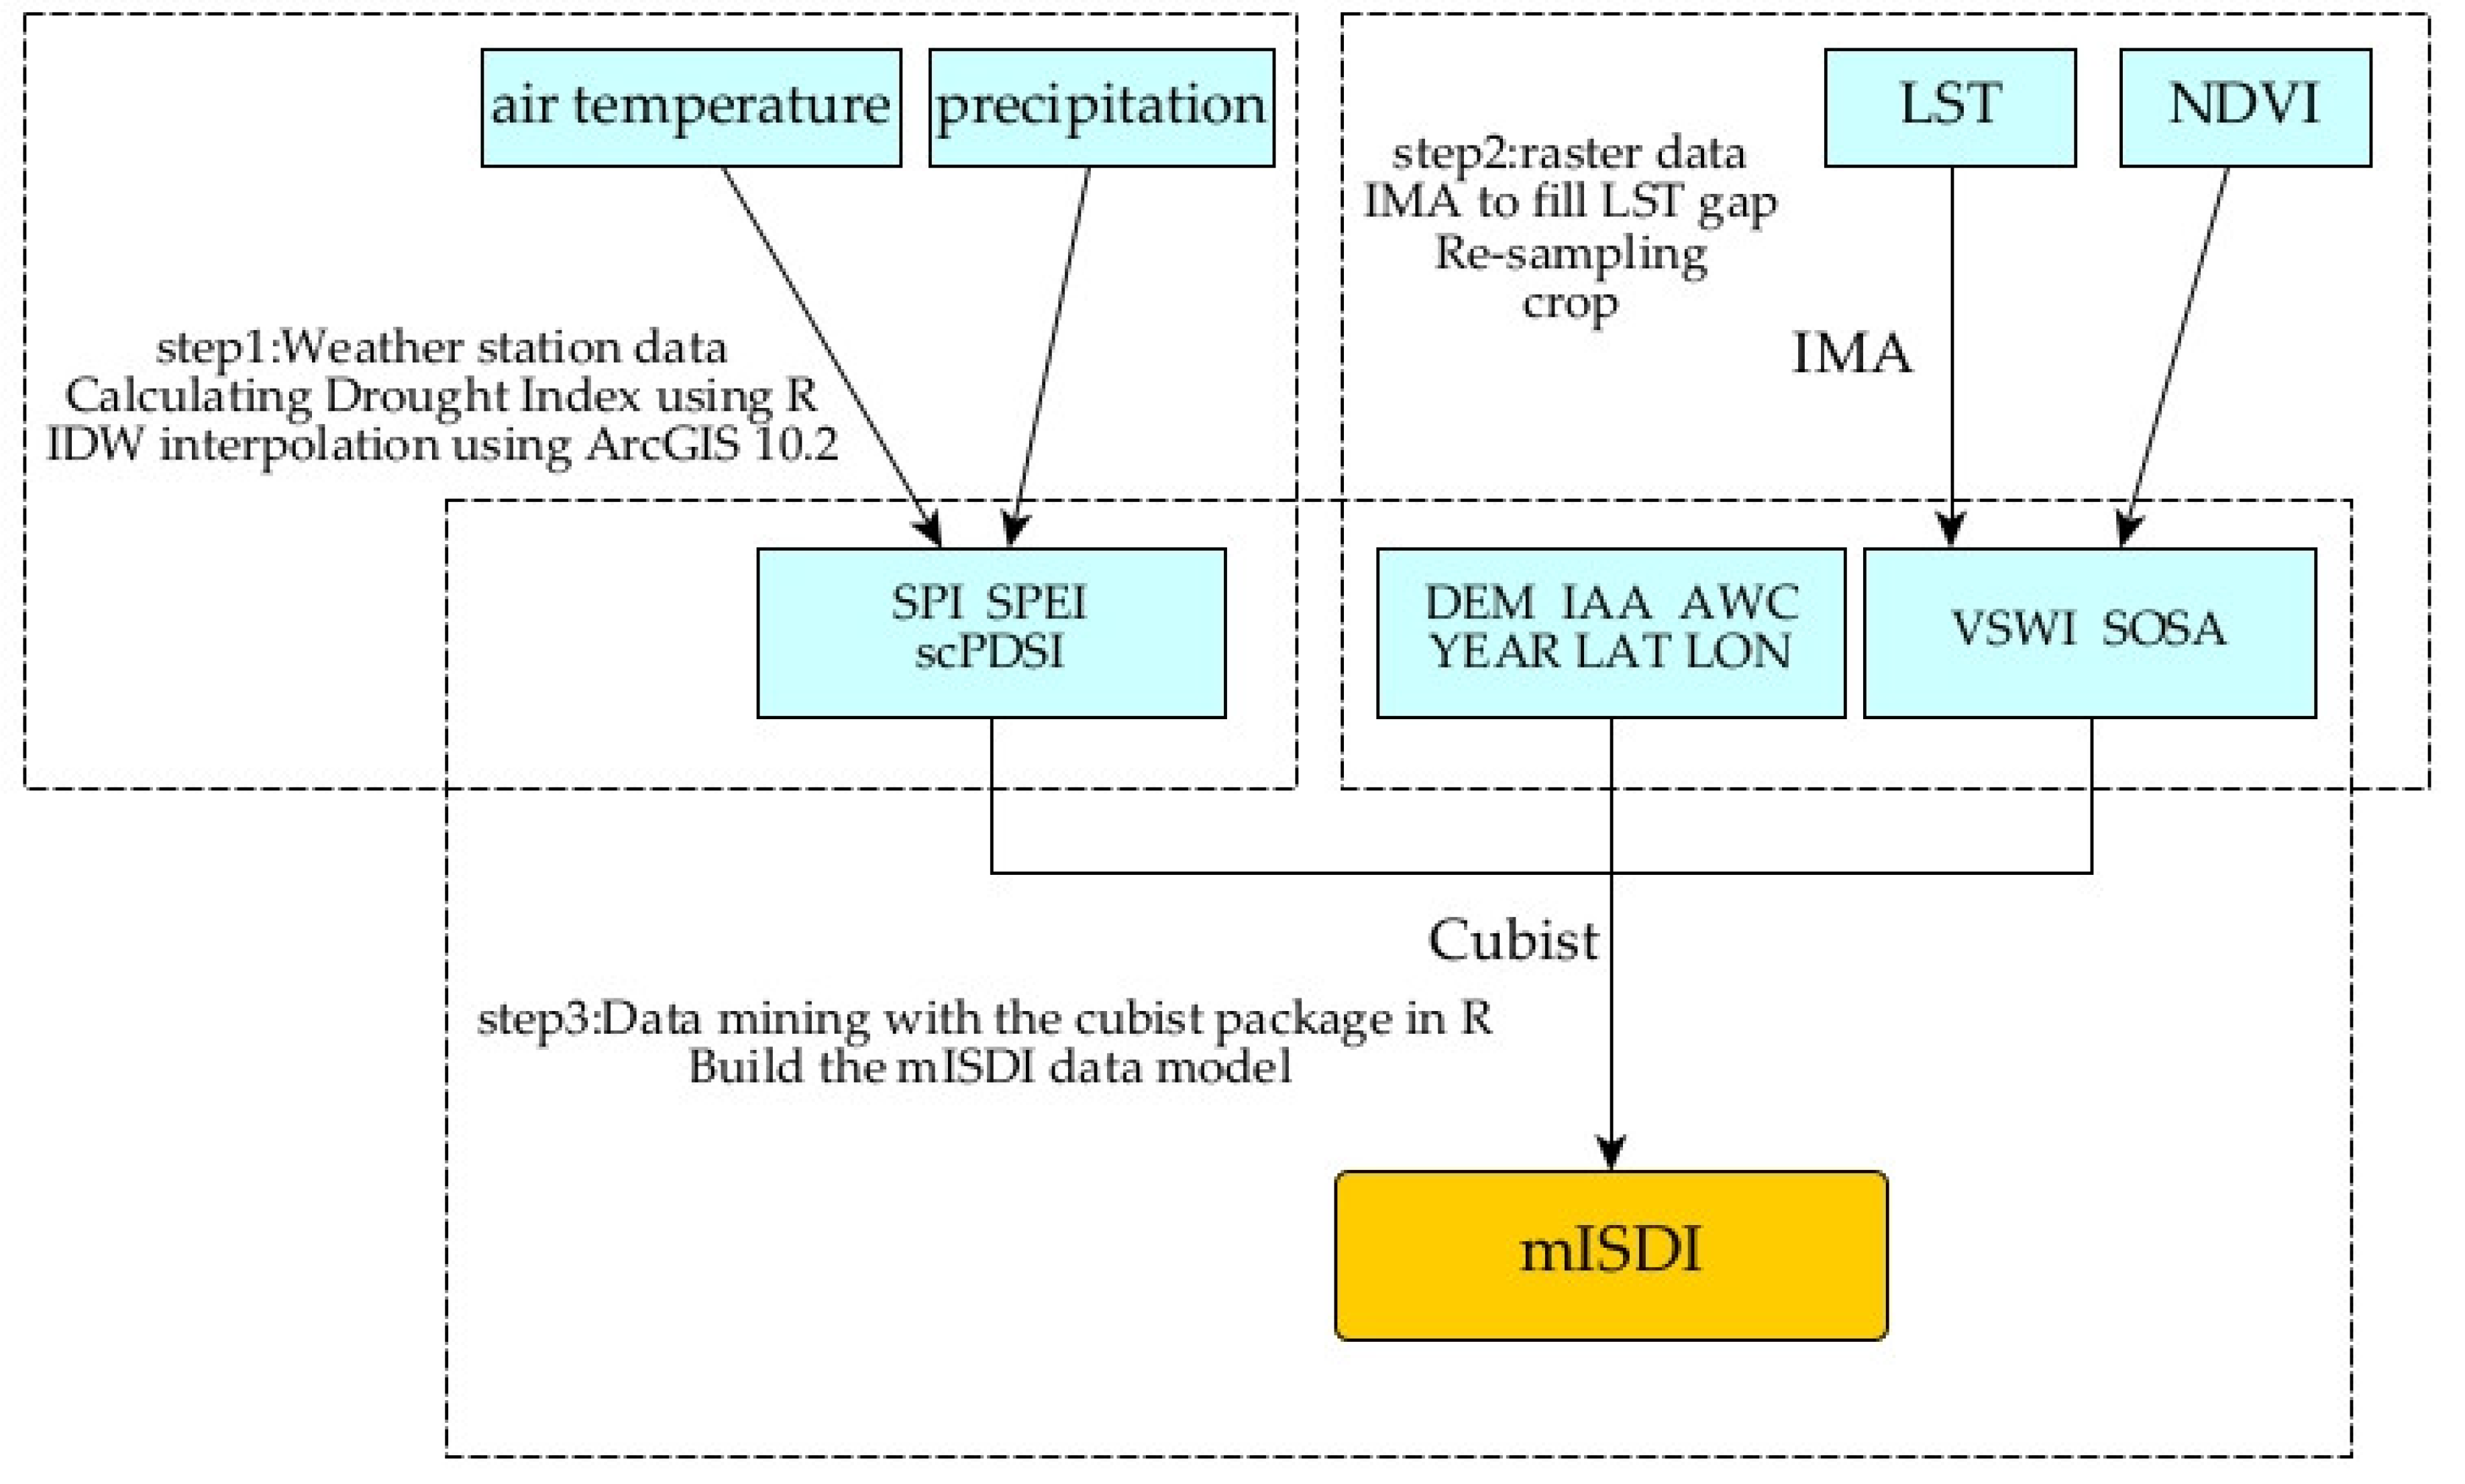
2.3.1. Data Preparation

Because the 8-day synthetic surface temperature product is partially missing owing to the occlusion of the cloud layer, the LST data had to be pre-processed to ensure the integrity of the data and the accuracy of the results. This study used an interpolation of the mean anomalies (IMA) method to fill the missing LST data. In a previous study, Militino et al. [28] proposed a method to fill in missing and abnormal data. By averaging adjacent images, comparing the target image with the anomaly of the mean, extracting the anomaly, interpolating according to the extracted anomaly and finally adding to the mean image to fill in the missing data. Jiang et al. [22] verified the feasibility of the IMA for surface temperature reconstruction in the Han River basin. This study used the rsat smoothing images method in the rsat package of R software to reconstruct the LST of the HHHP. The 8-day reconstructed surface temperature was synthesized using the monthly surface temperature data. The start of season anomaly (SOSA) and the vegetation supply water index (VSWI) were calculated from the LST and the NDVI [29]. The calculation steps are listed in Table 3.

2.3.2. Integrated Drought Index Model

Drought can be of several different types, depending on whether they are mainly caused by meteorology, hydrology, landforms, human activities or other factors which can all impact the ecosystem. Currently, many types of drought indices are used to assess different types of drought, such as single, multidimensional, and composite drought indices. A single drought index considers only one variable such as precipitation, temperature, river flow, or soil moisture. The multidimensional drought index can contain the effects of more variables on drought, and in this study, drought research in the HHHP was carried out based on the mISDI. In this study, the mISDI model selected the self-calibration palmer drought severity index (scPDSI) as a dependent variable, and the independent variable input combinations were divided into six different combinations (Table 4). The resulting mISDI values were classified into one of 8 levels of drought severity (Table 5). The drought grades intervals of the mISDI were set according to [30].
The calculation flow of the mISDI is divided into the following three steps (Figure 3). First, the standardized precipitation index (SPI), the standardized precipitation evapotranspiration index (SPEI), and the scPDSI [31,32,33,34] of each station according to the meteorological station data were calculated using the R software. Then, the point data were converted to raster data by using the inverse distance weight (IDW) of ArcGIS 10.2, with a 1 km spatial resolution. Next, for the preprocessed raster data, the cubist algorithm was used to establish the mISDI model according to the combinations of Table 4.

2.4. Run Theory and Drought Characteristics

The run theory is a time-series analysis method commonly used in the field of meteorology [35]. Drought duration (DD), drought severity (DS), and drought intensity (DI) can be calculated by the run theory, and the severity of drought events can be determined according to their values [36]. For the run theory, the mISDI is less than −1 as a truncation level. When the mISDI is less than −1, it is preliminarily considered that a drought occurs in this month. When a drought event lasts only one month, it is considered that there is no drought in that month [37]. In a time series, the run theory can accurately identify drought events, but there are some disadvantages. For example, spatially, the drought events are identified by the run theory in the entire region, and it is not easy to identify small-scale drought events that occur in this region. In previous studies, the run theory has shown a better event detection ability. Herbst was the first to use the run theory to identify drought events based on monthly precipitation [38]. Zhang et al. [3] used the run theory to detect drought events in Henan Province and extracted characteristic variables such as drought frequency, duration, and intensity to study the temporal and spatial changes of drought in Henan Province. Wang et al. [38] used the copula function and the run theory to analyze the intensity and duration of drought events in the Loess Plateau of Northern Shaanxi.

2.5. Time-Lag Effects of Drought on the CWUE

In this study, Spearman’s and Pearson’s correlation analyses were used analysis methods in statistics. The Pearson method is widely used in previous studies and provided a reference for this study [39,40,41]. It is unclear whether there is a linear relationship between drought and the CWUE. To obtain the explanation of the time-lag effects of drought on the CWUE, Spearman correlation analysis was used to calculate the correlation coefficient in this study [42]. This detailed steps are shown in [24]. The process is completed by the “raster” package and the “rgdal” package in the R software to realize the pixel-by-pixel correlation analysis of the mISDI and the CWUE on a monthly scale. The lag time was determined based on the number of pixels with |R| ≥ 0.5 in the result:
R i = corr ( mISDI , CWUE i ) , 0 i     6
where CWUEi is i lagged months of the CWUE, Ri is the Spearman’s correlation coefficient between the mISDI and the CWUE monthly series. Refer to [7] for R truncation level.

2.6. Theil–Sen Median and Mann-Kendall Trend Test

The Theil–Sen Median method, also known as Sen’s slope estimation, is a robust nonparametric statistical trend calculation method. This method has high computational efficiency and is insensitive to measurement errors [43,44]. The Mann-Kendall trend test is a non-parametric test method. Compared with other parametric test methods, it does not require samples to follow a certain distribution and is less disturbed by outliers [45]. This method has been successfully applied in a large number of studies [24,39,46] related to hydrological and meteorological trends.
In this study, the “raster” package in the R software was used for raster calculation, and the “sen.slope” function of the “trend” package was used for the calculation of “sen+mk”.

3. Results

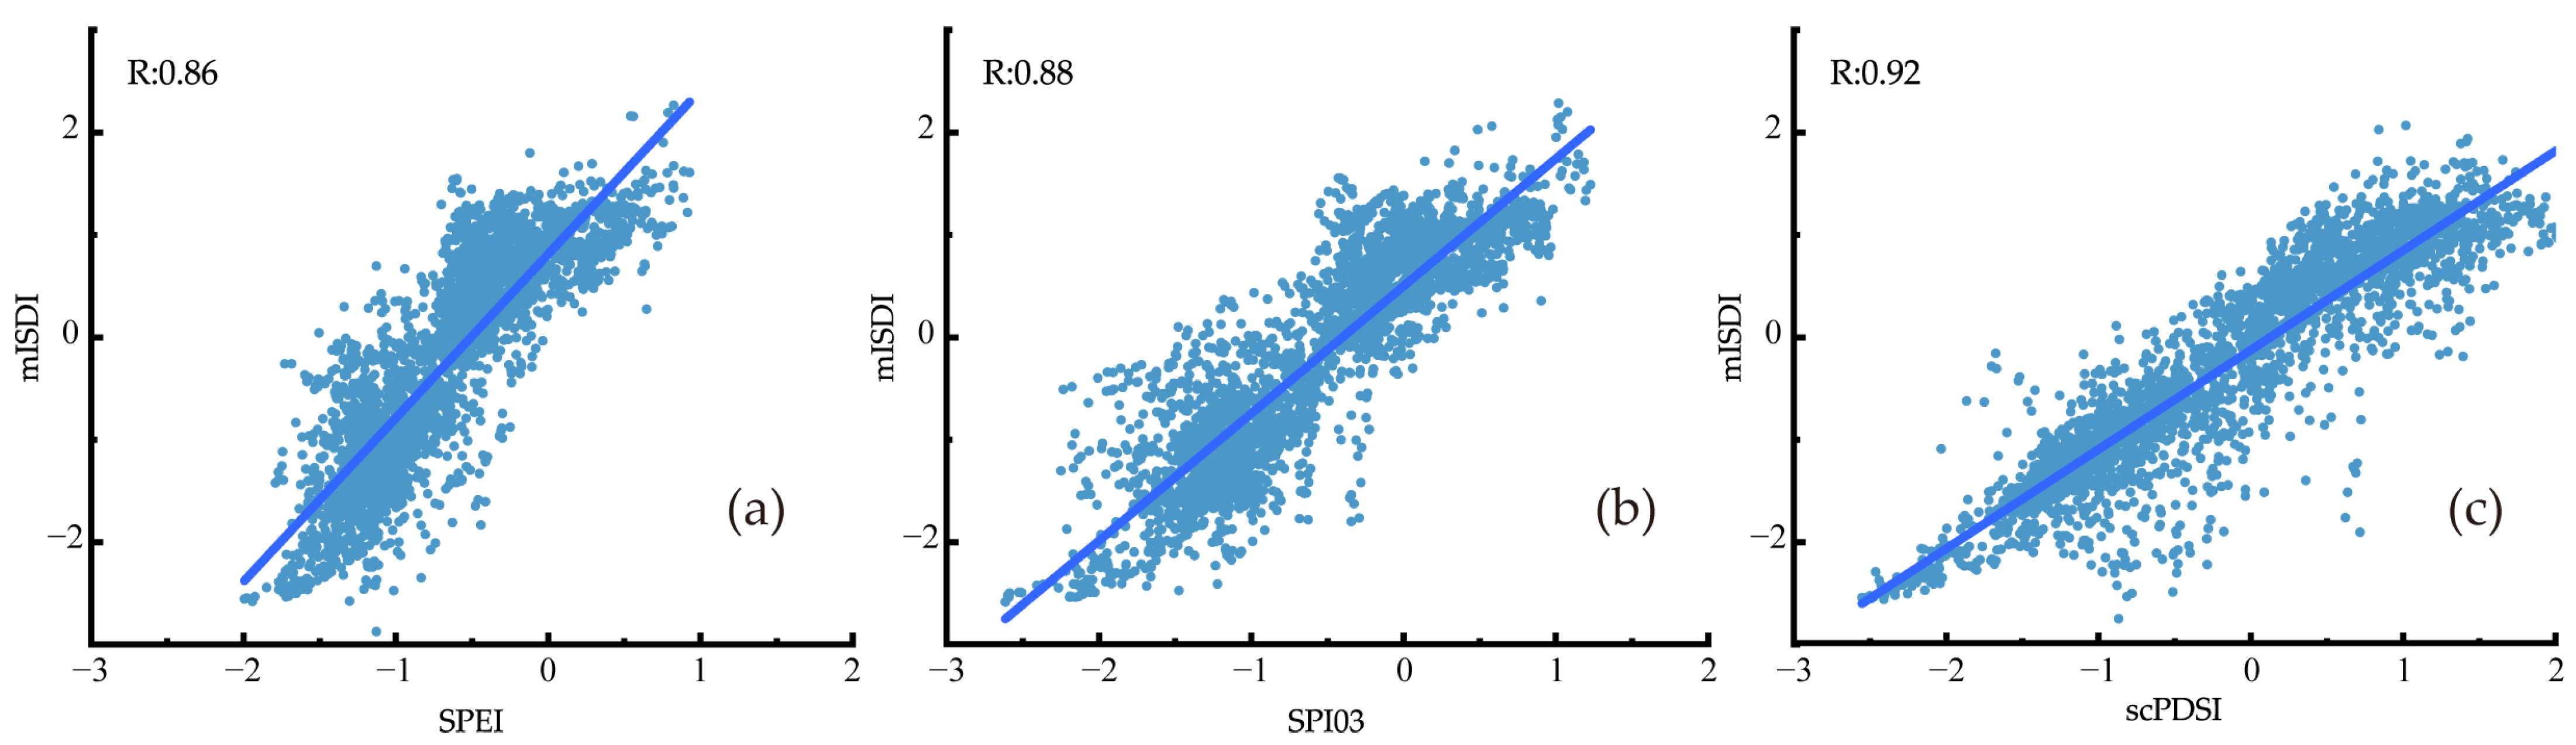
3.1. Drought Index Model Accuracy and Validation

Based on the mISDI model constructed in Section 2.3.2, the cubist package of R software was used to test the six combinations in the Table 4, and the June data from 2001 to 2020 were chosen as an example. As June is summer, the ISDI in summer has a better model accuracy in Zhou’s study [21], and the results are shown in Table 6.
The results showed that combination 3 of the mISDI model had the highest accuracy, as the MAE and the RMSE were the lowest and the R2 was the highest (Table 6). Comparing the results of combinations 1, 2, 4, and 5, the addition of spatial variables (longitude (LON) and LAT) greatly improved the accuracy of the model, which was better than that reported by Jiang et al. [22]. When LAT, LON, and time variables were not included (combinations 1), the errors were higher and the R2 was lower. Adding LAT and LON to combinations 2 increased the R2 by 0.20 and the further addition of the year increased R2 by another 0.17 to reach the very high value of 0.987 (Table 6), and the model accuracy greatly improved [21,30]. The comparison of combinations 1, 3, 4, and 6 revealed that the performance of the three-month scales of the SPI (SPI03) as an independent variable was better than that of the SPEI. Finally, comparing the different combinations, this study chose combination 3 as the input variable combinations for the mISDI model.
By further analyzing the importance of the independent variables in the model, it was found that LC and IAA barely contributed to the model, as shown in Figure 4. Within the study area, the proportion of land surface types varied greatly, the distribution of various surface types was uneven, and the cultivated land accounted for approximately 83% of the total study area. Similarly, according to the Asian irrigation area map, the type of irrigation in the HHHP was extracted, and it was found that the irrigated area accounted for 62.45% of the total area, the rainfed area accounted for 20.33% of the total area, and the non-agricultural area and the water body accounted for 14.98% and 2.24% of the total area, respectively. The data were sufficient to show that the data distributions of LC type and irrigation type in the HHHP were uneven, so we chose to delete the two variables of LC and IAA on the basis of the first group of models and obtained mISDI data in other months according to the modified model.

3.2. Drought Events and Characteristics Analysis in the HHHP

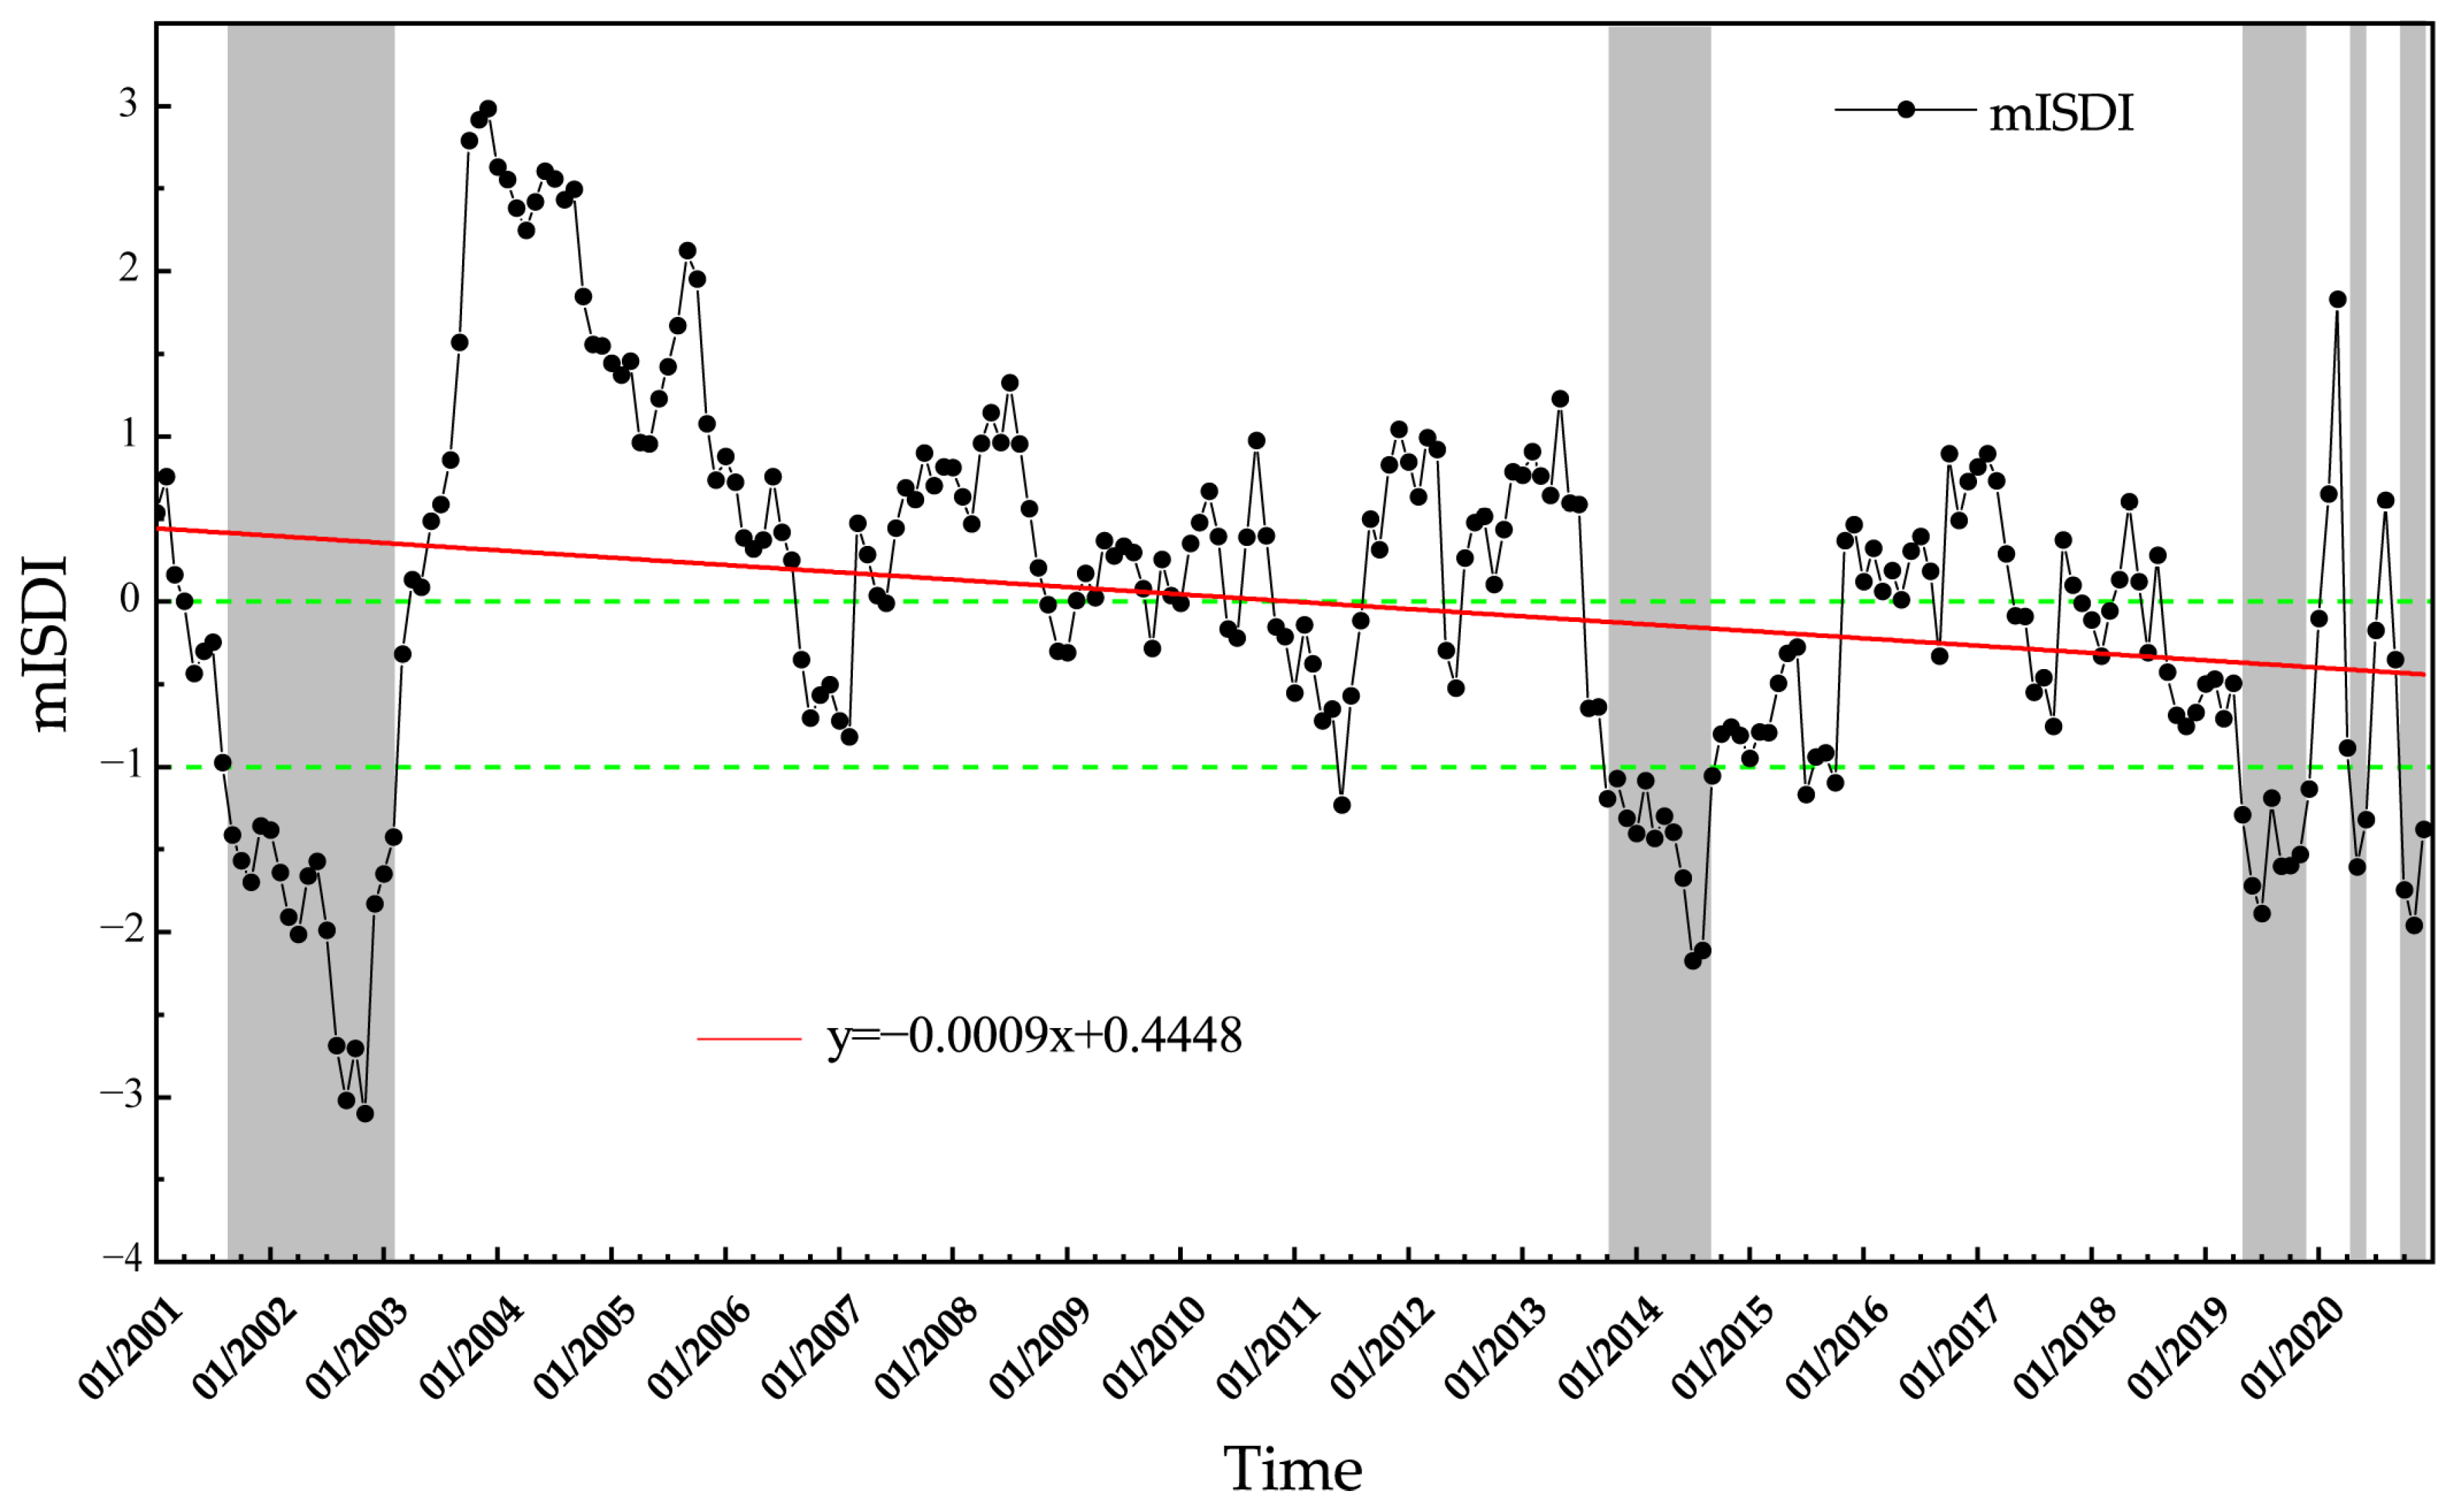
3.2.1. Run Theory Identifies Drought Events

From 2001 to 2020, the average mISDI in the HHHP showed a significant downward trend (slope = −0.0009/month, p < 0.01), indicating that the drought in the HHHP worsened. In the five drought events (E1–E5) from 2001 to 2020, the corresponding drought characteristics (DD, DI, and DS) were calculated using the run theory based on the regional mean mISDI. The identification results of the run theory are shown in Table 7.
As shown in Table 7, the duration of recent droughts was shorter, while the number of drought periods increased (Figure 5). There was a gradual decline in the average mISDI over the same period from being slightly positive (~0.4) to being slightly negative (~−0.4), indicating that drought conditions in the HHHP gradually deteriorated. E1 had the longest DD and the strongest DI among the five drought events. From 2001 to 2020, the DD gradually became shorter, but the HHHP showed a significant downward trend. The reason for this may be that the run theory identified drought events in the HHHP as a whole, but usually, droughts only occur in local areas. With climate change, there was an increased variability with swings from parched to soaked (Figure 4). Flash drought events should be the focus of attention, and short-term drought events that occur during critical periods of crop growth can also have a significant impact on grain yields.

3.2.2. Accuracy of Drought Event

This study analyzed the reliability of drought events from two aspects. On the one hand, the correlations between the mISDI and the SPI03, the SPEI, and the scPDSI were compared to prove the reliability of the mISDI. Although the correlations between the mISDI and the three drought indices were different (Figure 6), they all reached values greater than 0.85, showing a strong correlation, which was enough to prove the reliability of the mISDI. On the other hand, owing to the limited time range of the meteorological disaster data records available in this region, by analyzing the existing data, the drought events identified by the run theory were compared with the time range of the drought events recorded by the actual data. For example, according to the records of the 2015 Yearbook of Meteorological Disaster in China, the HHHP experienced a winter drought in 2013, and from June 1 to August 22, the precipitation was 50% lower than normal, resulting in severe drought. This was basically in line with the duration of E2 from October 2013 to September 2014. According to the 2019 National Water Information Annual Report in China, from May to August, the HHHP experienced high temperatures and little rainfall, and periodic summer droughts occurred. This is a good validation of the 2019 drought event. Furthermore, according to the 2020 National Water Information Annual Report in China, the summer drought occurrence in the HHHP from early May to mid-June was highly consistent with the time of the fourth drought event. According to the above verification, it can be proved that the results of drought events had high confidence.

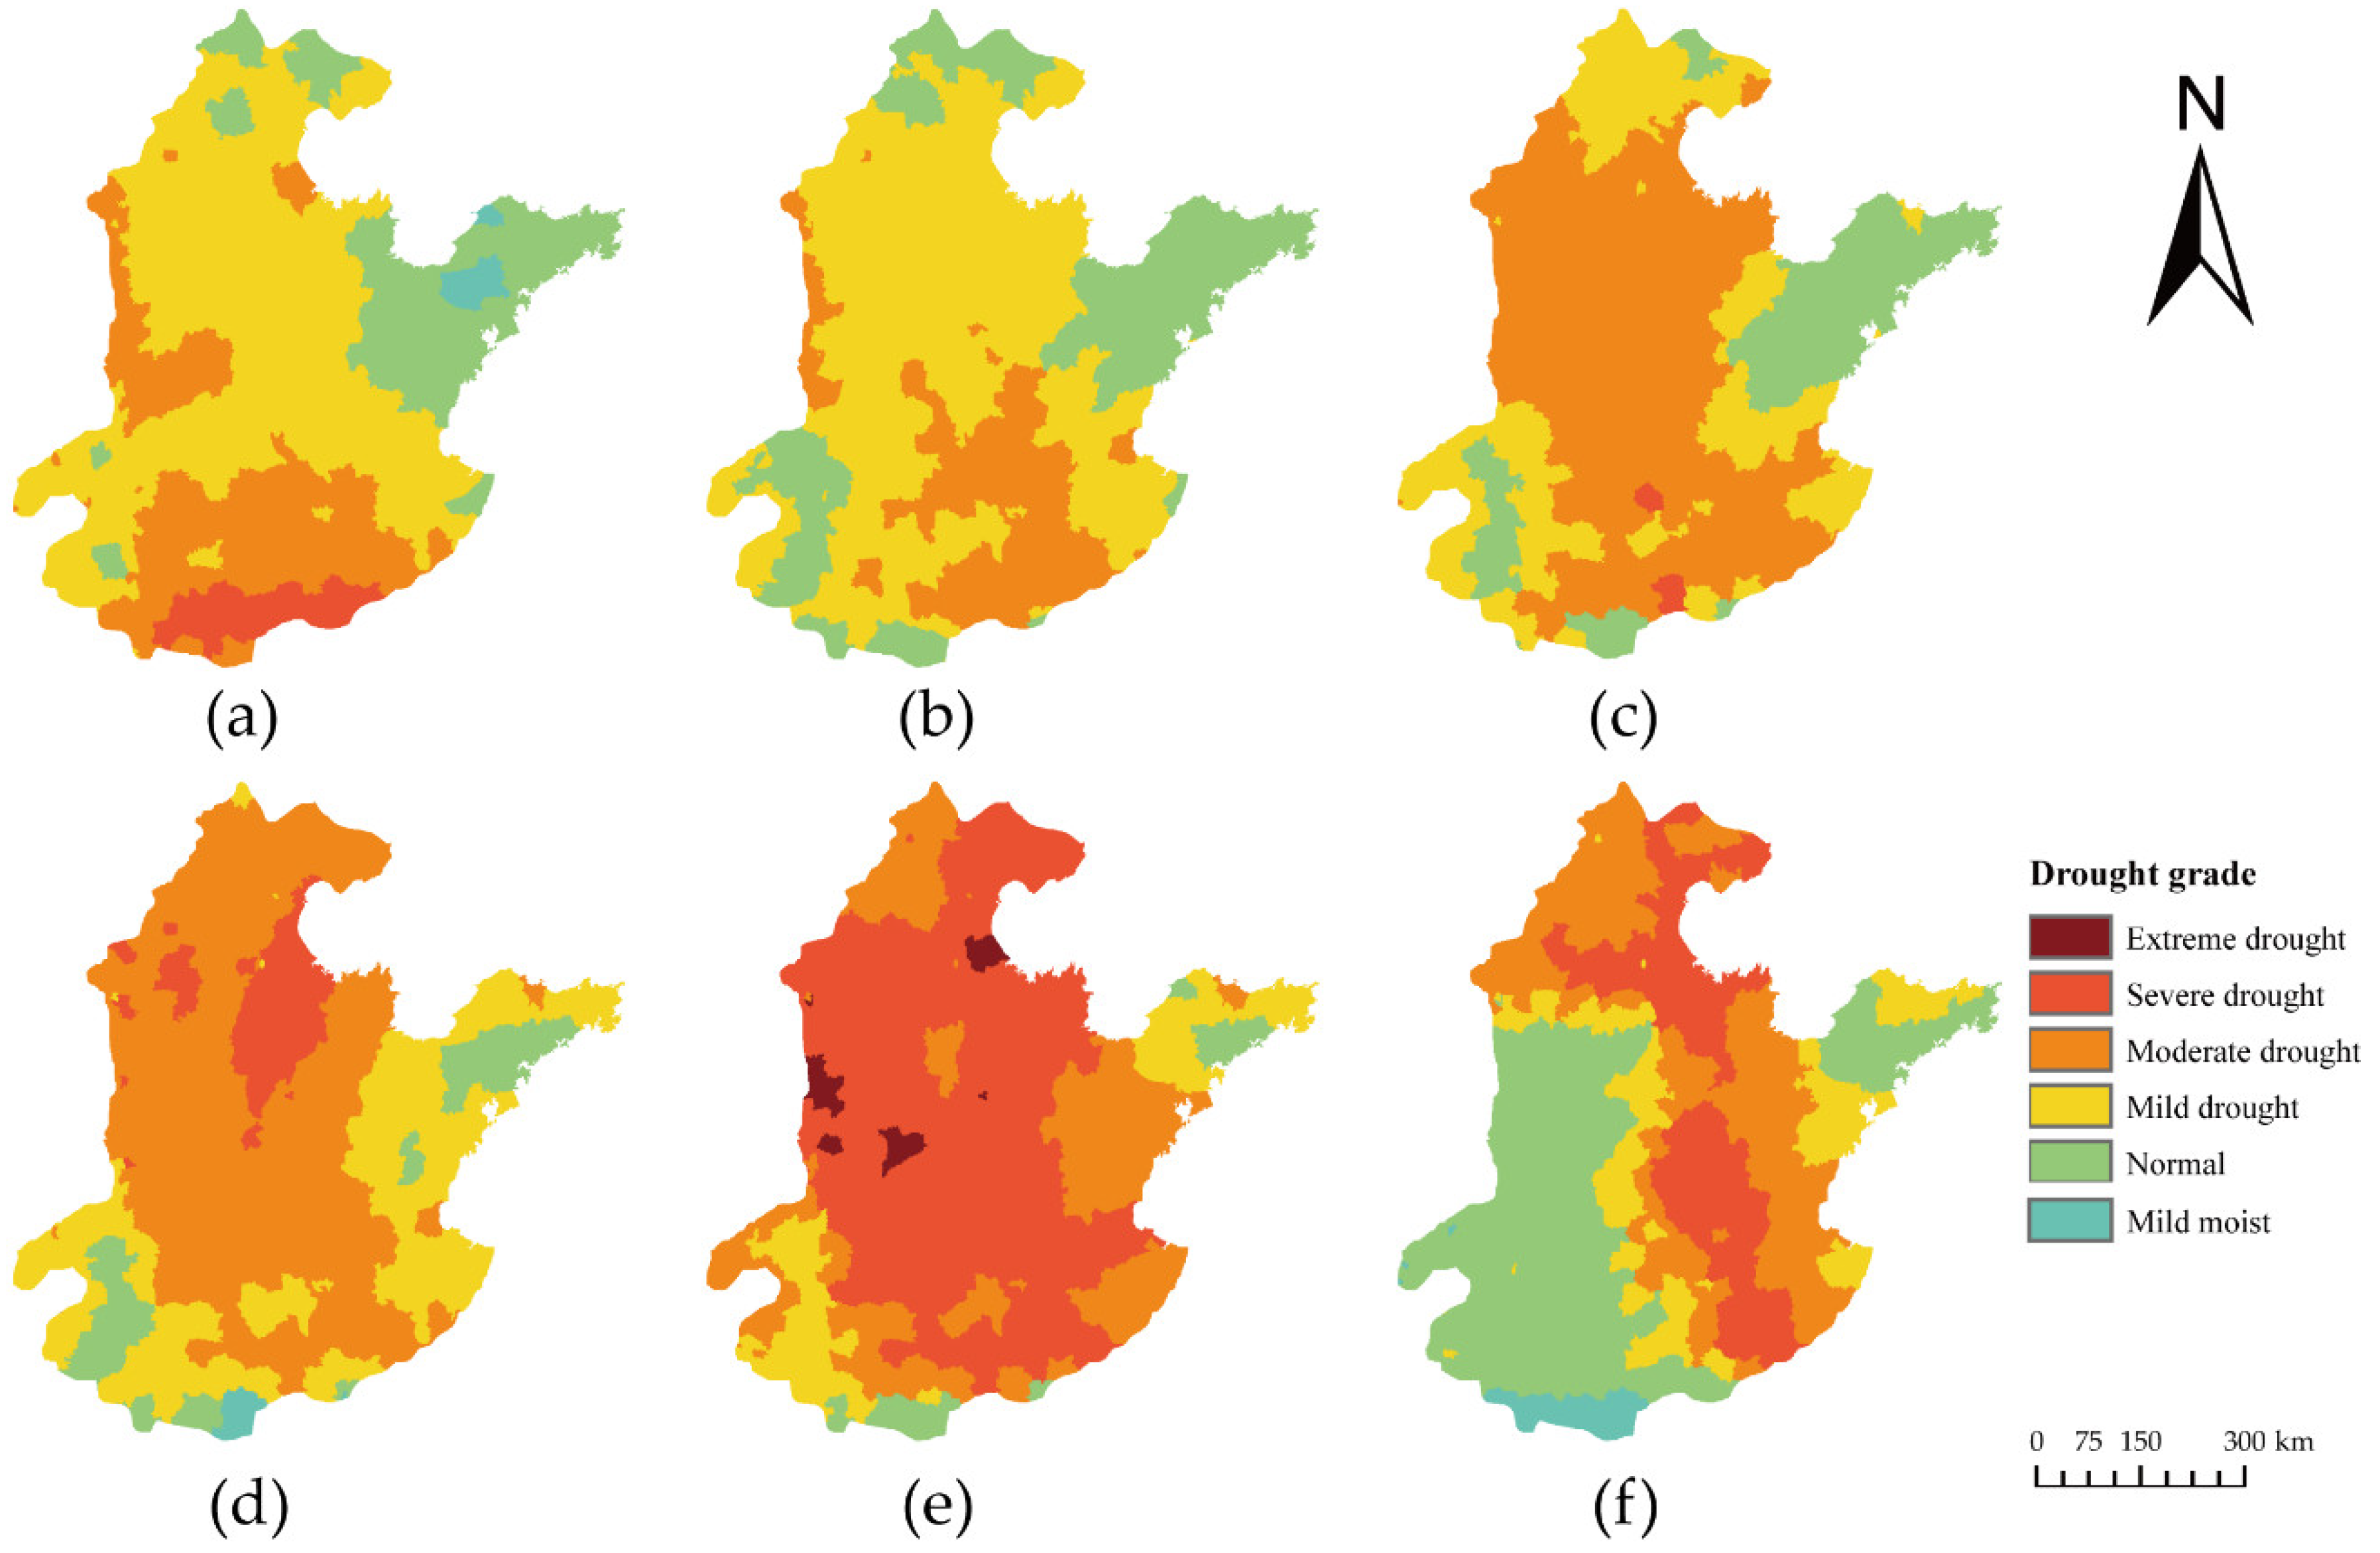
3.2.3. Spatial Analysis of Drought Disaster in the HHHP

Spatially, the change trend of the mISDI in the HHHP from 2001 to 2020 was analyzed using the Theil–Sen Median and the Mann-Kendall trend test. At a confidence level of 0.05, the Mann-Kendall test results were classified as significantly different (Z > 1.96 or Z < 1.96) or not significantly different (1.96 ≤ Z ≤ 1.96). As shown in Figure 7, during 2001–2020, the mISDI in most of Shandong Province and Northeastern Henan Province showed a significant downward trend, implying that the drought in these regions worsened. The areas with a worsening trend of drought were mainly in Shandong Province. Except for Northern Shandong, Northern Shandong Peninsula, and Mount Tai, other areas in Shandong Province should focus on preventing the occurrence of drought disasters. According to the development trend, the frequency of drought disasters will be higher than those in other regions in the next few years. However, in the southern and northern parts of the HHHP, the mISDI showed a significant upward trend in most areas, indicating that the drought conditions in these areas were alleviated. From the perspective of watersheds, the areas where the drought eased were mainly distributed near the middle and lower reaches of the Huaihe and Haihe Rivers. As shown in Figure 7, by comparing with others, the distribution of regions with significantly reduced mISDI indices were concentrated and wide. The mISDI of capital increased significantly, indicating a lower risk of drought here. Jinan as the provincial capital of Shandong and Zhengzhou as the provincial capital of Henan are located in regions where the mISDI index decreased significantly. Therefore, local government departments should take drought control as the focus of their work.
Since the first drought event was the most severe and lasted for a long time, it was selected for the study. The spatial distribution of the mISDI in the HHHP was studied using a county-level administrative region as the basic unit of space and the season as the basic unit of time. As shown in Figure 8a–f, the more severe stage during the first drought event occurred in the summer and autumn of 2002, resulting in a severe autumn drought. The drought development trend in the entire region was from south to north. It can be seen from Figure 8 that the probability of drought in the Shandong Peninsula was relatively low, and the drought was mainly concentrated in the central plain area of the HHHP.

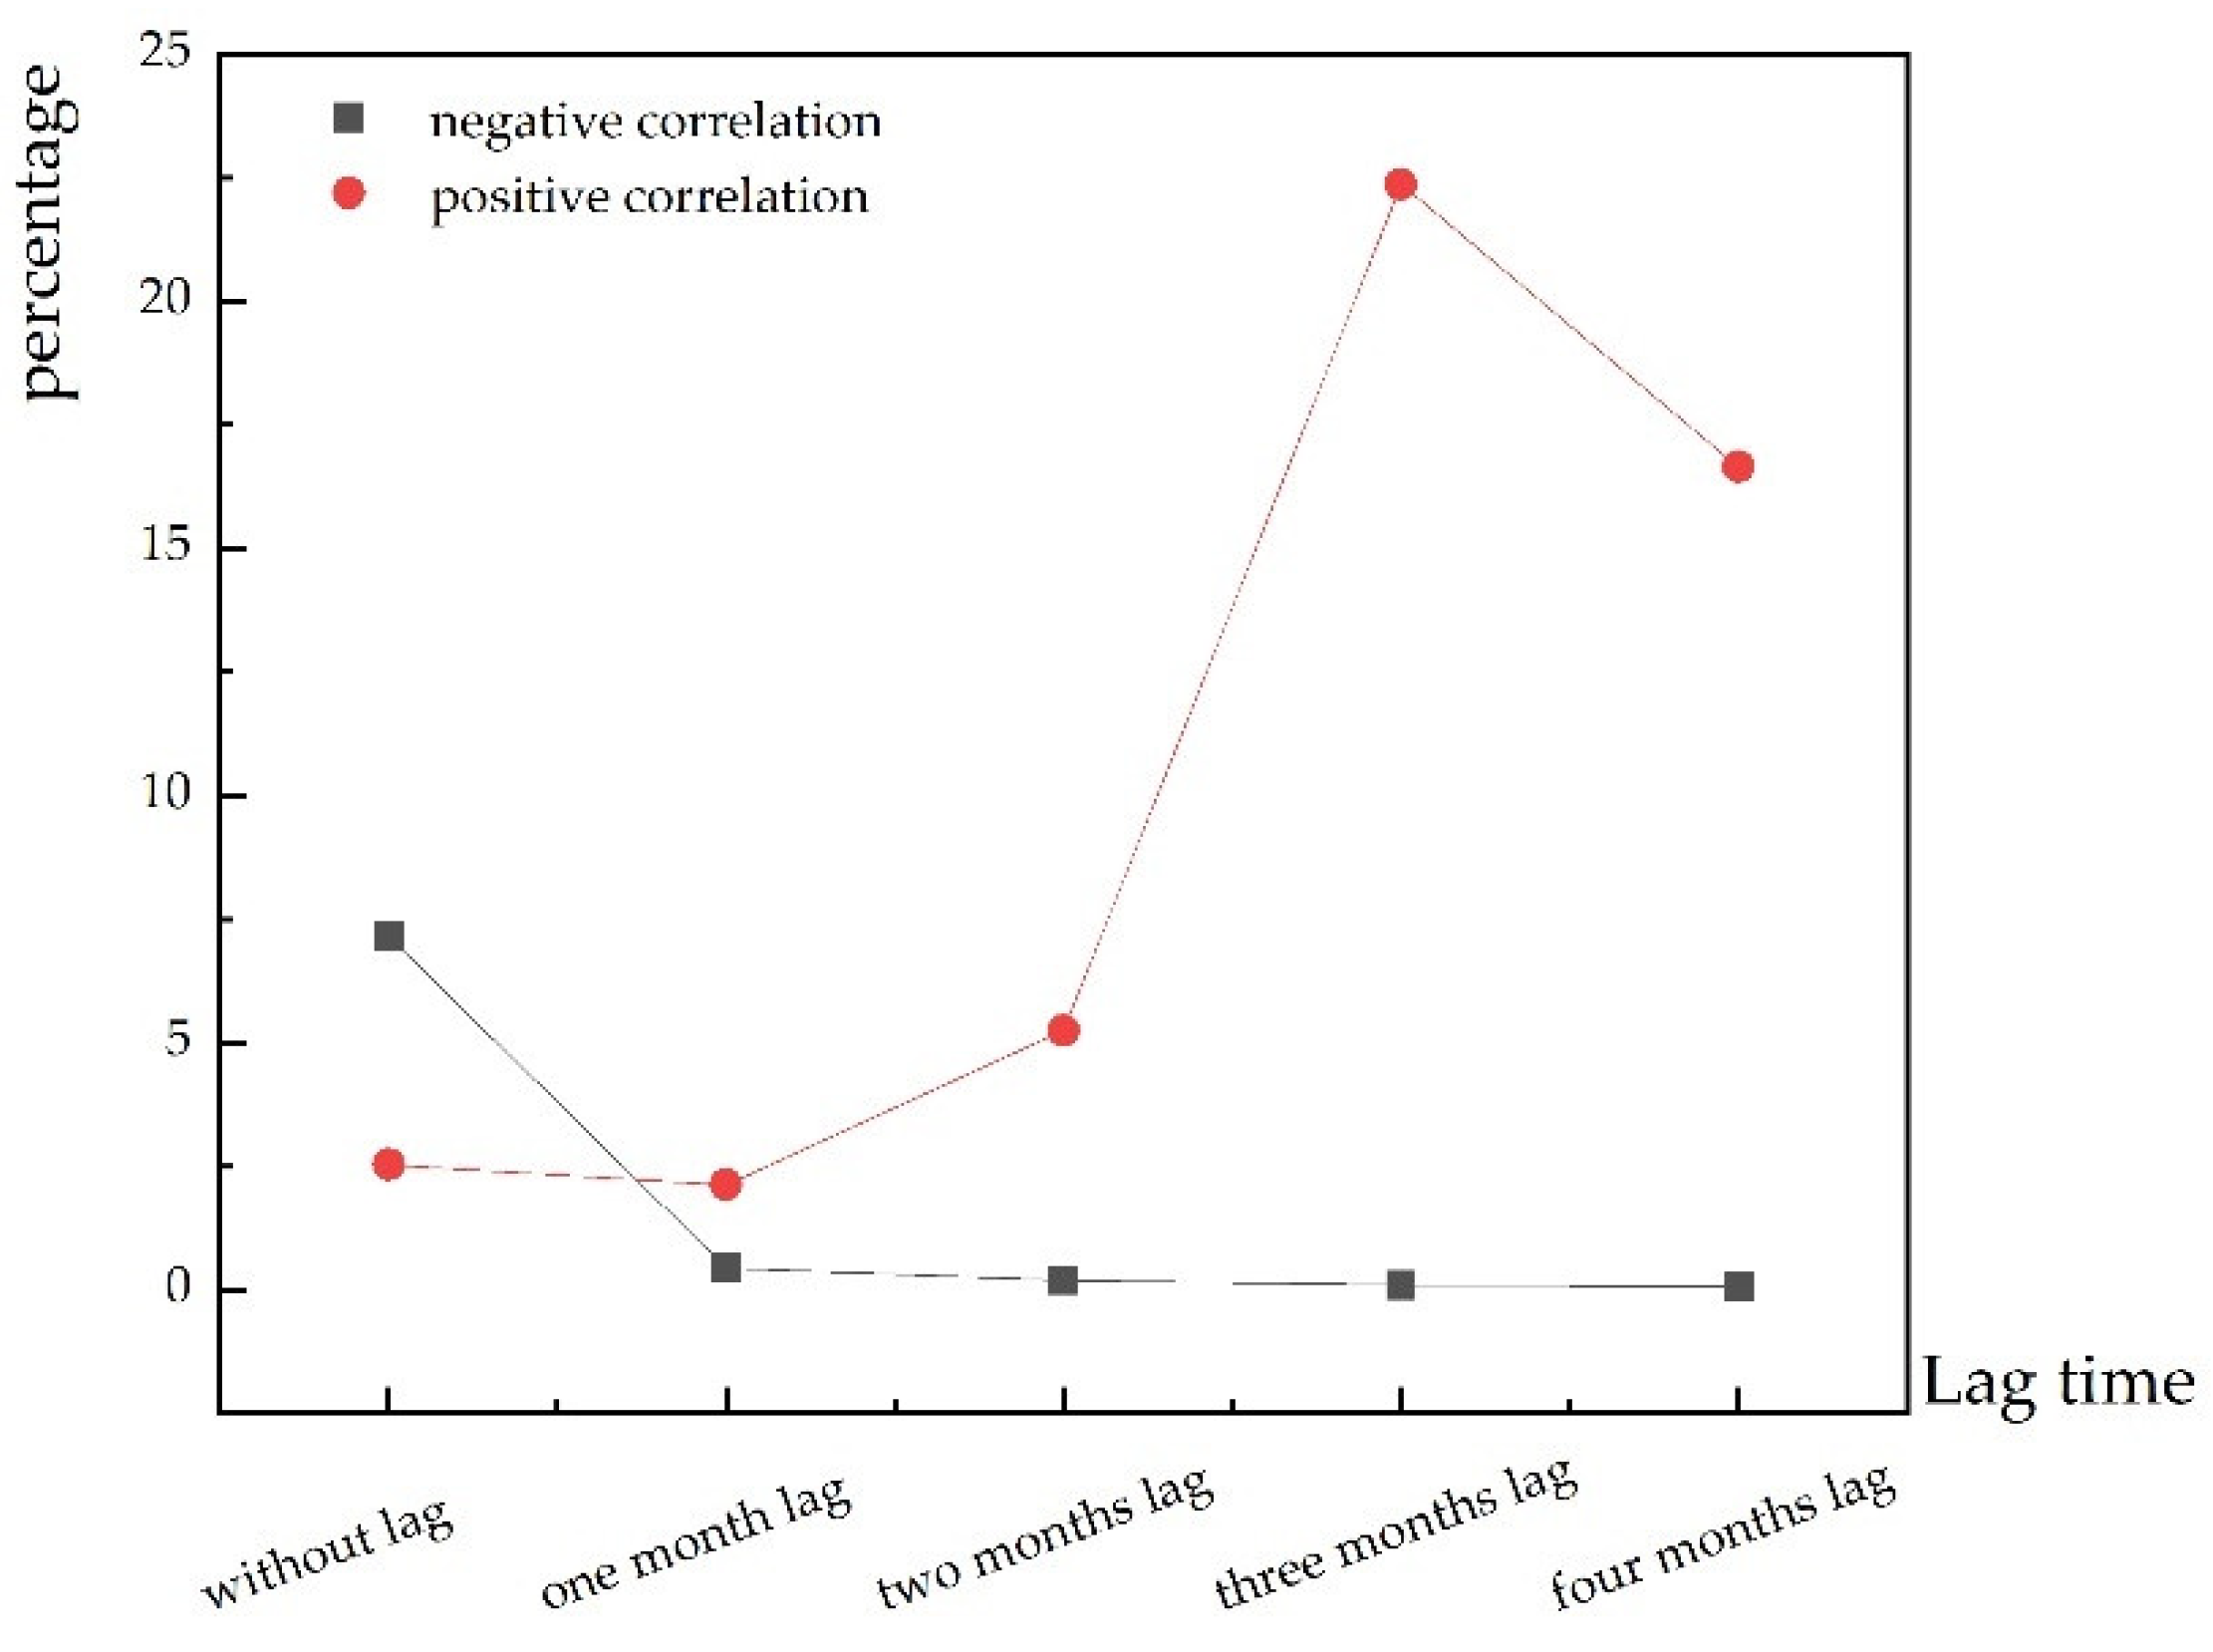
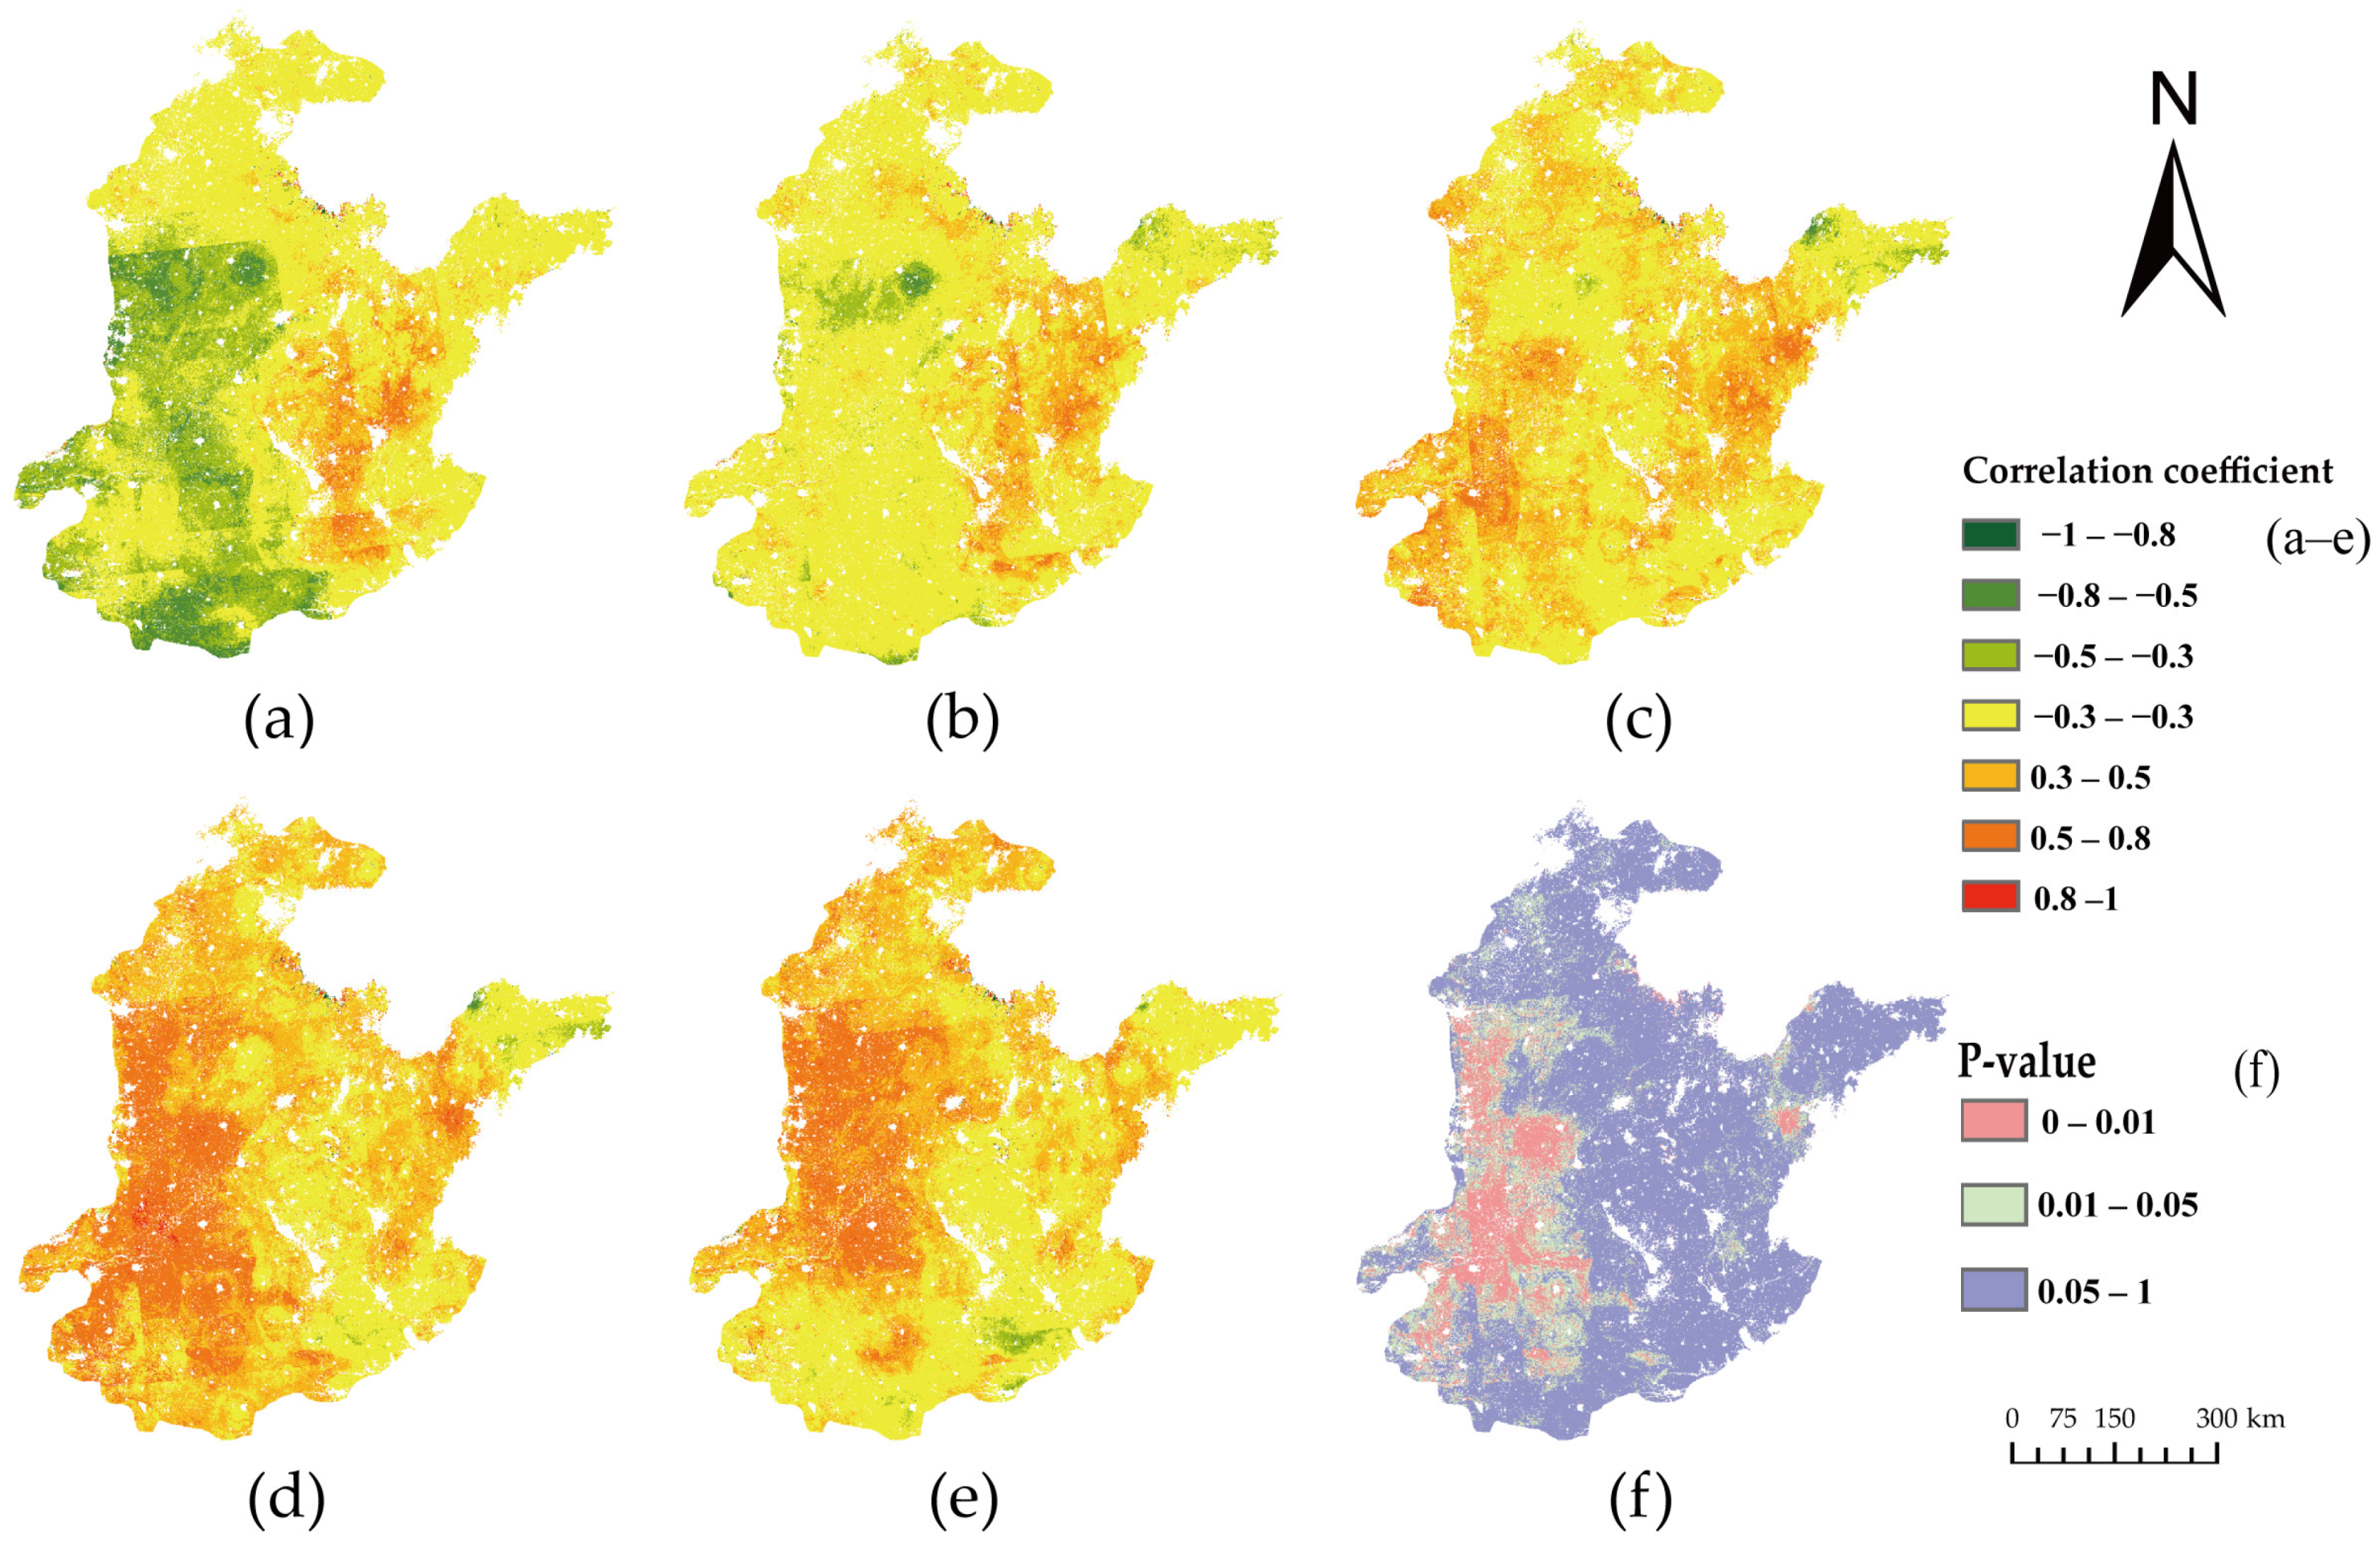
3.3. Correlation Analysis of the CWUE on Drought Events

In this study, we investigated the response of the CWUE under drought conditions, according to cultivated land vegetation types. MODIS GPP and ET were used to calculate the CWUE (gC kg−1 H2O) [47]. For each 1 km grid cell, the monthly CWUE was calculated by combining the GPP and ET data for every eight days from 2001 to 2020. At the ecosystem level, the WUE is a comprehensive indicator of terrestrial biological and physical processes.
From 2001 to 2020, the trend analysis of the CWUE was carried out based on the Theil–Sen Median and Mann-Kendall trend test method [48]. It can be seen from Figure 9 that the CWUE did not change significantly in most areas, and some coastal areas of the Shandong Peninsula increased significantly. By comparing Figure 7 and Figure 9, it can be seen that in the HHHP, the significant decrease in the mISDI was more consistent with the increase in CWUE, but according to Table 8, most of the areas where the CWUE increases were insignificant. From Figure 2 and Figure 9, it can be found that the areas with a significantly increased CWUE were mainly distributed in the eastern hilly area of the HHHP. Therefore, drought had an enhanced effect on the CWUE of the HHHP, and the enhancement of the CWUE in the eastern hilly area was more significant.
Among the drought events from 2001 to 2020 identified according to the run theory, the first most representative drought event was selected to study the effect of drought on the CWUE. According to the annual cultivated land type of the MCD12Q1 data, the corresponding cultivated land range was extracted and used to calculate the cultivated land range of the CWUE. Spearman’s correlation analysis was carried out between the first drought event and the WUE, and it was found that the relationship between drought and the CWUE showed no delay. The region showed a negative correlation, and the right hilly area showed a positive correlation. However, since the cultivated land in the HHHP is mainly irrigated, most of the cultivated land will be irrigated when drought occurs, so the Pearson’s correlation analysis with time lag was selected. By comparing the lag period of one month to four months (Figure 10a–e), it was found that the correlation between drought and the CWUE was the strongest and positively correlated when the lag period was three months (Figure 10d and Figure 11). According to Figure 10f, the left plain area had the highest significance (p < 0.01). This is consistent with that of Yang et al. [49], who concluded that there is a positive correlation between drought and the CWUE in the HHHP.

4. Discussion

The main contributions of this study are twofold. First, we conducted a targeted study on the CWUE and obtained the relationship between cultivated land and drought in the HHHP from the perspective of the WUE, which has never been reported in previous studies. This study provides a scientific basis for the production and development of food safety in China. Second, this study systematically conducted a spatiotemporal analysis of drought in the HHHP from the two aspects of drought events and drought trends, which provided a reference for drought prevention and disaster prevention in the HHHP.
This study explored the spatial and temporal distributions of droughts in the HHHP and the sensitivity of the CWUE to drought anomalies. Five drought events were identified using the run theory. The results showed that the duration of recent droughts was short, but their frequency increased. Moreover, the period of change from soaked to parched gradually shortened. The recent short-term droughts alternating with wet periods are consistent with an increase in climate variability related to climate change [50]. Recently, Gou et al. [51] developed a method to identify small-scale extreme flash drought events. Therefore, for future research, we could combine this method to expand the study of drought events in the HHHP.
Huang et al. [7] previously divided the global ecosystem into arid and humid ecosystems and concluded that droughts had a positive or negative impact on the WUEs of both ecosystems. Although the effects of drought on the WUE have been shown to be region- and biome-dependent, at the spatial scale, dividing ecosystems into arid and humid ecosystems is not sufficiently specific. Liu et al. [6] analyzed the spatial–temporal changes of the annual WUE in different regions and its response to drought depends on the vegetation types and administrative divisions. However, a differential analysis of the response of the same vegetation type to droughts in different regions has not been conducted. Further research [23] considered the southwest region as the study area and found that the responses of the WUEs of forests, shrublands, and other ecosystems to droughts vary with the drought severity. In summary, the current research on the relationship between droughts and the WUE has led to different conclusions owing to differences in the scales of the study area and the calculation model used for the WUE. Therefore, the present study indicated that the smaller the study area, the more helpful it is to determine the relationship between the WUE and drought. Thus, we suggest that the discussion of the relationship between drought and the WUE should start at a small scale. This study took the HHHP as the research area, selected the cultivated land ecosystem as the research object and explored the spatiotemporal relationship between the CWUE and drought. In addition to the precise spatial scale, the accurate division of time periods was also the focus of the follow-up research on the CWUE in this study. For example, the vegetation growing season can be used as a criterion for the time scale division.
Many studies have examined the time-lag effects of drought on the WUE [24,46,52]. Some researchers believe that the impact of droughts on the WUE has a lag effect of approximately four months, and this effect exists in 70.87% of the global vegetation areas. For shrubs and sparse vegetation, the lag effect of droughts on the WUE is short (1–4 months) [24]. Owing to the vegetation sparseness of cultivated land, the time-lag effects of drought on the CWUE in the HHHP obtained in this study were in agreement with results obtained previously [24]. Moreover, this study clearly concluded that there was a lag period of three months in the response of the CWUE to drought. This may be related to the fact that the cultivated land in this area is mainly irrigated. Previous studies pointed out the low WUE in the North China Plain, where droughts are frequent and water shortages are severe, requiring increasing irrigation over time [47]. Combined with the conclusions of this study, although the HHHP has experienced flash droughts recently, there is a three-month lag period in the response of the CWUE to drought. Therefore, agricultural production activities in the HHHP need to focus on preventing long-term droughts. For example, artificial rainfall, diversion irrigation, and groundwater irrigation could be used to mitigate the effects of drought. In addition, the changing mechanism of the CWUE is affected by various factors, including temperature, vegetation type, and soil properties [11,23,53,54,55,56], which could be the focus of future research on the CWUE.
However, the current study has some limitations. On the one hand, owing to the influence of multi-source data, the mISDI model has a short time range in the time series. On the other hand, as crop rotation can affect the CWUE by changing the GPP, these effects should be considered in future research. This study has a limited scope in that it relates to cultivated land, but such cultivated land is widespread in this important crop-producing area. In follow-up research, the model developed in our study can be extended to other regions and other countries as part of improving our understanding of the WUE during drought. Increasing the efficiency of irrigation will be important aspect of managing the effects of climate change.

5. Conclusions

This study used multi-source data, such as meteorological stations and remote sensing, and the Cubist algorithm to establish the mISDI dataset of the HHHP from 2001 to 2020. The spatial and temporal distributions of drought events and the impact of drought events on CWUE changes were analyzed. The results are summarized as follows.
  • The mISDI dataset in the HHHP was established, and the June data were taken as an example to establish a drought index model suitable for the HHHP. SPI03, SOSA, VSWI, AWC, DEM, LON, LAT, and YEAR were selected as independent variables, and scPDSI was a dependent variable.
  • Five drought events were identified using the run theory. The first drought event had the highest intensity (−1.925) and the longest drought duration (18 months) and was considered as the most severe of all the drought events. However, the gradual decline in the mISDI over the 2001–2020 period indicated a trend of worsening drought conditions in most areas of Shandong Province and in the northeastern part of Henan Province. The recent short-term droughts alternating with wet periods was consistent with an increase in climate variability related to climate change. Further studies are needed to determine if the rapid alternation between droughts and wet periods will continue. Drought had an enhanced effect on the CWUE of the HHHP, and the enhancement of the CWUE in the eastern hilly area was more significant.
  • Using the most severe drought event during the study period as an example, the correlation between drought and the CWUE was studied. The study found that there was a three-month lag period and a significant positive correlation between the response to drought and the CWUE, which was related to the irrigation habits of the HHHP. The areas with significant correlations were dominated by plains with the flattest terrain in the entire area.
In general, the mISDI has high accuracy in the comprehensive drought index model in the HHHP and has been effectively verified in the monitoring of drought events. From the response results of the CWUE and drought, the conclusions can also be verified by previous studies; however, the conclusions are more precise than those of previous studies. The relationship between multiple influencing factors of the WUE requires special attention. In future research, we plan to compare different regions of the country, explore the impact of drought on the WUE in different LATs and LONs, climatic zones, and biomes and try to reveal the underlying mechanism of drought and the WUE.

Author Contributions

Conceptualization, W.W. and J.L.; methodology, J.L. and W.W.; formal analysis, W.W., H.Q., W.X., C.Z., Y.T. and Z.H.; writing—original draft preparation, J.L. and W.W.; writing—review and editing, J.L. and W.W.; visualization, W.W. and J.L.; project administration, J.L.; funding acquisition, J.L. All authors have read and agreed to the published version of the manuscript.

Funding

This research was financially supported by the Natural Science Foundation of Anhui Province (grant No. 2108085MD29) and in part by the National Natural Science Foundation of China (grant No. 41571400).

Data Availability Statement

The data used to support the findings of this study area are available from the corresponding author upon request via email.

Conflicts of Interest

The authors declare that they have no conflict of interest.

References

  1. Aghakouchak, A.; Cheng, L.Y.; Mazdiyasni, O.; Farahmand, A. Global warming and changes in risk of concurrent climate extremes: Insights from the 2014 California drought. Geophys. Res. Lett. 2014, 41, 8847–8852. [Google Scholar] [CrossRef] [Green Version]
  2. Lesk, C.; Rowhani, P.; Ramankutty, N. Influence of extreme weather disasters on global crop production. Nature 2016, 529, 84–87. [Google Scholar] [CrossRef] [PubMed]
  3. Zhang, M.M.; Luo, D.; Su, Y.Q. Drought monitoring and agricultural drought loss risk assessment based on multisource information fusion. Nat. Hazards 2022, 111, 775–801. [Google Scholar] [CrossRef]
  4. Ito, A.; Inatomi, M. Water-use efficiency of the terrestrial biosphere: A model analysis focusing on interactions between the global carbon and water cycles. J. Hydrometeorol. 2012, 13, 681–694. [Google Scholar] [CrossRef]
  5. Aguilos, M.; Stahl, C.; Burban, B.; Hérault, B.; Courtois, E.; Coste, S.; Wagner, F.; Ziegler, C.; Takagi, K.; Bonal, D. Interannual and seasonal variations in ecosystem transpiration and water use efficiency in a tropical rainforest. Forests 2018, 10, 14. [Google Scholar] [CrossRef] [Green Version]
  6. Liu, Y.B.; Xiao, J.F.; Ju, W.M.; Zhou, Y.L.; Wang, S.Q.; Wu, X.C. Water use efficiency of China’s terrestrial ecosystems and responses to drought. Sci. Rep. 2015, 5, 13799. [Google Scholar] [CrossRef]
  7. Huang, L.; He, B.; Han, L.; Liu, J.J.; Wang, H.Y.; Chen, Z.Y. A global examination of the response of ecosystem water-use efficiency to drought based on MODIS data. Sci. Total Environ. 2017, 601, 1097–1107. [Google Scholar] [CrossRef]
  8. Sinclair, T.R.; Tanner, C.; Bennett, J. Water-use efficiency in crop production. Bioscience 1984, 34, 36–40. [Google Scholar] [CrossRef]
  9. Xue, B.L.; Guo, Q.H.; Otto, A.; Xiao, J.F.; Tao, S.L.; Li, L. Global patterns, trends, and drivers of water use efficiency from 2000 to 2013. Ecosphere 2015, 6, 1–18. [Google Scholar] [CrossRef]
  10. Xiao, J.F.; Sun, G.; Chen, J.Q.; Chen, H.; Chen, S.P.; Dong, G.; Gao, S.H.; Guo, H.Q.; Guo, J.X.; Han, S.J. Carbon fluxes, evapotranspiration, and water use efficiency of terrestrial ecosystems in China. Agric. For. Meteorol. 2013, 182, 76–90. [Google Scholar] [CrossRef]
  11. Tian, H.Q.; Chen, G.S.; Liu, M.L.; Zhang, C.; Sun, G.; Lu, C.Q.; Xu, X.F.; Ren, W.; Pan, S.F.; Chappelka, A. Model estimates of net primary productivity, evapotranspiration, and water use efficiency in the terrestrial ecosystems of the southern United States during 1895–2007. For. Ecol. Manag. 2010, 259, 1311–1327. [Google Scholar] [CrossRef]
  12. Gang, C.C.; Wang, Z.Q.; Chen, Y.Z.; Yang, Y.; Li, J.L.; Cheng, J.M.; Qi, J.G.; Odeh, I. Drought-induced dynamics of carbon and water use efficiency of global grasslands from 2000 to 2011. Ecol. Indic. 2016, 67, 788–797. [Google Scholar] [CrossRef]
  13. Tong, X.J.; Mu, Y.M.; Zhang, J.S.; Meng, P.; Li, J. Water stress controls on carbon flux and water use efficiency in a warm-temperate mixed plantation. J. Hydrol. 2019, 571, 669–678. [Google Scholar] [CrossRef]
  14. Piao, S.L.; Ciais, P.; Huang, Y.; Shen, Z.H.; Peng, S.S.; Li, J.S.; Zhou, L.P.; Liu, H.Y.; Ma, Y.C.; Ding, Y.H. The impacts of climate change on water resources and agriculture in China. Nature 2010, 467, 43–51. [Google Scholar] [CrossRef]
  15. Xu, J.W.; Ju, H.; Mei, X.R.; Liu, Q.; Yang, J.Y. Simulation on potential effects of drought on winter wheat in Huang-Huai-Hai Plain from 1981 to 2010. Trans. Chin. Soc. Agric. Eng. 2015, 31, 150–158. [Google Scholar]
  16. Xue, C.Y.; Ma, Z.H.; Hu, C.D. Spatiotemporal characteristics of drought during summer maize growing season in Huang-Huai-Hai area for recent 40 years. J. Nat. Disaster 2016, 25, 1–14. [Google Scholar]
  17. Li, Z.; Liu, S.; Sun, R.; Liu, W. Identifying the temporal-spatial pattern evolution of the multiple cropping index in the Huang-Huai-Hai region. Acta Ecol. Sin. 2018, 38, 4454–4460. [Google Scholar]
  18. Trenberth, K.E.; Dai, A.; Van Der Schrier, G.; Jones, P.D.; Barichivich, J.; Briffa, K.R.; Sheffield, J. Global warming and changes in drought. Nat. Clim. Change 2014, 4, 17–22. [Google Scholar] [CrossRef]
  19. Meng, L.K.; Dong, T.; Zhang, W. Drought monitoring using an Integrated Drought Condition Index (IDCI) derived from multi-sensor remote sensing data. Nat. Hazards 2016, 80, 1135–1152. [Google Scholar] [CrossRef]
  20. Brown, J.F.; Wardlow, B.D.; Tadesse, T.; Hayes, M.J.; Reed, B.C. The Vegetation Drought Response Index (VegDRI): A New Integrated Approach for Monitoring Drought Stress in Vegetation. GIScience Remote Sens. 2008, 45, 16–46. [Google Scholar] [CrossRef]
  21. Zhou, L.; Wu, J.J.; Zhang, J.H.; Leng, S.; Liu, M.; Zhang, J.; Zhao, L.; Zhang, F.Y.; Shi, Y. The integrated surface drought index (ISDI) as an indicator for agricultural drought monitoring: Theory, validation, and application in Mid-Eastern China. IEEE J. Sel. Top. Appl. Earth Observ. Remote Sens. 2013, 6, 1254–1262. [Google Scholar] [CrossRef]
  22. Jiang, W.X.; Wang, L.C.; Zhang, M.; Yao, R.; Chen, X.X.; Gui, X.; Sun, J.; Cao, Q. Analysis of drought events and their impacts on vegetation productivity based on the integrated surface drought index in the Hanjiang River Basin, China. Atmos. Res. 2021, 254, 105536. [Google Scholar] [CrossRef]
  23. Zhao, J.X.; Xu, T.R.; Xiao, J.F.; Liu, S.M.; Mao, K.; Song, L.S.; Yao, Y.J.; He, X.L.; Feng, H.Z. Responses of water use efficiency to drought in southwest China. Remote Sens. 2020, 12, 199. [Google Scholar] [CrossRef] [Green Version]
  24. Ji, Y.D.; Li, Y.; Yao, N.; Biswas, A.; Zou, Y.F.; Meng, Q.T.; Liu, F.G. The lagged effect and impact of soil moisture drought on terrestrial ecosystem water use efficiency. Ecol. Indic. 2021, 133, 108349. [Google Scholar] [CrossRef]
  25. Tian, H.F.; Chen, T.; Li, Q.Z.; Mei, Q.Y.; Wang, S.; Yang, M.D.; Wang, Y.J.; Qin, Y.C. A Novel Spectral Index for Automatic Canola Mapping by Using Sentinel-2 Imagery. Remote Sens. 2022, 14, 1113. [Google Scholar] [CrossRef]
  26. Tian, H.F.; Qin, Y.C.; Niu, Z.; Wang, L.; Ge, S.S. Summer Maize Mapping by Compositing Time Series Sentinel-1A Imagery Based on Crop Growth Cycles. J. Indian Soc. Remote 2021, 49, 2863–2874. [Google Scholar] [CrossRef]
  27. Tian, H.F.; Wang, Y.J.; Chen, T.; Zhang, L.J.; Qin, Y.C. Early-Season Mapping of Winter Crops Using Sentinel-2 Optical Imagery. Remote Sens. 2021, 13, 3822. [Google Scholar] [CrossRef]
  28. Militino, A.F.; Ugarte, M.D.; Pérez-Goya, U.; Genton, M.G. Interpolation of the mean anomalies for cloud filling in land surface temperature and normalized difference vegetation index. IEEE Trans. Geosci. Remote Sens. 2019, 57, 6068–6078. [Google Scholar] [CrossRef]
  29. Wu, J.J.; Zhou, L.; Liu, M.; Zhang, J.; Leng, S.; Diao, C.Y. Establishing and assessing the Integrated Surface Drought Index (ISDI) for agricultural drought monitoring in mid-eastern China. Int. J. Appl. Earth Obs. Geoinf. 2013, 23, 397–410. [Google Scholar] [CrossRef]
  30. Wu, J.J.; Zhou, L.; Mo, X.Y.; Zhou, H.K.; Zhang, J.; Jia, R.J. Drought monitoring and analysis in China based on the Integrated Surface Drought Index (ISDI). Int. J. Appl. Earth Obs. Geoinf. 2015, 41, 23–33. [Google Scholar] [CrossRef]
  31. Vicente-Serrano, S.M.; Beguería, S.; López-Moreno, J.I. A Multiscalar Drought Index Sensitive to Global Warming: The Standardized Precipitation Evapotranspiration Index. J. Clim. 2010, 23, 1696–1718. [Google Scholar] [CrossRef] [Green Version]
  32. Wells, N.; Goddard, S.; Hayes, M.J. A Self-Calibrating Palmer Drought Severity Index. J. Clim. 2004, 17, 2335–2351. [Google Scholar] [CrossRef]
  33. Guttman, N.B. Accepting the standardized precipitation index: A calculation algorithm 1. JAWRA J. Am. Water Resour. Assoc. 1999, 35, 311–322. [Google Scholar] [CrossRef]
  34. Zhang, L.; Xiao, J.F.; Zhou, Y.; Zheng, Y.; Li, J.; Xiao, H. Drought events and their effects on vegetation productivity in China. Ecosphere 2016, 7, e01591. [Google Scholar] [CrossRef]
  35. Yevjevich, V.M. An Objective Approach to Definitions and Investigations of Continental Hydrologic Droughts. Ph.D. Thesis, Colorado State University, Libraries, Fort Collins, CO, USA, 1967. [Google Scholar]
  36. Guo, H.; Bao, A.; Liu, T.; Ndayisaba, F.; Jiang, L.L.; Kurban, A.; De Maeyer, P. Spatial and temporal characteristics of droughts in Central Asia during 1966–2015. Sci. Total Environ. 2018, 624, 1523–1538. [Google Scholar] [CrossRef]
  37. Wang, F.; Wang, Z.M.; Yang, H.B.; Zhao, Y.; Zhang, Z.Z.; Li, Z.H.; Hussain, Z. Copula-based drought analysis using Standardized Precipitation Evapotranspiration Index: A case study in the Yellow river basin, China. Water 2019, 11, 1298. [Google Scholar] [CrossRef] [Green Version]
  38. Wang, X.F.; Zhang, Y.; Feng, X.M.; Feng, Y.; Xue, Y.Y.; Pan, N.Q. Analysis and application of drought characteristics based on run theory and Copula function. Trans. Chin. Soc. Agric. Eng. 2017, 33, 206–214. [Google Scholar]
  39. Jiang, W.X.; Niu, Z.G.; Wang, L.C.; Yao, R.; Gui, X.; Xiang, F.F.; Ji, Y.X. Impacts of Drought and Climatic Factors on Vegetation Dynamics in the Yellow River Basin and Yangtze River Basin, China. Remote Sens. 2022, 14, 930. [Google Scholar] [CrossRef]
  40. Chu, H.S.; Venevsky, S.; Wu, C.; Wang, M.H. NDVI-based vegetation dynamics and its response to climate changes at Amur-Heilongjiang River Basin from 1982 to 2015. Sci. Total Environ. 2019, 650, 2051–2062. [Google Scholar] [CrossRef]
  41. Zhao, A.Z.; Yu, Q.Y.; Feng, L.L.; Zhang, A.B.; Pei, T. Evaluating the cumulative and time-lag effects of drought on grassland vegetation: A case study in the Chinese Loess Plateau. J. Environ. Manag. 2020, 261, 110214. [Google Scholar] [CrossRef]
  42. Hauke, J.; Kossowski, T. Comparison of values of Pearson’s and Spearman’s correlation coefficients on the same sets of data. Quaest. Geogr. 2011, 30, 87. [Google Scholar] [CrossRef] [Green Version]
  43. Kendall, M.G. A new measure of rank correlation. Biometrika 1938, 30, 81–93. [Google Scholar] [CrossRef]
  44. Jiang, W.G.; Yuan, L.H.; Wang, W.J.; Cao, R.; Zhang, Y.F.; Shen, W.M. Spatio-temporal analysis of vegetation variation in the Yellow River Basin. Ecol. Indic. 2015, 51, 117–126. [Google Scholar] [CrossRef]
  45. Mann, H.B. Nonparametric tests against trend. Econometrica 1945, 13, 245–259. [Google Scholar] [CrossRef]
  46. Zuo, D.P.; Han, Y.N.; Xu, Z.X.; Li, P.J.; Ban, C.G.; Sun, W.C.; Pang, B.; Peng, D.Z.; Kan, G.Y.; Zhang, R. Time-lag effects of climatic change and drought on vegetation dynamics in an alpine river basin of the Tibet Plateau, China. J. Hydrol. 2021, 600, 126532. [Google Scholar] [CrossRef]
  47. Sun, H.Y.; Liu, C.M.; Zhang, X.Y.; Shen, Y.J.; Zhang, Y.Q. Effects of irrigation on water balance, yield and WUE of winter wheat in the North China Plain. Agric. Water Manag. 2006, 85, 211–218. [Google Scholar] [CrossRef]
  48. Sen, P.K. Estimates of the regression coefficient based on Kendall’s tau. J. Am. Stat. Assoc. 1968, 63, 1379–1389. [Google Scholar] [CrossRef]
  49. Yang, S.S.; Zhang, J.H.; Han, J.Q.; Wang, J.W.; Zhang, S.; Bai, Y.; Cao, D.; Xun, L.; Zheng, M.X.; Chen, H. Evaluating global ecosystem water use efficiency response to drought based on multi-model analysis. Sci. Total Environ. 2021, 778, 146356. [Google Scholar] [CrossRef]
  50. Javed, T.; Zhang, J.H.; Bhattarai, N.; Sha, Z.; Rashid, S.; Yun, B.; Ahmad, S.; Henchiri, M.; Kamran, M. Drought characterization across agricultural regions of China using standardized precipitation and vegetation water supply indices. J. Clean. Prod. 2021, 313, 127866. [Google Scholar] [CrossRef]
  51. Gou, Q.Q.; Zhu, Y.H.; Lü, H.S.; Horton, R.; Yu, X.H.; Zhang, H.Q.; Wang, X.Y.; Su, J.B.; Liu, E.; Ding, Z.Z. Application of an improved spatio-temporal identification method of flash droughts. J. Hydrol. 2022, 604, 127224. [Google Scholar] [CrossRef]
  52. Wu, X.C.; Li, X.Y.; Chen, Y.H.; Bai, Y.; Tong, Y.Q.; Wang, P.; Liu, H.Y.; Wang, M.J.; Shi, F.Z.; Zhang, C.C. Atmospheric water demand dominates daily variations in water use efficiency in alpine meadows, northeastern Tibetan Plateau. J. Geophys. Res. Biogeosci. 2019, 124, 2174–2185. [Google Scholar] [CrossRef]
  53. Ponce-Campos, G.E.; Moran, M.S.; Huete, A.; Zhang, Y.; Bresloff, C.; Huxman, T.E.; Eamus, D.; Bosch, D.D.; Buda, A.R.; Gunter, S.A. Ecosystem resilience despite large-scale altered hydroclimatic conditions. Nature 2013, 494, 349–352. [Google Scholar] [CrossRef] [PubMed]
  54. El Masri, B.; Stinchcomb, G.E.; Cetin, H.; Ferguson, B.; Kim, S.L.; Xiao, J.F.; Fisher, J.B. Linking Remotely Sensed Carbon and Water Use Efficiencies with In Situ Soil Properties. Remote Sens. 2021, 13, 2593. [Google Scholar] [CrossRef]
  55. Zhu, X.J.; Yu, G.R.; Wang, Q.F.; Hu, Z.M.; Zheng, H.; Li, S.G.; Sun, X.M.; Zhang, Y.P.; Yan, J.H.; Wang, H.M. Spatial variability of water use efficiency in China’s terrestrial ecosystems. Glob. Planet. Change 2015, 129, 37–44. [Google Scholar] [CrossRef]
  56. Huang, M.T.; Piao, S.L.; Sun, Y.; Ciais, P.; Cheng, L.; Mao, J.F.; Poulter, B.; Shi, X.Y.; Zeng, Z.Z.; Wang, Y.P. Change in terrestrial ecosystem water-use efficiency over the last three decades. Glob. Change Biol. 2015, 21, 2366–2378. [Google Scholar] [CrossRef] [PubMed]
Figure 1. Provinces (a) and land cover types (b) in the Huang–Huai–Hai Plain (HHHP) and administrative divisions of China (c).
Remotesensing 14 02381 g001
Figure 2. Elevation in the HHHP.
Remotesensing 14 02381 g002
Figure 3. The mISDI flow chart. Independent variables were defined in the main text and in Table 2.
Remotesensing 14 02381 g003
Figure 4. mISDI variables importance.
Remotesensing 14 02381 g004
Figure 5. Variations of the average mISDI of the HHHP. A bar shade represents a drought event.
Remotesensing 14 02381 g005
Figure 6. Correlation analysis of three drought indices and the mISDI: (a) correlation analysis of the SPEI and the mISDI; (b) correlation analysis of the SPI03 and the mISDI; (c) correlation analysis of the scPDSI and the mISDI.
Remotesensing 14 02381 g006
Figure 7. Spatial variation trend of the mISDI in the HHHP.
Remotesensing 14 02381 g007
Figure 8. The degree of drought in the HHHP: (a) autumn 2001; (b) winter 2001; (c) spring 2002; (d) summer 2002; (e) autumn 2002; and (f) winter 2002.
Remotesensing 14 02381 g008
Figure 9. Spatial variation trend of the CWUE in the HHHP.
Remotesensing 14 02381 g009
Figure 10. (a) The correlation analysis without lag; (b) the correlation analysis with a lag of 1 month; (c) the correlation analysis with a lag of 2 months; (d) the correlation analysis with a lag of 3 months; (e) the correlation analysis with a lag of 4 months; and (f) a significant test with a lag of 3 months.
Remotesensing 14 02381 g010
Figure 11. Analysis of the proportions of pixel values of ≤−0.5 (negative correlation) and pixel values of ≥0.5 (positive correlation) under different lags.
Remotesensing 14 02381 g011
Table 1. MODIS products used in the study.
ProductsDateTime
Resolution
Amount of Data
MOD11A21 January 2001–31 December 20208 d918
MOD13A31 January 2001–31 December 2020Month240
MCD12Q11 January 2001–31 December 2019Year19
MOD17A2HGF1 January 2001–31 December 20208 d920
MOD16A2GF1 January 2001–31 December 20208 d920
Table 2. Information about the data in this study.
NameAbbreviationResolution
land surface temperatureLST1 km
normalized difference vegetation indexNDVI1 km
gross primary productionGPP500 m
evapotranspirationET500 m
land coverLC500 m
digital elevation modelDEM1 km
available water capacityAWC1 km
Asian irrigated area mapIAA250 m
longitude and latitudeLON and LAT1 km
standardized precipitation indexSPIstations
standardized precipitation evapotranspiration indexSPEIstations
self-calibration palmer drought severity indexscPDSIstations
palmer drought severity indexPDSIstations
Table 3. Calculation methods for the start of season anomaly (SOSA) and the vegetation supply water index (VSWI).
IndexEquationCalculationTime Resolution
SOSA SOSA i = SOST i SOST med SOSTi represents the start of the growing season in year n, and SOSTmed represents the median of the start of the growing season for the entire time series. SOST is calculated by TIMESAT based on the Savitzky–Golay filtered NDVI in the bear toolbox.year
VSWI VSWI = NDVI LST Pixel ratio of the NDVI to the LST per monthmonth
Table 4. Data combinations input into the model.
CombinationsDependent
Variable
Independent Variable
1scPDSI1 SPI03, 2 SOSA, 3 VSWI, 4 AWC, 5 LC, 6 DEM, and 7 IAA
2scPDSIAdd location variables (8 LAT and 9 LON) to combination 1
3scPDSIAdd time variables (10 YEAR) to combination 2
4scPDSISPEI, SOSA, VSWI, AWC, LC, and DEM IAA
5scPDSIAdd location variables (LAT and LON) to combination 4
6scPDSIAdd time variables (YEAR) to combination 5
1 SPI03 (the 3-month scales of the SPI); 2 SOSA (start of season anomaly); 3 VSWI (vegetation supply water index); 4 AWC (available water capacity); 5 LC (land cover); 6 DEM (digital elevation model); 7 LON (longitude); 8 LAT (latitude); 9 IAA (irrigated area map of Asia); 10 YEAR (time variables).
Table 5. Classification of drought severity for the monthly integrated surface drought index (mISDI).
mISDI ValueDrought Degree
mISDI ≥ 3severe moist
2 ≤ mISDI < 3moderate moist
0.5 ≤ mISDI < 2mild moist
−1 ≤ mISDI < 0.5normal
−2 ≤ mISDI < −1mild drought
−3 ≤ mISDI < −2moderate drought
−4 ≤ mISDI < −3severe drought
mISDI < −4extreme drought
Table 6. Model accuracies of different data combinations.
1 Combination2 MAE3 RMSE4 R2
11.0571.3840.619
20.7250.9800.819
30.1560.2530.987
41.0691.3870.618
50.7120.9590.827
60.1620.2650.986
1 Combinations as described in Table 4; 2 MAE, mean absolute error; 3 RMSE, root-mean-square error; 4 R2, coefficient of determination.
Table 7. Run theory identification results.
Drought EventDuration1 DD2 DS3 DI
E1September 2001–February 20031834.658−1.925
E2October 2013–September 20141217.230−1.436
E3May 2019–December 2019811.968−1.496
E4May 2020–June 202022.931−1.466
E5October 2020–December 202035.090−1.697
1 DD, drought duration; 2 DS, drought severity; 3 DI, drought intensity.
Table 8. Statistics of the cropland water use efficiency (CWUE) trend.
1 SCWUEZ ValueTrend of the CWUEPercentage
≥0≥1.96significant increase3.99%
≥0−1.96–1.96insignificant increase60.78%
≤0−1.96–1.96insignificant decrease35.17%
≤0≤1.96significant decrease0.06%
1 SCWUE (slope of the CWUE).
Publisher’s Note: MDPI stays neutral with regard to jurisdictional claims in published maps and institutional affiliations.

