Article

The Changes of Spatiotemporal Pattern of Rocky Desertification and Its Dominant Driving Factors in Typical Karst Mountainous Areas under the Background of Global Change

1
School of Civil Architectural Engineering, Shandong University of Technology, Zibo 255000, China
2
State Key Laboratory of Resources and Environmental Information System, Institute of Geographic Sciences and Natural Resources Research of Chinese Academy of Sciences, Beijing 100101, China
3
Key Laboratory of Urban Land Resources Monitoring and Simulation, Ministry of Natural Resources, Shenzhen 518000, China
4
Key Laboratory of National Geographic Census and Monitoring, Ministry of Natural Resources, Wuhan 430072, China
5
Aerospace Information Research Institute, Chinese Academy of Sciences, Beijing 100101, China
6
State Key Laboratory of Information Engineering in Surveying, Mapping and Remote Sensing, Wuhan University, Wuhan 430079, China
7
Key Laboratory of Land Use, Ministry of Natural Resources, China Land Survey and Planning Institute, Beijing 100035, China
*
Author to whom correspondence should be addressed.
Remote Sens. 2022, 14(10), 2351; https://doi.org/10.3390/rs14102351
Submission received: 4 April 2022 / Revised: 9 May 2022 / Accepted: 10 May 2022 / Published: 12 May 2022
(This article belongs to the Special Issue Recent Progress of Change Detection Based on Remote Sensing)

Abstract

:
There are significant differences in the dominant driving factors of rocky desertification evolution in different historical periods in southwest karst mountainous areas. However, previous studies were mostly conducted in specific periods. In this study, taking Bijie City as an example, the spatial and temporal evolution pattern of rocky desertification in Bijie City in the recent 35 years was analyzed by introducing the feature space model and the gravity center model, and then the dominant driving factors of rocky desertification in the study area in different historical periods were clarified based on GeoDetector. The results were as follows: (1) The point-to-point B (bare land index)-DI (dryness index) feature space model has high applicability for rocky desertification monitoring, and its inversion accuracy was 91.3%. (2) During the past 35 years, the rocky desertification in Bijie belonged to the moderate rocky desertification on the whole, and zones of intensive and severe rocky desertification were mainly distributed in the Weining Yi, Hui, and Miao Autonomous Region. (3) During 1985–2020, the rocky desertification in Bijie City showed an overall weakening trend (‘weakening–aggravating–weakening’). (4) From 1985 to 2020, the gravity center of rocky desertification in Bijie City moved westward, indicating that the aggravating degree of rocky desertification in the western region of the study area was higher than that in the eastern region. (5) The dominant factors affecting the evolution of rocky desertification in the past 35 years shifted from natural factor (vegetation coverage) to human activity factor (population density). The research results could provide decision supports for the prevention and control of rocky desertification in Bijie City and even the southwest karst mountainous area.

1. Introduction

Rocky desertification is a typical process of land degradation caused by serious soil erosion, large-scale bare bedrock, serious decline in land productivity, and similar desert landscape on the surface due to the interference and destruction of unreasonable social and economic activities [1,2]. The southwest mountainous area is one of the most typical karst landform areas in the world with the largest distribution area and the strongest formation [3,4]. The serious problem of rocky desertification has led to the aggravation of regional soil erosion, the degradation of ecosystem function, and the siltation of rivers and lakes, which has greatly threatened the ecological security and sustainable development of the middle and lower reaches of the river [5,6,7]. It has always been the focus of regional research and ecological environment governance [8].
Domestic and foreign scholars have carried out a series of studies on rocky desertification in southwest mountainous areas, including rocky desertification information extraction, dynamic evolution, comprehensive evaluation, driving mechanism, and ecological restoration and management [9,10]. Since the 1990s, many scholars have begun to explore the extraction methods of rocky desertification information, including the image interpretation method and comprehensive index method. The image interpretation method has gradually become an important approach to detect the rocky desertification [11,12,13]. However, this method could not obtain the inner spatial differentiation pattern information. In order to monitor the spatiotemporal change of rocky desertification, the comprehensive index of rocky desertification was established by using rock exposure rate and land-use status based on the comprehensive index method [14]. The land vegetation types, soil lithology, slope, vegetation coverage, and bedrock exposure rate were combined to evaluate the rocky desertification condition and then obtain the spatiotemporal change patterns of rocky desertification [15]. The bedrock exposure rate and vegetation coverage were extracted, and then the normalized rock index (NDR) was constructed to obtain the rocky desertification information based on the above two indices [16,17,18]. A novel rocky desertification index was proposed based on the normalized difference vegetation index (NDVI), slope, surface albedo, vegetation net primary productivity (NPP), and other factors, which had higher applicability in a large-scale area [19]. For a small-scale watershed, the remote sensing (RS) and geographic information system (GIS) technology were applied to explore the relationship between the distribution of rocky desertification and different landscapes [20]. Combined with the fuzzy analytic hierarchy process, the evolution process of rocky desertification was investigated by using socioeconomic factors, topography, climate, and geomorphology [21]. However, the comprehensive index method would amplify one certain factor and ignore the interactions among different evaluating factors. In order to analyze the spatial and temporal evolution characteristics of rocky desertification, GeoDetector was introduced to analyze the dominant factor of rocky desertification [22]. Using field-observed data and remote sensing images, the rocky desertification index was constructed based on the multiterminal spectral mixture analysis method, and then the temporal and spatial change characteristics of rocky desertification was explored [23]. However, the above studies are mostly based on the perspective of short-term series, and it was difficult to reveal the long-term change characteristics and evolution trend of rocky desertification evolution [24]. In addition, under the background of global change, there were significant differences in the dominant factors affecting the evolution of rocky desertification in different historical periods. However, previous studies have mostly explored the driving mechanism of rocky desertification in specific periods. In different historical periods of evolution of rocky desertification, the dominant driving factors and the changes were not clear [25,26,27].
In this study, taking Bijie City as an example, the feature space model was introduced to quantitatively invert the rocky desertification index from 1985 to 2020 based on Landsat satellite images, and then the long-term spatiotemporal evolution pattern and characteristics were analyzed. Finally, the differences of dominant factors affecting the evolution of rocky desertification in different historical periods were clarified and revealed utilizing GeoDetector.

2. Materials and Methods
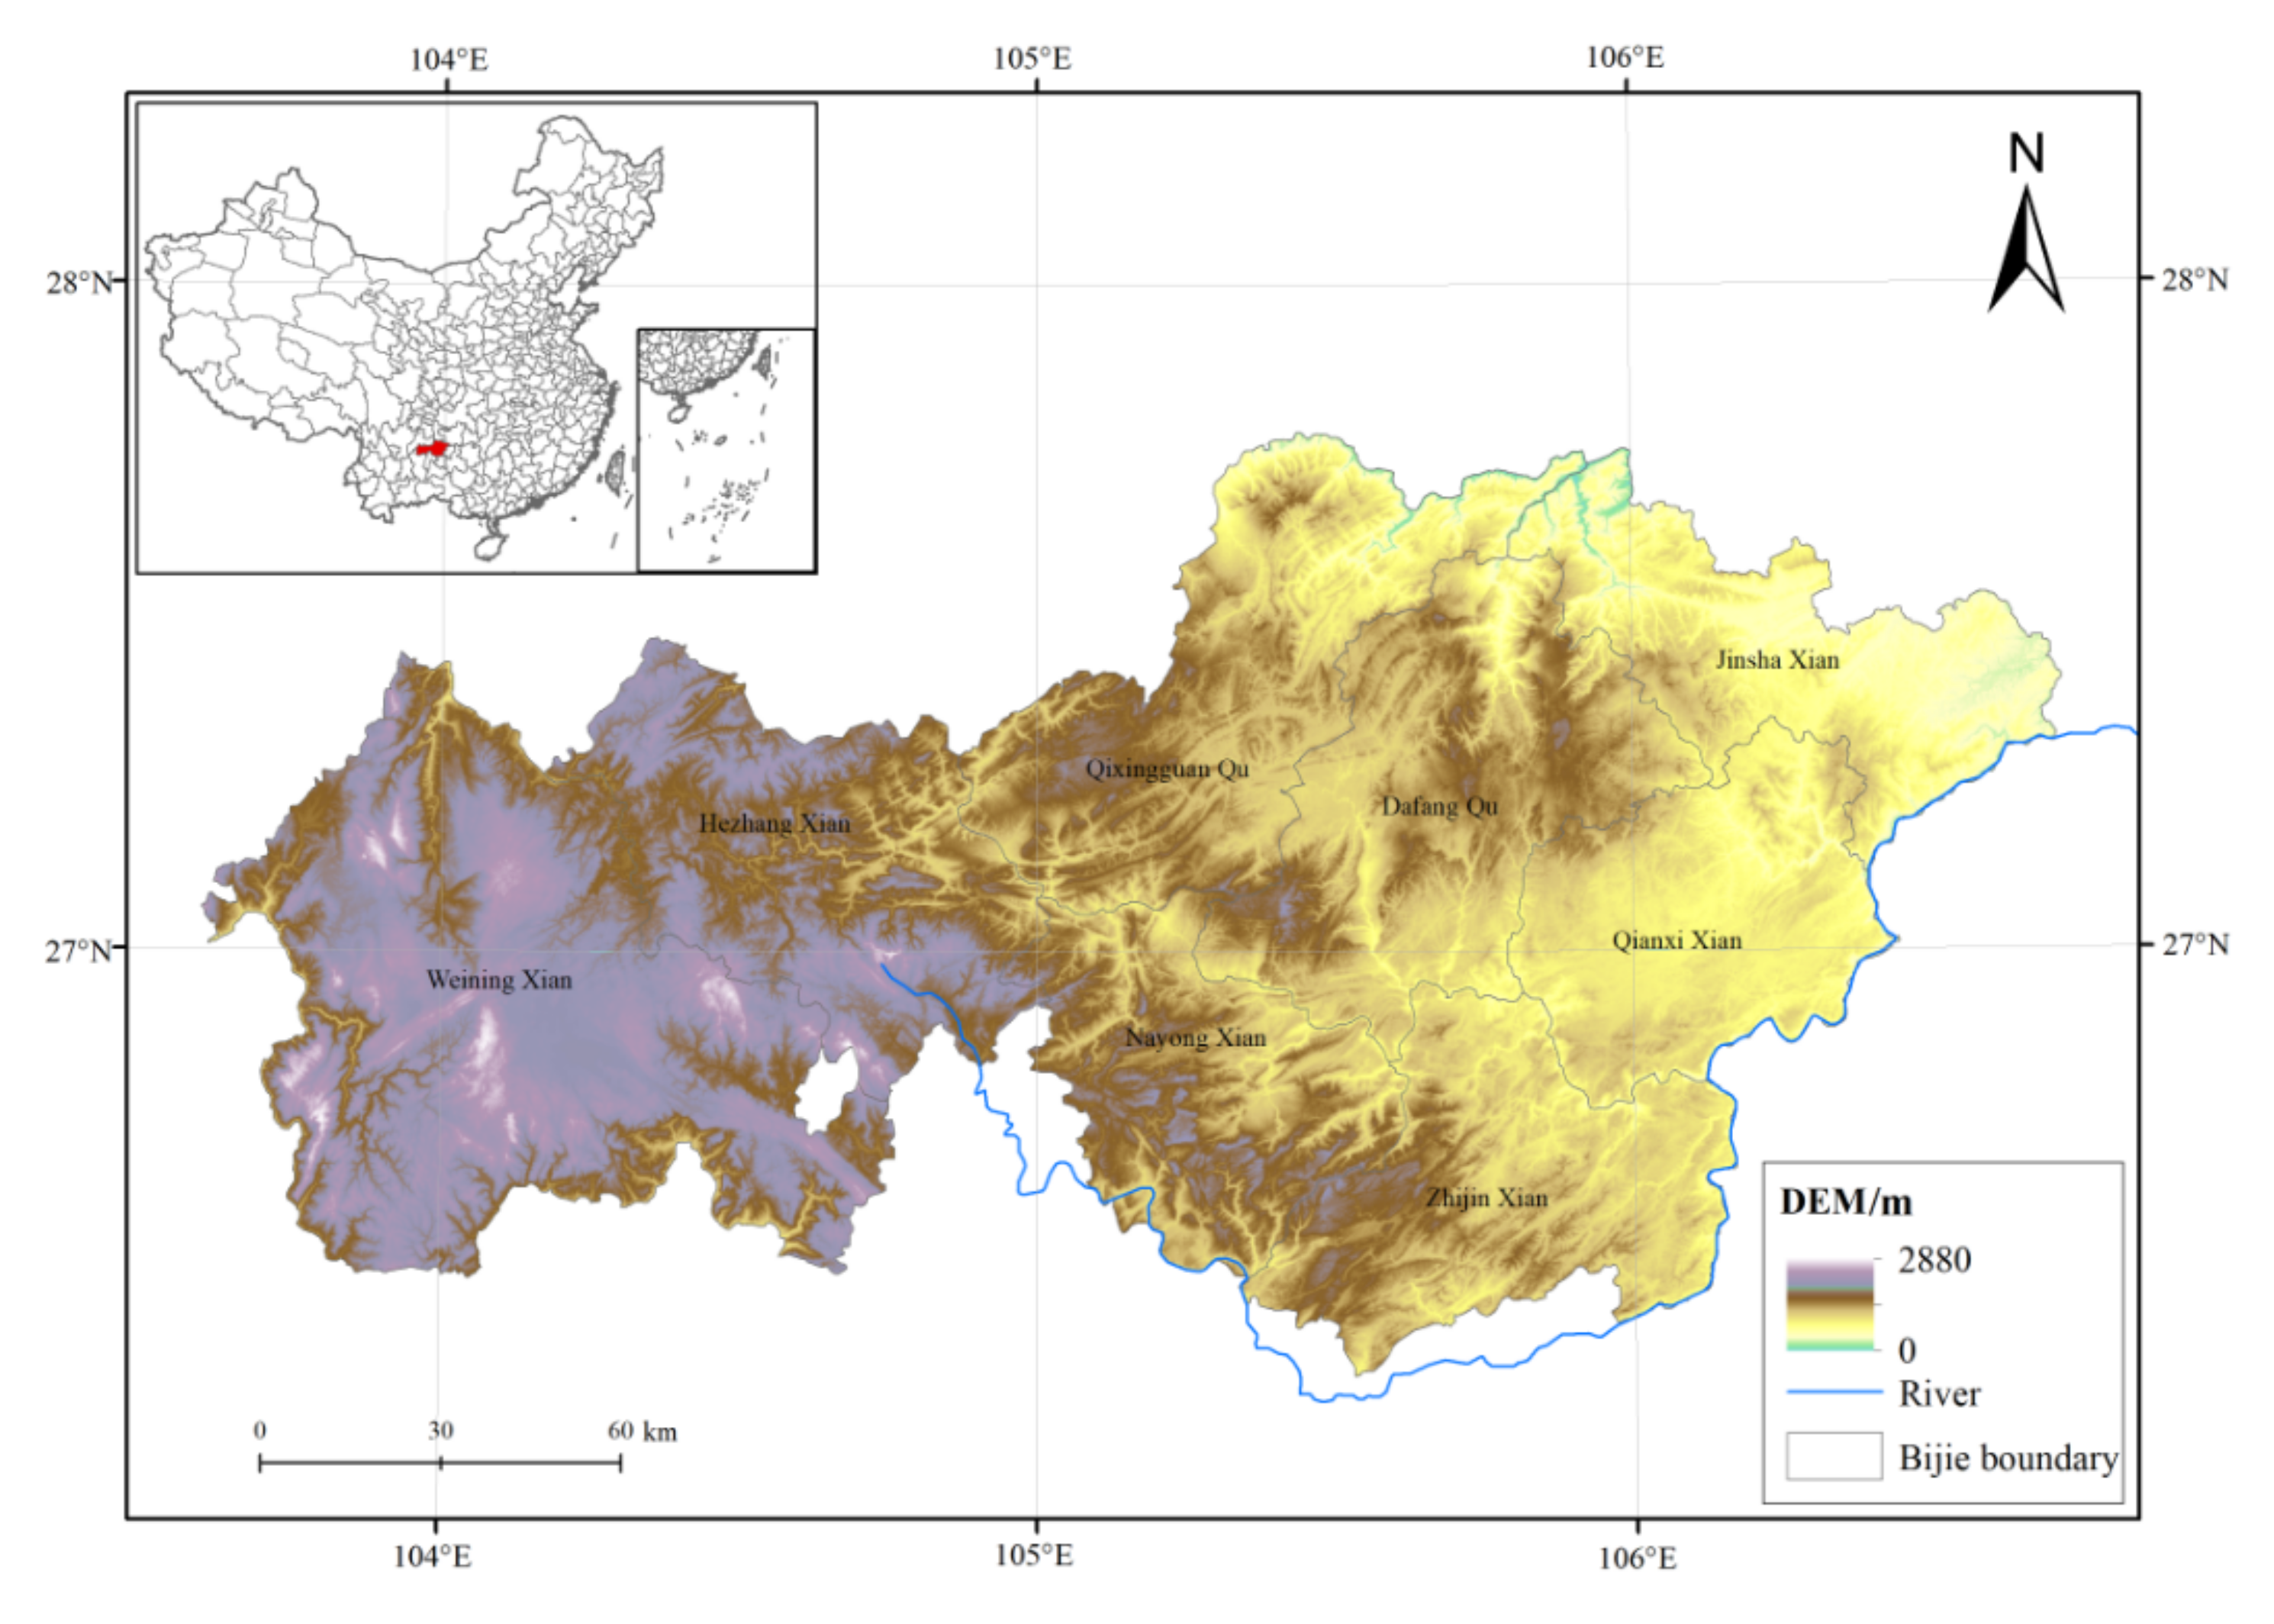
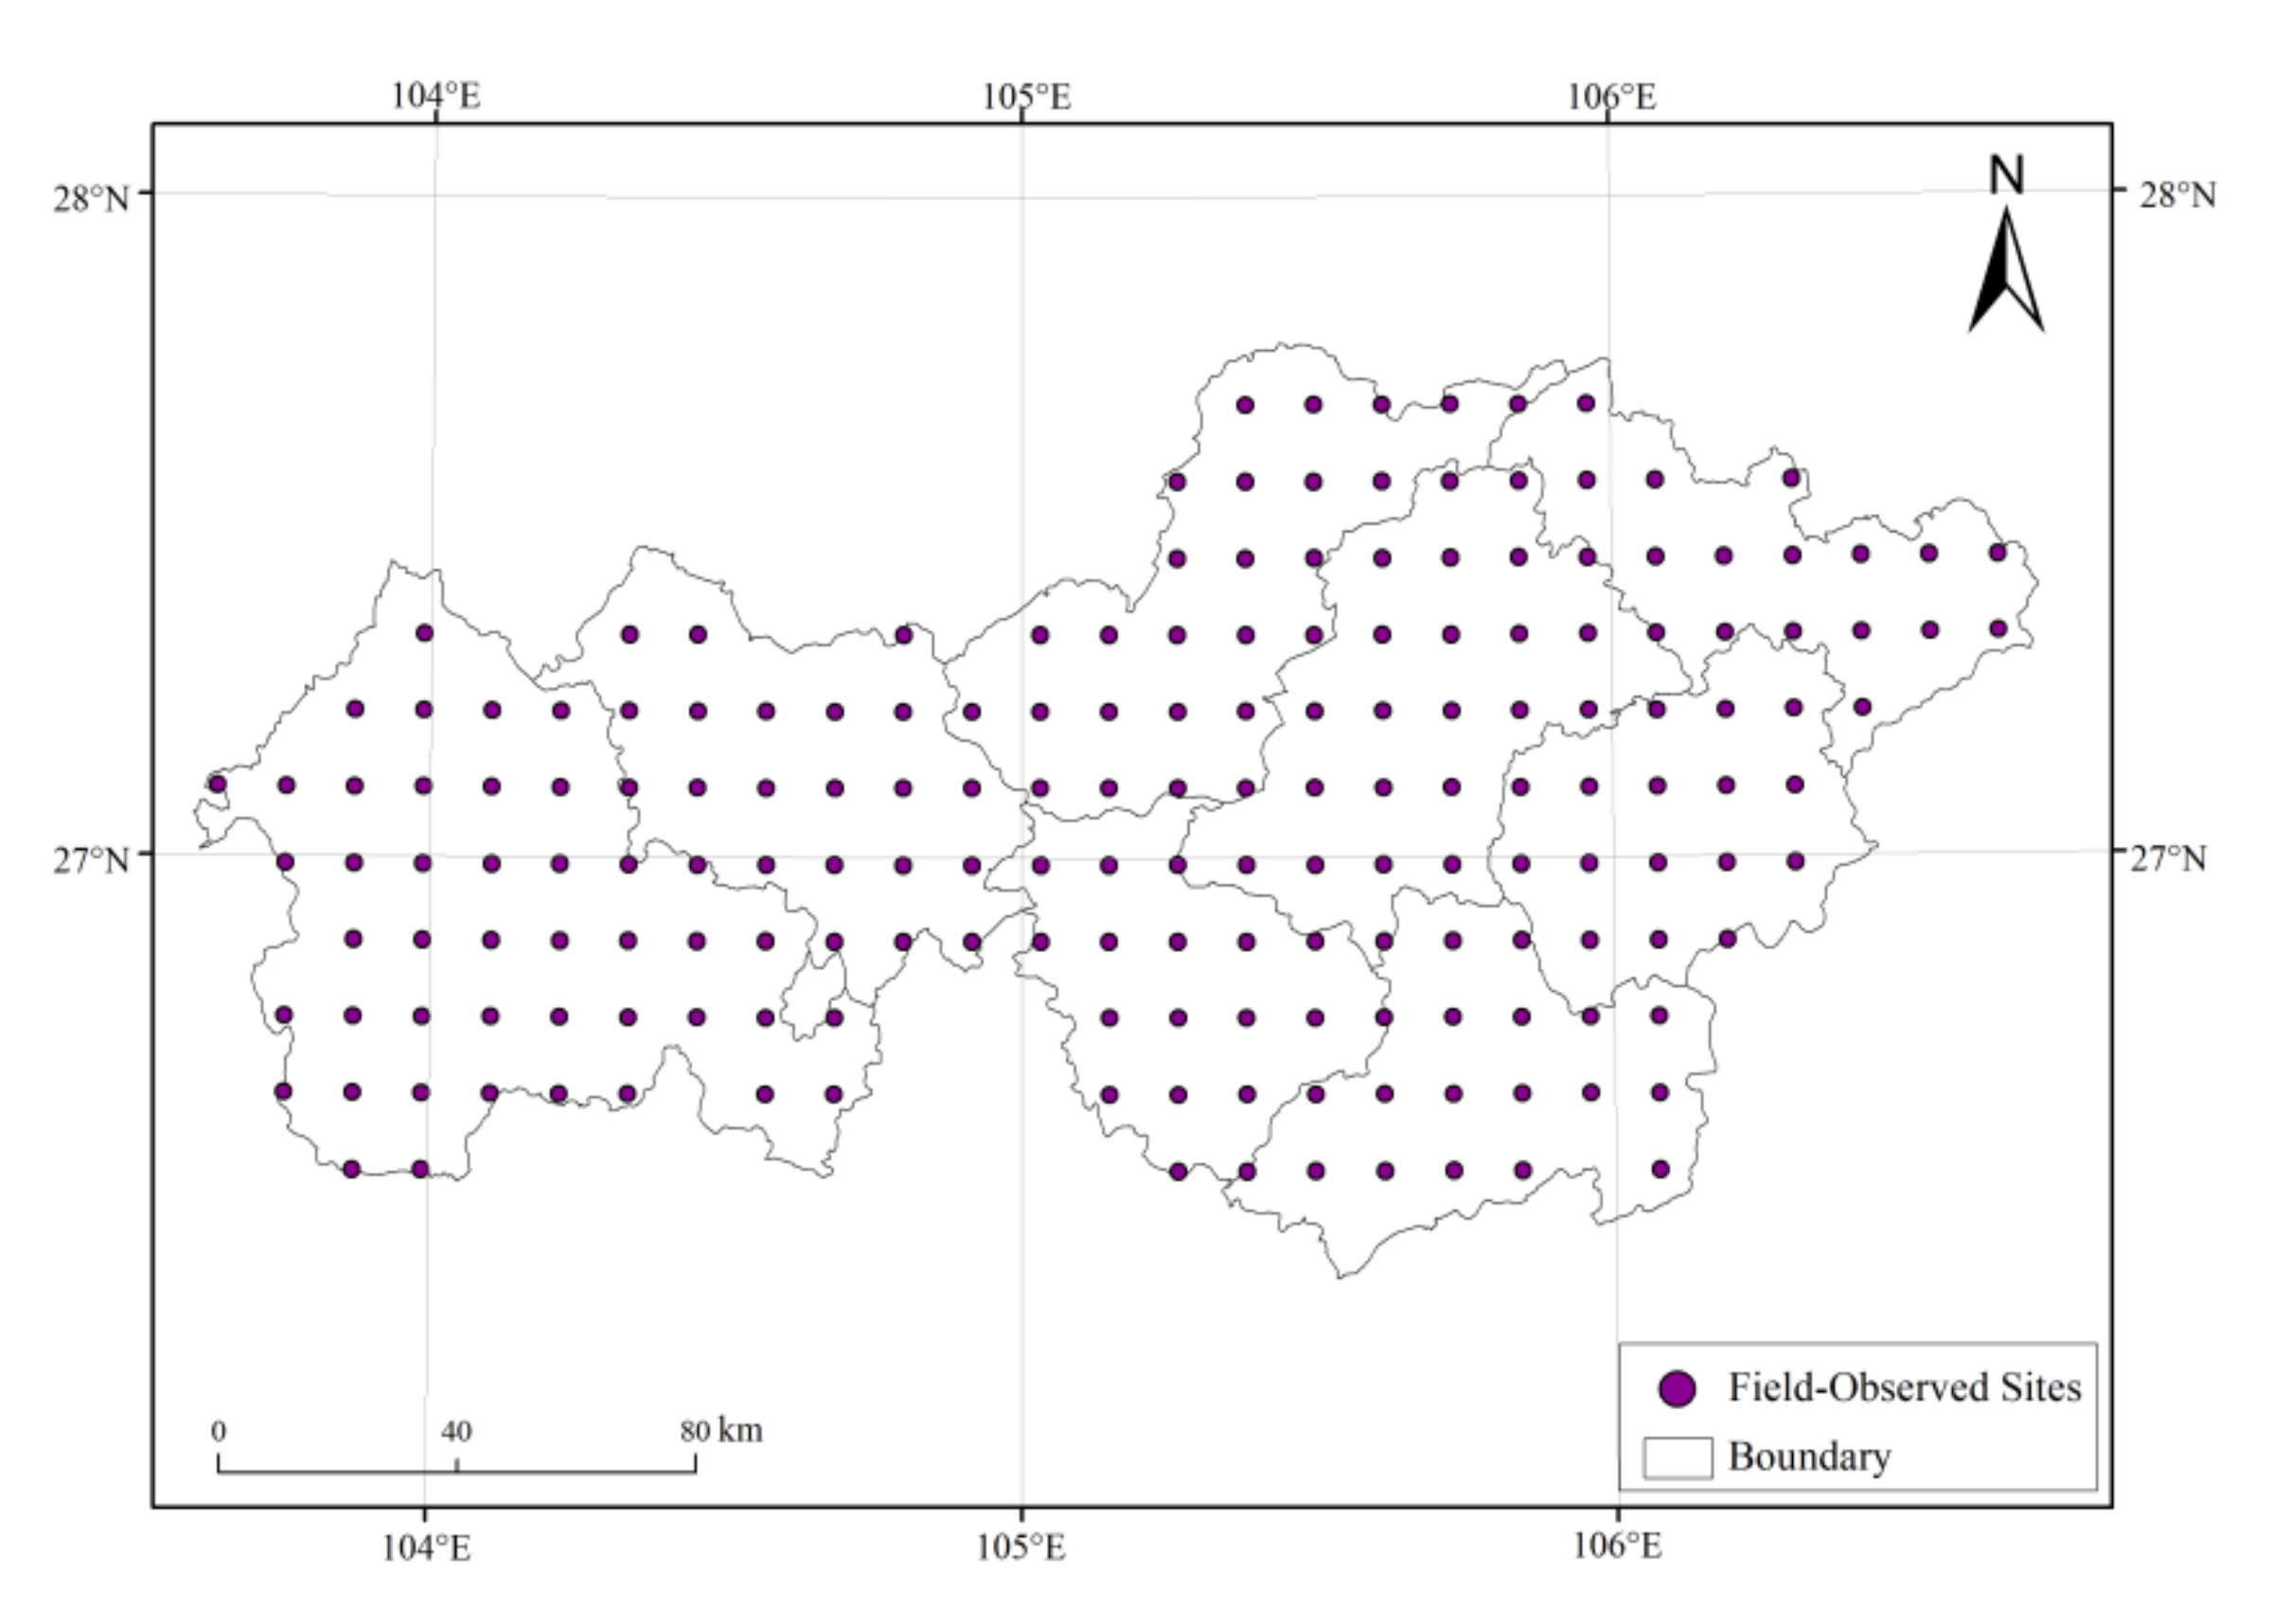
2.1. Study Area

Bijie City is located in the northwest of Guizhou Province (105°36′–106°43′E, 26°21′–27°46′N, Figure 1), with an area of about 26,853 km2, accounting for 15% of Guizhou Province. Bijie mainly has a subtropical humid monsoon climate with rain and heat over the same periods. The precipitation is abundant with an average annual precipitation of 727.3–1193.2 mm and an average temperature of 10–15 °C. The average elevation of Bijie City ranges from 457 to 2900 m, and its terrain types are mainly composed of mountain and plateau. The mainly soil type in this study area is red soil. The land-use types are mainly composed of woodland and grassland. Woodland has the largest distribution area, followed by grassland. The karst landform in Bijie City is well developed, and limestone and dolomite are widely distributed, accounting for about 60% of the total area.

2.2. Data Source and Preprocessing
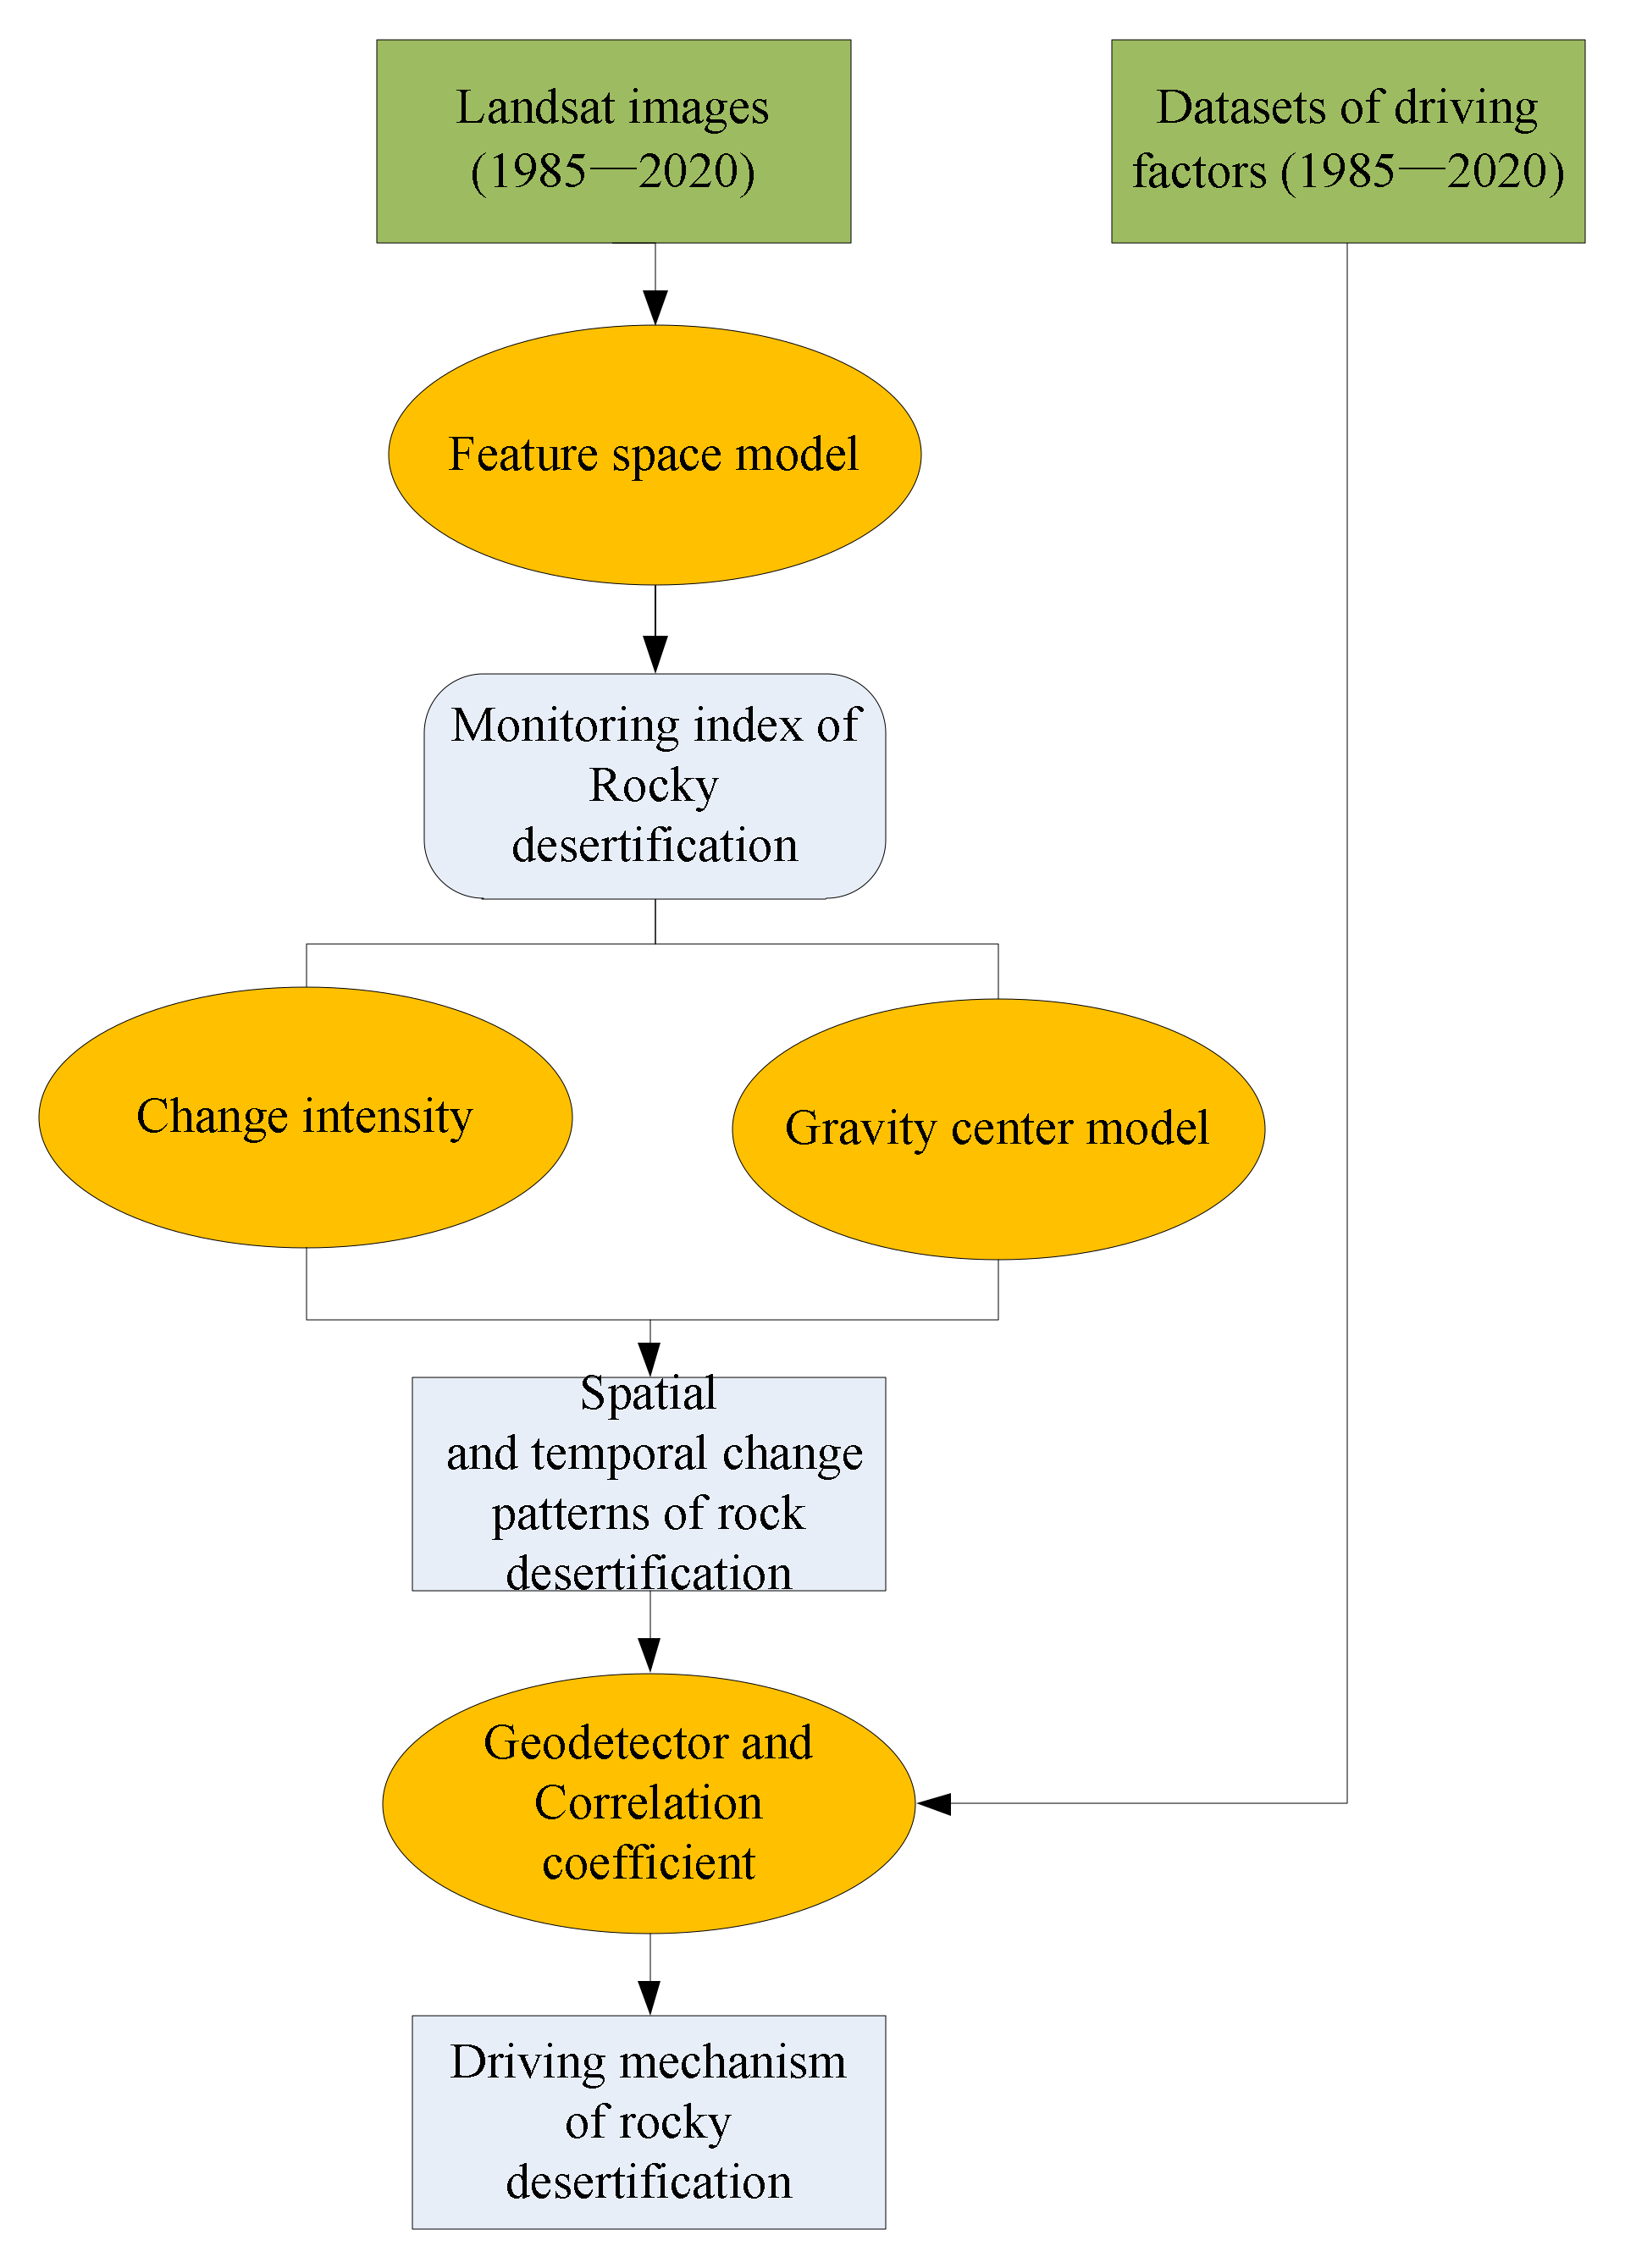
Landsat 5 TM and Landsat 8 OLI images in 1985, 1990, 1995, 2000, 2005, 2010, 2015, and 2020 were downloaded from the Geospatial Data Cloud (http://www.gscloud.cn/, accessed on 6 January 2022), with cloud less than 10% and a spatial resolution of 30 m. Atmospheric correction was applied using the tool of ENVI5.3 FLAASH atmospheric correction. Land-use types with a spatial scale of 1:100,000 were downloaded from the Resource and Environmental Science and Data Center of the Chinese Academy of Sciences (https://www.resdc.cn/, accessed on 25 December 2021). The land-use types mainly include cultivated land, forest land, grassland, water area, construction land, and unused land. The overall accuracy of this dataset reached 95.41%, which met the needs of this study. The 35 meteorological stations’ data used in this study were obtained from the China Meteorological Data Network (http://data.cma.cn/, accessed on 14 November 2021), including precipitation (0.1 mm), sunshine hours (0.1 h), and daily average temperature (0.1 °C). Then, the kriging interpolation method of ArcGIS 10.2 was applied to obtain grid images with a spatial resolution of 30 m, and the projection type of Krasovsky-1940-Albers. The DEM data with a resolution of 30 m were obtained from a Shuttle Radar Topography Mission 3 (SRTM3) product available at the Geospatial Data Cloud. The gross domestic product (GDP) density and population density were downloaded from Resource and Environmental Science and Data Center of the Chinese Academy of Sciences (Table 1).

2.3. Methods

The work flowchart of our study is shown in Figure 2.

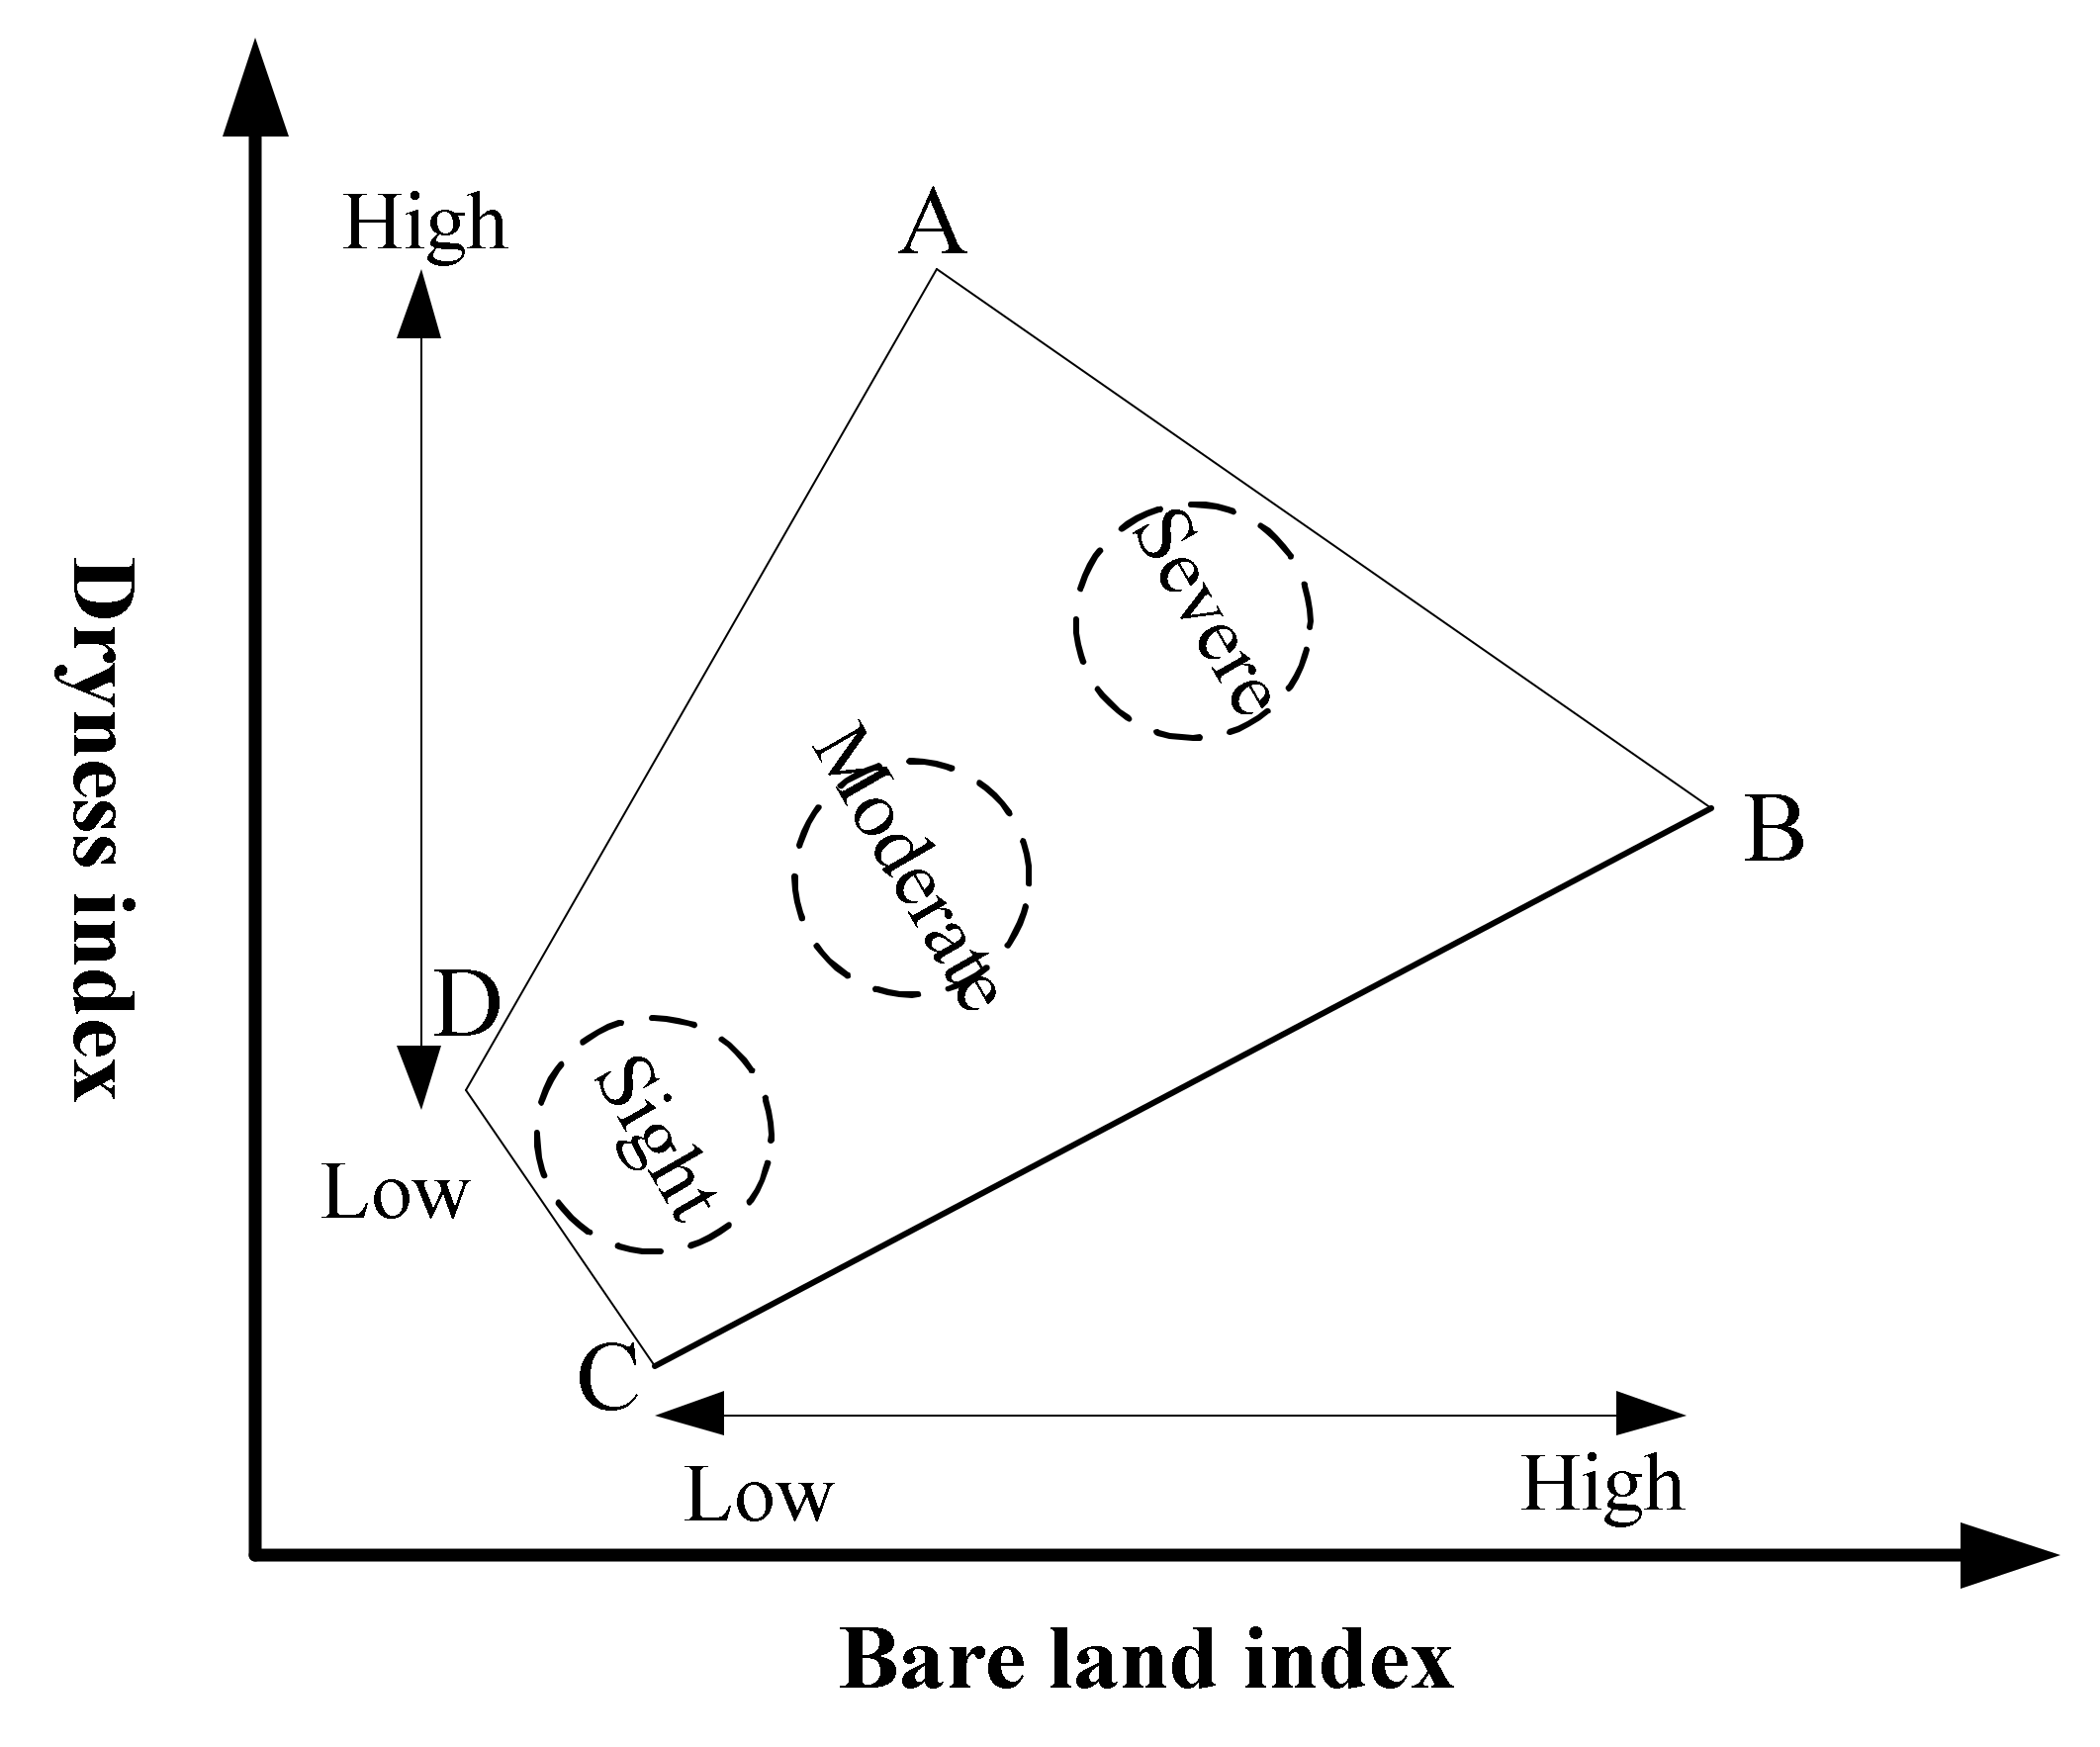
2.3.1. Calculation of Typical Parameters and Principle of Feature Space Model

Feature space is a two-dimensional plane constructed by two typical rocky desertification parameters as abscissa and ordinate, respectively. The feature space model can better reflect the interaction effect between sensitive surface parameters of rocky desertification. There are significant changes in land surface exposure rate during the process of rocky desertification. The surface bare land index (BLI) could better reflect the surface land exposure rate. In addition, the land surface dryness would be larger in zones with more exposed rock, and so the dryness index (DI) could also be a better indicator of rocky desertification. Therefore, in this study, according to the main causes of rocky desertification and regional ecological environment characteristics, the DI and BLI were selected to indicate the rocky desertification process. With the aggravation of rocky desertification, the surface vegetation coverage decreases and the exposed rock and soil areas increase, which results in an increase in surface soil bare rate. Vegetation has the function of regulating the local climate and improving the regional ecological environment quality. Therefore, surface dryness tends to increase with the aggravation of rocky desertification. As shown in Figure 3, with the aggravation of rocky desertification, the bare land index and surface dryness index showed an increasing trend, in which the AD line represented a severe rocky desertification area, and the CD line represented no or a slight rocky desertification area.
BLI = ( ( B swir 1 + B red ) ( B nir + B blue ) ) / ( ( B swir 1 + B red ) + ( B nir + B blue ) )
DI = 0.0315 × B blue + 0.2021 × B green + 0.3102 × B red + 0.1594 × B nir 0.6806 × B swir 1 0.6109 × B swir 2

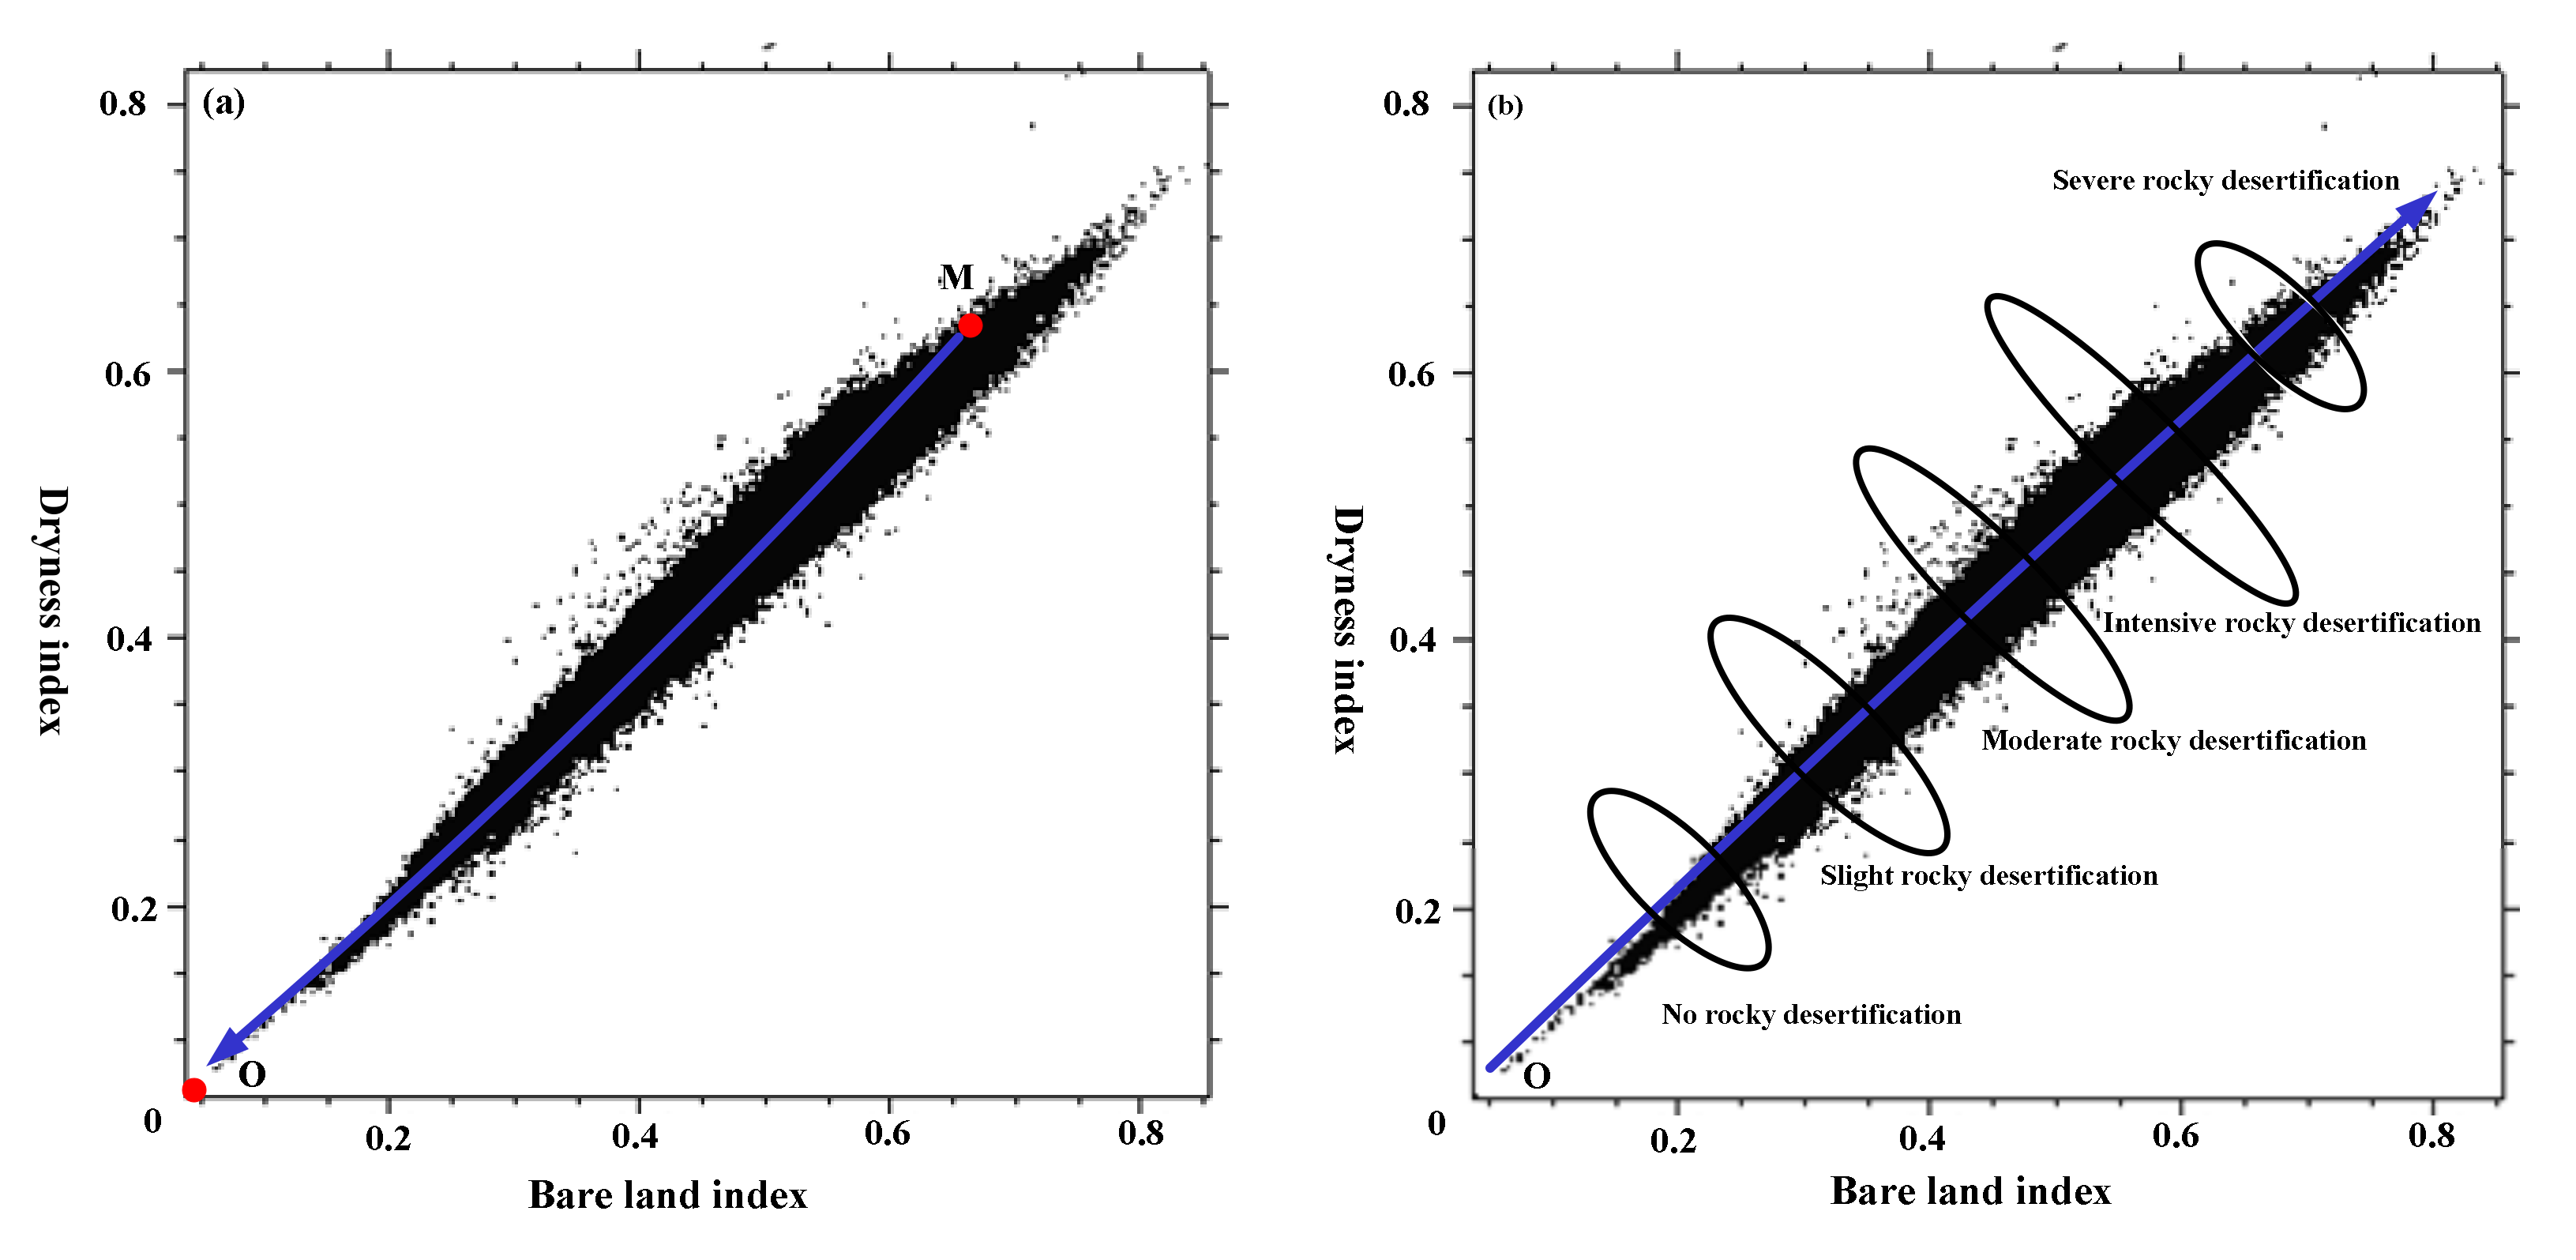
2.3.2. Construction of Point-to-Point BLI-DI Rocky Desertification Monitoring Model

In order to analyze the distribution and differentiation law of different levels of rocky desertification in the feature space, five corresponding point sets were selected in this study to explore the correlations between BLI and DI, and the rocky desertification level corresponding to the five-point sets was determined by field observation data, Google Earth, and GF-2 images in this study. As shown in Figure 4, the distributions of different point sets corresponding to levels of rocky desertification in the BLI-DI feature space are significantly different. The farther away from point O (0, 0), the more serious the rocky desertification. The distance from the point sets of severe rocky desertification to point O (P, Q) is the largest, followed by the point sets of intensive, moderate, and slight rocky desertification, and the distance from the point sets of no rocky desertification is the smallest. The elliptical section perpendicular to the OM line can better distinguish different levels of rocky desertification. Therefore, the distance from any point M (x, y) to point O (P, Q) can be used to indicate the change process of rocky desertification. According to the distance formula between two points, the point-to-point rocky desertification monitoring model can be established:
RDI = ( x P ) 2 + ( y Q ) 2

2.3.3. GeoDetector

GeoDetector is a new statistical method for detecting the spatial differences and explaining the driving forces behind a certain geographical phenomenon. This study has utilized this method to determine the dominant factors of rocky desertification in Bijie City:
PD = 1 h = 1 L N h σ h 2 N σ 2 = 1 SSW SST
SSW = h = 1 L N h σ h 2 , SST = N σ 2
where PD is the explanatory power of influencing actors to rocky desertification, and the range is [0,1]. The larger the value is, the stronger the explanatory power of influencing factors to rocky desertification is; h = 1, 2…, L is the classification or partition of variable Y or factor X; and SSW and SST are the sum of intralayer variance and regional total variance, respectively.
Interaction detection calculates the q value of the factors X1 and X2, and then calculates the q value of the interaction between the factors X1 and X2. Based on the detection results of interaction, this paper evaluates the explanatory power of the interaction (increase or decrease) and mutual independence of influencing factors on rocky desertification.

2.3.4. Verification Method

In this paper, the precision index and the basic error matrices were adopted to test the accuracy of the inversion results:
C i + = j = 1 n C i j , C + j = i = 1 n C i j
P u , i = C i i / C i + , P A , j = C j j / C + j
where Pu,i represents the user accuracy of inversion category i, PA,j represents the cartographic accuracy of the field-observed category j, n is the number of categories, Ci+ is the sum of the inversion category i, C+j is the sum of the field-observed category j, and Cij is the number of the inversion category i and the field-observed category j that both occur.

3. Results

3.1. Validation of Monitoring Index for Rocky Desertification

Based on the constructed rocky desertification monitoring model, this study used ArcGIS 10.2 to calculate and obtain the spatial distributions of rocky desertification in Bijie City in 1985, 1990, 1995, 2000, 2005, 2010, 2015, and 2020. In order to eliminate the interference of the built-up area and the bare land area, this study applied the land-use and geological and lithologic data to extract this land-use type and then divided the rocky desertification index (RDI) into five levels: RDI < 0.3 as no rocky desertification, 0.3 < RDI < 0.5 as slight rocky desertification, 0.5 < RDI < 0.7 as moderate rocky desertification, 0.7 < RDI < 0.9 as intensive rocky desertification, and 0.9 < RDI < 1 as severe rocky desertification. In order to verify the accuracy of the proposed rocky desertification monitoring model, 185 validation samples (Figure 5) in 2020 were selected from different types of landscape areas by using field measured data, Google Earth, and GF-2 satellite images, and the error matrix of the rocky desertification monitoring index (2020) was constructed. Table 2 shows that the overall accuracy of the BLI-DI feature space index monitoring model based on point–point mode is 91.3%, indicating that the model had good applicability in the study area.

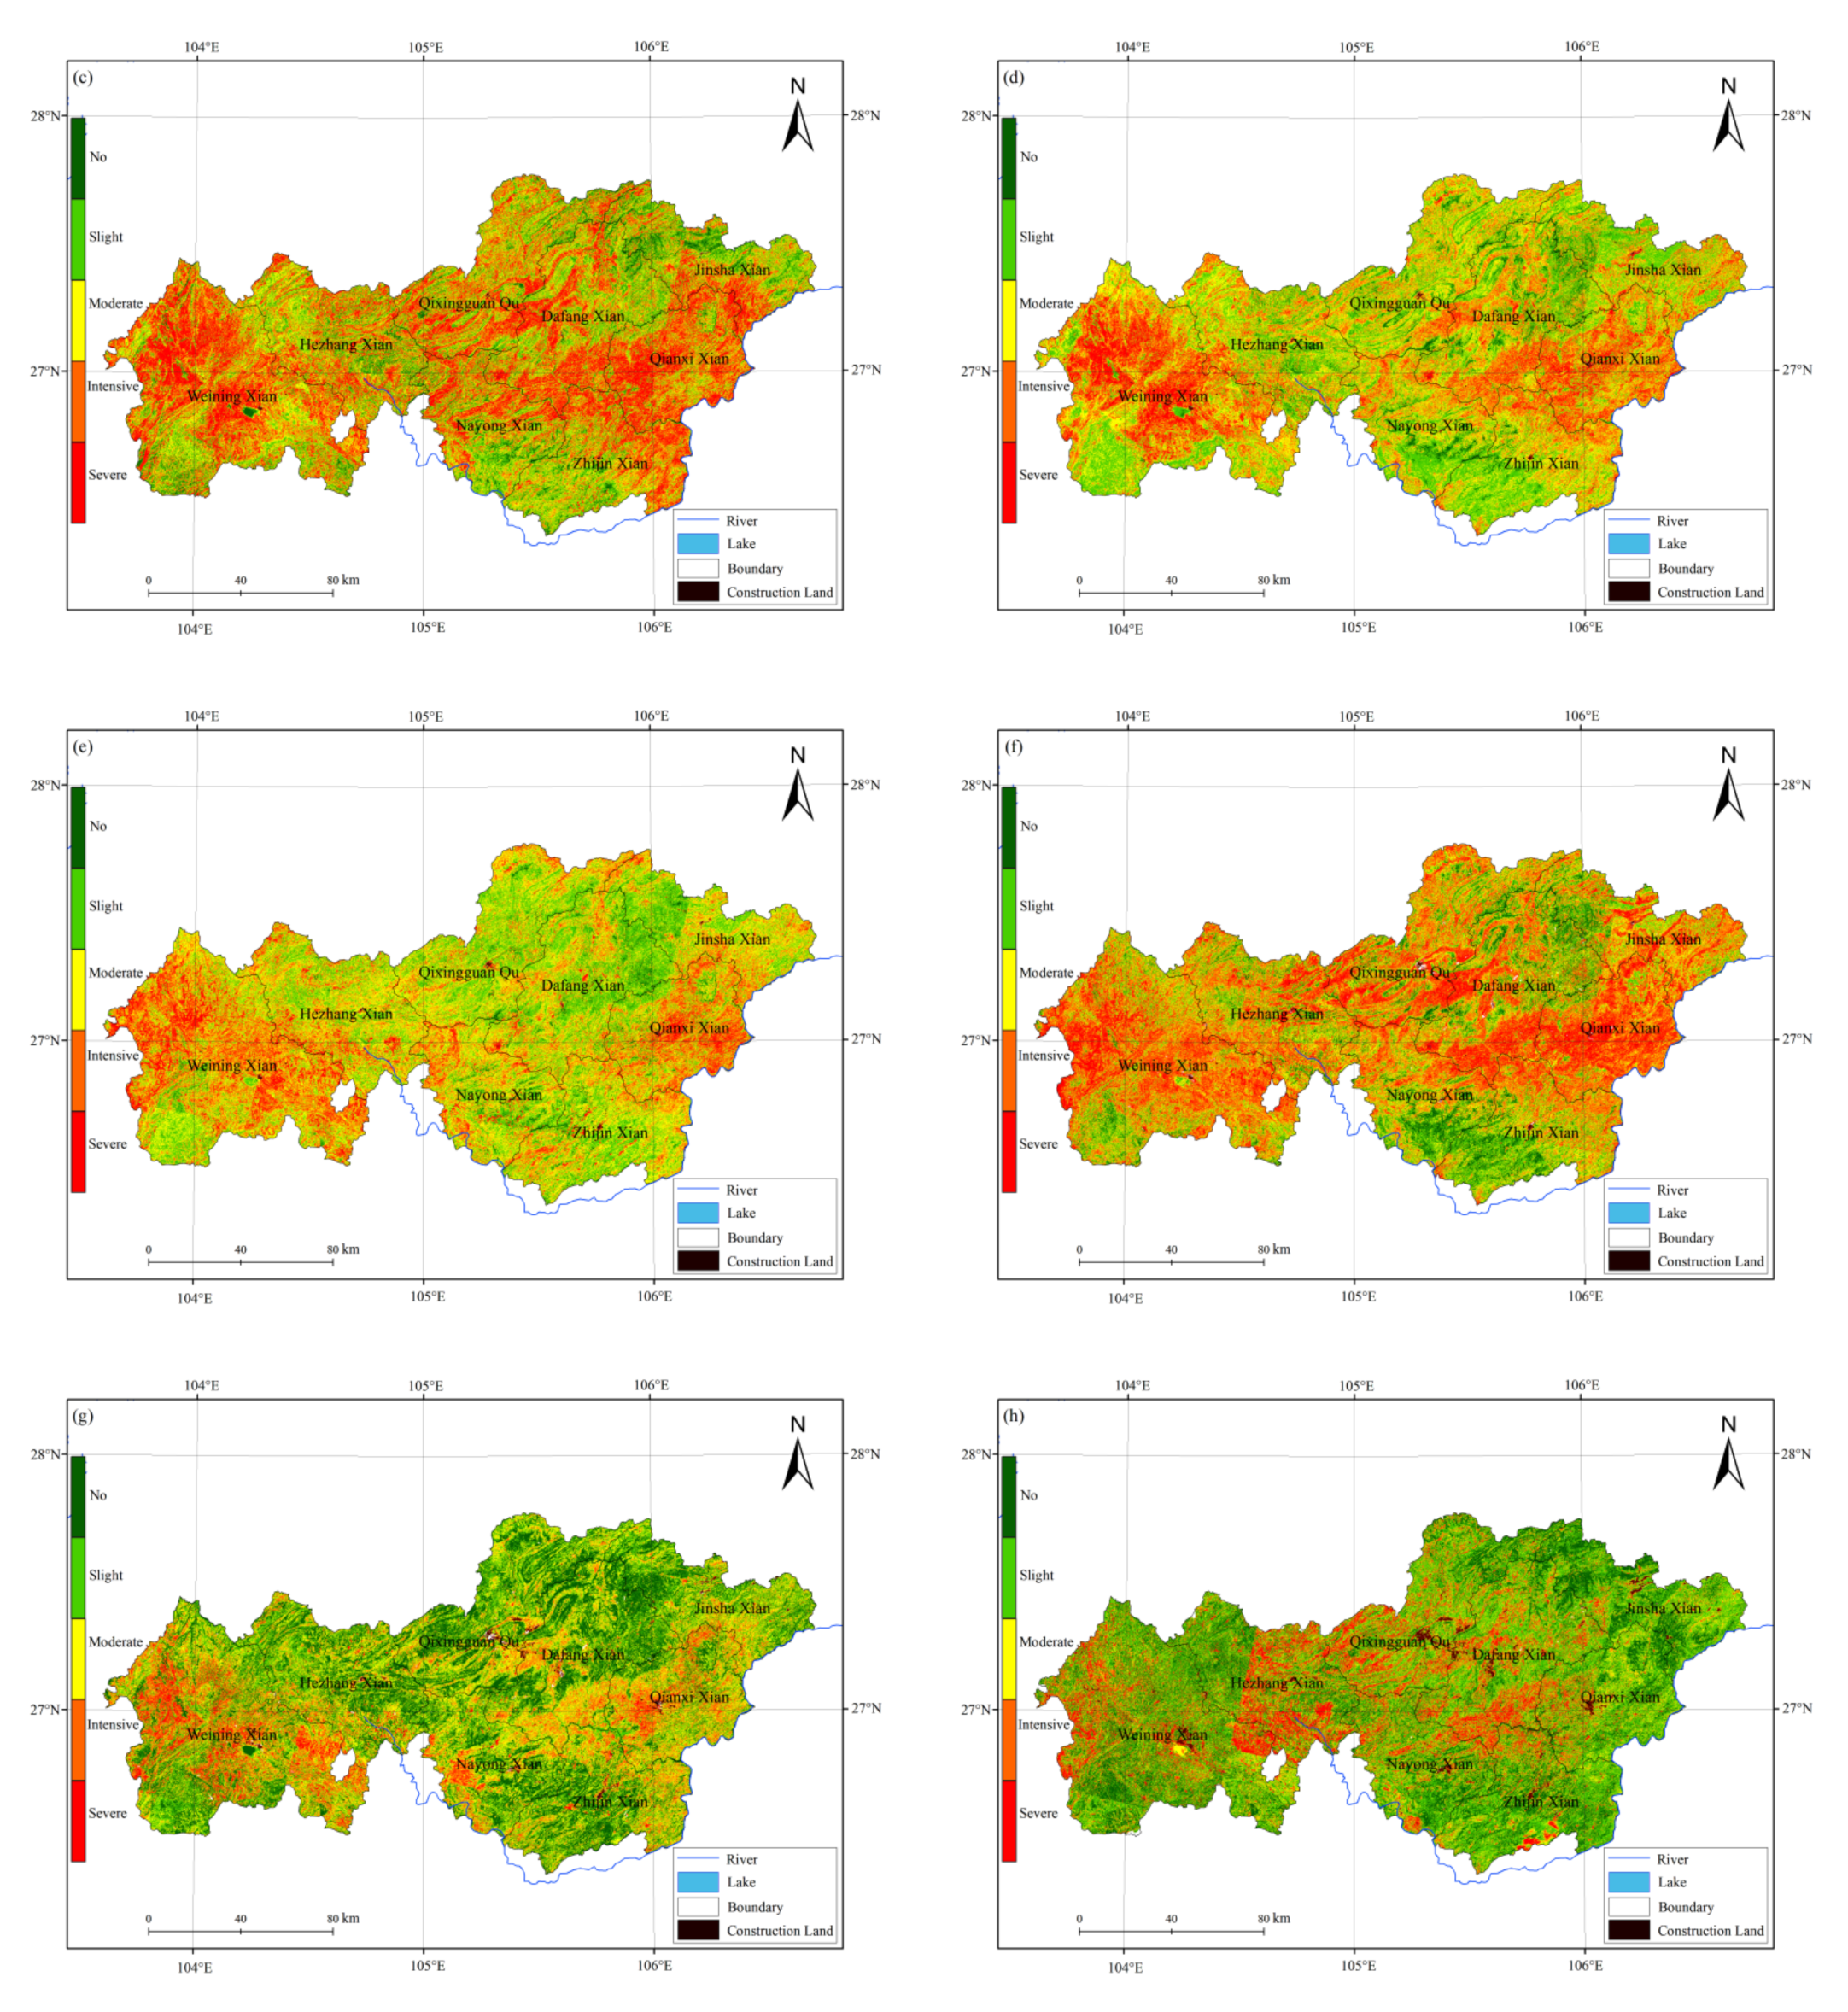
3.2. Spatial Distribution of Rocky Desertification in Different Periods

In this study, the rocky desertification indexes in 1985, 1990, 1995, 2000, 2005, 2010, 2015, and 2020 were retrieved based on the point-to-point BLI-DI feature space monitoring model. The spatial distributions and proportion of different levels of rocky desertification in different periods were obtained (Figure 6 and Table 3).
Figure 6a shows that the rocky desertification in Bijie City in 1985 was more serious in the east and west, and slighter in the middle. Zones of severe rocky desertification (1290.30 km2) were mainly distributed in the Weining Yi, Hui, and Miao Autonomous Region, Qianxi County, and northern Zhijin County. A zone of intensive rocky desertification (6686.79 km2) was mainly concentrated in southern Dafang District, eastern Jinsha County, and western Nayong County. Slight rocky desertification zones (6966.95 km2) and no rocky desertification zone (292.71 km2) were mainly distributed in eastern Dafang District, Hezhang County, Qixingguan District, and southern Zhijin County. Figure 6b shows that the rocky desertification in the central part of Bijie City aggravated in 1990, while the rocky desertification in the east and west improved. A zone of severe rocky desertification (1239.48 km2) was mainly distributed in the western Weining Yi, Hui, and Miao Autonomous Region, Hezhang County, Dafang District, Qixingguan District, Qianxi County, northern Nayong County, and northern Zhijin County. A zone of intensive rocky desertification (11,456.29 km2) was mainly distributed in eastern Jinsha County and the central of Zhijin County. Zones of slight rocky desertification (7152.62 km2) and no rocky desertification (630.37 km2) were distributed in southern Nade County, western Hezhang County, southern Zhijin County, and the southwestern Weining Yi, Hui, and Miao Autonomous Region. Figure 6c shows that the overall rocky desertification in Bijie City aggravated in 1995. A zone of severe rocky desertification (3073.94 km2) was mainly distributed in the central part of the Weining Yi, Hui, and Miao Autonomous Region, Qianxi County, northwestern Nayong County, northern Zhijin County, and southern Dafang District. An intensive rocky desertification zone (8952.3 km2) was mainly distributed in Qixingguan District and Hezhang County. Zones of slight rocky desertification (7089.45 km2) and no rocky desertification (65.65 km2) were mainly distributed in western Jinsha County, southern Nayong County, and southern Zhijin County. Figure 6d shows that the rocky desertification in Bijie in 2000 had been improved. A zone of severe rocky desertification (2549.99 km2) was distributed in the central area of the Weining Yi, Hui, and Miao Autonomous Region, Qianxi County, and southeastern Dafang District. A zone of intensive rocky desertification (9362.53 km2) was mainly distributed in western Jinsha County, northern Zhijin County, and western Dafang District. Zones of slight rocky desertification (7172.12 km2) and no rocky desertification (686.03 km2) were mainly distributed in eastern Dafang District, southern Nayong County, and southern Zhijin County. Figure 6e shows that the rocky desertification in Bijie City continued to be improved in 2005. A zone of severe rocky desertification (2381.78 km2) was mainly distributed in the junction zone of Qianxi County and the Weining Yi, Hui, and Miao Autonomous Region. A zone of intensive rocky desertification (5598.24 km2) was mainly distributed in northwestern Nayong County. Zones of slight rocky desertification (7401.95 km2) and no rocky desertification (657.07 km2) were mainly distributed in Dafang District, western Jinsha County, Qixingguan District, and central and southern Zhijin County. Figure 6f shows an aggravation trend in rocky desertification in 2010. A zone of severe rocky desertification was mainly distributed in the Weining Yi, Hui, and Miao Autonomous Region, Qixingguan District, eastern Jinsha County, Qianxi County, northern Zhijin County, and western Hezhang County. Zones of slight rocky desertification and no rocky desertification were mostly concentrated in southern Zhijin County and central and eastern Dafang District. Figure 6g shows that the rocky desertification in Bijie City showed an improvement trend in 2015. A zone of severe rocky desertification (1160.32 km2) was mainly distributed in the northwestern and southeastern Weining Yi, Hui, and Miao Autonomous Region, western Qianxi County, and western Nayong County. Zones of intensive rocky desertification (4000.87 km2) were mainly distributed in the junction zones of Qixingguan District and Dafang District. Zones of slight rocky desertification (9840.29 km2) and no rocky desertification (5321.99 km2) were mainly distributed in Qixingguan District, Dafang District, Hezhang County, and Zhijin County. Figure 6h shows that a zone of severe rocky desertification (3575.25 km2) in 2020 was mainly distributed in the western Weining Yi, Hui, and Miao Autonomous Region, southern Dafang District, and the central part of Hezhang County. A zone of intensive rocky desertification (2065.99 km2) was mainly distributed in northern Qixingguan District and western Qianxi County. Zones of slight rocky desertification (10,523.95 km2) and no desertification (5683.99 km2) were mostly distributed in Jinsha County, Zhijin County, western Hezhang County, and the northern and southern Weining Yi, Hui, and Miao Autonomous Region.

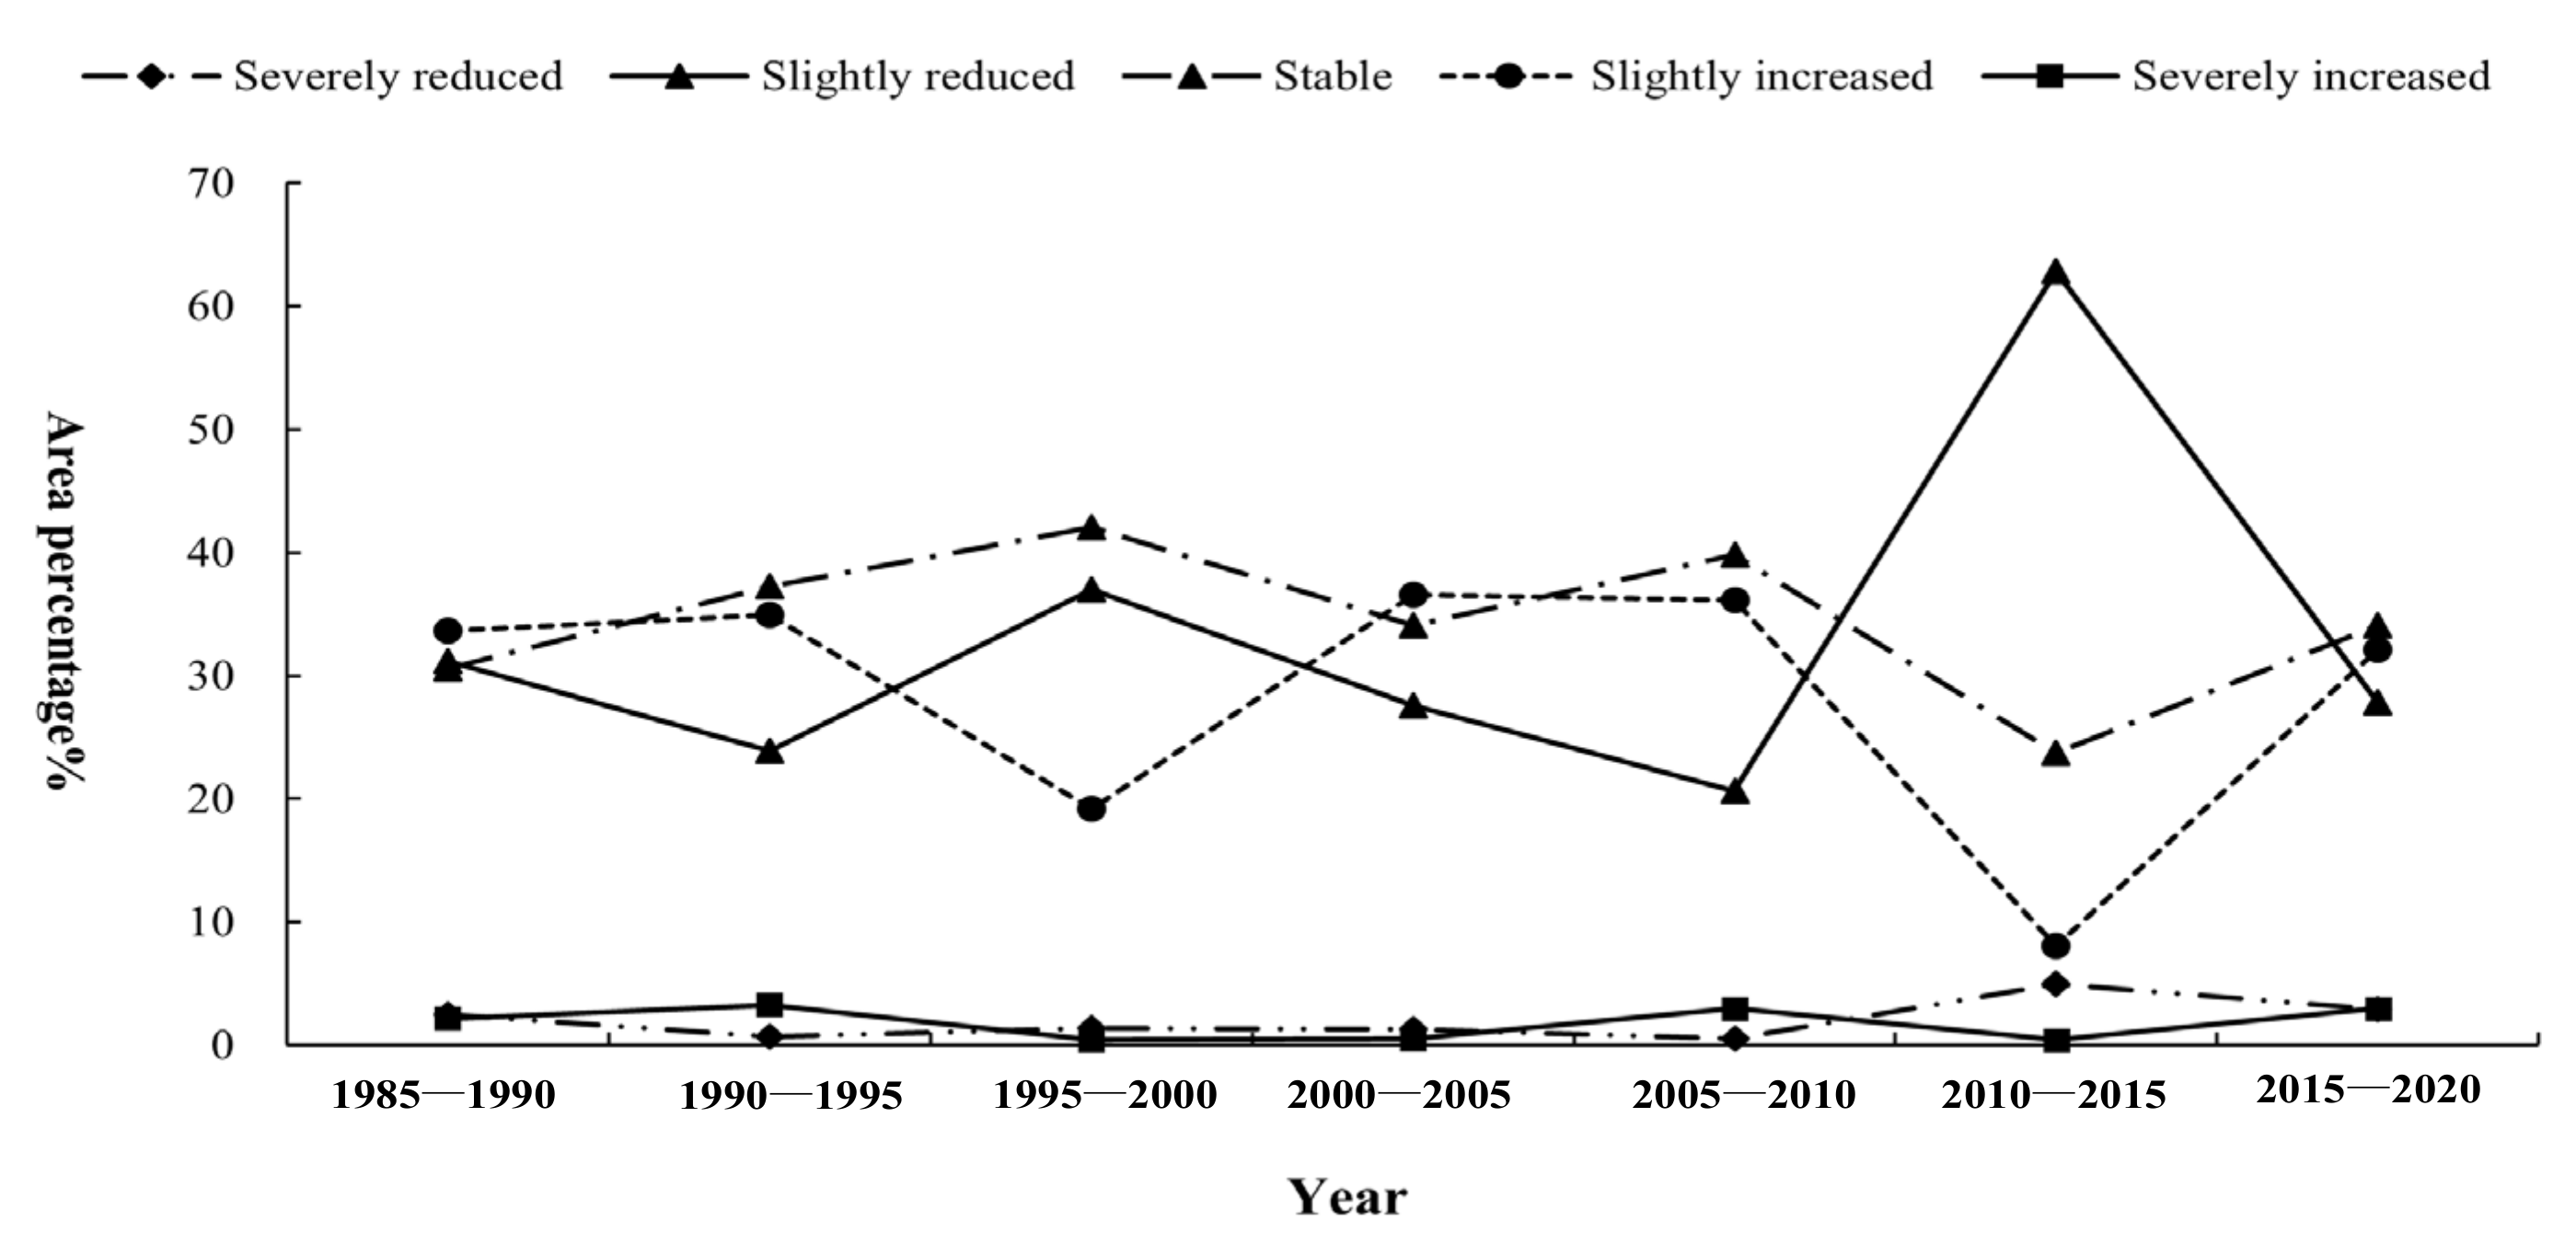
3.3. Change Intensity of Rocky Desertification in Different Historical Periods

In order to further analyze the change trend of rocky desertification in Bijie City, this study calculated and obtained the spatial distribution of the change intensity (CI) of rocky desertification and the area proportion of different levels of rocky desertification change intensity (CI ≤ −0.04 as severely reduced, −0.04 < CI ≤ −0.02 as slightly reduced, −0.02 < CI ≤ 0.02 as stable area, 0.02 < CI ≤ 0.04 as slightly increased, CI > 0.04 as severely increased) during 1985–2020 (Figure 7 and Figure 8).
Figure 8a shows that a zone of severely reduced rocky desertification in Bijie City during 1985–1990 accounted for 2.50% of the total area, mainly distributed in the western Weining Yi, Hui, and Miao Autonomous Region and Jinsha County. A zone of slightly reduced rocky desertification was mainly distributed in the southeastern Weining Yi, Hui, and Miao Autonomous Region, northern Qixingguan District, and western Jinsha County, accounting for 31.13% of the total area. The stable zone was mainly distributed in the northern Weining Yi, Hui, and Miao Autonomous Region and northeastern Zhijin County, accounting for 30.57% of the total area. Zones of slightly and severely increased rocky desertification were mainly distributed in the central parts of Bijie City, including Qixingguan District and Dafang District, accounting for 35.8% of the total area.
Figure 8b shows that a zone of severely reduced rocky desertification in Bijie City during 1990–1995 was mainly located in northeastern Jinsha County and the northern Weining Yi, Hui, and Miao Autonomous Region, accounting for 0.69% of the study area. The slightly reduced zone was mainly distributed in the central part of Bijie City, including Qixingguan District, eastern Dafang District, and northern Nayong County, accounting for 23.89% of the total area. The stable zone was mainly distributed in Qixingguan District and Dafang District, accounting for 37.21% of the total area. Zones of slightly increased and severely increased rocky desertification were mainly distributed in the junction area of the Weining Yi, Hui, and Miao Autonomous Region, Nayong County, Jinsha County, and Qianxi County, accounting for 38.31% of the total area of the study area.
Figure 8c shows that a zone of severely reduced rocky desertification in Bijie City accounted for 1.34% of the total area, which was mainly distributed in the junction area of Jinsha County, Qianxi County, and northwestern Qixingguan District. A zone of slightly reduced rocky desertification was mainly distributed in the central and eastern parts, including Qixingguan District, eastern Hezhang County, Dafang District, Nayong County, Zhijin County, Qianxi County, and Jinsha County, accounting for 37.02% of the total area. The stable zone was mainly concentrated in the central and eastern Weining Yi, Hui, and Miao Autonomous Region, Nayong County and southern Zhijin County, accounting for 42.08% of the total area. Zones of slightly increased and severely increased rocky desertification accounted for 19.56% of the total area of the study area.
Figure 8d shows that during 2000–2005, a zone of severely reduced rocky desertification was mainly concentrated in the central parts of the Weining Yi, Hui, and Miao Autonomous Region, southern Dafang District, and Dafang County, accounting for 1.28% of the total area. Zone that was slightly reduced decreased, accounting for 27.61% of the total area of the study area, mainly distributed in central Qixingguan District, northern Zhijin County, and western Qianxi County. The stable zone was mainly distributed in the southwestern Weining Yi, Hui, and Miao Autonomous Region, northern Jinsha County, and the junction area of Hezhang County and Qixingguan District, accounting for 34.04% of the total area. Zones that were severely increased and slightly increased were mainly distributed in the northwestern and southeastern Weining Yi, Hui, and Miao Autonomous Region, southern Hezhang County, Nayong County, and southwestern Zhijin County.
Figure 8e shows that a zone of severely reduced rocky desertification was mainly distributed in southern Nayong County and southern Zhijin County, accounting for 0.51% of the total area. The slightly reduced zone was mainly distributed in southern Dafang District, western Jinsha County, and northeastern Qixingguan District, accounting for 20.62% of the total area. The stable zone accounted for 39.78%, which was mainly distributed in the northern Weining Yi, Hui, and Miao Autonomous Region, northwestern Hezhang County, and eastern Qianxi County. The slightly and severely increased zones were mainly distributed in southern Dafang District, Hezhang County, Qixingguan District, western Qianxi County, and northwest Zhijin County.
As shown in Figure 8f, the severely reduced zone of rocky desertification during 2010–2015 was mainly distributed in the central parts of the Weining Yi, Hui, and Miao Autonomous Region and northern Jinsha County. The slightly reduced zone was mainly concentrated in Hezhang County, Qixingguan District, Dafang District, Jinsha County, and Qianxi County. Zones of slightly increased and severely increased rocky desertification were mainly distributed in Nayong County and southern Zhijin County, accounting for 8.47% of the total area.
Figure 8g shows that zone of severely reduced rocky desertification from 2015 to 2020 was mainly distributed in the central parts of the Weining Yi, Hui, and Miao Autonomous Region, accounting for 2.95% of the total area. The slightly reduced zone was mainly concentrated in western Hezhang County, southwestern Nayong County, Qianxi County, and southern Jinsha County, accounting for 27.86% of the total area. The severely and slightly increased zones were mainly distributed in southwestern Qixingguan District and eastern Hezhang County, accounting for 35.08% of the total area.

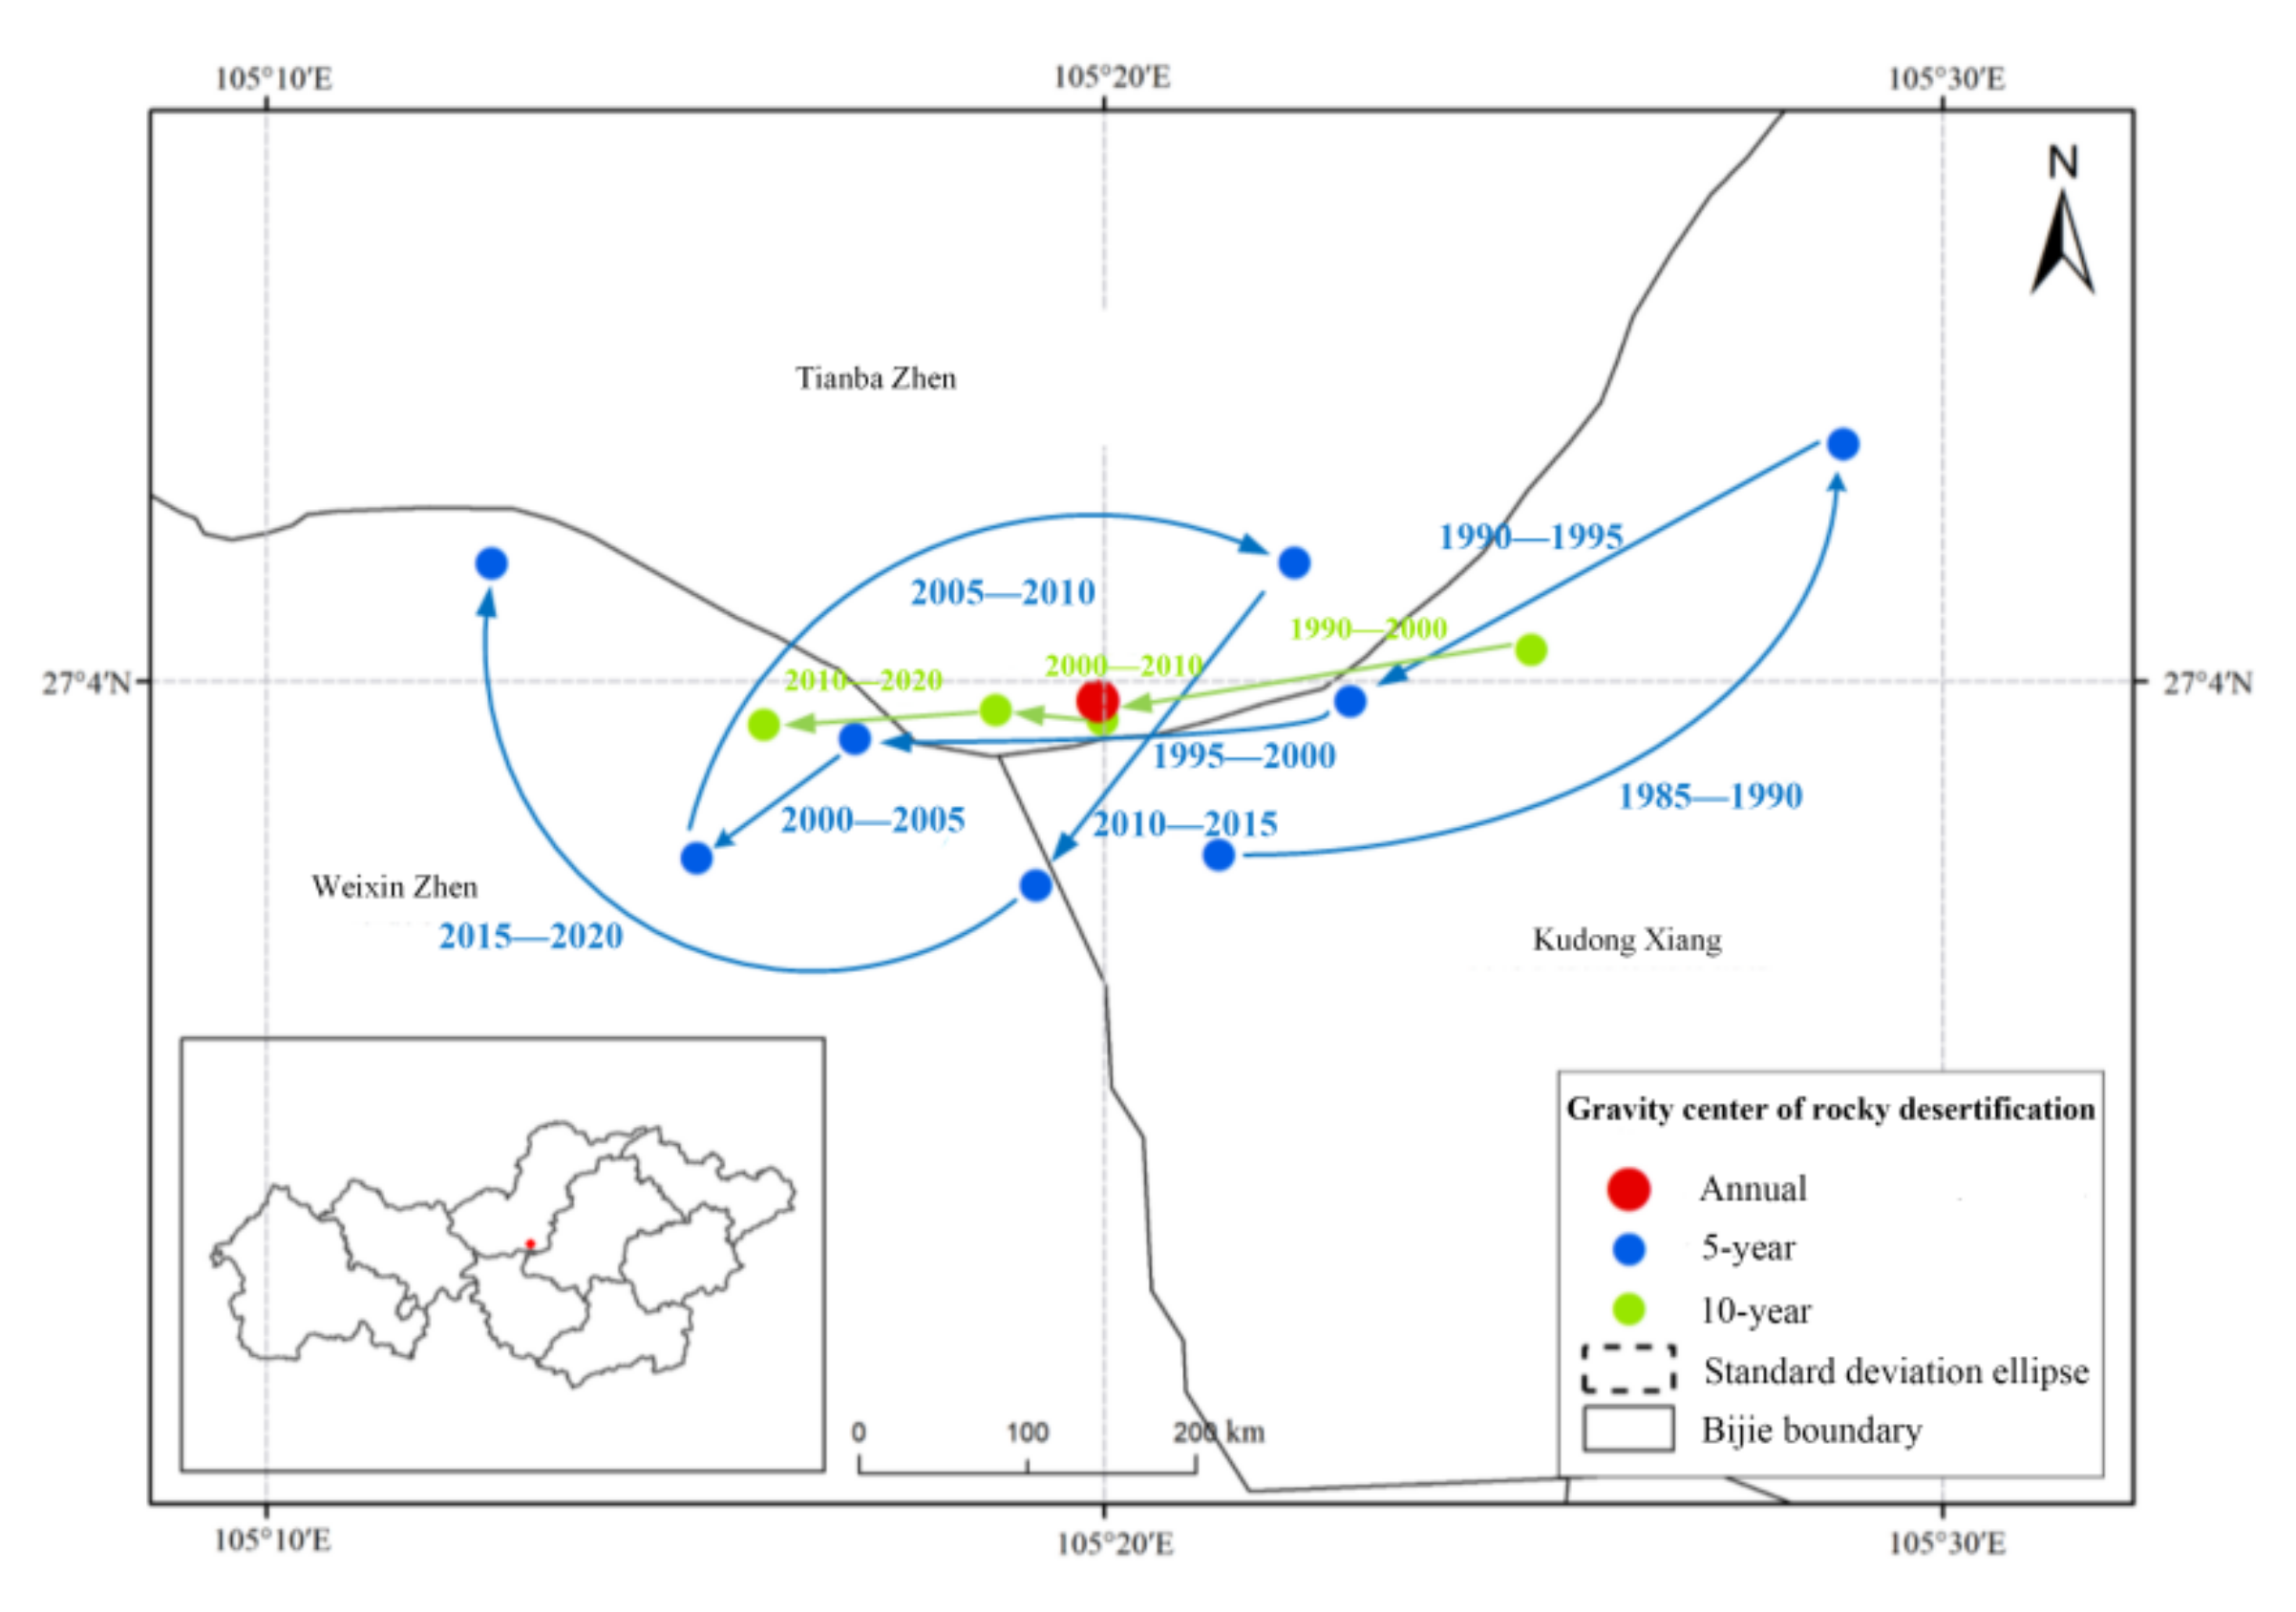
3.4. Gravity Center Migration Trajectory of Rocky Desertification in Different Historical Periods

In order to better analyze the internal temporal and spatial heterogeneity of rocky desertification changes, the gravity center migration trajectory of rocky desertification in the past 35 years was calculated and analyzed at scales of 5 and 10 years (Figure 9). During 1985–2020, the gravity center of rocky desertification in Bijie City generally moved westward. At a 5-year scale, compared with that of 1980–1985, the gravity center of rocky desertification during 1985–1990 shifted northeastward, indicating that the aggravating degree of rocky desertification in northeastern parts was greater than that in southwestern parts during 1985–1990. Compared with that of 1985–1990, the gravity center of rocky desertification in Bijie City shifted southwestward during 1990–1995, indicating that the aggravating degree of rocky desertification in southwestern parts was greater than that in northeastern parts during 1990–1995. Compared with that of 1990–1995, the gravity center of rocky desertification in Bijie City shifted westward during 1995–2000, indicating that the aggravating degree of rocky desertification in western parts was greater than that in eastern parts during 1995–2000. Compared with that of 1995–2000, the gravity center of rocky desertification shifted southwestward during 2000–2005, indicating that the aggravating degree of rocky desertification in southwestern parts was greater than that in northeastern parts during this period. Compared with that of 2000–2005, the gravity center of rocky desertification shifted northeastward during 2005–2010, indicating that the aggravating degree of rocky desertification in northeastern parts was greater than that in southwestern parts during 2005–2010. Compared with that of 2005–2010, the gravity center of rocky desertification shifted southwestward during 2010–2015, indicating that the aggravating degree of rocky desertification in southwestern parts was greater than that in northeastern parts during 2010–2015. Compared with that of 2010–2015, the gravity center of rocky desertification shifted northwestward during 2015–2020, indicating that the aggravating degree of rocky desertification in northwestern parts was greater than that in southeastern parts during 2015–2020. At a 10-year scale, the gravity center of rocky desertification shifted northwestward during 1990–2000 compared with that of 1980–1990, indicating that the aggravating degree of rocky desertification in northwestern parts was greater than that in southeastern parts during 1990–2000. The gravity center of rocky desertification shifted westward during 2000–2010 compared with that of 1990–2000, indicating that the aggravating degree of rocky desertification in western parts was greater than that in eastern parts during 2000–2010. Compared with that of 2000–2010, the gravity center of rocky desertification shifted westward during 2010–2020, indicating that the aggravating degree of rocky desertification in the western region was greater than that in the eastern region during 2010–2020. During 1985–2020, the gravity center of rocky desertification in Bijie shifted westward, indicating that the aggravating degree of rocky desertification in the western region of Bijie was greater than that in the eastern region.

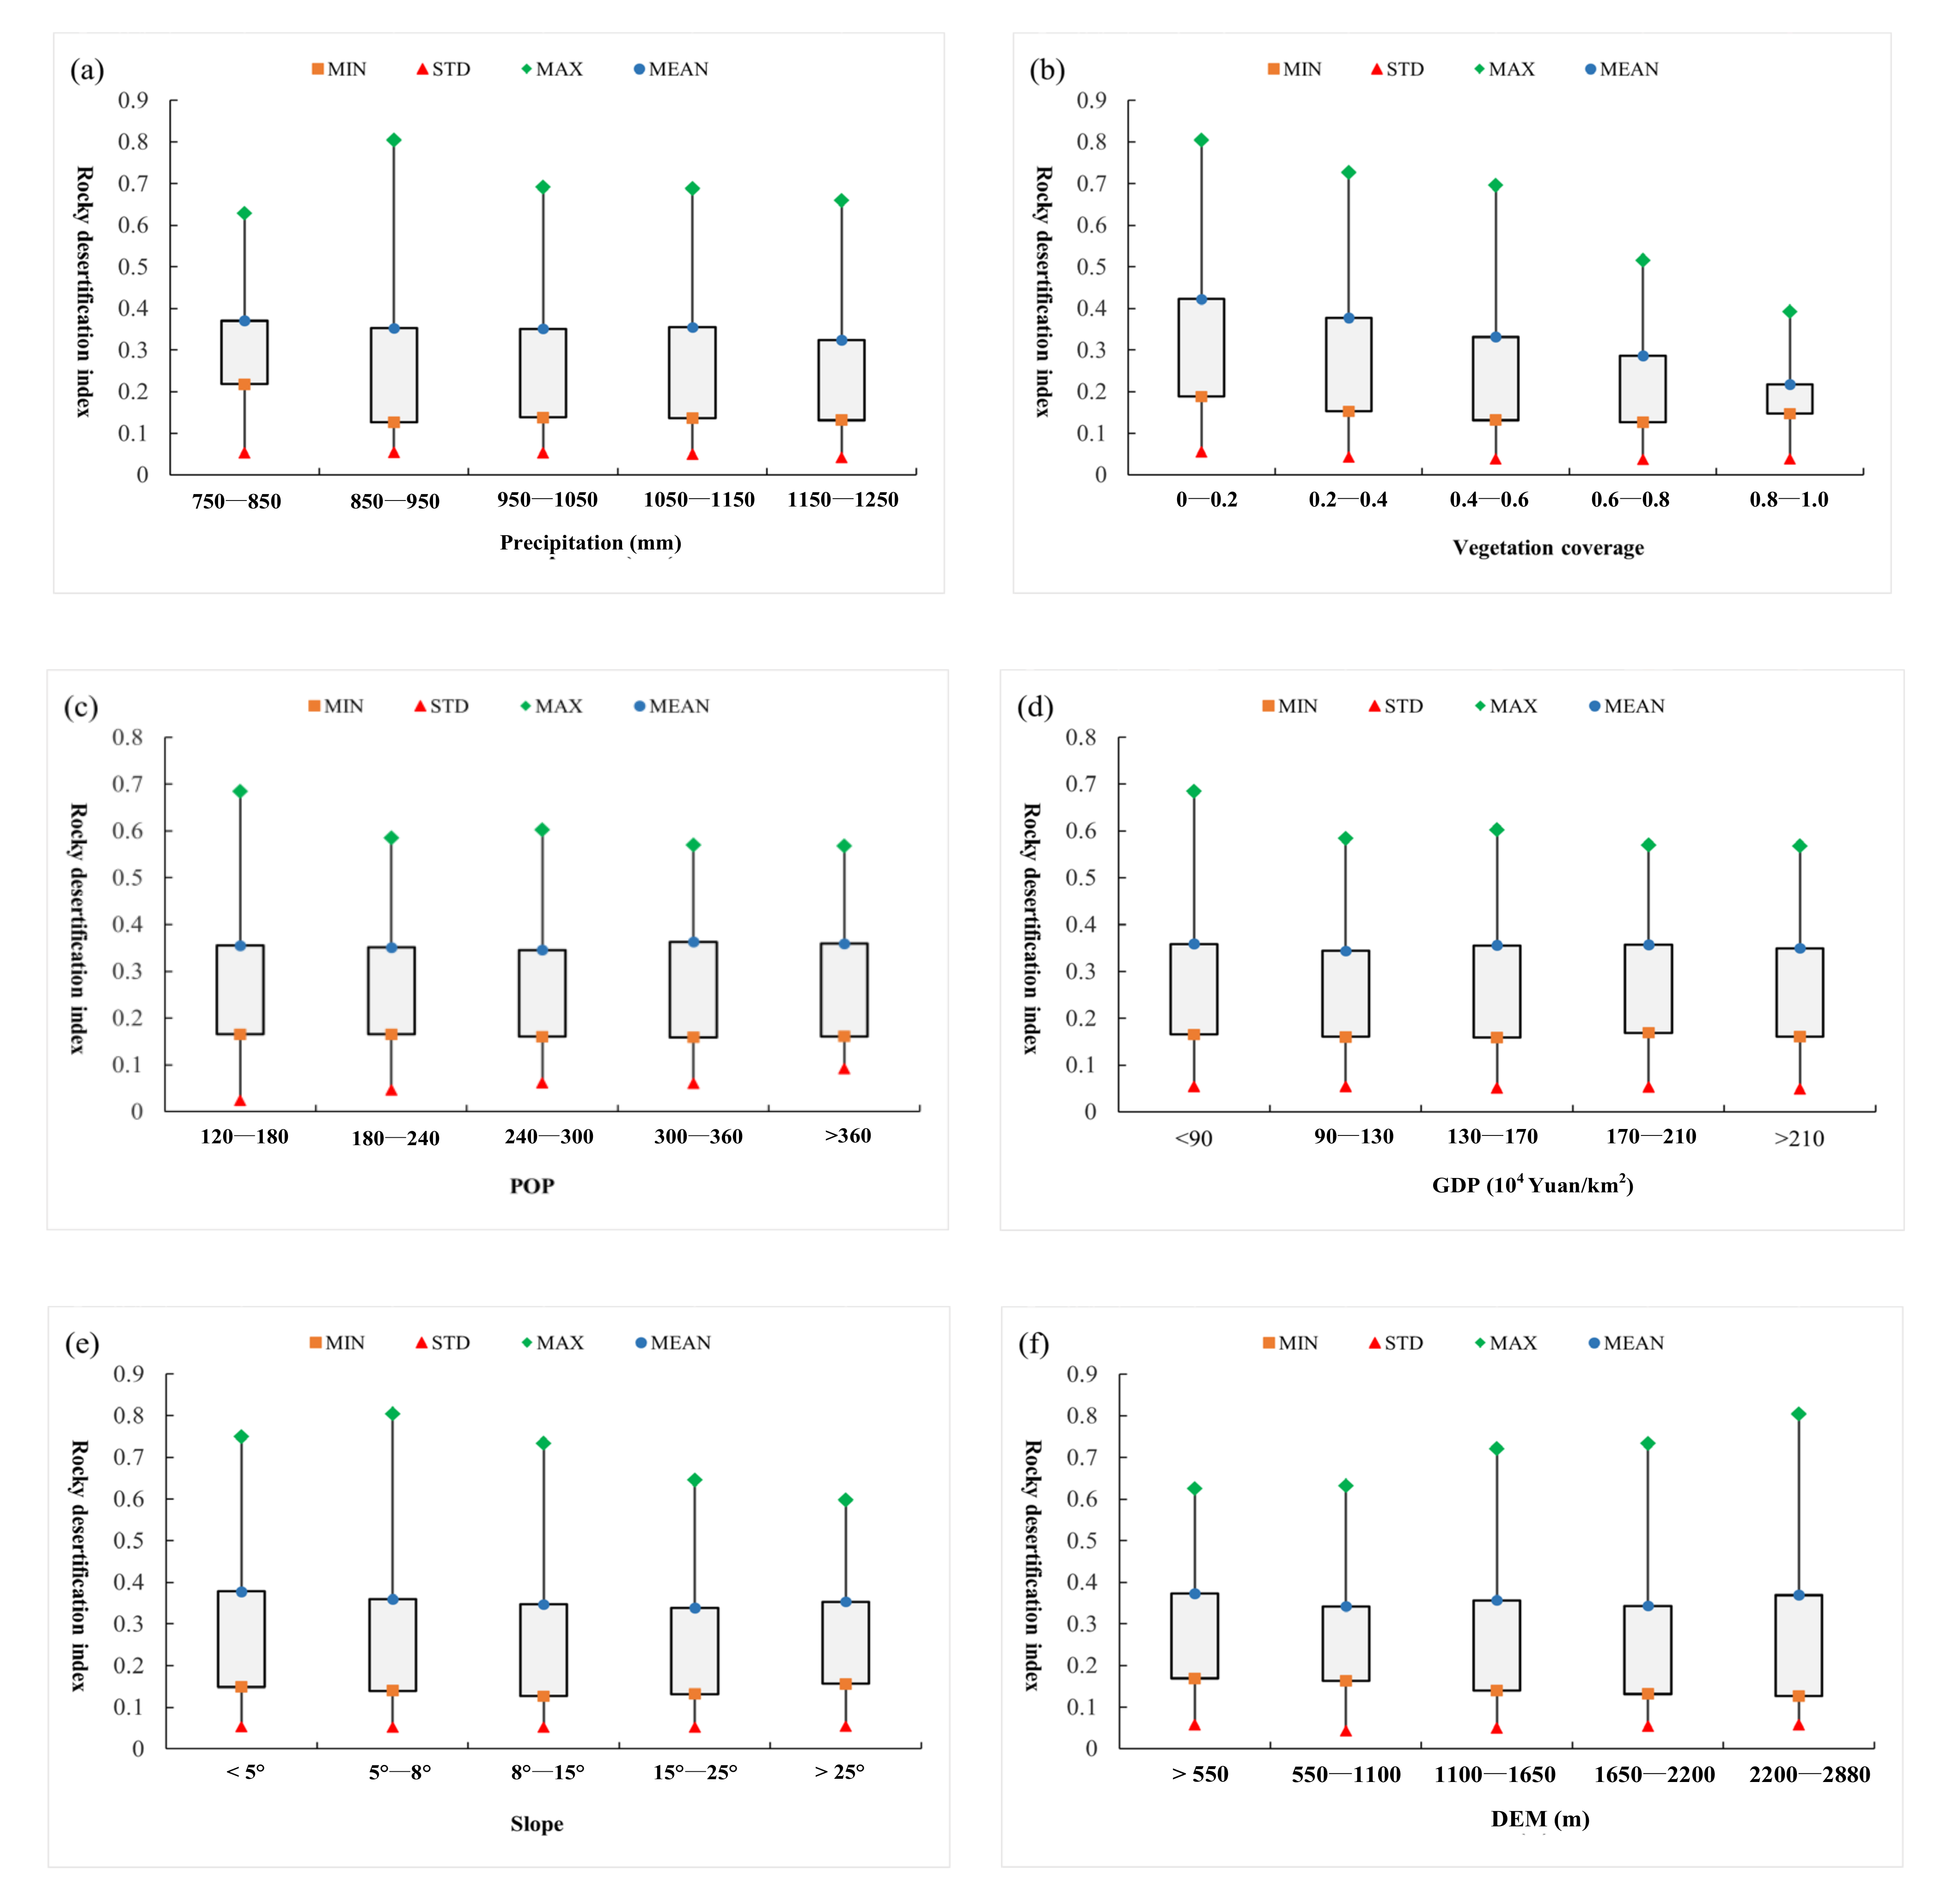
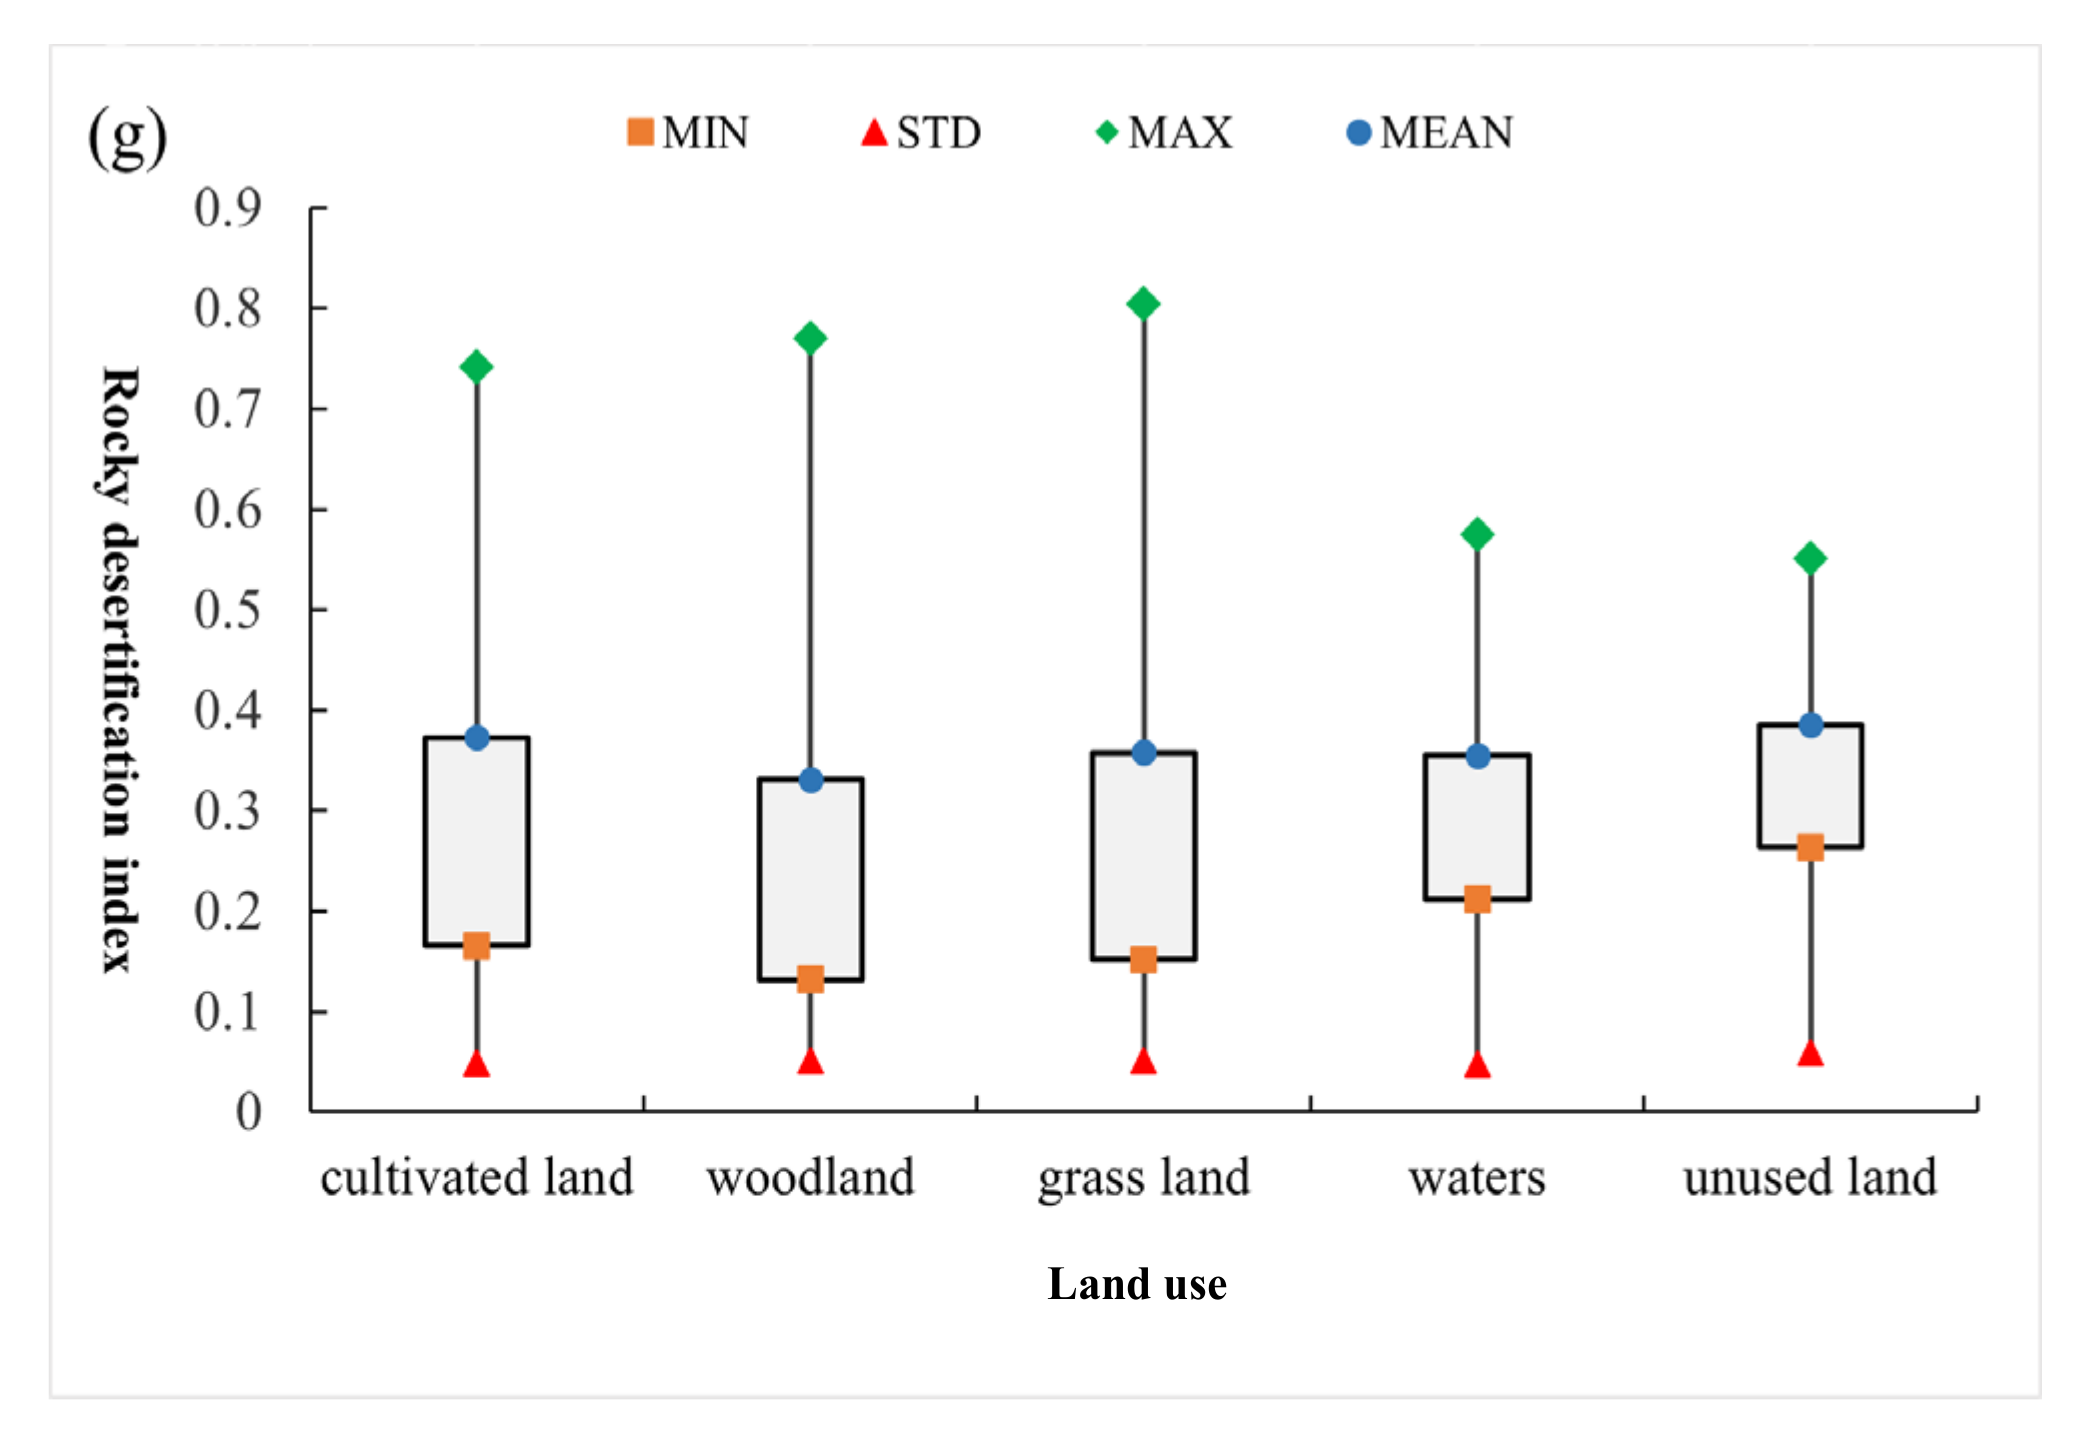
3.5. Single Driving Factor Analysis

In order to explore the influence mechanism of different factors on the evolution of rocky desertification, this study selected eight typical factors, including precipitation, temperature, vegetation coverage, population (POP) density, gross domestic product (GDP) density, slope, elevation, and land use, to analyze the correlations. Figure 10a shows that the standard deviation of the rocky desertification index in precipitation zones of 1150–1250 mm was the smallest, indicating that the homogeneity of spatial distribution of rocky desertification in this zone was higher. The average index of rocky desertification at a precipitation zone of 750–850 mm was the largest, indicating that the rocky desertification in this area was the most serious. Figure 10b shows that the average index and standard deviation of rocky desertification at a vegetation coverage zone of 0.8–1 were the smallest, indicating that the rocky desertification in high vegetation areas was generally slighter. Figure 10c shows that with the increase in population density, the average rocky desertification index first decreased and then increased, while the rocky desertification index was the smallest in zones with 240–300 person/km2. The standard deviation of the rocky desertification index showed an increasing trend with the enlargement of population density, indicating that the spatial heterogeneity of regional rocky desertification became greater with the increasing human disturbance intensity. Figure 10d shows that the average rocky desertification index decreased first, then increased, and finally, decreased, while the rocky desertification index was relatively smaller in zones of 900,000–1,300,000 Yuan/km2, which indicated that with the increase in human disturbance intensity, the rocky desertification became more serious. However, positive interference, such as ecological protection, gradually became the dominant factor when the economic development reached a certain level, which contributed to the improvement of rocky desertification. As shown in Figure 10e, the average rocky desertification index first decreased and then increased with the enlargement of the slope, and the average rocky desertification index was the smallest at a slope zone of 15°–25°. Figure 10f shows that the average rocky desertification index fluctuated with the increase in elevation, which indicated that moderate and severe rocky desertification occurred mostly in middle- and high-elevation zones. Figure 10g shows that the average index and standard deviation of rocky desertification in unused land were the largest, while the rocky desertification in forest land was relatively slighter.
In addition, this study utilized GeoDetector to analyze and determine the dominant influencing factors (elevation, aspect, temperature, land use, slope, precipitation, population density, vegetation coverage, GDP density) of rocky desertification in Bijie City in 1985, 1990, 1995, 2000, 2005, 2010, 2015, and 2020. The dominant factors were identified and displayed in Figure 11: 1985 (vegetation coverage, q = 0.93), 1990 (vegetation coverage, q = 0.94), 1995 (land use, q = 0.90), 2000 (air temperature, q = 0.97), 2005 (vegetation coverage, q = 0.95), 2010 (vegetation coverage, q = 0.92), 2015 (POP density, q = 0.94), and 2020 (POP density, q = 0.94). During the past 35 years, the dominant driving factor in the evolution of rocky desertification in Bijie City shifted from natural factor to human activity factor.

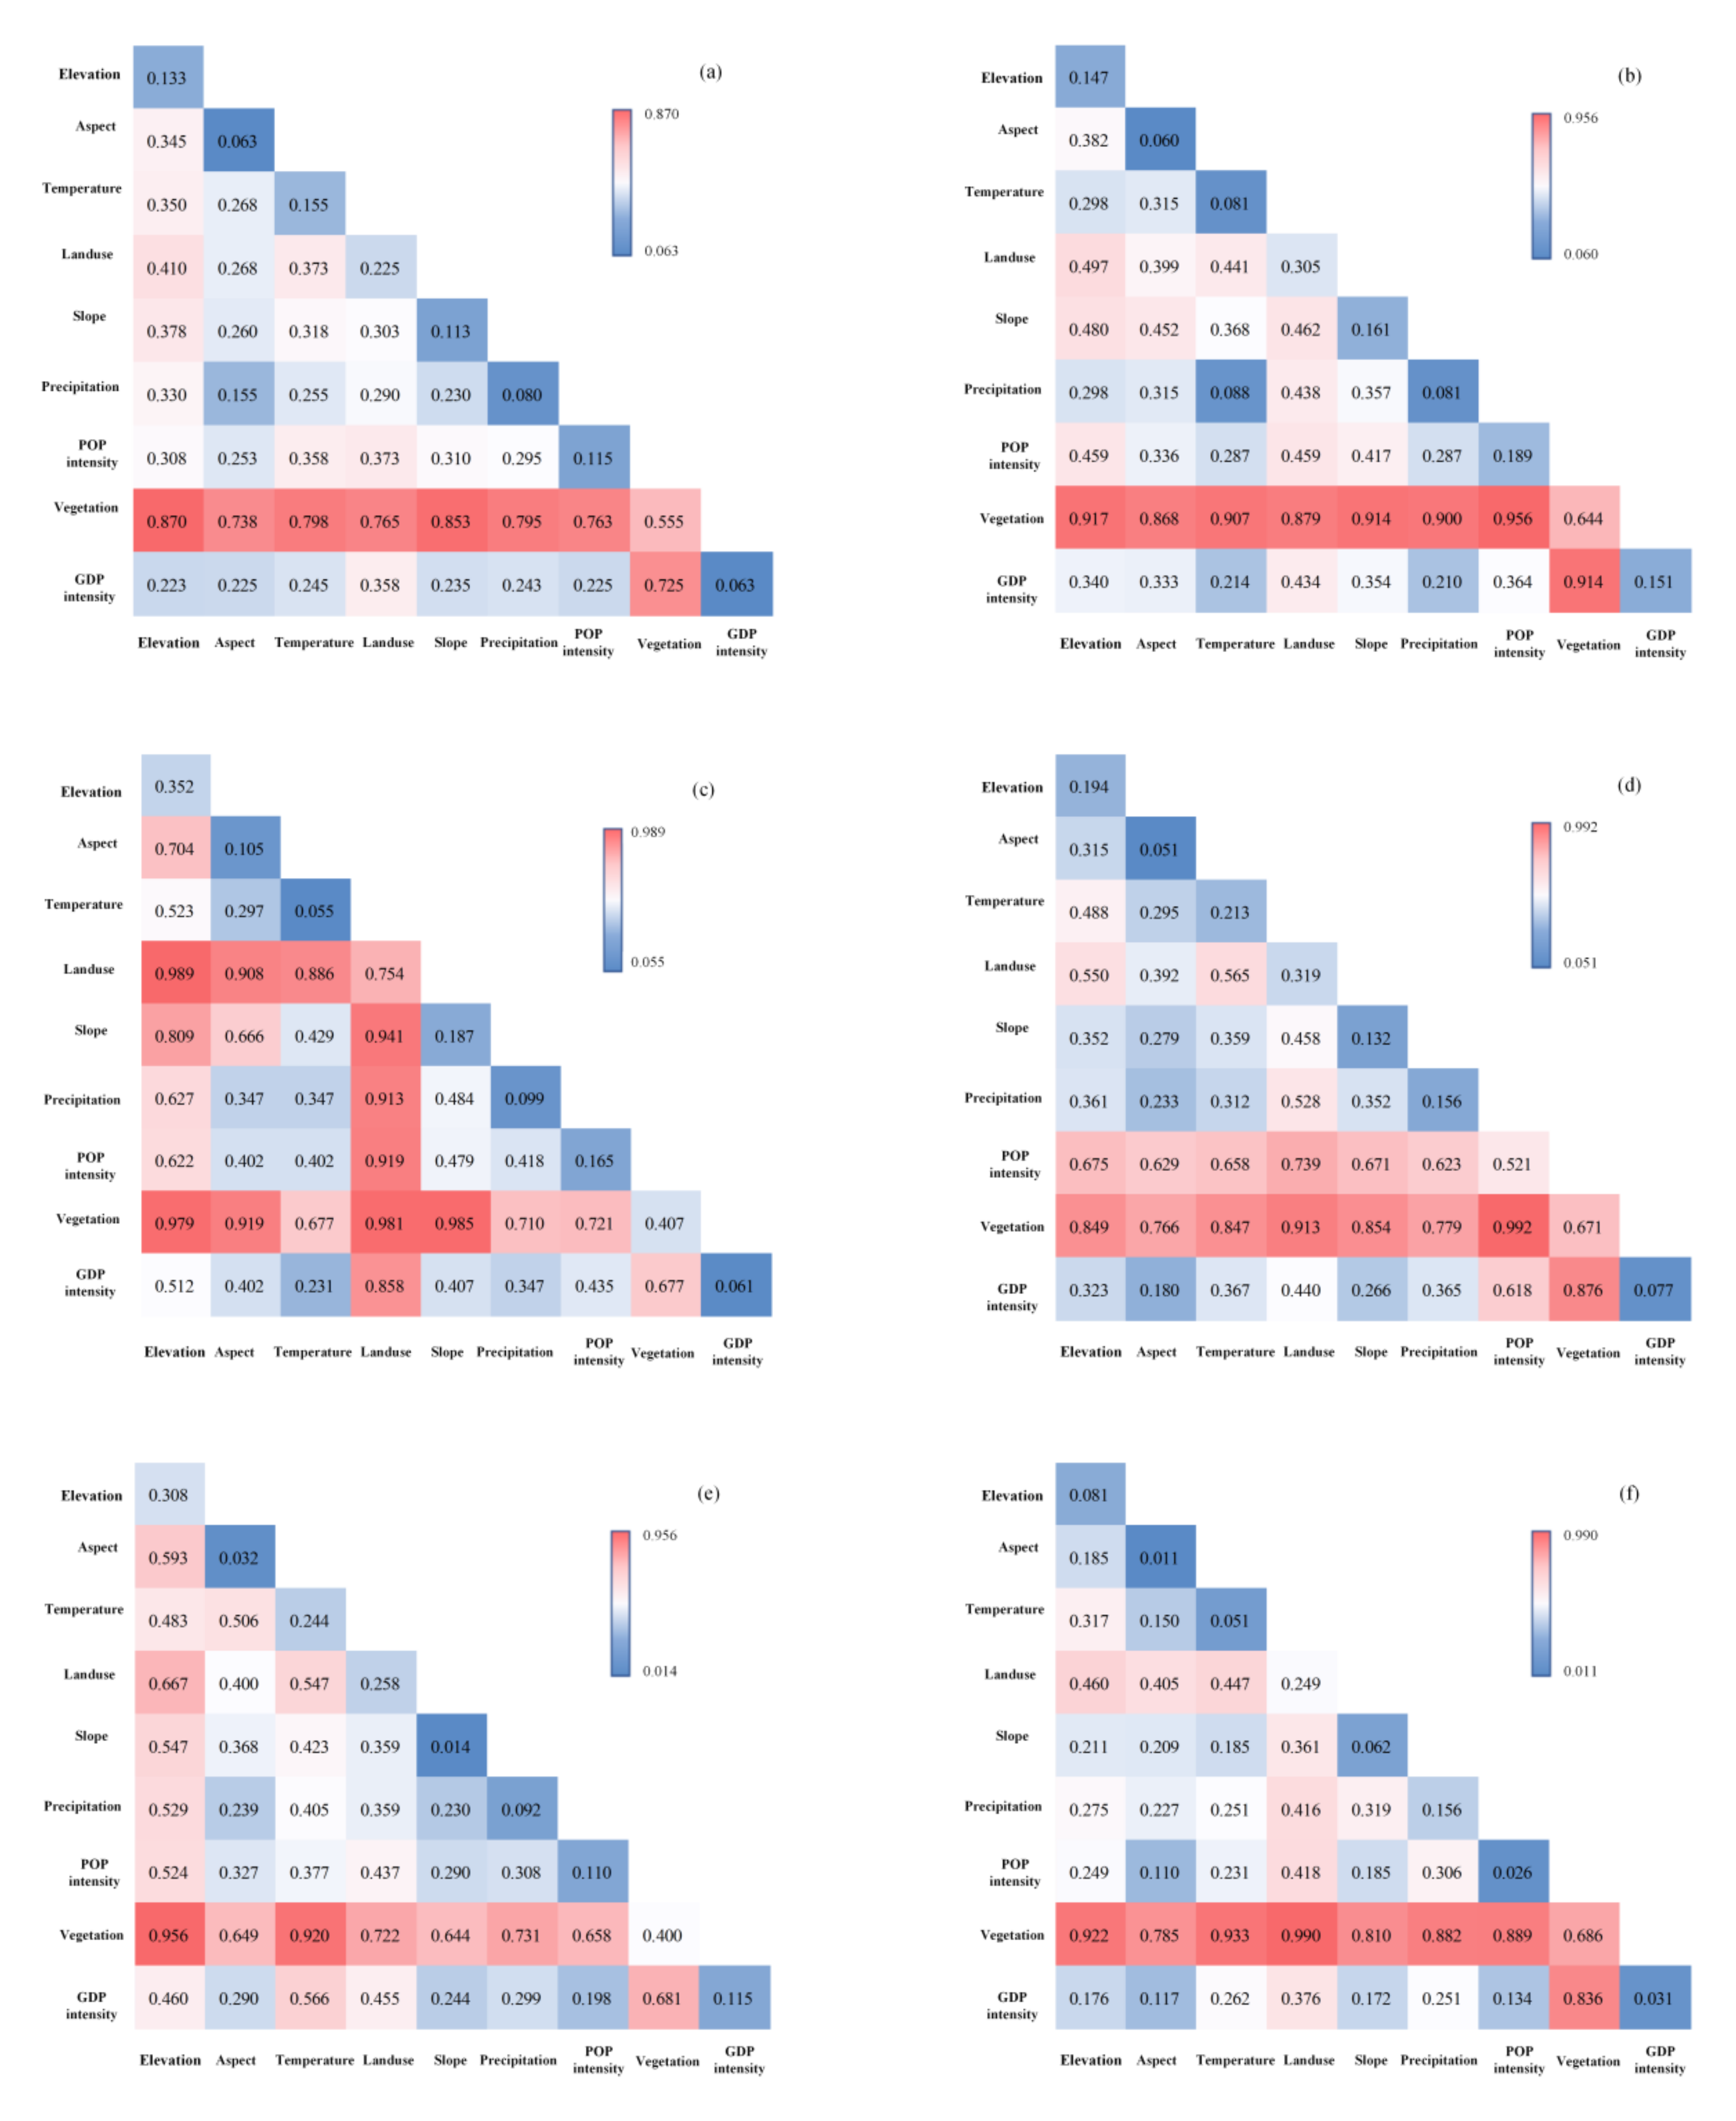
3.6. Interactive Factor Analysis

Since the process of rocky desertification was affected by the interaction of different types of factors, this study utilized the interactive factor detector of GeoDetector to analyze and determine the dominant interactive factor of rocky desertification in different historical periods.
As shown in Figure 12a, the interactive factors in the evolution of rocky desertification in 1985 were as follows, according to q value: vegetation coverage ∩ elevation (0.870) > vegetation coverage ∩ slope (0.853) > vegetation coverage ∩ temperature (0.798) > vegetation coverage ∩ precipitation (0.795) > vegetation coverage ∩ land use (0.765) > vegetation coverage ∩ POP density (0.763) > vegetation coverage ∩ aspect (0.738) > GDP density ∩ vegetation coverage (0.725). The vegetation coverage ∩ elevation had the largest contribution rate with a q value of 0.870, which was the dominant interactive factor in the evolution process of rocky desertification. As shown in Figure 12b, the interactive factors of the evolution of rocky desertification in 1990 were as follows according to the q value: vegetation coverage ∩ POP density (0.956) > vegetation coverage ∩ elevation (0.917) > vegetation coverage ∩ slope (0.914) = GDP density ∩ vegetation coverage (0.914) > vegetation coverage ∩ temperature (0.907) > vegetation coverage ∩ precipitation (0.900) > vegetation coverage ∩ land use (0.879) > vegetation coverage ∩ slope (0.868). Among them, the q value of the vegetation coverage ∩ POP density interactive factor was the largest at 0.956, which indicated that vegetation coverage ∩ POP density had the strongest explanatory power for the evolution of rocky desertification. Figure 12c shows that the interactive factors in 1995 were as follows according to the q value: land use ∩ elevation (0.989) > vegetation coverage ∩ slope (0.985) > vegetation coverage ∩ land use (0.981) > vegetation coverage ∩ elevation (0.979) > slope ∩ land use (0.941) > vegetation coverage ∩ aspect (0.919) = POP density ∩ land use (0.919) > precipitation ∩ land use (0.913) > land use ∩ temperature (0.8861) > GDP density ∩ land use (0.858). The land use ∩ elevation interactive factor had the largest q value of 0.989, so it had the strongest explanatory power for rocky desertification evolution. As shown in Figure 12d, the interactive factors in the evolution of rocky desertification in 2000 were as follows according to the q value: vegetation coverage ∩ POP density (0.992) > vegetation coverage ∩ land use (0.913) > GDP density ∩ vegetation coverage (0.876) > vegetation coverage ∩ slope (0.854) > vegetation coverage ∩ elevation (0.849) > vegetation coverage ∩ temperature (0.847) > vegetation coverage ∩ precipitation (0.779) > vegetation coverage ∩ slope (0.766) > POP density ∩ land use (0.739) > POP density ∩ elevation (0.675). The q value of the vegetation coverage ∩ POP density interactive factor was the largest at 0.992, which indicated that vegetation coverage ∩ POP density had the strongest explanatory power for rocky desertification evolution. Figure 12e shows that the interactive factors in the evolution of rocky desertification in 2005 were as follows: vegetation coverage ∩ elevation (0.956) > vegetation coverage ∩ temperature (0.920) > vegetation coverage ∩ precipitation (0.731) > vegetation coverage ∩ land use (0.722) > GDP density ∩ vegetation coverage (0.6818) > land use ∩ elevation (0.667) > vegetation coverage ∩ POP density (0.6583) > vegetation coverage ∩ slope (0.644). The vegetation coverage ∩ elevation interactive factor had the largest q value, and it had the strongest explanatory power for the evolution process of rocky desertification. As shown in Figure 12f, the interactive factors in the evolution of rocky desertification in 2010 were as follows according to the q value: vegetation coverage ∩ land use (0.990) > vegetation coverage ∩ air temperature (0.933) > vegetation coverage ∩ elevation (0.922) > vegetation coverage ∩ POP density (0.889) > vegetation coverage ∩ precipitation (0.882) > GDP density ∩ vegetation coverage (0.836) > vegetation coverage ∩ slope (0.810) > vegetation coverage ∩ slope (0.785) > land use ∩ elevation (0.460). Among them, the q value of vegetation coverage ∩ land use was the largest, which indicated that it had the strongest explanatory power for rocky desertification. Figure 12g shows that the interactive factors in the evolution of rocky desertification in 2015 were as follows according to the q value: land use ∩ vegetation coverage (0.966) > vegetation coverage ∩ elevation (0.837) > vegetation coverage ∩ slope (0.753) > vegetation coverage ∩ precipitation (0.747) > vegetation coverage ∩ temperature (0.735) > vegetation coverage ∩ POP density (0.717) > vegetation coverage ∩ slope (0.705) > GDP density ∩ vegetation coverage (0.687) > land use ∩ elevation (0.675) > land use ∩ temperature (0.645) > slope ∩ land use (0.597). The q value of land use ∩ vegetation coverage was the largest (0.966), which had the strongest explanatory power for rocky desertification. As shown in Figure 12h, the interactive factors in the evolution of rocky desertification in 2020 were as follows according to the q value: vegetation coverage ∩ land use (0.949) > vegetation coverage ∩ slope (0.790) > vegetation coverage ∩ slope (0.764) > vegetation coverage ∩ elevation (0.762) = vegetation coverage ∩ air temperature (0.762) > vegetation coverage ∩ precipitation (0.725) > GDP density ∩ vegetation coverage (0.703) > POP density ∩ vegetation coverage (0.689). The q value of vegetation coverage ∩ land use was the largest, and the explanatory power of vegetation coverage ∩ land use on rocky desertification evolution was the strongest.

4. Discussion

4.1. Advantages of Analysis Model

Previous studies on the monitoring of rocky desertification information were mostly carried out based on image classification and the comprehensive index method [27]. However, image classification had great advantages in distinguishing the boundaries and ranges of rocky desertification and nonrocky desertification, but it was difficult to quantitatively identify different levels of rocky desertification [28]. The comprehensive index method evaluates the rocky desertification condition by selecting different types of surface parameters to obtain a comprehensive index. However, this method often enhanced the contribution of a certain type of influencing factors in the process of rocky desertification [29]. At the same time, this method cannot take into account the complex influence of the interaction between different types of characterization parameters on the rocky desertification process [30]. In this paper, two typical surface parameters were calculated to construct the feature space and then to analyze the distribution and differentiation law of the levels of rocky desertification in the feature space, so as to quantitatively establish the rocky desertification monitoring model [31]. Compared with previous studies, this method could fully consider the interaction between different surface parameters and improve the accuracy of rocky desertification monitoring to a certain extent. However, due to the fact that the bandwidth of NIR in Landsat 5 TM and Landsat 8 OLI was different, it might affect the inversion value of BLI and DI. However, the difference was small, which had subtle influences on the spatial distribution patterns of rocky desertification that derived from the proposed model based on the above two types of images. Because the formation and evolution of rocky desertification were often affected by multiple types of natural factors and human activities, it was difficult to identify the dominant single factor and interactive factors in the evolution of rocky desertification [32]. As a statistical method to detect the spatial differentiation of geographical phenomena and their driving forces, GeoDetector was widely used in natural and social fields [33]. This method could not only analyze the spatial differentiation characteristics of geographical phenomena [34] but also detect the interactions between driving factors and ensure their collinearity immunity to multiple factors, which provided a new idea for the analysis of natural–human nonlinear interaction in the process of rocky desertification in this study. Meanwhile, there were obvious differences in the influence and contribution rate of natural–human activity factors on the evolution of rocky desertification in different historical periods. Revealing and clarifying the dominant driving factors and their change rules in different periods could provide useful exploration for the evolution mechanism of rocky desertification under the background of global change.

4.2. Causes of Spatial Distribution of Rocky Desertification

The mountain karst landform in Bijie City was well developed, which accounted for 70% of the study area. Additionally, the rocky desertification was widely distributed in Bijie City during the past 35 years. The main reason was that the exposed area of limestone and dolomite in the region was about 2268.7 km2, which provided natural material conditions for the formation of rocky desertification [35]. Bijie City had a subtropical monsoon humid climate with concentrated precipitation and abundant photothermal resources, which was conducive to a strong karstification process [36]. When the precipitation was relatively concentrated, it was conducive to form rainstorms and torrential rains, resulting in flood disasters, soil erosion, and thinning [35,37]. The rocky desertification would aggravate under the combined effects of frequent drought and flood, vegetation degradation, landslides, debris flows, and soil erosion. Meanwhile, human activities exposed excessive pressures and damages to the vegetation ecosystem [38]. With the arrival of the period of high birth rate and low mortality in poor areas before 2000, population growth was difficult to control. The heavy population pressure led to people’s excessive economic activities in nature, resulting in the destruction of resources. It was an important factor causing rocky desertification in fragile ecological areas [39]. In the absence of reclamation conditions and protective measures, agricultural activities, such as slash-and-burn cultivation, steep slope reclamation, and gully cultivation, led to abundant loss of soil and water. In addition, concentrated precipitation accelerated the soil migration process, prompting the loss of land productivity, and ultimately exacerbated the rocky desertification. Zones of moderate and above rocky desertification were mostly distributed in the Weining Yi, Hui, and Miao Autonomous Region, Qianxi City, Dafang District, Zhijin County, and Qixingguan District. The main reason was that the mountainous areas in these regions were widely distributed [40]. Due to the inconvenience of transportation and poverty in the mountainous area, the living energy of the people was single, mainly composed of firewood. Especially in some areas with a lack of coal and electricity, wood cutting was the main factor for the destruction of the ecological environment [41]. Excessive wood cutting greatly damaged the vegetation ecosystem, resulting in an extremely sensitive and fragile environmental system in this region. The reduction of environmental carrying capacity accelerated the deterioration rate of the ecological environment in the karst area [42,43]. In addition, the unreasonable development of mineral resources, such as extensive management and mining, resulted in mine land rocky desertification [44].

4.3. Causes of Rocky Desertification Evolution

The mountain karst landform in Bijie City was well developed, which accounted for 70% of the study area. Additionally, the rocky desertification was widely distributed in Bijie City during the past 35 years. The main reason was that the exposed area of limestone and dolomite in the region was about 2268.7 km2, which provided natural material conditions for the formation of rocky desertification [45]. Bijie City had a subtropical monsoon humid climate with concentrated precipitation and abundant photothermal resources, which was conducive to a strong karstification process [46]. When the precipitation was relatively concentrated, it was conducive to form rainstorms and torrential rains, resulting in flood disasters, soil erosion, and thinning [47,48]. The rocky desertification would aggravate under the combined effects of frequent drought and flood, vegetation degradation, landslides, debris flows, and soil erosion. Meanwhile, human activities exposed excessive pressures and damages to the vegetation ecosystem [49]. With the arrival of the period of high birth rate and low mortality in poor areas before 2000, population growth was difficult to control. The heavy population pressure led to people’s excessive economic activities in nature, resulting in the destruction of resources. It was an important factor causing rocky desertification in fragile ecological areas [50]. In the absence of reclamation conditions and protective measures, agricultural activities, such as slash-and-burn cultivation, steep slope reclamation, gully cultivation, led to abundant loss of soil and water. In addition, concentrated precipitation accelerated the soil migration process, prompting the loss of land productivity, and ultimately exacerbated the rocky desertification. Zones of moderate and above rocky desertification were mostly distributed in the Weining Yi, Hui, and Miao Autonomous Region, Qianxi City, Dafang District, Zhijin County, and Qixingguan District. The main reason was that the mountainous areas in these regions were widely distributed [51]. Due to the inconvenience of transportation and poverty in the mountainous area, the living energy of the people was single, mainly composed of firewood. Especially in some areas with a lack of coal and electricity, the wood cutting was the main factor for the destruction of the ecological environment [52]. Excessive wood cutting greatly damaged the vegetation ecosystem, resulting in an extremely sensitive and fragile environmental system in this region. The reduction of environmental carrying capacity accelerated the deterioration rate of the ecological environment in the karst area [53,54]. In addition, the unreasonable development of mineral resources, such as extensive management and mining, resulted in mine land rocky desertification [55]. In 2010, the rocky desertification showed an obviously exacerbating trend compared with that of 2005. The reason was that the severe drought in 2009–2010 in the southwest mountainous area led to widespread vegetation degradation, which aggravated the rocky desertification condition.

4.4. Suggestions for the Prevention of Rocky Desertification

During the past 35 years, human activities gradually became the dominant factor affecting the evolution of rocky desertification in Bijie City [56]. Therefore, it was helpful for the prevention and control of regional rocky desertification to adjust the influence mode and contribution rate of human activities on the intensification or improvement of rocky desertification [57,58]. Therefore, corresponding measures could be taken as the following: (1) The implementation of basic farmland construction, transformation of low-yielding fields, and promotion of a basic farmland stable high yield could effectively solve the food and clothing problems of farmers, which would let them devote themselves to the comprehensive prevention and control of rocky desertification. (2) The implementation of water conservancy and water conservation projects, rural energy resources, and a ‘slope-to-ladder’ project could improve people’s living standards to prevent karst mountain reclamation and destruction. (3) According to the characteristics of the rocky desertification environment and human disturbance mode, the natural restoration and artificial promotion restoration should be combined to improve the ecological environment and protect the existing forest resources [53]. The implementation of a comprehensive mountain closure management and the adoption of artificial measures to restore forest as soon as possible could prevent further deterioration of karst mountains. (4) The ecological vulnerability of rocky desertification mountainous areas in Bijie City was fragile. A total of 60 million poor people were mainly distributed in karst rocky mountainous areas. For the lack of basic living conditions in rocky desertification mountainous areas, ecological migration should be carried out to reduce the carrying capacity of land according to local conditions.

5. Conclusions

Against the background of global change, there are significant changes in the dominant driving factors in the evolution of rocky desertification in the southwest karst mountainous area. However, previous studies mostly focus on the driving mechanism of a specific period, and what are the dominant driving factors and how they change in different historical periods are still unclear. In this study, the spatial and temporal evolution patterns of rocky desertification in Bijie City in recent 35 years have been analyzed and investigated by using the feature space and the gravity center models, and then the dominant factors in the evolution of rocky desertification in different historical periods have been determined and clarified with GeoDetector. The main conclusions are as follows:
(1)
The proposed point–point BLI-DI feature space model has high applicability for rocky desertification monitoring in Bijie City, and its inversion accuracy is 91.3%.
(2)
During 1985–2020, the rocky desertification in Bijie City was moderate rocky desertification. Zones of intensive and severe rocky desertification are mainly distributed in the Weining Yi, Hui, and Miao Autonomous Region, while zones of slight and no rocky desertification are mostly located in Jinsha County, Nayong County, and Zhijin County.
(3)
During 1985–2020, there was an overall decreasing trend of rocky desertification in Bijie City (weakening–aggravating–weakening). The gravity center of rocky desertification moved westward, indicating that the aggravation degree of rocky desertification in the western region of the study area is higher than that in the eastern region.
(4)
During the past 35 years, the human activity factor (POP density) has become the dominant factor affecting the evolution of rocky desertification in the study area.

Author Contributions

Conceptualization, methodology, writing—original draft preparation, B.G. Investigation, supervision, project administration, funding acquisition, F.Y., J.F., and Y.L. All authors have read and agreed to the published version of the manuscript.

Funding

This research was funded by the National Natural Science Foundation of China, grant number 42101306 and 42171413; Natural Science Foundation of Shandong Province, grant number ZR2021MD047, Open Fund of Key Laboratory of Urban Land Resources Monitoring and Simulation, Ministry of Natural Resources, grant number KF-2020-05-001; and Major Project of High Resolution Earth Observation System of China, grant number GFZX0404130304.

Data Availability Statement

Not applicable.

Conflicts of Interest

The authors declare no conflict of interest.

References

  1. Wulder, M.A.; Masek, J.G.; Cohen, W.B. Opening the archive: How free data has enabled the science andmonitoring promise of Landsat. Remote Sens. Environ. 2012, 122, 2–10. [Google Scholar] [CrossRef]
  2. Di, X.Y.; Xiao, B.H.; Dong, H.; Wang, S.J. Implication of different humic acid fractions in soils under karst rocky desertification. Catena 2019, 174, 308–315. [Google Scholar] [CrossRef]
  3. Dai, Q.H.; Peng, X.D.; Yang, Z.; Zhao, L.S. Runoff and erosion processes on bare slopes in the Karst Rocky Desertification Area. Catena 2017, 152, 218–226. [Google Scholar] [CrossRef]
  4. Zhang, X.M.; Yue, Y.M.; Tong, X.W.; Wang, K.L.; Qi, X.K. Eco-engineering controls vegetation trends in southwest China karst. Sci. Total Environ. 2021, 770, 145160. [Google Scholar] [CrossRef]
  5. Chen, S.T.; Guo, B.; Zhang, R.; Zang, W.Q.; Wei, C.X.; Wu, H.W.; Yang, X.; Zhen, X.Y.; Li, X.; Zhang, D.F.; et al. Quantitatively determine the dominant driving factors of the spatial–temporal changes of vegetation NPP in the Hengduan Mountain area during 2000–2015. J. Mt. Sci. 2021, 18, 427–445. [Google Scholar] [CrossRef]
  6. Guo, B.; Zang, W.Q.; Luo, W. Spatial-temporal shifts of ecological vulnerability of Karst Mountain ecosystem-impacts of global change and anthropogenic interference. Sci. Total Environ. 2020, 741, 140256. [Google Scholar] [CrossRef]
  7. Wu, H.W.; Guo, B.; Fan, J.F.; Yang, F.; Han, B.M.; Wei, C.X.; Lu, Y.F.; Zang, W.Q.; Zhen, X.Y.; Meng, C. A novel remote sensing ecological vulnerability index on large scale: A case study of the China-Pakistan Economic Corridor region. Ecol. Indic. 2021, 129, 107955. [Google Scholar] [CrossRef]
  8. Huang, W.; Ho, H.C.; Peng, Y.Y.; Li, L. Qualitative risk assessment of soil erosion for karst landforms in Chahe town, Southwest China: A hazard index approach. Catena 2016, 144, 184–193. [Google Scholar] [CrossRef]
  9. Gao, J.B.; Wang, H. Temporal analysis on quantitative attribution of karst soil erosion: A case study of a peak-cluster depression basin in Southwest China. Catena 2019, 172, 369–377. [Google Scholar] [CrossRef]
  10. Zhang, Y.Q.; Liao, J.; Long, Y.; An, J.; Xu, S.J.; Wang, X.L. Dating reservoir deposits to reconstruct sediment yields from a small limestone catchment in the Yimeng Mountain region, China. Catena 2018, 166, 1–9. [Google Scholar] [CrossRef]
  11. Chong, G.S.; Hai, Y.; Zheng, H.; Xu, W.H.; Ouyang, Z.Y. Progresses in Remote Sensing Information Extraction Methods for Rocky Desertification. J. Appl. Sci. 2021, 39, 961–968. [Google Scholar]
  12. Wang, H.; Wang, Y.Y.; Cai, H.; Jia, Y.; Zhou, Q. Research on Temporal and Spatial Changes of Multi-scale Rocky Desertification Based on Multi-source Data. Chin. J. Undergr. Space Eng. 2021, 17, 1044–1050. [Google Scholar]
  13. Li, W.; Wei, M. Study on monitoring rocky desertification based on the combination of remote sensing interpretation and geographical conditions. Bull. Surv. Mapp. 2020, 2, 121–125. [Google Scholar]
  14. Bai, X.Y.; Wang, S.J.; Chen, Q.W. Spatio-temporal evolution process and its evaluation method of karst rocky desertification in Guizhou Province. Acta Geogr. Sin. 2009, 64, 609–618. [Google Scholar]
  15. Jiang, Y.; Gao, J.B.; Yang, L.; Wu, S.H.; Dai, E.F. The interactive effects of elevation, precipitation and lithology on karst rainfall and runoff erosivity. Catena 2021, 207, 105588. [Google Scholar] [CrossRef]
  16. Zhang, X.L.; Gan, S. Research on Extracting Rocky Desertification Information based on NDRI Dimidiate Pixel Model. New Technol. New Process 2014, 1, 72–75. [Google Scholar]
  17. Xu, G.Y.; Xiao, J.; Oliver, D.M.; Yang, Z.Q.; Xiong, K.N.; Zhao, Z.M. Spatio-temporal characteristics and determinants of anthropogenic nitrogen and phosphorus inputs in an ecologically fragile karst basin: Environmental responses and management strategies. Ecol. Indic. 2021, 133, 108453. [Google Scholar] [CrossRef]
  18. Yan, T.T.; Xue, J.H.; Zhou, Z.D.; Wu, Y.B. Effects of biochar-based fertilizer on soil bacterial network structure in a karst mountainous area. Catena 2021, 206, 105535. [Google Scholar] [CrossRef]
  19. Luo, X.L.; Wang, S.J.; Bai, X.Y. Analysis on the spatio-temporal evolution process of rocky desertification in Southwest Karst area. Acta Ecol. Sin. 2021, 41, 680–693. [Google Scholar]
  20. Zhou, M.W.; Wang, S.J.; Li, Y.B. Spatial factor analysis of karst rocky desertification landscape patterns in Wangjiazhai catchment, Guizhou. Geogr. Resaust 2007, 5, 897–905. [Google Scholar]
  21. Gu, Z.F.; Bai, G.; Liu, Z.K. Prediction and evaluation of the rocky desertification evolution trend in southwest Guizhou Province based on the method of fuzzy analytic hierarchy process. J. Zhengzhou Inst. Aeronaut. Ind. Manag. 2021, 39, 95–102. [Google Scholar]
  22. Xi, H.P.; Wang, S.J.; Bai, X.Y. Spatio-temporal characteristics of rocky desertification in typical Karst areas of Southwest China: A case study of Puding County, Guizhou Province. Acta Ecol. Sin. 2018, 38, 8919–8933. [Google Scholar]
  23. Yan, J.N.; Wang, L.Z.; He, H.X.; Liang, D.; Song, W.J.; Han, W. Large area land cover change monitoring with time-series remote sensing images using transferable deep models. IEEE T Geosci. Remote 2022, 60, 1–17. [Google Scholar] [CrossRef]
  24. Yan, J.N.; He, H.X.; Wang, L.Z.; Zhang, T.; Liang, D.; Zhang, J.Q. Inter-comparison of four models for detecting forest fire disturbance from MOD13A2 time series. Remote Sens. 2022, 14, 1446. [Google Scholar] [CrossRef]
  25. Chen, Y.L.; Mo, J.F.; Mo, W.H. Temporal and Spatial Distributions of Rocky Desertifi-cation in Guangxi Karst Area in the Past 30 Years. Guangxi Sci. 2018, 25, 625–631. [Google Scholar]
  26. Khalid, M.; Tan, H.X.; Ali, M.; Rehman, A.; Liu, X.X.; Su, L.T. Karst rocky desertification diverged the soil residing and the active ectomycorrhizal fungal communities thereby fostering distinctive extramatrical mycelia. Sci. Total Environ. 2022, 807, 151016. [Google Scholar] [CrossRef] [PubMed]
  27. Lan, G.Y.; Liu, C.; Wang, H.; Cao, J.H.; Tang, W.; Li, Q. Linking soil redistribution to soil organic carbon using 210Pbex along different complex toposequences in a karst region, southwest China. Catena 2021, 202, 105239. [Google Scholar] [CrossRef]
  28. Deng, Y.; Wu, S.; Ke, J.; Zhu, A.J. Effects of meteorological factors and groundwater depths on plant sap flow velocities in karst critical zone. Sci. Total Environ. 2021, 781, 146764. [Google Scholar] [CrossRef]
  29. Ma, T.S.; Deng, X.W.; Chen, L.; Xiang, W.H. The soil properties and their effects on plant diversity in different degrees of rocky desertification. Sci. Total Environ. 2020, 736, 139667. [Google Scholar] [CrossRef]
  30. Michele, L.; Oliveira, D.; Carlos, A.C.; Santos, D.; Oliveira, G.D.; Aldrin, M. Effects of human-induced land degradation on water and carbon fluxes in two different Brazilian dryland soil covers. Sci. Total Environ. 2021, 792, 148458. [Google Scholar]
  31. Ding, Z.; Zheng, H.; Li, H.; Yu, P.J.; Man, W.Y.; Tang, X.G.; Liu, Y. Afforestation-driven increases in terrestrial gross primary productivity are partly offset by urban expansion in Southwest China. Ecol. Indic. 2021, 127, 107641. [Google Scholar] [CrossRef]
  32. Liu, Z.Q.; Yu, X.X.; Jia, G.D. Water utilization characteristics of typical vegetation in the rocky mountain area of Beijing, China. Ecol. Indic. 2018, 91, 249–258. [Google Scholar] [CrossRef]
  33. Zhang, Y.H.; Xu, X.L.; Li, Z.W.; Xu, C.H.; Luo, W. Improvements in soil quality with vegetation succession in subtropical China karst. Sci. Total Environ. 2021, 775, 145876. [Google Scholar] [CrossRef] [PubMed]
  34. Zhang, J.Y.; Dai, M.H.; Wang, L.C.; Su, W.C. Household livelihood change under the rocky desertification control project in karst areas, Southwest China. Land Use Policy 2016, 56, 8–15. [Google Scholar] [CrossRef]
  35. Gao, J.B.; Jiang, Y.; Anker, Y. Contribution analysis on spatial tradeoff/synergy of Karst soil conservation and water retention for various geomorphological types: GeoDetector application. Ecol. Indic. 2021, 125, 107470. [Google Scholar] [CrossRef]
  36. Guo, B.; Wei, C.X.; Yu, Y.; Liu, Y.F.; Li, J.L.; Meng, C.; Cai, Y.M. The dominant influencing factors of desertification changes in the Source Region of Yellow River: Climate change or human activity? Sci. Total Environ. 2022, 813, 152512. [Google Scholar] [CrossRef]
  37. Hu, L.N.; Li, Q.; Yan, J.H.; Liu, C.; Zhong, J.X. Vegetation restoration facilitates belowground microbial network complexity and recalcitrant soil organic carbon storage in southwest China karst region. Sci Total Environ. 2022, 820, 153137. [Google Scholar] [CrossRef]
  38. Guo, B.; Zang, W.Q.; Yang, F.; Han, B.M.; Chen, S.T.; Liu, Y.; Yang, X.; He, T.L.; Chen, X.; Liu, C.T.; et al. Spatial and temporal change patterns of net primary productivity and its response to climate change in the Qinghai–Tibet Plateau of China from 2000 to 2015. J. Arid. Land. 2020, 12, 1–17. [Google Scholar] [CrossRef] [Green Version]
  39. Uzuner, C.; Dengiz, O. Desertification risk assessment in Turkey based on environmentally sensitive areas. Ecol. Indic. 2020, 114, 106295. [Google Scholar] [CrossRef]
  40. Xu, X.B.; Yang, G.S.; Tan, Y. Identifying ecological red lines in China’s Yangtze River Economic Belt: A regional approach. Ecol. Indic. 2019, 96, 635–646. [Google Scholar] [CrossRef]
  41. Zhang, W.X.; Yu, Y.; Wu, X.Q.; Pereira, P.; Borja, M.E.L. Integrating preferences and social values for ecosystem services in local ecological management: A framework applied in Xiaojiang Basin Yunnan province, China. Land Use Policy 2020, 91, 104339. [Google Scholar] [CrossRef]
  42. Rafael, D.A.; Virginia, G.G.; José, V.; Oliver, V.; Eduardo, R.B. Land use/cover change analysis in the Mediterranean region: A regional case study of forest evolution in Castelló (Spain) over 50 years. Land Use Policy 2022, 114, 105967. [Google Scholar]
  43. Rahmati, O.; Mohammadi, F.; Ghiasi, S.S.; Tiefenbacher, J.; Moghaddam, D.D. Identifying sources of dust aerosol using a new framework based on remote sensing and modelling. Sci. Total Environ. 2020, 737, 139508. [Google Scholar] [CrossRef] [PubMed]
  44. Li, S.; Ren, H.D.; Xue, L.; Chang, J.; Yao, X.H. Influence of bare rocks on surrounding soil moisture in the karst rocky desertification regions under drought conditions. Catena 2014, 116, 157–162. [Google Scholar] [CrossRef]
  45. Tang, J.; Tang, X.X.; Qin, Y.M.; He, Q.S.; Yi, Y.; Ji, Z.L. Karst rocky desertification progress: Soil calcium as a possible driving force. Sci. Total Environ. 2019, 649, 1250–1259. [Google Scholar] [CrossRef]
  46. Zuo, L.Y.; Gao, J.B. Dynamic analysis of the determinants of trade-off and synergy between karst soil loss and water yield with integration of geomorphological differentiation. Ecol. Indic. 2022, 137, 108754. [Google Scholar] [CrossRef]
  47. Hu, X.N.; Luo, H.; Guo, M.C.; Wang, J.J. Ecological technology evaluation model and its application based on Logistic Regression. Ecol. Indic. 2022, 136, 108641. [Google Scholar] [CrossRef]
  48. Wu, L.H.; Wang, S.J.; Bai, X.Y.; Tian, Y.C.; Luo, G.J. Climate change weakens the positive effect of human activities on karst vegetation productivity restoration in southern China. Ecol. Indic. 2020, 115, 106392. [Google Scholar] [CrossRef]
  49. Zhang, Y.Q.; Liao, J.L.; Pei, Z.L.; Lu, X.; Xu, S.J.; Wang, X.L. Effect of dam construction on nutrient deposition from a small agricultural karst catchment. Ecol. Indic. 2019, 107, 105548. [Google Scholar] [CrossRef]
  50. Zhao, S.; Wu, X.Q.; Zhou, J.X.; Pereira, P. Spatiotemporal tradeoffs and synergies in vegetation vitality and poverty transition in rocky desertification area. Sci. Total Environ. 2021, 752, 141770. [Google Scholar] [CrossRef]
  51. Li, S.N.; Zhao, X.Q.; Pu, J.W.; Miao, P.P.; Wang, Q. Optimize and control territorial spatial functional areas to improve the ecological stability and total environment in karst areas of Southwest China. Land Use Policy 2021, 100, 104940. [Google Scholar] [CrossRef]
  52. Yan, Y.J.; Dai, Q.H.; Hu, G.; Jiao, Q.; Mei, L.N.; Fu, W.B. Effects of vegetation type on the microbial characteristics of the fissure soil-plant systems in karst rocky desertification regions of SW China. Sci. Total Environ. 2020, 712, 136543. [Google Scholar] [CrossRef] [PubMed]
  53. Yan, Y.J.; Dai, Q.H.; Jin, L.; Wang, X.D. Geometric morphology and soil properties of shallow karst fissures in an area of karst rocky desertification in SW China. Catena 2019, 174, 48–58. [Google Scholar] [CrossRef]
  54. Qiao, Y.N.; Jiang, Y.J.; Zhang, C.Y. Contribution of karst ecological restoration engineering to vegetation greening in southwest China during recent decade. Ecol. Indic. 2021, 121, 107081. [Google Scholar] [CrossRef]
  55. Shen, Y.X.; Wang, D.J.; Chen, Q.Q.; Tang, Y.Y.; Chen, F.J. Large heterogeneity of water and nutrient supply derived from runoff of nearby rock outcrops in karst ecosystems in SW China. Catena 2019, 172, 125–131. [Google Scholar] [CrossRef]
  56. Tan, K.; Zhao, X.Q.; Pu, J.W.; Li, Y.H. Zoning regulation and development model for water and land resources in the Karst Mountainous Region of Southwest China. Land Use Policy 2021, 109, 105683. [Google Scholar] [CrossRef]
  57. You, H.Y. Orienting rocky desertification towards sustainable land use: An advanced remote sensing tool to guide the conservation policy. Land Use Policy 2017, 61, 171–184. [Google Scholar] [CrossRef]
  58. Yan, T.T.; Xue, J.H.; Zhou, Z.D.; Wu, Y.B. Biochar-based fertilizer amendments improve the soil microbial community structure in a karst mountainous area. Sci. Total Environ. 2021, 794, 148757. [Google Scholar] [CrossRef]
Figure 1. Location and topography of the study area.
Remotesensing 14 02351 g001
Figure 2. Work flowchart of the study.
Remotesensing 14 02351 g002
Figure 3. Principle of the feature space model.
Remotesensing 14 02351 g003
Figure 4. Construction of a point-to-point BLI-DI feature space rocky desertification monitoring model. (a) BLI-DI feature space; (b) Spatial distribution of levels of rocky desertification.
Remotesensing 14 02351 g004
Figure 5. Spatial distribution of the field-observed sites.
Remotesensing 14 02351 g005
Figure 6. Spatial distribution of rocky desertification in different historical periods: (a) 1985, (b) 1990, (c) 1995, (d) 2000, (e) 2005, (f) 2010, (g) 2015, (h) 2020.
Remotesensing 14 02351 g006aRemotesensing 14 02351 g006b
Figure 7. Percentage of rocky desertification change area in different historical periods.
Remotesensing 14 02351 g007
Figure 8. Distribution of levels of rocky desertification change intensity in different historical periods: (a) 1985–1990, (b) 1990–1995, (c) 1995–2000, (d) 2000–2005, (e) 2005–2010, (f) 2010–2015, (g) 2015–2020.
Remotesensing 14 02351 g008aRemotesensing 14 02351 g008b
Figure 9. Gravity center migration trajectory of rocky desertification at different time scales.
Remotesensing 14 02351 g009
Figure 10. Correlations between different single driving factors and rocky desertification. MIN refers to the minimum value, STD refers to the standard deviation, MAX refers to the maximum value, and MEAN refers to the mean value. (a) Precipitation; (b) Vegetation coverage; (c) Pop; (d) GDP; (e) Slope; (f) DEM; (g) Land use.
Remotesensing 14 02351 g010aRemotesensing 14 02351 g010b
Figure 11. The dominant single factors in different historical periods.
Remotesensing 14 02351 g011
Figure 12. The interactive dominant factors in different historical periods: (a) 1985, (b) 1990, (c) 1995, (d) 2000, (e) 2005, (f) 2010, (g) 2015, (h) 2020.
Remotesensing 14 02351 g012aRemotesensing 14 02351 g012b
Table 1. Data description and sources.
Data NameSourcesSpatial and Temporal Resolution
Landsat 5 TM and Landsat 8 OLI imagesGeospatial Data Cloud30 m; 1985, 1990, 1995, 2000, 2005, 2010, 2015, and 2020
Land-use typesResource and Environmental Science and Data Center of the Chinese Academy of Sciences1:100,000; 1985, 1990, 1995, 2000, 2005, 2010, 2015, and 2020
Meteorological station dataChina Meteorological Data Network35 station(.shp); 1985–2020
DEM dataGeospatial Data Cloud30 m, 2003
GDP density and population densityResource and Environmental Science and Data Center of the Chinese Academy of SciencesStatistical data; 1985, 1990, 1995, 2000, 2005, 2010, 2015, and 2020
Table 2. Error matrix of different levels of rocky desertification in 2020.
BLI-DIInversion Value
No Rocky DesertificationSlight Rocky DesertificationModerate Rocky DesertificationIntensive Rocky DesertificationSevere Rocky DesertificationSum
Observed valueNo rocky desertification23000023
Slight rocky desertification33000033
Moderate rocky desertification01292032
Intensive rocky desertification00337040
Severe rocky desertification00165057
Sum2631334550185
Table 3. The proportions of the levels of the rocky desertification area in different periods.
Grade PeriodsNo Rocky DesertificationSlight Rocky DesertificationModerate Rocky DesertificationIntensive Rocky DesertificationSevere Rocky Desertification
1985Area (km2)292.716966.9511,452.446686.791290.30
Percentage1.09%26.03%42.78%24.98%4.82%
1990Area (km2)630.377152.626299.8411,456.291239.48
Percentage2.35%26.72%23.53%42.80%4.63%
1995Area (km2)65.657089.457596.758952.33073.94
Percentage0.25%26.48%28.38%33.44%11.48%
2000Area (km2)686.037172.127002.179362.532549.99
Percentage2.56%26.79%26.16%34.98%9.53%
2005Area (km2)657.077401.9510,733.125598.242381.78
Percentage2.45%27.65%40.10%20.91%8.90%
2010Area (km2)1937.045254.657576.6210,034.944914.41
Percentage6.52%17.68%25.49%33.77%16.54%
2015Area (km2)5321.999840.296687.404000.871160.32
Percentage19.88%36.76%24.98%14.95%4.33%
2020Area (km2)5683.9910,523.954840.012065.993575.25
Percentage21.30%39.43%18.13%7.74%13.40%
Publisher’s Note: MDPI stays neutral with regard to jurisdictional claims in published maps and institutional affiliations.

