Article

TDA-Net: A Novel Transfer Deep Attention Network for Rapid Response to Building Damage Discovery

1
State Key Laboratory of Information Engineering in Surveying, Mapping and Remote Sensing, Wuhan University, Wuhan 430079, China
2
College of Geo-Exploration Science and Technology, Jilin University, Changchun 130026, China
*
Author to whom correspondence should be addressed.
Remote Sens. 2022, 14(15), 3687; https://doi.org/10.3390/rs14153687
Submission received: 7 June 2022 / Revised: 13 July 2022 / Accepted: 25 July 2022 / Published: 1 August 2022
(This article belongs to the Special Issue Recent Progress of Change Detection Based on Remote Sensing)

Abstract

:
The rapid and accurate discovery of damage information of the affected buildings is of great significance for postdisaster emergency rescue. In some related studies, the models involved can detect damaged buildings relatively accurately, but their time cost is high. Models that can guarantee both detection accuracy and high efficiency are urgently needed. In this paper, we propose a new transfer-learning deep attention network (TDA-Net). It can achieve a balance of accuracy and efficiency. The benchmarking network for TDA-Net uses a pair of deep residual networks and is pretrained on a large-scale dataset of disaster-damaged buildings. The pretrained deep residual networks have strong sensing properties on the damage information, which ensures the effectiveness of the network in prefeature grasping. In order to make the network have a more robust perception of changing features, a set of deep attention bidirectional encoding and decoding modules is connected after the TDA-Net benchmark network. When performing a new task, only a small number of samples are needed to train the network, and the damage information of buildings in the whole area can be extracted. The bidirectional encoding and decoding structure of the network allows two images to be input into the model independently, which can effectively capture the features of a single image, thereby improving the detection accuracy. Our experiments on the xView2 dataset and three datasets of disaster regions achieve high detection accuracy, which demonstrates the feasibility of our method.

1. Introduction

In recent years, global climate change has continued to intensify, and natural disasters have occurred frequently, which have had a severe impact on human society. Buildings are the main places for people to live and be active, and they are also the concentrated areas of population and property. Rapid and effective extraction of damage information of affected buildings is significant for postdisaster humanitarian assistance and secondary disaster prevention [1,2,3]. High-resolution (HR) remote sensing images are now widely used in the field of remote sensing. In the field of remote sensing, there are many tasks that are almost always performed based on HR remote sensing images [3,4]. However, this also brings challenges to related algorithms. Because there are significant intraclass differences in HR remote sensing images, the interference of light and atmospheric conditions is also a non-negligible factor [3]. In HR remote sensing images, the background environment of damaged buildings is usually complex. Accurately extracting damaged buildings from complex backgrounds is an important and challenging task [2,5].
Building damage discovery (BDD) falls under the category of change detection [6,7,8]. Change detection studies use multitemporal remote sensing images or other remote sensing data to detect the range and class of change of objects in the same geographical area [9]. When traditional methods such as the spectral feature threshold difference method [10], ratio method [11], change vector analysis method [12], and regression analysis method [13] are applied to HR remote sensing images, pseudochange areas and “salt and pepper noise” are prone to appear frequently. This is intolerable for the study of BDD because it needs to reflect clearer edges and more complete patches.
Deep learning technology [14,15] has been successfully applied in the field of remote sensing, such as remote sensing image classification, semantic segmentation, object detection, change detection, etc. [16]. This is due to the great advantages of deep learning techniques in feature extraction and information modeling [2,17,18]. In the BDD, various deep neural network models have shown good performance [19,20,21] because they can extract the semantically rich high-level features from the image and synthesize the feature information [3,16]. However, deep learning-based BDD methods almost all rely on a large number of training samples and require deeper and more complex network models as the basis. Time-consuming model training is also inevitable. Additionally, the hyperparameter tune of the network is also a tedious process. The time cost is a factor that must be considered for the application of deep learning techniques in different domains. For a time-sensitive problem such as BDD, the large time investment can limit the use of some highly accurate network models [2,22,23].
According to our survey, the convolutional neural network-based BDD approach is the most common. For example, Vetrivel et al. [24] used AlexNet model and combined it with point cloud data to achieve multicore learning to complete the detection and evaluation of damaged buildings. Zhou et al. [25] used DCNN to extract features and used a support vector machine as a classifier to complete the detection of building damage in the earthquake area. Hezaveh et al. [26] used four strategies to alleviate the imbalance of training samples based on the UNet network and performed damage detection on the roof of the building. Ge et al. [27] used an RS-GAN network model to extract more accurate building outlines. There are also some studies that have been conducted on building localization and damage classification. Some used UNet for pixel-level localization of damaged buildings and ResNet-50 [28] as a discriminator of damage levels. Some designed a network called Siamese-UNet [29] for an integrated implementation of damage localization and classification. Others have designed a ChangeOS [1] framework that can perform integrated processing of building damage assessment to overcome the semantic gap problem. However, it has to be mentioned that all the abovementioned studies were conducted to ensure that the models were trained effectively. A large number of training samples and a long time of model training are necessary to ensure the smooth implementation of the proposed method.
It is common in deep learning to use pretrained models as a starting point for new models in computer vision tasks and natural language processing tasks, which usually consume huge time and computational resources in developing neural networks. Transfer learning [30,31,32] allows the transfer of powerful acquired skills to related problems. This is certainly applicable to the discovery of damaged buildings in disaster-stricken areas. This is because timely assessment after a disaster can effectively guide postdisaster relief and humanitarian assistance [1]. In some cases, timeliness even takes precedence over accuracy [33,34,35]. It is worth noting that disasters are small probability events. While there is a wide variety of disaster types around the world, each type of disaster does not always occur. Very few visible disaster data have been recorded and is available. There are even fewer sample data that can be used to train the model. Model training with the support of a small number of samples is valuable if good results can be achieved [36]. Therefore, using the transfer learning mode, the network model that extracts useful feature information through a few training samples has a high research value.
Embedding modules represented by attention mechanisms are continuously proposed to obtain better gains in different tasks. Networks with different structures and functions have been designed and applied in several fields of remote sensing image processing. This is dominated by end-to-end semantic segmentation networks, such as FCN [37], UNet [38], SegNet [39], FC-EF [40], DeepLabv3+ [41], ChangeNet [42], SCDNET [7], DSA-Net [43], ADA-Net [6], etc., which show good performance in full element change detection or building change detection. Undoubtedly, the use of attention modules or their variants improves the feature extraction capability, robustness, or detection accuracy of the networks. However, attention modules for effective extraction of image features in BDD tasks still need to be studied in depth. The aspects of feature extraction at small sample numbers, reuse of low-level features, and effective fusion of low-level and high-level features are still of great value in the research of BDD.
In order to improve the efficiency of building damage information discovery and obtain an accurate damage area coverage map with the support of a small number of samples, this paper proposes a new transfer-learning deep attention network (TDA-Net). TDA-Net uses a pretrained residual network as the benchmark network, which can alleviate the heavy model training process, improve the efficiency of model use, and achieve rapid disaster response. In order to accurately extract the damage features in HR remote sensing images, precisely locate the damaged area, and guide the model to focus on the learning of damage information, we introduce a deep attention module which aims to model training data when there are few training samples. The key features implied in a small number of samples are fully learned, and the deep data representation of the building damage area in the image is mined to capture the effective information source for fast model fitting. Experiments are carried out on a set of global building disaster data and three sets of disaster area data, and the experimental results verify the effectiveness of the proposed method.

2. Materials and Methods

2.1. Dataset Description

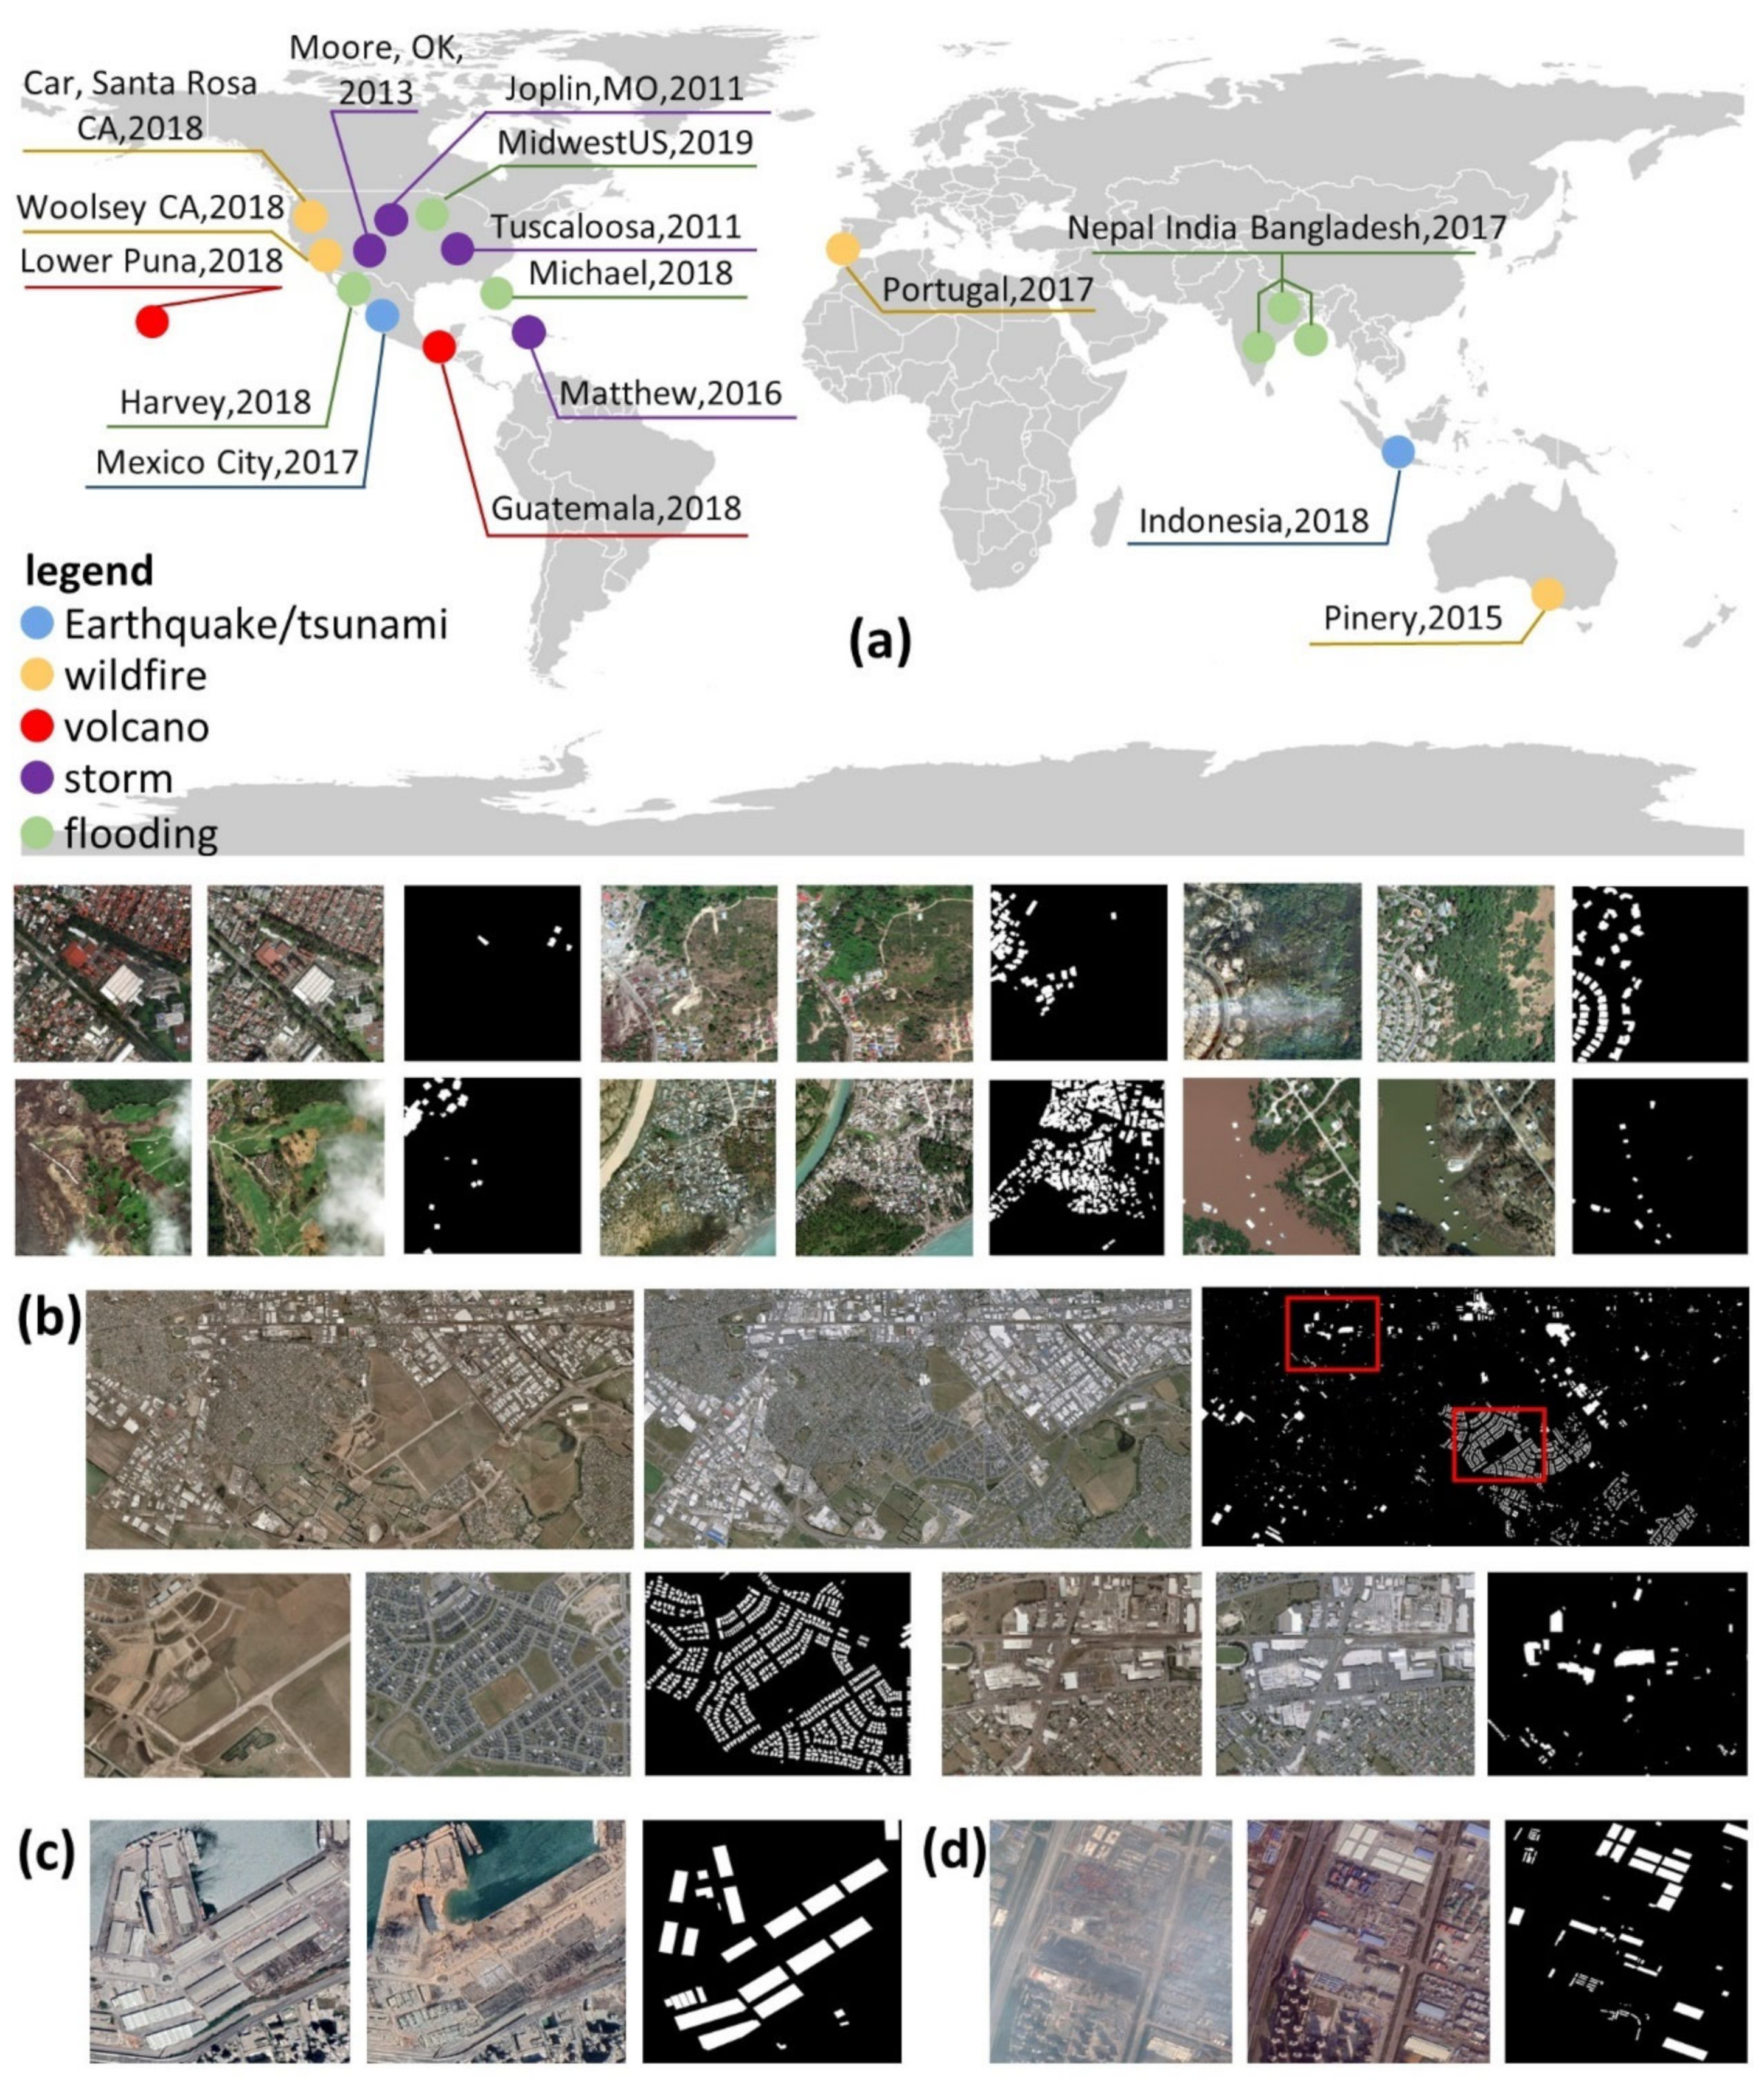
Four sets of data were used in this paper, as shown in Figure 1. The first set is the global xView2 building damage assessment dataset [23]. The dataset contains multiple types of disasters that occurred in North America, Asia, and Australia between 2011 and 2019. The locations of disasters are shown in Figure 1a. The disaster types in the dataset include earthquakes, volcanoes, storms, tsunamis, wildfires, and floods. It consists of 22,068 HR remote sensing images from the WorldView2 and WorldView3 satellite platforms, and the images contain 850,736 building instances. With rich disaster types and real scenarios with large space-time spans, xBD is a high-quality dataset for pretraining models.
The second dataset is the WHU Building Dataset, which consists of aerial images with a spatial resolution of 0.075 m, as shown in Figure 1b. The area covered by the imagery is Christchurch, New Zealand, which was hit by a 6.3 magnitude earthquake in February 2011, and a large number of buildings were destroyed. The urban area was subsequently rebuilt, and aerial imagery obtained in April 2012 contained 12,796 buildings within 20.5 km2. This dataset is a large building change discovery dataset that can be used to validate the robustness of the model in discovering changing buildings over a large area. The other two sets of data come from Google Earth, and the disaster types involved are explosions. Beirut is the largest city and capital of Lebanon. Its port exploded on 4 August 2020. The accident destroyed a large number of buildings. We selected the area with the most severe explosion as the test area, as shown in Figure 1c. On 12 August 2015, an explosion occurred in the Binhai New Area of Tianjin, China, and about 304 buildings were damaged. We selected remote sensing images before and after the explosion for building damage assessment, as shown in Figure 1d.

2.2. Basic Architecture of TDA-Net

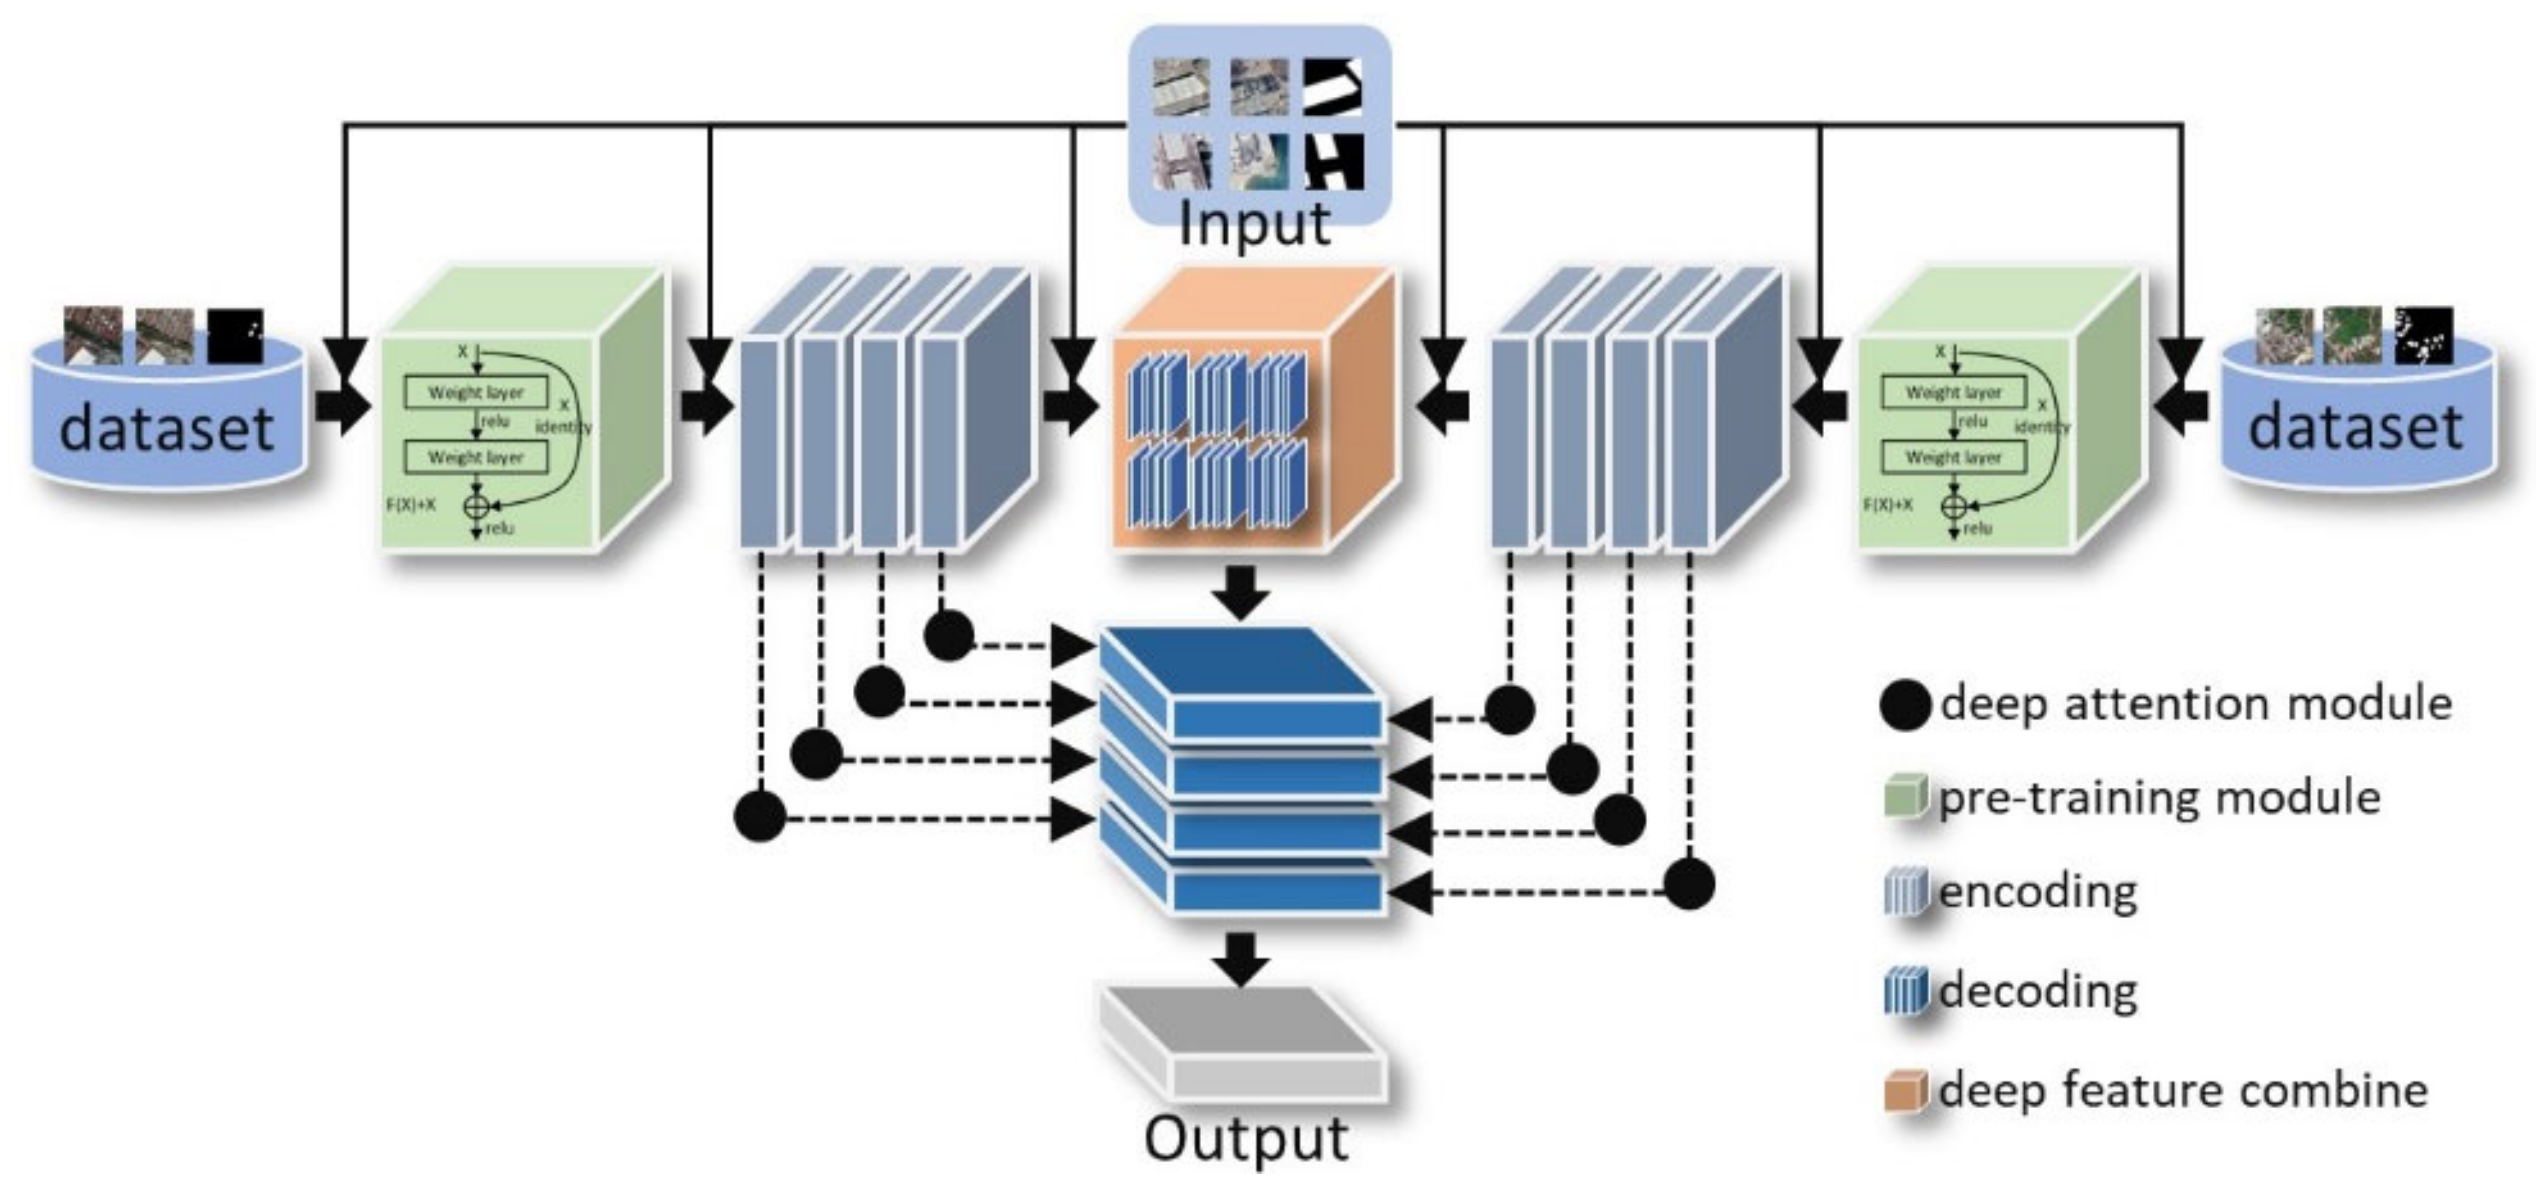
The backbone network of TDA-Net consists of four parts: pretraining, encoding, decoding, and deep attention operation, as shown in Figure 2. The pretraining section uses the Resnet101 model [28]. It uses the shortcut connection operation technique to learn to form residuals for each layer in the network, optimize the training process better, and to deepen the number of network layers. Resnet101 has a deep network layer, which can extract higher-level in-depth features. We use it as the front-end network for feature extraction and use the image features extracted by it to serve the downstream work. The network in the second stage is composed of encoding modules. The encoding modules at both ends accept the output of Resnet101 and extract semantic information again, and finally form deep combined features. The third stage is the decoding part, where the depth-combined features implement pixel-level class mapping through decoding operations. The fourth stage is carried out simultaneously with the third stage. In the process of decoding and mapping the deep combined features, the deep attention module guides the network and combines primary and high-level features to achieve an effective combination and utilization of useful feature information. It is worth mentioning that the input of TDA-Net is bidirectional, with two interfaces for receiving pre- and postimages, respectively. The weights in the two branches are independent, and both use ResNet101 for efficient modeling of features in both phases of the images and targeted data analysis of the images. This approach of modeling images separately enables the extraction of image features at both ends using pretrained ResNet101, by which separate modeling of the distributed form of image data is achieved. Combining the features extracted by ResNet101 from the two phases of images separately at different levels results in a clearer representation of the features, which may not be an advantage of the approach that first concatenates the two phases of images and then feeds them into the model. This divide and conquer approach is a very popular way of using the data, and this side is used in much of the literature [43,44,45,46].
In order to reuse the low-dimensional feature data and make the raw images useful in the high-level classification task, we introduced raw image data information at each of the three different nodes of the network to supplement the high-level abstract feature information. At different nodes, different resampling strategies are used to keep the original image size and the feature map size of that layer consistent. The details of the model are shown in Table 1.
In order to keep the same distribution of the input of each neural network’s layer and speed up the training of the model, we added a normalization layer to the encoding and decoding modules, respectively. ReLU is used as the nonlinear activation function in each layer. The Sigmoid function is used at the end of the network to implement the feature transformation and obtain the output of the network.
In the research of binary classification, the problem of a severe imbalance of the proportion of positive and negative samples is almost inevitable [21,47]. Disasters are always rare. Even if a disaster occurs in a particular area, it does not necessarily cause damage to buildings. Some minor damages are difficult to detect and are not apparent in optical images. In order to obtain a better training effect when the number of samples of damaged buildings is small and the environment where the buildings locate is complex, we use the focal loss function [48]. This loss function reduces the weight of a large number of simple negative samples in training and can focus on information mining for difficult samples. The focal loss function was modified based on the cross-entropy loss function. It uses two modulation factors to balance the positive and negative samples and solve the problem of easy and difficult sample learning. Its formula is as follows:
F L p t = α t 1 p t γ log p t  
where α and γ are the sample modulation factors, and p is the predicted probability.

2.3. Pretraining Residuals Module

Adequate pretraining efforts have a positive effect on downstream tasks. This is because the pretrained model already has the ability to simulate similar data. ResNet was proposed in 2015 and won first place in the ImageNet competition classification task. Since then, many methods have been conducted on the basis of ResNet50 or ResNet101, and ResNet has been used in fields such as detection, segmentation, and recognition. The residual units in the network (Figure 3) can learn new features based on the input features by “short-circuiting the connections”, allowing the network to achieve better performance.
The ResNet101 we use is a publicly available model pretrained on the ImageNet dataset. Based on this, we reconstructed the end of the network. The end-depth residual features of the network are accepted by a two-dimensional convolution, and a dimensionality reduction is made. Among them, the two-dimensional convolution includes a two-dimensional convolutional computation unit, a batch normalization unit, and a ReLU function unit. Finally, the reduced-dimensional result is mapped nonlinearly by the Sigmoid function. The pretraining module is trained using the xView2 building damage assessment dataset, mainly by supervising the results and adapting the model so it can model building damage information.

2.4. Deep Attention Module

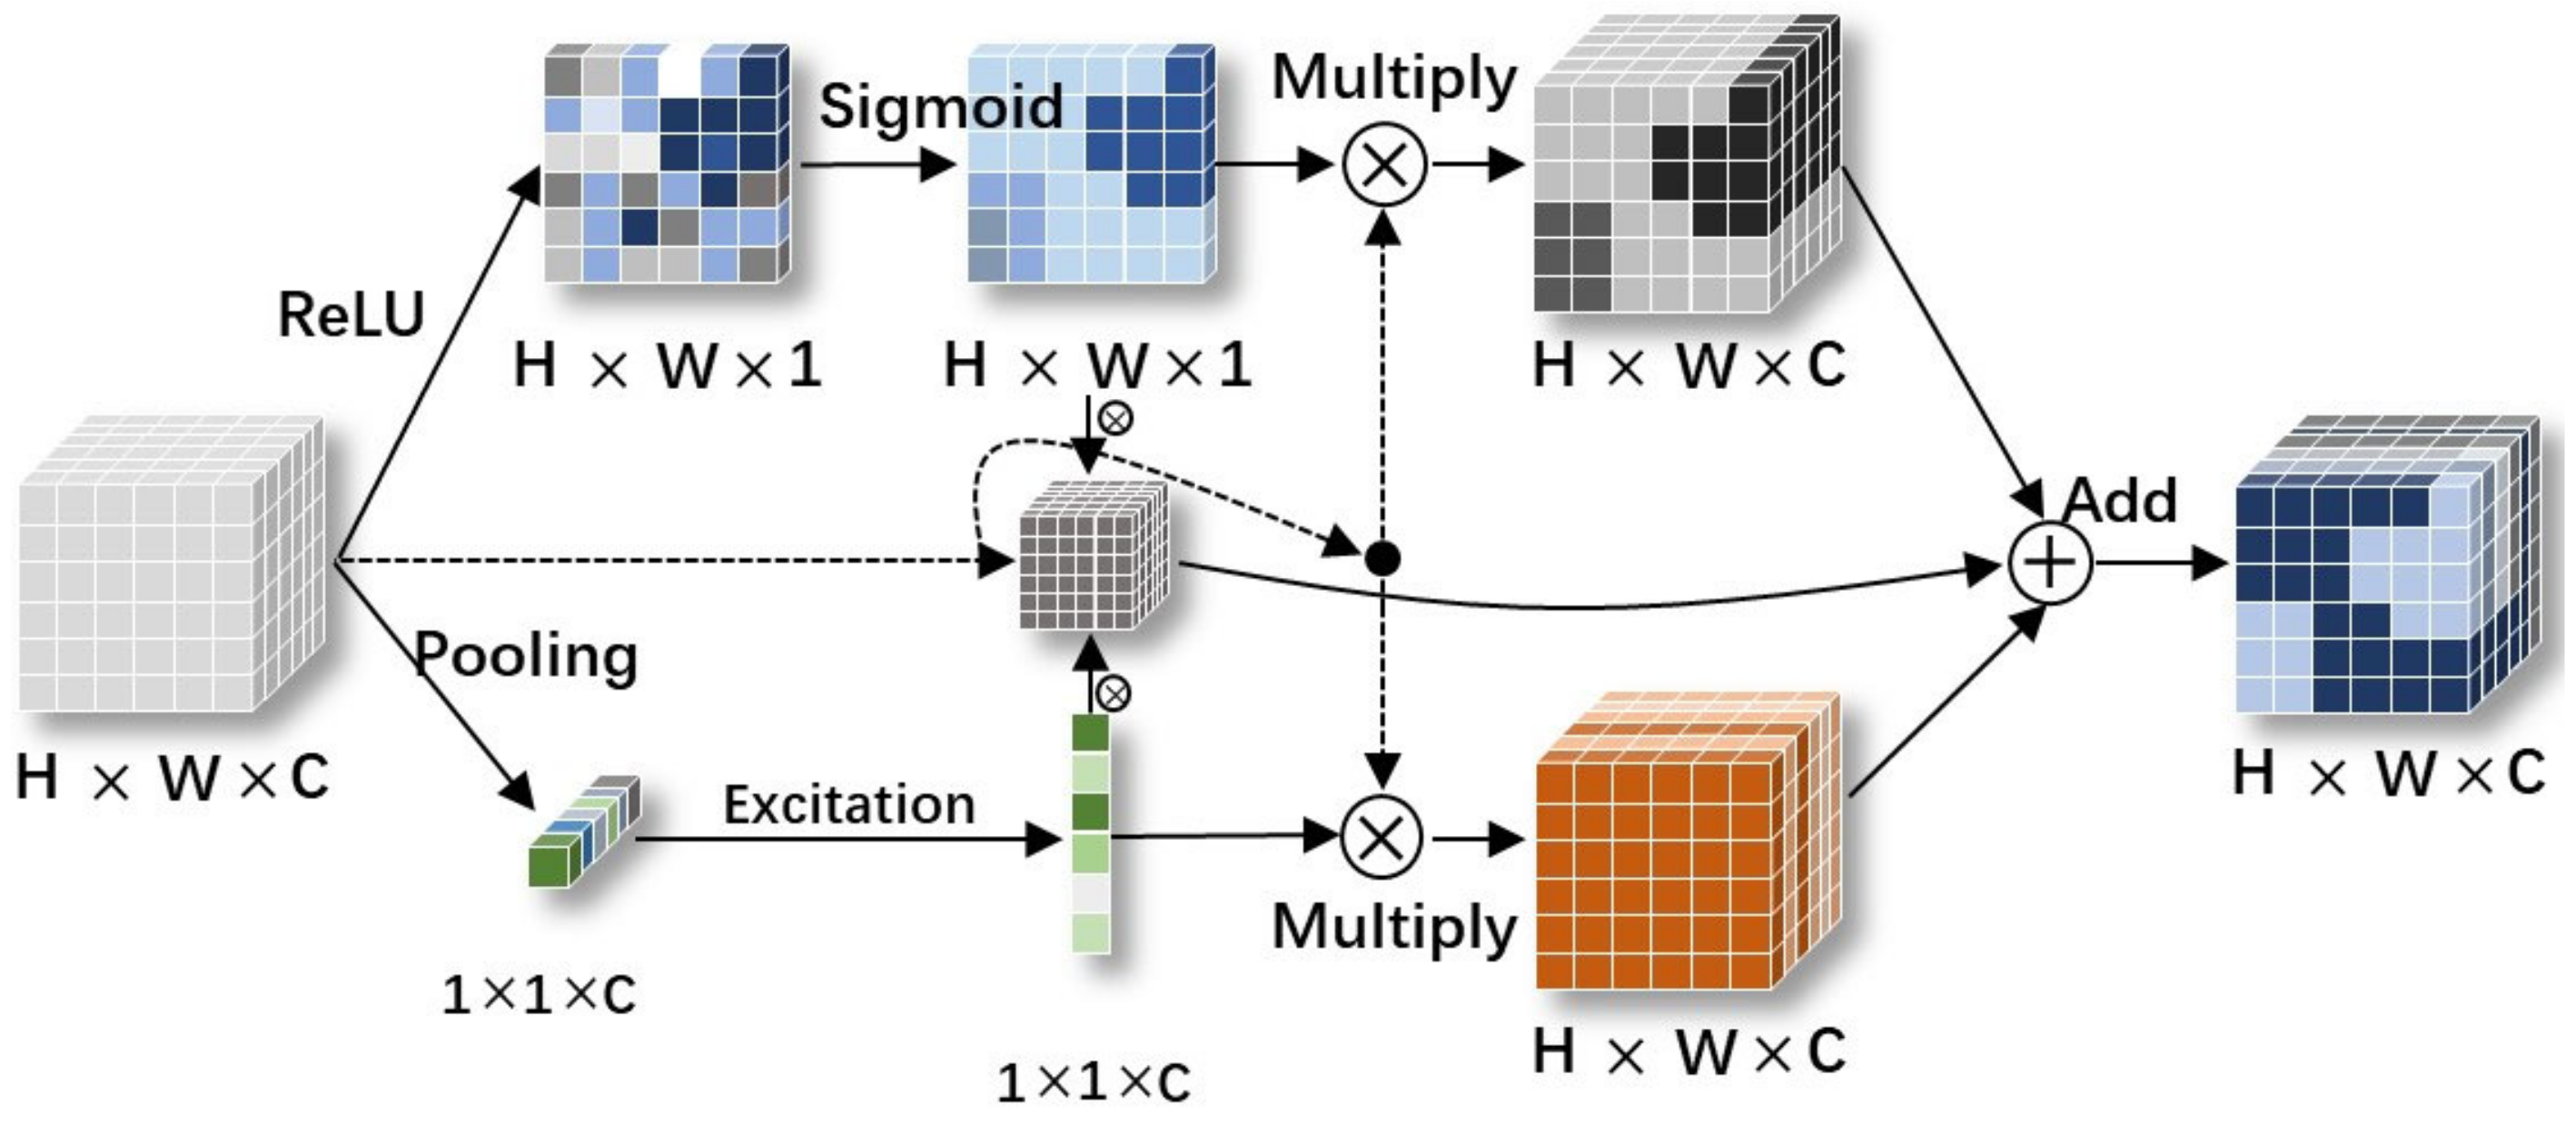
A Convolutional Neural Network (CNN) has the characteristics of strong representation, fast inference, and weight sharing characteristics, and CNNs show better results in image segmentation [5,49]. The core computation of CNNs is implemented by the convolution operator, which learns new feature maps from the input feature maps by convolution kernels. Essentially, convolution is a feature fusion of a local region, which includes spatial (H and W dimensions) and interchannel (C dimension) feature fusion. For convolution operations, a large part of the work is to improve the receptive field, that is, to fuse more features spatially or to extract multiscale spatial information. For channel dimension feature fusion, the convolution operation basically connects all channels of the input feature map by default. The feature fusion of the spatial dimension realizes the continuous abstraction of spatial features with the deepening of the number of layers. In order to make the model effective at both the channel and spatial levels of attention, we combine channel attention and spatial attention to form a deep attention module (Figure 4). The channel attention mechanism uses global descriptors to capture the relationship between channels and assign weights to channels [50]. The spatial attention mechanism restricts the activated part to the region with segmentation, reduces the activation value of the background to optimize the segmentation, and plays the role of strengthening important features and suppressing secondary features. The deep attention module can guide the model to focus on the areas and channels that need to be learned and effectively model image information.
The deep attention module brings together the spatial and channel attention information and has the attention variant information after multiplying the two. This variant information has a stronger guiding ability and has the advantage of integration over spatial and channel attention. Compared with the traditional operation means, the deep attention module does not simply stitch the attention-weighted feature maps of the two branches. The spatial and channel attention weights are multiplied with the input feature matrix at the same time, and the obtained feature signals have stronger integration. Finally, the output of the deep attention module is obtained by making an addition operation of the three.
The calculation process of the transfer deep attention module is as follows:
T D A = S i l + C i l + S i l C i l
S i l = σ 2 ψ T σ 1 W x T x i l + W g T + b g + b ψ
C i l = σ 2 W 2 σ 1 W 1 z
where T D A identifies transfer deep attention module, S identifies spatial attention mechanism, and C identifies channel attention mechanism. σ 2 is the sigmoid activation function, σ 1 is the ReLu activation function, and z identifies global average pooling.

2.5. Comparison Methods and Evaluation Metrics

We evaluate our method, separately, from quantitative and qualitative perspectives. F1-score(F1), Precision(P), recall(R), false alarm (FA), and missing alarm (MA) are used as quantitative evaluation metrics. We use FCN [37], UNet [38], SegNet [39], and UNet++ [51] as comparison models, where the FCN used is an optimized version using the pretrained VGG16 as the feature extraction layer. UNet and SegNet are the same versions as in the original paper, i.e., UNet is the classical encoding and decoding structure with 4 down-sampling and 4 up-sampling layers, and SegNet uses the first 13 layers of VGG16 for the encoding part. UNet++ is the L2 pruning model in version.
The calculation formula of the evaluation metrics is as follows:
F 1 = 2 T P 2 T P + F P + F N
P = T P T P + F P
R = T P T P + F N
F A = F P T P + F P
M A = F N T P + F N
where T P is the number of positive samples classified by the model correctly, F N is the number of positive samples classified by the model incorrectly, T N is the number of negative samples classified by the model correctly, and F P is the number of negative samples classified by the model incorrectly.
FCN is an initial attempt to perform pixel-level classification of images, addressing the problem of image segmentation at the semantic level. The FCN used in the experiments is not the original version but a modified version using VGG16 as the pretrained feature-extraction backbone. This approach was used because we wanted to further explore the difference in accuracy with the introduction of the pretraining module compared to the normal model.
The UNet is a classic semantic segmentation network that has been successfully used in the field of remote sensing image processing. It is a fully convolutional neural network with a U-shaped structure, with the encoding path on the left and the decoding path on the right. The UNet model used in this paper is the classical version, but its output has been modified to accommodate the pattern of binary semantic segmentation. In addition, it has four layers for both encoding and decoding parts.
SegNet is also a fully convolutional neural network but does not use the same techniques as FCN in the encoding and decoding parts. The encoder part of SegNet uses the first 13 layers of VGG16, and each encoder layer corresponds to a decoder layer. The final output of the decoder is sent to the SoftMax classifier, which generates category probabilities for each pixel independently.
UNet++ has made further improvements based on UNet. It mitigates unknown network depths by efficient integration of U-Net of different depths and designs a highly flexible feature fusion scheme and a pruning scheme for model acceleration. Although the dense skip link structure of UNet++ is able to capture features at different levels and bridge the semantic gap between encoder and decoder feature maps, it has a large number of parameters, which in turn leads to its inefficient operation. This large consumption of time reduces the usability of UNet++ because the analysis and evaluation of disasters require a lower time investment. The L2-mode of UNet++ achieves almost the same level of detection accuracy as not only L3 and L4, but its time cost is also small. We believe that better results may be obtained if the full UNet++ is used in our experiments, but this improvement in accuracy will not be too great. At the same time, the time cost of the full UNet++ will be high. Therefore, we used the pruned UNet++ model.
The models involved in the comparison are relatively classical semantic segmentation networks, which are often used in remote sensing image change detection, and many researchers have proved their performance.

3. Results

3.1. Experimental Setup and Model Training

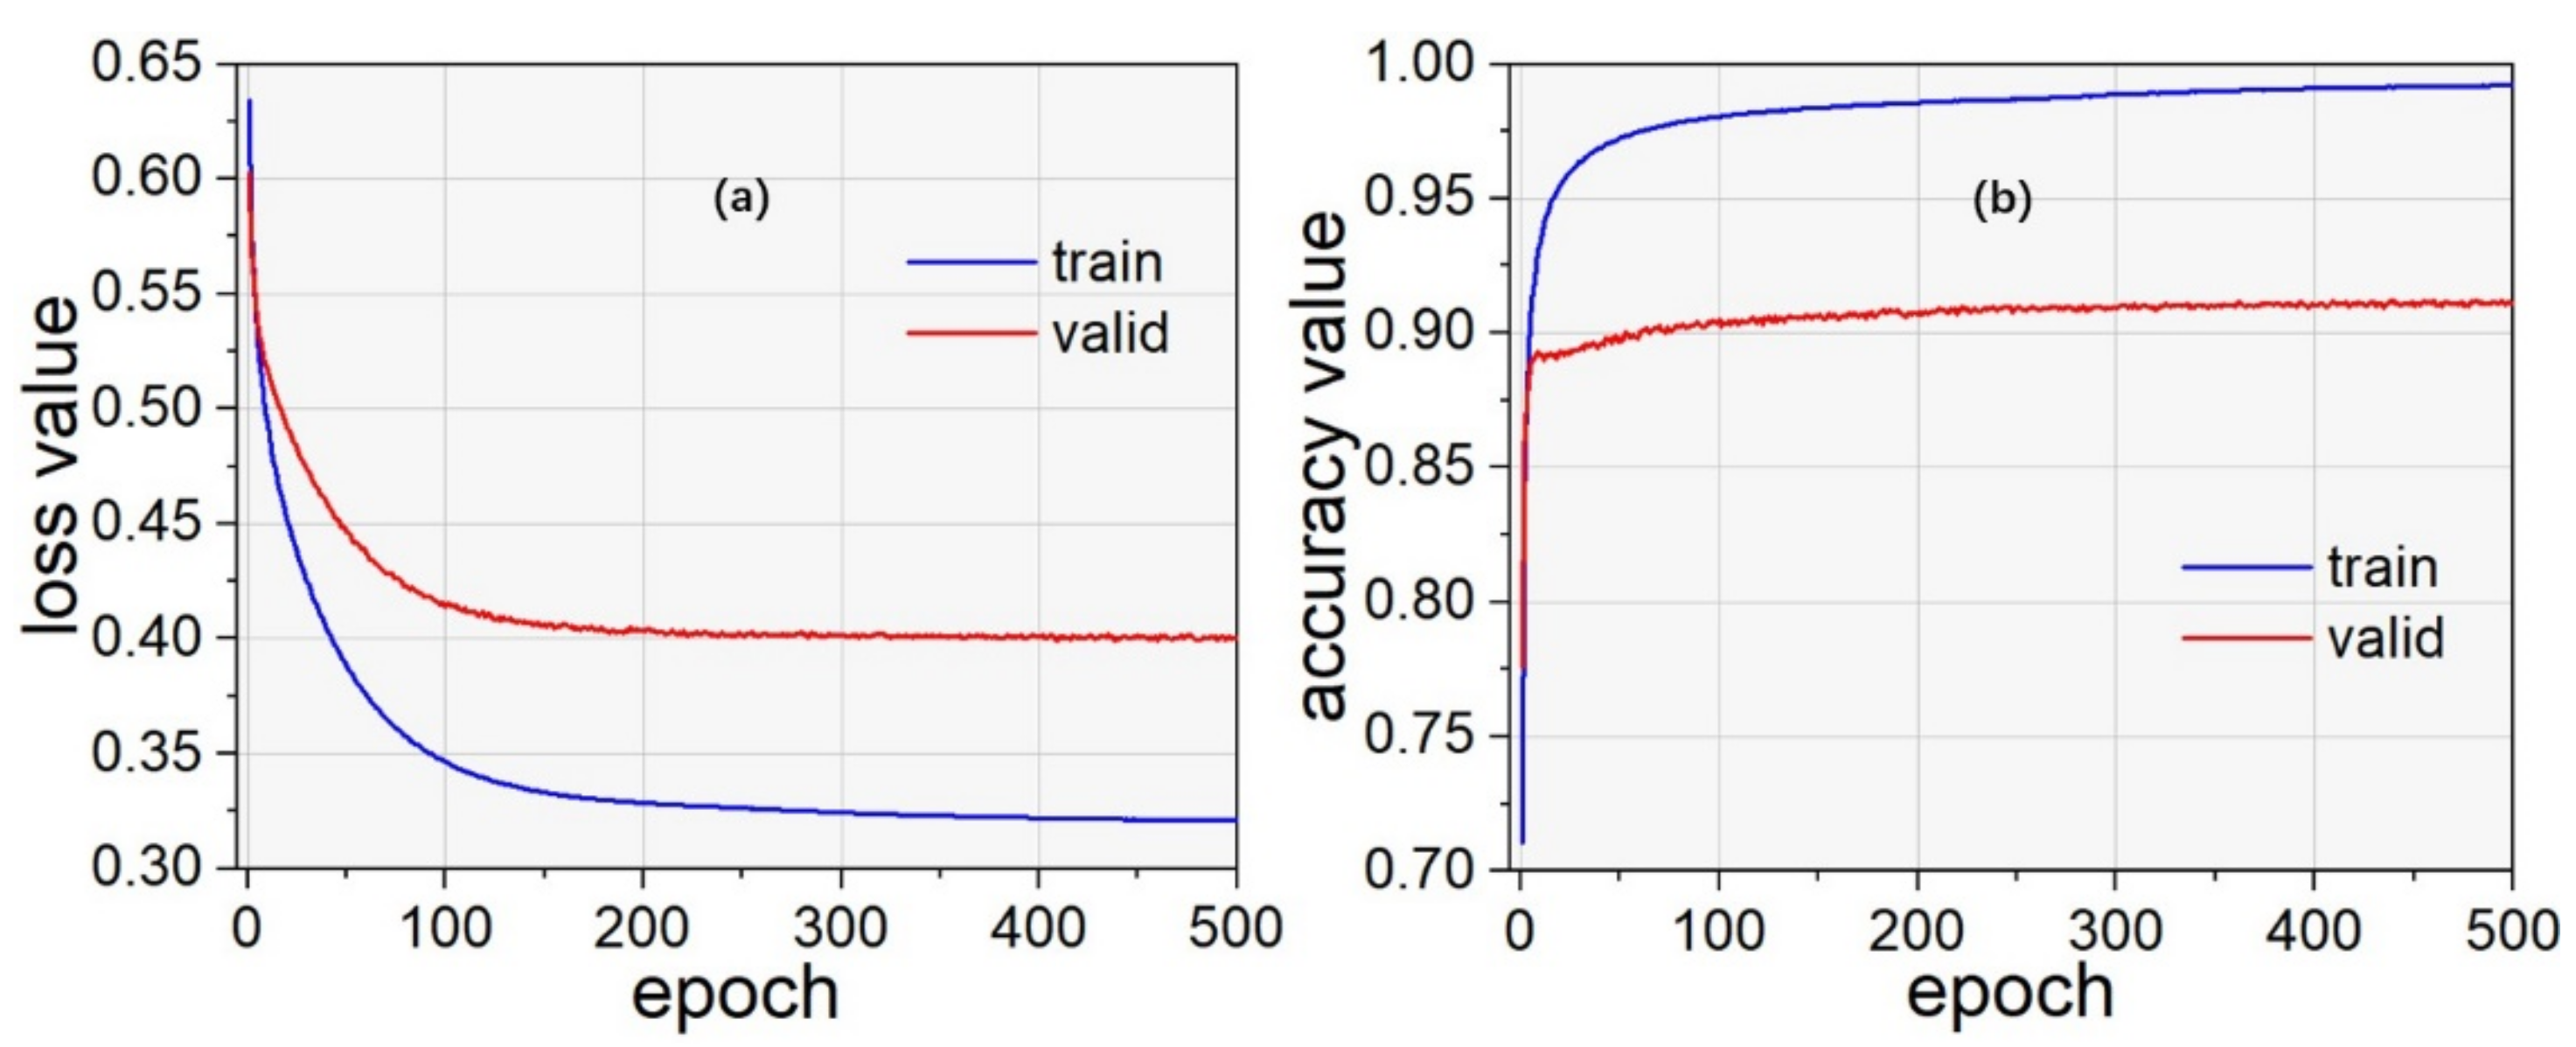
Our model is built using Pytorch, running on an Intel(R) Xeon(R) W-2245 CPU (3.90 GHz, 64 GB RAM) and a single NVIDIA GeForce RTX 3090. In the pretraining phase, we trained ResNet101 with a total of 3915 pairs of patches of size 256 × 256 pixels, and 1393 pairs of patches of the same size were used to validate the model. The number of patches involved in training and validation at one time is 16 and eight pairs, respectively. We chose Adam as the optimizer, and the initial learning rate was set to 1 × 10⁻⁴. It is worth mentioning that our training and validation datasets are regenerated from the original dataset. In the original dataset, the size of each patch is 1024 × 1024 pixels. In order to avoid the imbalance of positive and negative samples, we judge each patch when generating a 256 × 256 size patch to ensure that each patch contains no less than 3000 positive samples. We recorded the values of evaluation metrics during training, i.e., training dataset accuracy and loss and validation dataset accuracy and loss. This is shown in Figure 5.
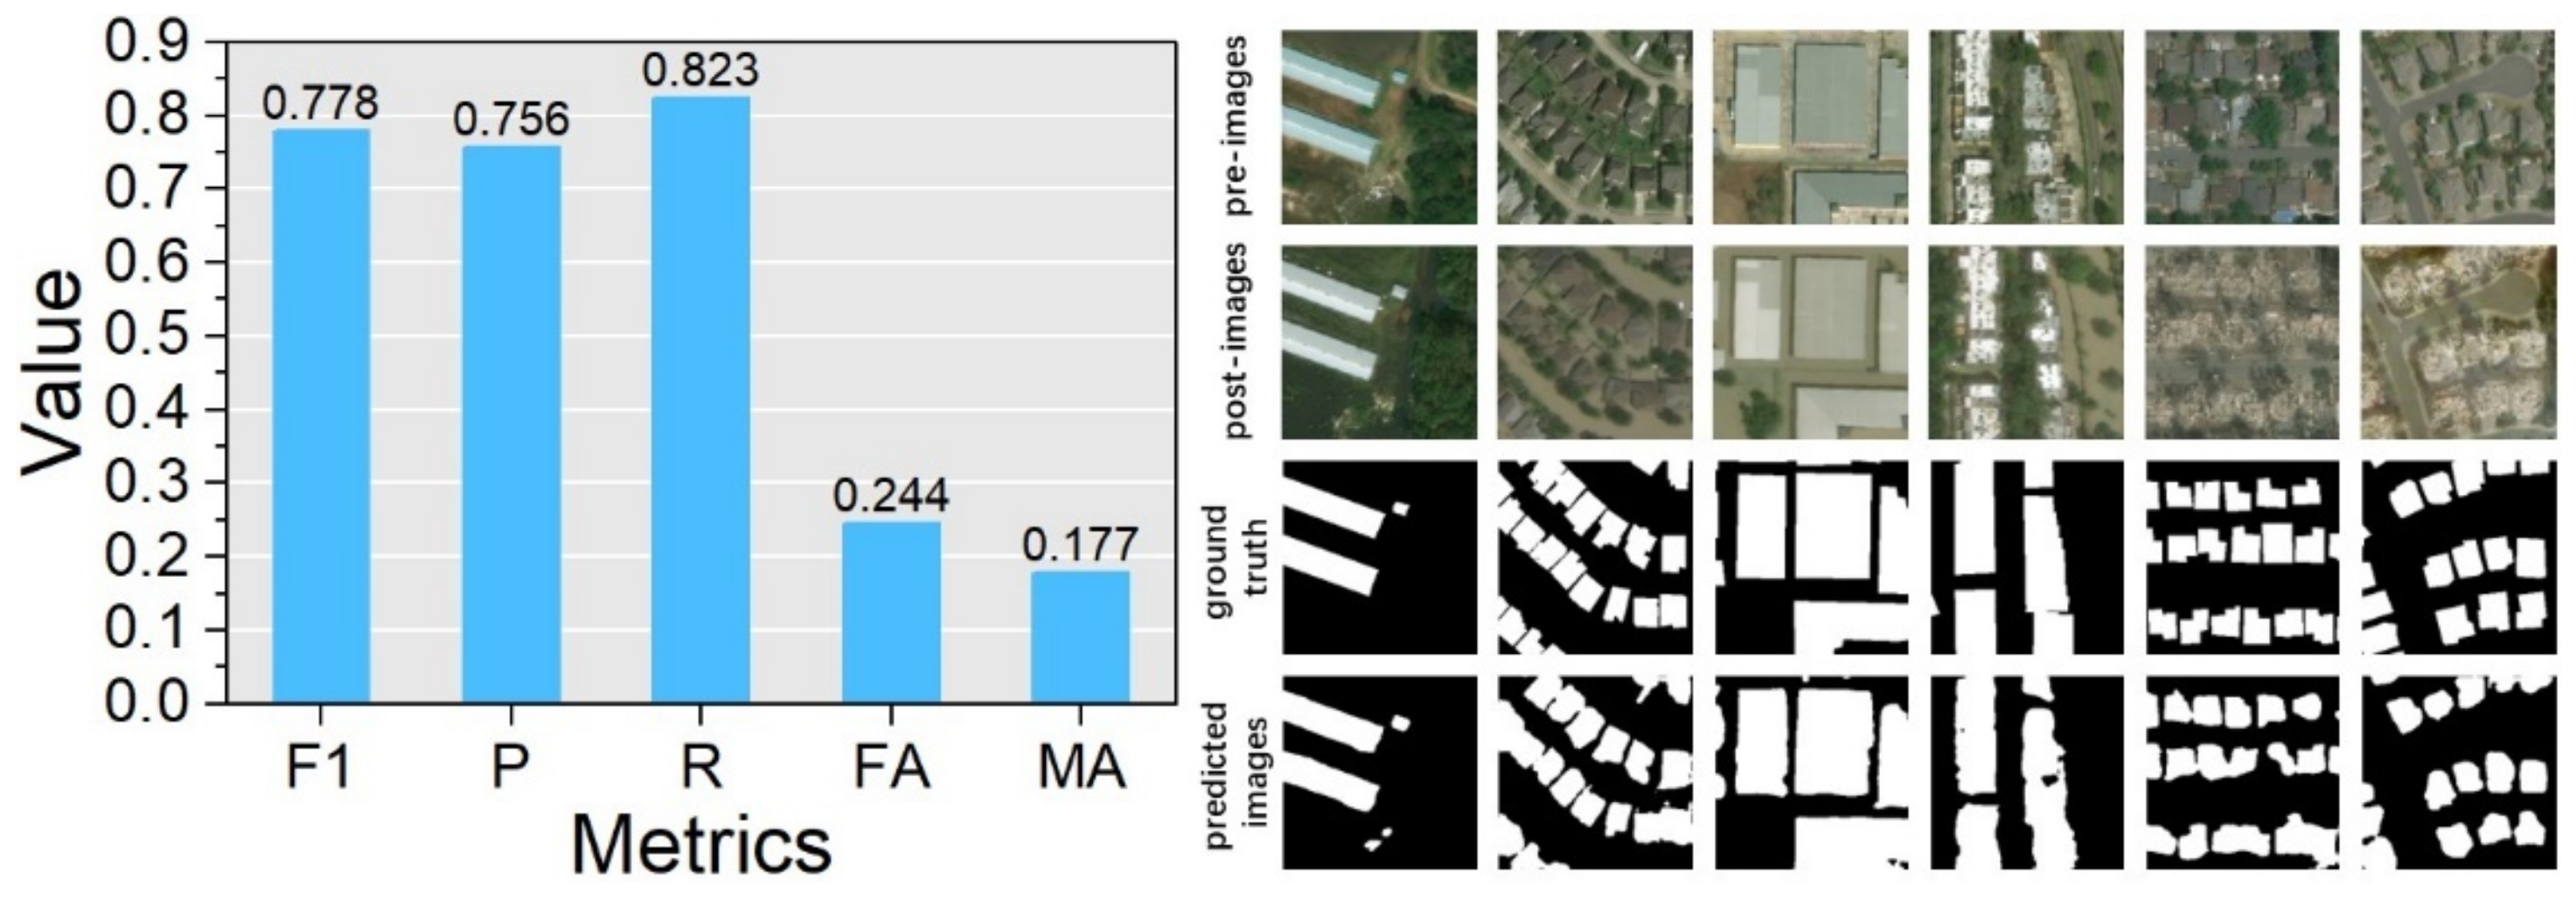
It can be observed that as the number of iterations increases, the value of loss of training gradually decreases, and the value of precision gradually increases. Although the validation accuracy looks almost unchanged after 150 epochs, the trend of growth is there. The loss of the validation dataset eventually converges to 0.40, and the precision converges to 0.92. This indicates that ResNet101 was effectively trained. To verify its performance, we evaluated the model functionally using 1134 test samples. By comparing the prediction results of ResNet101 for all samples with ground truth, the average values of F 1 , P, R, FA, and MA can be calculated. In order to value the magnitude of each metric, we plotted the accuracy histogram. Intuitively, some samples are visualized to facilitate the observation of the model’s ability to detect buildings in disaster areas, as shown in Figure 6.
The five metrics in the histogram visually reflect the performance of ResNet101. It achieves an average recall of 0.823, which indicates that the model has the ability to detect buildings from the disaster context. Moreover, the values of F 1 and P are both greater than 0.75, indicating that the pretrained ResNet101 completes a basic fit to the disaster image data. From some of its predicted samples, it can be found that the disaster buildings it finds in different scenes are intact, and the boundaries of these buildings are relatively clear and have a high degree of internal compactness.
During the training phase of TDA-Net and the comparison model, Adam, with a learning rate of 1 × 10⁻⁴, was still selected to be used as the optimizer. The size of the training samples is also 256 × 256 pixels in size, and the number of patches fed into the model for each of the training and validation datasets is eight and four. It is necessary to train the model using a small number of samples because this is the only way to verify the role played by the pretrained model. Experiments based on all three datasets used a small number of samples to train the model. The number of samples involved in model training and validation for the WHU Building Dataset, Beirut port dataset, and Tianjin Binhai New Area dataset are presented in Table 2. During the training process, the model with the highest validation accuracy is saved. In Table 3, the number of iterations and the validation accuracy values are shown when the different models reach the highest value of validation accuracy on the three datasets. The training process of each model on the three datasets is recorded in Figure 7.
It can be observed that TDA-Net leads the other four models in terms of loss value and accuracy on all three datasets, i.e., the loss value is always the smallest, and the accuracy value is always the largest. It is worth noting that TDA-Net converges quickly. Its loss and accuracy values converge to a more desirable level within almost 30 epochs. The loss value and accuracy value are the most basic evaluation metrics to reflect how well the model is trained. TDA-Net is ahead of other models in these two metrics, which indicates that its design is reasonable and effective. The binary segmentation ability of TDA-Net for remote sensing images of disaster areas can be proved in its comparison with other classical models. It is possible to believe that the design of its structure and operating principle is feasible.

3.2. Experimental Results of Building Damage Discovery

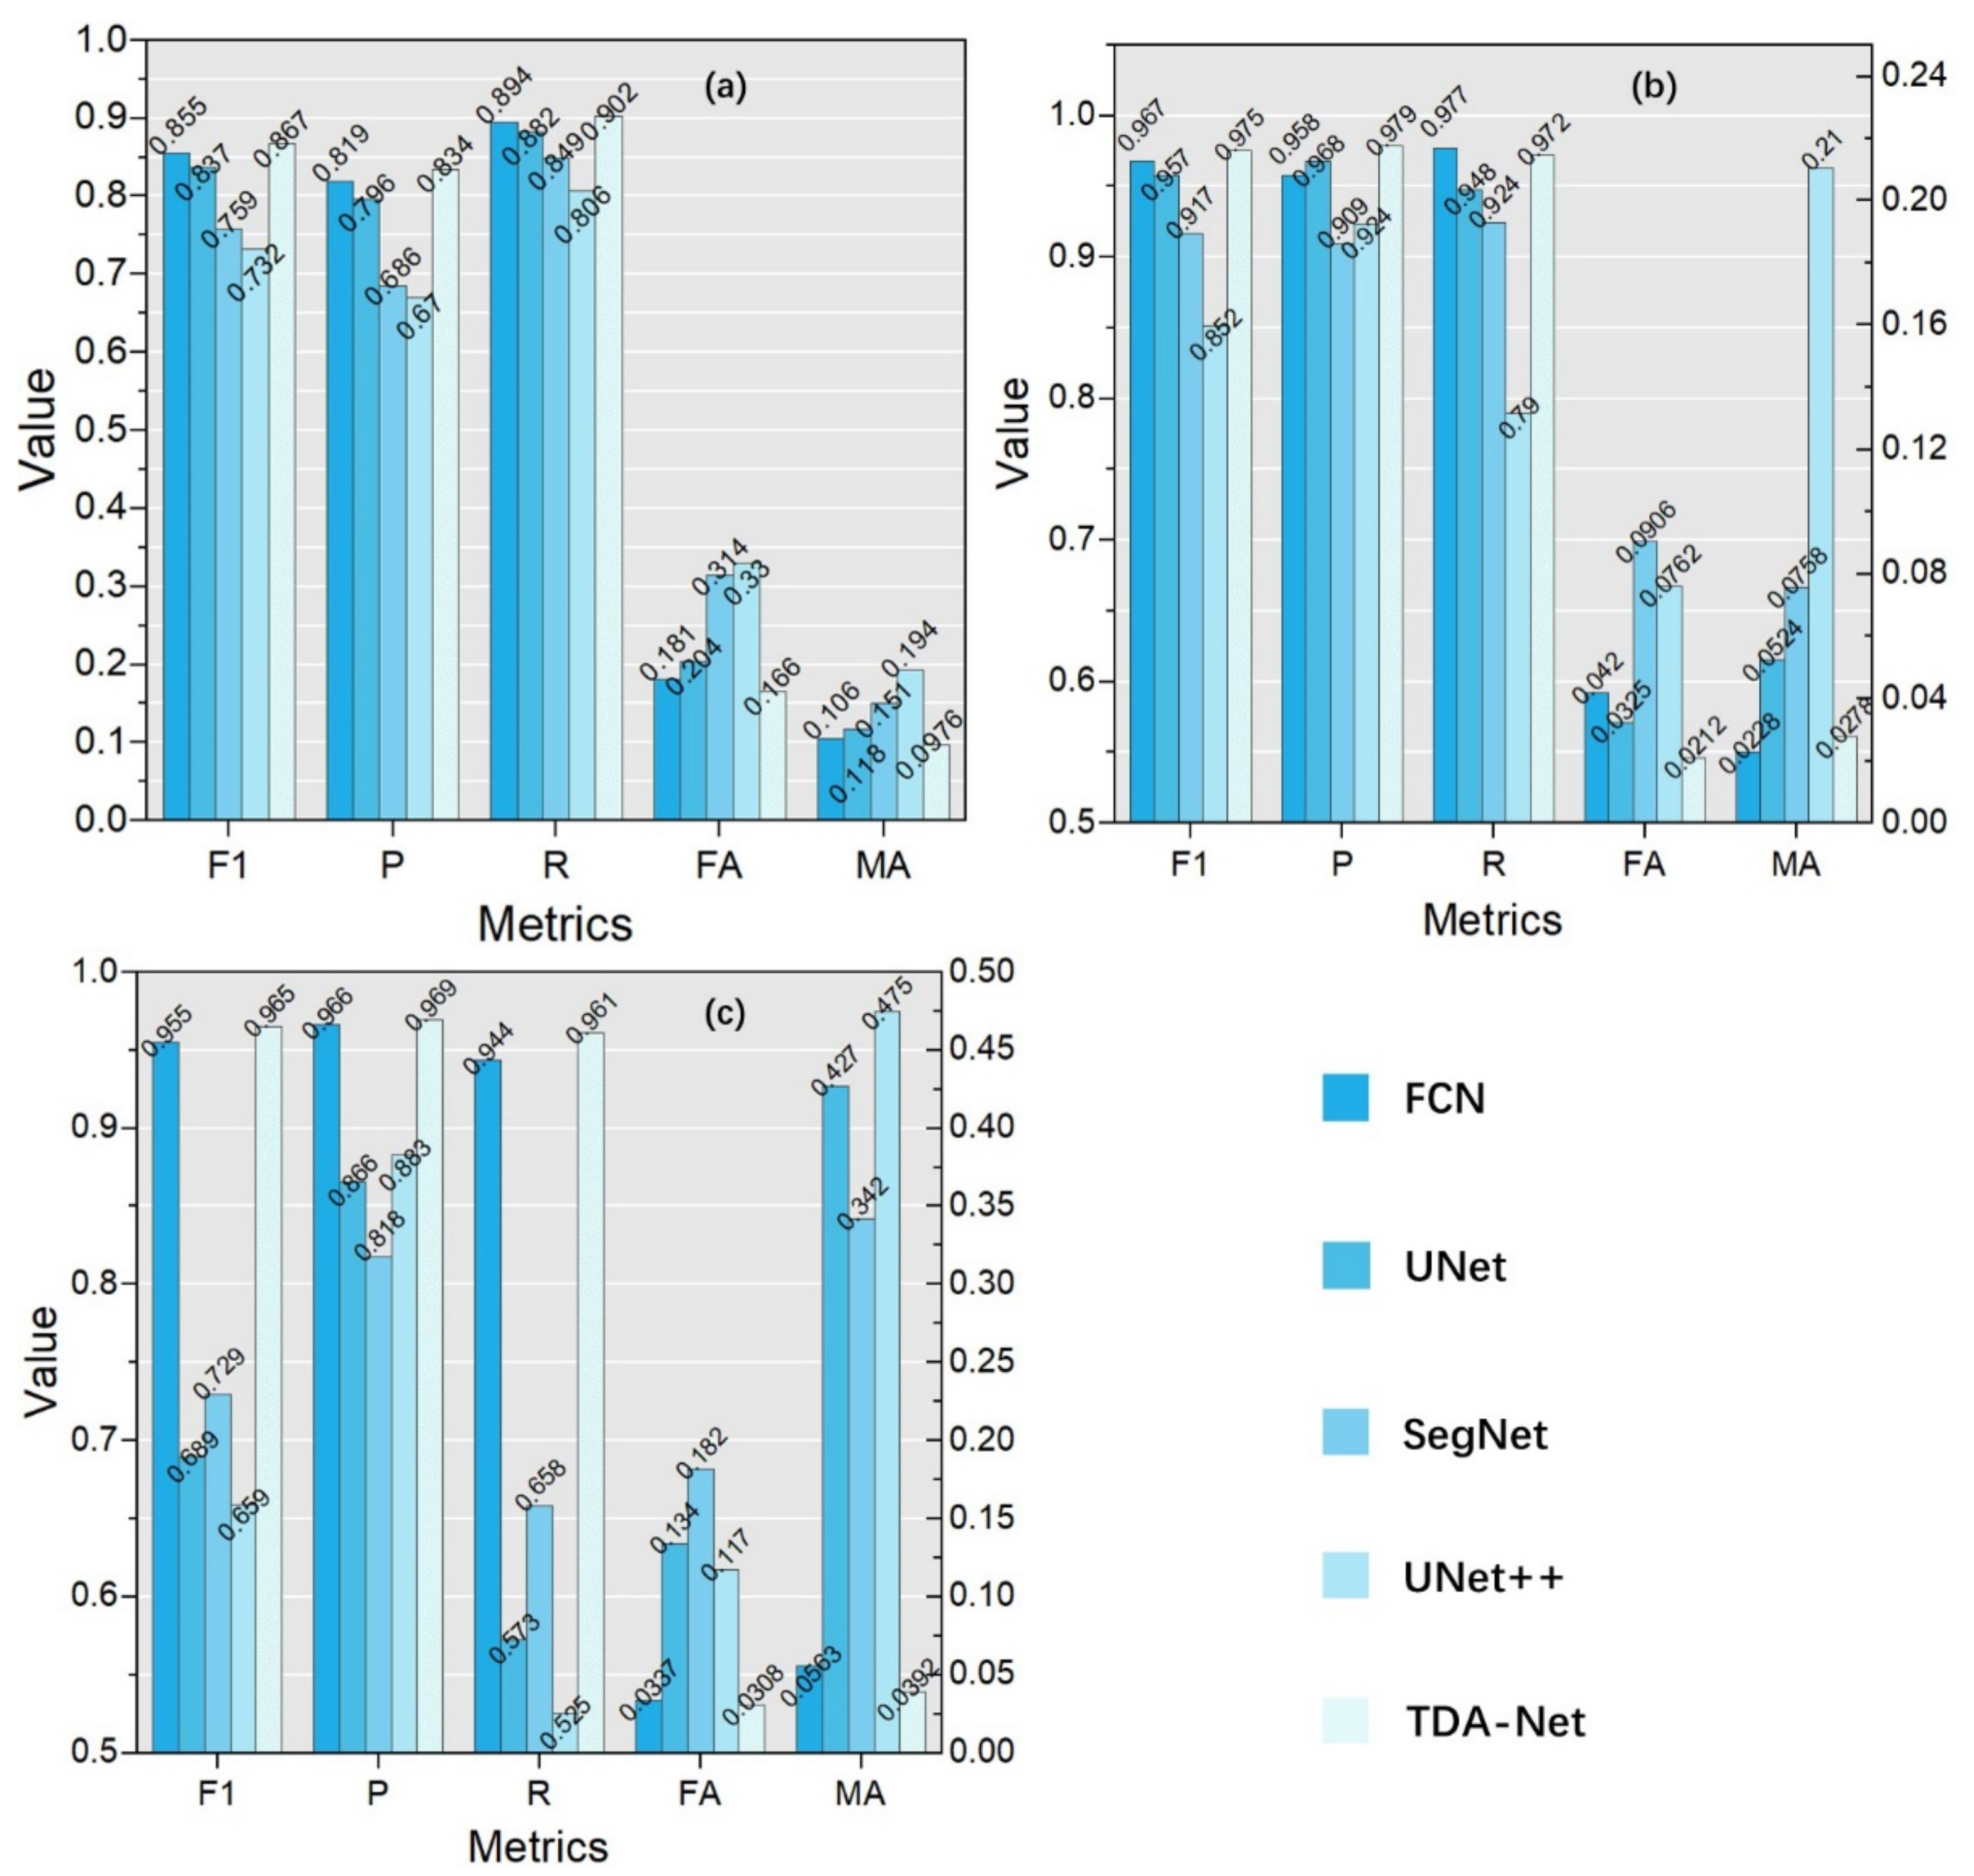
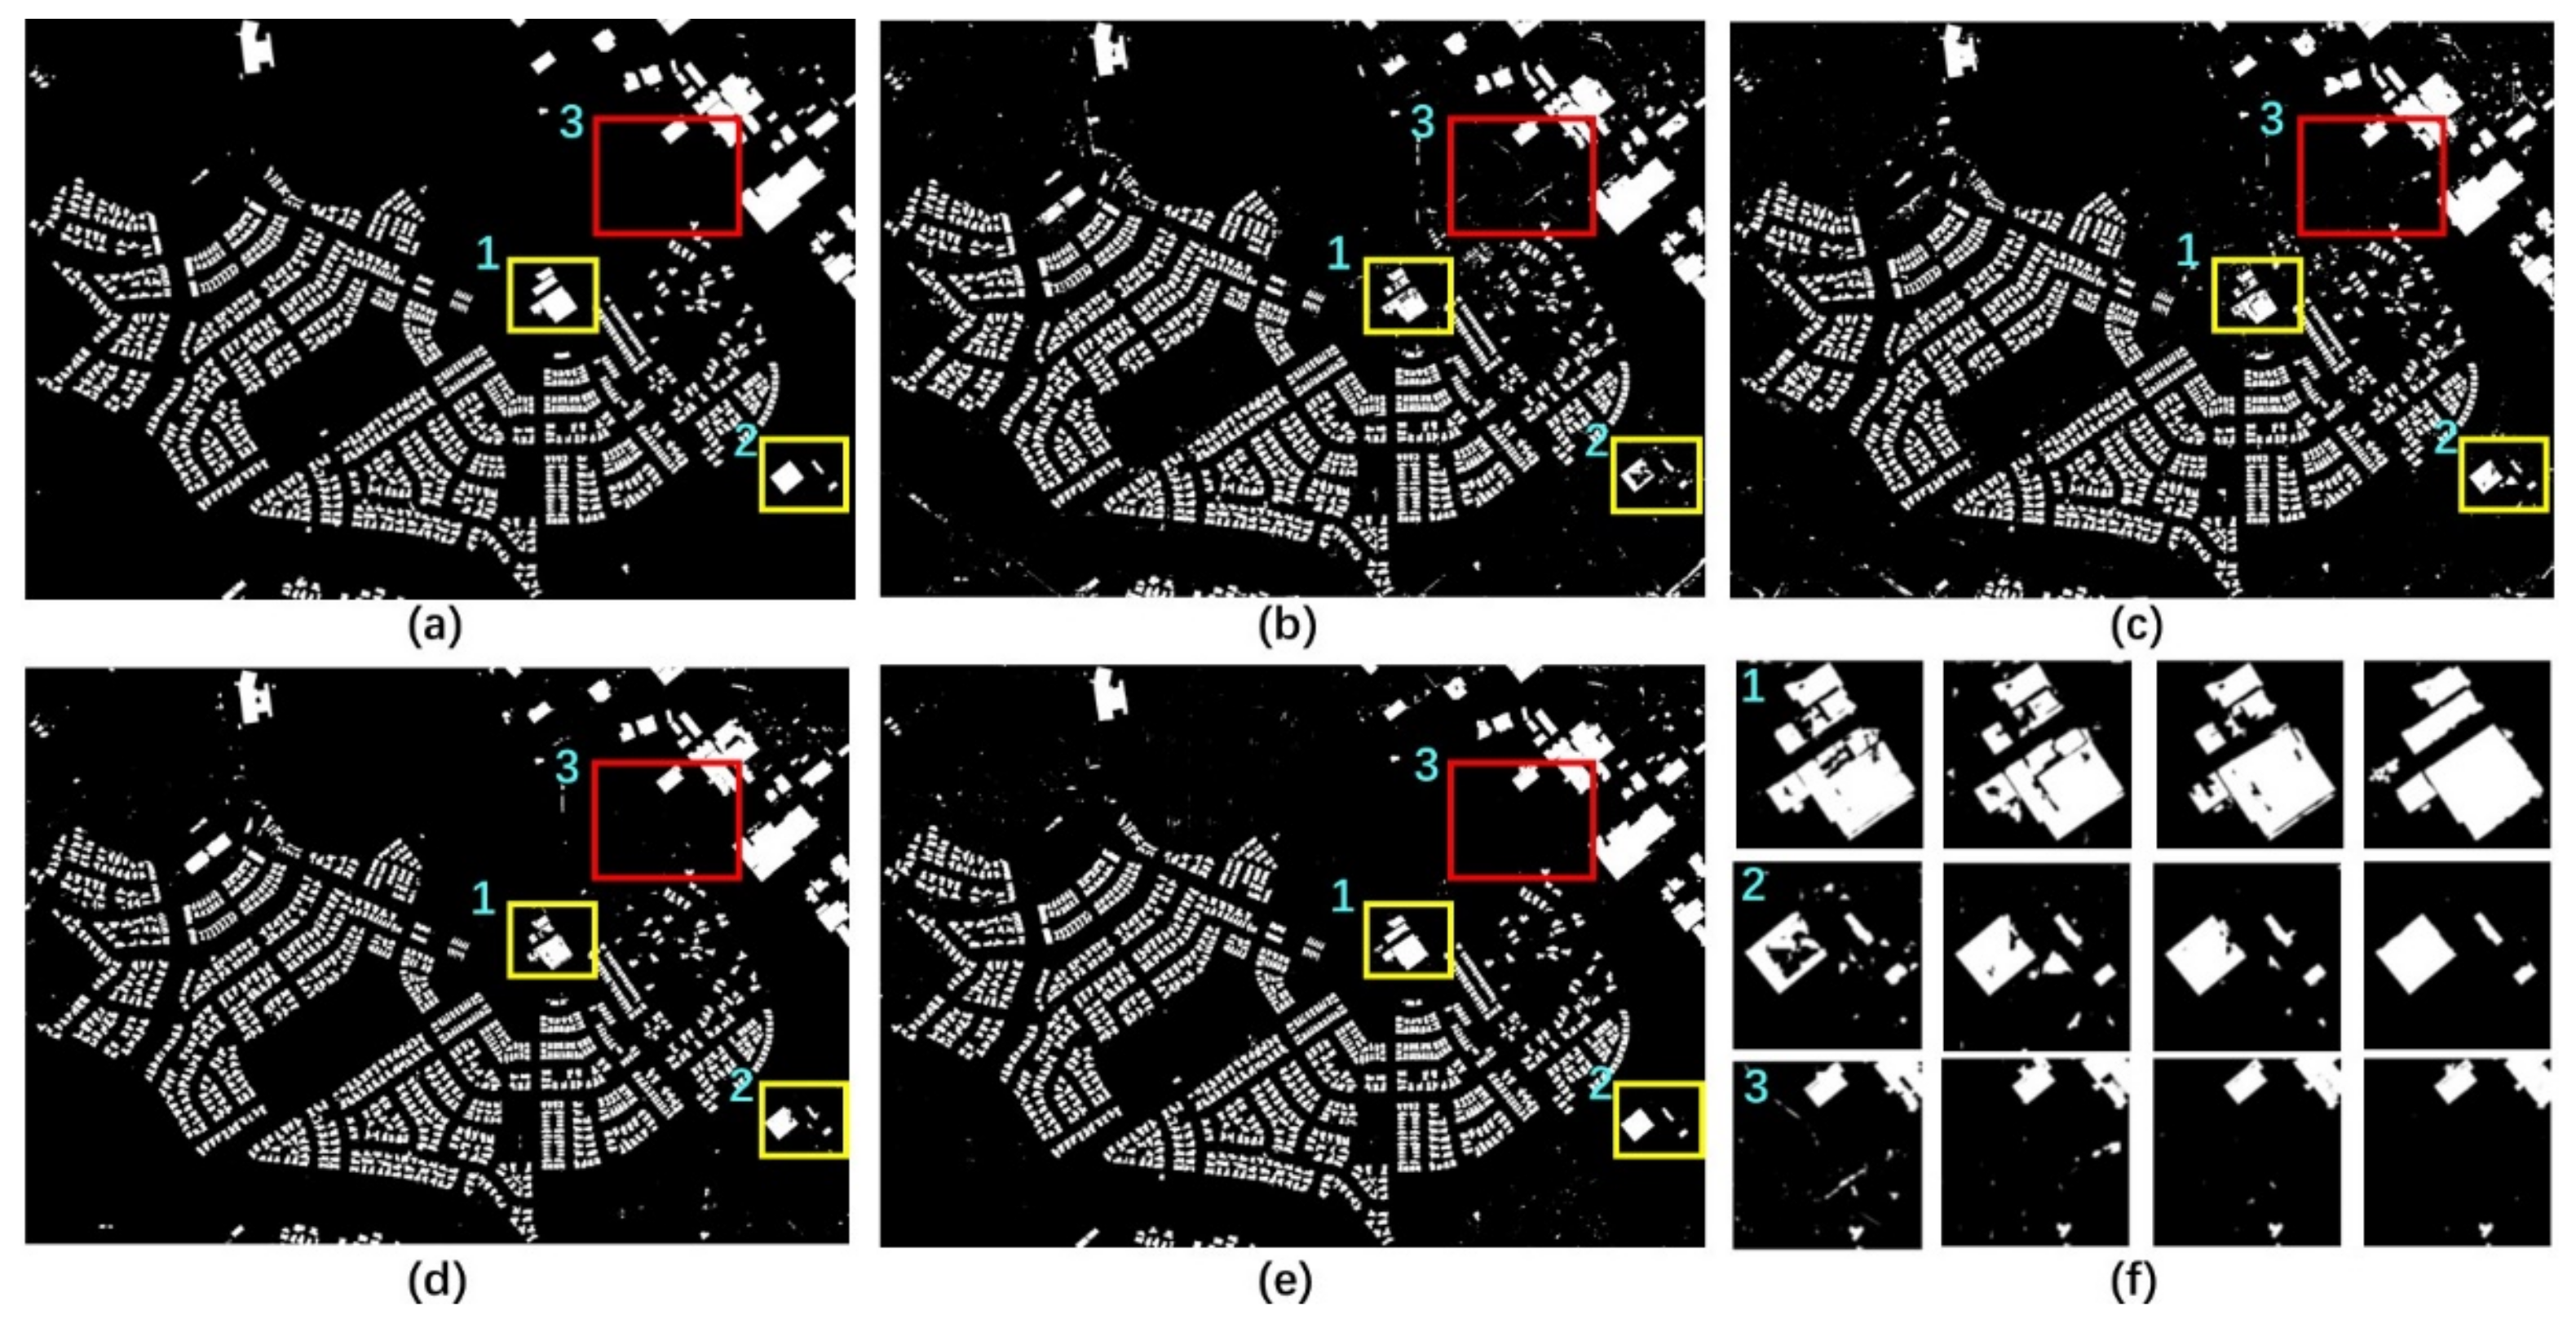
Based on the trained models, whole images from three experimental datasets are predicted to verify the ability of each model to detect damaged buildings. The image size in the WHU Building Dataset is 15,354 × 32,507 pixels, and a patch of size 256 × 256 pixels is fed into the model each time, and the whole image is traversed line-by-line in steps of 250 pixels in size. The image sizes of the Beirut and Tianjin datasets are 2954 × 3137 pixels and 4386 × 4360 pixels, respectively, and a patch of size 64 × 64 pixels is fed into the model at a time with a step size of 60 pixels. Moreover, each patch is normalized to the data before feeding into the model in the same way as it was calculated during model training. The prediction results of each model for the experimental area are shown in Figure 8. Figure 9 shows the visualization of the evaluation metrics.
As we can see in Figure 8, TDA-Net has fewer missing detections (yellow boxes) and false detections (red boxes) of buildings. The detection of individual buildings is relatively complete and has clear edges. The detection of group buildings is more consistent, and there are fewer false pixels between adjacent buildings. In contrast, the other models show varying degrees of false detections and missing detections. FCN performs best, which may be related to its backbone network using pretrained VGG16. The pretrained VGG16 can help the network to finish fitting the data as soon as possible given the limited training samples; UNet and SegNet, on the other hand, use only training samples and fit the data distribution from scratch, which may require a longer training period. As a result, both have a high rate of missed detection, and the detection of buildings is always incomplete. It should be noted that the false detection rate of UNet++ is almost always high. We used the baseline model in the pruning mode because building detection in the disaster area should have efficiency as the first consideration, and UNet++ in the pruning mode is the most efficient. The performance of pruning mode UNet++ is degraded to some extent, and the degree of pruning is not easy to determine. Therefore, there are a large number of false detections during detection.
In Figure 9, it can be found that TDA-Net performs satisfactorily on the three datasets. The false detection rate and missing detection rate are small, which indicates that it is robust in detecting buildings in disaster areas. It is able to achieve good detection by clearly delineating the background and the affected buildings. The metrics obtained by FCN are most similar to those of TDA-Net but not as good as those of TDA-Net. The performances of UNet and SegNet are relatively close, and UNet++ has the worst performance, a phenomenon that is undoubtedly related to the reasons analyzed above. Specifically, the introduction of the pretraining module in FCN did produce good results, as FCN performed comparably to TDA-Net in almost every set of experiments. This suggests that the inclusion of the pretraining module significantly improves the performance of the model, which is undoubtedly related to the feature extraction and integration capabilities of the pretraining module. The initially optimized network weights will be more sensitive to the new task in terms of information perception, and the optimization of weights based on this will be more efficient. While the other three models do not use the pretraining module, their performance is poor. Additionally, the fact that FCN does not perform as well as TDA-Net indicates that the design principle or structure of the latter is excellent.
In addition, TDA-Net still has other advantages over FCN. First, when a disaster occurs, it is necessary to obtain timely information about the damaged buildings in the affected area. Secondly, using the idea of transfer learning to obtain some basic models and applying these models to the field will achieve some practical value. Specifically, our model performs very efficiently. Because it is fully pretrained, it has a high sensitivity to buildings in the disaster context. It is able to fit the remote sensing data of the disaster area relatively quickly. This is very helpful for disaster assessment work. In addition, the model we trained on xView2 can be used as a benchmark for other disaster studies. Other researchers can borrow this idea from us for change detection in disaster areas.

4. Discussion

From the experimental results we obtained, it does appear that the pretraining module is more useful for TDA-Net than the deep attention module. We believe that this is related to the feature extraction ability of ResNet101 and also to xView2. ResNet101 has a strong feature extraction ability, which can help TDA-Net to obtain useful feature information. Additionally, xView2 is a large disaster dataset, which contains many types of disasters and can effectively train the model to make it acquire a stronger data modeling capability. In addition, although the pretraining module achieves a better performance, this may be related to the design of the network because the “nopre” version of the model is based on TDA-Net with all ResNet101 removed, while the “noatt” version only removes the deep attention module.
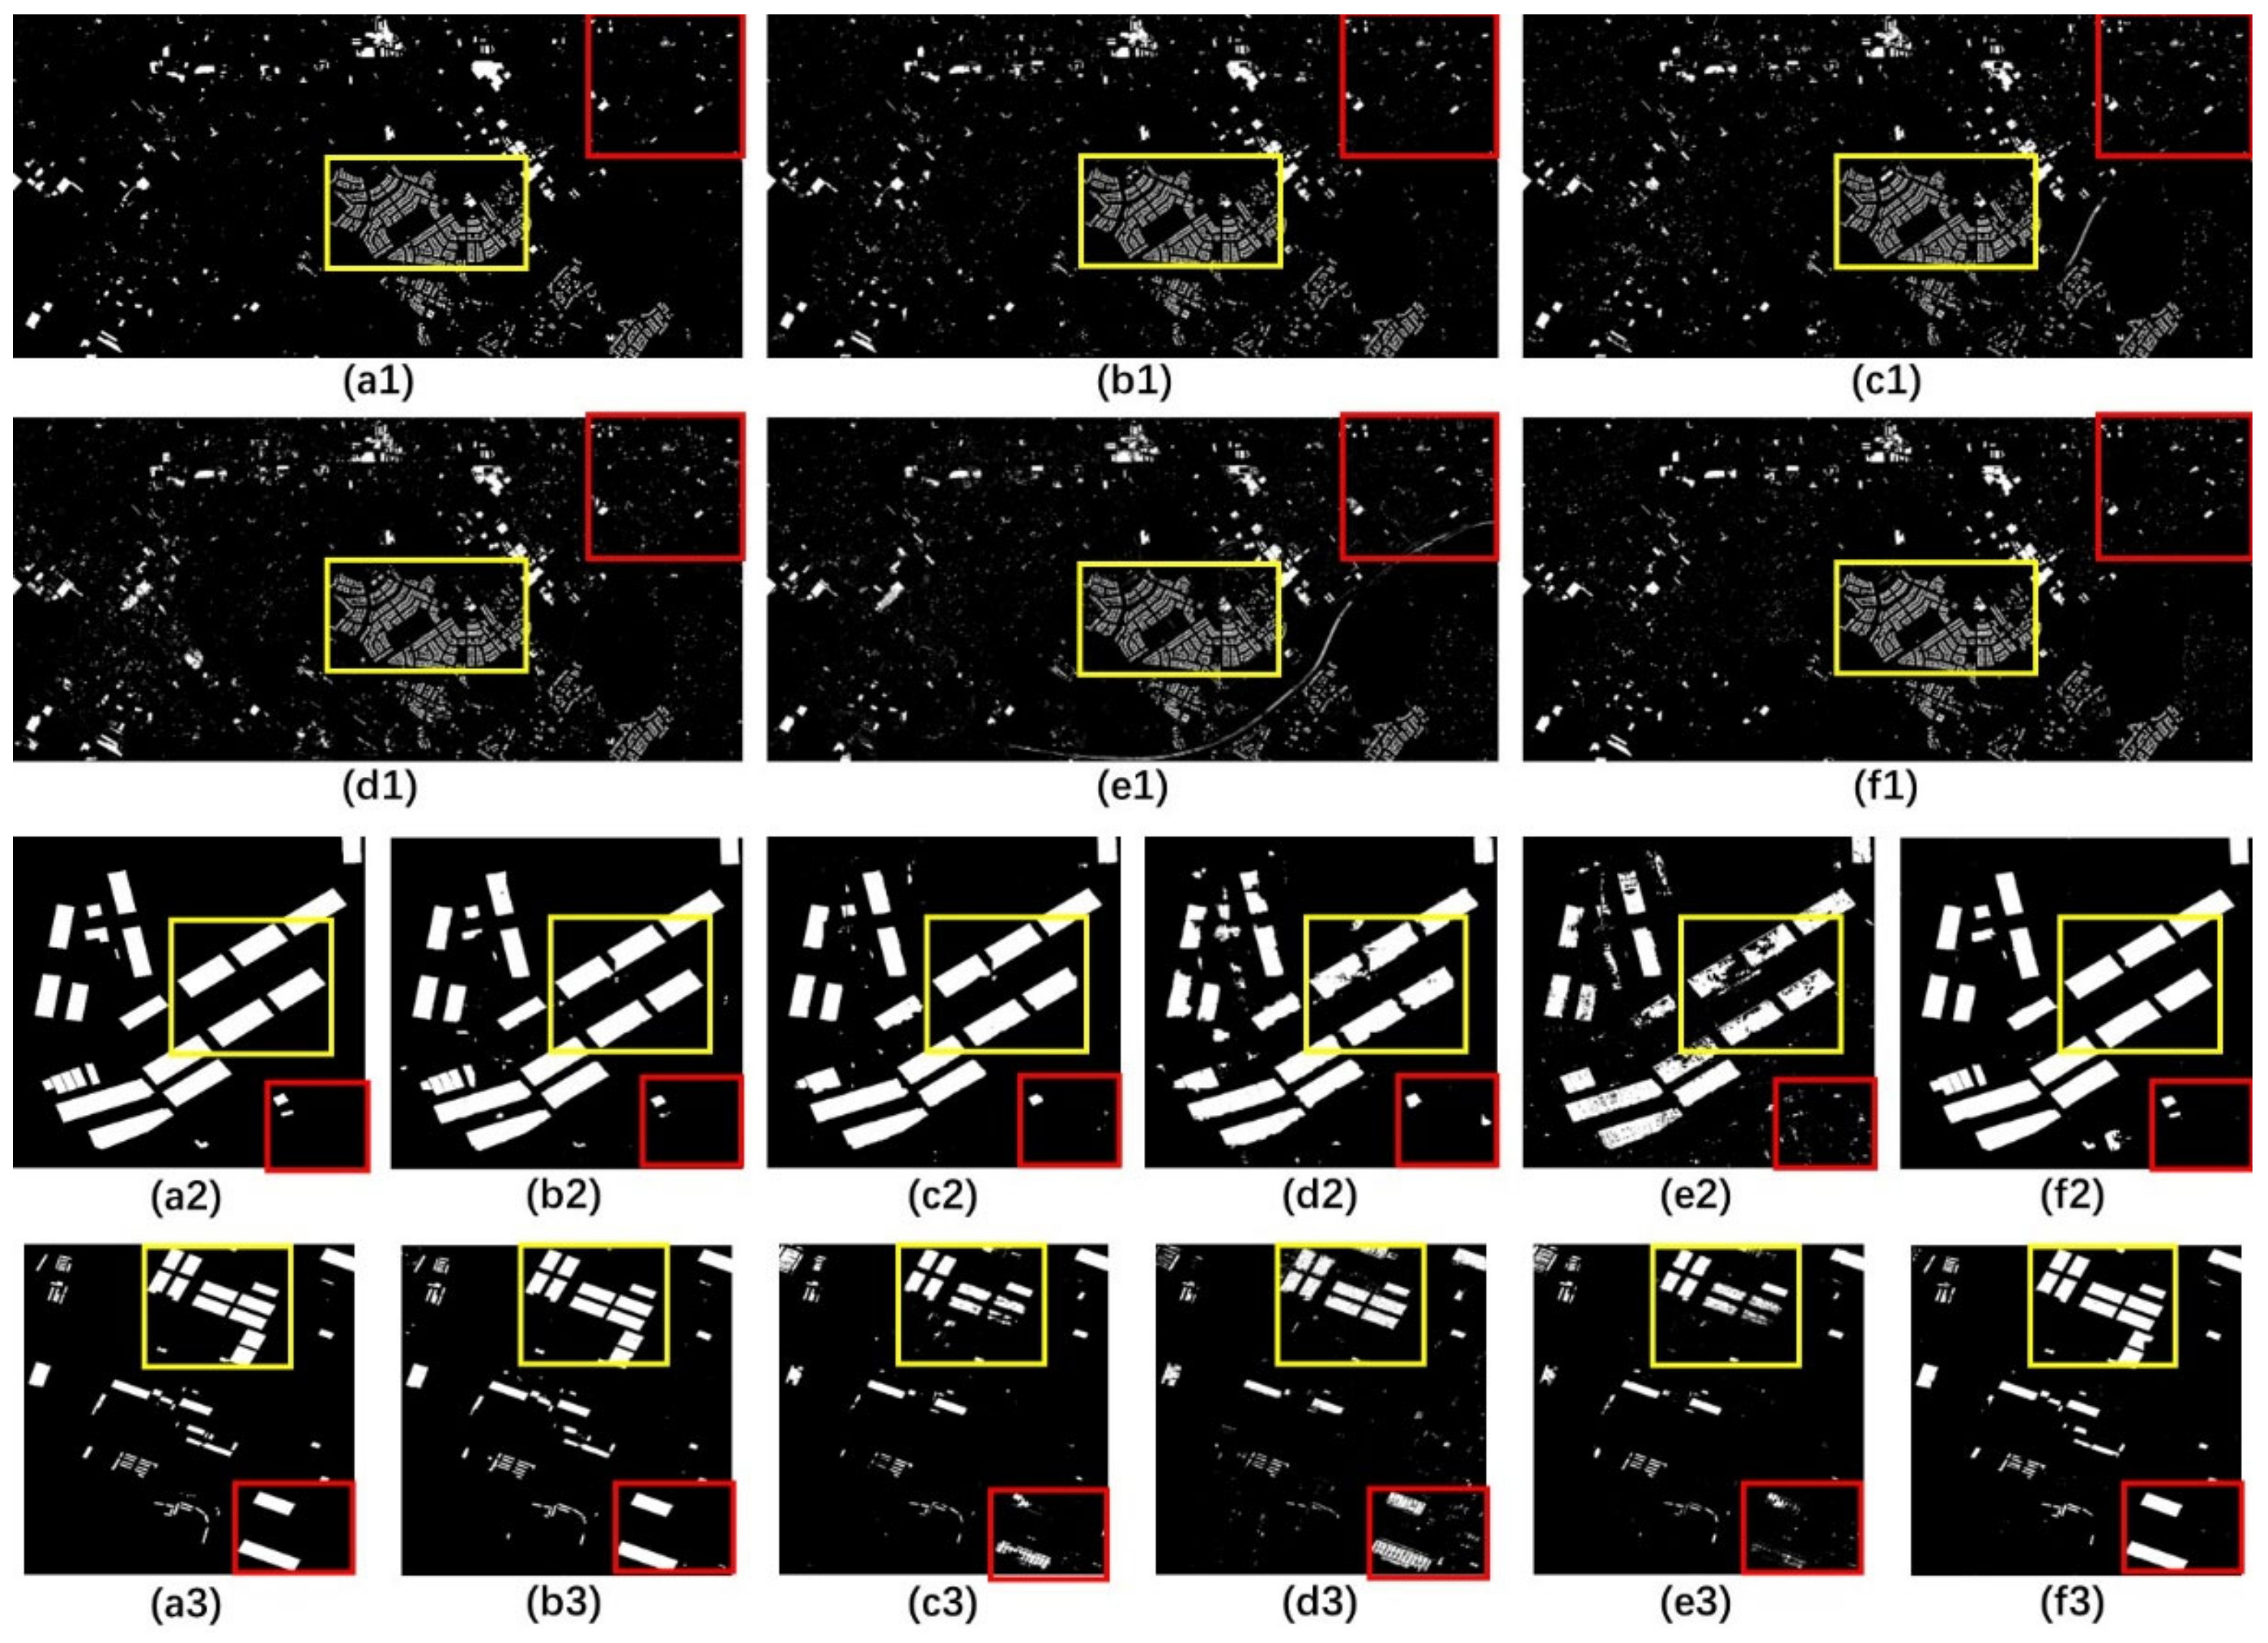
The role played by the pretrained model and the deep attention module on TDA-Net is worth exploring. We designed an ablation experiment in order to verify the effects that both have on the model and to analyze the role they play behind TDA-Net. The three models involved in the ablation experiment are the TDA-Net_nopre model with ResNet101 removed, the TDA-Net_noatt model with the deep attention module removed, and the TDA-Net_noprenoatt model with both ResNet101 and the attention module removed. That is, TDA-Net_nopre is based on TDA-Net with ResNet101 removed and does not use it as the feature extraction front-end structure. TDA-Net_noprenoatt removes the deep attention module and replaces it with skip connections. TDA-Net_noprenoatt is based on TDA-Net with both ResNet101 and the attention module removed, and only the encoding–decoding structure and the low-dimensional feature reuse mechanism are retained. In addition, Adam is still used as an optimizer, and its learning rate is set to 1 × 10⁻⁴. We acquired a core region of size 7000 × 10,000 pixels in the WHU Building Dataset as a test area. The training data used are the same as those in Section 3.2, but the training period is shortened to 50 epochs. We use four retrained models for building information extraction on the test area (see Figure 10) and count the evaluation metrics of them (see Table 4).
The addition of the pretraining model and the deep attention module has had an immediate effect on the performance improvement of TDA-Net. The performance of all three shows an incremental trend. That is, both the pretraining model and the deep attention module have positive effects on performance improvement. TDA-Net_noprenoatt has the worst performance, with a high rate of missing detection (see yellow box) and false detection (see red box), incomplete detection of buildings, and poorly defined edges of buildings. TDA-Net_nopre is complete in detecting buildings because of the deep attention module, which makes it more capable of feature sense, but there are still many false pixels. TDA-Net_noatt also achieved satisfactory performance, and it outperformed TDA-Net_nopre. TDA-Net performs best with clear edges, complete individuals, and fewer false pixels detected. It is worth mentioning that the use of the pretraining module seems to improve the performance of the model more, while the additional utilization of the deep attention model improves the performance of the model to a small extent, as can be clearly observed in Table 4. This phenomenon may be due to the fact that the pretrained model plays a more important role inside the network, making the model more sensitive to image features and more able to fit the key feature information effectively. In contrast, the deep attention module used in the middle stage of the network only increases the feature awareness of the model and does not give it help in the front end of the network. This results in little improvement in the overall effectiveness of the model with a small number of samples involved in the training.

5. Conclusions

In this paper, we propose TDA-Net, a transfer learning-based deep attention network that can quickly and accurately extract information about damaged buildings in disaster areas. The greatest contribution of TDA-Net is to ensure high detection accuracy while maintaining high efficiency. The network incorporates the idea of transfer learning, and the pretrained bilateral branch benchmark model can effectively improve the training efficiency of the model. This is critical for rapid response to disasters. The deep attention module embedded in the network captures essential and practical information in the image. Under the training cycle of small batches, the model can be quickly converged, and the detection accuracy of the model can be higher. We conducted experiments on a total of three datasets, and the qualitative and quantitative results of the experiments show that our method is feasible and has high detection accuracy. Additionally, our analysis on the time consumption of the model also show that TDA-Net is of high practical value because it converges quickly and requires only a small number of cycles of training to achieve the expected validation accuracy.
In the future, the optimization of the structure of TDA-Net is worth investigating. This is because it takes the longest time in the detection phase. The optimization of its intermediate computation process may be beneficial in reducing time consumption. In addition, we fine-tuned the model using a small fraction of the data in our experiments. In future studies, perhaps we need to explore some steps without fine-tuning to achieve a more efficient detection process.
Author Contributions

Conceptualization, H.Z.; methodology, H.Z.; software, Y.Z.; validation, H.Z., Y.Z. and G.M.; formal analysis, H.Z.; investigation, M.W.; resources, H.Z.; data curation, H.Z.; writing—original draft preparation, H.Z.; writing—review and editing, H.Z., G.M. and M.W.; visualization, G.M.; supervision, H.Z. and M.W.; project administration, Y.Z.; funding acquisition, G.M. All authors have read and agreed to the published version of the manuscript.

Funding

This research was funded by the State Key Research and Development Plan (2018YFB100046) and China Geological Survey Project (DD20191016).

Data Availability Statement

Not applicable.

Conflicts of Interest

The authors declare no conflict of interest.

References

  1. Zheng, Z.; Zhong, Y.; Wang, J.; Ma, A.; Zhang, L. Building damage assessment for rapid disaster response with a deep object-based semantic change detection framework: From natural disasters to man-made disasters. Remote Sens. Environ. 2021, 265, 112636. [Google Scholar] [CrossRef]
  2. Ge, P.; Gokon, H.; Meguro, K. A review on synthetic aperture radar-based building damage assessment in disasters. Remote Sens. Environ. 2020, 240, 111693. [Google Scholar] [CrossRef]
  3. Zhang, H.; Wang, M.; Wang, F.; Yang, G.; Zhang, Y.; Jia, J.; Wang, S. A Novel Squeeze-and-Excitation W-Net for 2D and 3D Building Change Detection with Multi-Source and Multi-Feature Remote Sensing Data. Remote Sens. 2021, 13, 440. [Google Scholar] [CrossRef]
  4. Wang, M.; Zhang, H.; Sun, W.; Li, S.; Wang, F.; Yang, G. A Coarse-to-Fine Deep Learning Based Land Use Change Detection Method for High-Resolution Remote Sensing Images. Remote Sens. 2020, 12, 1933. [Google Scholar] [CrossRef]
  5. Ji, S.; Shen, Y.; Lu, M.; Zhang, Y. Building Instance Change Detection from Large-Scale Aerial Images using Convolutional Neural Networks and Simulated Samples. Remote Sens. 2019, 11, 1343. [Google Scholar] [CrossRef] [Green Version]
  6. Wang, D.; Chen, X.; Jiang, M.; Du, S.; Xu, B.; Wang, J. ADS-Net:An Attention-Based deeply supervised network for remote sensing image change detection. Int. J. Appl. Earth Obs. Geoinf. 2021, 101, 102348. [Google Scholar] [CrossRef]
  7. Peng, D.; Bruzzone, L.; Zhang, Y.; Guan, H.; He, P. SCDNET: A novel convolutional network for semantic change detection in high resolution optical remote sensing imagery. Int. J. Appl. Earth Obs. Geoinf. 2021, 103, 102465. [Google Scholar] [CrossRef]
  8. Zhao, W.; Chen, X.; Ge, X.; Chen, J. Using Adversarial Network for Multiple Change Detection in Bitemporal Remote Sensing Imagery. IEEE Geosci. Remote Sens. Lett. 2021, 19, 8003605. [Google Scholar] [CrossRef]
  9. Fang, S.; Li, K.; Shao, J.; Li, Z. SNUNet-CD: A Densely Connected Siamese Network for Change Detection of VHR Images. IEEE Geosci. Remote Sens. Lett. 2021, 19, 8007805. [Google Scholar] [CrossRef]
  10. Quarmby, N.A.; Cushnie, J.L. Monitoring urban land cover changes at the urban fringe from SPOT HRV imagery in south-east England. Int. J. Remote Sens. 2010, 10, 953–963. [Google Scholar] [CrossRef]
  11. Howarth, P.J.; Wickware, G.M. Procedures for change detection using Landsat digital data. Int. J. Remote Sens. 2007, 2, 277–291. [Google Scholar] [CrossRef]
  12. Bovolo, F.; Bruzzone, L. A Theoretical Framework for Unsupervised Change Detection Based on Change Vector Analysis in the Polar Domain. IEEE Trans. Geosci. Remote Sens. 2007, 45, 218–236. [Google Scholar] [CrossRef] [Green Version]
  13. Ludeke, A.K.; Maggio, R.C.; Reid, L.M. An analysis of anthropogenic deforestation using logistic regression and GIS. J. Environ. Manag. 1990, 31, 247–259. [Google Scholar] [CrossRef]
  14. LeCun, Y.; Bengio, Y.; Hinton, G. Deep learning. Nature 2015, 521, 436–444. [Google Scholar] [CrossRef] [PubMed]
  15. Khelifi, L.; Mignotte, M. Deep Learning for Change Detection in Remote Sensing Images: Comprehensive Review and Meta-Analysis. IEEE Access 2020, 8, 126385–126400. [Google Scholar] [CrossRef]
  16. Zhu, X.X.; Tuia, D.; Mou, L.; Xia, G.-S.; Zhang, L.; Xu, F.; Fraundorfer, F. Deep Learning in Remote Sensing: A Comprehensive Review and List of Resources. IEEE Geosci. Remote Sens. Mag. 2017, 5, 8–36. [Google Scholar] [CrossRef] [Green Version]
  17. Zou, Q.; Ni, L.; Zhang, T.; Wang, Q. Deep Learning Based Feature Selection for Remote Sensing Scene Classification. IEEE Geosci. Remote Sens. Lett. 2015, 12, 2321–2325. [Google Scholar] [CrossRef]
  18. Liu, T.; Yang, L.; Lunga, D. Change detection using deep learning approach with object-based image analysis. Remote Sens. Environ. 2021, 256, 112308. [Google Scholar] [CrossRef]
  19. Chen, H.; Li, W.; Shi, Z. Adversarial Instance Augmentation for Building Change Detection in Remote Sensing Images. IEEE Trans. Geosci. Remote Sens. 2022, 60, 5603216. [Google Scholar] [CrossRef]
  20. Chen, H.; Qi, Z.; Shi, Z. Remote Sensing Image Change Detection with Transformers. IEEE Trans. Geosci. Remote Sens. 2021, 60, 5607514. [Google Scholar] [CrossRef]
  21. Liu, Y.; Pang, C.; Zhan, Z.; Zhang, X.; Yang, X. Building Change Detection for Remote Sensing Images Using a Dual-Task Constrained Deep Siamese Convolutional Network Model. IEEE Geosci. Remote Sens. Lett. 2021, 18, 811–815. [Google Scholar] [CrossRef]
  22. Zhong, C.; Xu, Q.Z.; Yang, F.; Hu, L. Building Change Detection for High-Resolution Remotely Sensed Images Based on a Semantic Dependency. In Proceedings of the 2015 IEEE International Geoscience and Remote Sensing Symposium (IGARSS), Milan, Italy, 26–31 July 2015; pp. 3345–3348. [Google Scholar]
  23. Weber, E.; Kan, H. Building Disaster Damage Assessment Insatellite Imagery with Multi-Temporal Fusion. arXiv 2020, arXiv:2004.05525. [Google Scholar]
  24. Vetrivel, A.; Gerke, M.; Kerle, N.; Nex, F.; Vosselman, G. Disaster damage detection through synergistic use of deep learning and 3D point cloud features derived from very high resolution oblique aerial images, and multiple-kernel-learning. ISPRS J. Photogramm. Remote Sens. 2018, 140, 45–59. [Google Scholar] [CrossRef]
  25. Zhou, Y.; Zhang, Y.; Chen, S.; Zou, Z.; Zhu, Y.; Zhao, R. Disaster damage detection in building areas based on DCNN features. Remote Sens. Land Resour. 2019, 31, 44–50. [Google Scholar] [CrossRef]
  26. Hezaveh, M.M.; Kanan, C.; Salvaggio, C. Roof Damage Assessment using Deep Learning. In Proceedings of the 2017 IEEE Applied Imagery Pattern Recognition Workshop (AIPR), Washington, DC, USA, 10–12 October 2017; pp. 6403–6408. [Google Scholar]
  27. Ge, X.; Chen, X.; Zhao, W.; Li, R. Detection of damage dbuildings based on generative adversarial networks. Acta Geod. Cartogr. Sin. 2022, 51, 238–247. [Google Scholar]
  28. He, K.; Zhang, X.; Ren, S.; Sun, J. Deep Residual Learning for Image Recognition. In Proceedings of the 2016 IEEE Conference on Computer Vision and Pattern Recognition (CVPR), Las Vegas, NV, USA, 27–30 June 2016; pp. 770–778. [Google Scholar]
  29. Durnov, V. Xview2 First Place Solution. Available online: https://github.com/DIUx-xView/xView2_first_place (accessed on 6 August 2020).
  30. Pan, S.J.; Yang, Q. A Survey on Transfer Learning. IEEE Trans. Knowl. Data Eng. 2010, 22, 1345–1359. [Google Scholar] [CrossRef]
  31. Niu, S.; Liu, Y.; Wang, J.; Song, H. A Decade Survey of Transfer Learning (2010–2020). IEEE Trans. Artif. Intell. 2020, 1, 151–166. [Google Scholar] [CrossRef]
  32. Zhuang, F.; Qi, Z.; Duan, K.; Xi, D.; Zhu, Y.; Zhu, H.; Xiong, H.; He, Q. A Comprehensive Survey on Transfer Learning. Proc. IEEE 2021, 109, 43–76. [Google Scholar] [CrossRef]
  33. Adriano, B.; Yokoya, N.; Xia, J.; Miura, H.; Liu, W.; Matsuoka, M.; Koshimura, S. Learning from multimodal and multitemporal earth observation data for building damage mapping. ISPRS J. Photogramm. Remote Sens. 2021, 175, 132–143. [Google Scholar] [CrossRef]
  34. Lee, J.; Xu, J.Z.; Sohn, K.; Lu, W.; Berthelot, D.; Gur, I.; Khaitan, P.; Huang, K.; Koupparis, K.M.; Kowatsch, B.J.A. Assessing Post-Disaster Damage from Satellite Imagery using Semi-Supervised Learning Techniques. arXiv 2020, arXiv:2011.14004. [Google Scholar]
  35. Plank, S. Rapid Damage Assessment by Means of Multi-Temporal SAR—A Comprehensive Review and Outlook to Sentinel-1. Remote Sens. 2014, 6, 4870–4906. [Google Scholar] [CrossRef] [Green Version]
  36. Wang, Z.; Ma, P.; Chi, Z.; Li, D.; Yang, H.; Du, W. Multi-attention mutual information distributed framework for few-shot learning. Expert Syst. Appl. 2022, 202, 117062. [Google Scholar] [CrossRef]
  37. Shelhamer, E.; Long, J.; Darrell, T. Fully Convolutional Networks for Semantic Segmentation. IEEE Trans. Pattern Anal. Mach. Intell. 2017, 39, 3431–3440. [Google Scholar] [CrossRef] [PubMed]
  38. Ronneberger, O.; Fischer, P.; Brox, T. U-Net: Convolutional Networks for Biomedical Image Segmentation. In Proceedings of the International Conference on Medical Image Computing and Computer-Assisted Intervention, Munich, Germany, 5–9 October 2015. [Google Scholar]
  39. Badrinarayanan, V.; Kendall, A.; Cipolla, R. SegNet: A Deep Convolutional Encoder-Decoder Architecture for Image Segmentation. IEEE Trans. Pattern Anal. Mach. Intell. 2017, 39, 2481–2495. [Google Scholar] [CrossRef] [PubMed]
  40. Caye Daudt, R.; Le Saux, B.; Boulch, A.; Gousseau, Y. Multitask learning for large-scale semantic change detection. Comput. Vis. Image Underst. 2019, 187, 102783. [Google Scholar] [CrossRef] [Green Version]
  41. Chen, L.-C.; Zhu, Y.; Papandreou, G.; Schroff, F.; Adam, H.J.A. Encoder-Decoder with Atrous Separable Convolution for Semantic Image Segmentation. In Proceedings of the European Conference on Computer Vision (ECCV), Munich, Germany, 8–14 September 2018. [Google Scholar]
  42. Varghese, A.; Gubbi, J.; Ramaswamy, A.; Balamuralidhar, P. ChangeNet: A Deep Learning Architecture for Visual Change Detection. Lect. Notes Comput. Sci. 2019, 11130, 129–145. [Google Scholar] [CrossRef]
  43. Ding, Q.; Shao, Z.; Huang, X.; Altan, O. DSA-Net: A novel deeply supervised attention-guided network for building change detection in high-resolution remote sensing images. Int. J. Appl. Earth Obs. Geoinf. 2021, 105, 102591. [Google Scholar] [CrossRef]
  44. Zhang, C.; Wang, L.; Cheng, S.; Li, Y. SwinSUNet: Pure Transformer Network for Remote Sensing Image Change Detection. IEEE Trans. Geosci. Remote Sens. 2022, 60, 3160007. [Google Scholar] [CrossRef]
  45. Li, Q.; Zhong, R.; Du, X.; Du, Y. TransUNetCD: A Hybrid Transformer Network for Change Detection in Optical Remote-Sensing Images. IEEE Trans. Geosci. Remote Sens. 2022, 60, 3169479. [Google Scholar] [CrossRef]
  46. Seydi, S.T.; Rastiveis, H.; Kalantar, B.; Halin, A.A.; Ueda, N. BDD-Net: An End-to-End Multiscale Residual CNN for Earthquake-Induced Building Damage Detection. Remote Sens. 2022, 14, 2214. [Google Scholar] [CrossRef]
  47. Shen, L.; Lu, Y.; Chen, H.; Wei, H.; Xie, D.; Yue, J.; Chen, R.; Lv, S.; Jiang, B. S2Looking: A Satellite Side-Looking Dataset for Building Change Detection. Remote Sens. 2021, 13, 5094. [Google Scholar] [CrossRef]
  48. Lin, T.-Y.; Goyal, P.; Girshick, R.; He, K.; Dollar, P. Focal Loss for Dense Object Detection. In Proceedings of the 2017 IEEE International Conference on Computer Vision (ICCV), Venice, Italy, 19–22 October 2017; pp. 2999–3007. [Google Scholar]
  49. Lu, D.; Mausel, P.; Brondízio, E.; Moran, E. Change detection techniques. Int. J. Remote Sens. 2010, 25, 2365–2401. [Google Scholar] [CrossRef]
  50. Hu, J.; Shen, L.; Albanie, S.; Sun, G.; Wu, E. Squeeze-and-Excitation Networks. IEEE Trans. Pattern Anal. Mach. Intell. 2020, 42, 2011–2023. [Google Scholar] [CrossRef] [PubMed] [Green Version]
  51. Zhou, Z.; Siddiquee, M.M.R.; Tajbakhsh, N.; Liang, J. UNet++: Redesigning Skip Connections to Exploit Multiscale Features in Image Segmentation. IEEE Trans. Med. Imaging 2020, 39, 1856–1867. [Google Scholar] [CrossRef] [Green Version]
Figure 1. Overview of datasets. (a) The xView2 building damage assessment dataset. (b) The WHU Building Dataset. (c) The Beirut port dataset. (d) The Tianjin Binhai New Area dataset.
Remotesensing 14 03687 g001
Figure 2. The architecture of TDA-Net.
Remotesensing 14 03687 g002
Figure 3. The structure of the residual units.
Remotesensing 14 03687 g003
Figure 4. The structure of the deep attention module.
Remotesensing 14 03687 g004
Figure 5. Loss and accuracy curves of ResNet101 on the xView2 dataset. (a) Loss value. (b) Accuracy value.
Remotesensing 14 03687 g005
Figure 6. Histograms of model evaluation metrics and sample visualization.
Remotesensing 14 03687 g006
Figure 7. The model curves of (a1) WHU Building dataset loss, (a2) WHU Building dataset accuracy, (b1) Beirut dataset loss, (b2) Beirut dataset accuracy, (c1) Tianjin dataset loss, and (c2) Tianjin dataset accuracy.
Remotesensing 14 03687 g007
Figure 8. Visualization of the prediction results of each model. (a) Ground truth. (b) FCN. (c) UNet. (d) SegNet. (e) UNet++. (f) TDA-Net. Where 1 denotes WHU Building dataset, 2 denotes Beirut dataset, and 3 denotes Tianjin dataset.
Remotesensing 14 03687 g008
Figure 9. Visualization of metrics for prediction results. (a) WHU Building, (b) Beirut, and (c) Tianjin datasets.
Remotesensing 14 03687 g009
Figure 10. Test results of ablation experiment. (a) Ground truth. (b) TDA-Net_noprenoatt. (c) TDA-Net_nopre. (d) TDA-Net_noatt. (e) TDA-Net. (f) Details shown.
Remotesensing 14 03687 g010
Table 1. Configuration details of TDA-Net.
ModuleLayerOutputParameter Details
PretrainingResNet101X1 [-, 2048, 16, 16]
X2 [-, 256, 64, 64]
strides = [1, 1, 2, 2]
dilations = [1, 1, 1, 2]
blocks = [1, 2, 4]
Encoding DoubleConv MaxPool 2 d × 4
DoubleConv
X3 [-, 512, 16, 16]DoubleConv = [Conv2d, BatchNorm2d, ReLU]
Deep attention spatial   attention channel   attention × 4
Add
X4 [-, 512, 32, 32]
X5 [-, 256, 64, 64]
X6 [-, 128, 128, 128]
X7 [-, 64, 256, 256]
reduction ratio = 16
Decoding ConvTranspose 2 d DoubleConv × 4 X8 [-, 16, 256, 256]DoubleConv = [Conv2d, BatchNorm2d, ReLU]
Table 2. The number of samples for different datasets.
DatasetsTrainValid
WHU Building500150
Beirut12632
Tianjin26064
Table 3. Model details of the training process.
DatasetsFCNUNetSegNetUNet++TDA-Net
HaLiHaLiHaLiHaLiHaLi
WHU Building0.960960.9341000.935920.959760.96983
Beirut0.983830.970590.948970.980990.98485
Tianjin0.988530.982920.985720.987610.99177
Note: Ha denotes the highest value of validation accuracy during training, and Li denotes the epoch (last iteration) corresponding to the highest validation accuracy.
Table 4. Table of precision evaluation.
Model F 1 PRFAMA
TDA-Net_noprenoatt0.9120.8710.9570.1290.043
TDA-Net_nopre0.9270.8960.9600.1040.040
TDA-Net_noatt0.9470.9350.9580.0650.042
TDA-Net0.9560.9490.9640.0510.036
Publisher’s Note: MDPI stays neutral with regard to jurisdictional claims in published maps and institutional affiliations.