1. Introduction
Water is a major part of a country’s economic and social development, and precipitation is the principal source of freshwater on the Earth. Efficient management in this field needs accurate and precise information on precipitation and its spatio-temporal variations [
1]. Furthermore, precipitation is the main factor in the water cycle and the balance of the Earth’s energy [
2] and directly affects climate change [
3]. Precipitation data are used in many areas, such as flood modeling [
4], landslides [
5], heavy rain forecast [
6], water resource management [
7], drought monitoring [
8], hydrological modeling [
9], meteorological applications [
10,
11], and improving crop yield and soil moisture estimation [
12].
Reliable measurements of areal precipitation are still the major challenge of hydrology research and water management in all their sub-fields [
13,
14,
15]. Rainfall timing and spatial distribution make reliable measurements even more complicated in many semi-arid, arid, and mountainous regions, while precipitation gauges are often sparsely distributed [
15,
16,
17]. The latter is crucial in the more mountainous regions (of which snowfall is extremely important for water resources in Iran). In this context, satellite-based rainfall estimates have raised high expectations in the scientific community since 1998, when the first quasi-global Tropical Rainfall Measurement Mission (TRMM)-derived dataset was made available. There have been many discussions on whether those areal rainfall estimates were reliable or not, and if yes, under which boundary conditions?
Scientists concluded that, for many regions, those datasets were better than too sparsely distributed precipitation gauge ‘networks’ and applied the TRMM datasets more or less successfully in hydrological models and other applications. Many shortcomings were documented in the literature, but TRMM data functioned well in several applications with no alternative data sources.
Documented shortcomings of TRMM products were mostly based on ‘simple’ physical reasons: the spatial, temporal, and spectral resolution of the sensors, the common problem of all satellite-based studies. However, for rainfall estimates, the compromises of TRMM/TMPA were partly too big. Thus, logically, TRMM’s follow-on was expected to have better spatial, temporal, and spectral resolutions to overcome the known shortcomings. The Global Precipitation Mission (GPM) was launched in 2014 with high expectations from the hydrological community.
1.1. Drought and Wet Conditions
Drought is generally driven by a moisture deficit condition that occurs due to a lack of precipitation over a period [
18,
19]. Drought occurs almost anywhere globally, even in rainy regions [
20], and can last from a few months to several years, causing enormous damage to the economy and society [
21]. Due to global warming issues, decision-makers have increasingly turned to drought-related studies in recent years. Different indicators are used to diagnose drought and wet conditions [
22]. However, many studies [
23,
24,
25,
26,
27] have shown that the standardized precipitation index (SPI) works well for different climates in Iran to assess the frequency and duration of droughts. The index, developed by McKee et al. (1993), describes the cumulative probability of precipitation in any given period. Meanwhile, this index only requires rainfall data and therefore has fewer calculations.
1.2. Seasonal Importance of Precipitation
The amount of rainfall and its importance vary from season to season. For example, winter rains have a more significant effect on forest health. The tree rings indicate rain periods in the cold seasons; in other words, trees have the highest growth in the years with rainy winters, and tree patterns can be traced back to winter rainfall patterns in northern latitudes [
28]. Moreover, the lack of rainfall in winter and spring causes forests to become more vulnerable to fire and the fire season to start sooner [
29]. However, rainwater quickly enters the rivers in the summer, and the remaining moisture evaporates quickly in the summer sun [
30].
1.3. State of the Art
Precipitation data are currently available to the public from various data providers such as the Climate Prediction Center MORPHing technique (CMORPH), and Precipitation Estimation from Remotely Sensed Information using Artificial Neural Networks (PERSIANN). This study compares precipitation products of Tropical Rainfall Measuring Mission (TRMM) Multisatellite Precipitation Analysis (TMPA version 7 research level product) and Integrated Multisatellite Retrievals for GPM (IMERG version 6 research level product).
GPM was launched in 2014 to continue collecting rainfall data after ending the TRMM mission in 2015. TMPA/3B43 and IMERG provide monthly precipitation in millimeters per hour in 0.25° × 0.25° and 0.1° × 0.1° resolutions, respectively. Several studies have been conducted on their accuracy [
31,
32,
33,
34] worldwide. For example, Sharifi et al. [
35] compared the daily data of ground gauges and GPM data in different climatic conditions and seasons throughout Iran. However, their work was limited to only the years 2014 and 2015. They concluded that GPM/IMERG was superior to TRMM/TMPA and that monthly products underestimated the precipitation in high rain climatic conditions. However, in arid and semi-arid conditions, IMERG and TMPA overestimated the rainfall data.
Anjum and Ahmad [
36] showed that the IMERG product was slightly better than TMPA, although both correlated well with in-situ measurements. However, the satellite data underestimated moderate and heavy precipitation and overestimated light rainfalls. In several other studies, researchers found the same results, in that IMERG and TMPA monthly data were highly consistent with ground gauge measurements. However, they concluded that the improvements were insignificant [
37,
38]. The main advantage of IMERG is its fine resolution [
39]. To summarize previous studies, there is a good correlation between TMPA and IMERG precipitation data with in-situ measurements, although IMERG slightly outperformed TMPA.
This study compared the satellite data products from 2000 to 2017 with in-situ measurements. Although ground-based measurements of precipitation—especially snowfall—have many errors and uncertainties, they are still used as the most accurate values in calculations and modeling. Ground station precipitation data were used to measure the drought and wet conditions and evaluate the IMERG and TMPA products in the corresponding conditions. Many researchers have used satellite data for drought monitoring [
40,
41,
42] all over the globe. However, no other study has so far compared satellite data accuracy in drought and wet circumstances to our knowledge. In addition, this study evaluated the effect of seasonal and drought conditions on satellite-based precipitation data accuracy over different climates.
2. Materials and Methods
2.1. Study Area
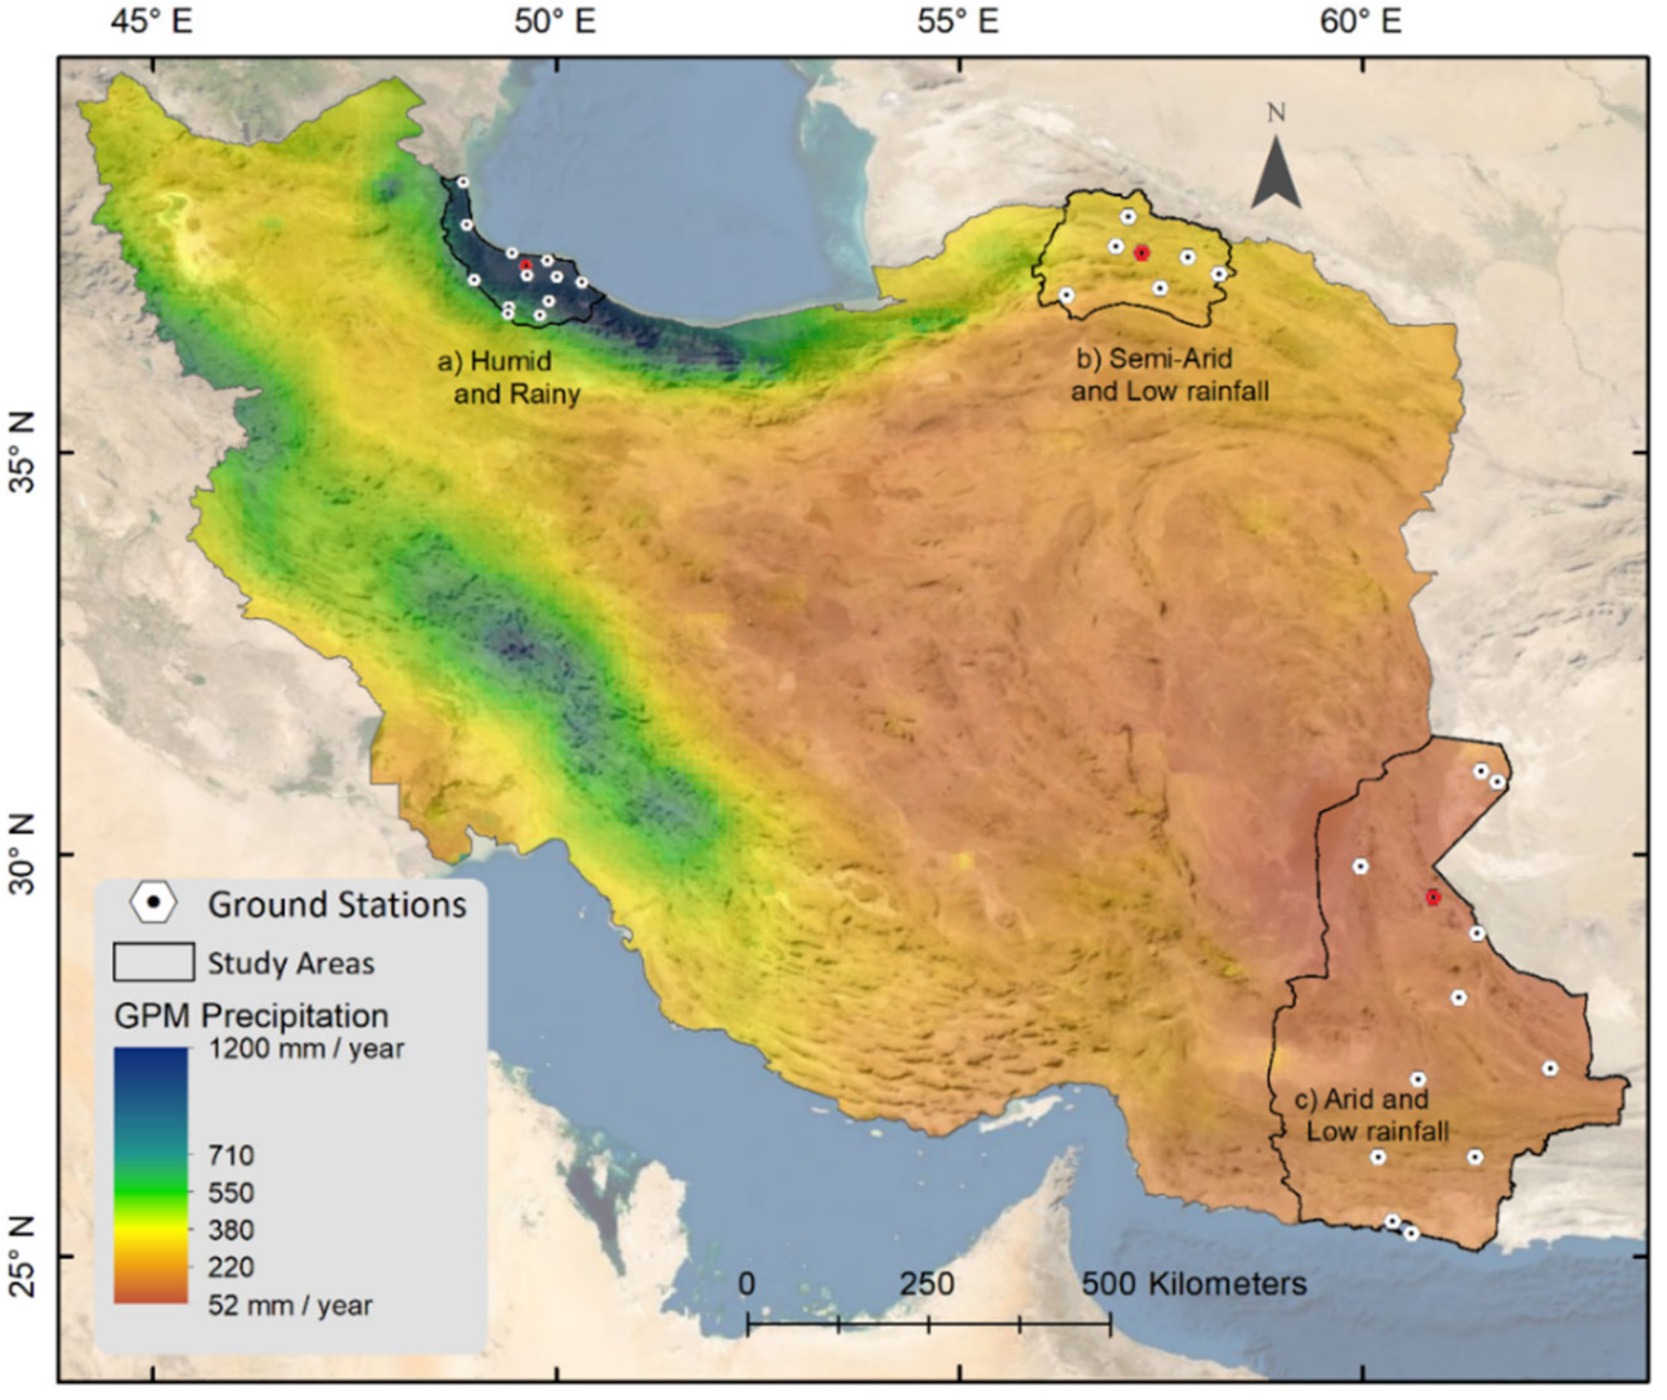
The study area includes three provinces in northern, northeastern, and southeastern Iran, each with a different climatic condition, namely rainy, semi-arid, and arid climates.
Figure 1 shows the study areas and average precipitation using IMERG product.
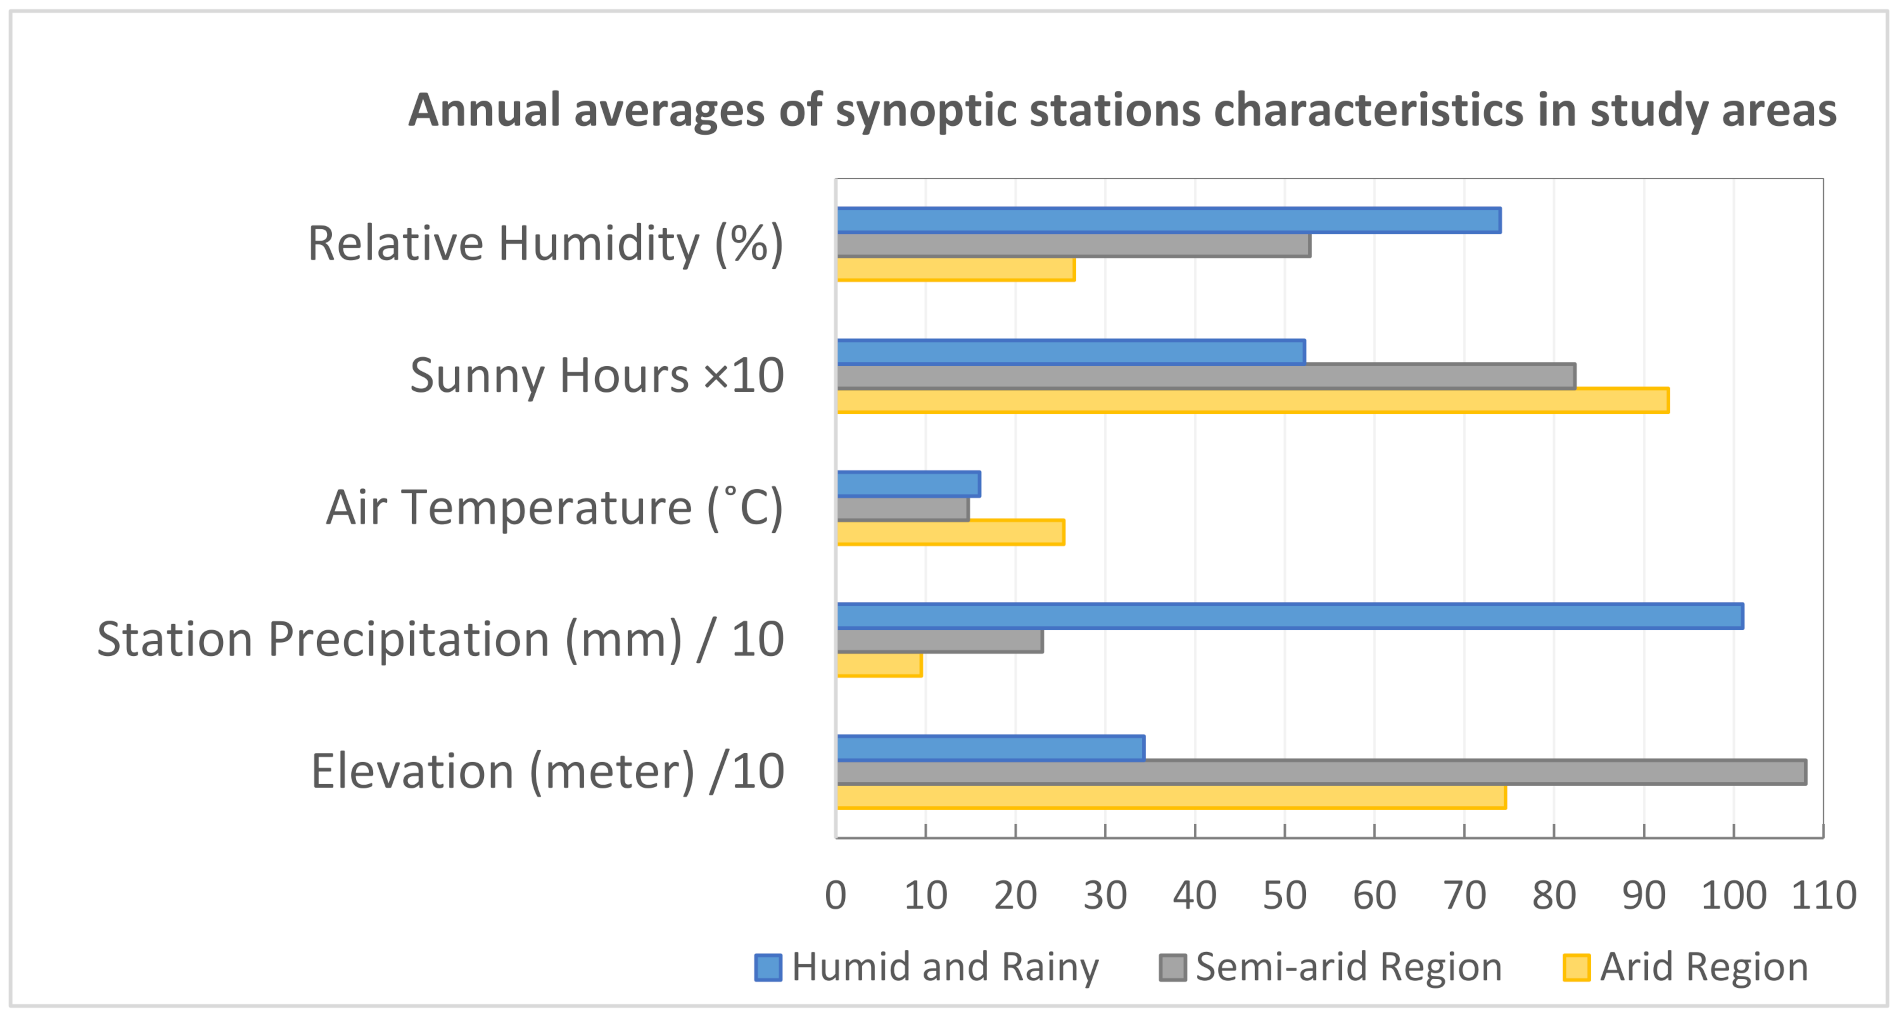
Figure 2 shows the annual averages of relative humidity, sunny hours, temperature, precipitation, and ground stations’ altitude in the study areas. The parameters have been scaled to display the stations’ characteristics in a single graph.
2.2. Dataset
2.2.1. Basic Data
The datasets of synoptic ground stations were obtained from the Meteorology Organization of Iran. Gilan, North Khorasan, and Sistan-Baluchestan provinces have 13, 7, and 12 synoptic ground stations, respectively.
Table 1 shows the characteristics of synoptic ground stations.
2.2.2. Satellite-Based Data
Several techniques have been developed to take advantage of satellite observations over the last few years. Satellite precipitation products are obtained by combining infrared, microwave, and radar precipitation data from various satellite sensors. TRMM/TMPA and GPM/IMERG products are two well-known and commonly used sources of precipitation data. Following the end of the TRMM mission in 2015, GPM, together with partner satellites, took over the main role of providing data for precipitation products. In addition to measuring rainfall, GPM can record snowfall and rainfall of less than 0.5 mm per hour. GPM can also cover latitudes between 65° in the Northern and Southern hemispheres. TRMM’s satellite precipitation data was discontinued in 2015; however, the TMPA/3B43 version 7 uses other satellites in the constellation. As was the case for TMPA, the IMERG algorithm was applied to TRMM data and reprocessed to present a homogeneous dataset with the current GPM data since 2000. TMPA/3B43V7 and IMERG version 6 were obtained from the NASA website (
https://gpm.nasa.gov, accessed on 23 January 2020) for the 2000–2017 period.
2.3. Technical Framework
The objective of this study is twofold. The first aim is to compare the performance of the satellite precipitation products against ground station measurements over the study period, drought conditions, and seasons. The second aim is to achieve a correction model to predict the errors of the satellite precipitation data using a coefficient that minimizes the root mean square error (RMSE) between satellite and ground station precipitation data.
Ground data are usually at point scales while satellite products include gridded precipitation products; therefore, comparing them is always challenging. There are two general approaches to comparison. The first method is to compare the gauge directly with the pixel value at the station [
31,
43]. The second method is pixel-to-pixel comparison, in which in-situ data are converted to the desired grid scale using interpolation methods and then compared [
1,
44,
45]. Although the second approach has been used in several studies, it has been criticized by some researchers because it creates some uncertainties in computation through interpolation. In this study, the first method was used to evaluate the satellite-derived products and compare them for two reasons. First, in areas with sparse ground stations or heterogeneous physiography, interpolation does not yield good results, as confirmed by the findings of this study. Secondly, this method has been done comparatively for the whole study area. Thus, if an error occurs, it is generally for the whole calculation and will not affect the results. The following formulas were used to assess the performance of the satellite products. For IMERG, the formulas are the same.
2.4. Comparison of Satellite Data with Interpolated Ground-Based Data
Data from synoptic stations are at point scales compared to satellite precipitation data with at least 100 km2 area pixels. Therefore, the satellite data were compared with the interpolated values of some stations for 2017. The inverse distance weighting (IDW) interpolation method, used here, assumes that values measured near the prediction location have more influence on the prediction than those farther away. In other words, the quantity of precipitation was interpolated in the ground station location using other ground stations measurements. Then, the interpolated value in the station’s location was compared with the station and satellite products. Three modes for selecting comparison points were considered. In the first case, a station that was in a relatively densely populated area was selected. In the second case, a station with a heterogeneous topography was selected, and in the third case, a station relatively far from the other stations.
2.5. Assessment of Satellite Data on the Synoptic Ground Stations
The satellite products were compared using the Pearson correlation coefficient between ground stations and corresponding satellite image pixels. It determines how well satellite datasets fit ground-based measurements. R-squared is the square of the correlation coefficient; higher values of R
2 result in lower errors. Moreover, this study introduced the following equation called RMSEx, where ‘x’ is the factor that should be calculated in such a way as to make the equation minimum based on the ground stations and their corresponding satellite data. With x = 1, it will be typical RMSE. The best coefficients for approaching precise rainfall values from two sources are achievable by minimizing the following equation.
In Equation (5), by changing x, the smallest RMSEx can be obtained, and N is the number of records. If the x-factor is higher than one, the stations’ values are greater than satellite product values, and so satellite product underestimates the data. If the x value is less than one, the satellite product overestimates the rainfall data. X, which hereafter is called the ‘correction factor’ (CF), controls the peaks, which may be an essential factor in flood occurrences.
2.6. Assessment of Satellite Data over Drought and Wet Conditions
SPI is widely used in meteorological drought studies over different periods [
46,
47]. Lack of rainfall in the short term affects soil moisture, while it often affects groundwater, river flow, and water resources in long periods [
47,
48]. Therefore, SPI indicates soil moisture in short periods, while it is associated with the number of groundwater reserves over more extended periods. In addition, this indicator can be used to compare climates that are significantly different.
The threshold values of SPI proposed by McKee et al. (1993) and developed by Edwards [
49] are shown in
Table 2. The precipitation data of the ground stations were classified according to this table, and then their correlation with satellite data was examined. The same method was used to compare the seasonal performance of satellite data.
3. Results
3.1. Interpolated Precipitation Versus IMERG and TMPA
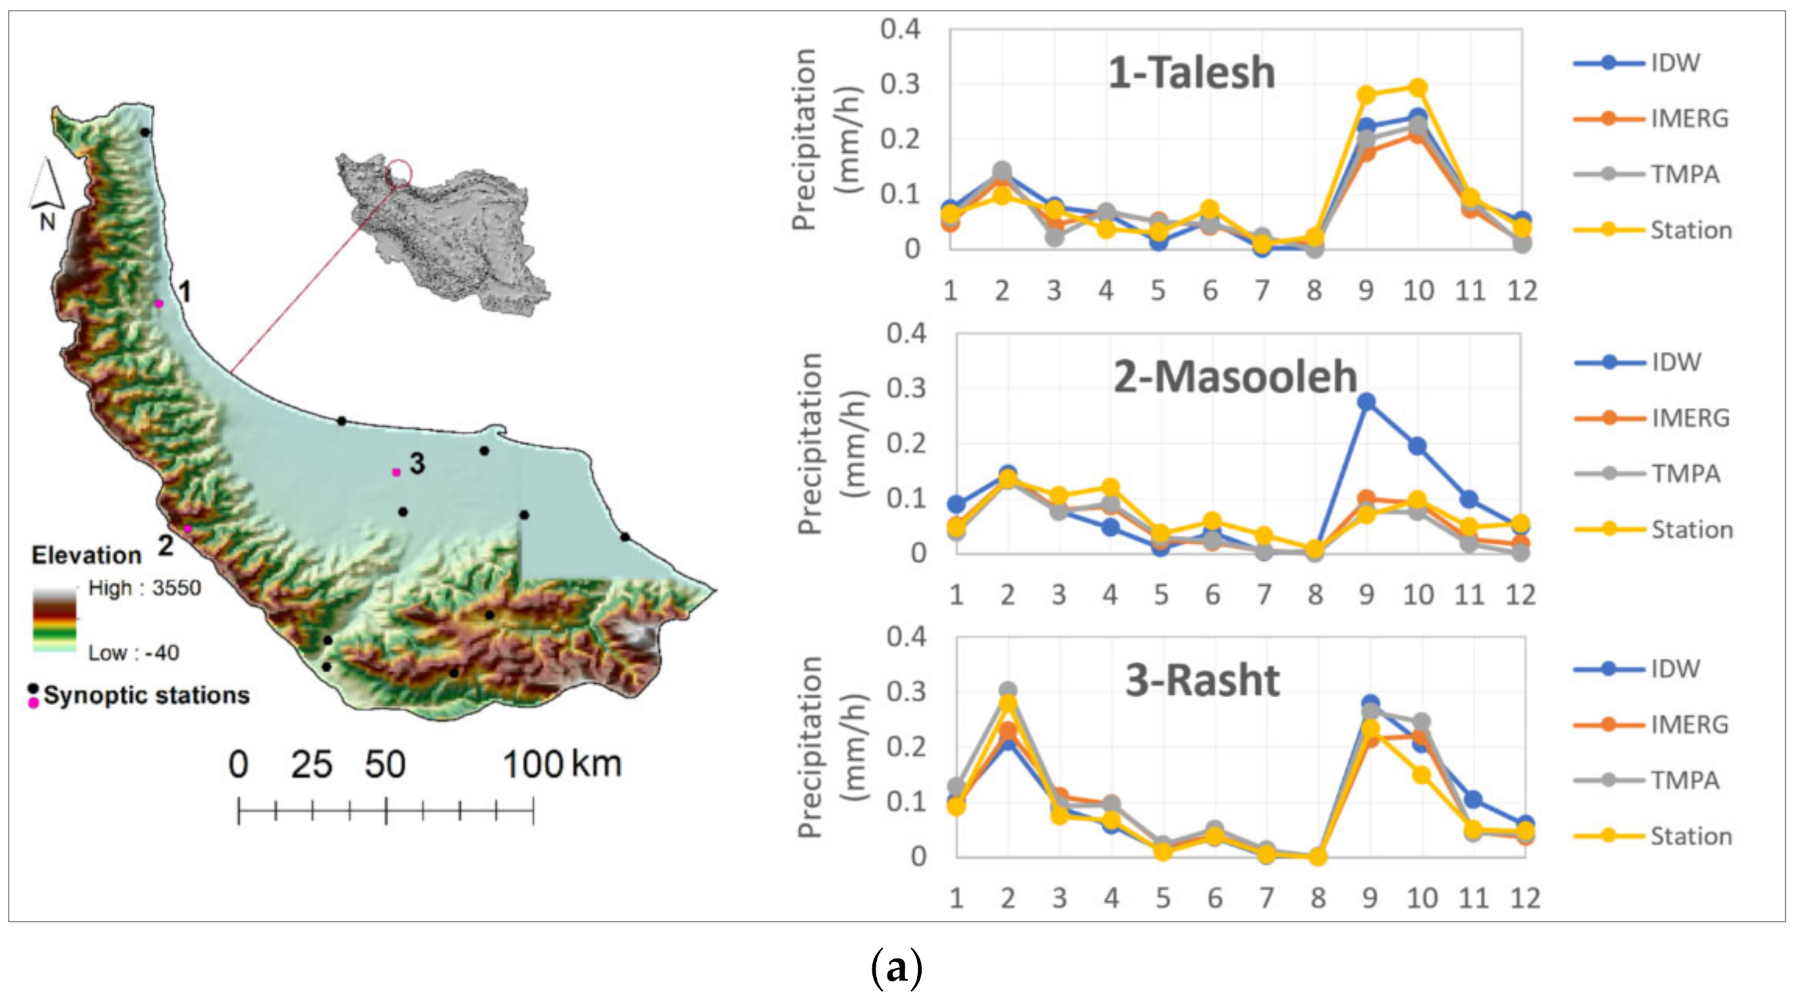
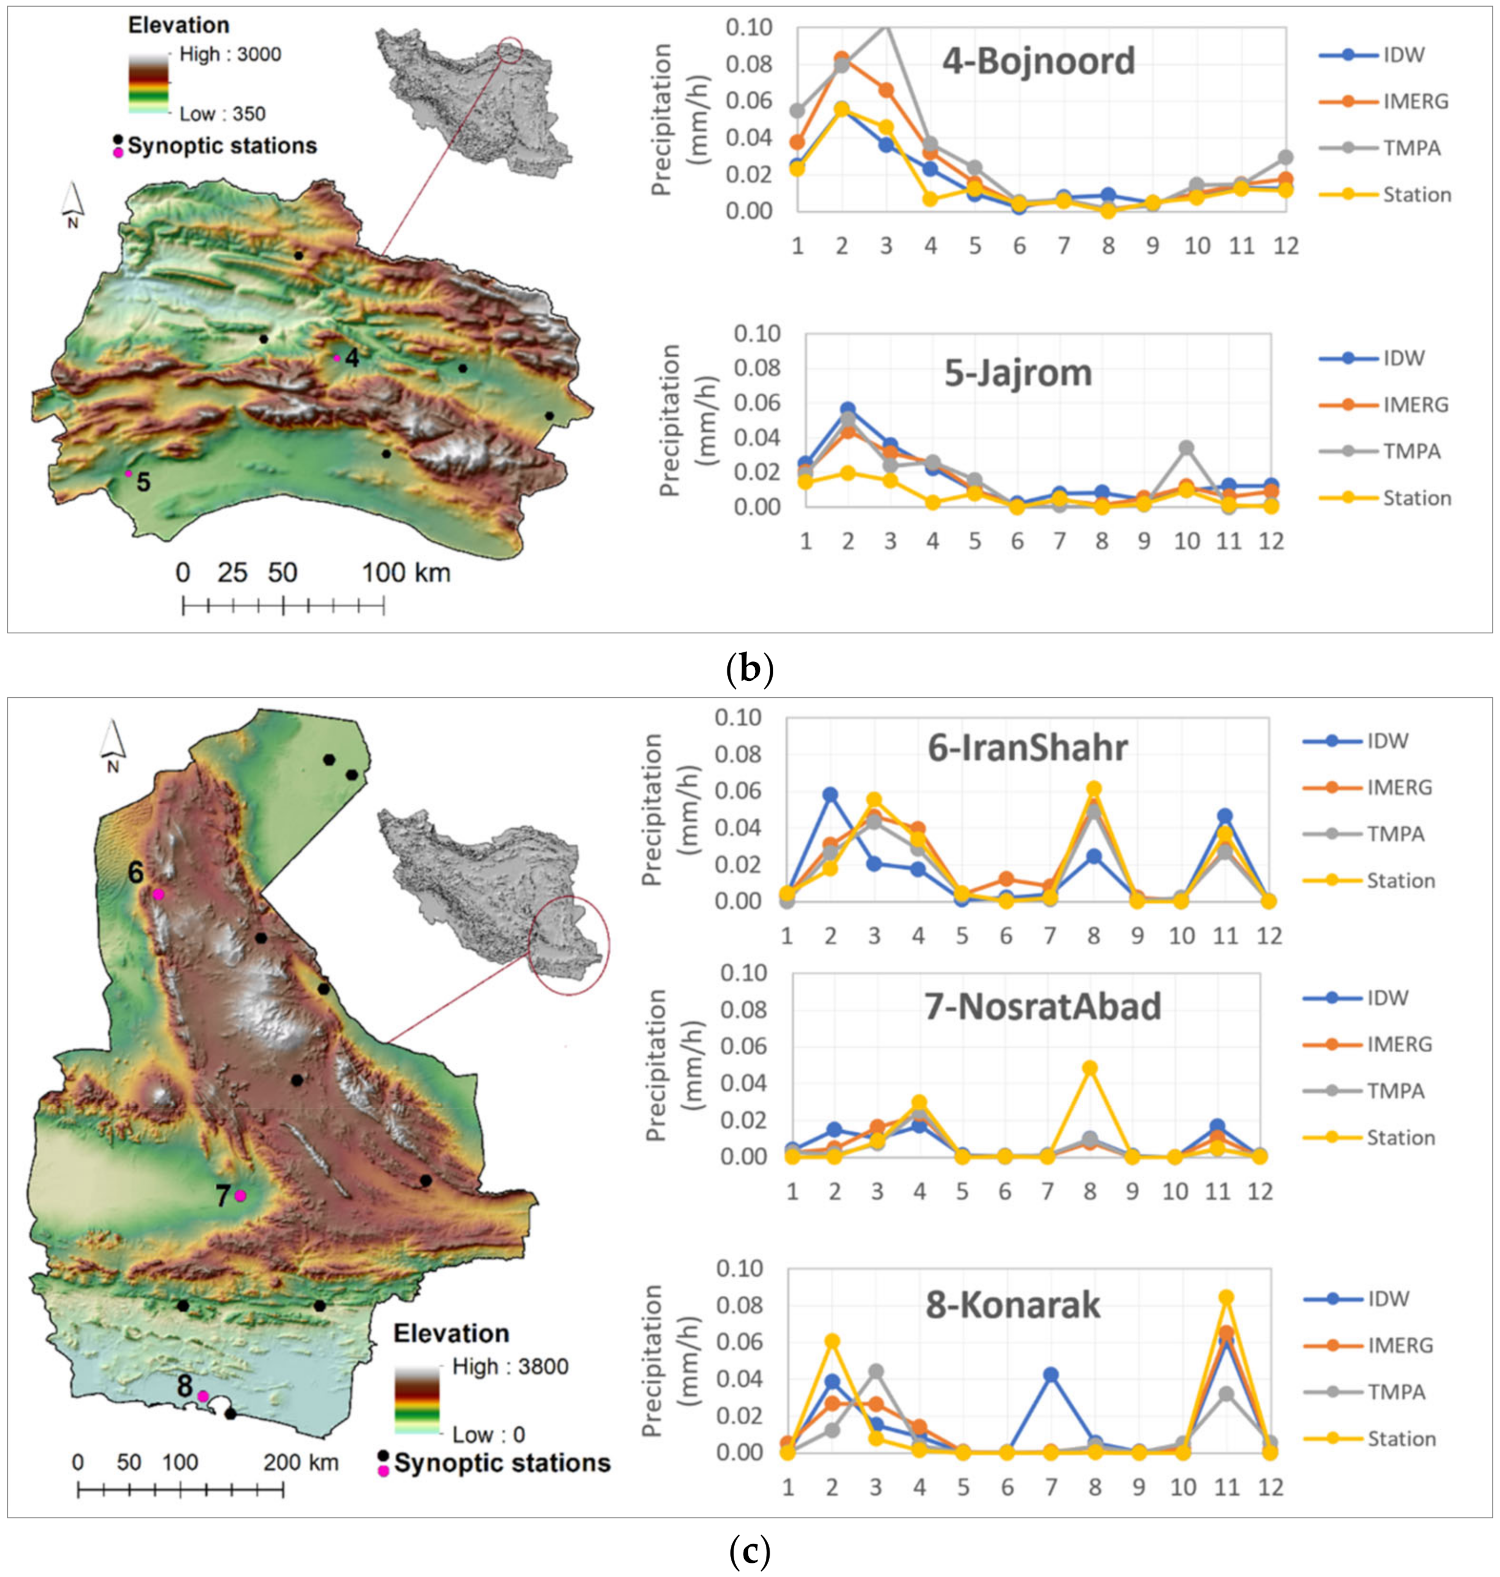
The comparisons of interpolated results with IMERG, TMPA, and ground-based measurements are presented in
Figure 3. The maps are provided for the precipitation data from 2017, the newest data used in this study. The calculations are implemented for the points in areas with different heterogeneities. The stations selected for comparison are shown in pink in
Figure 3. As can be seen, the interpolation results are sometimes higher than the satellite values and sometimes vice versa. The difference between the measured and the interpolated values depends on the distance of the surrounding stations to the desired point and the heterogeneity of the topography between the desired point and other stations.
3.2. Performance of Satellite Data over the Study Areas
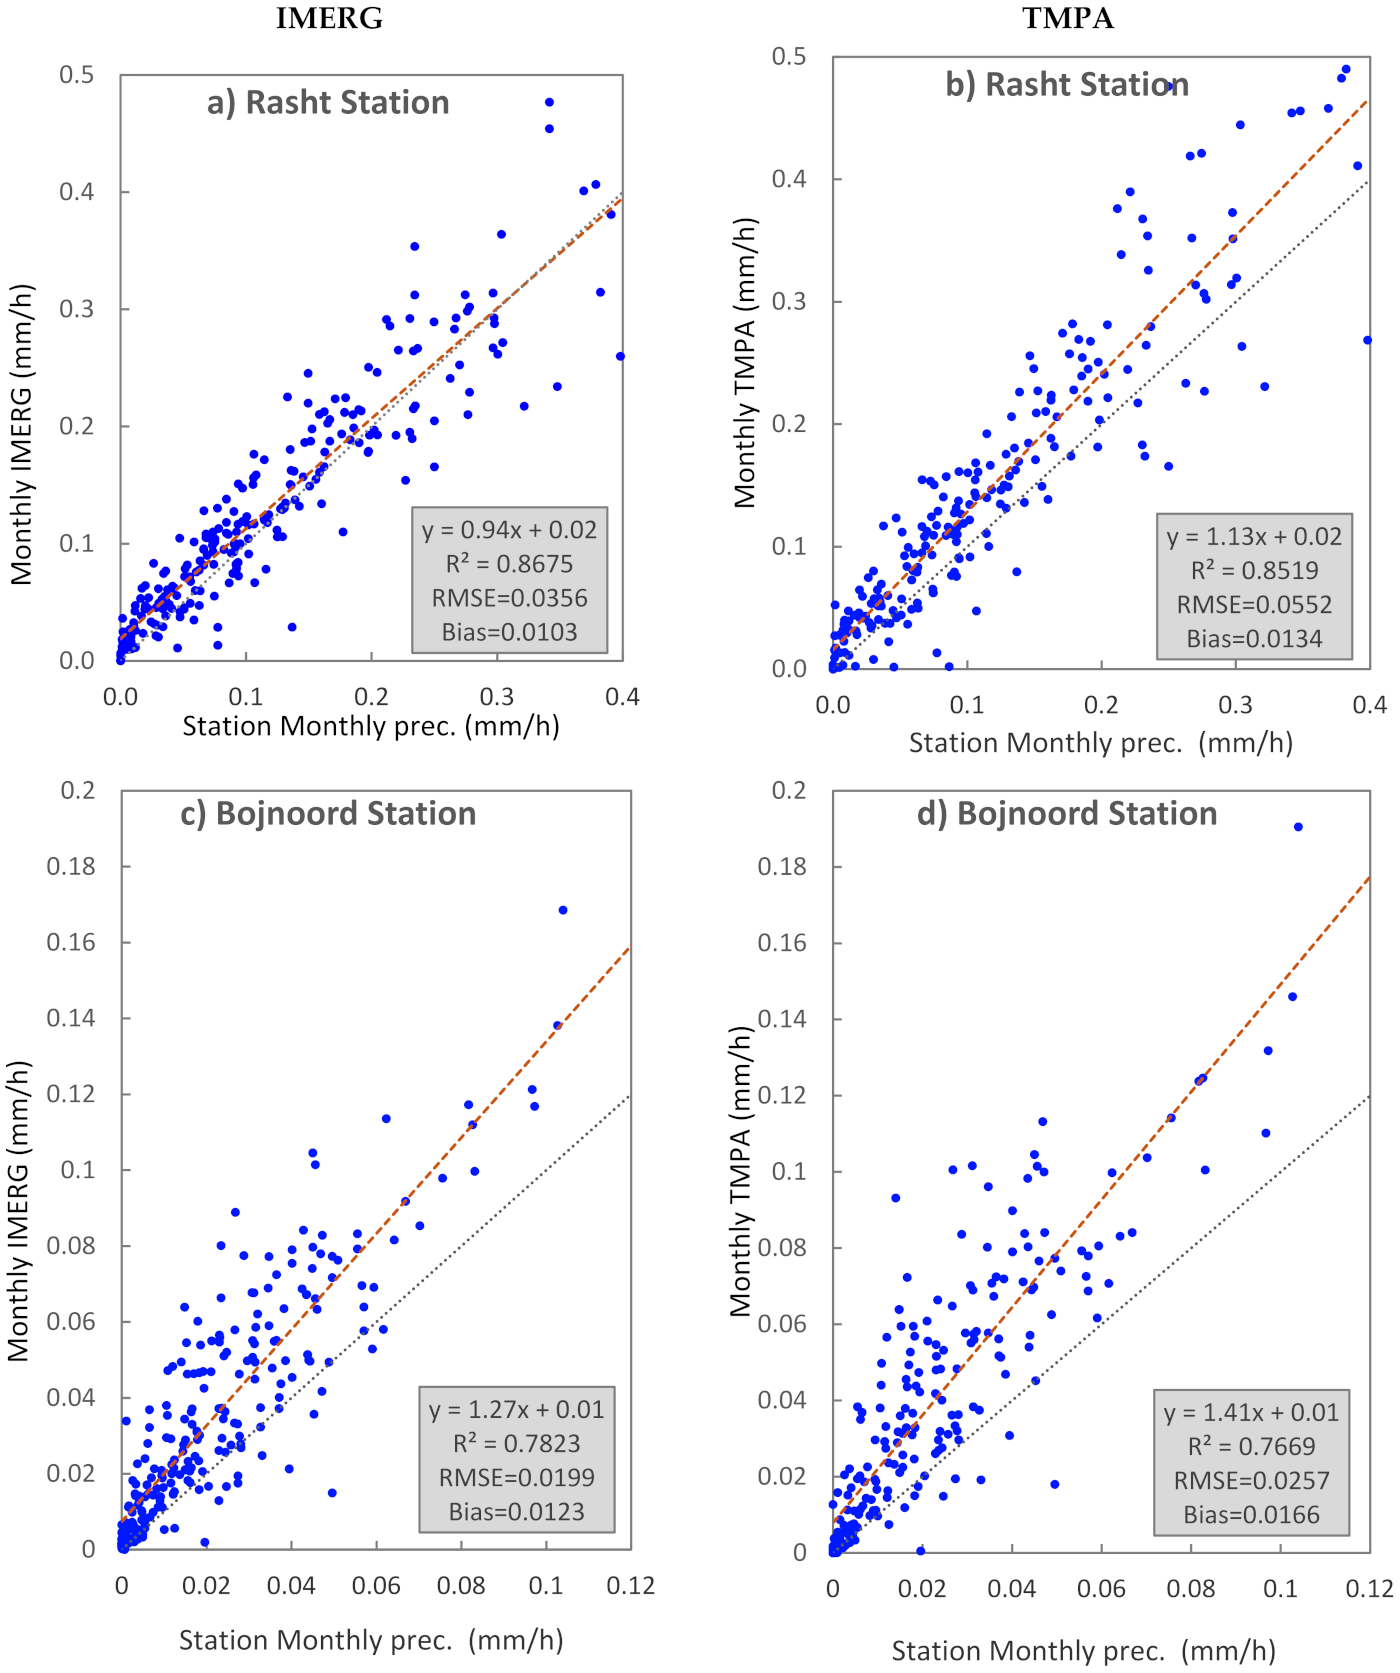
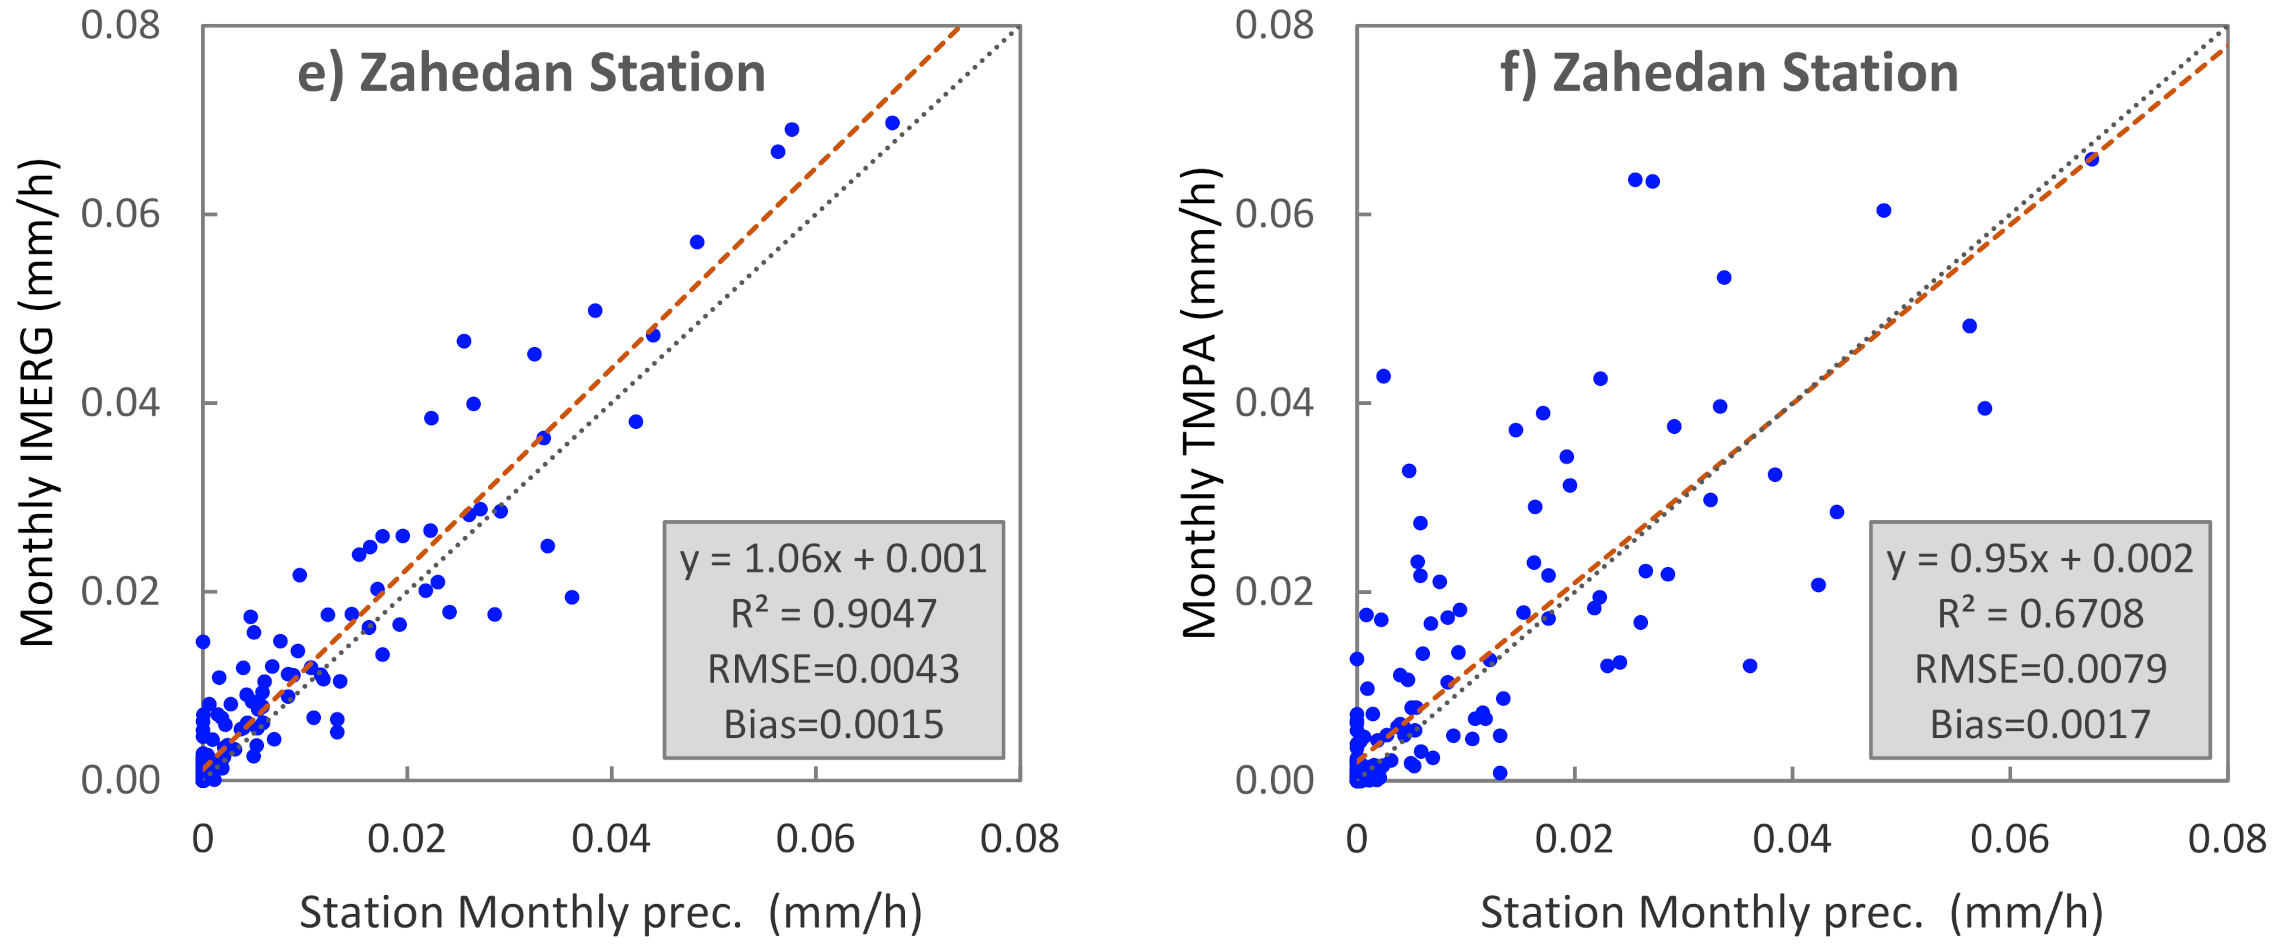
Figure 4 shows the comparison of precipitation data from satellite and ground stations for the province centers under study with different climatic conditions. The precipitation data are measured in millimeters per hour; only three stations are displayed here. In all graphs, IMERG shows higher R
2 than TMPA, especially in low rainfall, in which the R-squared of IMERG is over 30% higher than TMPA. In the high rain region (a), the higher the rainfall, the greater the errors.
3.3. Error Adjustment of Satellite Precipitation
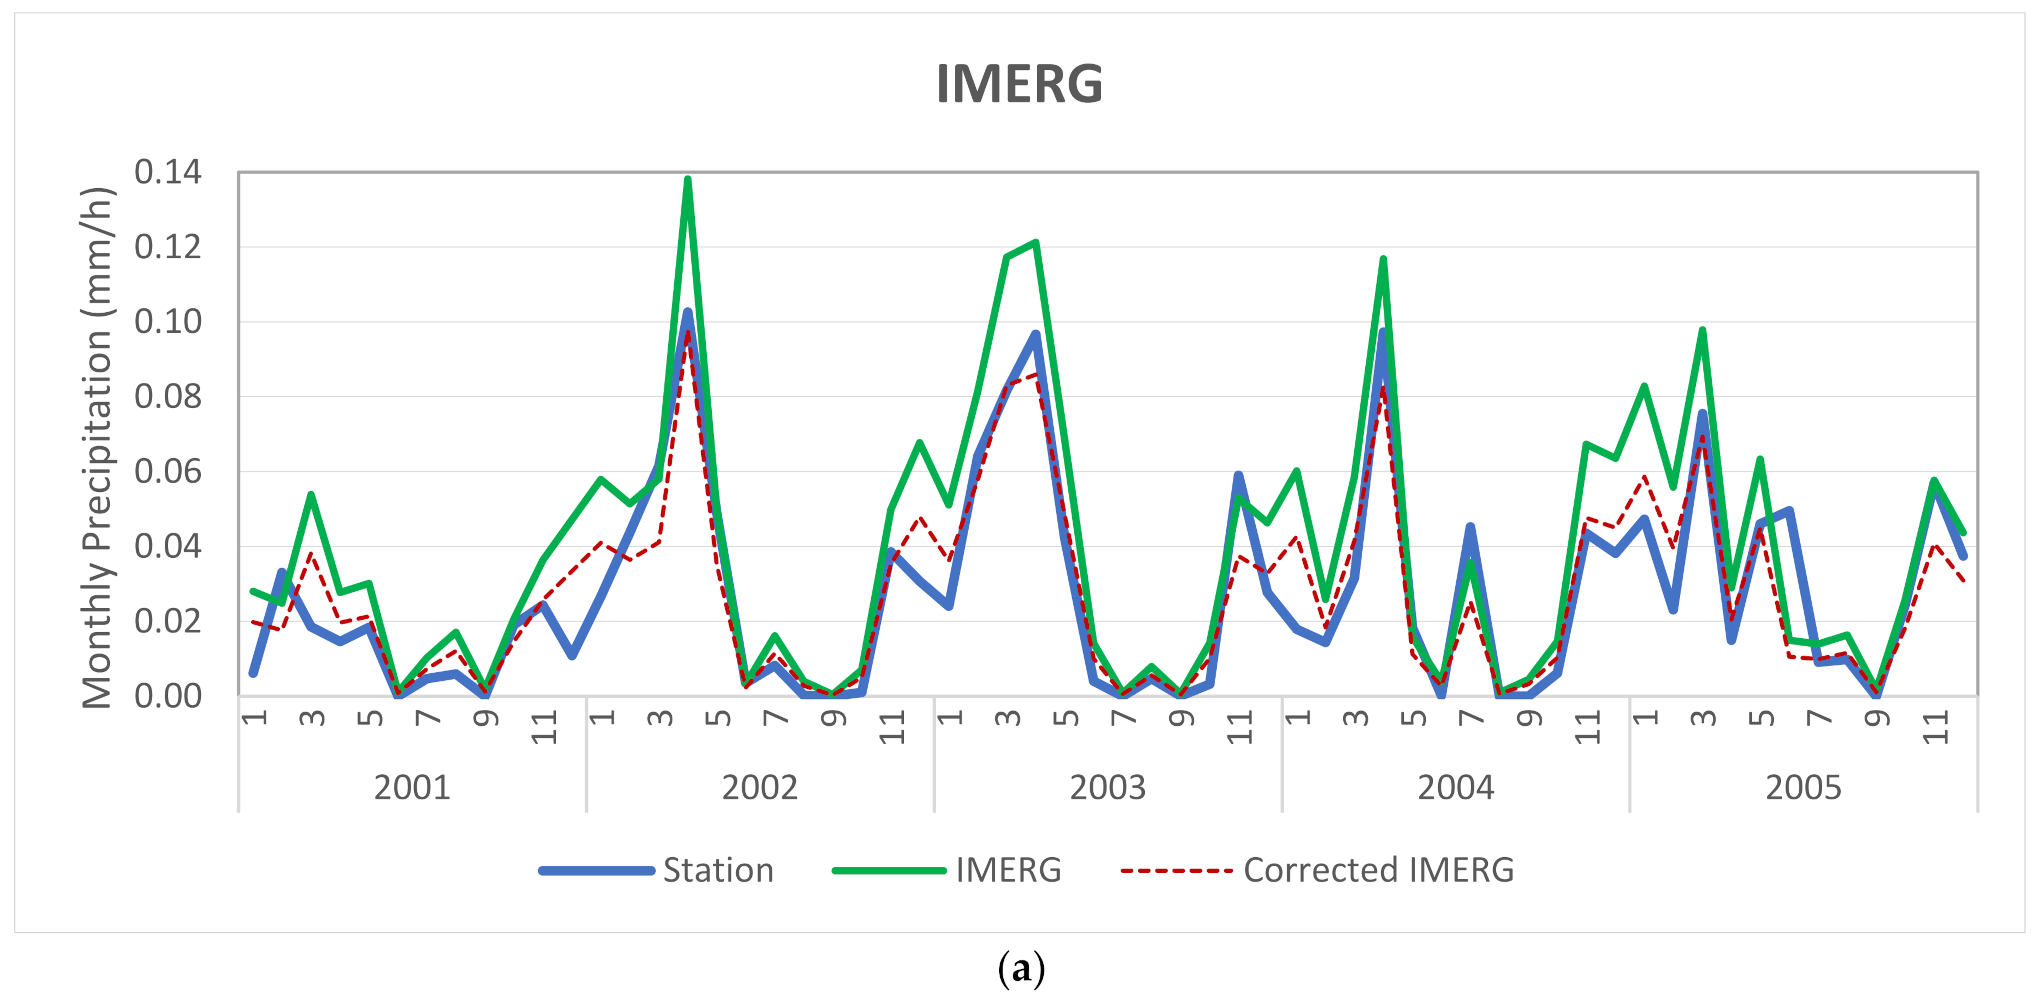
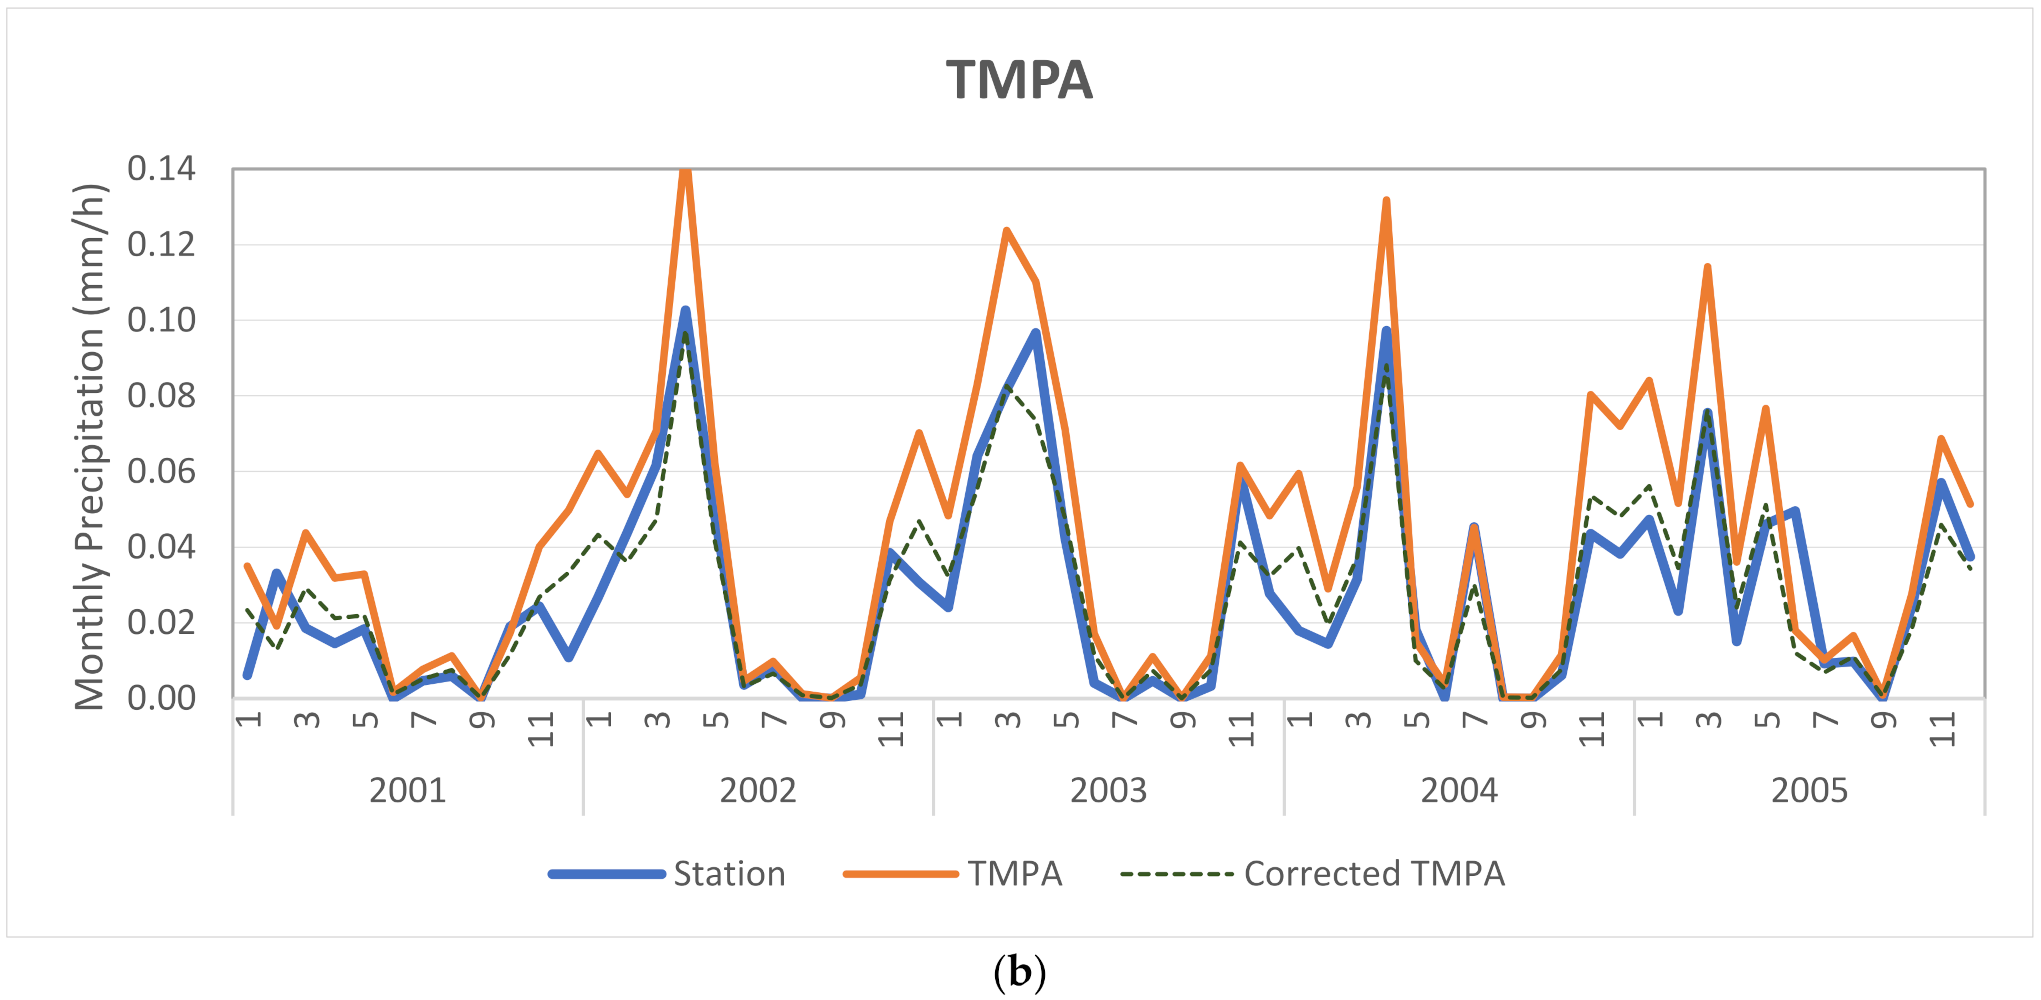
Figure 5 illustrates the effect of the correction factor on the monthly variations of IMERG and TMPA precipitation compared to a ground station. Only five years were selected for better visualization. The graphs show that IMERG and TMPA overestimate the station’s rainfall data, especially in the peaks. However, the patterns of corrected data are the same as the original ones. This is because the correction factor is multiplied by the IMERG/TMPA values; therefore, it does not change values equal to zero.
R-squared and correction factors (CF
IMERG and CF
TMPA) of all ground stations are listed in
Table 3. The IMERG/TMPA data overestimate precipitation because the CF is less than one. It means the satellite data should be decreased. However, in the high rain region, IMERG/TMPA mostly underestimates the precipitation. Nevertheless, not only IMERG outperforms TMPA, but it is also more precise than TMPA. On average, IMERG has the best performance in the arid region and TMPA in high rain areas. The highest discrepancy between IMERG and TMPA happened in ZAHAK, which is displayed in bold.
Figure 6,
Figure 7 and
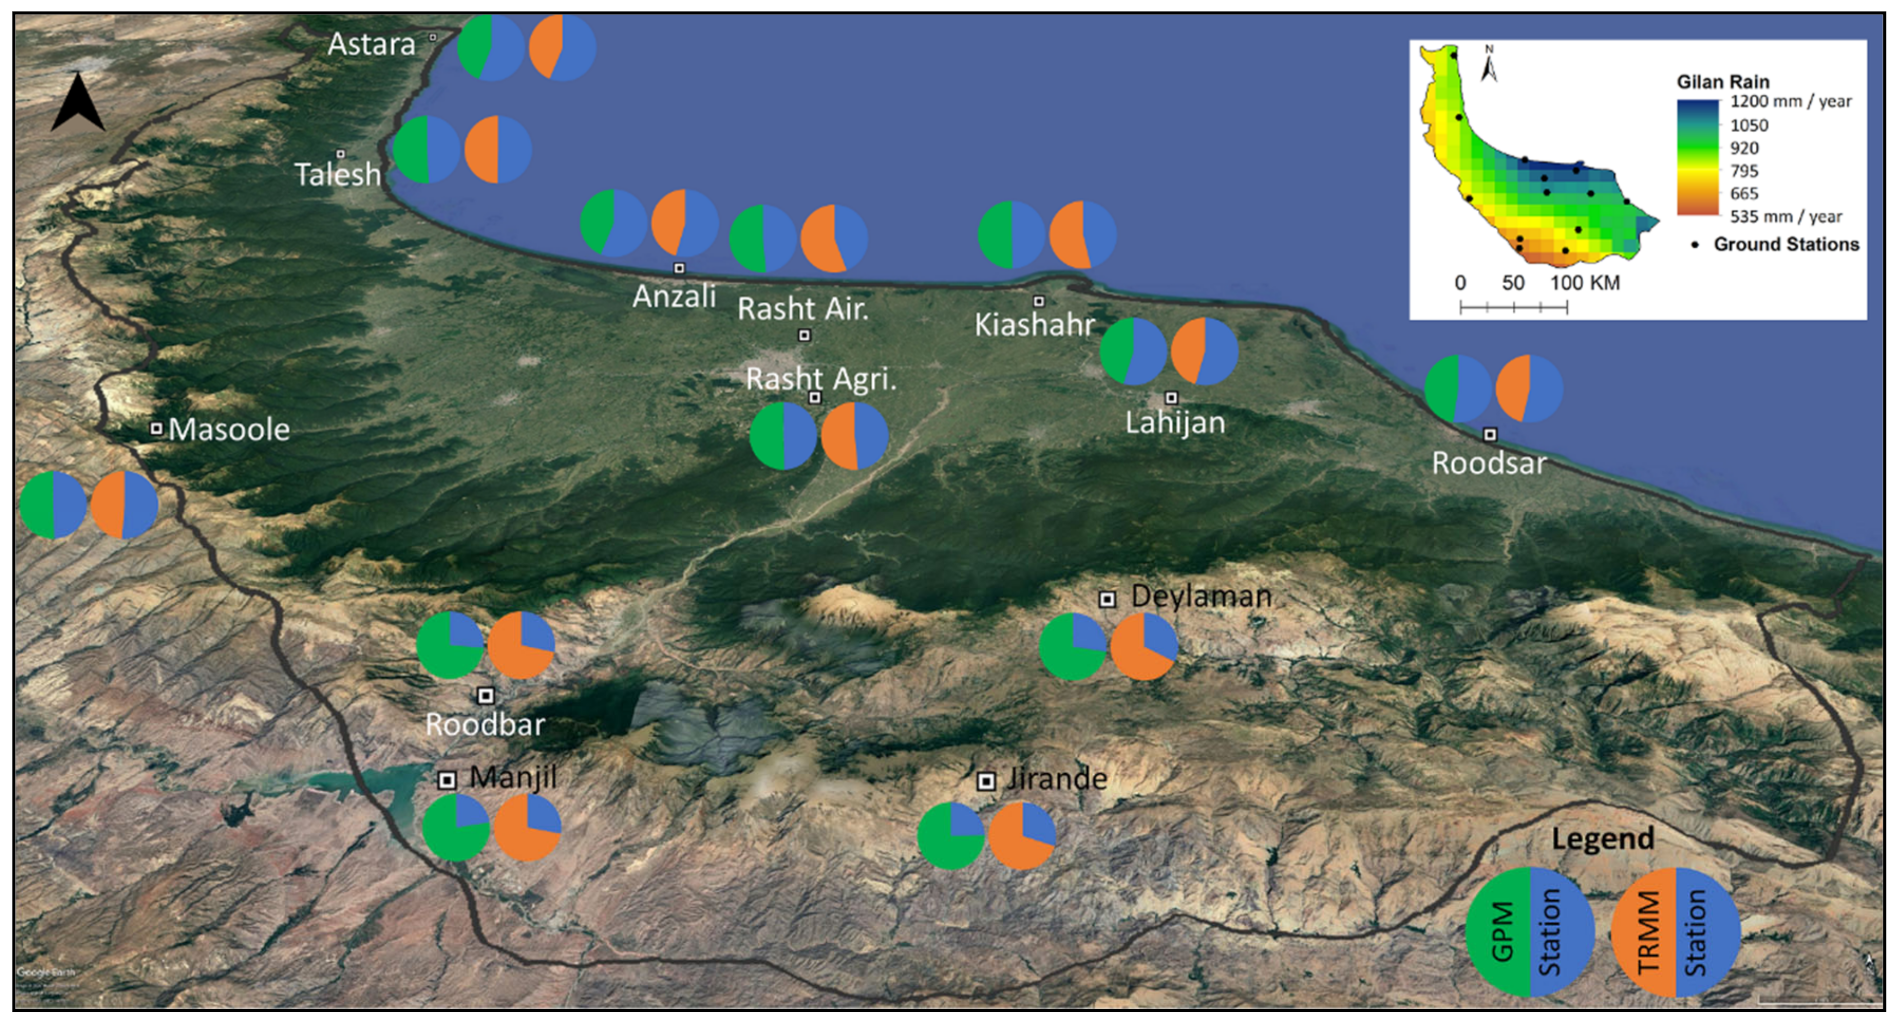
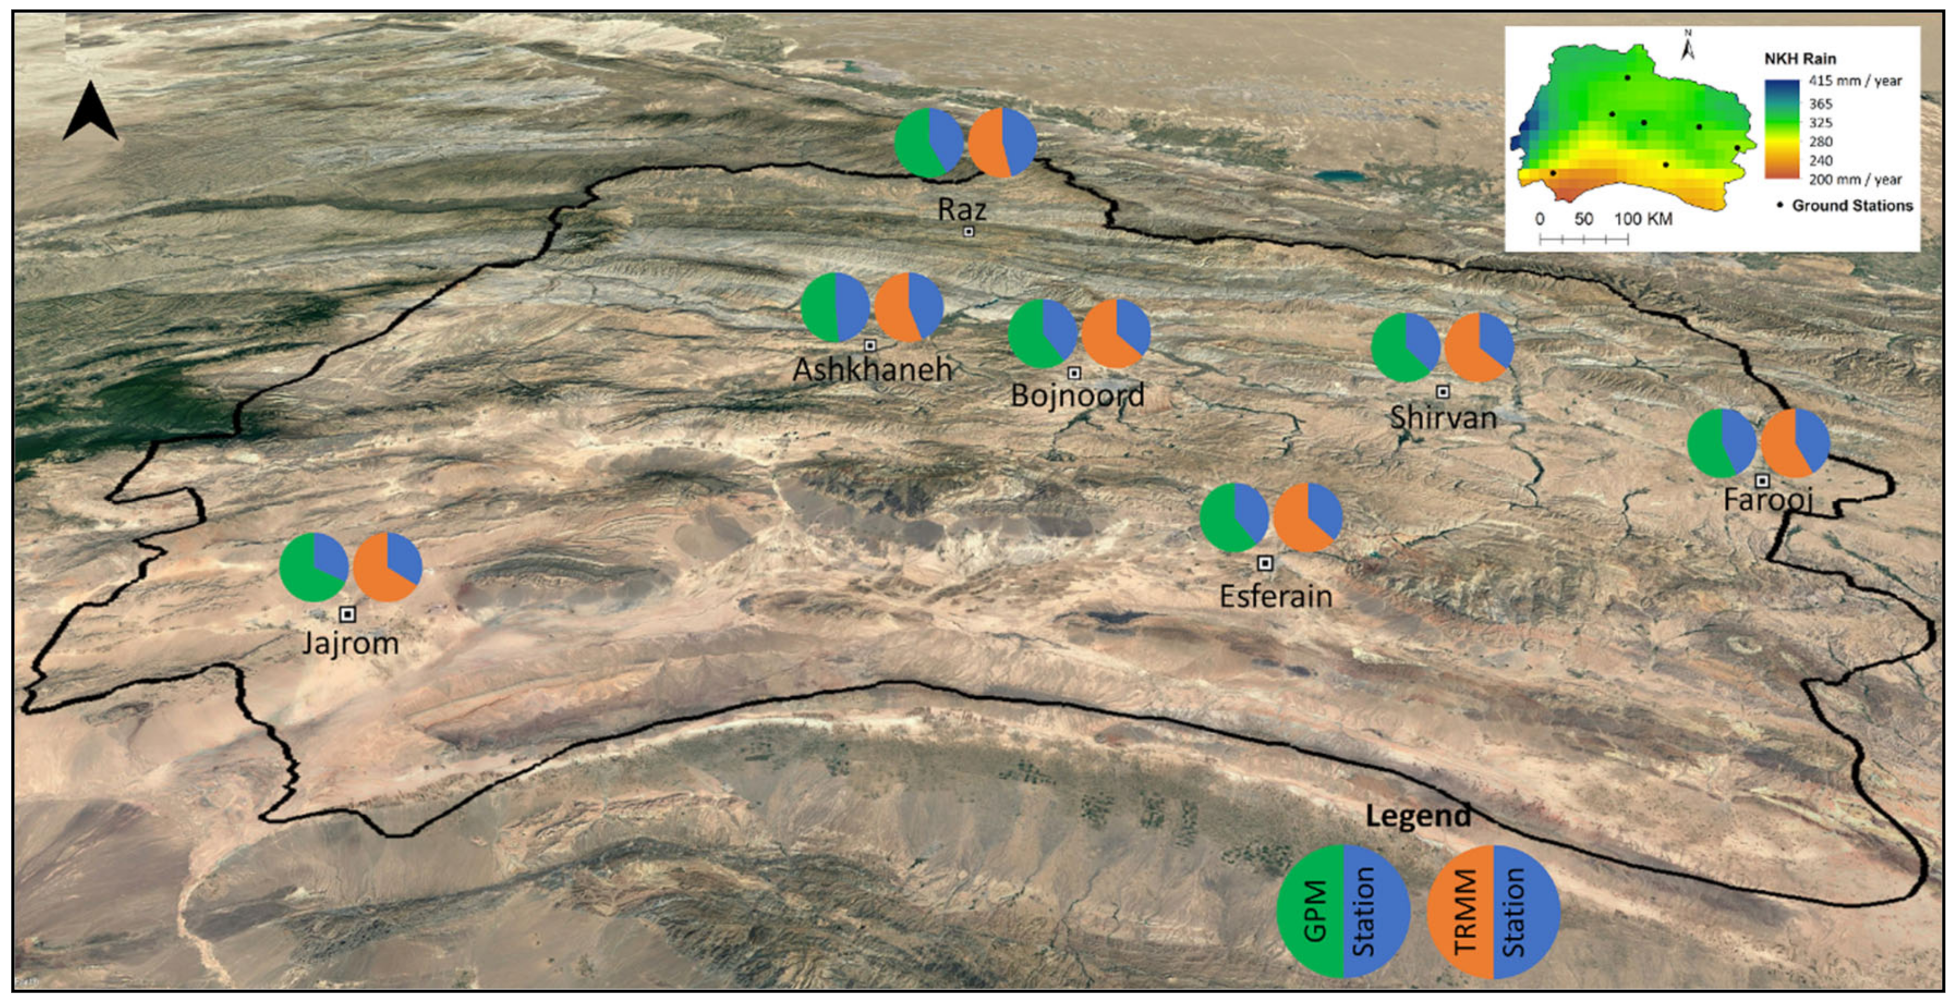
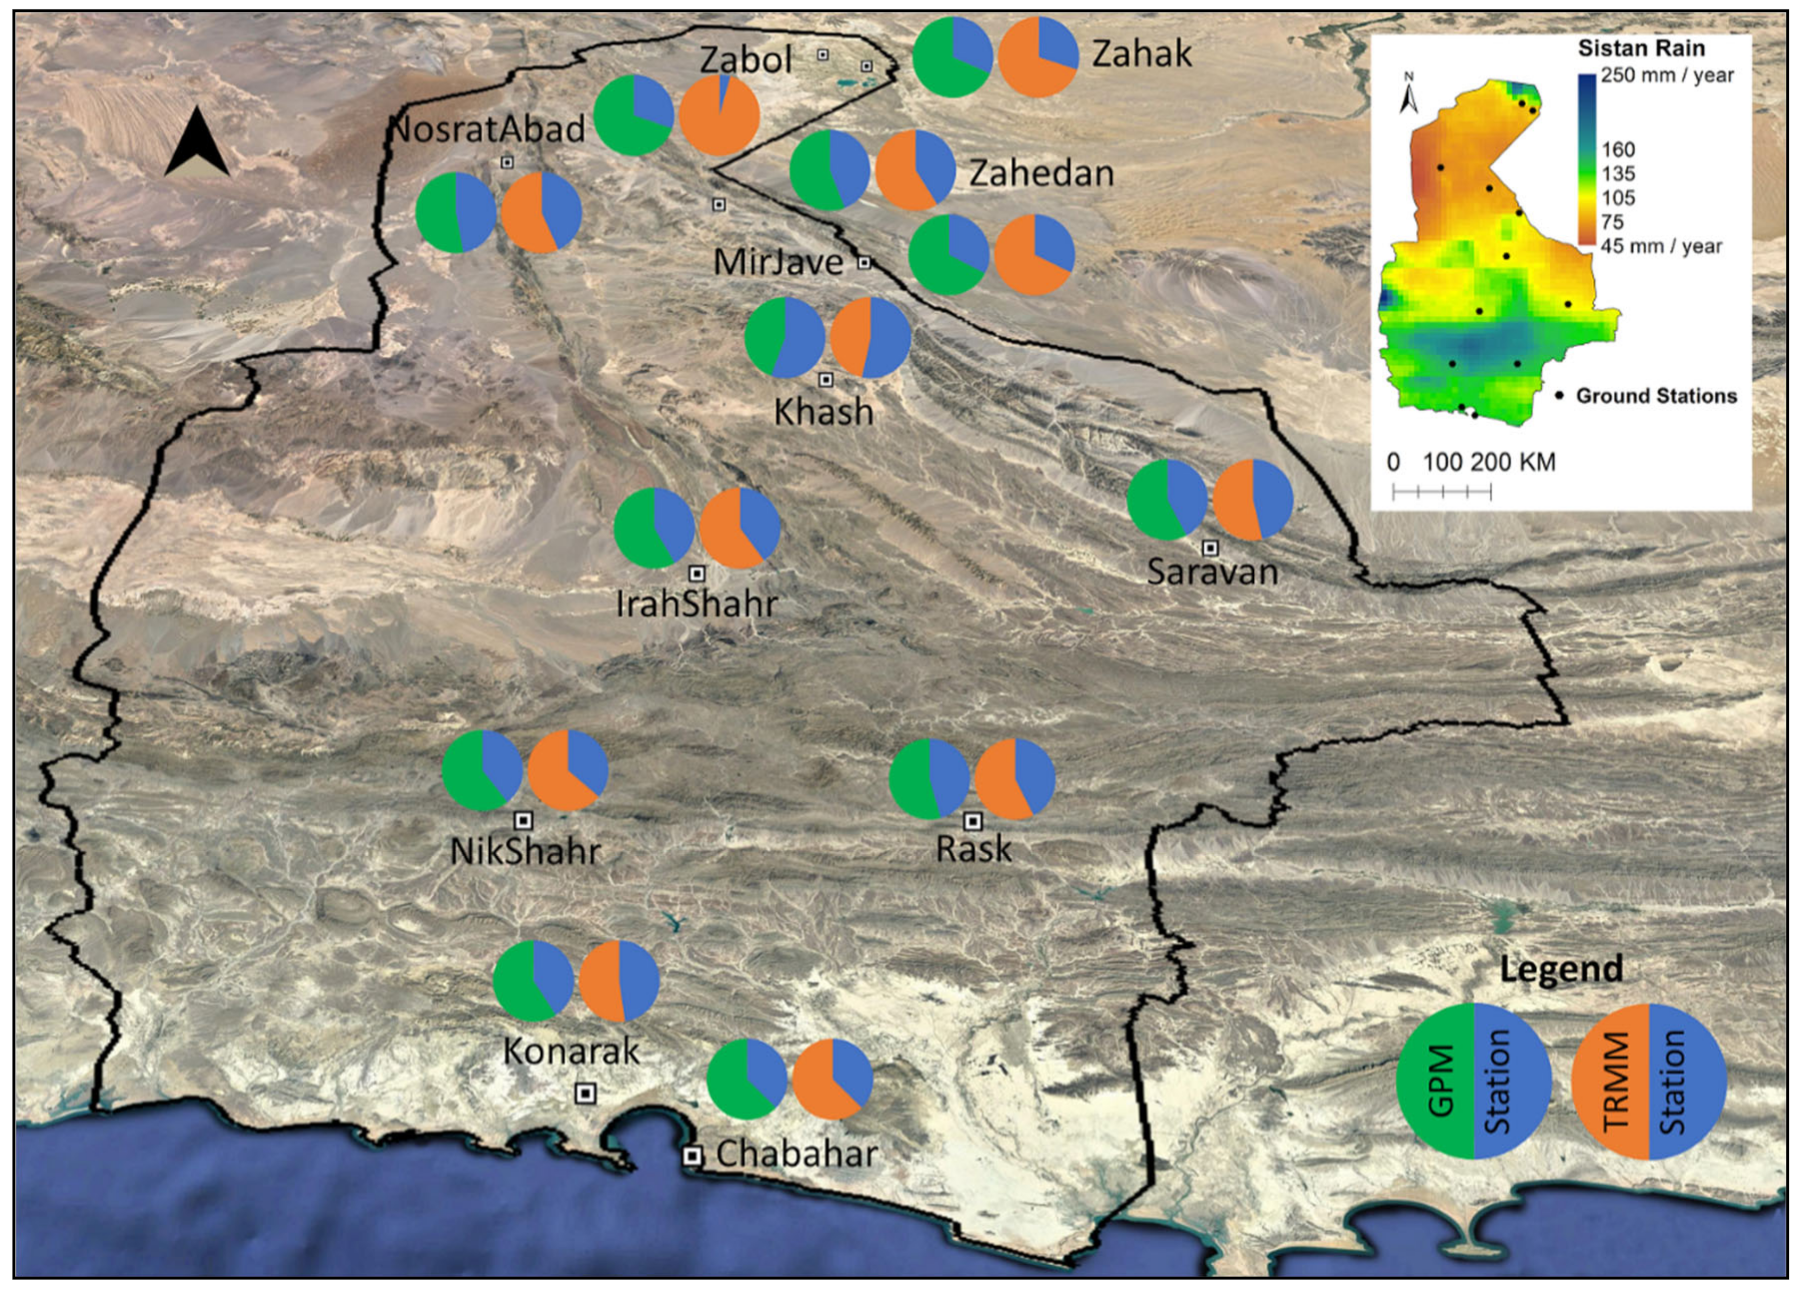
Figure 8 demonstrate the values of correction factors for both datasets in the study areas as colored circles. These circles work in such a way that if the satellite estimate is equal to ground measurement, then the circle is divided into two equal parts. However, if the satellite estimate is higher than the ground observation, its share in the circle is greater, and the correction factor will be less than one, and if the correlation factor is less than one, vice versa. In these figures, the Google Earth satellite images are tilted to be visualized as 3D images. The small precipitation maps were included in the top-right of each figure. Comparison of the precipitation map and the corresponding Google Earth image reveals a direct relationship between the amount of precipitation and IMERG/TMPA performance.
3.4. Performance of IMERG and TMPA Data in Wet, Normal, and Drought Periods
SPI takes advantage of at least 20 years of data, but some ground stations were newly established and covered short periods. Therefore, SPI was calculated only for stations with available data over the period from 1998 to 2017. First, the drought, wet, and normal conditions were calculated using in-situ data over this period (20 years). The performance of satellite-based precipitation (2000 to 2017) was assessed in comparison to the obtained in-situ results.
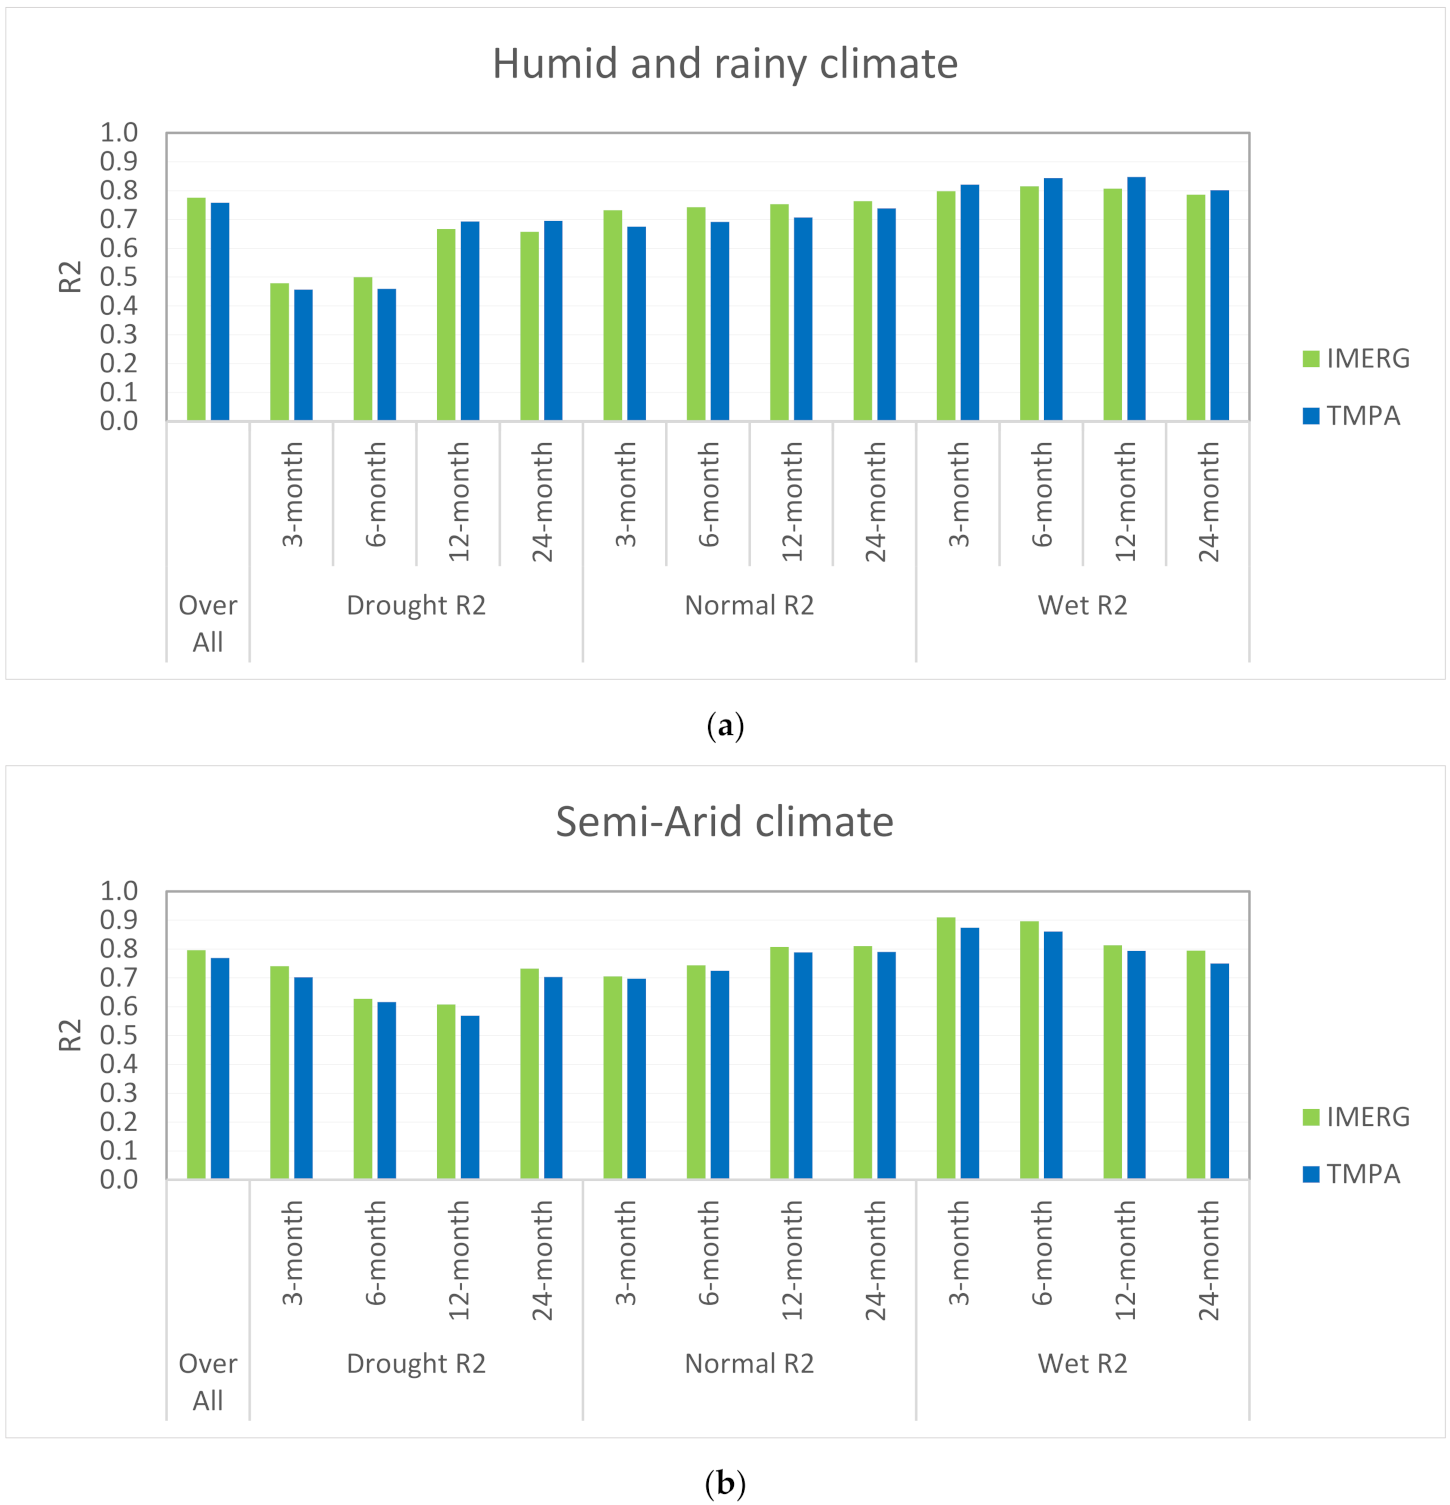
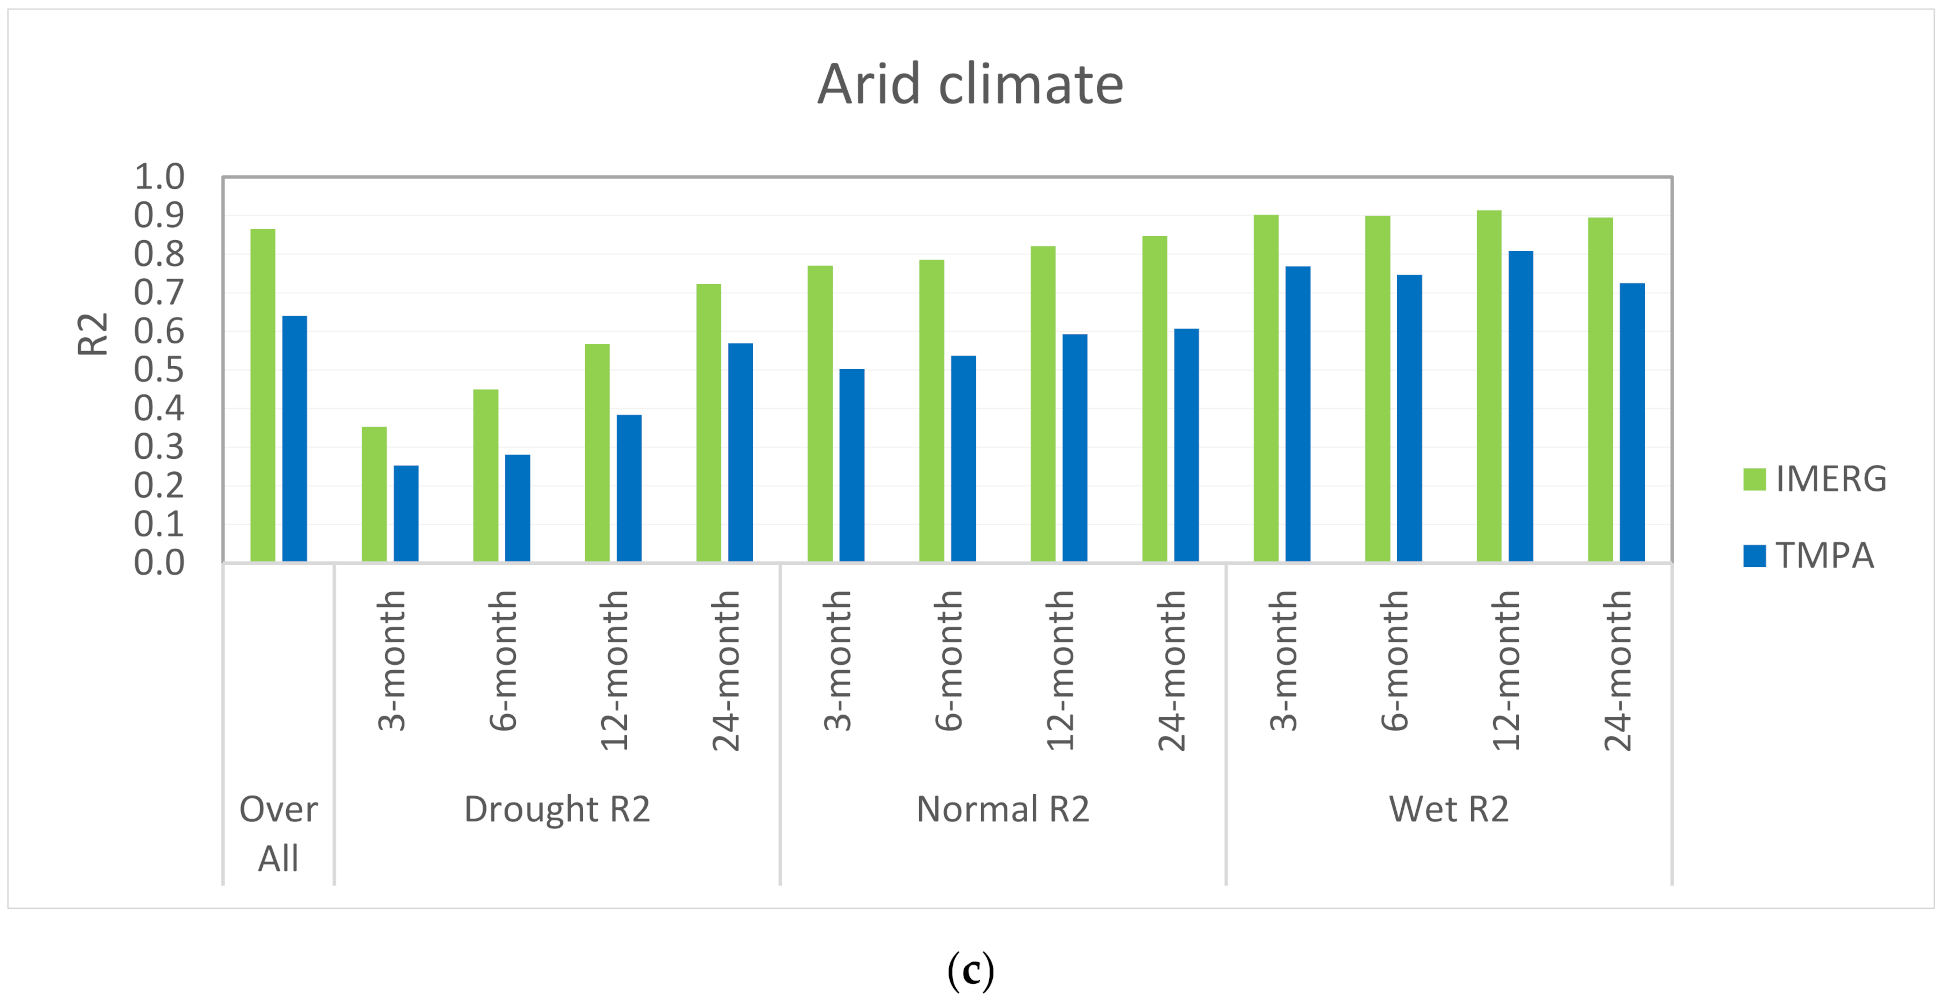
Figure 9 shows the results of comparing ground data with satellite data for different study areas under different drought conditions. Three- and six-month intervals were considered for short-term, and 12- and 24-month intervals for long-term analysis. The improvement of performance from IMERG to TMPA is considerable in arid climatic conditions. The overall R
2 factor in the arid region is 0.64 for TMPA, while for IMERG, it is 0.86. However, R
2 increased from 0.76 to 0.78 for TMPA and IMERG in humid and 0.77 to 0.80 in semi-arid regions.
3.5. Seasonal Performance of Satellite Products in Different Climatic Conditions
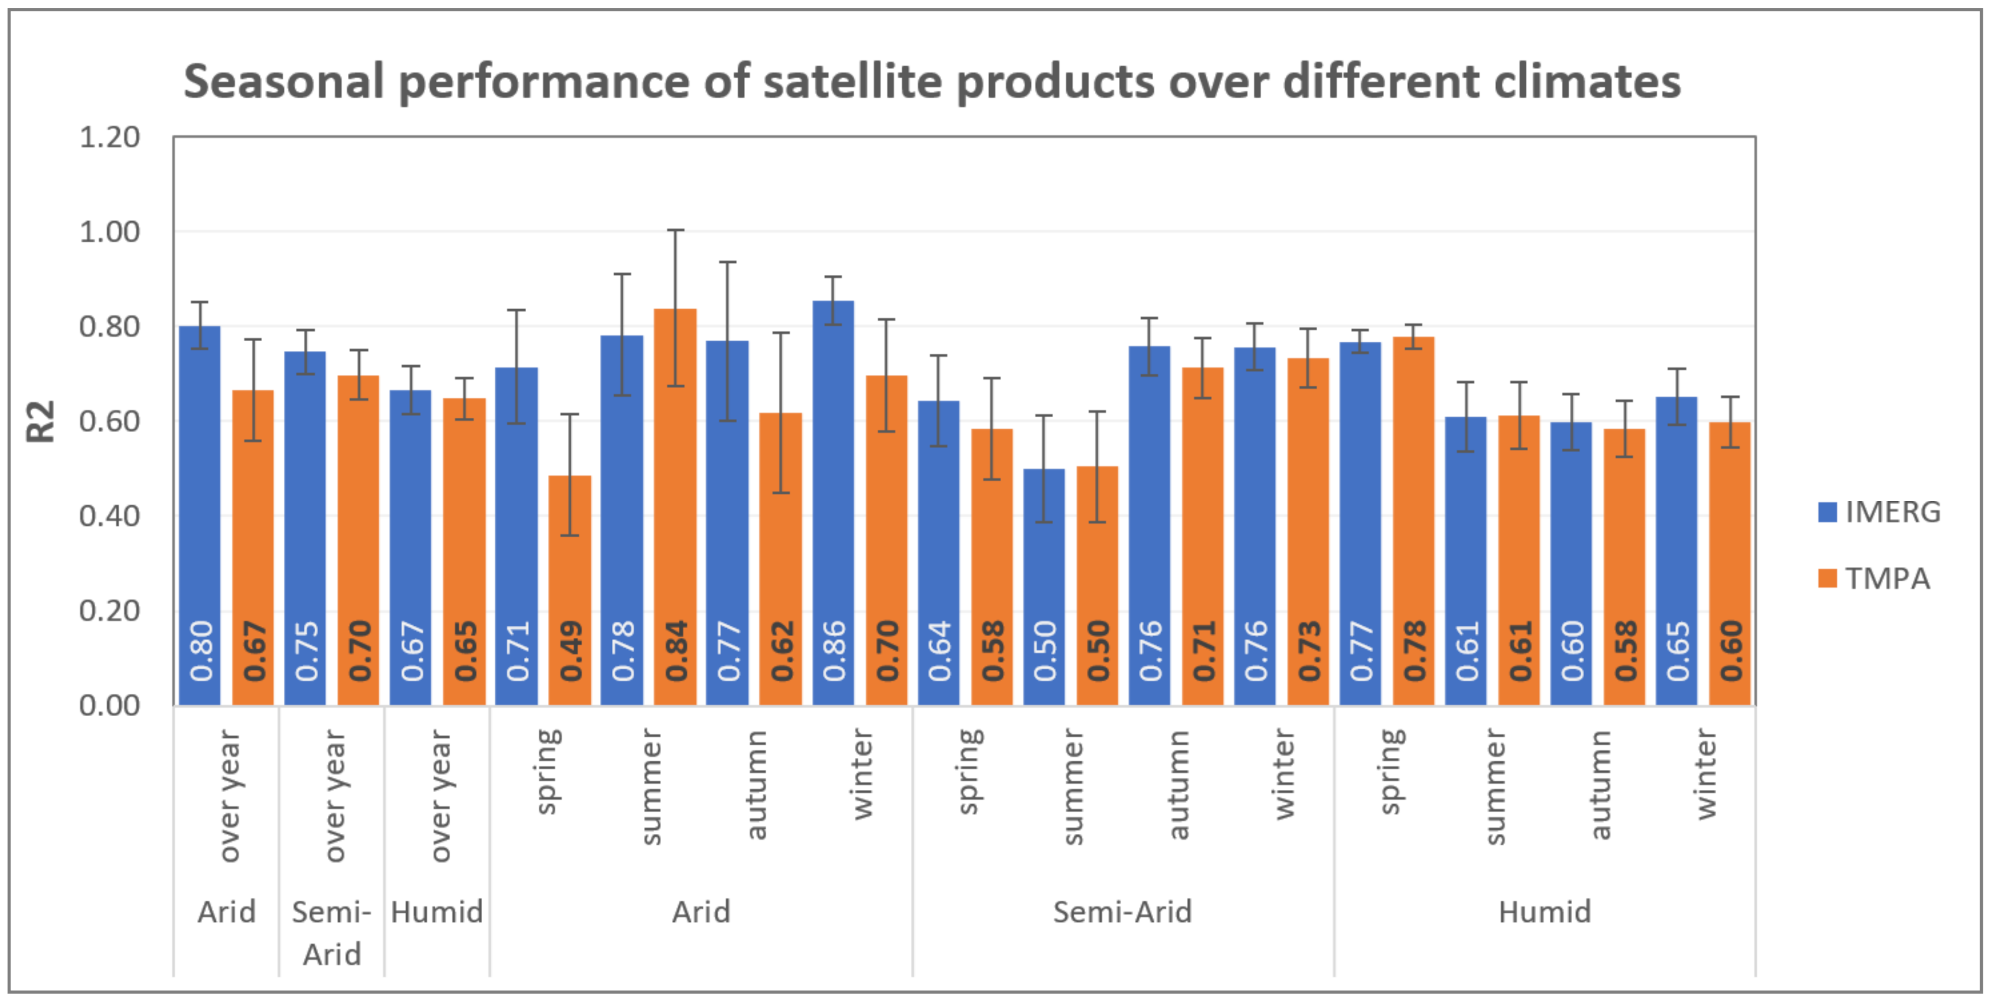
Figure 10 compares R-squared and standard error Equation (4) of satellite data with ground measurements in different seasons. The R-squared shows how the data are consistent with each other. However, the standard error indicates how the data is good and spread out around the mean. In general, R-squared of IMERG is higher than TMPA over yearly measurements. The highest was seen in the arid area, where IMERG’s R
2 was 0.8, while TMPA’s 0.67, with a higher standard error. Furthermore, the most considerable difference between IMERG and TMPA performance occurred for spring in the arid region.
3.6. Estimating the Correction Factor Based on the Properties of Ground Synoptic Stations
Linear regression using a stepwise method showed that among the variables of
Table 1, there are only three statistically significant independent variables. Therefore, the final regression equation for IMERG was converted to Equation (5)
In Equation (6),
MeanPrecip is the average precipitation of each ground station over the study period (2000 to 2017).
Altitude and
Latitude are the characteristics of the ground stations. The coefficients of Equation (6) for IMERG and TMPA data are shown in
Table 4 and
Table 5, respectively. The
t-values show that the mean precipitation effect is two times higher than the altitude and latitude effects on the correction factor and is statistically significant based on the
p-value.
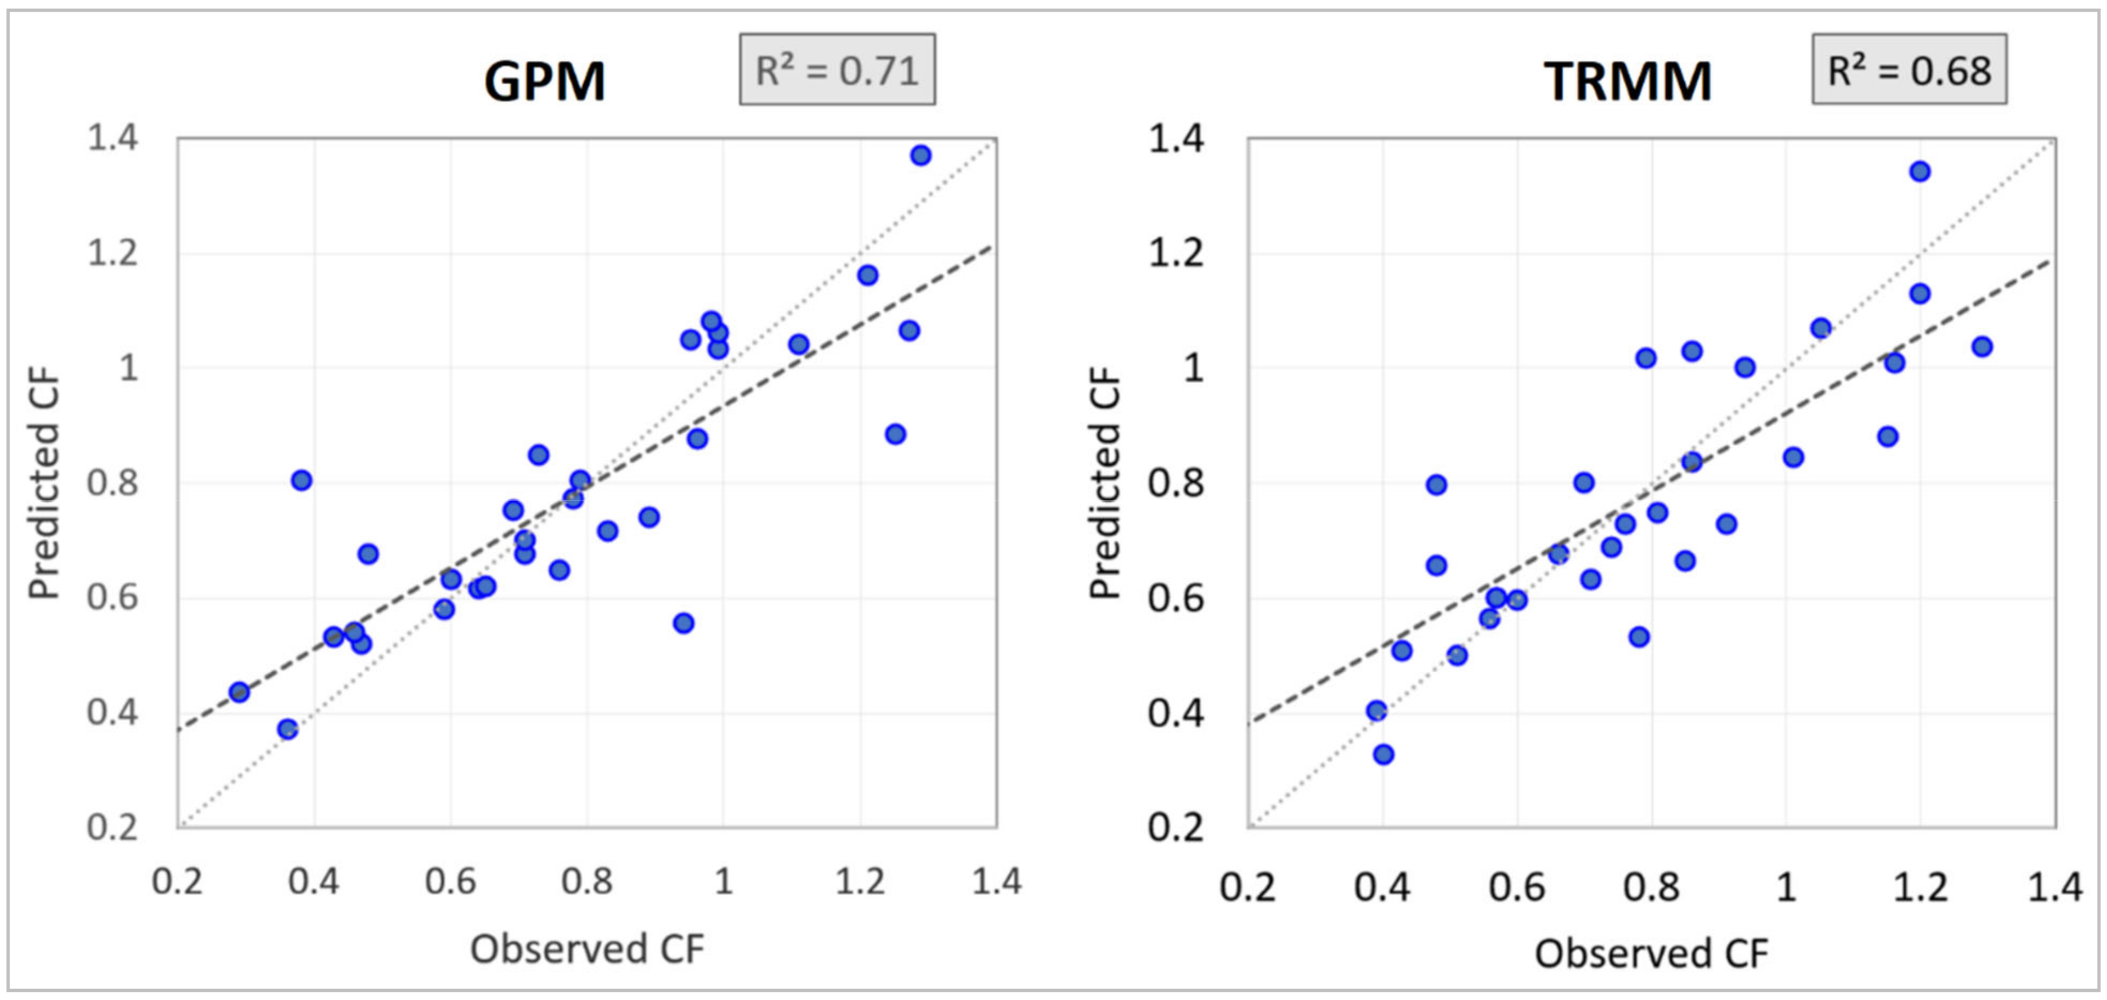
The comparison of observed and predicted correction factors for IMERG and TMPA data are shown in
Figure 11. The R
2 values for the prediction of IMERG and TMPA precision were 0.71 and 0.68, respectively.
4. Discussion
Rainfall is the primary source of freshwater supply on the Earth [
50]. Therefore, an accurate and precise understanding of precipitation can help in various fields, such as agriculture and preventing natural disasters [
51]. Satellite data is an essential source of rainfall data due to its global coverage, broad time ranges, and low cost. However, various studies have shown that the accuracy of satellite data is not entirely reliable in some places and requires error correction [
52]. In this study, satellite data performance (IMERG/TMPA) was evaluated in three different climates. Winter rainfall plays a vital role in tree growth in the study area and prevents premature forest fires, so a more accurate estimate of rainfall in winter can benefit forest management research [
29]. Therefore, the accuracy of the data should be checked in different seasons. Furthermore, drought and wet conditions are critical in water resource management. Consequently, the reliability of data on drought and wet conditions is essential and can be useful in increasing the accuracy of predictions and timely warnings.
4.1. Interpolation of Ground-Based Precipitation or Satellite Measurement
Interpolation is a standard method for estimating precipitation in areas with no rain gauge stations [
53,
54].
Figure 3 compares ground station precipitation, interpolated values, and satellite imagery results for 2017 for three different climatic zones. Statistical comparison based on the
t-test method showed no significant difference between interpolated values and satellite measurements. There was a good agreement between ground measurements and interpolated values on homogeneous areas. In the rainy region, interpolation roughly outperformed satellite data in the homogeneous areas. In contrast, the satellite data was more consistent with the ground data than interpolated data in the heterogeneous region. In other words, the interpolation method cannot accurately estimate the amount of precipitation using the surrounding stations in heterogeneous areas. In the semi-arid region with dense rain gauges, the output of the interpolation method was more consistent with ground measurements than the satellite products. However, the performance of satellite measurements in remote areas was more relevant to the interpolation results based on ground station measurements. Similar results were seen in the arid region, showing that interpolation works better at short distances around the pixels of satellite imagery. However, satellite data have more acceptable results than interpolation methods in areas with sparse and heterogeneous rain gauges. The results of comparing ground data and interpolated values show that the amount of rainfall measured at ground stations can be used for distances comparable to the pixels of satellite images, especially in homogeneous areas.
4.2. Comparison of IMERG and TMPA Performance and Precision Prediction
Based on the investigations, the GPM/IMERG product was mainly more accurate than TRMM/TMPA over different climates, although, in some stations, TMPA was slightly (less than 5%) better than IMERG. The performance of satellite data in the arid climate was better than in other climates. On average, the highest difference between the IMERG and TMPA data was in the arid climate and the lowest in the rainy climate. For example, in the arid climate station, namely ZAHAK, the R
2 was 0.15 for TMPA and 0.85 for IMERG. The same results were found by Huffman [
55] in the driest place of Colombia.
The correction factor obtained by minimizing the root mean square error (RMSE) between the ground station and satellite data varied in different climates. For example, the spatial analysis of CF (
Figure 6,
Figure 7 and
Figure 8) shows that in the humid area, in locations exposed to sea with dense vegetation, the rainfall was underestimated by satellite. However, precipitation was overestimated in stations behind the mountains, as was the case for semi-arid and arid climates.
Although the CF does not affect the precipitation estimation correlation between the stations and satellite data, it corrects the monthly precipitation totals. In other words, IMERG/TMPA overestimates and underestimates the rainfall, and CF adjusts the rainfall estimation to be close to the station amount. Results show that CF could be calculated using the average precipitation, altitude, and latitude of the locations in the study area. Average precipitation and altitude have positive, and latitude negative, effects on the amount of CF. Therefore, for locations with high rain or high altitudes, IMERG/TMPA underestimates the precipitation. Many validation studies confirm the strong dependence of the accuracy of satellite rainfall estimation on the climate regime and topographic features of the study regions. Therefore, they propose regionally-based evaluations instead of global approaches [
56,
57,
58]. It should be mentioned that the calculated CF are specific for the case study area and may not work for other case studies.
4.3. Performance of Satellite Products in Drought, Normal, and Wet Conditions
Due to the importance of rainfall in drought periods and a positive correlation between the CF and the amount of rainfall, the performance was examined to measure the satellite products’ reliability in drought and wet conditions. The results show that by increasing the time scales, the correlation increases as well. In other words, satellite products have higher accuracy in predicting long-term drought or wet conditions, but they should be used cautiously for short periods.
Because of the SPI index limitations, the calculations were done only for the stations with at least 20 years of data. Generally speaking, IMERG products are always more accurate than TMPA in all drought conditions. However, it seems their products have different accuracies in different scales of droughts and other conditions. In general, satellite products have the highest correlation in wet conditions and the lowest in drought periods. Furthermore,
Figure 9 shows that the IMERG algorithm operates more accurately than TMPA in the arid region, especially in drought conditions. More importantly, the accuracy of satellite products in short-term drought conditions, especially in the arid climate, is significantly lower than in normal and wet conditions. In drought conditions, the lowest correlation belongs to the arid area in the short-term period. In other words, there can be significant uncertainties in the monitoring of agricultural drought. As far as our research shows, many evaluations of drought or wet monitoring are based on satellite products, but this study shows that drought or wet monitoring through satellite products, especially for drought periods, should be done with caution [
31,
59,
60,
61,
62].
4.4. Performance of Satellite Products in Different Seasons
In general, IMERG has outperformed TMPA in yearly and seasonal performance. The highest enhancement of IMERG belongs to the arid region, where there are sparse ground stations. Aside from performance, the standard error has also been noticeably reduced in IMERG, especially for arid and semi-arid regions. Seasonal exploration of product performance showed that IMERG had the best results during winter in the arid region. In contrast, it had slightly lower correlation and a larger standard error in other seasons. On the other hand, TMPA had the best results in summer and worst in spring with a high standard error. On average, the highest correlation and lowest spread occurred in the studied areas in winter and spring. However, the worst correlation with the highest dispersion occurred in summer. These results are contrary to the findings of Kolios and Kalimeris [
63] in the Mediterranean region.
It can be inferred that product performance decreased with the warming of the air and reached the lowest value in the summer. Then the correlation began to increase in the fall and reached its highest value in the winter. The standard error was the highest in summer and lowest in winter. These results are in complete agreement with the results of Adeyewa and Nakamura [
64]. The overall average correlation from highest to lowest was in winter, spring, fall, and summer. A hypothesis is formed here in the study that the low performance of satellite products in the summer is probably due to the rapid evaporation and short duration of precipitation in the regions. In other words, the satellite has measured precipitation, a part of which has evaporated before reaching the ground, so precipitation accuracy in hot weather is estimated to be lower than in cold weather.
In the end, the lack of long-term meteorological ground station data, the limited number of stations, and the non-uniform distribution of ground stations limited our study to explore the satellite products in depth. Therefore, more investigations with a larger number of ground stations across the country and a more extensive study area, especially for drought monitoring, are suggested for future studies. Moreover, the accuracy of precipitation after long drought conditions that can lead to flood occurrence calls for extra investigations.
5. Conclusions
The provision of accurate precipitation data leads to improvements in various agricultural applications, water resource management, and natural disaster forecasting. Despite the advantages of satellite precipitation products, remote sensing measurements are inaccurate in some parts of the world, leading to incorrect results and unreliable interpretations. This paper examined the performance of satellite products in three climates—including humid and rainy, semi-arid with low rainfall, and arid with low rainfall—in drought and wet conditions and different seasons. The results of this study are as follows. (1) In the case study, the precision of satellite products in different climates depends on latitude, so that in high latitudes, IMERG/TMPA products overestimate the precipitation products and vice versa. (2) The average monthly rainfall measured by satellite is 11% (in the high rainfall region), 50% (in the semi-arid region), and 43% (in the arid region) higher than station measurements. (3) The introduced correction factor (CF) does not affect the value of the R2 coefficient. CF increases the precision of the satellite products. (4) Respectively, 71% and 68% of the variation in IMERG and TMPA CF values can be explained by three parameters, namely mean precipitation, altitude, and latitude. (5) The performance of satellite precipitation products in wet conditions is higher than in normal conditions, and the correlation in normal conditions is higher than in drought conditions. The lowest performance occurs in the drought condition of the arid region. (5) Satellite products have the best performance in winter and the worst performance in summer.
Author Contributions
Conceptualization, J.K. and A.A.K.; formal analysis, J.K.; funding acquisition, S.Q.; investigation, J.K., A.A.K. and S.Q.; methodology, J.K.; project administration S.Q. and A.A.K.; software, J.K.; supervision, S.Q. and A.A.K.; visualization, J.K.; writing—original draft, J.K.; writing—review and editing, S.Q., A.A.K. and M.K.F. All authors have read and agreed to the published version of the manuscript.
Funding
This research received no external funding.
Data Availability Statement
Data are available on request from the corresponding author.
Conflicts of Interest
The authors declare no conflict of interest.
References
- Shukla, A.K.; Ojha, C.S.P.; Singh, R.P.; Pal, L.; Fu, D. Evaluation of TRMM precipitation dataset over Himalayan catchment: The upper Ganga basin, India. Water 2019, 11, 613. [Google Scholar] [CrossRef] [Green Version]
- Ebert, E.E.; Janowiak, J.E.; Kidd, C. Comparison of near-real-time precipitation estimates from satellite observations and numerical models. Bull. Am. Meteorol. Soc. 2007, 88, 47–64. [Google Scholar] [CrossRef] [Green Version]
- Faurès, J.-M.; Goodrich, D.; Woolhiser, D.A.; Sorooshian, S. Impact of small-scale spatial rainfall variability on runoff modeling. J. Hydrol. 1995, 173, 309–326. [Google Scholar] [CrossRef]
- Yan, Y.; Wu, H.; Gu, G.; Huang, Z.; Alfieri, L.; Li, X.; Nanding, N.; Pan, X.; Tang, Q. Climatology and Interannual Variability of Floods During the TRMM Era (1998–2013). J. Clim. 2020, 33, 3289–3305. [Google Scholar] [CrossRef]
- Robbins, J. A probabilistic approach for assessing landslide-triggering event rainfall in Papua New Guinea, using TRMM satellite precipitation estimates. J. Hydrol. 2016, 541, 296–309. [Google Scholar] [CrossRef]
- Ibadullah, W.M.W.; Tangang, F.; Juneng, L.; Jamaluddin, A.F. Practical Predictability of the 17 December 2014 Heavy Rainfall Event over East Coast of Peninsular Malaysia using WRF Model. Sains Malays. 2019, 48, 2297–2306. [Google Scholar] [CrossRef]
- Amini, A.; Abdeh Kolahchi, A.; Al-Ansari, N.; Karami Moghadam, M.; Mohammad, T. Application of TRMM Precipitation Data to Evaluate Drought and Its Effects on Water Resources Instability. Appl. Sci. 2019, 9, 5377. [Google Scholar] [CrossRef] [Green Version]
- Du, L.; Tian, Q.; Yu, T.; Meng, Q.; Jancso, T.; Udvardy, P.; Huang, Y. A comprehensive drought monitoring method integrating MODIS and TRMM data. Int. J. Appl. Earth Obs. Geoinf. 2013, 23, 245–253. [Google Scholar] [CrossRef]
- Collischonn, B.; Collischonn, W.; Tucci, C.E.M. Daily hydrological modeling in the Amazon basin using TRMM rainfall estimates. J. Hydrol. 2008, 360, 207–216. [Google Scholar] [CrossRef]
- Turk, F.J.; Rohaly, G.D.; Jeff, H.; Smith, E.A.; Marzano, F.S.; Mugnai, A.; Levizzani, V. Meteorological applications of precipitation estimation from combined SSM/I, TRMM and infrared geostationary. In Microwave Radiometry and Remote Sensing of the Earth’s Surface and Atmosphere; VSP International Science Publishers: Leiden, The Netherlands, 2020; p. 353. [Google Scholar]
- Macharia, J.M.; Ngetich, F.K.; Shisanya, C.A. Comparison of satellite remote sensing derived precipitation estimates and observed data in Kenya. Agric. For. Meteorol. 2020, 284, 107875. [Google Scholar] [CrossRef]
- Zipper, S.C.; Loheide II, S.P. Using evapotranspiration to assess drought sensitivity on a subfield scale with HRMET, a high resolution surface energy balance model. Agric. For. Meteorol. 2014, 197, 91–102. [Google Scholar] [CrossRef]
- Niemczynowicz, J. Urban hydrology and water management–present and future challenges. Urban Water 1999, 1, 1–14. [Google Scholar] [CrossRef]
- Cosgrove, W.J.; Loucks, D.P. Water management: Current and future challenges and research directions. Water Resour. Res. 2015, 51, 4823–4839. [Google Scholar] [CrossRef] [Green Version]
- Mashaly, A.F.; Fernald, A.G. Identifying Capabilities and Potentials of System Dynamics in Hydrology and Water Resources as a Promising Modeling Approach for Water Management. Water 2020, 12, 1432. [Google Scholar] [CrossRef]
- Boluwade, A. Spatial-Temporal Assessment of Satellite-Based Rainfall Estimates in Different Precipitation Regimes in Water-Scarce and Data-Sparse Regions. Atmosphere 2020, 11, 901. [Google Scholar] [CrossRef]
- de Carvalho Lopes, D.; Neto, A.J.S.; de Queiroz, M.G.; de Souza, L.S.B.; Zolnier, S.; da Silva, T.G.F. Sparse Gash model applied to seasonal dry tropical forest. J. Hydrol. 2020, 590, 125497. [Google Scholar] [CrossRef]
- McKee, T.B.; Doesken, N.J.; Kleist, J. The relationship of drought frequency and duration to time scales. In Proceedings of the 8th Conference on Applied Climatology, Anaheim, CA, USA, 17–22 January 1993; pp. 179–183. [Google Scholar]
- Zhou, Z.; Guo, B.; Su, Y.; Chen, Z.; Wang, J. Multidimensional evaluation of the TRMM 3B43V7 satellite-based precipitation product in mainland China from 1998–2016. PeerJ 2020, 8, e8615. [Google Scholar] [CrossRef] [Green Version]
- Dai, A. Drought under global warming: A review. Wiley Interdiscip. Rev. Clim. Change 2011, 2, 45–65. [Google Scholar] [CrossRef] [Green Version]
- Tan, M.L.; Tan, K.C.; Chua, V.P.; Chan, N.W. Evaluation of TRMM product for monitoring drought in the Kelantan River Basin, Malaysia. Water 2017, 9, 57. [Google Scholar] [CrossRef] [Green Version]
- Vicente-Serrano, S.M.; Beguería, S.; López-Moreno, J.I.; Angulo, M.; El Kenawy, A. A new global 0.5 gridded dataset (1901–2006) of a multiscalar drought index: Comparison with current drought index datasets based on the Palmer Drought Severity Index. J. Hydrometeorol. 2010, 11, 1033–1043. [Google Scholar] [CrossRef] [Green Version]
- Morid, S.; Smakhtin, V.; Moghaddasi, M. Comparison of seven meteorological indices for drought monitoring in Iran. Int. J. Climatol. A J. R. Meteorol. Soc. 2006, 26, 971–985. [Google Scholar] [CrossRef]
- Akhtari, R.; Morid, S.; Mahdian, M.H.; Smakhtin, V. Assessment of areal interpolation methods for spatial analysis of SPI and EDI drought indices. Int. J. Climatol. A J. R. Meteorol. Soc. 2009, 29, 135–145. [Google Scholar] [CrossRef]
- Tabari, H.; Abghari, H.; Hosseinzadeh Talaee, P. Temporal trends and spatial characteristics of drought and rainfall in arid and semiarid regions of Iran. Hydrol. Process. 2012, 26, 3351–3361. [Google Scholar] [CrossRef]
- Rostamian, R.; Eslamian, S.; Farzaneh, M.R. Application of standardised precipitation index for predicting meteorological drought intensity in Beheshtabad watershed, central Iran. Int. J. Hydrol. Sci. Technol. 2013, 3, 63–76. [Google Scholar] [CrossRef]
- SafarianZengir, V.; Sobhani, B.; Asghari, S. Modeling and Monitoring of Drought for forecasting it, to Reduce Natural hazards Atmosphere in western and north western part of Iran, Iran. Air Qual. Atmos. Health 2020, 13, 119–130. [Google Scholar] [CrossRef]
- Rittenhouse, C.D.; Rissman, A.R. Changes in winter conditions impact forest management in north temperate forests. J. Environ. Manag. 2015, 149, 157–167. [Google Scholar] [CrossRef]
- Westerling, A.L.; Cayan, D.R.; Brown, T.J.; Hall, B.L.; Riddle, L.G. Climate, Santa Ana winds and autumn wildfires in southern California. Eos Trans. Am. Geophys. Union 2004, 85, 289–296. [Google Scholar] [CrossRef]
- Zhou, T.; Yu, R.; Chen, H.; Dai, A.; Pan, Y. Summer precipitation frequency, intensity, and diurnal cycle over China: A comparison of satellite data with rain gauge observations. J. Clim. 2008, 21, 3997–4010. [Google Scholar] [CrossRef]
- Nastos, P.; Kapsomenakis, J.; Philandras, K. Evaluation of the TRMM 3B43 gridded precipitation estimates over Greece. Atmos. Res. 2016, 169, 497–514. [Google Scholar] [CrossRef]
- Darand, M.; Amanollahi, J.; Zandkarimi, S. Evaluation of the performance of TRMM Multi-satellite Precipitation Analysis (TMPA) estimation over Iran. Atmos. Res. 2017, 190, 121–127. [Google Scholar] [CrossRef]
- Wang, N.; Liu, W.; Sun, F.; Yao, Z.; Wang, H.; Liu, W. Evaluating satellite-based and reanalysis precipitation datasets with gauge-observed data and hydrological modeling in the Xihe River Basin, China. Atmos. Res. 2020, 234, 104746. [Google Scholar] [CrossRef]
- Wang, J.; Petersen, W.A.; Wolff, D.B. Validation of Satellite-Based Precipitation Products from TRMM to GPM. Remote Sens. 2021, 13, 1745. [Google Scholar] [CrossRef]
- Sharifi, E.; Steinacker, R.; Saghafian, B. Assessment of GPM-IMERG and other precipitation products against gauge data under different topographic and climatic conditions in Iran: Preliminary results. Remote Sens. 2016, 8, 135. [Google Scholar] [CrossRef] [Green Version]
- Anjum, M.N.; Ahmad, I.; Ding, Y.; Shangguan, D.; Zaman, M.; Ijaz, M.W.; Sarwar, K.; Han, H.; Yang, M. Assessment of IMERG-V06 precipitation product over different hydro-climatic regimes in the Tianshan Mountains, North-Western China. Remote Sens. 2019, 11, 2314. [Google Scholar] [CrossRef] [Green Version]
- Wu, L.; Xu, Y.; Wang, S. Comparison of TMPA-3B42RT legacy product and the equivalent IMERG products over mainland China. Remote Sens. 2018, 10, 1778. [Google Scholar] [CrossRef] [Green Version]
- Sunilkumar, K.; Yatagai, A.; Masuda, M. Preliminary evaluation of GPM-IMERG rainfall estimates over three distinct climate zones with APHRODITE. Earth Space Sci. 2019, 6, 1321–1335. [Google Scholar] [CrossRef] [Green Version]
- Tan, M.L.; Duan, Z. Assessment of GPM and TRMM precipitation products over Singapore. Remote Sens. 2017, 9, 720. [Google Scholar] [CrossRef] [Green Version]
- Zeng, H.; Li, L.; Li, J. The evaluation of TRMM Multisatellite Precipitation Analysis (TMPA) in drought monitoring in the Lancang River Basin. J. Geogr. Sci. 2012, 22, 273–282. [Google Scholar] [CrossRef]
- Tan, M.L.; Chua, V.P.; Tan, K.C.; Brindha, K. Evaluation of TMPA 3B43 and NCEP-CFSR precipitation products in drought monitoring over Singapore. Int. J. Remote Sens. 2018, 39, 2089–2104. [Google Scholar] [CrossRef]
- Xu, F.; Guo, B.; Ye, B.; Ye, Q.; Chen, H.; Ju, X.; Guo, J.; Wang, Z. Systematical evaluation of GPM IMERG and TRMM 3B42V7 precipitation products in the Huang-Huai-Hai Plain, China. Remote Sens. 2019, 11, 697. [Google Scholar] [CrossRef] [Green Version]
- Michot, V.; Vila, D.; Arvor, D.; Corpetti, T.; Ronchail, J.; Funatsu, B.M.; Dubreuil, V. Performance of TRMM TMPA 3B42 V7 in replicating daily rainfall and regional rainfall regimes in the Amazon basin (1998–2013). Remote Sens. 2018, 10, 1879. [Google Scholar] [CrossRef] [Green Version]
- Pombo, S.; de Oliveira, R.P. Evaluation of extreme precipitation estimates from TRMM in Angola. J. Hydrol. 2015, 523, 663–679. [Google Scholar] [CrossRef]
- Mahbod, M.; Shirvani, A.; Veronesi, F. A comparative analysis of the precipitation extremes obtained from tropical rainfall-measuring mission satellite and rain gauges datasets over a semiarid region. Int. J. Climatol. 2019, 39, 495–515. [Google Scholar] [CrossRef]
- Rhee, J.; Im, J.; Carbone, G.J. Monitoring agricultural drought for arid and humid regions using multi-sensor remote sensing data. Remote Sens. Environ. 2010, 114, 2875–2887. [Google Scholar] [CrossRef]
- Guttman, N.B. Accepting the standardized precipitation index: A calculation algorithm 1. JAWRA J. Am. Water Resour. Assoc. 1999, 35, 311–322. [Google Scholar] [CrossRef]
- Belayneh, A.; Adamowski, J.; Khalil, B.; Ozga-Zielinski, B. Long-term SPI drought forecasting in the Awash River Basin in Ethiopia using wavelet neural network and wavelet support vector regression models. J. Hydrol. 2014, 508, 418–429. [Google Scholar] [CrossRef]
- Edwards, D.C. Characteristics of 20th Century Drought in the United States at Multiple Time Scales; Air Force Institute of Technology: Wright-Patterson AFB, OH, USA, 1997. [Google Scholar]
- Sharma, A. Seasonal to interannual rainfall probabilistic forecasts for improved water supply management: Part 1—A strategy for system predictor identification. J. Hydrol. 2000, 239, 232–239. [Google Scholar] [CrossRef]
- Hou, A.Y.; Kakar, R.K.; Neeck, S.; Azarbarzin, A.A.; Kummerow, C.D.; Kojima, M.; Oki, R.; Nakamura, K.; Iguchi, T. The global precipitation measurement mission. Bull. Am. Meteorol. Soc. 2014, 95, 701–722. [Google Scholar] [CrossRef]
- Kenabatho, P.; Parida, B.; Moalafhi, D. Evaluation of satellite and simulated rainfall products for hydrological applications in the Notwane Catchment, Botswana. Phys. Chem. Earth Parts A/B/C 2017, 100, 19–30. [Google Scholar] [CrossRef]
- Haberlandt, U. Geostatistical interpolation of hourly precipitation from rain gauges and radar for a large-scale extreme rainfall event. J. Hydrol. 2007, 332, 144–157. [Google Scholar] [CrossRef]
- Teegavarapu, R.S.; Meskele, T.; Pathak, C.S. Geo-spatial grid-based transformations of precipitation estimates using spatial interpolation methods. Comput. Geosci. 2012, 40, 28–39. [Google Scholar] [CrossRef]
- Vallejo-Bernal, S.M.; Urrea, V.; Bedoya-Soto, J.M.; Posada, D.; Olarte, A.; Cárdenas-Posso, Y.; Ruiz-Murcia, F.; Martínez, M.T.; Petersen, W.A.; Huffman, G.J. Ground validation of TRMM 3B43 V7 precipitation estimates over Colombia. Part I: Monthly and seasonal timescales. Int. J. Climatol. 2021, 41, 601–624. [Google Scholar] [CrossRef]
- Yong, B.; Ren, L.L.; Hong, Y.; Wang, J.H.; Gourley, J.J.; Jiang, S.H.; Chen, X.; Wang, W. Hydrologic evaluation of Multisatellite Precipitation Analysis standard precipitation products in basins beyond its inclined latitude band: A case study in Laohahe basin, China. Water Resour. Res. 2010, 46. [Google Scholar] [CrossRef] [Green Version]
- Chen, S.; Hong, Y.; Cao, Q.; Gourley, J.J.; Kirstetter, P.E.; Yong, B.; Tian, Y.; Zhang, Z.; Shen, Y.; Hu, J. Similarity and difference of the two successive V6 and V7 TRMM multisatellite precipitation analysis performance over China. J. Geophys. Res. Atmos. 2013, 118, 13060–13074. [Google Scholar] [CrossRef]
- Maggioni, V.; Meyers, P.C.; Robinson, M.D. A review of merged high-resolution satellite precipitation product accuracy during the Tropical Rainfall Measuring Mission (TRMM) era. J. Hydrometeorol. 2016, 17, 1101–1117. [Google Scholar] [CrossRef]
- Cashion, J.; Lakshmi, V.; Bosch, D.; Jackson, T.J. Microwave remote sensing of soil moisture: Evaluation of the TRMM microwave imager (TMI) satellite for the Little River Watershed Tifton, Georgia. J. Hydrol. 2005, 307, 242–253. [Google Scholar] [CrossRef]
- Wang, J.; Wolff, D.B. Evaluation of TRMM ground-validation radar-rain errors using rain gauge measurements. J. Appl. Meteorol. Climatol. 2010, 49, 310–324. [Google Scholar] [CrossRef] [Green Version]
- Cao, Y.; Zhang, W.; Wang, W. Evaluation of TRMM 3B43 data over the Yangtze River Delta of China. Sci. Rep. 2018, 8, 5290. [Google Scholar] [CrossRef] [Green Version]
- Li, R.; Shi, J.; Ji, D.; Zhao, T.; Plermkamon, V.; Moukomla, S.; Kuntiyawichai, K.; Kruasilp, J. Evaluation and Hydrological Application of TRMM and GPM Precipitation Products in a Tropical Monsoon Basin of Thailand. Water 2019, 11, 818. [Google Scholar] [CrossRef] [Green Version]
- Kolios, S.; Kalimeris, A. Evaluation of the TRMM rainfall product accuracy over the central Mediterranean during a 20-year period (1998–2017). Theor. Appl. Climatol. 2020, 139, 785–799. [Google Scholar] [CrossRef]
- Adeyewa, Z.D.; Nakamura, K. Validation of TRMM radar rainfall data over major climatic regions in Africa. J. Appl. Meteorol. 2003, 42, 331–347. [Google Scholar] [CrossRef]
Figure 1.
Distribution of annual average precipitation (GPM/IMERG) over the study areas in the year 2017: (a) Gilan (humid and rainy), (b) North-Khorasan (semi-arid and low rainfall), (c) Sistan-Baluchestan (arid and low rainfall).
Figure 1.
Distribution of annual average precipitation (GPM/IMERG) over the study areas in the year 2017: (a) Gilan (humid and rainy), (b) North-Khorasan (semi-arid and low rainfall), (c) Sistan-Baluchestan (arid and low rainfall).
Figure 2.
Annual average of environmental characteristics and elevation in the study areas.
Figure 2.
Annual average of environmental characteristics and elevation in the study areas.
Figure 3.
Comparison of station (pink dots) precipitation in 2017 with IMERG, TMPA, and interpolated value using IDW interpolation method, (a) humid and rainy, (b) semi-arid, and (c) arid climate; horizontal axes are months.
Figure 3.
Comparison of station (pink dots) precipitation in 2017 with IMERG, TMPA, and interpolated value using IDW interpolation method, (a) humid and rainy, (b) semi-arid, and (c) arid climate; horizontal axes are months.
Figure 4.
Comparison of monthly average precipitation between stations and satellite data for (
a,
b) Rasht (humid and rainy) (
c,
d) Bojnoord (semi-arid), and (
e,
f) Zahedan (arid). Red and black dashed lines show the trend line, and x = y line, respectively. The stations used here are marked by red points in
Figure 1.
Figure 5.
Comparison of monthly precipitation change graphs of ground-station measurement, IMERGV6, TMPAV7, and corrected data (using CF) from 2001 to 2005 for Bojnoord in semi-arid and low rainfall conditions. (a) IMERG, (b) TMPA.
Figure 5.
Comparison of monthly precipitation change graphs of ground-station measurement, IMERGV6, TMPAV7, and corrected data (using CF) from 2001 to 2005 for Bojnoord in semi-arid and low rainfall conditions. (a) IMERG, (b) TMPA.
Figure 6.
Precipitation correction coefficient for Gilan. The legend is shown when satellite and station have an equal amount. The image is tilted to create a 3D perspective.
Figure 6.
Precipitation correction coefficient for Gilan. The legend is shown when satellite and station have an equal amount. The image is tilted to create a 3D perspective.
Figure 7.
Precipitation correction coefficient for North Khorasan. The legend is shown when satellite and station have an equal amount. The image is tilted to create a 3D perspective.
Figure 7.
Precipitation correction coefficient for North Khorasan. The legend is shown when satellite and station have an equal amount. The image is tilted to create a 3D perspective.
Figure 8.
Precipitation correction coefficient for Sistan-Baluchestan. The legend is shown when satellite and station have an equal amount. The image is tilted to create a 3D perspective.
Figure 8.
Precipitation correction coefficient for Sistan-Baluchestan. The legend is shown when satellite and station have an equal amount. The image is tilted to create a 3D perspective.
Figure 9.
Comparison of average performance of satellite product in wet, normal, and drought periods of (a) humid and rainy, (b) semi-arid, and (c) arid climate.
Figure 9.
Comparison of average performance of satellite product in wet, normal, and drought periods of (a) humid and rainy, (b) semi-arid, and (c) arid climate.
Figure 10.
Average seasonal performance of IMERG and TMPA data and their standard errors.
Figure 10.
Average seasonal performance of IMERG and TMPA data and their standard errors.
Figure 11.
Comparison of the observed and predicted correction factors of GPM/IMERG and TRMM/TMPA.
Figure 11.
Comparison of the observed and predicted correction factors of GPM/IMERG and TRMM/TMPA.
Table 1.
Characteristics of synoptic ground stations in study areas from 1998 to 2017 (collected from Meteorology Organization of Iran,
https://data.irimo.ir (accessed on 23 January 2020)). Blue rows are in the rainy region, gray and yellow rows are in the semi-arid and arid regions, respectively. Perc = precipitation, Tm = temperature, rHum = relative humidity, SH = sunny hours.
| Station | Lat. | Lon. | Alt. | Perc.
Max | Perc.
Mean | Perc.
Std | Tm.
Min | Tm.
Max | Tm.
Mean | Tm.
Std | rHum.
Min | rHum.
Mean | rHum.
Std | SH. Max | SH.
Mean | SH.
Std |
|---|
| Astara | 38.36 | 48.85 | 18 | 264.00 | 3.00 | 9.90 | −5.20 | 34.20 | 15.50 | 7.90 | 7.00 | 80.92 | 9.85 | 13.50 | 5.08 | 4.37 |
| Anzali | 37.48 | 49.46 | −24 | 195.80 | 4.80 | 14.00 | −7.00 | 37.00 | 16.30 | 7.40 | 3.00 | 83.46 | 8.58 | 14.00 | 5.01 | 4.36 |
| Talesh | 37.84 | 48.89 | 7 | 234.80 | 4.39 | 9.70 | −6.00 | 37.00 | 16.94 | 7.89 | 9.00 | 77.29 | 11.72 | 12.60 | 4.28 | 4.02 |
| Jirnadeh | 36.71 | 49.80 | 1581 | 38.80 | 0.84 | 2.96 | −13.80 | 37.60 | 12.35 | 8.56 | 4.00 | 59.29 | 20.19 | 13.00 | 7.40 | 3.86 |
| Deylaman | 36.89 | 49.94 | 1448 | 48.60 | 1.04 | 3.39 | −18.20 | 39.50 | 12.26 | 7.90 | 5.00 | 63.58 | 19.99 | 14.20 | 5.76 | 3.96 |
| Rasht (Airport) | 37.32 | 49.62 | −9 | 170.40 | 3.56 | 10.33 | −19.00 | 40.00 | 16.25 | 7.61 | 2.00 | 81.94 | 11.05 | 13.60 | 4.63 | 4.19 |
| Rasht (Agri.) | 37.2 | 49.64 | 25 | 134.70 | 3.43 | 9.87 | −13.60 | 38.70 | 16.65 | 7.88 | 8.00 | 82.24 | 11.71 | 13.70 | 4.83 | 4.20 |
| Rood Bar | 36.81 | 49.52 | 0 | 22.70 | 0.67 | 2.24 | −4.70 | 43.10 | 19.19 | 7.96 | 11.00 | 63.34 | 12.92 | 14.20 | 4.60 | 4.08 |
| Rood Sar | 37.13 | 50.32 | −22 | 178.00 | 3.51 | 11.56 | −8.00 | 36.60 | 17.42 | 7.74 | 7.00 | 79.04 | 9.78 | 12.80 | 5.02 | 4.13 |
| KiaShahr | 37.39 | 49.89 | −22 | 113.00 | 3.62 | 10.69 | −7.00 | 38.00 | 17.62 | 7.77 | 16.00 | 79.58 | 10.87 | 13.20 | 4.74 | 4.06 |
| Lahijan | 37.19 | 50.02 | 34 | 264.00 | 3.95 | 11.54 | −5.60 | 37.90 | 17.42 | 7.75 | 3.00 | 77.82 | 12.13 | 12.50 | 5.00 | 4.18 |
| Masooleh | 37.15 | 48.99 | 1081 | 64.50 | 2.58 | 5.64 | −11.40 | 39.10 | 12.24 | 7.55 | 9.00 | 77.71 | 19.83 | 12.70 | 3.90 | 3.65 |
| Manjil | 36.73 | 49.41 | 338 | 42.50 | 0.58 | 2.37 | −6.80 | 47.80 | 17.25 | 8.14 | 2.00 | 60.73 | 12.71 | 13.00 | 7.57 | 3.68 |
| Mean | 37.25 | 49.57 | 342.69 | 136.29 | 2.77 | 8.01 | −9.72 | 38.96 | 15.95 | 7.85 | 6.62 | 74.38 | 13.18 | 13.31 | 5.22 | 4.06 |
| StdDev | 0.46 | 0.45 | 602.51 | 88.20 | 1.49 | 4.09 | 4.96 | 3.37 | 2.26 | 0.29 | 4.07 | 9.02 | 4.07 | 0.60 | 1.10 | 0.22 |
| Esferain | 37.05 | 57.49 | 1203 | 49.90 | 0.52 | 2.34 | −17.60 | 42.30 | 16.34 | 10.41 | 2.00 | 43.50 | 18.29 | 13.60 | 8.36 | 3.78 |
| Bojnoord | 37.48 | 57.27 | 1100 | 37.40 | 0.67 | 2.45 | −21.00 | 40.60 | 13.23 | 9.39 | 2.00 | 59.57 | 18.32 | 14.80 | 7.82 | 3.94 |
| Jajrom | 36.96 | 56.33 | 969 | 30.60 | 0.35 | 1.88 | −16.30 | 42.00 | 16.68 | 10.34 | 2.00 | 44.85 | 16.84 | 13.50 | 8.47 | 3.51 |
| Raz | 37.94 | 57.10 | 1278 | 25.40 | 0.82 | 2.72 | −17.30 | 38.30 | 13.74 | 9.20 | 10.00 | 53.70 | 20.86 | 13.1 | 8.32 | 3.48 |
| Shirvan | 37.43 | 57.84 | 1051 | 29.80 | 0.58 | 2.38 | −16.70 | 40.10 | 13.24 | 9.61 | 7.00 | 58.82 | 20.87 | 13.30 | 8.42 | 3.52 |
| Farooj | 37.22 | 58.23 | 1196 | 28.00 | 0.68 | 2.66 | −15.10 | 38.90 | 12.94 | 9.33 | 7.00 | 56.60 | 20.47 | 13.34 | 8.25 | 3.36 |
| Ashkhaneh | 37.57 | 56.95 | 762 | 31.20 | 0.78 | 2.64 | −18.40 | 43.80 | 16.88 | 9.75 | 4.00 | 52.56 | 19.89 | 13.00 | 7.95 | 4.74 |
| Mean | 37.38 | 57.32 | 1079.9 | 33.19 | 0.63 | 2.44 | −17.49 | 40.86 | 14.72 | 9.72 | 4.86 | 52.80 | 19.36 | 13.52 | 8.23 | 3.76 |
| StdDev | 0.33 | 0.62 | 174.39 | 8.23 | 0.16 | 0.29 | 1.87 | 1.96 | 1.81 | 0.48 | 3.18 | 6.42 | 1.56 | 0.60 | 0.25 | 0.47 |
| Chabahar | 25.28 | 60.62 | 8 | 130.10 | 0.29 | 3.73 | 7.90 | 42.60 | 26.62 | 3.71 | 1.00 | 73.76 | 14.53 | 12.20 | 9.19 | 2.27 |
| IranShahr | 27.20 | 60.70 | 591 | 56.50 | 0.27 | 2.12 | −2.20 | 49.30 | 27.42 | 8.68 | 1.00 | 26.95 | 15.45 | 12.20 | 9.39 | 2.20 |
| Khash | 28.22 | 61.20 | 1394 | 99.00 | 0.42 | 3.20 | −10.00 | 43.40 | 21.34 | 8.51 | 0.00 | 27.70 | 16.54 | 13.30 | 9.49 | 2.48 |
| Rask | 26.23 | 61.40 | 406 | 56.00 | 0.35 | 2.66 | 2.70 | 51.70 | 30.77 | 6.49 | 1.00 | 32.84 | 17.88 | 12.10 | 8.93 | 2.25 |
| Zabul | 31.03 | 61.48 | 489 | 28.60 | 0.14 | 1.11 | −11.80 | 49.60 | 22.64 | 10.05 | 1.00 | 34.21 | 16.34 | 13.00 | 8.96 | 2.95 |
| Zahedan | 29.47 | 60.88 | 1370 | 53.80 | 0.20 | 1.59 | −13.00 | 43.40 | 19.53 | 8.70 | 13.00 | 19.53 | 16.77 | 13.20 | 9.34 | 2.70 |
| Zahak | 30.90 | 61.68 | 495 | 70.00 | 0.13 | 1.28 | −10.00 | 49.00 | 24.97 | 10.05 | 4.80 | 27.38 | 15.09 | 13.40 | 9.27 | 2.90 |
| Saravan | 27.33 | 62.33 | 1195 | 79.70 | 0.28 | 2.25 | −6.00 | 45.40 | 22.81 | 8.35 | 1.00 | 27.14 | 15.50 | 13.10 | 9.53 | 2.26 |
| Konark (Airport) | 25.44 | 60.38 | 528 | 147.00 | 0.28 | 3.42 | 3.80 | 49.00 | 27.29 | 4.94 | 1.00 | 62.20 | 13.15 | 12.70 | 8.76 | 2.19 |
| MirJave | 29.02 | 61.43 | 836 | 25.80 | 0.11 | 1.02 | −8.10 | 47.40 | 26.59 | 9.68 | 1.00 | 18.13 | 14.45 | 13.00 | 9.30 | 2.54 |
| NosratAbad | 29.85 | 59.98 | 1127 | 42.00 | 0.20 | 1.67 | −6.90 | 45.50 | 24.69 | 9.52 | 1.00 | 20.26 | 13.94 | 13.20 | 9.49 | 2.57 |
| NikShahr | 26.23 | 60.20 | 510 | 110.70 | 0.48 | 3.95 | 2.80 | 50.80 | 29.59 | 7.02 | 1.00 | 31.33 | 16.40 | 12.70 | 9.61 | 2.08 |
| Mean | 28.02 | 61.02 | 745.75 | 74.93 | 0.26 | 2.33 | −4.23 | 47.26 | 25.36 | 7.98 | 2.23 | 26.55 | 15.50 | 12.84 | 9.27 | 2.45 |
| StdDev | 2.04 | 0.68 | 434.92 | 39.23 | 0.11 | 1.04 | 7.00 | 3.10 | 3.34 | 2.04 | 3.58 | 5.61 | 1.35 | 0.46 | 0.27 | 0.29 |
Table 2.
Classes of drought and wet conditions based on SPI [
18].
Table 2.
Classes of drought and wet conditions based on SPI [
18].
| Period | SPI |
|---|
| Extremely wet | ≥+2.0 |
| Very wet | +1.5 to +1.99 |
| Moderately wet | +1.0 to +1.49 |
| Normal | +0.99 to −0.99 |
| Moderately dry | −1.0 to −1.49 |
| Very dry | −1.5 to −1.99 |
| Extremely dry | ≤−2.0 |
Table 3.
R-squared and correction factors of IMERG and TMPA in ground stations.
Table 3.
R-squared and correction factors of IMERG and TMPA in ground stations.
| Station | R2IMERG | R2TMPA | CFIMERG | CFTMPA |
|---|
| Astara | 0.74 | 0.73 | 1.27 | 1.29 |
| Anzali | 0.76 | 0.76 | 1.29 | 1.20 |
| Talesh | 0.59 | 0.46 | 0.96 | 1.01 |
| Deylaman | 0.54 | 0.53 | 0.38 | 0.48 |
| Rasht (Airport) | 0.86 | 0.83 | 0.95 | 0.79 |
| Rasht (Agri.) | 0.83 | 0.77 | 0.99 | 0.94 |
| Rood Bar | 0.25 | 0.30 | 0.36 | 0.40 |
| Rood Sar | 0.66 | 0.73 | 1.11 | 1.16 |
| Kiashahr | 0.72 | 0.68 | 0.99 | 0.86 |
| Lahijan | 0.77 | 0.76 | 1.21 | 1.20 |
| Masoole | 0.77 | 0.66 | 0.98 | 1.05 |
| Manjil | 0.50 | 0.57 | 0.29 | 0.39 |
| Average | 0.67 | 0.65 | 0.90 | 0.90 |
| StdDev | 0.17 | 0.16 | 0.36 | 0.32 |
| Esferain | 0.71 | 0.67 | 0.64 | 0.57 |
| Bojnoord | 0.74 | 0.72 | 0.65 | 0.57 |
| Jajrom | 0.54 | 0.45 | 0.47 | 0.51 |
| Raz | 0.68 | 0.67 | 0.71 | 0.85 |
| Shirvan | 0.84 | 0.75 | 0.59 | 0.56 |
| Farooj | 0.94 | 0.92 | 0.76 | 0.71 |
| Ashkhaneh | 0.76 | 0.71 | 0.94 | 0.78 |
| Average | 0.75 | 0.70 | 0.68 | 0.65 |
| StdDev | 0.12 | 0.14 | 0.15 | 0.13 |
| Khash | 0.74 | 0.59 | 0.60 | 0.60 |
| Rask | 0.88 | 0.78 | 0.71 | 0.66 |
| Zabul | 0.90 | 0.81 | 1.25 | 1.15 |
| Zahedan | 0.68 | 0.58 | 0.83 | 0.74 |
| Zahak | 0.85 | 0.15 | 0.43 | 0.05 |
| Saravan | 0.90 | 0.70 | 0.79 | 0.70 |
| Konarak (Airport) | 0.80 | 0.63 | 0.46 | 0.43 |
| MirJave | 0.77 | 0.83 | 0.73 | 0.86 |
| NosratAbad | 0.69 | 0.47 | 0.69 | 0.91 |
| NikShahr | 0.75 | 0.63 | 0.48 | 0.48 |
| Chabahar | 0.68 | 0.50 | 0.89 | 0.76 |
| IranShahr | 0.70 | 0.69 | 0.78 | 0.81 |
| Average | 0.78 | 0.61 | 0.72 | 0.68 |
| StdDev | 0.09 | 0.18 | 0.23 | 0.28 |
Table 4.
Results of a linear regression of the prediction accuracy of IMERG data based on station parameters.
Table 4.
Results of a linear regression of the prediction accuracy of IMERG data based on station parameters.
| Parameter of Stations | Coefficient | Std. Error | t | Sig. | VIF. |
|---|
| (Constant) | 1.343 | 0.239 | 5.609 | 0.000 | |
| Latitude | −0.031 | 0.008 | −3.822 | 0.001 | 1.698 |
| Altitude | 0.00024 | 0.000 | 3.170 | 0.004 | 1.851 |
| Precipitation Mean | 0.242 | 0.032 | 7.470 | 0.000 | 2.716 |
Table 5.
Results of a linear regression of the prediction accuracy of TMPA data based on station parameters.
Table 5.
Results of a linear regression of the prediction accuracy of TMPA data based on station parameters.
| Parameter of Stations | Coefficient | Std. Error | t | Sig. | VIF. |
|---|
| (Constant) | 1.322 | 0.256 | 5.156 | 0.000 | |
| Latitude | −0.031 | 0.009 | −3.644 | 0.001 | 1.698 |
| Altitude | 0.00026 | 0.000 | 3.249 | 0.003 | 1.851 |
| Precipitation Mean | 0.246 | 0.035 | 7.085 | 0.000 | 2.716 |
| Publisher’s Note: MDPI stays neutral with regard to jurisdictional claims in published maps and institutional affiliations. |
© 2021 by the authors. Licensee MDPI, Basel, Switzerland. This article is an open access article distributed under the terms and conditions of the Creative Commons Attribution (CC BY) license (https://creativecommons.org/licenses/by/4.0/).
