1. Introduction
The forest system, which occupied almost one third of the total land area, provides a variety of critical ecological services such as natural habitat, water conservation, timber products and maintaining biodiversity [
1]. It also plays a central role in global carbon circle and energy balance [
2,
3]. However, the areas of global forests sharply declined at a rate of roughly 10 million hectares per year [
4]. Wildfire is the principal threat in terrestrial ecosystems, and many evidences have proved that recent global warming and precipitation anomalies have made forests more susceptible to burning [
5,
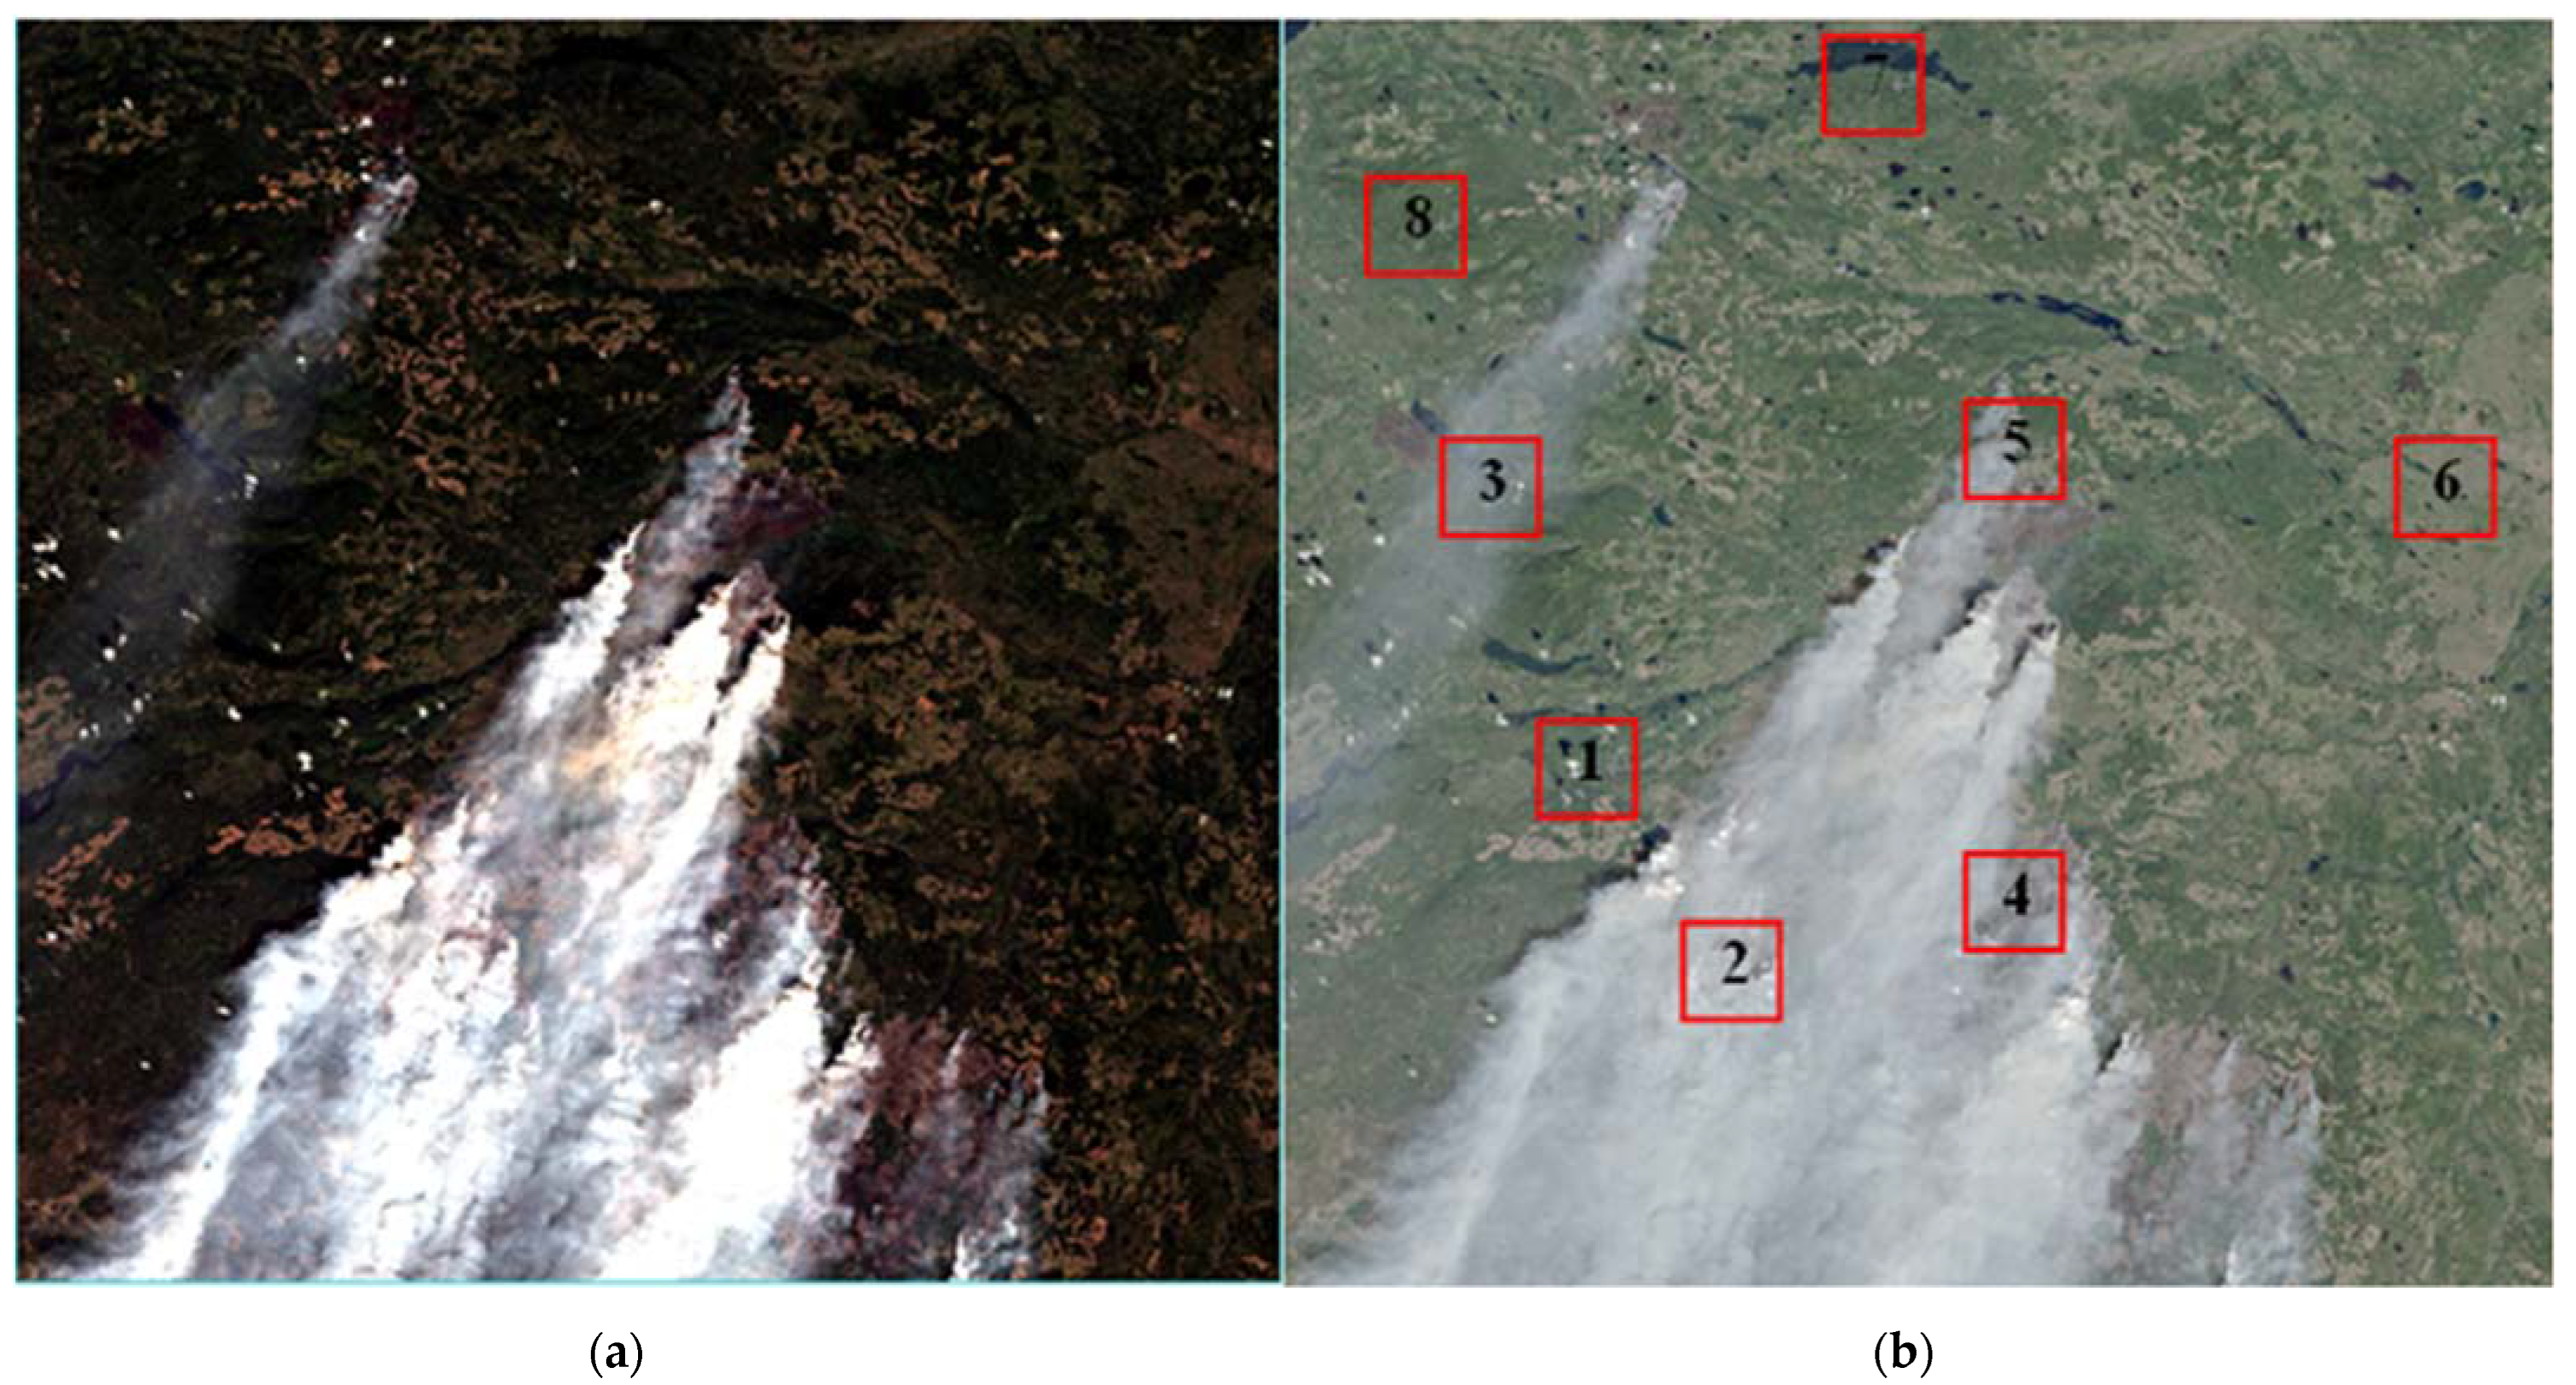
6]. In the period of 2019–2020, the Amazon and South Australia faced the most severe wildfires, and these events have caused wide public concerns because of their considerable ecological and socioeconomic consequences such as consuming generous quantities of tropical rainforest, emitting great volumes of greenhouse gas and aerosols and altering the composition of the atmosphere.
Because smoke appeared at the earliest phase in wildfires, earlier detection and rapid identification of initial wildfire smoke are crucial for wildfire suppression and management to avoid the damages and negative impacts of wildfires [
7]. Wildfire smoke is usually identified by means of manual observation, patrol of forest rangers, infrared and optical sensors of fire lookout towers and aviation monitoring. However, these techniques have shown ineffective, unsystematic, and geographical limit. Wildfires, caused by natural events (e.g., lightening and spontaneous combustion) or human-forcing activities, occurred in the remote regions, making it difficult and cost-consuming for accessibility and suppression. However, data from remote sensing satellites can provide continuous, frequent, and numerous systematic information with various spatial and temporal resolution at global scales, which may overcome several limitations of the conventional wildfire smoke observation methods [
8].
Currently, the widely used remote sensing monitoring algorithms are mostly based on satellite remote sensing data of low and medium resolution (>250 m) [
9,
10], such as Advanced Very High Resolution Radiometer (AVHRR) [
11,
12,
13], Moderate Resolution Imaging Spectroradiometer (MODIS) [
14,
15,
16], etc., which has become an important business method to detect wildfire smoke for daily wildfire disaster monitoring in many countries around the world. However, the satellites with lower spatial resolution are unable to capture relevant information effectively at the early stage of forest fires due to too small initial burning area, and thus would cause the detection of early fire spots to be missed. Therefore, high-resolution satellite data are urgently needed to improve the accuracy of fire detection. Landsat-8 data can be publicly obtained and the resolution has increased by an order of magnitude, reaching 30 m, compared with Suomi National Polar-orbiting Partnership (S-NPP) and Visible Infrared Imaging Radiometer Suite (VIIRS) [
17,
18,
19,
20]. In addition, Operational Land Imager (OLI) and Thermal Infrared Sensor (TIRS) mounted on Landsat-8 can provide a new data source and capability allowing as small as 1 m
2 active fire to be observed [
21]. Therefore, Landsat-8 data were used for wildfire smoke detection in this paper.
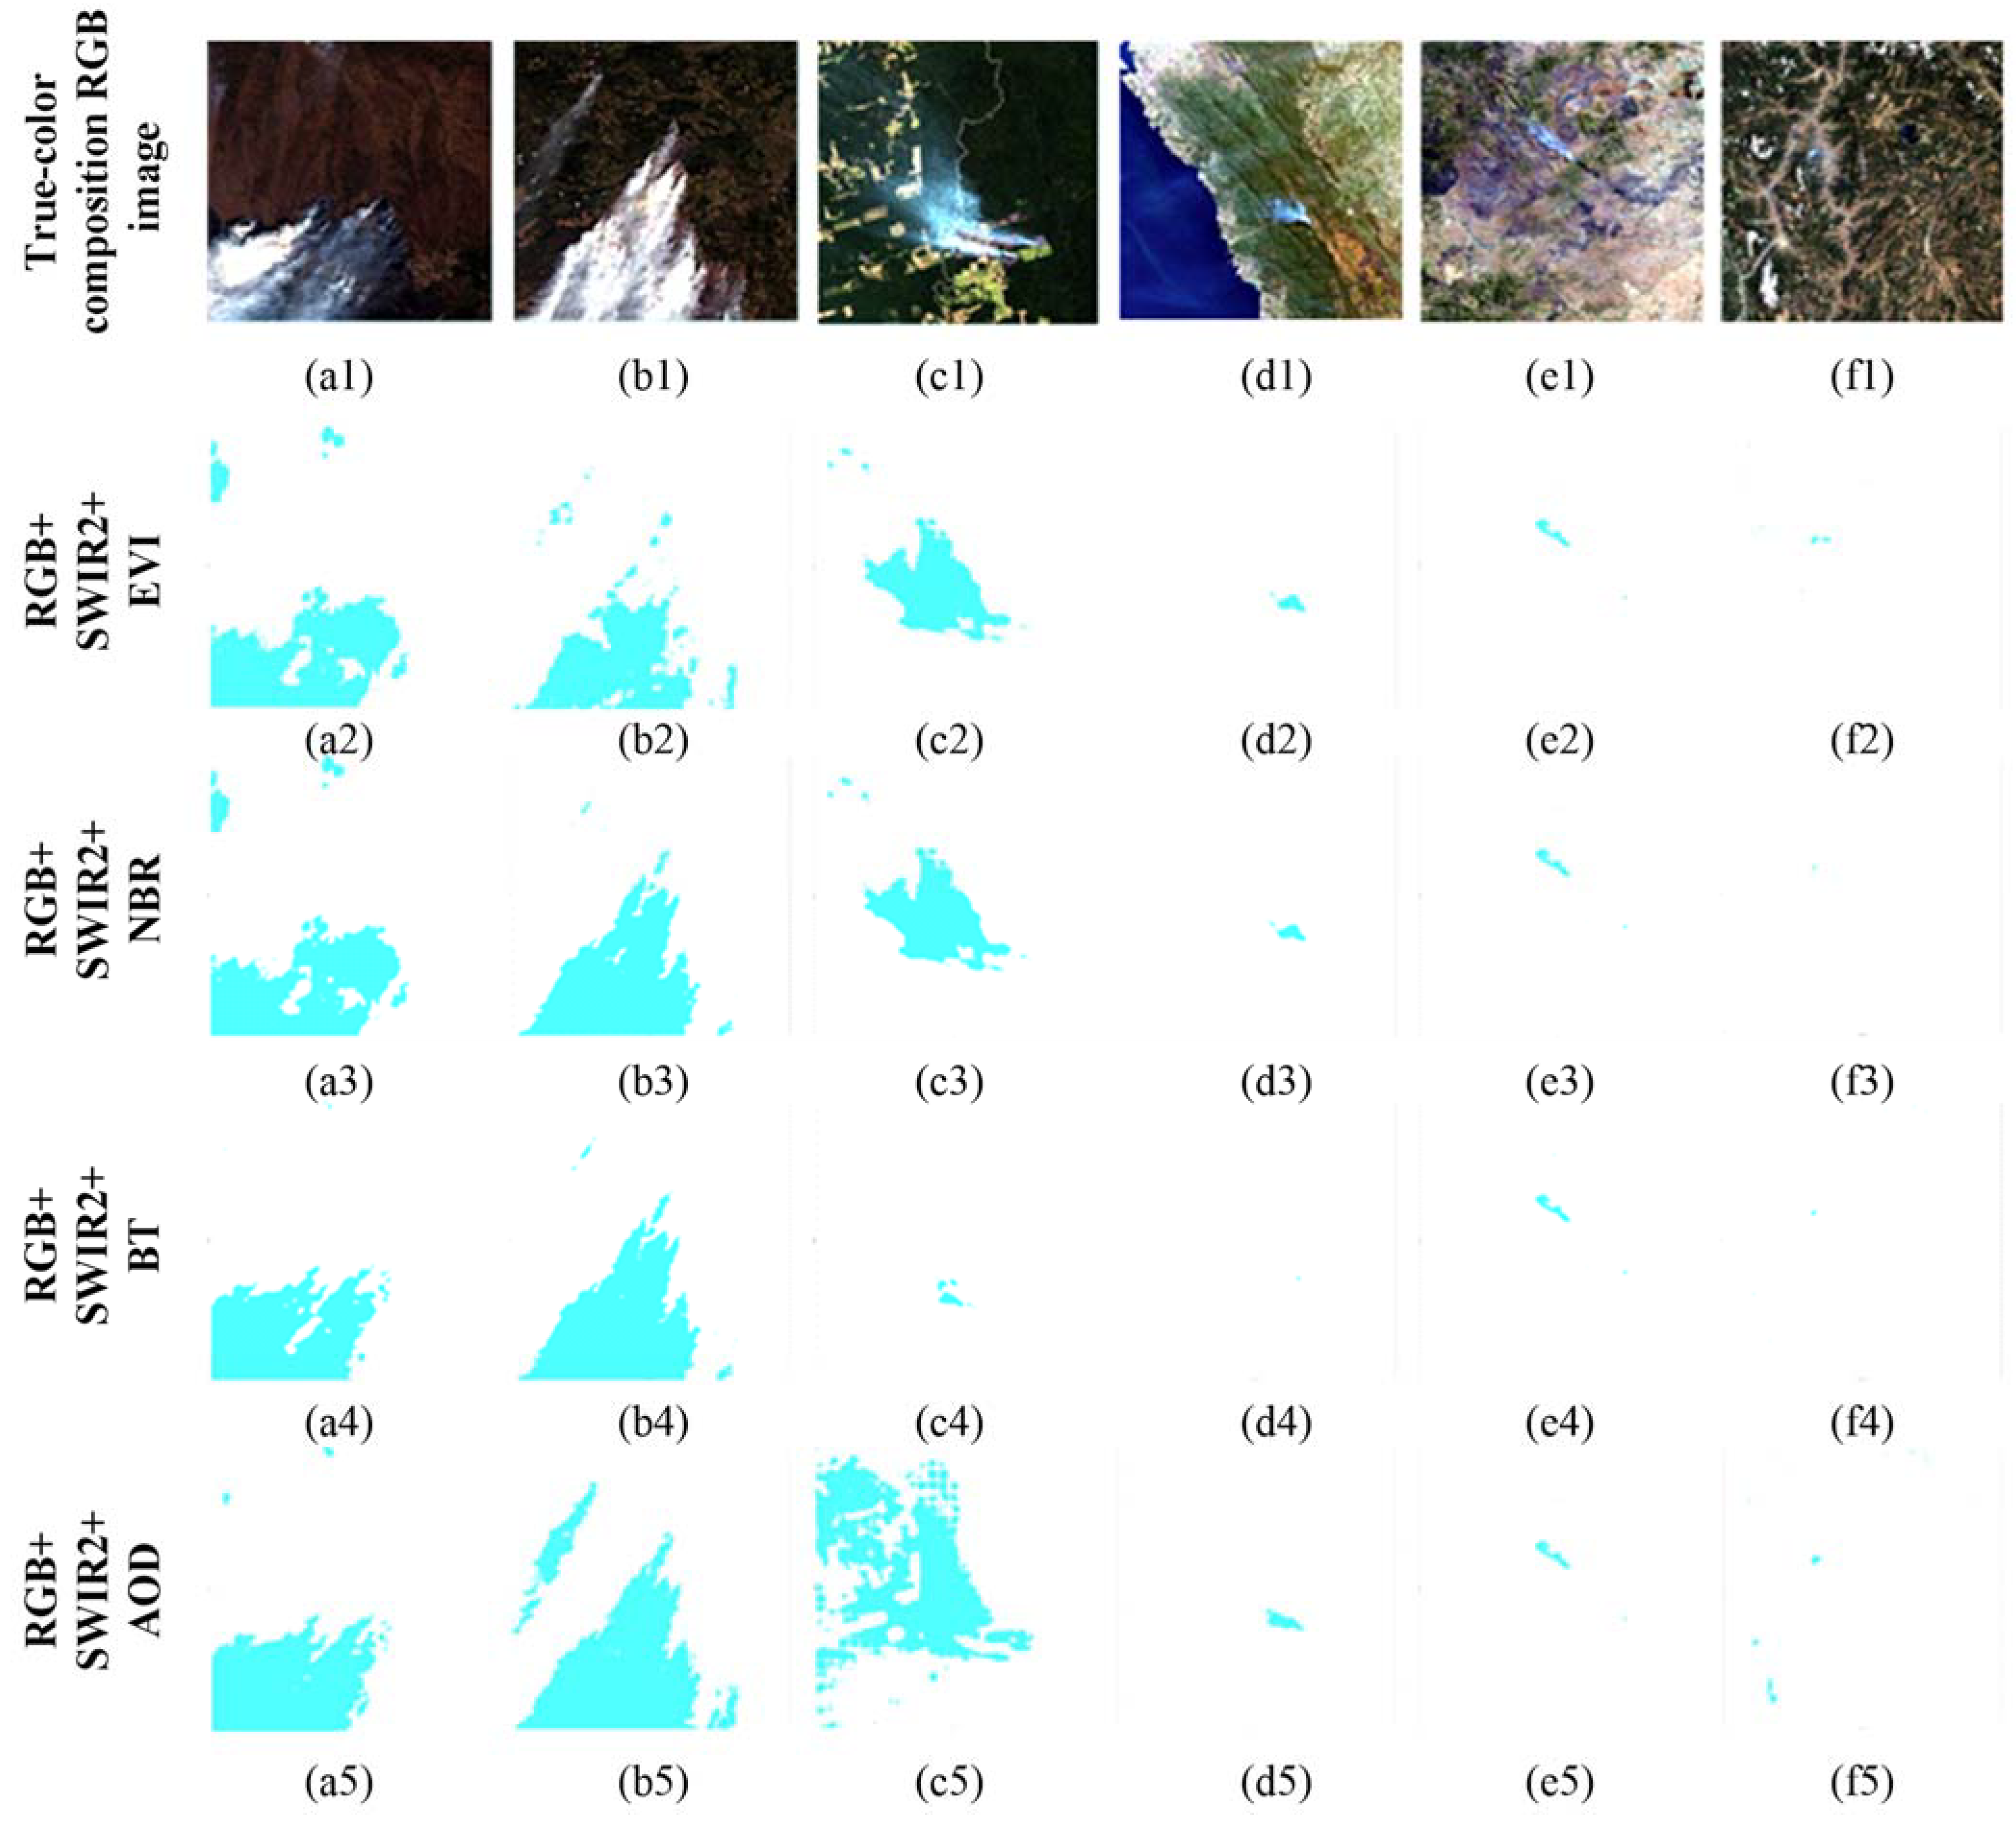
The satellite can carry many multispectral sensors and provide large amounts of multi-spectral data with more valuable information than RGB. Wildfire smoke presents different characteristics in different spectral ranges of remote sensing data and the choice of bands is crucial to smoke recognition. The wildfire smoke detection algorithms [
22,
23] of AVHRR mainly derived from band 3 (centered at 3.7 μm), band 4 (centered at 10.8μm) and band 5 (centered at 12 μm). The family of products [
24,
25] based on MODIS sensors primarily used two MIR bands (band 21 and band 22, centered at 3.96 μm) and TIR band 31 (centered at 11 μm). Data from band 4 (centered at 3.55~3.93 μm) and band 5 (centered at 10.5~12.4 μm) of VIIRS are used for tracking active fires [
26,
27,
28]. Nevertheless the Landsat-8 wildfire smoke detection algorithm was based on the reflectance of band 7 (SWIR, centered at 2.2 μm), that is sensitive to thermal abnormality [
29]. Therefore, the selection of the spectral range of remote sensing data is very important for smoke identification based on different spectral properties.
Due to the development of machine learning and data mining, several studies focused on the automatic retrieving smoke pixels. Li et al. [
30] facilitated a neural network algorithm using AVHRR data to search smoke plumes but it failed when smoke pervades in the downwind area. As a powerful and popular machine learning approach, Support Vector Machine (SVM) is widely used in remote sensing task. The SVM classifiers can take advantage of combination of texture, color and other features of the remote sensing scene, and successfully distinguish the pixels contained smoke from non-smoke pixels [
31,
32,
33]. Other machine learning techniques, such as K-means clustering, fisher linear classification [
34] and BPNN algorithm [
35], were used to discriminate smoke pixels. Nevertheless, it is still a challenge to extract smoke areas because of the wide range of shapes, color, texture, luminance and heterogeneous component of aerosol as well as diversity of cover types. In addition, with the development of remote sensing technology, a dramatically increasing satellites archive makes it no longer suitable for hand-crafted features of remote sensing data, and it is urgent to develop more automatic detection algorithms.
Deep learning, in the specific area of Convolutional Neural Networks (CNNs), is inspired by the working way of the human brain and recently has acquired many impressive achievements in many scientific fields such as image classification, object detection, and image segmentation. CNN can automatically extract features from data using a structure of multilayers. They are iteratively learning by forward propagation and backward derivation and updating parameters of kernels through complex nonlinear functions. The accuracies can be further improved by providing great amounts of input data, so it would be the best candidate for remote automated detection tasks. CNNs have successfully been employed in variety remote sensing fields such as road detection [
36], cloud detection [
37] and smoke classification [
38]. Recent Unet-based methods [
39] have also made good progress in the field of remote sensing [
40,
41]. However, remote sensing satellite data have many redundant bands so that too much information causes the wildfire smoke detection accuracy drop after the first rise and the detection efficiency decrease. How to reduce the interference of redundant information and make full use of the correlation of feature channels is a key problem on wildfire smoke detection based on remote sensing data.
The objective of this study was to propose a wildfire smoke detection algorithm of Landsat-8 satellite remote sensing imagery at the scene of a wildfire using multispectral data. First, a multispectral smoke dataset of Landsat-8 satellite at global scale, including the information from visible to TIRS1 infrared bands, was built in this paper. Second, a deep learning model, Smoke-Unet, based on Unet architecture incorporating with residual block [
42] and attention mechanism [
43], was proposed. Then, the performance of this algorithm on different region and various scale of wildfire smoke was evaluated by the experiments based on the abovementioned multispectral smoke dataset. Finally, to better extract the features of remote sensing smoke and reduce the redundancy of remote sensing data, the sensitivity of multiple bands was analyzed.
The main parts of this paper are structured as follows.
Section 2 introduces the establishment of a multispectral smoke dataset of Landsat-8 satellite at a global scale, and a proposed deep learning model, Smoke-Unet, based on the Unet architecture incorporating with Attention mechanism and residual block, is presented in
Section 3. To reduce the disturbance of the redundant information, the influence of different band combinations of multispectral data and remote sensing parameters on the accuracy of the algorithm are analyzed and the band sensitivity are evaluated in
Section 4, and the conclusion is made in
Section 5.
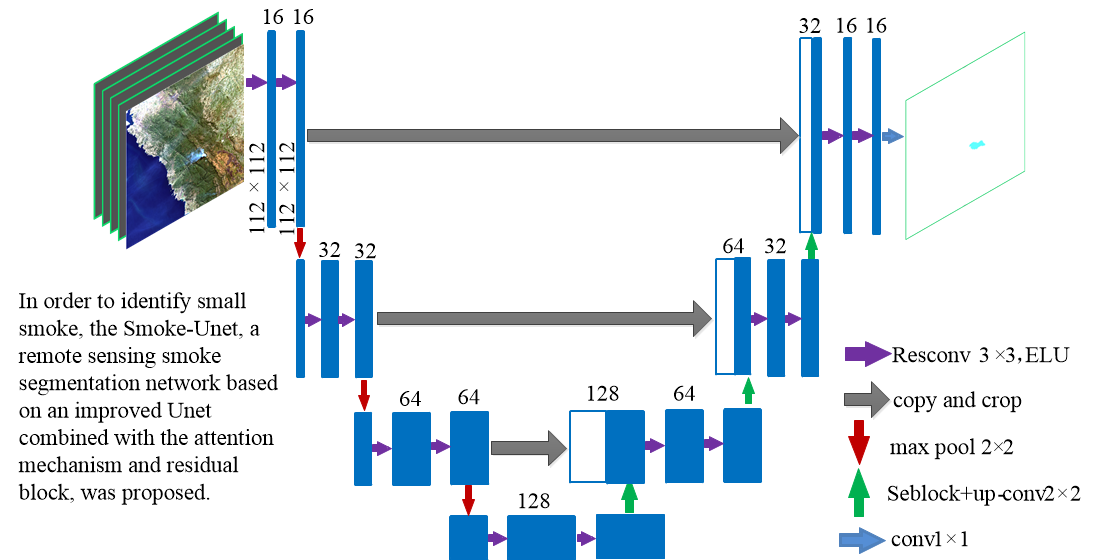
3. Methods
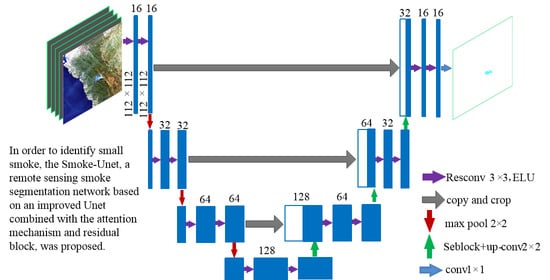
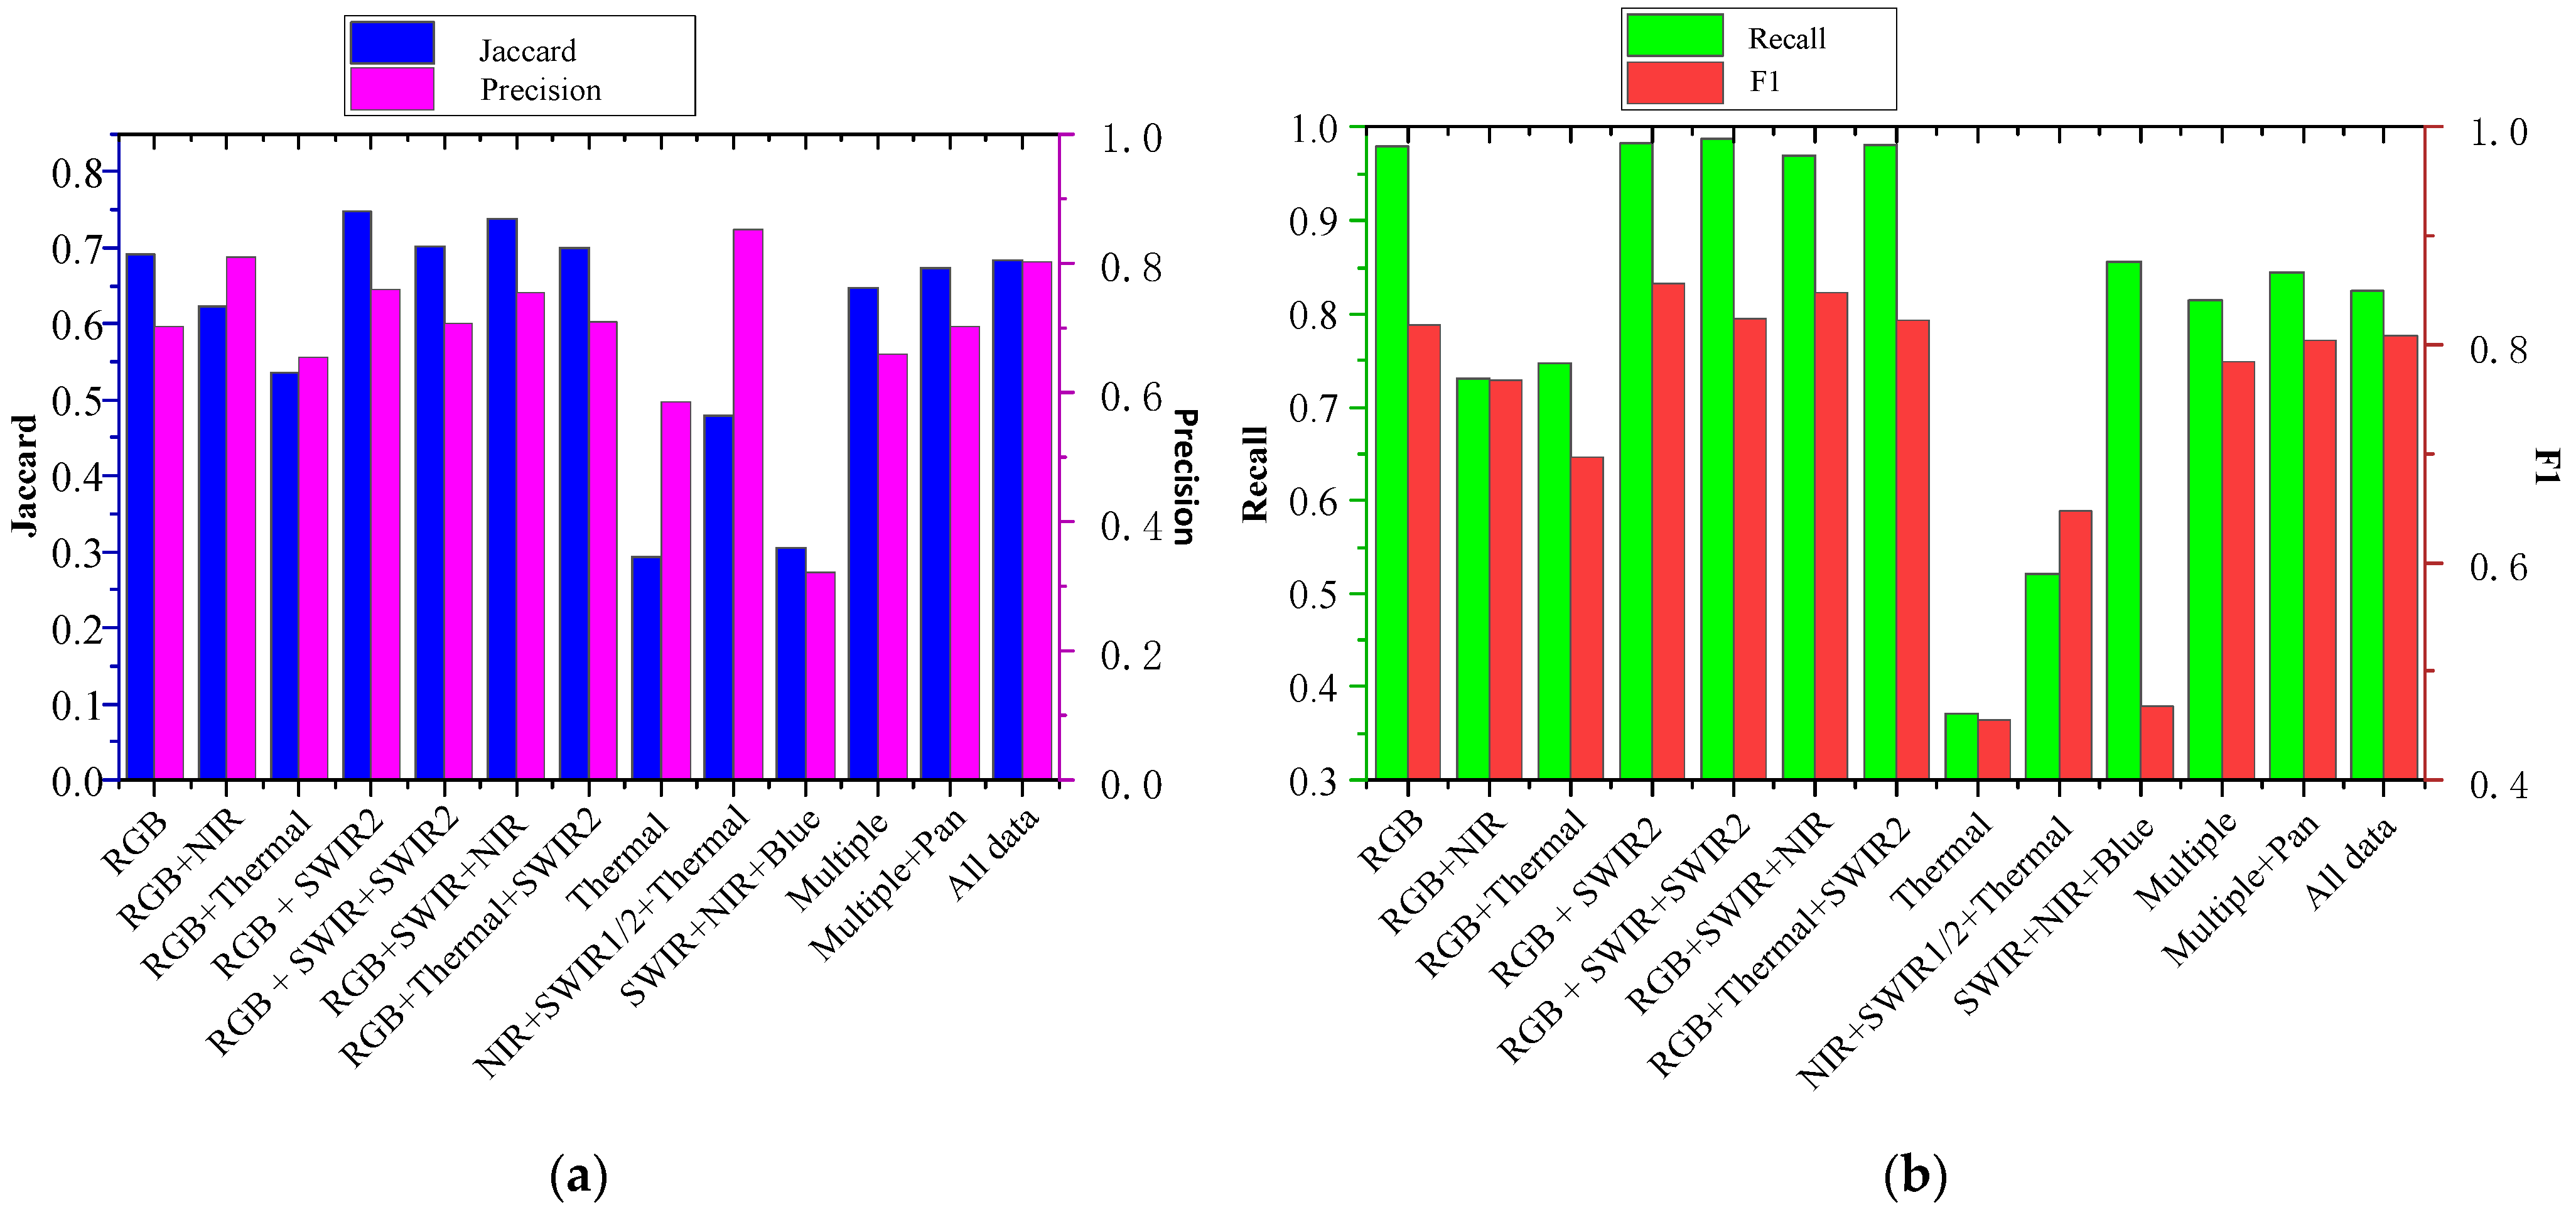
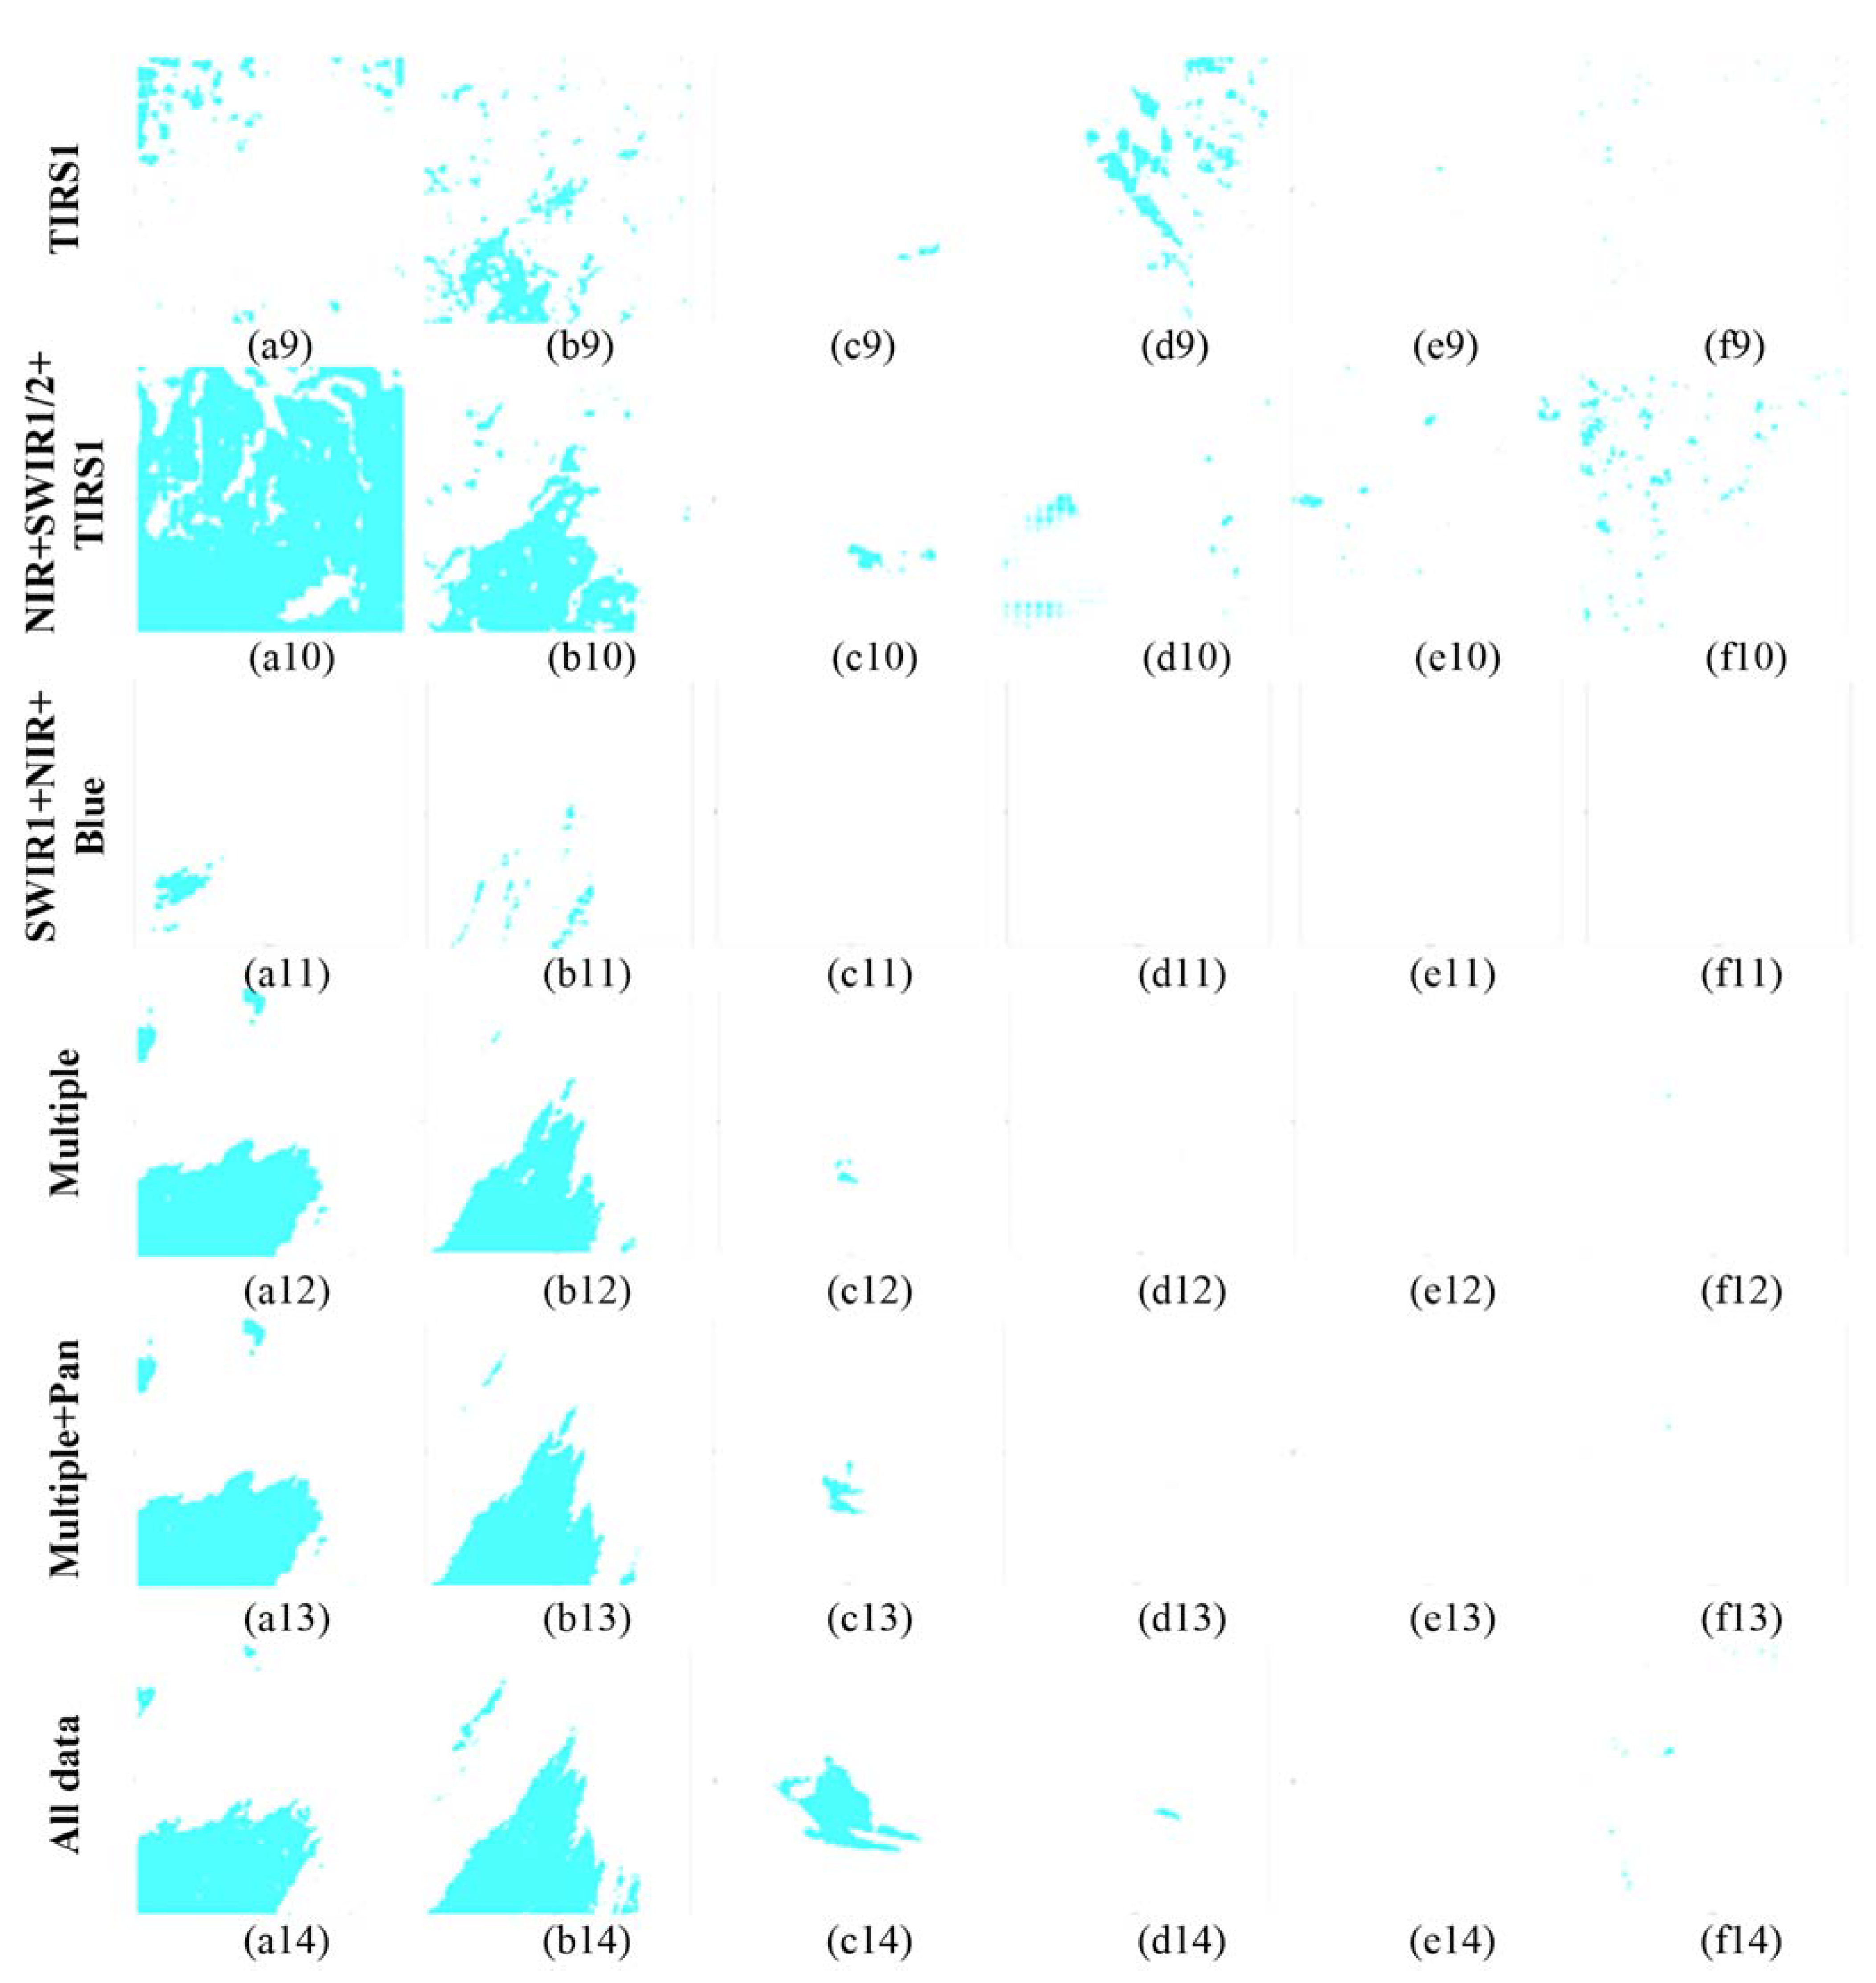
As a dense prediction problem, the task of smoke classification in satellite image is to make a prediction at each pixel. Based on the Unet network structure, Smoke-Unet, fused into residual blocks and attention model, was put forward to segment smoke in satellite images in this paper.
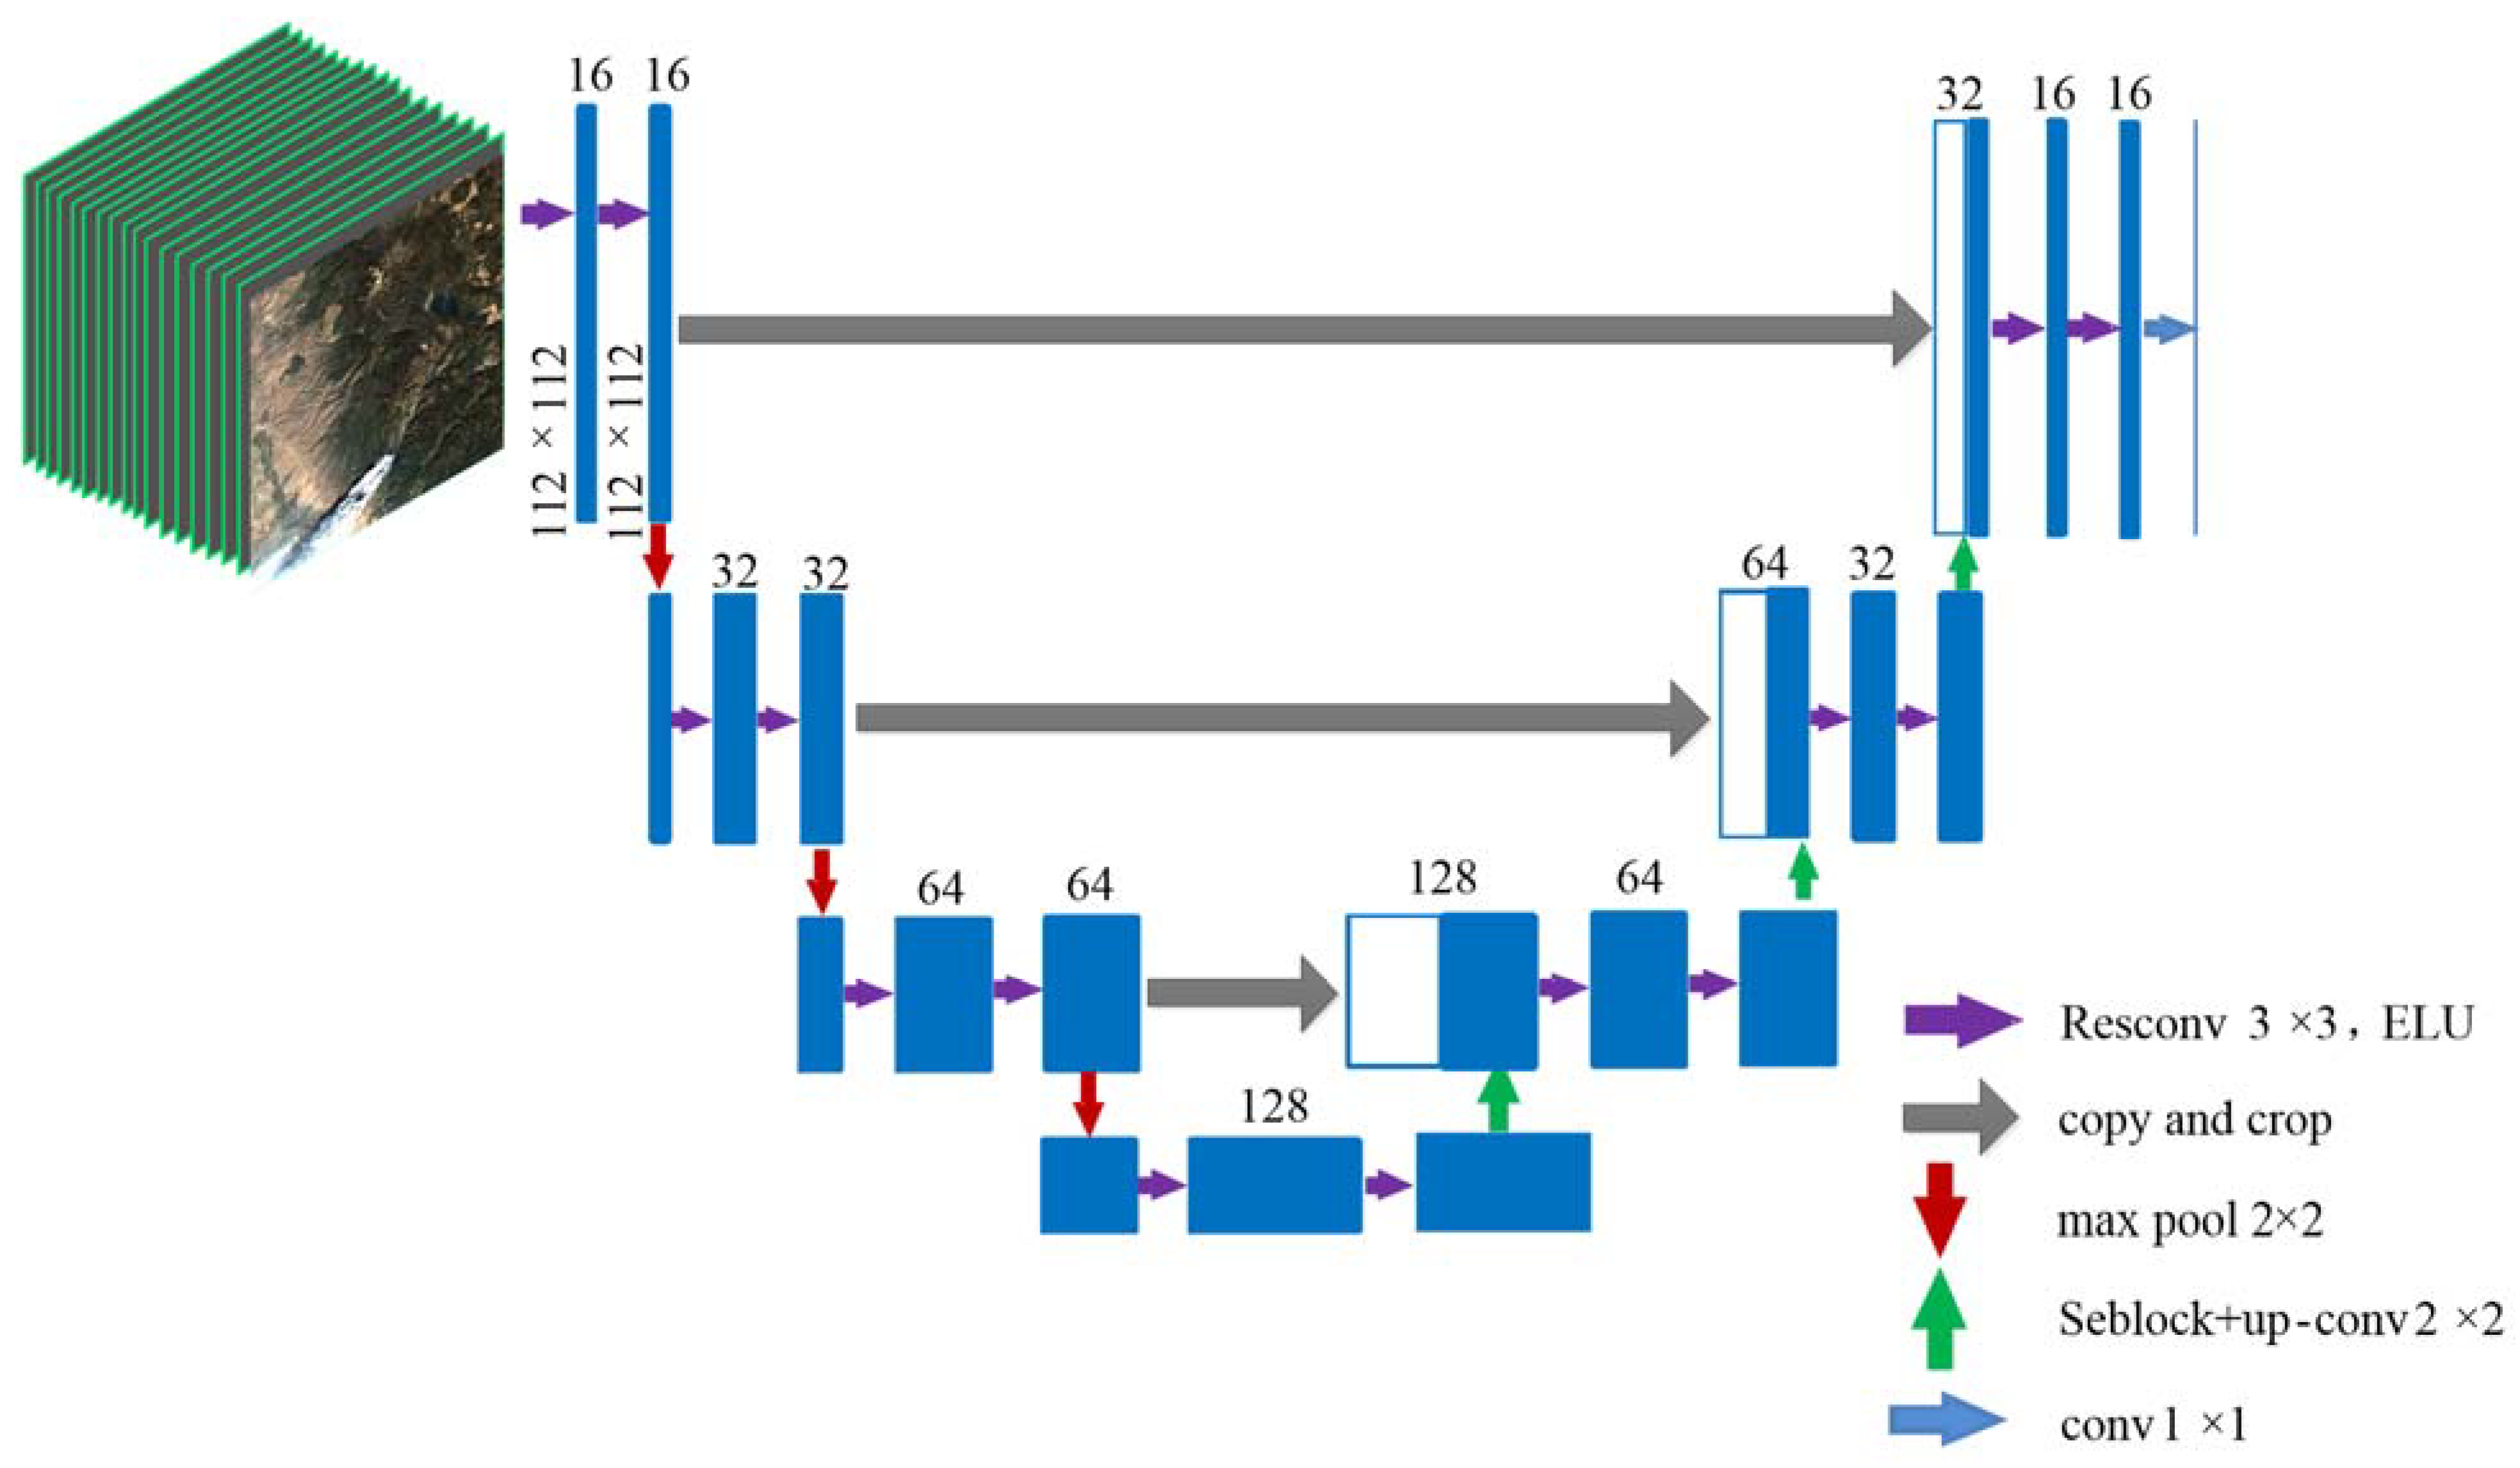
As seen in
Figure 6, Smoke-Unet consists of a contraction path on the left side and an expansive path on the right side. The contracting path follows the typical architecture of a convolutional network. It consists of the repeated application of two 3 × 3 convolutions (padded convolutions), each followed by a linear unit (ELU) and a 2 × 2 max pooling operation with stride 1 for downsampling. At each downsampling step, we double the number of feature channels. Every step in the expansive path consists of an upsampling of the feature map followed by a 2 × 2 convolution (“up-convolution”) that halves the number of feature channels, a concatenation with the correspondingly cropped feature map from the contracting path, and two 3 × 3 convolutions, each followed by a ELU. The cropping is necessary due to the loss of border pixels in every convolution. Because the resolution of the remote sensing image is smaller (one pixel for Landsat with a resolution of 30 m), downsampling will have a catastrophic effect on these local small target features, resulting in the problem of vanishing gradients for many network layers. Therefore, Smoke-Unet is designed to only downsample three times. The steps of convolution and downsampling are alternately performed three times to obtain a high-dimensional feature map and then the spatial resolution is restored through the three-time symmetrical convolution and upsampling operations. The feature map with the same resolution was fused through a skip connection to compensate for the loss of detail caused by downsampling.
In order to improve the feature learning ability of the network, ResBlock, a residual block is added to the convolution block to enhance the feature extraction ability. The residual block with skip connection structure can enhance the robustness of the network and improve the performance of the network. The skips structure between layers can fuse coarse semantic and local appearance information. This skip feature is learned end-to-end to improve the semantics and spatial precision for the output. Remote sensors onboard satellite have so many spectral channels that too much irrelevant information leads to difficulty in extracting feature. In order to emphasize effective information and reduce the interference of invalid band information, the SEBlock module based on the attention mechanism is added to the Smoke-Unet network structure. In the attention model, the focus process can be imitated by setting the weight coefficient. The key attention areas can be set with larger weight coefficients, which represent the importance of the information in these areas, while other areas can be set with smaller coefficients to filter invalid information. Through considering different degree of importance for information, the efficiency and accuracy of information processing can be greatly improved. At the final layer, a 1 × 1 convolution is used to map each 16-component feature vector to final smoke class. In total, the network has 15 convolutional layers.


 ,
, 


