Article

UAV-Based LiDAR Scanning for Individual Tree Detection and Height Measurement in Young Forest Permanent Trials

by
Francisco Rodríguez-Puerta
1,*,
Esteban Gómez-García
2,
Saray Martín-García
3,4,
Fernando Pérez-Rodríguez
3 and
Eva Prada
2
1
EiFAB-iuFOR, Campus Duques de Soria s/n, Universidad de Valladolid, 42004 Soria, Spain
2
Centro de Investigación Forestal de Lourizán, Xunta de Galicia, 36143 Pontevedra, Spain
3
Föra Forest Technologies SLL, Campus Duques de Soria s/n, 42004 Soria, Spain
4
Biodiversity-LaboraTe-IBADER, Departamento de Enxeñaría Agroforestal, Universidade de Santiago de Compostela, 27001 Lugo, Spain
*
Author to whom correspondence should be addressed.
Remote Sens. 2022, 14(1), 170; https://doi.org/10.3390/rs14010170
Submission received: 29 November 2021 / Revised: 21 December 2021 / Accepted: 30 December 2021 / Published: 31 December 2021
(This article belongs to the Special Issue Applications of Individual Tree Detection (ITD))

Abstract

:
The installation of research or permanent plots is a very common task in growth and forest yield research. At young ages, tree height is the most commonly measured variable, so the location of individuals is necessary when repeated measures are taken and if spatial analysis is required. Identifying the coordinates of individual trees and re-measuring the height of all trees is difficult and particularly costly (in time and money). The data used comes from three Pinus pinaster Ait. and three Pinus radiata D. Don plantations of 0.8 ha, with an age ranging between 2 and 5 years and mean heights between 1 and 5 m. Five individual tree detection (ITD) methods are evaluated, based on the Canopy Height Model (CHM), where the height of each tree is identified, and its crown is segmented. Three CHM resolutions are used for each method. All algorithms used for individual tree detection (ITD) tend to underestimate the number of trees. The best results are obtained with the R package, ForestTools and rLiDAR. The best CHM resolution for identifying trees was always 10 cm. We did not detect any differences in the relative error (RE) between Pinus pinaster and Pinus radiata. We found a pattern in the ITD depending on the height of the trees to be detected: the accuracy is lower when detecting trees less than 1 m high than when detecting larger trees (RE close to 12% versus 1% for taller trees). Regarding the estimation of tree height, we can conclude that the use of the CHM to estimate height tends to underestimate its value, while the use of the point cloud presents practically unbiased results. The stakeout of forestry research plots and the re-measurement of individual tree heights is an operation that can be performed by UAV-based LiDAR scanning sensors. The individual geolocation of each tree and the measurement of heights versus pole and/or hypsometer measurement is highly accurate and cost-effective, especially when tree height reaches 1–1.5 m.

Graphical Abstract

1. Introduction

Forest management needs tools to predict the growth of forest stands under different silvicultural systems and climatic scenarios [1]. This information facilitates decision making for both forest owners and managers. Such tools are usually based on growth and yield models, for which it is essential to design research plots that will be successively measured over time (permanent plots). Stand-level models project values of stand parameters (e.g., basal area, mean diameter, total height, or number of trees per hectare), while individual tree-level models are further classified as distance-dependent (or spatial) and distance-independent models [2,3]. Spatial models include a measure of spatial competition, usually expressed as a function of the distance (or size) between the individual tree itself and its neighbors. Therefore, for the construction of these models, it is necessary to obtain tree coordinates, tree crown boundaries, and the spatial variability of plant density, and to re-measure their individual tree height and diameter at breast height at different time intervals, making it an expensive and time-consuming task.
New technologies, such as remote sensing and new computer vision algorithms, have enabled the introduction of semiautomated forest assessments based on automatic delineation of single tree crowns and individual tree detection [4,5,6,7,8,9,10], which can reduce time and cost compared to field inventory. Aerial photography, light detection and ranging (LiDAR) and multispectral and hyperspectral imaging are current tools for Earth observation and large-scale analysis of forest ecosystems. These methods allow us to analyze forests at different temporal and geographic scales with the support of various statistical methods and can therefore be complementary to the forest inventory [11,12,13,14,15,16,17,18,19]. In this way, very high-resolution remote sensing data allow moving from the stand level to the individual tree level [20]. Both active and passive remote sensors are robust alternatives for estimating forest variables. Optical data is useful for providing spectral information on species and forest condition [5], while active remote sensing technologies, such as Airborne Laser Scanning (ALS), provide very accurate estimation of individual tree height [21]. Photogrammetric point clouds do not have the ability to penetrate vegetation and attain more information on the vertical profile of the canopies and individual trees [22,23]. Still, although they only have a large amount of information from the upper part of the canopy, they allow for accurate canopy height models (CHM) and, therefore, the individual tree detection (ITD). This type of approach is very common in mature plantations [24,25,26]. In young forests, these approaches are infrequent [27,28], with these analyses focusing on terrestrial laser scanning (TLS) data [29].
Originally, ITD was performed by using photogrammetric point clouds, while ALS is now the dominant technology for 3D mapping of forests. At present unmanned aerial vehicles (UAV)-based LiDAR scanning (ULS) standing out in small areas as it is a less expensive alternative to ALS, while producing very-high density point clouds [30]. Therefore, several methods for individual tree detection developed for optical imagery have been extended to LiDAR data [24,31]. Currently, small UAVs are increasingly used in various forest remote sensing applications [32,33,34]. The main characteristic that defines them is the high spatial resolution obtained both in their images and in their photogrammetric point clouds [35,36].
Algorithms for ITD can be divided into those using CHM raster data and those using LiDAR point clouds directly [37]. Most of these algorithms for ITD are based on the assumption that tree canopies represent the highest part of the landscape and therefore find local maxima (LM) of heights within the data of individual tree canopies [7,38,39]. Application of smoothing filters helps to eliminate spurious local maxima generated by individual tree branches [26]. The parameterization of LM algorithms is based on two parameters: a Smoothing Window Size (SWS) and Tree Window Size (TWS) which defines a fixed boundary within which the algorithm searches for treetops [40]. This is followed by segmentation to delineate the canopy boundary of individual trees. The most common segmentation techniques are based on region-growing techniques [41,42], watershed delineation [43], and clustering [44,45,46,47]. These LM-based methods usually result in an underestimation of the number of stems and a bias towards larger trees or those at the upper level of multilayer forest structures [24,48]. Errors increase with the stand height and plot structural complexity by frequently generating omission and commission errors when delineating trees [49,50], so more efficient methods are needed to accurately extract local maxima in more complex forest structures and to be able to distinguish false positives [51]. Many methods based on deep learning are currently being developed to solve these problems [52].
Using ITD, in addition to obtaining the total number of stems, the heights of these trees can also be estimated and, from the deviations presented by the heights and the characteristics of their crowns, their respective diameters at breast height can be estimated, and even the competition indices could be estimated to be able to evaluate the forest uniformity of the stand in order to customize stand management to increase forest growth [53,54,55]. There are many examples of individual tree detection focusing on forest stand and its inventory in general [56], although the most notable are the studies coordinated by Hyyppä [57,58,59], who were pioneers in demonstrating that single tree delineation in forest stands can be detected using high-density laser data. On the other hand, Popescu et al. [60] estimated individual tree heights at plot level with LiDAR data based on local filtering with a variable window size based on canopy height with good success. Person et al. [61] and Leckie et al. [62] have shown that individual tree heights can be measured with high accuracy from airborne LiDAR data. There are also several studies that have used data from ULS for individual tree height estimation [24,63].
Fast-growing P. pinaster and P. radiata are the main forest coniferous species in Galicia region (NW Spain). Hence, experimental trials are intended to reduce rotation age and/or improve production and wood quality. Nowadays, regional typical rotation ages are 30–45 years, while the stem wood production is 6–8 t·ha−1·year−1 [64]. P. pinaster and P. radiata plantations may be ideal for individual tree detection monitoring due to their relatively open nature and tendency towards single vertical stratums. The installation, measuring and remeasuring of permanent plots is a time-consuming and, therefore, costly task for forest researchers. In our research study, we use ULS data to detect and measure individual P. pinaster and P. radiata trees at multiple research plots of varying both height and canopy cover levels within six pine plantations located in Galicia. We test five LM-based algorithms along with different combinations of TWS and SWS, on three LiDAR-derived CHM resolutions in order to execute the ITD process. Thus, the overall goal of this study is to demonstrate that it is possible to conduct ITD and subsequent measurement of individual tree height in young pine research plots by combining forest modeling techniques on ULS data.

2. Materials and Methods
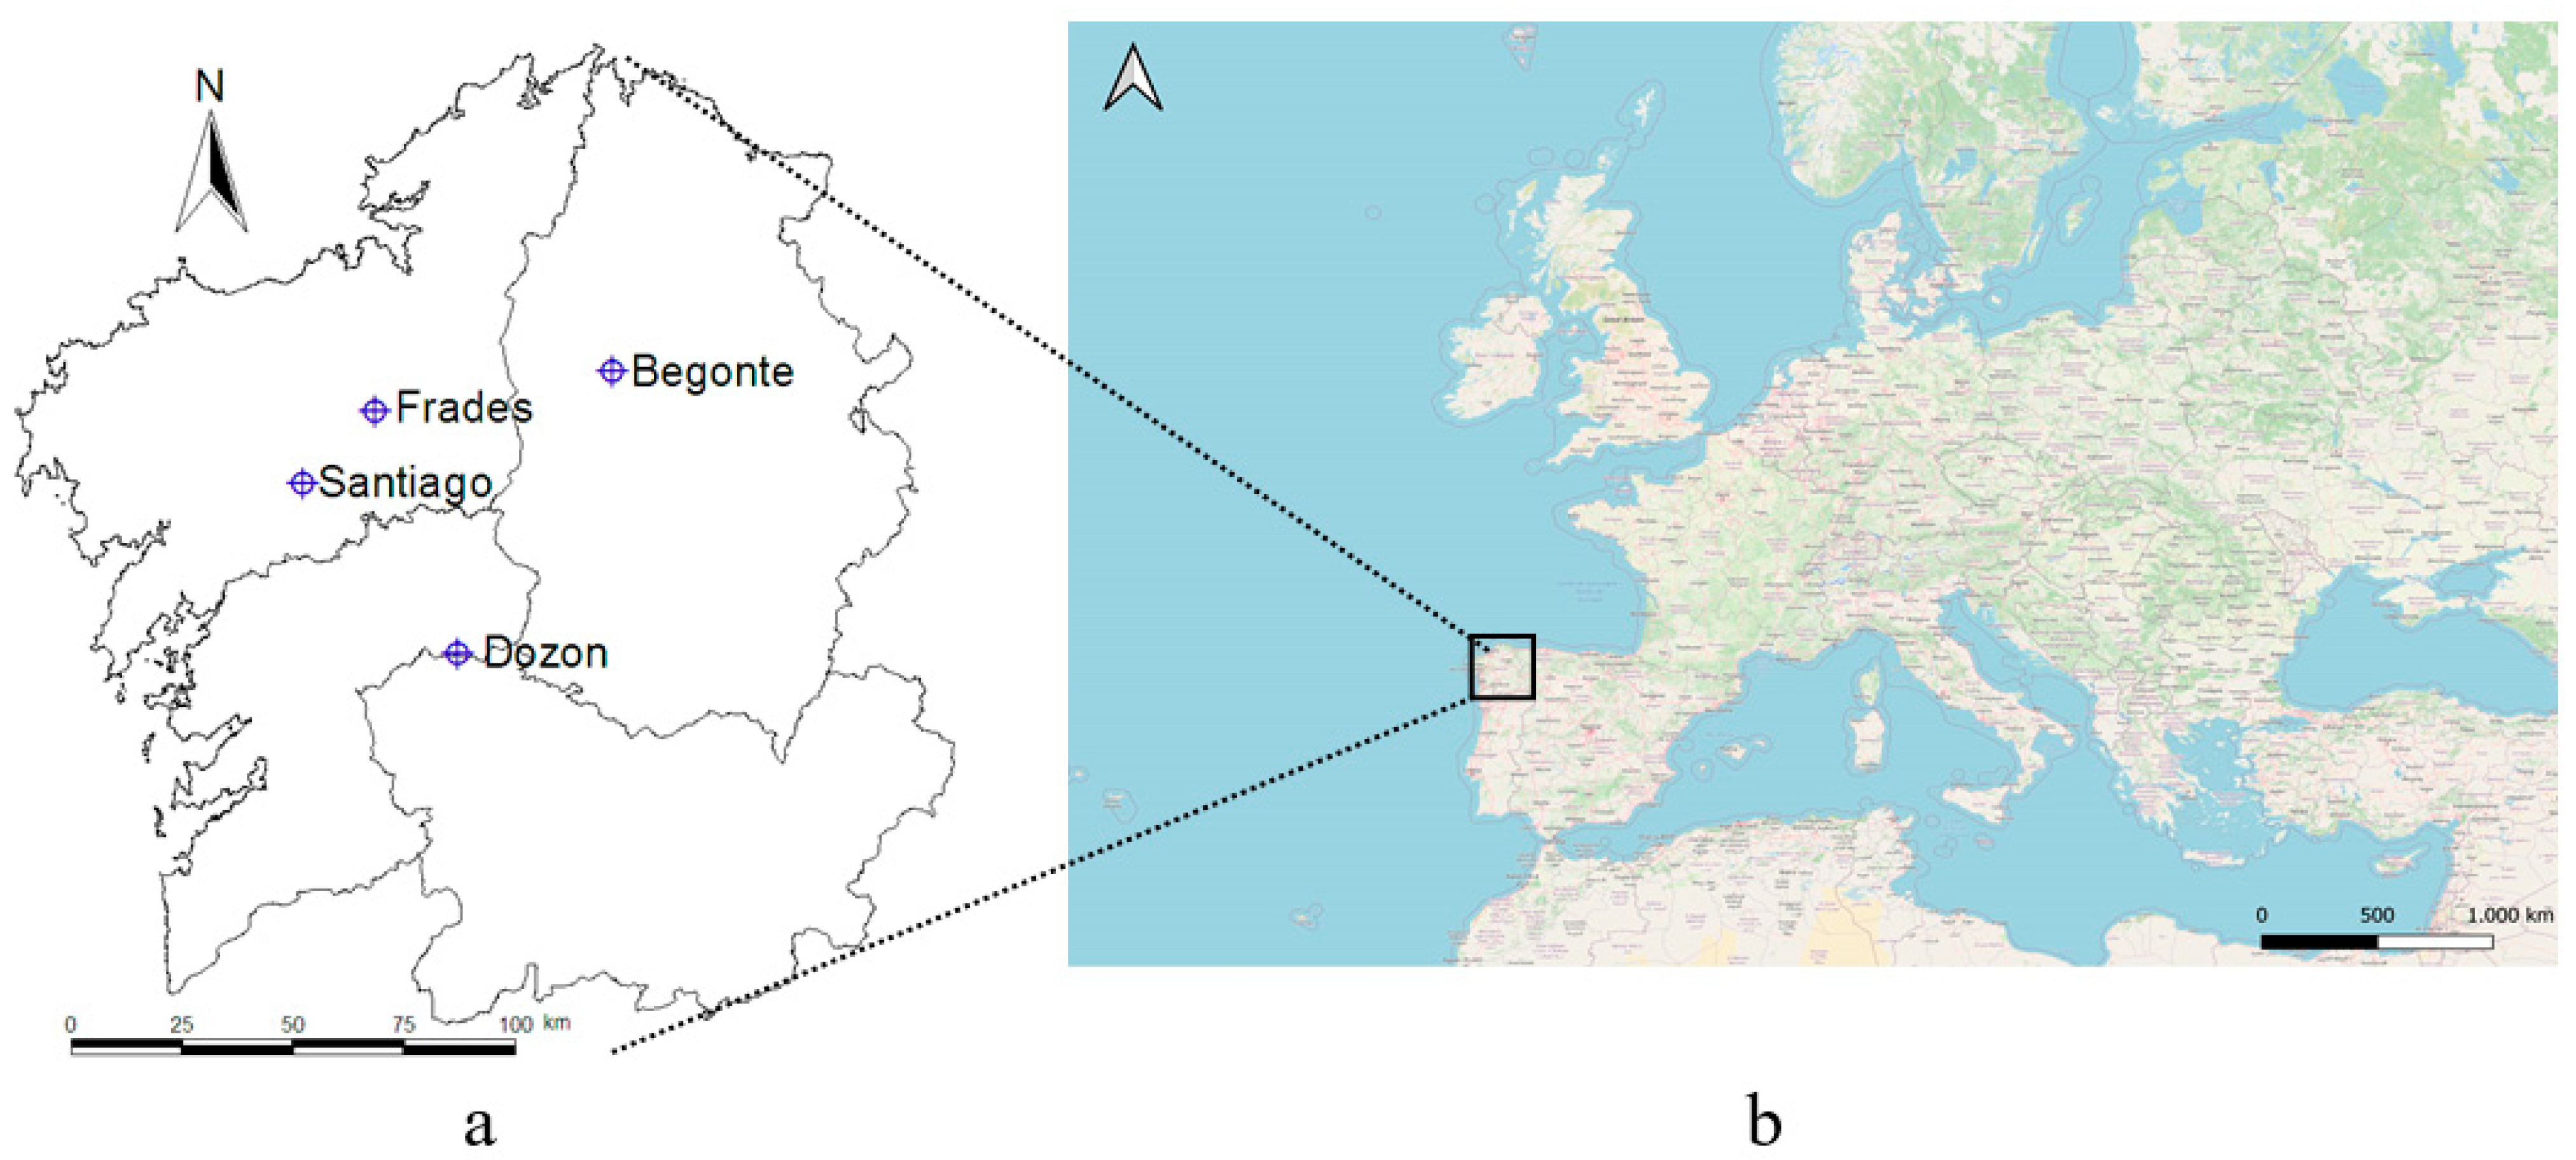
2.1. Study Area

The study was carried out in the Galicia region (northwest Spain, Figure 1b), with climate characterized by mild temperatures with low fluctuation and high rainfall with some water deficit in summer. Most representative soils are acidic, rich in organic matter, with a loam or sandy loam texture and well drained. The specific study area encompasses nearly 5 ha of young pine plantations (P. pinaster, A026, and P. radiata, A028, with an average height between 1 and 5 m) in four localizations (Table 1, Figure 1a). A total of 6 silvicultural permanent research plots using improved genetic material were established. At the time of planting, each plot comprised 1024 plants with a 4 × 2 m spacing. Plantations were established between March and April in several years. As forest growing is seasonal in the region, decreasing or even stopping in winter, in the moment of measurement (October 2020) the trees were in the dormant season.

2.2. LiDAR Data Collection and Pre-Processing

Data from the UAV was obtained on 28 and 29 October 2020. The integrated LiDAR system comprises a DJI M600 Pro UAV, a Phoenix LiDAR Systems Scout 16 with a Velodyne VLP-16 LiDAR sensor, and an inertial measurement unit (IMU-14). It is a high precision system (Root Mean Square Error (RMSE) = 30 mm) with a scanning rate of 600 k dual return points/s with a 360-degree field of view at a recommended scanning height of 20–60 m. To generate Post Processing Kinematic paths (PPK) the system uses a dual-frequency L1/L2 Global Navigation Satellite System (GNNS) receiver. The study was conducted with a flight height of 50 m above the ground at a speed of 4 m/s and at an approximate horizontal distance between adjacent flight lines of 15 m, producing a very high-density LiDAR point cloud (between 194 and 357 returns·m−2) with redundant coverage in the 90% overlap area.
Aeromedia UAV Inc. combined IMU and GNSS data through LiDARMill software (Phoenix LiDAR Systems) to apply differential corrections to generate a smooth and highly accurate trajectory for the computation of planimetric coordinates and ellipsoid height values. The Lastools (rapidlasso software) and easyLaz® environment (föra forest technologies), a proprietary tool based on the FUSION/ LDV software [65], were used to pre-process the raw data, which involved seven tasks: (1) a total of 34 unbuffered tiles (200 × 200 m) was generated using lastile procedure; (2) duplicate points were eliminated and noise was reduced using lasduplicate and lasnoise procedures, respectively; (3) the overlap was classified by the procedure lasoverage; (4) ground points were classified using a triangulated irregular network (TIN) algorithm implemented in lasground; (5) the elevation of each point above the ground was already computed with the lasheight procedure; (6) the point cloud was classified into high vegetation and buildings through the lasclassify procedure, this tool requires that the bare-earth points have already been identified (task 4); (7) and finally, the Digital Terrain Model (DTM), using the GridSurfaceCreate procedure, and the Canopy Height Model (CHM), using the CanopyModel procedure, were generated at 0.10 m, 0.25 m and 0.50 m resolutions.

2.3. Field Data and Photointerpretation

Total height of all living trees was measured using a telescometer in sites where trees were less than 3 m, and a Haglöf Sweden® Vertex when the average tree height exceeded the 3–4 m (plots A026FRA and A028SAN). In addition to the field work, a virtual inventory of all the trees (location and measurement of their total height) was carried out in the 6 plots based on the LiDAR point cloud. For this purpose, photointerpretation was performed using FugroViewer software (downloadable at http://www.fugroviewer.com/, accessed on 28 November 2021). Table 2 shows the total number of living trees in each plot, and the main statistics for the total height of each tree.

2.4. Individual Tree Detection Algorithms

Individual tree detection is the process of spatially locating trees and extracting height information based on two independent processes. In the first phase, it is necessary to detect the treetops through LM algorithms. The parameterization of LM algorithms is based on two parameters: Smoothing Window Size (SWS) and Tree Window Size (TWS), which defines a fixed boundary within which the algorithm searches for treetops [40]. This is followed by segmentation to delineate the canopy boundary of individual trees. The most common are based on region growth [41,42], watershed delineation [38], and clustering [44,45,46,47]. Some of the algorithms used in this work include both processes, while others only include the treetop detection. The delineation of the canopy boundary of individual trees in the latter was always performed from the watershed algorithm through the SAGA software [66].
To identify treetops in this research, we have compared the algorithms of ForestTools [67], lidR [68] and rLiDAR [69] packages in R software [70]. The vwf and mcws functions of the ForestTools package [67] can detect treetops and outline their respective crowns, applied to CHM, respectively. The vwf implements the variable window filter algorithm [71] and mcws implements the watershed function to segment [72]. The functions FindTreesCHM and ForestCAS available in the rLiDAR package [69] can detect treetops and their respective crown boundaries. The FindTreesCHM function searchs for treetops in the CHM through a moving window with a fixed TWS [21], while ForestCAS implements the watershed function for segmenting in a similar way to the segment_trees function in the lidR package [68]. Finally, the most comprehensive R package for manipulating airborne LiDAR data in forestry contexts is lidR [68]. There are several algorithms available in lidR, and they can be divided into two categories: point cloud-based algorithms that work without a CHM, and raster-based algorithms that work with a CHM. The functions find_trees and segment_trees can find the position of the trees and segment the individual tree crown, respectively. The find_trees function can use two algorithms (LMF or manual) either from the point cloud or from the CHM. The segment_trees function can use several possible algorithms based on region growing [42,73], watershed, and Voronoi tessellation [69]. More details can be found at Roussel et al. [68]). In our plots, we compared the results using a point cloud-based approach to those obtained with the CHM. In the first case, we used the algorithm of Li et al. [73], while in the second case, we used the algorithm of Dalponte and Coomes [42].

2.5. Accuracy Evaluation

To explore the influence of the different algorithms on the ITD, an evaluation of performance in terms of relative error rate was carried out. This accuracy assessment was based on the evaluation of statistical measures such as true positive (TP, correct detection), false negative (FN, omission error), false positive (FP, commission error), recall (r), precision (p) F-score (F, overall accuracy) and relative error (RE). These statistics are widely used to evaluate ITD methods [26,73,74,75]. Recall gives us a measure of detected trees and is inversely related to omission error, precision implies a measure of correctly detected trees and is inversely related to commission error, and the F-score represents the harmonic mean of recall and precision. These analyses were performed to compare the number of trees correctly located.
r = TP TP + FN
p = TP TP + FP
F = 2 × r × p r + p
RE = ND i NR i NR i × 100 %
where NDi is the number of detected trees in ith plot; NRi is the number of reference trees in ith plot.
To validate the heights of the correctly identified trees, we compared the tree heights measured in the fieldwork with the heights measured on the LiDAR point cloud and with the height measured on the CHM for each of the correctly identified trees. The analysis of the error obtained between the different estimated values of tree height and their respective values measured in the field were analyzed by means of two goodness-of-fit statistics well known in the forest literature: the mean bias error (BE) and the root mean square error (RMSE). Moreover, according to Hartley et al. [27] the effect of height on error was examined by plotting values of absolute error (AE) and percentage error (PE) against tree heights classes (size class of 0.5 m and ranging from 0–0.5 m to 5.5–6 m).
BE = i = 1 i = n Y i Y ^ i n
RMSE = i = 1 i = n ( Y i Y ^ i ) 2 n
AE = | Y i Y ^ i |
PE = AE Y i 100
where Yi are the field-measured tree height values, Y ^ i are the UAV-measured tree height values and n is the sample size.

3. Results

The relative errors (RE) of the different combinations of algorithms/plot/species/CHM resolution are shown in Table 3 and Table 4. Generally, all algorithms tend to underestimate the number of trees. In the case of raster-based algorithms that perform with a CHM, we observe that the most accurate resolution for the ITD was always the 10 cm resolution of the CHM, regardless of the algorithm used and the two pine species analyzed. Whether in CHM-based or point cloud-based ITD, no differences in accuracy were detected between P. pinaster and P. radiata. However, we did find a clear pattern when considering the average height of the trees to be detected: the accuracy is lower when detecting small trees (trees less than 1 m high) than when detecting larger trees. The plots in which the trees had an average height of less than 1 m, obtained a higher RE (close to 15%), while the plots in which the average height was higher than 2.5 m, the RE was roughly 1%.
The best results were obtained with the lidR package using Dalponte and Coomes [42] algorithm, where we obtained a RE between −13.27% and 1.47%. The lidR package includes the option to use a point cloud based algorithm [73], which is the most difficult to use and parameterize, and we have not been able to obtain results in accordance with this difficulty. Table 5 shows all the statistics calculated to evaluate the accuracy of the different methods, but only for the case of Dalponte and Coomes [42] algorithm. Figure 2 shows the graphical results obtained in plot A028SAN. The 2D view (Figure 2A) includes crown segmentation, tree height from the point cloud and treetop location. The 3D views of the point cloud from the results of the Li2012 algorithm [73] of the lidR package [68] are shown in Figure 2B,C.
The results of the second objective of this study, the reliability of LiDAR information for measuring individual tree height, are shown in Table 6. In this case, only the results obtained for the well-identified trees (TP) by the algorithm of Li et al. 2012 [73] are shown. This algorithm uses the point cloud directly, so the height of the treetops has been calculated based on it. As the other three algorithms are based on the CHM, we have also calculated the treetop height from the CHM (with and without smoothing). The differences between the results obtained through the three evaluated methodologies for estimating height are noteworthy. We can conclude that CHM always tends to underestimate individual tree height. If CHM has been smoothed, the underestimation is more significant. The estimation of height directly on the point cloud presents less biased results (an average of −0.047 m) and with a lower RMSE than in the case of the CHM (0.137 m versus 0.288 m). Finally, no differences were detected between the two pine species analyzed, neither between the different plots nor with any of the three methods evaluated.
Figure 3 shows the error pattern, when calculating the height of the treetops from the point cloud, against predicted values for each of the plots analyzed. There is a trend to underestimate the height of small trees and to slightly overestimate the height of larger trees. The effect of tree height on error (absolute, AE, and percent relative, PE) was examined for the methodology selected (estimation of height directly on the LiDAR point cloud) and considering all sites (Figure 4). PE in estimating tree height decreases when tree height increases (Figure 4 right), and specially declines sharply from the smallest two height categories (0–0.5 m and 0.5–1 m) to the taller trees. The mean PE fall below 10% when tree height categories exceed 1 m. Therefore, measure of tree height from UAV based lidar is preferable when tree height reached 1 m, and this threshold is the same as for ITD.

4. Discussion

Although, in the last few years, the forestry sector is increasing the use of UAVs to measure tree traits, there are few studies assessing the possibilities in young trees and most of them use UAV imagery. We have evaluated the use of UAV-based LiDAR scanning in young pine trees belonging to permanent research plots. We first assessed individual tree detection (ITD), followed by height measurement assessment.
In ITD, the best results were obtained with the lidR package. We observed that the accuracy is lower when detecting small trees (less than 1 m high). Probably, if the tree we want to measure with ULS is less than 1 m high, its crown will usually be very small, meaning that it will be more difficult to detect a relative maximum (LM). If plots with mean tree height less than 1 m are excluded (A026BEG and A028BEG), the accuracy statistics considered in ITD (recall, precision, and F-score) are higher than 0.94. Hao et al. [28] obtained similar values in the same statistics for ITD with their best solution using UAV-based photogrammetry from Chinese fir trees with heights ranging 1–4 m. According to Hao et al. [28], no complex forest structures, regularly distributed trees and without overlapping crowns; no complex topography, and cleared scrub before the UAV flight, as it is in our study, provide higher accuracy for ITD. Moreover, coniferous trees are better detected, and their height is better measured than deciduous trees thanks to their cone-shaped crown [76].
Hartley et al. [27] evaluated the use of UAV to generate high-density point clouds to measure height in young forestry trials (P. radiata from New Zealand). They concluded that ULS predicted tree height in young stands with greater precision (RMSE = 0.15 m) and lower bias than UAV-based photogrammetry with Structure from Motion (SfM) processing software (RMSE = 0.48 m). However, Hao et al. [28] reported better precision using SfM (RMSE = 0.22 m) in measured heights in young trees. Considering global values, the RMSE cited in Hartley et al. [27] from ULS is comparable to our study (0.15 m vs. 0.137 m); the bias is similar, although in the opposite direction. In our study, the tree height is overestimated (BE = −0.047) whereas in their study height is underestimated (BE = 0.05). The underestimation of tree height from LiDAR is well documented [56,57,58]. According to Hartley et al. [27] the percent relative error (PE) in estimating tree height decreases with increasing tree height, same as in our study, where mean PE falls below 10% when tree height categories exceed 1 m. The PE decline is steeper in Hartley et al. [27], where PE was 63.7% and 8.1%, respectively, for the 0.5–1 m and 1–1.5 m categories, than in our study, with values of 13.6% and 8.3% for the same categories.
We can consider the field height measurements with telescometer as real data, while the measurement with Haglöf Sweden® Vertex in tallest trees (3–4 m) could have an error in the same order that the RMSE obtained in this study [77]. Thus, we can point out that when the errors are very small (as in our case) the under- or overestimation can be very subtle and is often due to errors in height measurement in field. Wang et al. [78] observed high agreement on height measurement between field measurement, airborne laser scanning (ALS) and terrestrial laser scanning (TLS) for small trees (less 10 m) in no complex stands. The taller the tree, especially for dominant and co-dominant trees and for deciduous species, the more reliable is the ALS-based tree height measurement [78]. Wu et al. [79] also indicated agreement between these technologies and UAV imagery in horticultural tree crops of 2–10 m. The authors take TLS data as reference (“real data”) and conclude that UAV imagery provides the highest accuracies and level of flexibility for height measurement in medium size areas. Although Wu et al. [79] considered medium size areas as 1–10 km2, we considered more appropriate the range of spatial coverage that the same authors cited to UAV (0.01–10 km2) for forest measurements. Field measurements or TLS are more suited for small areas, and especially for collecting ground level data [80], while ALS data perform better in large areas, and for characterizing the upper part of the trees, including the crown [81]. However, the most interesting future challenge is to combine point clouds from TLS and ALS to evaluate each tree in a complete way [82,83].
An advantage of the collected UAV point cloud is that data remain available and allow for retrospective studies [79]. Moreover, UAV data provide canopy variables that are not frequently field-measured, except for canopy base height, because canopy measured in field is inaccurate, inconsistent, or not suited [79]. Having data on canopy variables allows, for example, conducting studies related to tree competition or evaluating thinning or pruning practices [84,85,86]. In addition, the canopy variables obtained from UAVs are spatially explicit and therefore consider that tree canopies are rarely centered directly above their stem bases [87]. Canopy displacement occurs to reduce competition with neighbors, so plants grow towards areas with greater resource availability.

5. Conclusions

Detecting and measuring the height of all trees is a difficult, costly, but necessary task in all research plots. The use of UAVs to carry out many forestry measurements is becoming more and more widespread, and it is even common for forest managers (as in agriculture) to have their own UAV. This paper successfully evaluates three individual tree detection methods based on the canopy height model, and another one based directly on the point cloud. In all of them, the height of each tree is measured from the point cloud and from the CHM (with and without smoothing) and compared with the data measured in the field. All algorithms used for individual tree detection tend to underestimate the number of trees, with worse results for small trees (trees less than 1 m high). Regarding the estimation of individual height, the results obtained on the point cloud are practically unbiased.
There are already many studies comparing UAV-based photogrammetry with Structure from Motion (SfM) and LiDAR-based techniques. It would be very interesting to carry out a photogrammetric flight to compare these results with those obtained with UAS, since this type of flight is much cheaper and easier to perform.

Author Contributions

Conceptualization, F.R.-P., E.P. and E.G.-G.; methodology, F.R.-P., F.P.-R. and S.M.-G.; formal analysis and validation, S.M.-G.; field data acquisition, E.P. and E.G.-G.; writing—original draft preparation, F.R.-P.; writing—review and editing, all authors. All authors have read and agreed to the published version of the manuscript.

Funding

This research was funded by Ministerio de Ciencia e Innovación, Spanish Government (DI-16-08446, Saray Martín-García), and by the actions PTT2020/154 and AC2021 L-03 of Xunta de Galicia, cofinanced by the European agricultural fund for rural development (EAFDR), Xunta de Galicia and Ministerio de Agricultura, Pesca y Alimentación.

Institutional Review Board Statement

Not applicable.

Informed Consent Statement

Not applicable.

Acknowledgments

LiDAR data was provided by Aeromedia UAV Inc. Experimental plots are owned by the company FINSA, SL. We are grateful to Carlos Iglesias Dapena and also the field staff of FINSA for their help taking the field data. Thanks to Rafael Alonso-Ponce and Iñigo Lizarralde for their proofreading of the manuscript.

Conflicts of Interest

The authors declare no conflict of interest.

References

  1. Bolte, A.; Ammer, C.; Löf, M.; Nabuurs, G.-J.; Schall, P.; Spathelf, P. Adaptive Forest Management: A Prerequisite for Sustainable Forestry in the Face of Climate Change; Springer: Dordrecht, The Netherlands, 2010; pp. 115–139. ISBN 978-90-481-3300-0. [Google Scholar]
  2. Vanclay, J.K. Modelling Forest Growth and Yield: Applications to Mixed Tropical Forests; CAB International: Wallingford, UK, 1994; ISBN 978-0-85198-913-6. [Google Scholar]
  3. Wimberly, M.C.; Bare, B.B. Distance-Dependent and Distance-Independent Models of Douglas-Fir and Western Hemlock Basal Area Growth Following Silvicultural Treatment. For. Ecol. Manag. 1996, 89, 1–11. [Google Scholar] [CrossRef]
  4. Brandtberg, T. Automatic Individual Tree Based Analysis of High Spatial Resolution Aerial Images on Naturally Regenerated Boreal Forests. Can. J. For. Res. 1999, 29, 1464–1478. [Google Scholar] [CrossRef]
  5. Wang, L.; Gong, P.; Biging, G.S. Individual Tree-Crown Delineation and Treetop Detection in High-Spatial-Resolution Aerial Imagery. Photogramm. Eng. Remote Sens. 2004, 70, 351–357. [Google Scholar] [CrossRef] [Green Version]
  6. Brandtberg, T.; Walter, F. Automated Delineation of Individual Tree Crowns in High Spatial Resolution Aerial Images by Multiple-Scale Analysis. Mach. Vis. Appl. 1998, 11, 64–73. [Google Scholar] [CrossRef]
  7. Ke, Y.; Quackenbush, L.J. A Review of Methods for Automatic Individual Tree-Crown Detection and Delineation from Passive Remote Sensing. Int. J. Remote Sens. 2011, 32, 4725–4747. [Google Scholar] [CrossRef]
  8. Ferraz, A.; Saatchi, S.; Mallet, C.; Meyer, V. Lidar Detection of Individual Tree Size in Tropical Forests. Remote Sens. Environ. 2016, 183, 318–333. [Google Scholar] [CrossRef]
  9. Gomes, M.F.; Maillard, P.; Deng, H. Individual Tree Crown Detection in Sub-Meter Satellite Imagery Using Marked Point Processes and a Geometrical-Optical Model. Remote Sens. Environ. 2018, 211, 184–195. [Google Scholar] [CrossRef]
  10. Kansanen, K.; Vauhkonen, J.; Lähivaara, T.; Seppänen, A.; Maltamo, M.; Mehtätalo, L. Estimating Forest Stand Density and Structure Using Bayesian Individual Tree Detection, Stochastic Geometry, and Distribution Matching. ISPRS J. Photogramm. Remote Sens. 2019, 152, 66–78. [Google Scholar] [CrossRef]
  11. Holmgren, J.; Persson, Å. Identifying Species of Individual Trees Using Airborne Laser Scanner. Remote Sens. Environ. 2004, 90, 415–423. [Google Scholar] [CrossRef]
  12. Baltsavias, E.; Gruen, A.; Eisenbeiss, H.; Zhang, L.; Waser, L.T. High-quality Image Matching and Automated Generation of 3D Tree Models. Int. J. Remote Sens. 2008, 29, 1243–1259. [Google Scholar] [CrossRef]
  13. Waser, L.T.; Baltsavias, E.; Ecker, K.; Eisenbeiss, H.; Ginzler, C.; Küchler, M.; Thee, P.; Zhang, L. High-resolution Digital Surface Models (DSMs) for Modelling Fractional Shrub/Tree Cover in a Mire Environment. Int. J. Remote. Sens. 2008, 29, 1261–1276. [Google Scholar] [CrossRef]
  14. Hudak, A.T.; Haren, A.T.; Crookston, N.L.; Liebermann, R.J.; Ohmann, J.L. Imputing Forest Structure Attributes from Stand Inventory and Remotely Sensed Data in Western Oregon, USA. For. Sci. 2014, 60, 253–269. [Google Scholar] [CrossRef] [Green Version]
  15. Hansen, E.; Gobakken, T.; Bollandsås, O.; Zahabu, E.; Næsset, E. Modeling Aboveground Biomass in Dense Tropical Submontane Rainforest Using Airborne Laser Scanner Data. Remote Sens. 2015, 7, 788–807. [Google Scholar] [CrossRef] [Green Version]
  16. Yu, X.; Hyyppä, J.; Karjalainen, M.; Nurminen, K.; Karila, K.; Vastaranta, M.; Kankare, V.; Kaartinen, H.; Holopainen, M.; Honkavaara, E.; et al. Comparison of Laser and Stereo Optical, SAR and InSAR Point Clouds from Air- and Space-Borne Sources in the Retrieval of Forest Inventory Attributes. Remote Sens. 2015, 7, 15933–15954. [Google Scholar] [CrossRef] [Green Version]
  17. Gholizadeh, A.; Mišurec, J.; Kopačková, V.; Mielke, C.; Rogass, C. Assessment of Red-Edge Position Extraction Techniques: A Case Study for Norway Spruce Forests Using HyMap and Simulated Sentinel-2 Data. Forests 2016, 7, 226. [Google Scholar] [CrossRef] [Green Version]
  18. Zhang, Z.; Kazakova, A.; Moskal, L.; Styers, D. Object-Based Tree Species Classification in Urban Ecosystems Using LiDAR and Hyperspectral Data. Forests 2016, 7, 122. [Google Scholar] [CrossRef] [Green Version]
  19. St-Onge, B.; Vega, C.; Fournier, R.A.; Hu, Y. Mapping Canopy Height Using a Combination of Digital Stereo-photogrammetry and Lidar. Int. J. Remote Sens. 2008, 29, 3343–3364. [Google Scholar] [CrossRef]
  20. Koch, B.; Heyder, U.; Weinacker, H. Detection of Individual Tree Crowns in Airborne Lidar Data. Photogramm. Eng. Remote Sens. 2006, 72, 357–363. [Google Scholar] [CrossRef] [Green Version]
  21. Wulder, M.; Niemann, K.O.; Goodenough, D.G. Local Maximum Filtering for the Extraction of Tree Locations and Basal Area from High Spatial Resolution Imagery. Remote Sens. Environ. 2000, 73, 103–114. [Google Scholar] [CrossRef]
  22. Hodgson, M.E.; Bresnahan, P. Accuracy of Airborne Lidar-Derived Elevation. Photogramm. Eng. Remote Sens. 2004, 70, 331–339. [Google Scholar] [CrossRef] [Green Version]
  23. Silva, C.A.; Valbuena, R.; Pinagé, E.R.; Mohan, M.; de Almeida, D.R.A.; North Broadbent, E.; Jaafar, W.S.W.M.; de Almeida Papa, D.; Cardil, A.; Klauberg, C. ForestGapR: An r Package for Forest Gap Analysis from Canopy Height Models. Methods Ecol. Evol. 2019, 10, 1347–1356. [Google Scholar] [CrossRef] [Green Version]
  24. Picos, J.; Bastos, G.; Míguez, D.; Alonso, L.; Armesto, J. Individual Tree Detection in a Eucalyptus Plantation Using Unmanned Aerial Vehicle (UAV)-LiDAR. Remote Sens. 2020, 12, 885. [Google Scholar] [CrossRef] [Green Version]
  25. Guerra-Hernández, J.; Cosenza, D.N.; Rodriguez, L.C.E.; Silva, M.; Tomé, M.; Díaz-Varela, R.A.; González-Ferreiro, E. Comparison of ALS- and UAV(SfM)-Derived High-Density Point Clouds for Individual Tree Detection in Eucalyptus Plantations. Int. J. Remote Sens. 2018, 39, 5211–5235. [Google Scholar] [CrossRef]
  26. Mohan, M.; Mendonça, B.A.F.; de Silva, C.A.; Klauberg, C.; de Saboya Ribeiro, A.S.; Araújo, E.J.G.; de Monte, M.A.; Cardil, A. Optimizing Individual Tree Detection Accuracy and Measuring Forest Uniformity in Coconut (Cocos nucifera L.) Plantations Using Airborne Laser Scanning. Ecol. Model. 2019, 409, 108736. [Google Scholar] [CrossRef]
  27. Hartley, R.J.L.; Leonardo, E.M.; Massam, P.; Watt, M.S.; Estarija, H.J.; Wright, L.; Melia, N.; Pearse, G.D. An Assessment of High-Density UAV Point Clouds for the Measurement of Young Forestry Trials. Remote Sens. 2020, 12, 4039. [Google Scholar] [CrossRef]
  28. Hao, Z.; Lin, L.; Post, C.; Yusen, J.; Li, M.; Wei, N.; Yu, K.; Liu, J. Assessing Tree Height and Density of a Young Forest Using a Consumer Unmanned Aerial Vehicle (UAV). New For. 2021, 52, 843–862. [Google Scholar] [CrossRef]
  29. Li, Y.; Hess, C.; von Wehrden, H.; Härdtle, W.; von Oheimb, G. Assessing Tree Dendrometrics in Young Regenerating Plantations Using Terrestrial Laser Scanning. Ann. For. Sci. 2014, 71, 453–462. [Google Scholar] [CrossRef] [Green Version]
  30. Zaforemska, A.; Xiao, W.; Gaulton, R. Individual tree detection from UAV LIDAR dta in a mixed species woodland. Int. Arch. Photogramm. Remote Sens. Spat. Inf. Sci. 2019, XLII-2/W13, 657–663. [Google Scholar] [CrossRef] [Green Version]
  31. Mohan, M.; Leite, R.V.; Broadbent, E.N.; Jaafar, W.S.W.M.; Srinivasan, S.; Bajaj, S.; Corte, A.P.D.; Amaral, C.H.; do Gopan, G.; Saad, S.N.M.; et al. Individual Tree Detection Using UAV-Lidar and UAV-SfM Data: A Tutorial for Beginners. Open Geosci. 2021, 13, 1028–1039. [Google Scholar] [CrossRef]
  32. Colomina, I.; Molina, P. Unmanned Aerial Systems for Photogrammetry and Remote Sensing: A Review. ISPRS J. Photogramm. Remote Sens. 2014, 92, 79–97. [Google Scholar] [CrossRef] [Green Version]
  33. Torresan, C.; Berton, A.; Carotenuto, F.; Di Gennaro, S.F.; Gioli, B.; Matese, A.; Miglietta, F.; Vagnoli, C.; Zaldei, A.; Wallace, L. Forestry Applications of UAVs in Europe: A Review. Int. J. Remote Sens. 2017, 38, 2427–2447. [Google Scholar] [CrossRef]
  34. Jaakkola, A.; Hyyppä, J.; Kukko, A.; Yu, X.; Kaartinen, H.; Lehtomäki, M.; Lin, Y. A Low-Cost Multi-Sensoral Mobile Mapping System and Its Feasibility for Tree Measurements. ISPRS J. Photogramm. Remote Sens. 2010, 65, 514–522. [Google Scholar] [CrossRef]
  35. Lisein, J.; Pierrot-Deseilligny, M.; Bonnet, S.; Lejeune, P. A Photogrammetric Workflow for the Creation of a Forest Canopy Height Model from Small Unmanned Aerial System Imagery. Forests 2013, 4, 922–944. [Google Scholar] [CrossRef] [Green Version]
  36. Puliti, S.; Ørka, H.; Gobakken, T.; Næsset, E. Inventory of Small Forest Areas Using an Unmanned Aerial System. Remote Sens. 2015, 7, 9632–9654. [Google Scholar] [CrossRef] [Green Version]
  37. Valbuena-Rabadán, M.-Á.; Santamaría-Peña, J.; Sanz-Adán, F. Estimation of Diameter and Height of Individual Trees for Pinus sylvestris L. Based on the Individualising of Crowns Using Airborne LiDAR and the National Forestry Inventory Data. For. Syst. 2016, 25, 046. [Google Scholar] [CrossRef] [Green Version]
  38. Korpela, I.; Anttila, P.; Pitkänen, J. The Performance of a Local Maxima Method for Detecting Individual Tree Tops in Aerial Photographs. Int. J. Remote Sens. 2006, 27, 1159–1175. [Google Scholar] [CrossRef]
  39. Wallace, L.; Lucieer, A.; Watson, C.S. Evaluating Tree Detection and Segmentation Routines on Very High Resolution UAV LiDAR Data. IEEE Trans. Geosci. Remote Sens. 2014, 52, 7619–7628. [Google Scholar] [CrossRef]
  40. Mohan, M.; Silva, C.; Klauberg, C.; Jat, P.; Catts, G.; Cardil, A.; Hudak, A.; Dia, M. Individual Tree Detection from Unmanned Aerial Vehicle (UAV) Derived Canopy Height Model in an Open Canopy Mixed Conifer Forest. Forests 2017, 8, 340. [Google Scholar] [CrossRef] [Green Version]
  41. Solberg, S.; Naesset, E.; Bollandsas, O.M. Single Tree Segmentation Using Airborne Laser Scanner Data in a Structurally Heterogeneous Spruce Forest. Photogramm. Eng. Remote Sens. 2006, 72, 1369–1378. [Google Scholar] [CrossRef]
  42. Dalponte, M.; Coomes, D.A. Tree-centric Mapping of Forest Carbon Density from Airborne Laser Scanning and Hyperspectral Data. Methods Ecol. Evol. 2016, 7, 1236–1245. [Google Scholar] [CrossRef] [Green Version]
  43. Chen, Q.; Baldocchi, D.; Gong, P.; Kelly, M. Isolating Individual Trees in a Savanna Woodland Using Small Footprint Lidar Data. Photogramm. Eng. Remote Sens. 2006, 72, 923–932. [Google Scholar] [CrossRef] [Green Version]
  44. Gupta, S.; Weinacker, H.; Koch, B. Comparative Analysis of Clustering-Based Approaches for 3-D Single Tree Detection Using Airborne Fullwave Lidar Data. Remote Sens. 2010, 2, 968–989. [Google Scholar] [CrossRef] [Green Version]
  45. Ferraz, A.; Bretar, F.; Jacquemoud, S.; Gonçalves, G.; Pereira, L.; Tomé, M.; Soares, P. 3-D Mapping of a Multi-Layered Mediterranean Forest Using ALS Data. Remote Sens. Environ. 2012, 121, 210–223. [Google Scholar] [CrossRef]
  46. Lindberg, E.; Eysn, L.; Hollaus, M.; Holmgren, J.; Pfeifer, N. Delineation of Tree Crowns and Tree Species Classification From Full-Waveform Airborne Laser Scanning Data Using 3-D Ellipsoidal Clustering. IEEE J. Sel. Top. Appl. Earth Obs. Remote Sens. 2014, 7, 3174–3181. [Google Scholar] [CrossRef] [Green Version]
  47. Xiao, W.; Xu, S.; Elberink, S.O.; Vosselman, G. Individual Tree Crown Modeling and Change Detection From Airborne Lidar Data. IEEE J. Sel. Top. Appl. Earth Obs. Remote Sens. 2016, 9, 3467–3477. [Google Scholar] [CrossRef]
  48. Peuhkurinen, J.; Mehtätalo, L.; Maltamo, M. Comparing Individual Tree Detection and the Area-Based Statistical Approach for the Retrieval of Forest Stand Characteristics Using Airborne Laser Scanning in Scots Pine Stands. Can. J. For. Res. 2011, 41, 583–598. [Google Scholar] [CrossRef]
  49. Goerndt, M.E.; Monleon, V.J.; Temesgen, H. Relating Forest Attributes with Area- and Tree-Based Light Detection and Ranging Metrics for Western Oregon. West. J. Appl. For. 2010, 25, 105–111. [Google Scholar] [CrossRef] [Green Version]
  50. Bouvier, M.; Durrieu, S.; Fournier, R.A.; Renaud, J.-P. Generalizing Predictive Models of Forest Inventory Attributes Using an Area-Based Approach with Airborne LiDAR Data. Remote Sens. Environ. 2015, 156, 322–334. [Google Scholar] [CrossRef]
  51. Xu, X.; Zhou, Z.; Tang, Y.; Qu, Y. Individual Tree Crown Detection from High Spatial Resolution Imagery Using a Revised Local Maximum Filtering. Remote Sens. Environ. 2021, 258, 112397. [Google Scholar] [CrossRef]
  52. Santos, A.A.; dos Marcato Junior, J.; Araújo, M.S.; Di Martini, D.R.; Tetila, E.C.; Siqueira, H.L.; Aoki, C.; Eltner, A.; Matsubara, E.T.; Pistori, H.; et al. Assessment of CNN-Based Methods for Individual Tree Detection on Images Captured by RGB Cameras Attached to UAVs. Sensors 2019, 19, 3595. [Google Scholar] [CrossRef] [PubMed] [Green Version]
  53. Zucon, A.R.S.; Hawkes, B.; Lemos, C.; Batistuzzo, G.Z.B.; Hakamada, R.; Pontes, G.R.; de Freitas, T.U.; de Bazani, J.H.; Alvares, C.A.; Junior, J.C.A.; et al. Use of Unmanned Aerial Vehicle Images as a Tool to Evaluate Stand Uniformity in Clonal Eucalyptus Plantations. In Proceedings of the Anais XVII Simpósio Brasileiro de Sensoriamento Remoto—SBSR, João Pessoa, PB, Brasil, 25–29 April 2015; INPE. [Google Scholar]
  54. Hakamada, R.E.; Stape, J.L.; Lemos, C.C.Z.; de Almeida, A.E.A.; Silva, L.F. Uniformidade entre árvore durante uma rotaçao como a productividade em Eucalyptus clonais. CERNE 2015, 21, 465–472. [Google Scholar] [CrossRef] [Green Version]
  55. Hentz, Â.M.K.; Silva, C.A.; Dalla Corte, A.P.; Netto, S.P.; Strager, M.P.; Klauberg, C. Estimating Forest Uniformity in Eucalyptus Spp. and Pinus taeda L. Stands Using Field Measurements and Structure from Motion Point Clouds Generated from Unmanned Aerial Vehicle (UAV) Data Collection. For. Syst. 2018, 27, e005. [Google Scholar] [CrossRef]
  56. Roussel, J.-R.; Caspersen, J.P.; Béland, M.; Thomas, S.C.; Achim, A. Removing Bias from LiDAR-Based Estimates of Canopy Height: Accounting for the Effects of Pulse Density and Footprint Size. Remote Sens. Environ. 2017, 198, 1–16. [Google Scholar] [CrossRef]
  57. Hyyppä, J.; Inkinen, M. Detecting and Estimating Attributes for Single Trees Using Laser Scanner. Photogramm. J. Finl. 1999, 16, 27–42. [Google Scholar]
  58. Hyyppä, J.; Hyyppä, H.; Litkey, P.; Yu, X.; Haggrén, H.; Rönnholm, P.; Pyysalo, U.; Pitkänen, J.; Maltamo, M. Algorithms and Methods of Airborne Laser Scanning for Forest Measurements. Int. Arch. Photogramm. Remote Sens. Spat. Inf. Sci. 2004, 36, 82–89. [Google Scholar]
  59. Hyyppä, E.; Yu, X.; Kaartinen, H.; Hakala, T.; Kukko, A.; Vastaranta, M.; Hyyppä, J. Comparison of Backpack, Handheld, Under-Canopy UAV, and Above-Canopy UAV Laser Scanning for Field Reference Data Collection in Boreal Forests. Remote Sens. 2020, 12, 3327. [Google Scholar] [CrossRef]
  60. Popescu, S.C.; Wynne, R.H.; Nelson, R.F. Estimating Plot-Level Tree Heights with Lidar: Local Filtering with a Canopy-Height Based Variable Window Size. Comput. Electron. Agric. 2002, 37, 71–95. [Google Scholar] [CrossRef]
  61. Persson, Å.; Holmgren, J.; Söderman, U. Detecting and Measuring Individual Trees Using an Airborne LIDAR. Photogramm. Eng. Remote Sens. 2002, 68, 925–932. [Google Scholar]
  62. Leckie, D.; Gougeon, F.; Hill, D.; Quinn, R.; Armstrong, L.; Shreenan, R. Combined High-Density Lidar and Multispectral Imagery for Individual Tree Crown Analysis. Can. J. Remote. Sens. 2003, 29, 633–649. [Google Scholar] [CrossRef]
  63. Zarco-Tejada, P.J.; Diaz-Varela, R.; Angileri, V.; Loudjani, P. Tree Height Quantification Using Very High Resolution Imagery Acquired from an Unmanned Aerial Vehicle (UAV) and Automatic 3D Photo-Reconstruction Methods. Eur. J. Agron. 2014, 55, 89–99. [Google Scholar] [CrossRef]
  64. Merino, A.; Balboa, M.A.; Rodríguez Soalleiro, R.; González, J.G.Á. Nutrient Exports under Different Harvesting Regimes in Fast-Growing Forest Plantations in Southern Europe. For. Ecol. Manag. 2005, 207, 325–339. [Google Scholar] [CrossRef]
  65. McGaughey, R.J. FUSION/LDV: Software for LiDAR Data Analysis and Visualization; Version 3.01; US Department of Agriculture, Forest Service, Pacific Northwest Research Station, University of Washington: Seattle, WA, USA, 2012.
  66. Conrad, O.; Bechtel, B.; Bock, M.; Dietrich, H.; Fischer, E.; Gerlitz, L.; Wehberg, J.; Wichmann, V.; Böhner, J. System for Automated Geoscientific Analyses (SAGA) v. 2.1.4. Geosci. Model Dev. 2015, 8, 1991–2007. [Google Scholar] [CrossRef] [Green Version]
  67. Plowright, A.; Plowright, M.A. R Package ‘ForestTools.’ CRAN. 2018. Available online: https://github.com/andrew-plowright/ForestTools (accessed on 21 December 2021).
  68. Roussel, J.-R.; Auty, D.; Coops, N.C.; Tompalski, P.; Goodbody, T.R.H.; Meador, A.S.; Bourdon, J.-F.; de Boissieu, F.; Achim, A. LidR: An R Package for Analysis of Airborne Laser Scanning (ALS) Data. Remote Sens. Environ. 2020, 251, 112061. [Google Scholar] [CrossRef]
  69. Silva, C.A.; Hudak, A.T.; Vierling, L.A.; Loudermilk, E.L.; O’Brien, J.J.; Hiers, J.K.; Jack, S.B.; Gonzalez-Benecke, C.; Lee, H.; Falkowski, M.J.; et al. Imputation of Individual Longleaf Pine (Pinus palustris Mill.) Tree Attributes from Field and LiDAR Data. Can. J. Remote Sens. 2016, 42, 554–573. [Google Scholar] [CrossRef]
  70. Team, R.C. R: A Language and Environment for Statistical Computing; R Foundation for Statistical Computing: Vienna, Austria, 2021. [Google Scholar]
  71. Popescu, S.C.; Wynne, R.H. Seeing the Trees in the Forest: Using Lidar and Multispectral Data Fusion with Local Filtering and Variable Window Size for Estimating Tree Height. Photogramm. Eng. Remote Sens. 2004, 70, 589–604. [Google Scholar] [CrossRef] [Green Version]
  72. Meyer, F.; Beucher, S. Morphological Segmentation. J. Vis. Commun. Image Represent. 1990, 1, 21–46. [Google Scholar] [CrossRef]
  73. Li, W.; Guo, Q.; Jakubowski, M.K.; Kelly, M. A New Method for Segmenting Individual Trees from the Lidar Point Cloud. Photogramm. Eng. Remote Sens. 2012, 78, 75–84. [Google Scholar] [CrossRef] [Green Version]
  74. Goutte, C.; Gaussier, E. A Probabilistic Interpretation of Precision, Recall and F-Score, with Implication for Evaluation. In Proceedings of the Advances in Information Retrieval, Santiago de Compostela, Spain, 21–23 March 2005; Losada, D.E., Fernández-Luna, J.M., Eds.; Springer: Berlin/Heidelberg, Germany, 2005; pp. 345–359. [Google Scholar]
  75. Sokolova, M.; Japkowicz, N.; Szpakowicz, S. Beyond Accuracy, F-Score and ROC: A Family of Discriminant Measures for Performance Evaluation. In Proceedings of the AI 2006: Advances in Artificial Intelligence, Hobart, Australia, 4–8 December 2006; Sattar, A., Kang, B., Eds.; Springer: Berlin/Heidelberg, Germany, 2006; pp. 1015–1021. [Google Scholar]
  76. Kwak, D.-A.; Lee, W.-K.; Lee, J.-H.; Biging, G.S.; Gong, P. Detection of Individual Trees and Estimation of Tree Height Using LiDAR Data. J. For. Res. 2007, 12, 425–434. [Google Scholar] [CrossRef]
  77. Vasilescu, M.M. Standard Error of Tree Height Using Vertex III. Bulletin of the Transilvania University of Brasov. For. Wood Ind. Agric. Food Eng. Ser. II 2013, 6, 75. [Google Scholar]
  78. Wang, Y.; Lehtomäki, M.; Liang, X.; Pyörälä, J.; Kukko, A.; Jaakkola, A.; Liu, J.; Feng, Z.; Chen, R.; Hyyppä, J. Is Field-Measured Tree Height as Reliable as Believed—A Comparison Study of Tree Height Estimates from Field Measurement, Airborne Laser Scanning and Terrestrial Laser Scanning in a Boreal Forest. ISPRS J. Photogramm. Remote Sens. 2019, 147, 132–145. [Google Scholar] [CrossRef]
  79. Wu, D.; Johansen, K.; Phinn, S.; Robson, A.; Tu, Y.-H. Inter-Comparison of Remote Sensing Platforms for Height Estimation of Mango and Avocado Tree Crowns. Int. J. Appl. Earth Obs. Geoinf. 2020, 89, 102091. [Google Scholar] [CrossRef]
  80. Burt, A.; Disney, M.; Raumonen, P.; Armston, J.; Calders, K.; Lewis, P. Rapid Characterisation of Forest Structure from TLS and 3D Modelling; IEEE: Piscataway, NJ, USA, 2013; pp. 3387–3390. [Google Scholar]
  81. Erfanifard, Y.; Stereńczak, K.; Kraszewski, B.; Kamińska, A. Development of a Robust Canopy Height Model Derived from ALS Point Clouds for Predicting Individual Crown Attributes at the Species Level. Int. J. Remote Sens. 2018, 39, 9206–9227. [Google Scholar] [CrossRef]
  82. Paris, C.; Kelbe, D.; Van Aardt, J.; Bruzzone, L. A Novel Automatic Method for the Fusion of ALS and TLS LiDAR Data for Robust Assessment of Tree Crown Structure. IEEE Trans. Geosci. Remote Sens. 2017, 55, 3679–3693. [Google Scholar] [CrossRef]
  83. Dai, W.; Yang, B.; Liang, X.; Dong, Z.; Huang, R.; Wang, Y.; Li, W. Automated Fusion of Forest Airborne and Terrestrial Point Clouds through Canopy Density Analysis. ISPRS J. Photogramm. Remote Sens. 2019, 156, 94–107. [Google Scholar] [CrossRef]
  84. Jiménez-Brenes, F.M.; López-Granados, F.; de Castro, A.I.; Torres-Sánchez, J.; Serrano, N.; Peña, J.M. Quantifying Pruning Impacts on Olive Tree Architecture and Annual Canopy Growth by Using UAV-Based 3D Modelling. Plant Methods 2017, 13, 55. [Google Scholar] [CrossRef] [PubMed] [Green Version]
  85. Johansen, K.; Raharjo, T.; McCabe, M.F. Using Multi-Spectral UAV Imagery to Extract Tree Crop Structural Properties and Assess Pruning Effects. Remote Sens. 2018, 10, 854. [Google Scholar] [CrossRef] [Green Version]
  86. Di Gennaro, S.F.; Nati, C.; Dainelli, R.; Pastonchi, L.; Berton, A.; Toscano, P.; Matese, A. An Automatic UAV Based Segmentation Approach for Pruning Biomass Estimation in Irregularly Spaced Chestnut Orchards. Forests 2020, 11, 308. [Google Scholar] [CrossRef] [Green Version]
  87. Muth, C.C.; Bazzaz, F.A. Tree Canopy Displacement and Neighborhood Interactions. Can. J. For. Res. 2003, 33, 1323–1330. [Google Scholar] [CrossRef]
Figure 1. (a) Location of the four areas tested in Galicia. (b) General view of Galicia, Spain, and Europe.
Remotesensing 14 00170 g001
Figure 2. Example of visualization of the A028SAN plot. (A) Two-dimensional view on QGIS showing tree crown segmentation, point cloud height and treetops, (B) 3D view of the point cloud where each tree is represented with a different color, and (C) top view of the 3D cloud from the results of the Li2012 algorithm from the lidR package.
Remotesensing 14 00170 g002
Figure 3. Residual plots (difference between the field measured value and the estimated value through LiDAR) in the six plots analyzed.
Remotesensing 14 00170 g003
Figure 4. Absolute error (left) and percent relative error (right) for the tree height estimated directly on the LiDAR point cloud, and considering all sites, against tree height categories.
Remotesensing 14 00170 g004
Table 1. Description of the experimental (UTM coordinates: Coordinates of the upper left corner of the plot, Elevation: meters above sea level (masl), Plantation: year of plantation, Species: A026 (P. pinaster) and A028 (P. radiata)).
SiteUTM Coordinates
(X-Y)
Elevation
(m)
Plantation
(yr)
Species
Frades (FRA)556799-47667733752016A026
Santiago (SAN)540550-47505803252017A028
Dozon (DOZ)575255-47124337702017, 2018A028, A026
Begonte (BEG)609842-47759174002019A026, A028
Table 2. Descriptive statistics for the database used in this work (N, number of trees; H, total tree height; mean, average value, min, minimum, max, maximum. In the A026FRA and A028SAN plots, all trees were measured with Haglöf Sweden® Vertex).
PlotNMean H (m)Min H (m)Max H (m)
A026BEG8710.950.242.04
A028BEG7770.870.151.75
A026DOZ7761.030.362.10
A028DOZ6761.680.352.88
A026FRA *4203.701.605.70
A028SAN *9502.851.504.10
Table 3. Relative error (RE in %) of the different combinations of algorithms/plot/species/CHM resolution (ForestTools, lidR CHM-based, rLiDAR, and lidR point cloud-based, are the different algorithms evaluated. 0.1; 0.25 and 0.5 are the different resolutions (in m) of the CHM. A026 and A028 indicate plots occupied by Pinus pinaster or Pinus radiata, respectively). A negative RE value indicates that the number of trees detected is being underestimated.
RE (%)
PlotForestTools (CHM)rLiDAR (CHM)lidR (CHM)lidR (Point-Cloud)
0.10.250.50.10.250.50.10.250.5*
A026BEG−18.1−31.5−51.0−26.7−36.4−52.4−10.7−23.2−39.6−21.5
A028BEG−17.4−29.0−47.4−24.7−33.2−48.8−11.6−21.4−38.4−23.8
A026DOZ−7.0−14.6−31.4−9.5−16.0−33.6−3.5−8.5−26.4−10.4
A028DOZ−0.6−8.5−24.0−2.8−9.3−26.7−0.9−4.5−25.0−5.5
A026FRA−1.3−9.9−41.2−7.4−8.0−19.81.88.4−9.24.8
A028SAN−0.2−10.2−42.5−18.2−20.9−37.5−1.7−11.9−34.8−0.2
* In the case of point cloud-based algorithm, CHM resolution cannot be considered as a factor.
Table 4. Mean relative error (RE in %) of the different combinations of algorithms/plot/species/CHM resolution (“all sites”, refers to the average RE of all evaluated plots. “Pinus pinaster” refers only to plots occupied by P. pinaster (A026BEG; A026DOZ; A026FRA), while “Pinus radiata” refers to plots occupied only by P.radiata (A028BEG; A028DOZ; A028SAN). A negative RE value indicates that the number of trees detected is being underestimated.
RE (%)
Mean RE (%)ForestTools (CHM)rLiDAR (CHM)lidR (CHM)lidR (Point-Cloud)
0.10.250.50.10.250.50.10.250.5*
all Sites−7.4−17.3−39.6−14.9−20.6−36.5−4.4−10.2−28.9−9.4
Pinus pinaster−8.8−18.7−41.2−14.5−20.2−35.3−4.1−7.8−25.1−9.1
Pinus radiata−6.1−15.9−38.0−15.2−21.1−37.7−4.7−12.6−32.7−9.8
* In the case of point cloud-based algorithm, CHM resolution cannot be considered as a factor.
Table 5. Evaluation of the ITD in terms of statistical measures for the case of the results obtained with the Dalponte and Coomes [42] algorithm (H(m) is mean height of the trees in the plot, r is recall, p is precision, F is overall precision and RE is relative error).
PlotH(m)rpFRE (%)
A026BEG0.950.8850.9990.939−10.7
A028BEG0.870.8940.9690.930−11.6
A026DOZ1.030.9480.9990.973−3.5
A028DOZ1.680.9660.9980.981−0.9
A026FRA3.700.9980.9930.9951.8
A028SAN2.850.9820.9970.990−1.7
Table 6. Goodness-of-fit statistics obtained from the well-identified trees by the Dalponte and Coomes [42] algorithm and their respective field-measured values (BE represents the mean bias error; RMSE represents the root mean square error, both in m).
Smoothed CHM (m)Non-Smoothed CHM (m)Point Cloud (m)
PlotBERMSEBERMSEBERMSE
A026BEG0.2710.3020.1780.205−0.1090.143
A028BEG0.2140.2420.1230.1750.0190.081
A026DOZ0.2450.2790.1120.159−0.0470.121
A028DOZ0.2570.2790.1330.163−0.1010.138
A026FRA0.2530.2900.1430.143−0.0580.151
A028SAN0.2670.3350.1430.1940.0120.189
all sites0.2510.2880.1390.173−0.0470.137
Pinus pinaster0.2430.2740.1380.180−0.0460.115
Pinus radiata0.2590.3010.1390.166−0.0490.160
Publisher’s Note: MDPI stays neutral with regard to jurisdictional claims in published maps and institutional affiliations.

