
Research on Internal Solitary Wave Detection and Analysis Based on Interferometric Imaging Radar Altimeter Onboard the Tiangong-2 Space Laboratory


Abstract
:
1. Introduction
2. Data
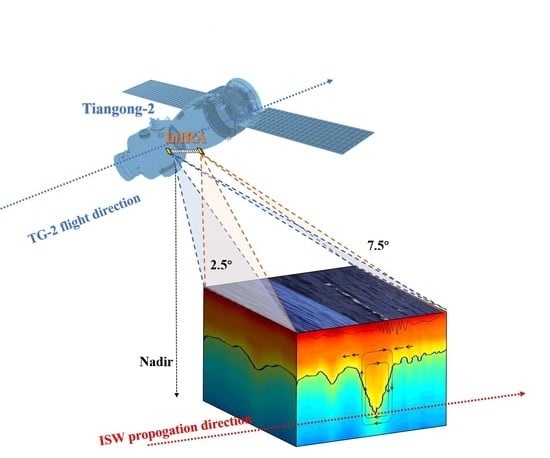
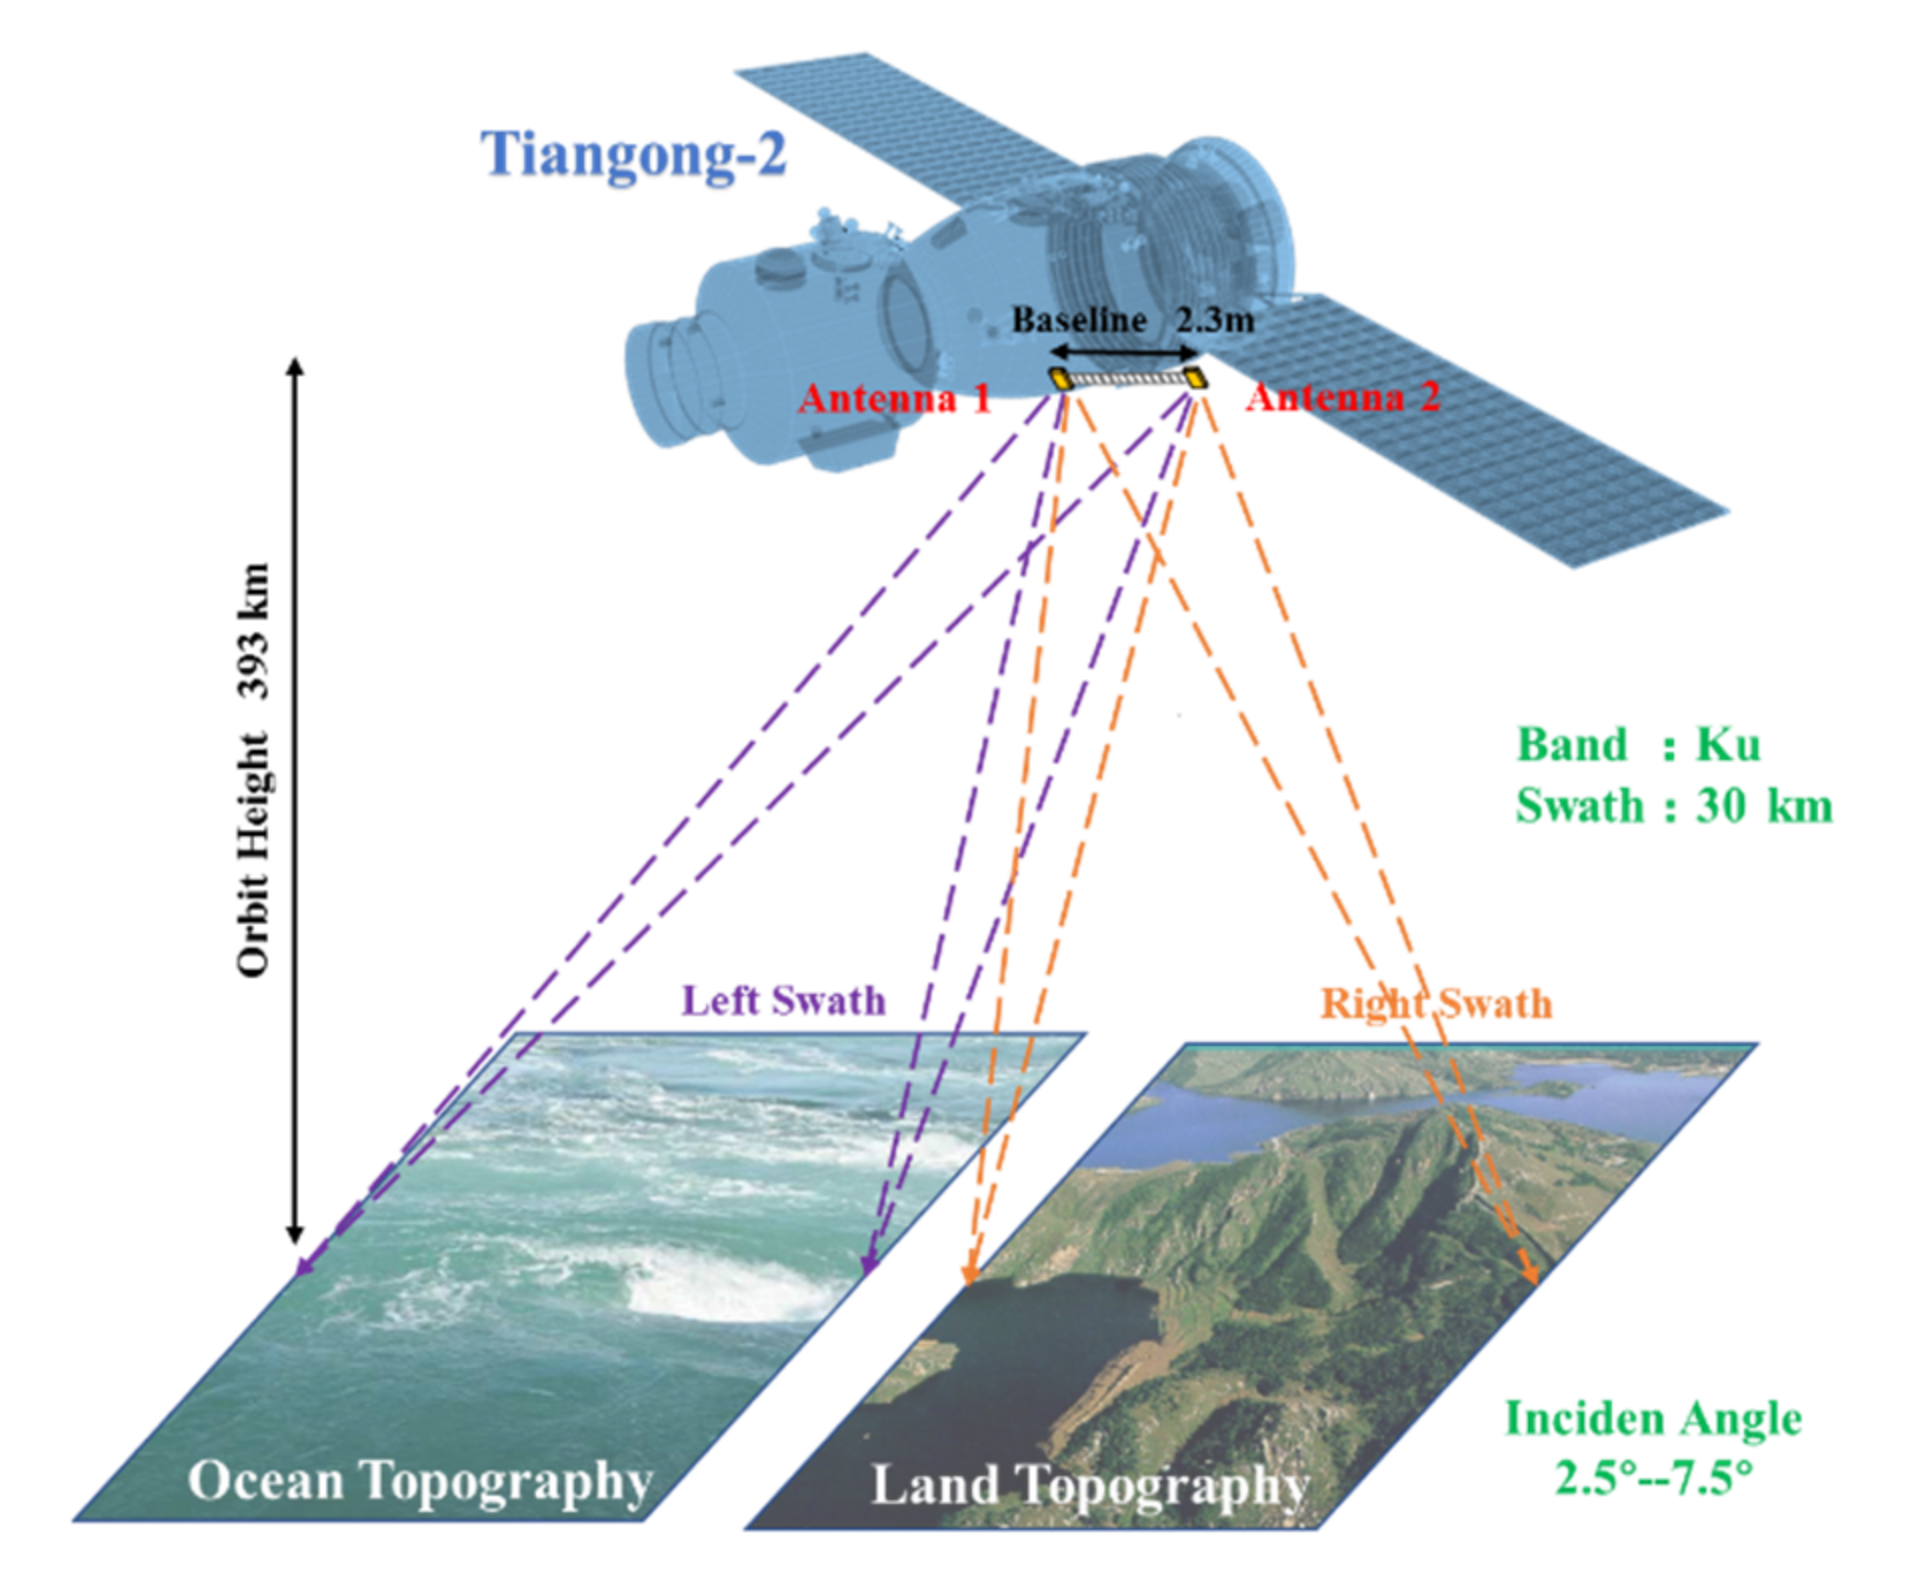
2.1. InIRA Format
2.2. Data Used
3. Internal Solitary Waves Features Acquisition
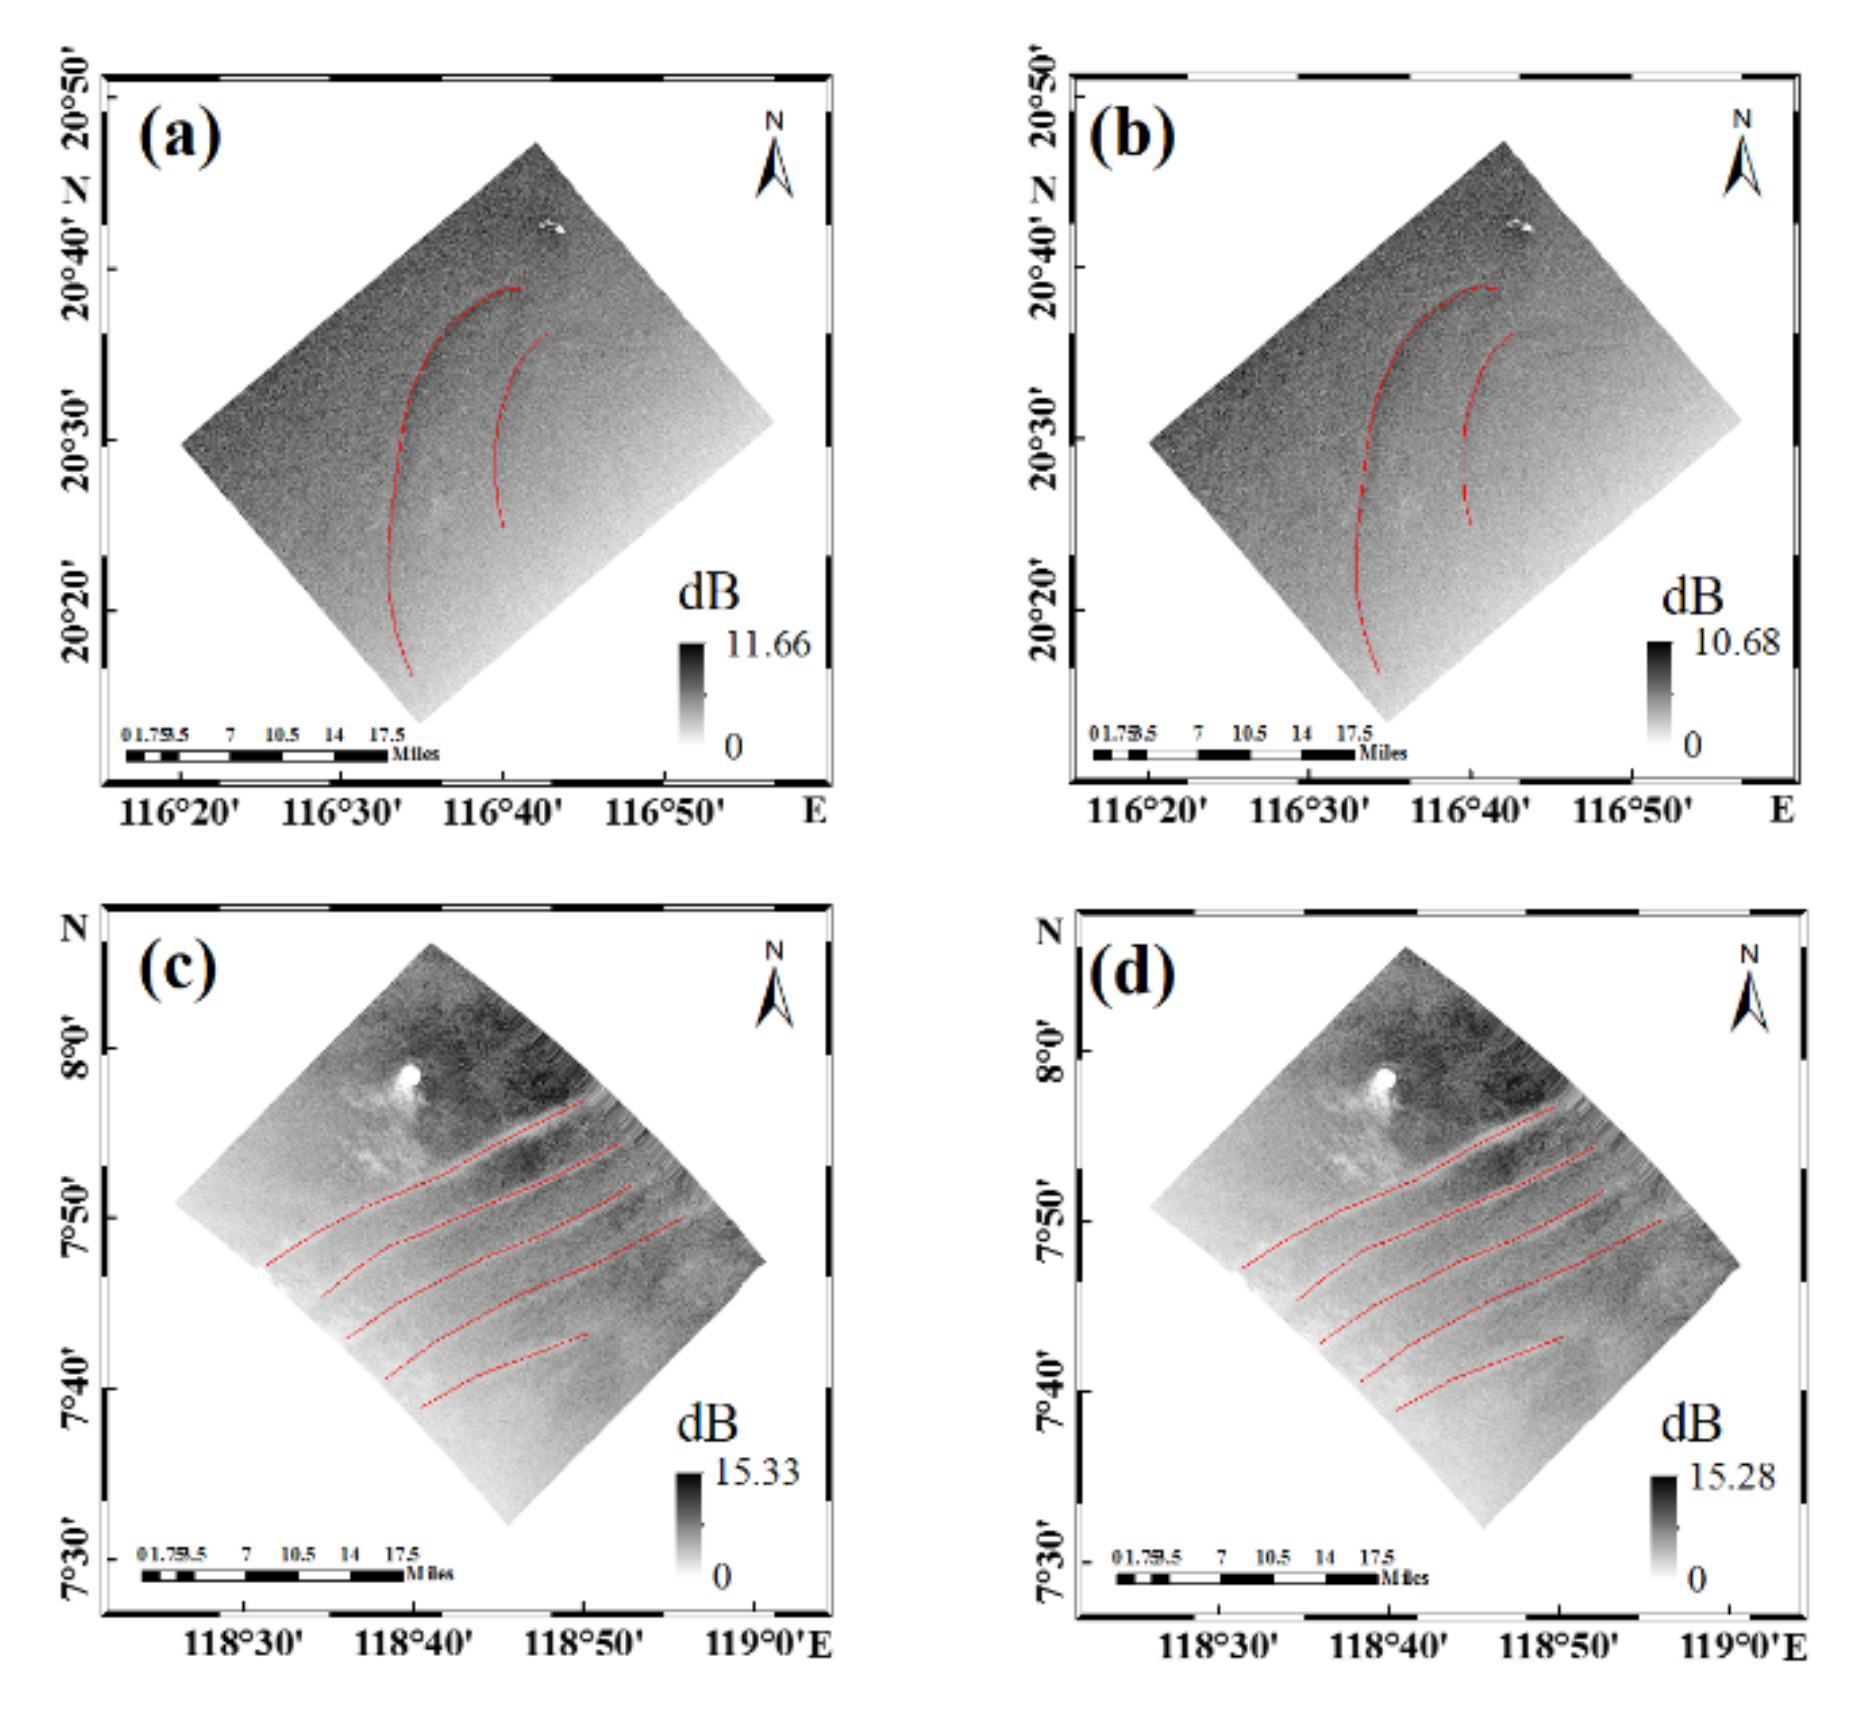
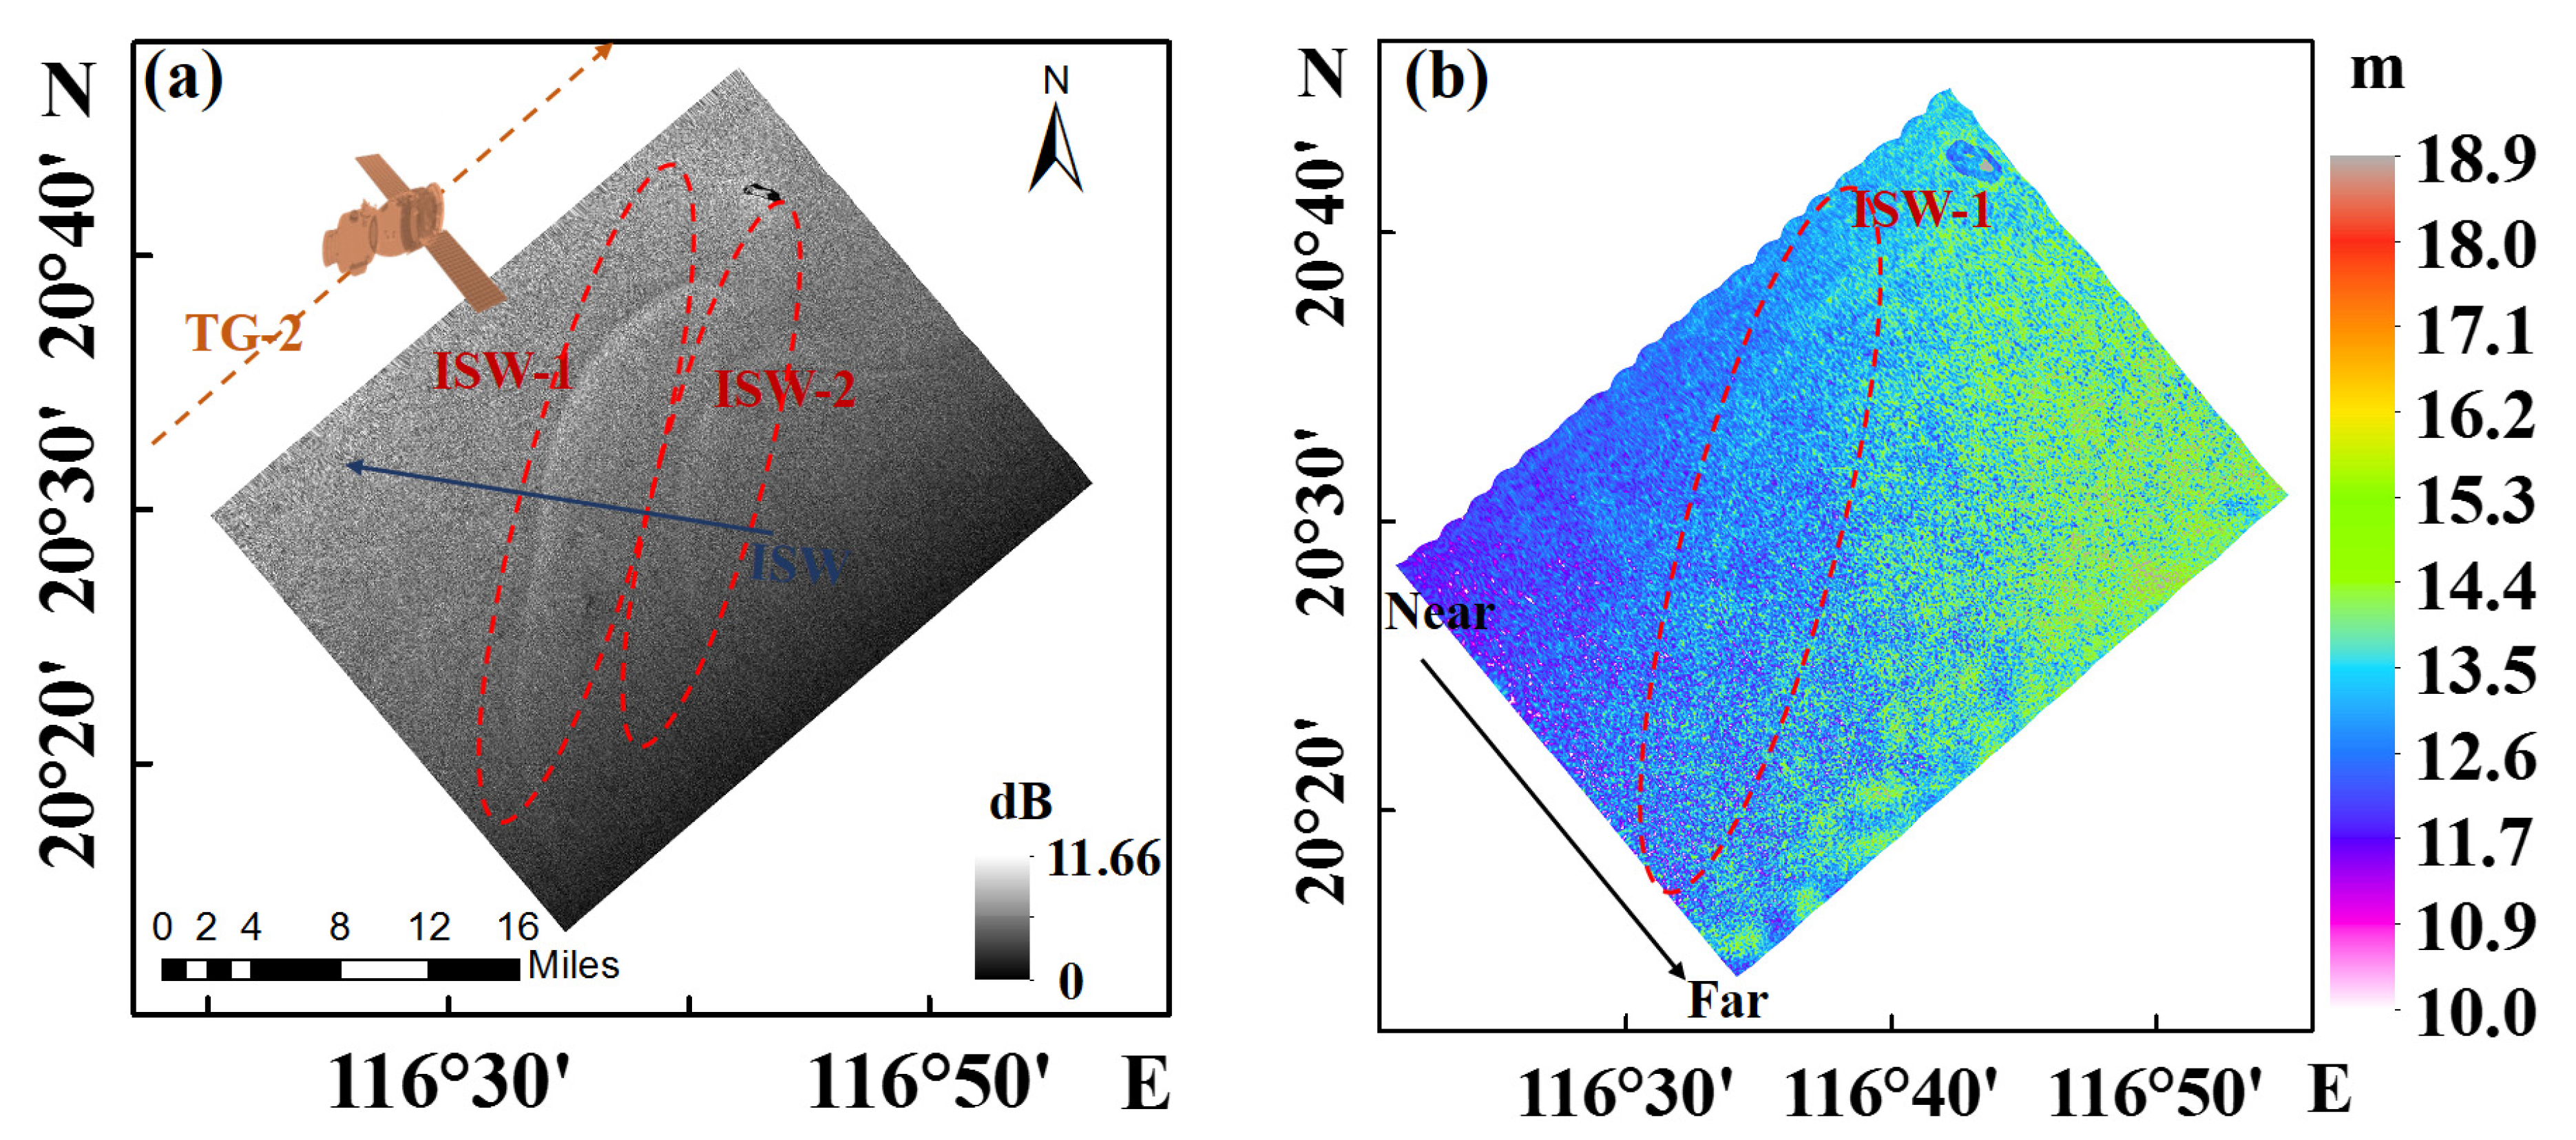
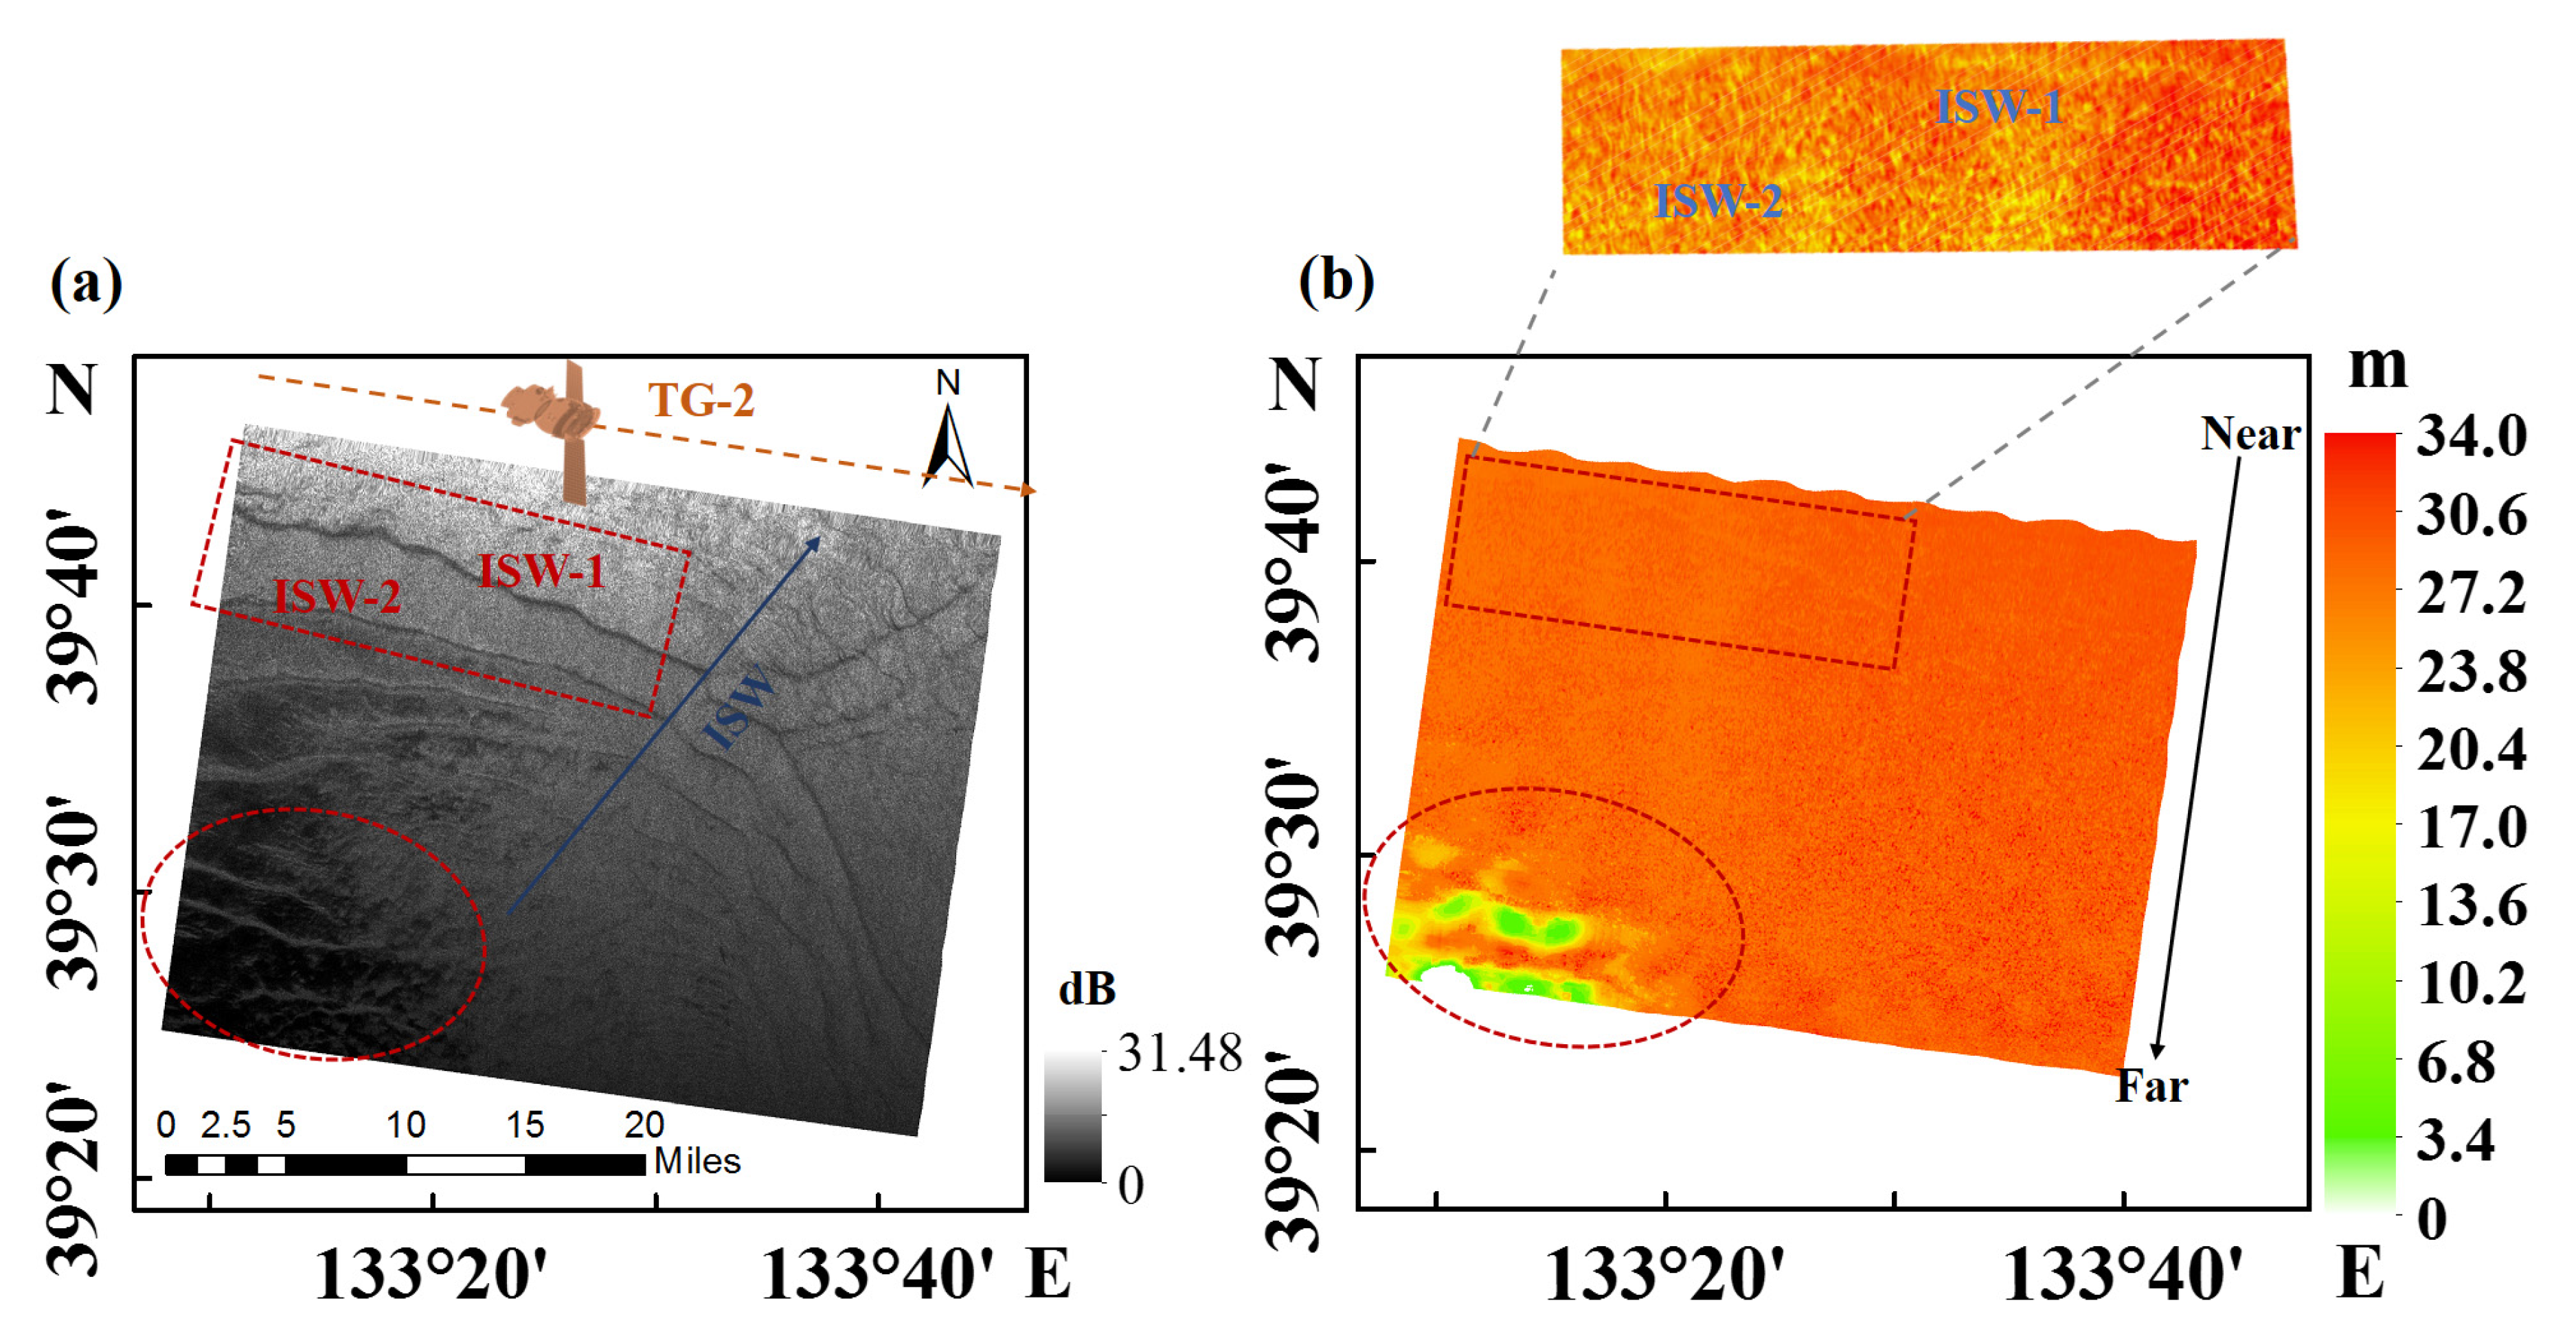
3.1. Two-Dimensional Information on the Sea Surface of ISWs
3.1.1. ISWs Crest Line Extraction
3.1.2. Contrast with Optical Remote Sensing Images
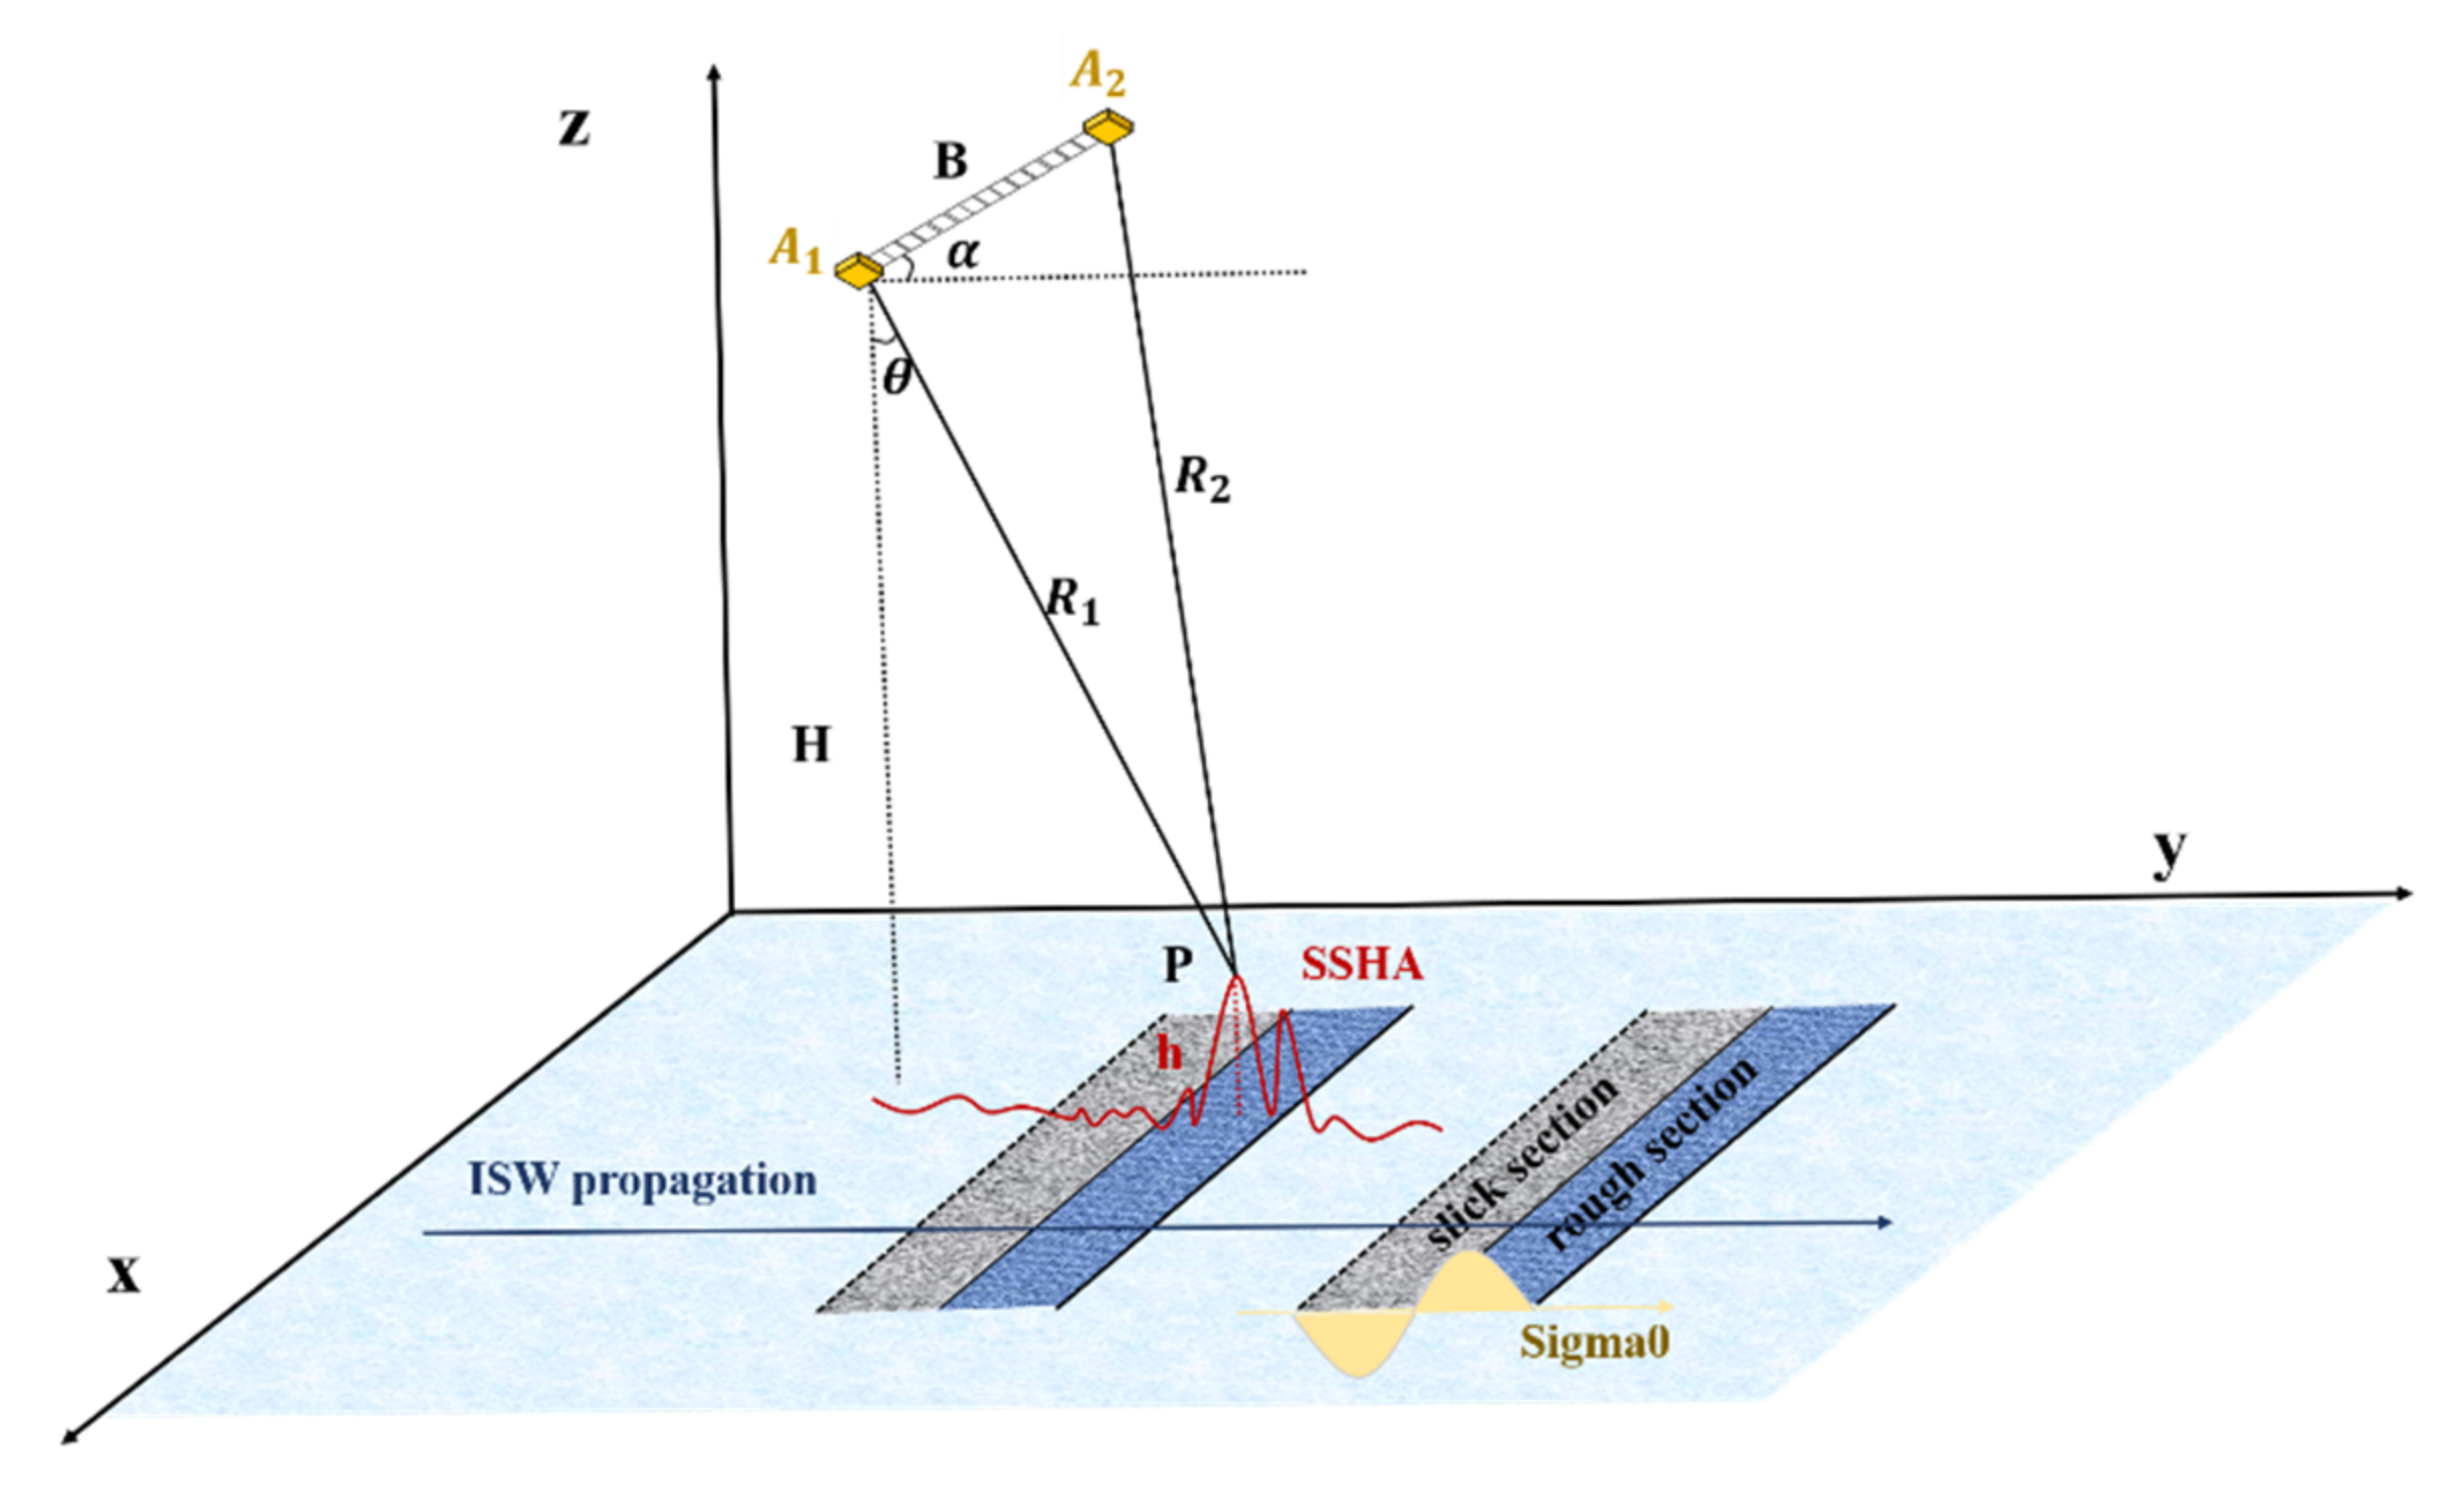
3.2. SSHA Caused by ISWs
4. Discussion
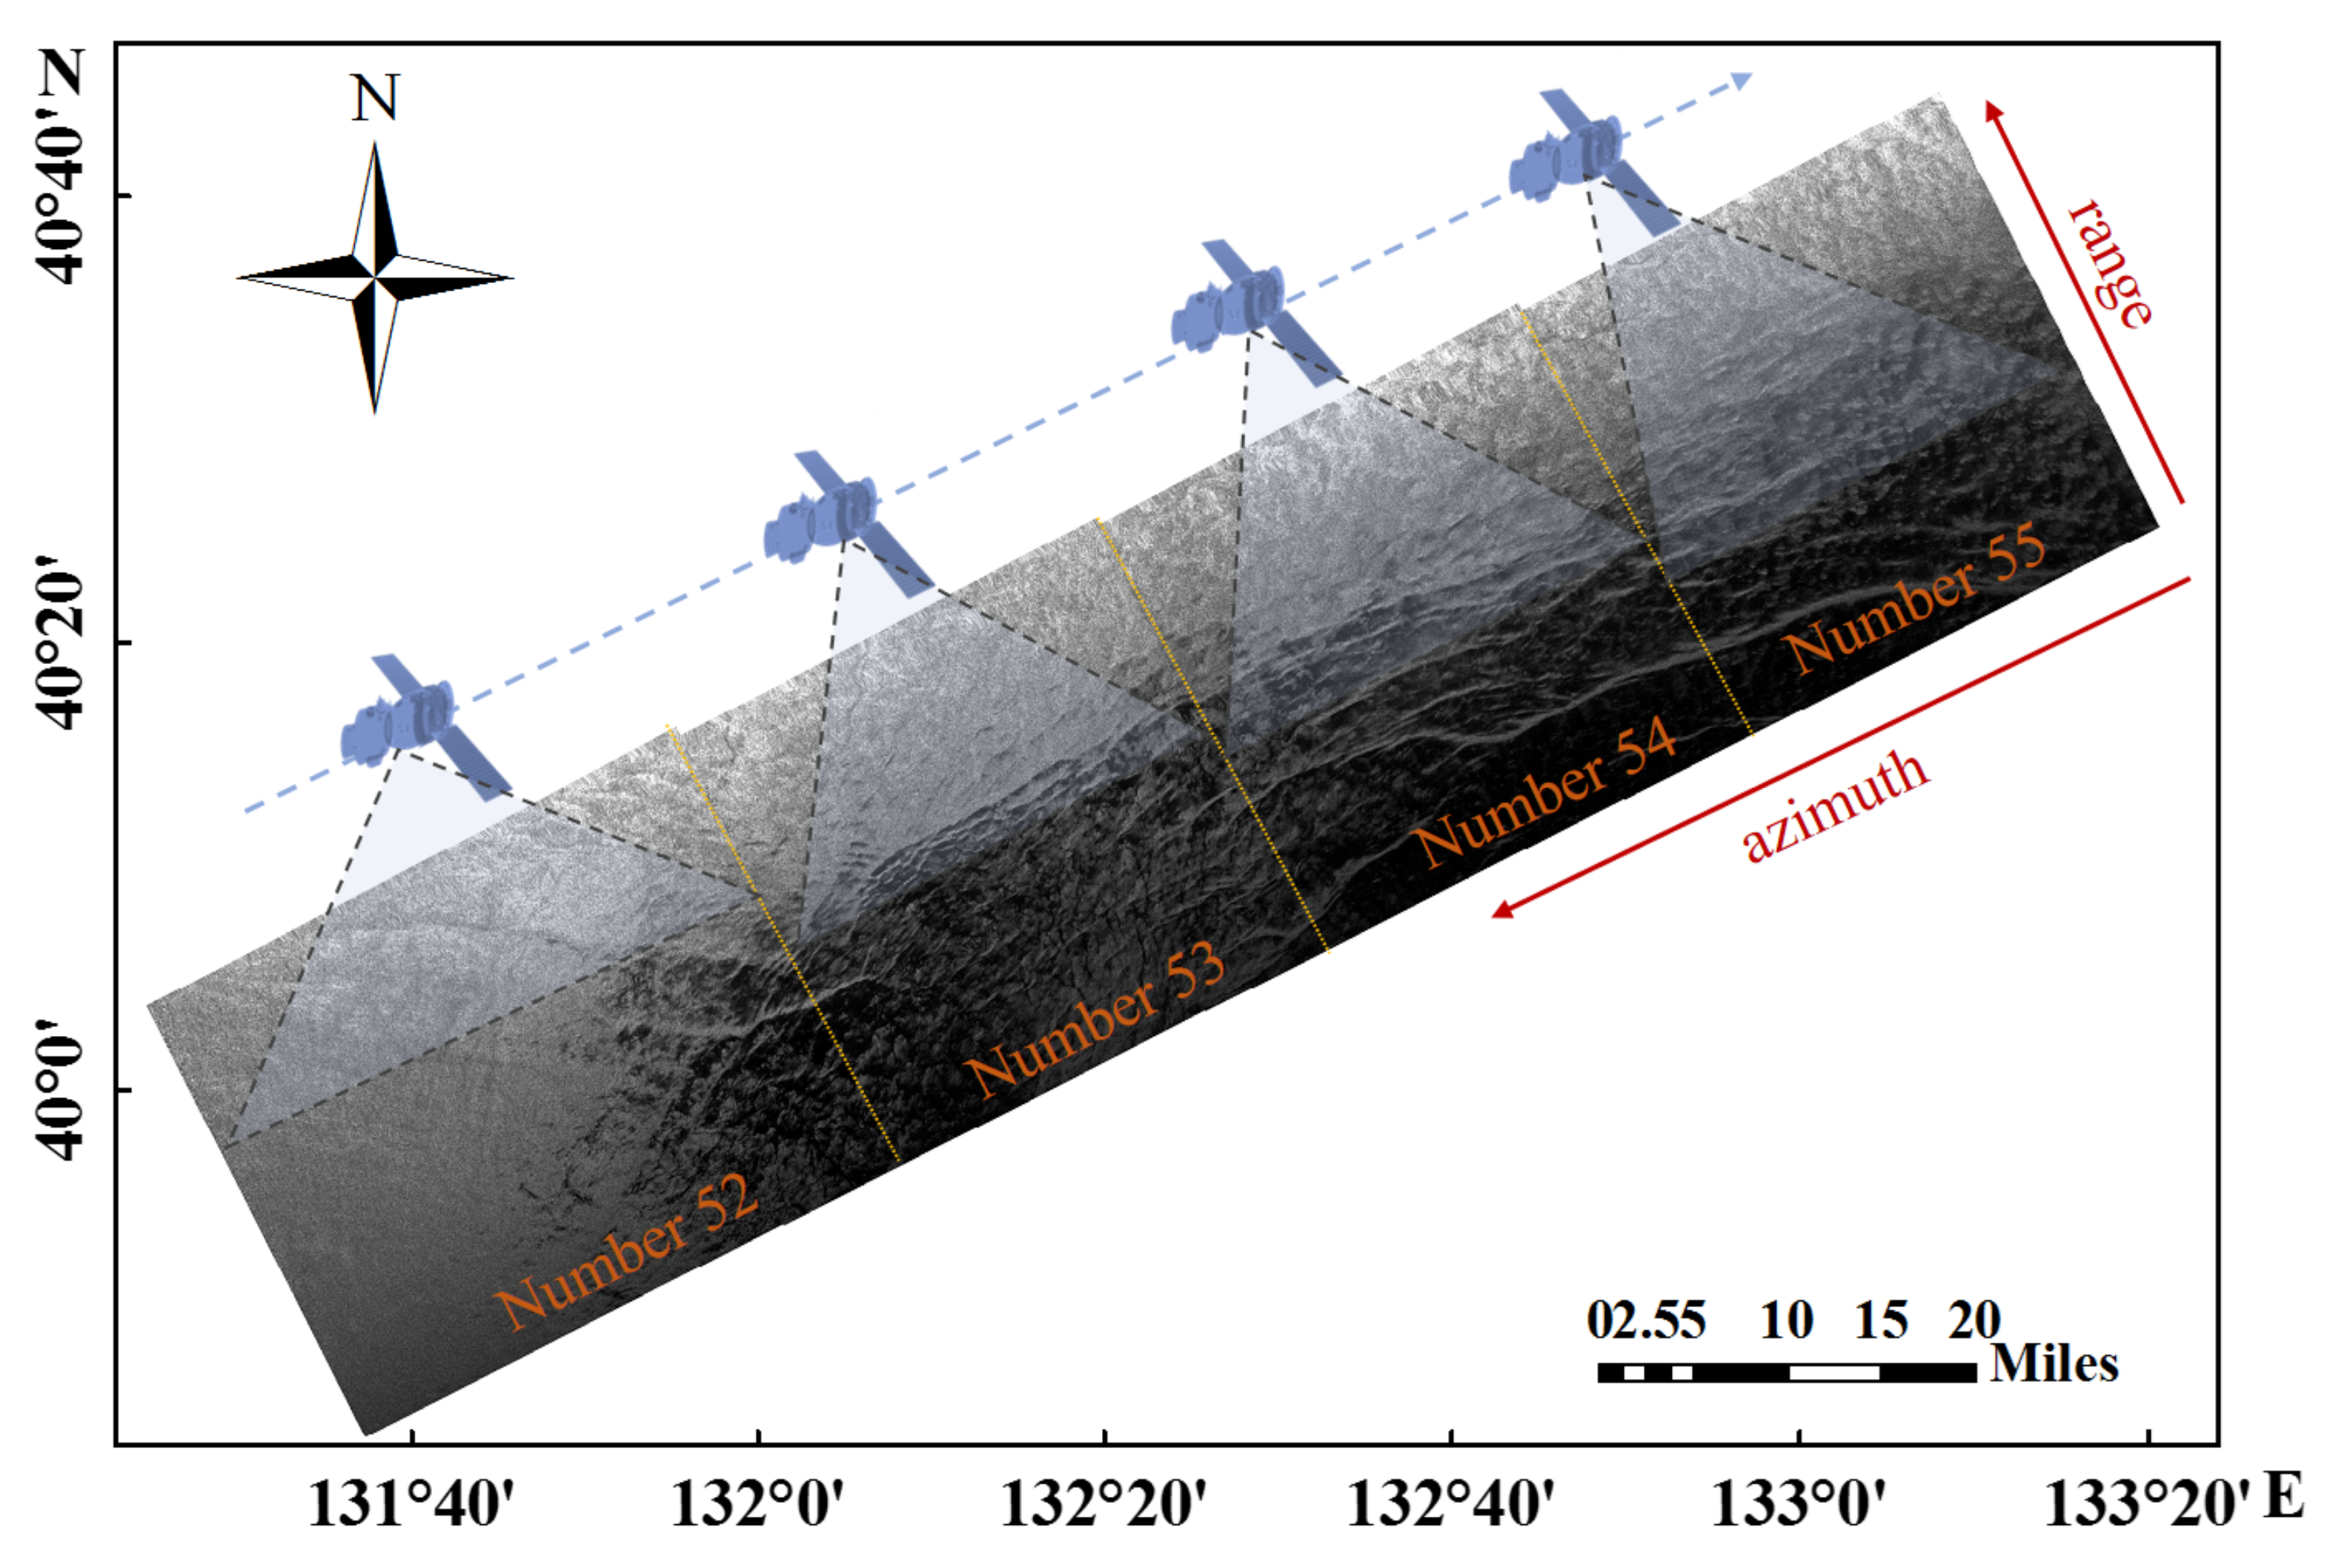
4.1. Image Coverage
4.2. Height Data Acquisition
5. Summary
Author Contributions
Funding
Institutional Review Board Statement
Informed Consent Statement
Data Availability Statement
Acknowledgments
Conflicts of Interest
References
- Gerkema, T.; Zimmerman, J. An Introduction to Internal Waves; Lecture Notes; Royal NIOZ: Texel, The Netherlands, 2008; pp. 12–14. [Google Scholar]
- Huang, X.D.; Chen, Z.H.; Zhao, W.; Zhang, Z.W.; Zhou, C.; Yang, Q.X.; Tian, J.W. An extreme internal solitary wave event observed in the northern South China Sea. Sci. Rep. 2016, 6, 30041. [Google Scholar] [CrossRef] [PubMed] [Green Version]
- Ramp, S.R.; Tang, T.Y.; Duda, T.F.; Lynch, J.F.; Liu, A.K.; Chiu, C.-S.; Bahr, F.L.; Kim, H.-R.; Yang, Y.-J. Internal solitons in the northeastern South China Sea. Part I: Sources and deep water propagation. IEEE J. Oceanic. Eng. 2004, 29, 1157–1181. [Google Scholar] [CrossRef]
- Bai, X.L.; Liu, Z.Y.; Li, X.F.; Chen, Z.Z.; Hu, J.Y.; Sun, Z.Y.; Zhu, J. Observations of high-frequency internal waves in the southern Taiwan Strait. J. Coastal. Res. 2013, 29, 1413–1419. [Google Scholar] [CrossRef]
- Jackson, C. Internal wave detection using the Moderate Resolution Imaging Spectroradiometer (MODIS). J. Geophys. Res. Oceans 2007, 112, 4220–4239. [Google Scholar] [CrossRef] [Green Version]
- Zheng, Q.A.; Susanto, R.D.; Ho, C.-R.; Song, Y.T.; Xu, Q. Statistical and dynamical analyses of generation mechanisms of solitary internal waves in the northern South China Sea. J. Geophys. Res. Oceans 2007, 112, C03021. [Google Scholar] [CrossRef]
- Sun, L.N.; Zhang, J.; Meng, J.M. A study of the spatial-temporal distribution and propagation characteristics of internal waves in the Andaman Sea using MODIS. Acta Oceanol. Sin. 2019, 38, 121–128. [Google Scholar] [CrossRef]
- Alpers, W.; Wang-Chen, H.; Hock, L. Observation of internal waves in the Andaman Sea by ERS SAR. In Proceedings of the IEEE International Geoscience and Remote Sensing Symposium Proceedings, Singapore, 3–8 August 1997; pp. 1518–1520. [Google Scholar] [CrossRef]
- Schuler, D.L.; Jansen, R.W.; Lee, J.S.; Kasilingam, D. Polarisation orientation angle measurements of ocean internal waves and current fronts using polarimetric SAR. IEE P-Radar Son Nav. 2003, 150, 135–143. [Google Scholar] [CrossRef]
- Karang, I.W.G.A.; Nishio, F. Internal waves in the Lombok Strait revealed by ALOS PALSAR images. In Proceedings of the 2011 IEEE International Geoscience and Remote Sensing Symposium, Vancouver, BC, Canada, 24–29 July 2011; pp. 253–256. [Google Scholar] [CrossRef]
- Kozlov, I.; Romanenkov, D.; Zimin, A.; Chapron, B. SAR observing large-scale nonlinear internal waves in the White Sea. Remote Sens. Environ. 2014, 147, 99–107. [Google Scholar] [CrossRef] [Green Version]
- Zhang, J.; Zhang, X.; Fan, C.Q.; Meng, J.M. Discussion on application of polarimetric synthetic aperture radar in marine surveillance. J. Radars. 2016, 5, 596–606. [Google Scholar] [CrossRef]
- Kozlov, I.E.; Zubkova, E.V.; Kudryavtsev, V.N. Internal solitary waves in the Laptev Sea: First results of spaceborne SAR observations. IEEE Geosci. Remote Sens. Lett. 2017, 14, 2047–2051. [Google Scholar] [CrossRef]
- Ning, J.; Sun, L.N.; Cui, H.J.; Lu, K.X.; Wang, J. Study on characteristics of internal solitary waves in the Malacca Strait based on Sentinel-1 and GF-3 satellite SAR data. Acta Oceanol. Sin. 2020, 39, 151–156. [Google Scholar] [CrossRef]
- Chong, J.S.; Zhou, X.Z. Survey of study on internal waves detection in synthetic aperture radar image. J. Radars. 2013, 2, 406–421. [Google Scholar] [CrossRef]
- Magalhaes, J.M.; da Silva, J.C.B. Satellite altimetry observations of large-scale internal solitary waves. IEEE Geosci. Remote Sens. Lett. 2017, 14, 534–538. [Google Scholar] [CrossRef]
- Stammer, D. Global characteristics of ocean variability estimated from regional TOPEX/POSEIDON altimeter measurements. J. Phys. Oceanogr. 1997, 27, 1743–1769. [Google Scholar] [CrossRef]
- Traon, P.Y.L.; Nadal, F.; Ducet, N. An improved mapping method of multisatellite altimeter data. J. Atmos. Ocean Technol. 1998, 15, 522–534. [Google Scholar] [CrossRef]
- Nerem, R.S.; Chambers, D.P.; Choe, C.; Mitchum, G.T. Estimating mean sea level change from the TOPEX and Jason altimeter missions. Mar. Geod. 2010, 33, 435–446. [Google Scholar] [CrossRef]
- Donlon, C.; Berruti, B.; Buongiorno, A.; Ferreira, M.-H.; Féménias, P.; Frerick, J.; Goryl, P.; Klein, U.; Laur, H.; Mavrocordatos, C.; et al. The global monitoring for environment and security (GMES) Sentinel-3 mission. Remote Sens. Environ. 2012, 120, 37–57. [Google Scholar] [CrossRef]
- Ray, C.; Martin-Puig, C.; Clarizia, M.P.; Ruffini, G.; Dinardo, S.; Gommenginger, C.; Benveniste, J. SAR altimeter backscattered waveform model. IEEE Trans. Geosci. Remote Sens. 2015, 53, 911–919. [Google Scholar] [CrossRef]
- Zhang, Y.H.; Jiang, J.S.; Zhang, H.Y.; Zhang, D.H. Spaceborne imaging altimeter for topographic mapping. In Proceedings of the IEEE 2000 International Geoscience and Remote Sensing Symposium, Honolulu, HI, USA, 24–28 July 2000; pp. 2349–2351. [Google Scholar] [CrossRef]
- Dong, X.; Zhang, Y.H.; Zhai, W.S. Design and algorithms of the Tiangong-2 interferometric imaging radar altimeter processor. In Proceedings of the 2017 Progress In Electromagnetics Research Symposium—Spring (PIERS), St. Petersburg, Russia, 22–25 May 2017; pp. 3802–3803. [Google Scholar] [CrossRef]
- Zhang, Y.H.; Shi, X.J.; Wang, H.J.; Tan, Y.Y.; Zhai, W.S.; Dong, X.; Kang, X.Y.; Yang, Q.S.; Li, D.; Jiang, J.S. Interferometric imaging radar altimeter on board Chinese Tiangong-2 space laboratory. In Proceedings of the 2018 Asia-Pacific Microwave Conference (APMC), Kyoto, Japan, 6–9 November 2018; pp. 851–853. [Google Scholar] [CrossRef]
- Fu, L.-L.; Alsdorf, D.; Rodriguez, E.; Morrow, R.; Mognard, N.; Lambin, J.; Vaze, P.; Lafon, T. The SWOT (Surface Water and Ocean Topography) Mission: Spaceborne radar interferometry for oceanographic and hydrological applications. In Proceedings of the OceanObs’09: Sustained Ocean Observations and Information for Society, Venice, Italy, 21–25 September 2009. [Google Scholar]
- Durand, M.; Fu, L.-L.; Lettenmaier, D.P.; Alsdorf, D.E.; Rodriguez, E.; Esteban-Fernandez, D. The Surface Water and Ocean Topography Mission: Observing terrestrial surface water and oceanic submesoscale eddies. Proc. IEEE 2010, 98, 766–779. [Google Scholar] [CrossRef]
- Zhang, X.D.; Zhang, J.; Fan, C.Q.; Wang, J.; Meng, J.M. Observations of internal waves with high sampling data of radar altimetry and MODIS images. Int. J. Remote Sens. 2018, 39, 7405–7416. [Google Scholar] [CrossRef]
- Santos-Ferreira, A.M.; da Silva, J.C.B.; Magalhaes, J.M. SAR mode altimetry observations of internal solitary waves in the tropical ocean Part 1: Case studies. Remote Sens. 2018, 10, 644–657. [Google Scholar] [CrossRef] [Green Version]
- Zhang, X.D.; Zhang, J.; Meng, J.M.; Fan, C.Q.; Wang, J. Observation of internal waves with OLCI and SRAL on board Sentinel-3. Acta Oceanol. Sin. 2020, 39, 56–62. [Google Scholar] [CrossRef]
- Santos-Ferreira, A.M.; da Silva, J.C.B. Can we retrieve internal soliton amplitudes in the ocean with SAR altimetry? What would this be good for? In Proceedings of the 2020 IEEE International Geoscience and Remote Sensing Symposium, Waikoloa, HI, USA, 26 September–2 October 2020; pp. 3525–3528. [Google Scholar] [CrossRef]
- da Silva, J.C.B.; Santos-Ferreira, A.M.; Rieu, P.; Moreau, T.; Borde, F.; Boy, F.; Maraldi, C.; Picot, N.; Donlon, C. Detection of internal solitary waves with conventional and advanced SAR altimetry processing methods: Preliminary results. In Proceedings of the 2020 IEEE International Geoscience and Remote Sensing Symposium, Waikoloa, HI, USA, 26 September–2 October 2020; pp. 3521–3524. [Google Scholar] [CrossRef]
- Zhang, Y.H.; Xu, K.; Li, M.T.; Li, J.; Liu, H.G.; Wang, X.Z. Study on spaceborne topography mapping altimeter. Remote Sens Technol. Appl. 1999, 14, 11–14. [Google Scholar] [CrossRef]
- Yang, J.S.; Ren, L.; Zheng, G. The first quantitative remote sensing of the ocean by Interferometric Imaging Radar Altimeter onboard the Tiangong-2. Haiyang Xuebao 2017, 39, 129–130. [Google Scholar] [CrossRef]
- Kong, W.Y.; Chong, J.S.; Tan, H. Performance analysis of ocean surface topography altimetry by Ku-Band near-nadir interferometric SAR. Remote Sens. 2017, 9, 933–947. [Google Scholar] [CrossRef] [Green Version]
- Bao, Q.L.; Yin, X.B.; Zou, J.H.; Lin, M.I.; Zhang, Y.G.; Zhang, Y.H. The wind speed inversion and in-orbit assessment of imaging altimeter on Tiangong-2 space station. In Proceedings of the 2018 IEEE International Geoscience and Remote Sensing Symposium, Valencia, Spain, 22–27 July 2018; pp. 1005–1008. [Google Scholar] [CrossRef]
- Ren, L.; Yang, J.S.; Jia, Y.J.; Dong, X.; Wang, J.; Zheng, G. Sea surface wind speed retrieval and validation of the interferometric imaging radar altimeter aboard the Chinese Tiangong-2 space laboratory. IEEE J. Sel. Top. Appl. Earth Observ. Remote Sens. 2018, 11, 4718–4724. [Google Scholar] [CrossRef]
- Liu, K.; Zhou, Z.Z.; Wan, X.; Hei, B.Q.; Xiong, S.P.; Wu, C.Y. Deep learning network integrated multi-spectral data and interferometric imaging radar altimeter data of Tiangong-2 for land use classification. In Proceedings of the Tiangong-2 Remote Sensing Application Conference; Springer: Singapore, 2019; pp. 232–240. [Google Scholar] [CrossRef]
- Shi, X.J.; Dong, X.; Yang, J.F.; Zhang, Y.H. Study on water information extraction method based on Tiangong-2 interferometric imaging radar altimeter data. In Proceedings of the 2019 Photonics Electromagnetics Research Symposium, Xiamen, China, 17–20 December 2019; pp. 1322–1326. [Google Scholar] [CrossRef]
- Wang, Y.H.; Kong, W.Y.; Chong, J.S. Preliminary study of oceanic eddies detected by Tiangong-2 interferometric imaging radar altimeter. In Proceedings of the Tiangong-2 Remote Sensing Application Conference; Springer: Singapore, 2019; pp. 323–332. [Google Scholar] [CrossRef]
- Ren, L.; Yang, J.S.; Dong, X.; Jia, Y.J.; Zhang, Y.H. Preliminary significant wave height retrieval from interferometric imaging radar altimeter aboard the Chinese Tiangong-2 space laboratory. Remote Sens. 2021, 13, 2413–2428. [Google Scholar] [CrossRef]
- Bai, X.L.; Liu, Z.Y.; Li, X.F.; Hu, J.J. Generation sites of internal solitary waves in the southern Taiwan Strait revealed by MODIS true-colour image observations. Int. J. Remote Sens. 2014, 35, 4086–4098. [Google Scholar] [CrossRef]
- Sun, L.N.; Zhang, J.; Meng, J.M. Analysis of spatio-temporal distribution of internal solitary waves in the South China Sea and Sulu Sea (2010–2015). Adv. Mar. Sci. 2019, 37, 398–408. [Google Scholar] [CrossRef]
- Davis, K.A.; Arthur, R.S.; Reid, E.C.; Rogers, J.S.; Fringer, O.B.; DeCarlo, T.M.; Cohen, A.L. Fate of internal waves on a shallow shelf. J. Geophys. Res. Oceans 2020, 125, C015377. [Google Scholar] [CrossRef]
- da Silva, J.C.B.; Cerqueira, A.L.F. A note on radar altimeter signatures of internal solitary waves in the ocean. In Remote Sensing of the Ocean, Sea Ice, Coastal Waters, and Large Water Regions 2016; SPIE Digital Library: Edinburgh, UK, 2016; pp. 99990201–99990215. [Google Scholar] [CrossRef] [Green Version]
- de Macedo, C.R.; da Silva, J.C.B. Internal wave dark-band signatures in ALOS-PALSAR imagery revealed by the standard deviation of the co-polarized phase difference. Remote Sens. 2020, 12, 2372. [Google Scholar] [CrossRef]
- Sui, X.H.; Zhang, R.N.; Wu, F.L.; Li, Y.; Wan, X.Y. Sea surface height measuring using InSAR altimeter. Geod. Geodyn. 2017, 8, 278–284. [Google Scholar] [CrossRef]
- Li, H.Y.; Du, T.; He, Y.J. Effects of wind on the internal waves SAR images. In Proceedings of the 2005 Annual Academic Conference of Chinese Society for Oceanography, Yinchuan, China, 9–11 October 2005; pp. 16–20. [Google Scholar]


| Number | Image Information | Image Center |
|---|---|---|
| 1 | T2_IALT_RIM1_SCI_20160923131510_20160923133009 _L2_7_52_20181017215017_V200 | 131.8704°E 39.9469°N |
| 2 | T2_IALT_RIM1_SCI_20160923131510_20160923133009 _L2_7_53_20181017220822_V200 | 132.2892°E 40.0315°N |
| 3 | T2_IALT_RIM1_SCI_20160923131510_20160923133009 _L2_7_54_20181017222423_V200 | 132.7357°E 40.1357°N |
| 4 | T2_IALT_RIM1_SCI_20160923131510_20160923133009 _L2_7_55_20181017224126_V200 | 133.1813°E 40.2369°N |
| Satellite/Platform | Sensor/Data | Platform Height/Km | Incident Angle Range/° | Image Width/Km |
|---|---|---|---|---|
| TIANGONG-2 | InIRA | 380 | 2.5–7.5 | 30 |
| GF-3 | QPSI | 755 | 20–40 | 30–40 |
| ALOS-2 | StripMap | 628 | 8–30 | 50–70 |
| Sentinel-1 | StripMap | 700 | 20–45 | 80 |
| TerraSAR-X | StripMap | 515 | 20–45 | 30–50 |
| RADARSAT-2 | Standard | 798 | 20–52 | 100 |
Publisher’s Note: MDPI stays neutral with regard to jurisdictional claims in published maps and institutional affiliations. |
© 2021 by the authors. Licensee MDPI, Basel, Switzerland. This article is an open access article distributed under the terms and conditions of the Creative Commons Attribution (CC BY) license (https://creativecommons.org/licenses/by/4.0/).
Share and Cite
Zhang, H.; Fan, C.; Meng, J.; Li, S.; Sun, L. Research on Internal Solitary Wave Detection and Analysis Based on Interferometric Imaging Radar Altimeter Onboard the Tiangong-2 Space Laboratory. Remote Sens. 2022, 14, 174. https://doi.org/10.3390/rs14010174
Zhang H, Fan C, Meng J, Li S, Sun L. Research on Internal Solitary Wave Detection and Analysis Based on Interferometric Imaging Radar Altimeter Onboard the Tiangong-2 Space Laboratory. Remote Sensing. 2022; 14(1):174. https://doi.org/10.3390/rs14010174
Chicago/Turabian StyleZhang, Hao, Chenqing Fan, Junmin Meng, Shibao Li, and Lina Sun. 2022. "Research on Internal Solitary Wave Detection and Analysis Based on Interferometric Imaging Radar Altimeter Onboard the Tiangong-2 Space Laboratory" Remote Sensing 14, no. 1: 174. https://doi.org/10.3390/rs14010174
APA StyleZhang, H., Fan, C., Meng, J., Li, S., & Sun, L. (2022). Research on Internal Solitary Wave Detection and Analysis Based on Interferometric Imaging Radar Altimeter Onboard the Tiangong-2 Space Laboratory. Remote Sensing, 14(1), 174. https://doi.org/10.3390/rs14010174