Article

Quantitative Retrieval of Volcanic Sulphate Aerosols from IASI Observations

1
Laboratoire Interuniversitaire des Systèmes Atmosphériques (LISA), UMR CNRS 7583, Institut Pierre Simon Laplace (IPSL), Université Paris-Est-Créteil, Université de Paris, 94000 Créteil, France
2
Laboratoire de Météorologie Dynamique (LMD), UMR CNRS 8539, Ecole Polytechnique, Institut Pierre Simon Laplace, Ecole Normale Supérieure, Université Paris-Saclay, Sorbonne Universités, Route de Saclay, 91128 Palaiseau, France
3
National School of Engineers of Sfax, Water, Energy and Environment Laboratory L3E, University of Sfax, B.P 1173, 3021 Sfax, Tunisia
4
COMET, Atmospheric, Oceanic and Planetary Physics, University of Oxford, Clarendon Laboratory, Parks Road, Oxford OX1 3PU, UK
5
UK Research and Innovation, Science and Technology Facilities Council, Rutherford Appleton Laboratory, Chilton OX11 0QX, UK
6
Istituto Nazionale di Geofisica e Vulcanologia (INGV), OE, 95123 Catania, Italy
*
Author to whom correspondence should be addressed.
Remote Sens. 2021, 13(9), 1808; https://doi.org/10.3390/rs13091808
Submission received: 28 January 2021 / Revised: 26 March 2021 / Accepted: 13 April 2021 / Published: 6 May 2021

Abstract

:
We developed a new retrieval algorithm based on the Infrared Atmospheric Sounding Interferometer (IASI) observations, called AEROIASI-H2SO4, to measure the extinction and mass concentration of sulphate aerosols (binary solution droplets of sulphuric acid and water), with moderate random uncertainties (typically ∼35% total uncertainty for column mass concentration estimations). The algorithm is based on a self-adapting Tikhonov–Phillips regularization method. It is here tested over a moderate-intensity eruption of Mount Etna volcano (18 March 2012), Italy, and is used to characterise this event in terms of the spatial distribution of the retrieved plume. Comparisons with simultaneous and independent aerosol optical depth observations from MODIS (Moderate Resolution Imaging Spectroradiometer), SO 2 plume observations from IASI and simulations with the CHIMERE chemistry/transport model show that AEROIASI-H2SO4 correctly identifies the volcanic plume horizontal morphology, thus providing crucial new information towards the study of volcanic emissions, volcanic sulphur cycle in the atmosphere, plume evolution processes, and their impacts. Insights are given on the possible spectroscopic evidence of the presence in the plume of larger-sized particles than previously reported for secondary sulphate aerosols from volcanic eruptions.

Graphical Abstract

1. Introduction

Gaining insights into volcanic emissions is important to constrain both internal magma processes and their subsequent atmospheric evolution and impacts. Of particular interest are sulphate aerosols (binary solution droplets of sulphuric acid and water, hereafter referred to as SA) of volcanic origin that can be both directly emitted (primary SA, e.g., [1]) or produced by the conversion of primary emissions of gaseous sulphur dioxide (SO 2 ) to particles (secondary SA [2]). The conversion to secondary SA is the major chemical sink for volcanic SO 2 emissions. The produced SA are highly-reflective in the solar spectral range, and they contribute the main source of radiative forcing from volcanism [3]. Moderate- to strong-VEI (Volcanic Explosivity Index) explosive eruptions, with stratospheric injection, produce relatively long-lasting perturbations to the hemispheric to global stratospheric aerosol optical depth (AOD) and the Earth’s reflectivity in the solar spectral domain [4] and produce an important radiative imbalance with significant perturbations to the climate system. This forcing has been estimated to be −0.19 ± 0.09 Wm 2 globally, for the series of moderate-VEI stratospheric eruptions in 2000–2015 [5]. The impact on the regional radiative budget and climate of smaller-VEI tropospheric eruptions and passive degassing emissions is not yet fully understood and estimated, though it was recently suggested that, for certain volcanoes like Mount Etna, it can be significant [6]. Moreover, volcanic SA in the troposphere can degrade air quality [7], impact ecosystems through acid rain [8] and modify clouds occurrence, lifetime and properties, adding uncertainties to climate modelling [9].
The quantitative observation of volcano-emitted gas and particle species using satellite instruments is a very powerful tool to get insights into volcanic/atmospheric processes on a systematic spatio-temporal basis. At present, reliable and systematic satellite observations of volcanic emissions in the troposphere, and/or with reasonable spatiotemporal sampling and horizontal resolution, are limited to SO 2 and, at very specific conditions, other sulphur-containing and halogenated volatiles ([10] and references therein) and ash [11,12]. A partial characterisation of SA, in terms of vertical coverage and horizontal sampling, can be obtained, for episodic explosive eruptions with relatively high-altitude (upper-tropospheric–stratospheric) injections, with satellite observations looking at the limb (i.e., with a tangent look to the Earth’s atmosphere) [13], or using space-based LiDAR (Light Detection And Ranging) instruments [4]. These observations suffer from a very scarce spatio-temporal coverage and, in the case of limb observations, a very limited horizontal resolution. This is a fundamental limitation for the study of plume evolution processes and the estimation of impacts at the regional spatial scale. In addition, limb observations are not effective in the mid- to lower-troposphere and are very sensitive to the presence of clouds, so limiting the study of tropospheric eruptions and passive degassing activities. Higher spatiotemporal-resolution observations in the nadir geometry (i.e., looking downward to the Earth) would be much more adapted, in this context. Unfortunately, methods to derive quantitative information on SA from nadir-looking satellite instruments are not available at present, and nadir monitoring is limited to SA qualitative detection at very specific conditions [14,15]. Despite these limitations, it has recently been shown that high-spectral-resolution nadir infrared instruments, like the Infrared Atmospheric Sounder Interferometer (IASI), have sufficient information content to provide quantitative information on SA, based on the peculiar SA absorption features at 1170 cm 1 and 905 cm 1 [16]. In addition, it has been proven that IASI is able to identify and partially characterize given aerosol typologies [17], based on the typology-dependent extinction features provided by their refractive indices. Recently, IASI observations have been used to characterize the vertical profile of coarse aerosol particles as desert dust and its three-dimensional distribution [18].
Building on these recent advances, we have developed and we present here a new retrieval algorithm called AEROIASI-H2SO4. This algorithm allows, for the first time, the quantitative observation of the infrared SA number density and extinction, and derived mass and optical column properties, at the high horizontal resolution of nadir observations, using IASI. This algorithm is based on the AEROIASI approach, which is a self-adapting Tikhonov–Phillips regularization method, used previously for dust retrievals [18], and is here adapted to observe SA (see description, including uncertainties estimates, in Section 2). AEROIASI-H2SO4 is applied to Mount Etna’s moderate eruption of 18 March 2012. Results, along with the plume morphological comparison with collocated AOD and SO 2 retrievals from independent products and chemistry-transport modelling, are shown and discussed in Section 3. Conclusions are drawn in Section 4.

2. Data and Methods

2.1. The IASI Instrument

The IASI instrument series are on board MetOp-A -B and -C spacecrafts since 2006, 2012 and 2018, respectively. Each instrument of the series provides a near-global coverage every 12 h. The IASI is a Fourier transform spectrometer covering the 645–2760 cm 1 (3.62–15.5 μm) spectral range, with an apodized spectral resolution of 0.5 cm 1 and a noise equivalent spectral radiance (NESR) of about 20 mW/(cm 1 m 2 sr) in the spectral region of interest for this work. It offers circular foot-prints of 12 km radius spaced by 25 km at nadir and a swath of 2200 km [19]. IASI provides information on meteorological (surface temperature, temperature, humidity profiles and cloud information) and trace gases’ parameters (O 3 , CO, NH 3 and others). In addition, IASI has been used to observe coarse aerosol particles like dust [18,20] and ash [21], and to detect the presence of different kinds of other aerosols [17].
For this work, IASI Level 1c data (infrared radiance spectra) are used. These data are distributed by EUMETSAT (European Organisation for the Exploitation of Meteorological Satellites).

2.2. AEROIASI-H2SO4 Retrieval Scheme

The retrieval scheme presented in this work, hereafter referred to as AEROIASI-H2SO4, follows from the AEROIASI algorithm, previously applied to dust retrievals, described by Cuesta et al. [18] and hereafter referred to as AEROIASI-Dust. The underlying algorithm is a constrained-least-squares fit method based on an auto-adaptive Tikhonov–Phillips regularization inverse method [22]. The use of a regularization method, rather than most common climatology-based optimal-estimation approaches, is critical in this case because of the fundamental lack of climatological information for SA following a given volcanic eruption. During the iterative solution search, AEROIASI minimises the difference between modelled and measured spectra, through the following cost function, based on the Rodgers method [23]:
χ 2 = ( y F ( x ) ) T S e 1 ( y F ( x ) ) + ( x x a ) T R ( x x a )
In Equation (1), S e 1 is the noise error covariance matrix, y and F ( x ) are the measured and modeled spectra, x and x a are the state vector at iteration i and an a priori state vector, and R is an analytic regularization matrix. The ensemble of R and x a in Equation (1) provides a physical constraint to the otherwise ill-posed inverse problem. A priori information is then provided by physical constraints rather than climatology, which is more practical in the particular case of episodic processes like volcanic eruption. The radiative transfer model F used in this work is the line-by-line Karlsruhe Optimized and Precise Radiative transfer Algorithm (KOPRA) [24], using as inputs meteorological profiles and first guess of surface temperature and humidity profiles taken from ERA-Interim reanalyses of the European Center Medium Range Weather Forecast (ECMWF) [25].
The main setup of the AEROIASI-H2SO4 algorithm is summarized in Table 1.
AEROIASI-H2SO4 differs from the previous AEROIASI-Dust algorithms in three main aspects, aimed at the specific detection and attribution of infrared radiation extinction to SA (and not dust): (1) the aerosol layer extinction signature adjusted in the retrieval process is modeled on the basis of SA refractive indices; (2) the spectral micro-windows are taken in sensitive regions for SA; (3) the a priori profile and the regularization matrix are adapted to the physics of volcanic injection. These three points are further discussed in the following.
The SA particles are modeled as spherical droplets of a sulphuric acid/water binary solution. The SA refractive indices are taken from Biermann et al. [26]. For this eruption, we assume a 57% sulphuric acid (H 2 SO 4 ) mixing ratio and a mono-modal log-normal size distribution with mean radius 0.5 μm and standard deviation 0.5. Sulphuric acid mixing ratio values around 75% have been observed for stratospheric eruptions [27], while smaller values are expected for tropospheric eruptions, i.e., in situations where the availability of water vapour is larger [16]. Using ground-based Fourier Transform infrared (FTIR) spectrometric observations, Sellitto et al. [28] have found a value of 65 ± 18% for the H 2 SO 4 mixing ratio in a tropospheric SA plume observed at Masaya volcano. For the present methodology, we have then selected the closest value, 57%, in the refractive index database, to this observed mixing ratio at Masaya. To our knowledge, other similar estimations of the H 2 SO 4 mixing ratio from remote observations of tropospheric volcanic plumes are not available in the literature.
Using climatological profiles [29] (see also at: https://www.imk-asf.kit.edu/english/312.php, accessed on 20 April 2021), the spectral signatures of a large number of gas species (21: H2O, CO2, CO, O3, CH4, NO, SO2, NO2, NH3, HNO3, OH, ClO, HOCl, H2O2, PH3, COF2, H2S, HCOOH, HO2, C2H4 and CFC-12) are simulated in the forward runs of AEROIASI-H2SO4, to fit satisfactorily IASI spectra. In order to reasonably avoid interferences with water vapour and ozone, we only use IASI measurements from 20 spectral micro-windows, spectrally narrow from 0.25 to 7 cm 1 , characterised by small absorption by these two atmospheric constituents. To further limit the interference of water vapour and to provide an adjustable baseline, water vapour profiles and surface temperature are co-retrieved within AEROIASI-H2SO4. The a priori surface temperature and humidity profiles, as well as pressure and temperature profiles, are taken from ECMWF ERA-Interim reanalyses at 0.75 ° × 0.75 ° horizontal resolution, interpolated for IASI pixels. Surface emissivity is taken from a global monthly IASI-derived climatology [30]. Most of the spectral micro-windows (19 out of 20) are located in the spectral range between 830 and 980 cm 1 , to exploit the SA spectral signature linked to the undissociated sulphuric acid, present in the SA droplets, centered around 905 cm 1 and affecting a broader region, between about 850 and 950 cm 1 [16]. This spectral range, while located in a region of a strong absorption signature for SA, presents the advantage of being unaffected by the absorption features of the possibly co-existing SO 2 (which has relatively strong absorption bands between 1100 and 1200 cm 1 ). An additional spectral micro-window is around 1250 cm 1 , also in a spectral region of sensitivity to undissociated sulphuric acid absorption (even if near the edge of this sensitivity region) but outside of the mentioned SO 2 bands. This spectral micro-window provides a point for the spectral baseline linked to the surface temperature co-retrieval and proved beneficial for the overall retrieval performances of AEROIASI-H2SO4. The spectral signature of SA around 905 cm 1 was observed in IASI spectra during the Mount Etna eruption, discussed in more detail in Section 2.3 and Section 3. Figure 1 shows an example of a IASI spectrum taken in the plume associated with this event. Spectra observed by IASI and fitted by AEROIASI-H2SO4 are shown in the spectral range 800–1250 cm 1 , in panel (a). A spectrum simulated by the KOPRA model but without accounting for SA is also shown. A zoom-in in the spectral range around the SA spectral feature at 905 cm 1 is shown in panel (b). From Figure 1a,b, the presence of the spectral signature of SA in IASI spectra can be seen; it is clear how the spectra cannot be properly fitted without inclusion of the SA signature. Apart from a broad-band impact on the spectrum, the unequivocal signature of SA absorption between 850 and 950 cm 1 , due to the sulphuric acid absorption band around 905 cm 1 is also appreciable and put in evidence in panel (c). At larger wavenumbers (around 1100–1250 cm 1 ), the spectral signature of SA is also apparent, while the spectral absorption of SO 2 is also visible in the range 1100–1200 cm 1 (see the difference between the IASI spectrum, in blue, and the AEROIASI-H2SO4-fitted spectrum, in green). Even if the SO 2 absorption signature is present in the IASI spectra, this has no impact on AEROIASI-H2SO4 retrievals because AEROIASI-H2SO4 selected micro-windows are not affected by the absorption of SO 2 . Nevertheless, this spectrum shows evidence of the co-existence of SO 2 and SA. Work is ongoing to develop inversion schemes for the co-retrieval of SO 2 and SA.
Different mono-modal log-normal size distributions were tested. In Figure 1, the retrieval using a mean radius 0.50 μm and standard deviation 0.50 (panels a–c) is compared with the retrieval using a mean radius 0.20 μm and standard deviation 0.20 (panels d–f), and a mean radius 0.20 μm and standard deviation 0.50 (panels g–i). The SA spectral signature peak around 905 cm 1 is significantly wider for larger particles than smaller [16], as it is reflected by the difference e.g., of Figure 1c,i. The effect on the SA spectral signature of using size distributions with the same radii but different standard deviations seems very small, in our case (compare Figure 1f and Figure 1i). The observed signature in IASI spectra shows a significantly better consistency with the fitted spectra using larger particles (0.5 μm mean radius and 0.5 standard deviation). Spectral fitting residuals are significantly smaller for the case 0.5 μm mean radius and 0.5 standard deviation (root mean square errors, RMSE, for residuals in the interval 875–925 cm 1 , of 31.3 mW/m 2 /sr/cm 1 ), than for 0.5 μm mean radius and 0.2 standard deviation (RMSE of 36.5 mW/m 2 /sr/cm 1 , 17% larger than for 0.5 μm mean radius and 0.5 standard deviation) and for 0.2 μm mean radius and 0.2 standard deviation (RMSE of 37.5 mW/m 2 /sr/cm 1 , 20% larger than for 0.5 μm mean radius and 0.5 standard deviation). Thus, we selected the size distribution accordingly. It has to be noted that typical values of the SA mean size for aged stratospheric volcanic plumes, after nucleation and condensation have taken place, are more in the range of smaller particles (a mean radius below 0.2 μm (e.g., [27], and references therein). Previous studies have shown larger SA or other sulphate-containing particles in tropospheric volcanic plumes, e.g., with in situ observations [31]. Our results suggest that tropospheric eruptions may produce SA with relatively large size. Further systematic analyses, using satellite data, are needed to get more insight into this aspect.
To better assess the peculiar SA spectral signature detected by AEROIASI-H2SO4, we have also tested the concurrent sensitivity of IASI spectra on SA and surface temperature. Figure 2 shows the same example of AEROIASI-H2SO4 fitted spectrum within the SA plume, as for Figure 1, compared with spectra calculated with the same conditions but: (a) a colder surface temperature, (b) a SA plume at lower altitude, and (c) by removing the SA layer. Comparing these different configurations is a simple tool to test the sensitivity to both temperature and the altitude of the SA layer. As it can be seen from Figure 2b, the spectral signature of the SA layer (blue curve) has a distinct and different spectral shape with respect to the surface temperature signature (orange curve). The peculiar signature at 850–950 cm 1 (the mentioned sulphuric acid band centered around 905 cm 1 ), which is the spectroscopic basis of AEROIASI-H2SO4, cannot be explained by a possible surface temperature sensitivity. The stronger SA band centred around 1170 cm 1 is also mostly unrelated from surface temperature sensitivity spectral shape but is not used in AEROIASI-H2SO4 to avoid interferences with SO2 bands, as discussed above. The AEROIASI-H2SO4 spectral micro-window at 1250 cm 1 is at the edge of this latter SA band, where sulphuric acid absorption is significantly smaller than at 1100–1200 cm 1 . At the same time, this spectral micro-window avoids the spectral region of strong water vapour absorption, which is approximately located at wavenumbers larger than 1300 cm 1 (see also Figure 7 in [16] and inherent discussion). For this spectral micro-window, a significant sensitivity to surface temperature is found, which is intended to provide information on the baseline, as discussed above. Finally, from Figure 2b, it can be seen that the sensitivity of IASI observations to the altitude of the SA layer (yellow curve) is very limited. Thus, AEROIASI-H2SO4 is not expected to be very sensitive to SA layer altitude.
For this study, we use a vertical-constant constraint matrix R , where we do not give any altitude-dependent prior information. However, this constraint is adjusted during the iterative procedure following a Levenberg–Marquardt-type method. During the first iterations, the algorithm tries to find the SA layer altitudes and profile shapes and, in the following ones, it modulates the total AODs in order to minimize the spectral residual. Nevertheless, following the previous discussion on IASI observations to the SA plume altitude, it is important to stress that AEROIASI-H2SO4 is expected to have a quite limited vertical sensitivity. The a priori SA profile is taken as non-zero small values between 4 and 21 km altitude and zero elsewhere (see Table 1). This is intended to partially force (second term of the cost value in Equation (1)) the retrieval to a reasonable altitude range, based on previous knowledge of the injection height. Nevertheless, it has to be noted that the very large vertical interval of non-zero a priori and the constant initial vertical shape of R concur to leave a large amount of freedom to the retrieved vertical profile to adjust.
The output vector is then composed of SA particle number density profiles, water vapour profiles and surface temperature. From SA particle number density, other quantities are derived: SA extinction coefficient and mass concentration profiles, integrated AODs at the wavelengths of the spectral micro-windows and mass columns.
While in the case of relatively large amount of SA the spectral signature of SA layers can be reasonably strong (up to 300 mW/(cm 1 m 2 sr), thus at least 15 times larger than IASI’s NESR), it still is a limited-sized signature if compared with other atmospheric aerosols and clouds. This depends, in particular, on the small average size of SA particles [16]. Thus, to avoid false detections and to single out unequivocally the SA spectral signature, quality tests of the retrievals are applied. AEROIASI-H2SO4 retrievals are cloud-screened based on AVHRR (Advanced Very High Resolution Radiometer) data (pixels with non-zero all-altitudes cloud fractions are screened out). A threshold on Root Mean Square (RMS) spectral residuals, also refereed to in the following as root mean square errors (RMSE), is applied (retrievals with RMSE lower than 60 mW/(cm 1 m 2 sr) are retained). It is important to notice that this RMSE-based screening can be seen as a post-screening analogous of the usually-applied pre-screening methods for confined plumes observations, like the one used in the IASI SO2 observations discussed in Section 2.4. Pixels with a relatively high AOD (larger than 0.07) due to dust, obtained with AEROIASI-Dust, are also screened out.

2.3. The Eruption of Mount Etna of 18–20 March 2012

On the morning of the 18 March 2012, the New South East Crater (NSEC) gave rise to the 22nd paroxysmal episode of the long lasting sequence of lava fountains experienced by Mount Etna between 2011 and 2015. Moderate Strombolian activity started on 16 March increasing in intensity on the 18 March at about 3:00 (all times reported here are UTC). At about 7:45, the eruptive activity transitioned to a discontinuous lava fountain with magma jets became gradually sustained and, after 8:00, the height of the lava fountain and eruptive column grew very fast, reaching an estimated height of about 7 km above the crater and dispersing at first towards the northeast and later east. At about 9:45, the paroxysmal phase started to decline to finish by 10:10, lasting 1:45 h overall. Moderate Strombolian explosions and a weak ash plume continued until 10:25, when the episode eventually stopped. The description of the volcanic activity for this event can be found in the weekly report of the Italian National Institute of Geophysics and Volcanology, for that period of time [32].
This case-study is a good test for AEROIASI-H2SO4 for the following reasons: (1) it is a moderate tropospheric eruption, yet with relatively large SO 2 emissions, possibly leading to consistent SA formation; (2) relatively wide cloud-free areas are found; and (3) very limited ash is emitted that is possibly quickly sedimented. It should be noted that, in case of a large presence of ash, the sensitivity of thermal infrared observations, like the ones from IASI, to SA can be severely hampered [16].

2.4. Plume Correlative Data

2.4.1. MODIS AOD Observations

The Moderate Resolution Imaging Spectroradiometer (MODIS) provides long-term global observation of the Earth’s land, ocean and atmospheric properties. It observes the Earth with a swath of 2330 km across track, from a polar orbit approximately 700 km above the surface and ±55 ° views scan. The MODIS sensor flies on Terra and Aqua satellites, which were launched in 1999 and 2002, respectively. The AOD at 550 nm of the MODIS aerosol products is retrieved with two entirely distinct algorithms, known as a Deep Blue (DB) algorithm over land and a Dark Target (DT) algorithm over land and ocean. We consider Terra MODIS C61 level 2 products at 3 km spatial resolution (MOD04_3K) (from https://ladsweb.nascom.nasa.gov/, accessed on 20 April 2021) that provides the AOD using a DT algorithm.

2.4.2. IASI SO 2 Observations

The SO 2 column amounts and plume height for this eruption are retrieved with the optimal-estimation algorithm of Carboni et al. [33,34], using IASI measurements, hereafter referred to as the “Oxford algorithm”. The algorithm exploits the SO 2 absorption bands in the spectral regions between 1000–1200 and 1300–1410 cm 1 . It is built around the RTTOV (Radiative Transfer for TOVS) radiative transfer model [35]. The output of this retrieval algorithm is a bi-dimensional vector, which includes the SO 2 amount (its total column in Dobson Units—DU) and the peak altitude of a modelled Gaussian vertical distribution. The IASI observations are preliminary screened, using the method of Walker et al. [36], and the full retrieval is performed only where SO 2 is detected with this method. This algorithm has been validated using ground-based and satellite data [34] and proved reliable in monitoring volcanic eruptions of different VEI-magnitude.

2.4.3. CHIMERE SO 2 Simulations

The same eruption is simulated using the CHIMERE chemistry-transport model [37], for a duration of 120 h starting on 18 March 2012, 0:00 UTC. This numerical experiment, for this event, is thoroughly described by Lachatre et al. [38]. We provide here a short description of these simulations. A simulation, hereafter referred to as volcanic-only run, has been realised using only volcanic SO 2 emissions. In these simulations, SO 2 has been treated as an inert tracer: in particular, oxidation of SO 2 and subsequent formation of SA has not been represented. The meteorology fields are forced by the WRFv.3.7.1 (Weather Research and Forecasting, [39]), with an update of the forcing meteorological variables every 20 min using the WRF-CHIMERE online simulation framework [40]. Horizontal advection in the CHIMERE model has been represented using the classical Van Leer [41] second-order slope-limited transport scheme, while the anti-dissipative transport scheme of Després and Lagoutiere [42] has been used for vertical transport. The simulation domain contains 799 × 399 cells at 5 km resolution, with 50 vertical levels from the surface to 150 hPa pressure level. The time and altitude profile for injection of SO 2 into the atmosphere has been obtained using the bulk SO 2 emission rates measured by the ground-based FLAME (FLux Automatic MEasurements) network [43]. It is important to notice that this method accurately measures SO 2 emission rates during passive degassing and effusive moderate Strombolian eruptive activity, in which the plume height is usually at most 2 km above the crater. In these cases, an empirical relationship between plume height and wind speed is used to retrieve the mass flux rate. Instead, during explosive paroxysmal events where the plume is ejected to higher altitudes, like, for this event, this linear height–wind relationship cannot be used, and mass flux is retrieved using the plume height estimated by visual camera and/or satellite retrieval. In our case, visual camera is used. Finally, SO 2 emission rates reaching values as high as about 450 kg s 1 , and an injection height varying from 4.5 km to 12.0 km, during its most intense phase, are found and used as input to the CHIMERE simulations. A second simulation, hereafter referred to as anthropogenic-only run, has been realised using only anthropogenic SO 2 emissions. In these simulations, oxidation of SO 2 and subsequent formation of SA has been represented. The anthropogenic-only run is merely used here to visually identify areas possibly affected by anthropogenic SO 2 that can provide positive detections to AEROIASI-H2SO4, outside the areas expected as volcanically-influenced. For this reason, we don’t give further details on this simulation, as this will be extensively analysed in future modelling work.

3. Results and Discussion
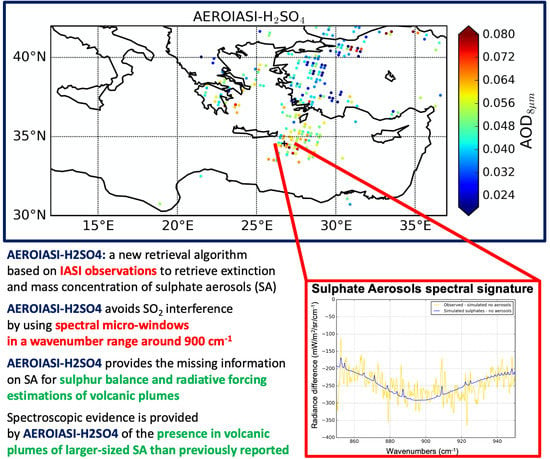
3.1. SA AOD

Figure 3a shows the SA plume obtained with AEROIASI-H2SO4, in terms of SA AOD at 8.0 μm (1250 cm 1 ), the shortest wavelength available in our product, on 19 March 2012 (IASI daytime overpass, approximate time 9:30 LT). At the overpass time, more than 24 h after the beginning of the volcanic eruption, the AOD at 8.0 μm reaches values as high as 0.1. An isolated plume, with higher AOD values, is found to the south of the island of Crete. This region is unaffected by dust and clouds (Figure 3d).
It is worth mentioning that the new sulphate-specific AOD observations shown in Figure 3a are a marked advance with respect to existing satellite-based AOD observations. Our new observations are based on a precise and non-ambiguous spectroscopic signature of SA that is then associated with quantitative information on SA thanks to a spectral fitting method and detailed radiative transfer calculations. This is fundamentally different from what was possible with broad-band radiometers (e.g., MODIS and MODIS-like sensors) that can just observe the broad-band optical signal of aerosols, or with space LiDARs (e.g., CALIOP and CATS) that derive information on aerosols and clouds thanks to the backscattered radiation at one or two wavelengths. In both these cases, only a raw indirect identification of the specific aerosol composition can be derived thanks, e.g., to the spectral variability of the aerosol extinction and/or the depolarization ratio. For AEROIASI-H2SO4 retrievals, instead, the attribution of integrated aerosol extinction (the AOD) is non-ambiguously attributed to the specific selected aerosol type (SA, in this case) through a detailed high-resolution spectroscopy. On the other hand, the validation of our SA retrievals is very difficult due to the mentioned fundamental limitations linked to these possible correlative products, which use the optical signature broadly linked to their size and/or shape rather than the aerosol-specific spectroscopy. In addition, regarding the spatial scale, this volcanic eruption, as most of the volcanic activity of such low-level continuous degassing volcanoes, is occurring mostly in the troposphere. In the case of such small-scale processes, limb observations, widely used to study extremely strong (stratospheric) volcanic eruptions, are also unusable. Unfortunately, space LiDARs as well are scarcely useful in the observation and study of the evolution of small-scale (tropospheric) eruptions due to the very limited revisit time of space LiDAR (basically no-swath instruments). These data-availability problems are not specific for this eruption but are well-known limitations when dealing with small-scale tropospheric volcanic activity and mirrors the lack of dedicated aerosol products to study these kinds of processes, which is one notable motivation of the present work. Thus, we evaluate these retrievals with a combination of a direct comparison with available MODIS AOD observations and with more indirect evaluations using observations and modelling of the dispersing SO 2 plume.
Figure 3b shows AOD observations at 550 nm wavelength from Terra-MODIS, for an overpass of the Terra satellite only about 1 h later than the IASI overpass of Figure 3a. Even if MODIS observes integrated AOD from all aerosols, a specific confined structure of enhanced AOD (up to almost 0.2) is found at approximately the same region of the SA plume observed by AEROIASI-H2SO4, southeast of Crete island. The aerosol plume observed by MODIS is slightly shifted towards the east with respect to the AEROIASI-H2SO4 plume observations, which supports the idea of a dispersing plume coming from Mount Etna’s emissions. Thus, this plume can be identified with the volcanic SA plume observed with AEROIASI-H2SO4.
In order to further investigate the spatial consistency of our SA retrievals, based on volcanic-specific information, they are compared with SO 2 simulations using CHIMERE and IASI SO 2 observations from an independent algorithm. The raw SO 2 total column, for the volcanic-only run described in Section 2.4.3, is shown in Figure 3c). An SO 2 map based on the IASI-SO 2 Oxford algorithm, for the same overpass shown in Figure 3a, is shown in Figure 3e. The SO 2 and SA plumes, for the same eruptive event and after such a short time from the beginning of the event, are expected to be reasonably collocated in space and time. Observations and simulations of the SO 2 plume are geographically consistent and show two separated sub-sections of the volcanic SO 2 plume: a western section, between the volcanic source and south Peloponnese, and an eastern section, to the south of Crete. As discussed extensively by Lachatre et al. [38], the western section is located at lower altitudes (4 to 6 km altitude, for both CHIMERE and IASI) and the eastern at higher altitudes (8 to 11 km altitude for CHIMERE and up to 12 or higher for IASI). The complete time series of modelled SO 2 with CHIMERE (data not shown here) reveals that the two plume sub-sections mentioned above split during the initial phase of the eruption and were then transported in two different directions. The eastern part of the plume, higher and advected faster towards the east due to the sustained westerly winds at this altitude can be traced back to the emissions from the paroxysmal phase of the eruption, while the western part of the plume lower and advected more slowly, can be traced back to the parts of the plume emitted either before or after the paroxysmal phase. The western section of the plume is partly missed by IASI, probably due to the limited sensitivity of IASI to low altitudes and/or the presence of Saharan dust. The SA plume observed by AEROIASI-H2SO4 is spatio-temporally colocated with the eastern, higher and denser SO 2 plume. AEROIASI-H2SO4 misses the western plume. This can be due to different factors: (1) the western SO 2 plume is not accompanied with consistent SA formation (due to limited SO 2 concentration or other chemical/micro-physical limiting factors), which is also consistent with the fact that MODIS did not observe the western plume either (Figure 3b), (2) AEROIASI-H2SO4 sensitivity is hampered by the co-presence of clouds and dust (see clouds- and dust-affected pixels in Figure 3d), (3) the AEROIASI-H2SO4 sensitivity is limited at the low altitudes of the western plume (lower than 6 km). To get more insights into this latter point, in Figure 4a, the typical averaging kernels (AK) of AEROIASI-H2SO4, for this case study, are shown. In the present algorithm configuration, the AK is a diagnostic of the vertical sensitivity of the retrieval. As it can be seen, AEROIASI-H2SO4 has a maximum sensitivity between about 6 and 12 km; the sensitivity is very small at the lower altitudes typical of the western plume. The impact of the limited vertical sensitivity of AEROIASI-H2SO4, as well as its spatial sampling, on the observation of the lower-altitudes western volcanic plume is further investigated by convolving the CHIMERE-SO2 simulations with AEROIASI-H2SO4 typical AK and projecting the simulation on the IASI swath (Figure 3d). As it is possible to see from Figure 3d, except for a couple of pixels, the western plume would not be fundamentally discernible with the sensitivity and geometry of AEROIASI-H2SO4. These results point at a general consistency of the AEROIASI-H2SO4 horizontal volcanic SA plume distribution with established volcanic SO 2 plume information.
Areas where AEROIASI-H2SO4 observes SA, other than those identified as volcanic (see discussion above), can be seen in Figure 3a. The geographical localisation of these areas is compared with the CHIMERE anthropogenic-only run described in Section 2.4.3 (Figure 5). From the visual comparison of Figure 3a and Figure 5, it can be noticed that most areas of positive AEROIASI-H2SO4 detection outside the volcanic plume and not affected by the presence of clouds (Figure 3d) are spatially coincident with enhanced-SO 2 areas from CHIMERE-anthropogenic. This is observed notably for areas in the central-western and northern coast Turkey, and plumes emanating from south-eastern Peloponnese and south of Thessalonoki towards the Aegean Sea. Some mismatches of non-volcanic AEROIASI-H2SO4 detection and CHIMERE antropogenic SO2 simulations can be explained with the limited vertical sensitivity of AEROIASI-H2SO4 and the patchy spatial sampling of IASI, by looking at the AK-convolved CHIMERE-SO2 simulations of Figure 3d. The marked anthropogenic SO2 plume in Libya, visible in Figure 5, is in an area not sampled by IASI. Raw CHIMERE simulations also show a large anthropogenic plume in northern Greece/Macedonia. Nevertheless, only a few SO2-enhanced pixels seem visible in the AK-convolved CHIMERE simulations in this area, reasonably collocated with a few SA-enhanced pixels from AEROIASI-H2SO4. The large anthropogenic plume northeast of Cyprus, visible in Figure 5, is also significantly smoothed by the vertical sensitivity of AEROIASI-H2SO4 (see the few pixels visible, for this plume, in Figure 3d) and, in addition, is located in a region of large dust burden. Nevertheless, AEROIASI-H2SO4 seems to detect a few SA-enhanced pixels in an area possibly matching the SO2 plume for this anthropogenic source, in southeastern Turkey. All these mismatches can thus be explained with considerations on either the vertical sensitivity or the horizontal sampling of AEROIASI-H2SO4. While a detailed analysis on the capability of AEROIASI-H2SO4 to observe lower-altitude anthropogenic SA is not carried out here, this evidence hints at this possibility that IASI could be sensitive to anthropogenic SA. It is important to notice that the present set-up of AEROIASI-H2SO4 is not optimised to observe these lower altitudes (see, e.g., the AK of Figure 4) and dedicated set-ups (e.g., different a priori, constrain matrix, SA micro-physics hypotheses and/or operational spectral micro-windows) are needed to get more insights into this possible sensitivity.
A summary of the AEROIASI-H2SO4, IASI SO 2 , AEROIASI-Dust, and clouds detections is shown in Figure 6. Pixels where the co-presence of SA and SO 2 is detected are explicitly indicated. The frontal area of the eastern sub-section of the plume is almost systematically composed of both volcanic species (SA and SO 2 ), thus indicating that rapid chemical and micro-physical processes are at play for this event.

3.2. SA Mass

The retrieved SA mass column concentration is shown in Figure 7a, for the same IASI overpass discussed in Section 3.1. The detected SA plume exhibits relatively large mass values, exceeding 0.05 g/m 2 , while smaller values are found in the extra-volcanic areas. Figure 7b shows the mean SA mass concentration vertical profile for the volcanic plume, compared with the mean altitude of SO 2 from volcanic-only CHIMERE simulations, in the same area. The maximum of the SA mass vertical profile is found between 6 and 10 km. The average SO 2 profile peaks between 9.5 and 11.5 km, for the same plume. These small discrepancies could be explained mainly by the limited vertical sensitivity of AEROIASI-H2SO4 and by the in-plume evolution of the plume. For this latter aspect, the enhanced formation of SA at the lowest altitudes of the plume can be mentioned, where a slightly larger humidity and temperature is found with respect to higher altitudes, two factors that generally enhance SO 2 -to-SA conversions [44]. Due to the relatively small distance from the volcanic source, gravitational sedimentation of the particles is expected to play a minor role in the separation of the gaseous and particulate components of the plume. In any case, due to the limited vertical sensitivity of AEROIASI-H2SO4, vertical profiles are to be taken with extreme caution, while, based on the evaluation of the method in Section 3.1, column retrievals are more robust.

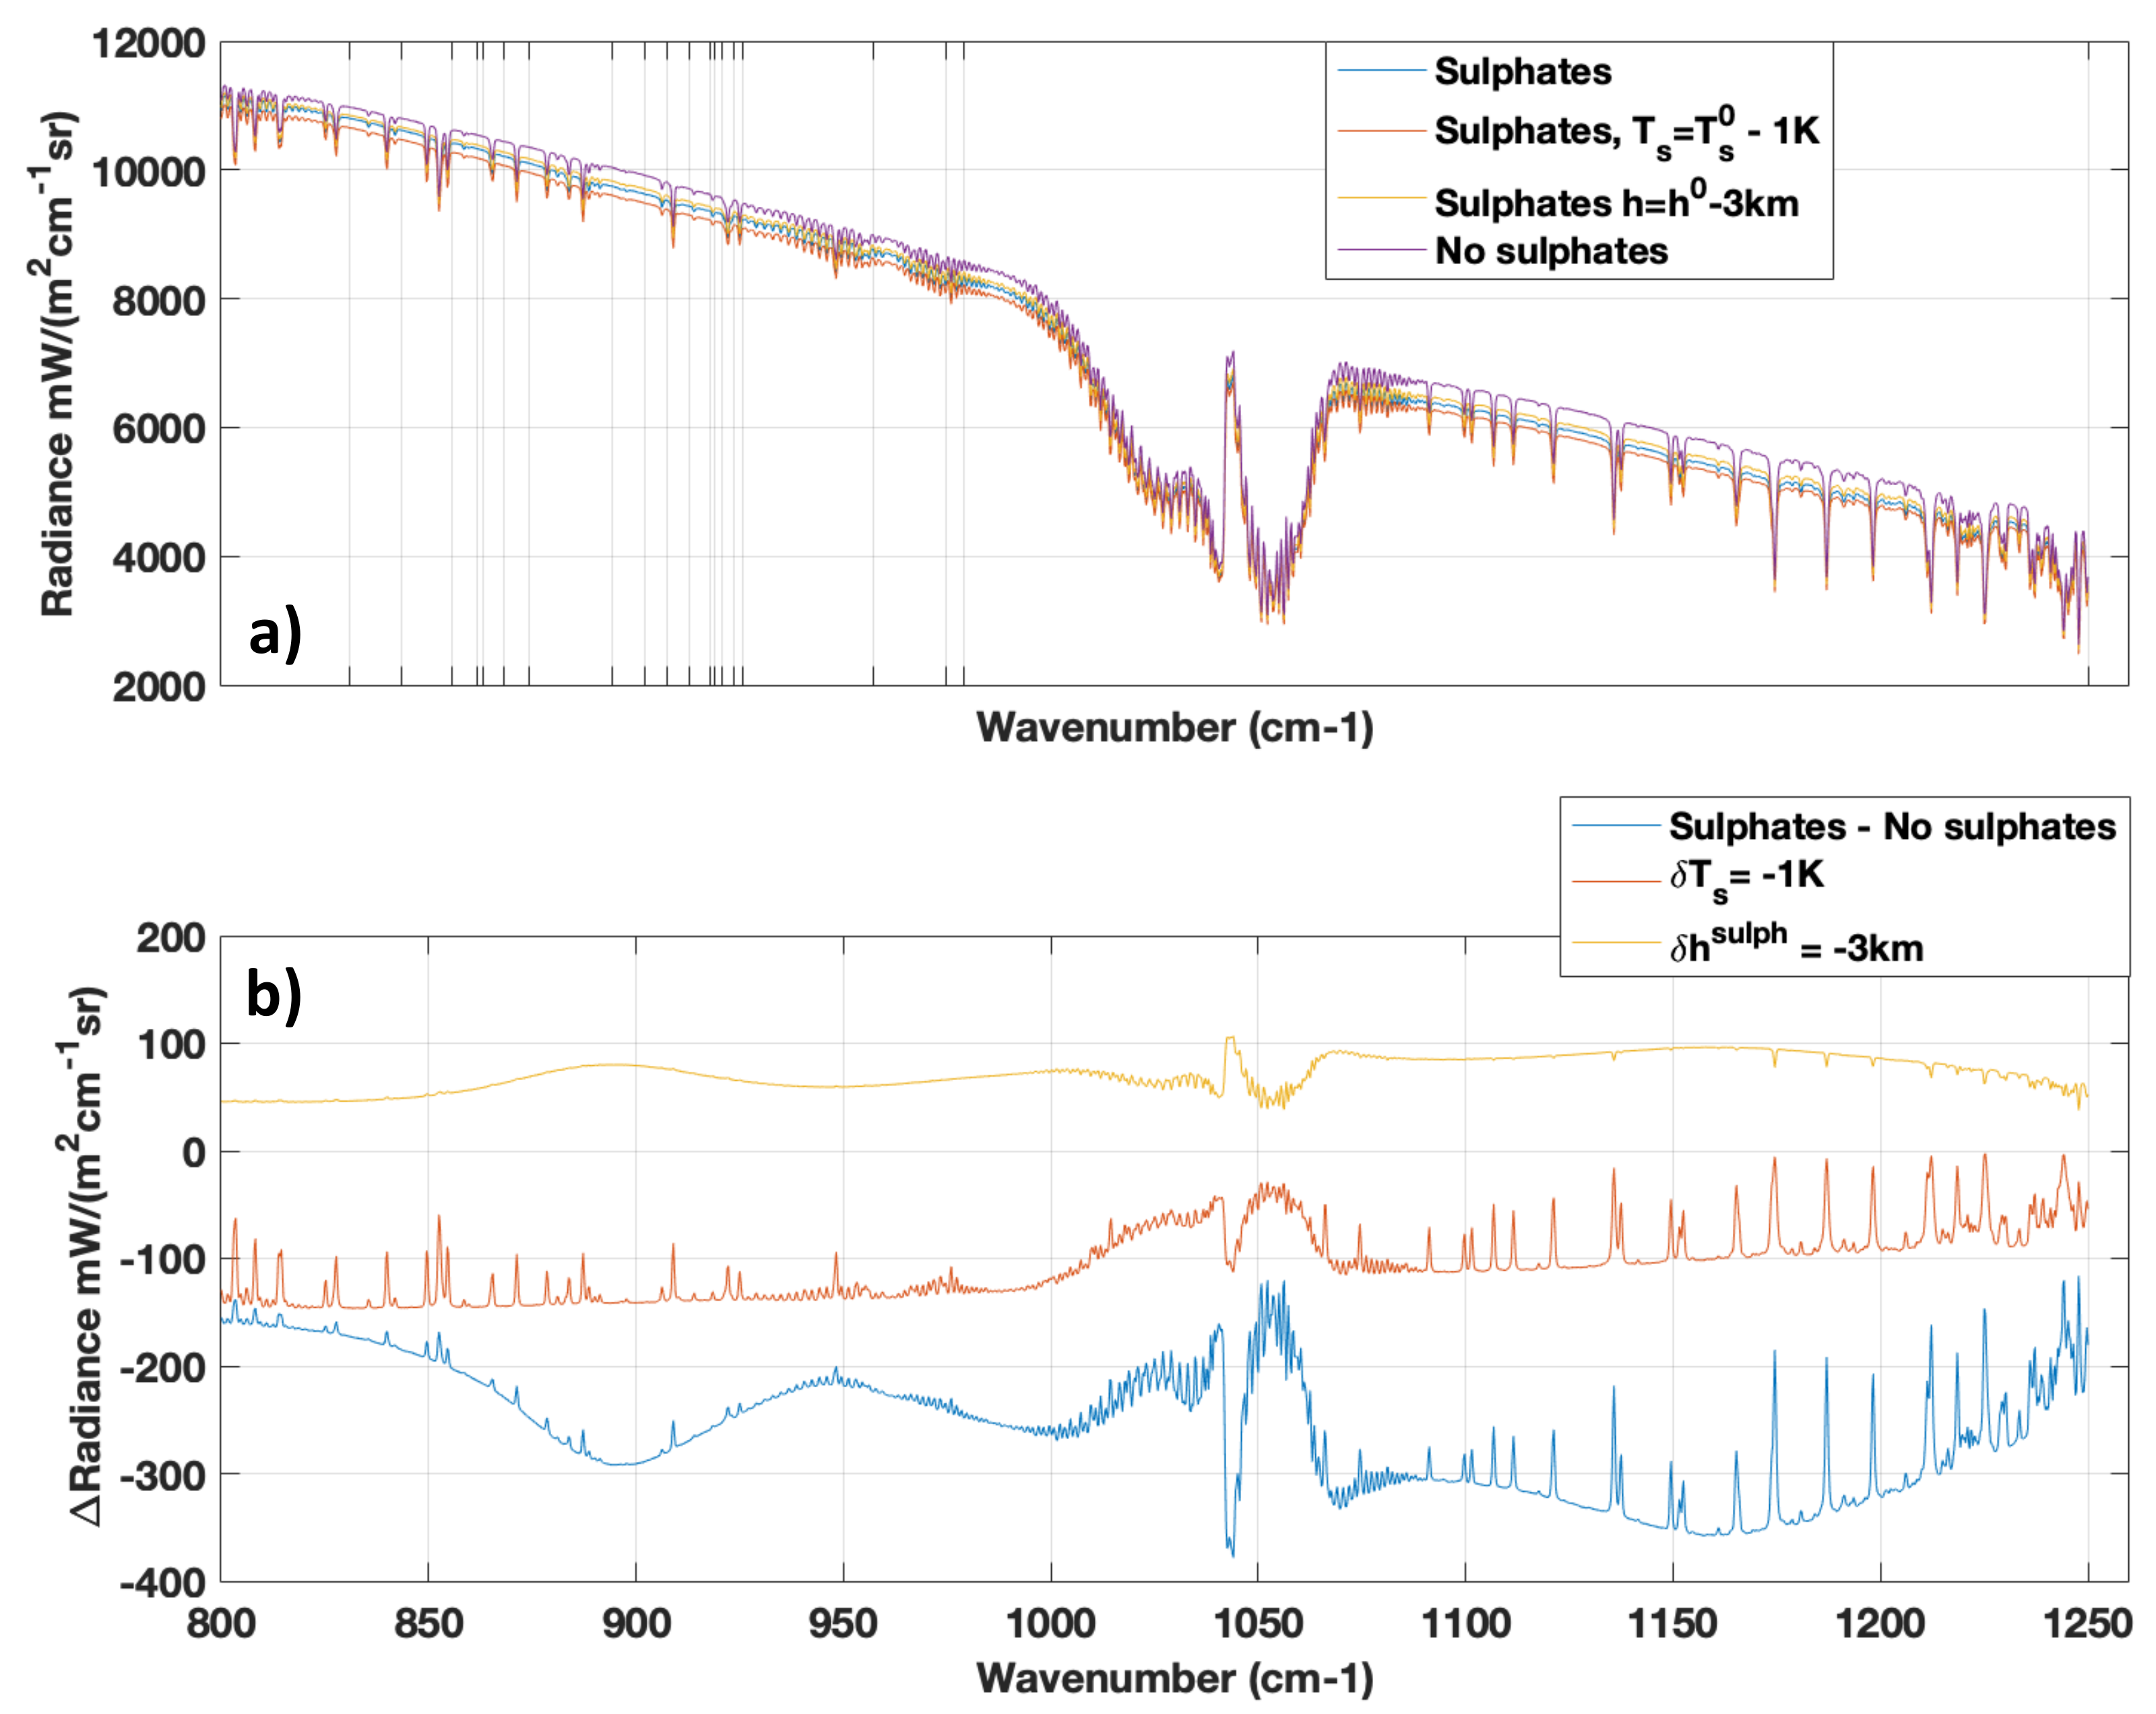
3.3. Sensitivity and Precision of AEROIASI-H2SO4

The sensitivity and precision of the retrieval has been analysed by means of the AK, the degrees of freedom (DOF, the number of independent parameters that can be theoretically retrieved from the measurements) and retrieval uncertainties.
The vertical sensitivity in terms of typical AEROIASI-H2SO4 AK points at a maximum sensitivity in an altitude range between about 5 and 12 km (see Figure 4a). Due to the self-adaptation of the inversion algorithm, during the iterative procedure, the DOF varies, starting from ∼1.2 and then reaching typical values of ∼1.0, during the last iteration. This allows the adaptability of the vertical shape of the profiles, at early iterations, and the convergence of the algorithm, at the end of the procedure. Nevertheless, these DOF values and the shape of the different AK confirm the indication brought by Figure 2 that the vertical sensitivity of AEROIASI-H2SO4 is limited. Typical DOF values of ∼0.8 are found in the background area, i.e., outside the plume.
We also provide here an estimation of the total uncertainties on the SA number density profile and mass concentration estimation. This is calculated as the sum of the main random errors (the smoothing and the measurement noise error) plus the size-distribution-related systematic error linked to the assumption of a fixed mean radius. Thus, the total error covariance matrix S T is:
S T = S rand + S syst = S sm + S m + S sd
where S rand and S syst are the random and systematic errors, S sm and S m are the smoothing and measurement noise error, S sd is the size distribution error. The covariance matrices for the random smoothing and measurement noise errors S sm and S m are derived using the adaptation of the optimal estimation methodology of Rodgers [23] to general regularization methods, provided the symmetry of the a priori covariance and the regularization matrix as the constraints of the least square minimisation [45]. The size distribution systematic error is estimated by the variability of different mass-normalised number density profile retrievals of the same pixel using different size distributions, i.e., comparing the retrievals using a mean radius 0.50 μm and standard deviation 0.50 (Figure 1a–c) and using a mean radius 0.20 μm and standard deviation 0.20 (Figure 1d–f). The different error components, as function of the altitude, are obtained using the diagonal elements of the respective covariance matrices, and the total uncertainty vertical profile is obtained using the diagonal elements of S T . Figure 4b shows the vertical profiles of the smoothing, measurement noise (and their sum, i.e., the total random error) and size distribution errors, as well as the total error, for a typical retrieval (the same as the AK of Figure 4a). Typical random uncertainties between ∼15 (from 4 to 10 km altitude) and 40% (at 14 km altitude, with larger values at higher altitudes, where number densities are very small) are found for the retrieved particle number density profile. Nevertheless, the error budget of SA number density and mass concentration estimation is dominated by the size distribution assumptions. Errors from 20 (at 6 km) to 60% (at 10 km) are found. Even if this comparison is based on very different size distributions, this result points at consistent possible systematic errors linked to micro-physical hypotheses. Thus, even if our size distribution choice is driven by clear spectroscopic evidence (see discussion of Figure 1), AEROIASI-H2SO4 absolute estimations must be taken with caution. The total uncertainty of number density and mass concentration profile retrievals ranges from about 60% (at 4 km) to 20% (at 6 km) to 50–60% (between 8 and 14 km). It must be stressed that systematic error associated with refractive indices (including uncertainties on the sulphuric acid mixing ratio in the SA droplets), and radiative transfer modelling related errors were not taken into account at this stage but can contribute significantly to the error budget. Using these results, the typical total uncertainty on the integrated column mass concentration is estimated at ∼35%.

4. Conclusions and Perspectives

In this paper, we have presented the new retrieval algorithm AEROIASI-H2SO4, for the observation of SA (binary solution droplets of sulphuric acid and water) using IASI measurements. This inversion scheme, based on a self-adapting Tikhonov–Phillips regularization method, provides, for the first time from space, quantitative observations of SA extinction and mass concentration with limited random uncertainties. Larger systematic errors are associated with the necessary hypotheses for the chemical and micro-physical state of the SA particles. The set-up of AEROIASI-H2SO4 presented in this study is dedicated to the observation of volcanic SA in the free troposphere. It operates in a specific SA-contained sulphuric acid absorption band (around 905 cm 1 ) that is completely independent of the absorption of the possibly co-existing SO 2 , the main gaseous precursor of volcanic SA, thus excluding interference of SO 2 on SA retrievals. The AEROIASI-H2SO4 algorithm is applied to a medium-sized-intensity tropospheric eruption of Mount Etna volcano (18 March 2012). A volcanic SA plume is detected, which is geographically collocated with simultaneous MODIS AOD observations, IASI SO 2 retrievals, obtained with an independent algorithm, and CHIMERE SO 2 simulations. Spectroscopic evidence is shown that tropospheric SA may have larger mean size (mean radius: 0.5 μm) than the well studied stratospheric aged SA plumes (typical mean radius: 0.2 μm). Even if this set-up of AEROIASI-H2SO4 is dedicated to volcanic SA retrieval, it is suggested that AEROIASI-H2SO4 can also be sensitive to anthropogenic SA. The new information brought by AEROIASI-H2SO4 may be crucial to have a more complete view on the sulphur mass balance for volcanic eruptions and direct radiative impacts of the SA of volcanic origin. For the future, we aim at the co-retrieval of SO 2 and SA, using IASI. The co-presence of SA and SO 2 is hinted at by the visual analysis of IASI spectra for the present case study. It has been recently demonstrated that IASI measurements contain sufficient information to characterise both species with the same radiance spectra [46]. A synoptic view of gaseous and particulate sulphur emissions, while of great importance to get insights into both inner volcanic and atmospheric processes, is also expected to reduce biases in both retrievals [28].

Author Contributions

H.G. and P.S. conceived the study, analysed and interpreted the results. P.S., J.C. and H.G. developed the AEROIASI-H2SO4 algorithm. H.G. completed the inversions. H.G., J.C. and M.E. developed the software. J.C. completed the AEROIASI-Dust inversions. E.C. completed the SO 2 IASI inversion. M.L., S.M. and L.M. performed the CHIMERE simulations and P.S. calculated the AK-convolved CHIMERE data. G.S. and T.C. took SO 2 measurements using the FLAME network. P.S. supervised the work. All authors discussed the results and contributed to the final manuscript. All authors have read and agreed to the published version of the manuscript.

Funding

This research was funded by CNES under grant TOSCA/IASI, PNTS under grant MIA-SO 2 , ANR under grant TTL-Xing, AID (Agence de L’Innovation de Défense) under grant TROMPET and the EC 7th Framework Program under grant No. 603557 (StratoClim).

Institutional Review Board Statement

Not applicable.

Informed Consent Statement

Not applicable.

Data Availability Statement

AEROIASI-H2SO4 and AEROIASI-Dust data are available on demand (AEROIASI-H2SO4: [email protected]; AEROIASI-Dust: [email protected]). MODIS data are freely available at the following website: https://ladsweb.nascom.nasa.gov/. CHIMERE simulations are available on demand ([email protected]). IASI SO 2 retrievals are accessible at the following link: http://www.nrt-atmos.cems.rl.ac.uk/.

Acknowledgments

This work has been funded by: CNES (Centre National d’Études Spatiales) via TOSCA/IASI grant; CNRS (Centre national de la recherche scientifique)-INSU(Institut National des Sciences de l’Univers) PNTS (Programme National de Télédétection Spatiale) via MIA-SO2 grant; ANR (Agence Nationale de la Recherche) via TTL-XING grant; AID (Agence de L’Innovation de Défense) via TROMPET grant; EC 7th Framework Program via grant nr. 603557 (StratoClim). We acknowledge the AERIS database and support for providing IASI Level 1c and AVHRR-CLARA2 data, and ECMWF for providing meteorological analyses. CHIMERE simulations were performed using HPC resources from GENCI TGCC under grant nr. A0050110274. The authors acknowledge NASA Goddard Space Flight Center for MODIS data.

Conflicts of Interest

The authors declare no conflict of interest.

References

  1. Roberts, T.; Vignelles, D.; Liuzzo, M.; Giudice, G.; Aiuppa, A.; Coltelli, M.; Salerno, G.; Chartier, M.; Couté, B.; Berthet, G.; et al. The primary volcanic aerosol emission from Mt Etna: Size-resolved particles with SO2 and role in plume reactive halogen chemistry. Geochim. Cosmochim. Acta 2018, 222, 74–93. [Google Scholar] [CrossRef] [Green Version]
  2. Martin, E.; Bekki, S.; Ninin, C.; Bindeman, I. Volcanic sulfate aerosol formation in the troposphere. J. Geophys. Res. Atmos. 2014, 119, 12,660–12,673. [Google Scholar] [CrossRef] [Green Version]
  3. Robock, A. Volcanic eruptions and climate. Rev. Geophys. 2000, 38, 191–219. [Google Scholar] [CrossRef]
  4. Vernier, J.P.; Thomason, L.W.; Pommereau, J.P.; Bourassa, A.; Pelon, J.; Garnier, A.; Hauchecorne, A.; Blanot, L.; Trepte, C.; Degenstein, D.; et al. Major influence of tropical volcanic eruptions on the stratospheric aerosol layer during the last decade. Geophys. Res. Lett. 2011, 38. [Google Scholar] [CrossRef] [Green Version]
  5. Ridley, D.A.; Solomon, S.; Barnes, J.E.; Burlakov, V.D.; Deshler, T.; Dolgii, S.I.; Herber, A.B.; Nagai, T.; Neely, R.R.; Nevzorov, A.V.; et al. Total volcanic stratospheric aerosol optical depths and implications for global climate change. Geophys. Res. Lett. 2014, 41, 7763–7769. [Google Scholar] [CrossRef] [Green Version]
  6. Sellitto, P.; Zanetel, C.; di Sarra, A.; Salerno, G.; Tapparo, A.; Meloni, D.; Pace, G.; Caltabiano, T.; Briole, P.; Legras, B. The impact of Mount Etna sulfur emissions on the atmospheric composition and aerosol properties in the central Mediterranean: A statistical analysis over the period 2000–2013 based on observations and Lagrangian modelling. Atmos. Environ. 2017, 148, 77–88. [Google Scholar] [CrossRef] [Green Version]
  7. Michaud, J.P.; Grove, J.S.; Krupitsky, D. Emergency department visits and vog-related air quality in Hilo, Hawai’i. Environ. Res. 2004, 95, 11–19. [Google Scholar] [CrossRef]
  8. Aiuppa, A.; Bellomo, S.; Brusca, L.; D’Alessandro, W.; Di Paola, R.; Longo, M. Major-ion bulk deposition around an active volcano (Mt. Etna, Italy). Bull. Volcanol. 2006, 68, 255–265. [Google Scholar] [CrossRef] [Green Version]
  9. Carslaw, K.S.; Lee, L.A.; Reddington, C.L.; Pringle, K.J.; Rap, A.; Forster, P.M.; Mann, G.W.; Spracklen, D.V.; Woodhouse, M.T.; Regayre, L.A.; et al. Large contribution of natural aerosols to uncertainty in indirect forcing. Nature 2013, 503, 67–71. [Google Scholar] [CrossRef] [PubMed]
  10. Carn, S.; Clarisse, L.; Prata, A. Multi-decadal satellite measurements of global volcanic degassing. J. Volcanol. Geotherm. Res. 2016, 311, 99–134. [Google Scholar] [CrossRef]
  11. Clarisse, L.; Prata, F. Chapter 11—Infrared Sounding of Volcanic Ash. In Volcanic Ash; Mackie, S., Cashman, K., Ricketts, H., Rust, A., Watson, M., Eds.; Elsevier: Amsterdam, The Netherlands, 2016; pp. 189–215. [Google Scholar] [CrossRef]
  12. Carn, S.; Krotkov, N. Chapter 12—Ultraviolet Satellite Measurements of Volcanic Ash. In Volcanic Ash; Mackie, S., Cashman, K., Ricketts, H., Rust, A., Watson, M., Eds.; Elsevier: Amsterdam, The Netherlands, 2016; pp. 217–231. [Google Scholar] [CrossRef] [Green Version]
  13. Günther, A.; Höpfner, M.; Sinnhuber, B.M.; Griessbach, S.; Deshler, T.; von Clarmann, T.; Stiller, G. MIPAS observations of volcanic sulfate aerosol and sulfur dioxide in the stratosphere. Atmos. Chem. Phys. 2018, 18, 1217–1239. [Google Scholar] [CrossRef] [Green Version]
  14. Haywood, J.M.; Jones, A.; Clarisse, L.; Bourassa, A.; Barnes, J.; Telford, P.; Bellouin, N.; Boucher, O.; Agnew, P.; Clerbaux, C.; et al. Observations of the eruption of the Sarychev volcano and simulations using the HadGEM2 climate model. J. Geophys. Res. Atmos. 2010, 115. [Google Scholar] [CrossRef] [Green Version]
  15. Karagulian, F.; Clarisse, L.; Clerbaux, C.; Prata, A.J.; Hurtmans, D.; Coheur, P.F. Detection of volcanic SO2, ash, and H2SO4 using the Infrared Atmospheric Sounding Interferometer (IASI). J. Geophys. Res. Atmos. 2010, 115, D00L02. [Google Scholar] [CrossRef]
  16. Sellitto, P.; Legras, B. Sensitivity of thermal infrared nadir instruments to the chemical and microphysical properties of UTLS secondary sulfate aerosols. Atmos. Meas. Tech. 2016, 9, 115–132. [Google Scholar] [CrossRef] [Green Version]
  17. Clarisse, L.; Coheur, P.F.; Prata, F.; Hadji-Lazaro, J.; Hurtmans, D.; Clerbaux, C. A unified approach to infrared aerosol remote sensing and type specification. Atmos. Chem. Phys. 2013, 13, 2195–2221. [Google Scholar] [CrossRef] [Green Version]
  18. Cuesta, J.; Eremenko, M.; Flamant, C.; Dufour, G.; Laurent, B.; Bergametti, G.; Höpfner, M.; Orphal, J.; Zhou, D. Three-dimensional distribution of a major desert dust outbreak over East Asia in March 2008 derived from IASI satellite observations. J. Geophys. Res. Atmos. 2015, 120, 7099–7127. [Google Scholar] [CrossRef] [Green Version]
  19. Clerbaux, C.; Boynard, A.; Clarisse, L.; George, M.; Hadji-Lazaro, J.; Herbin, H.; Hurtmans, D.; Pommier, M.; Razavi, A.; Turquety, S.; et al. Monitoring of atmospheric composition using the thermal infrared IASI/MetOp sounder. Atmos. Chem. Phys. 2009, 9, 6041–6054. [Google Scholar] [CrossRef] [Green Version]
  20. Capelle, V.; Chédin, A.; Siméon, M.; Tsamalis, C.; Pierangelo, C.; Pondrom, M.; Crevoisier, C.; Crepeau, L.; Scott, N.A. Evaluation of IASI-derived dust aerosol characteristics over the tropical belt. Atmos. Chem. Phys. 2014, 14, 9343–9362. [Google Scholar] [CrossRef] [Green Version]
  21. Ventress, L.J.; McGarragh, G.; Carboni, E.; Smith, A.J.; Grainger, R.G. Retrieval of ash properties from IASI measurements. Atmos. Meas. Tech. 2016, 9, 5407–5422. [Google Scholar] [CrossRef] [Green Version]
  22. Tikhonov, A.N. On the solution of ill-posed problems and the method of regularization. Dokl. Akad. Nauk SSSR 1963, 151, 501–504. [Google Scholar]
  23. Rodgers, C.D. Inverse Methods for Atmospheric Sounding: Theory and Practice; Series on Atmospheric Oceanic and Planetary Physics; World Scientific: London, UK, 2000; Volume 2, pp. 43–64. [Google Scholar]
  24. Stiller, G.P.; von Clarmann, T.; Funke, B.; Glatthor, N.; Hase, F.; Höpfner, M.; Linden, A. Sensitivity of trace gas abundances retrievals from infrared limb emission spectra to simplifying approximations in radiative transfer modelling. J. Quant. Spectrosc. Radiat. Transf. 2002, 72, 249–280. [Google Scholar] [CrossRef]
  25. Dee, D.P.; Uppala, S.M.; Simmons, A.J.; Berrisford, P.; Poli, P.; Kobayashi, S.; Andrae, U.; Balmaseda, M.A.; Balsamo, G.; Bauer, P.; et al. The ERA-Interim reanalysis: Configuration and performance of the data assimilation system. Q. J. R. Meteorol. Soc. 2011, 137, 553–597. [Google Scholar] [CrossRef]
  26. Biermann, U.M.; Luo, B.P.; Peter, T. Absorption Spectra and Optical Constants of Binary and Ternary Solutions of H2SO4, HNO3, and H2O in the Mid Infrared at Atmospheric Temperatures. J. Phys. Chem. A 2000, 104, 783–793. [Google Scholar] [CrossRef]
  27. Kremser, S.; Thomason, L.W.; von Hobe, M.; Hermann, M.; Deshler, T.; Timmreck, C.; Toohey, M.; Stenke, A.; Schwarz, J.P.; Weigel, R.; et al. Stratospheric aerosol—Observations, processes, and impact on climate. Rev. Geophys. 2016, 54, 278–335. [Google Scholar] [CrossRef]
  28. Sellitto, P.; Guermazi, H.; Carboni, E.; Siddans, R.; Burton, M. Unified quantitative observation of coexisting volcanic sulfur dioxide and sulfate aerosols using ground-based Fourier transform infrared spectroscopy. Atmos. Meas. Tech. 2019, 12, 5381–5389. [Google Scholar] [CrossRef] [Green Version]
  29. Stiller, G. The Karlsruhe Optimized and Precise Radiative Transfer Algorithm (KOPRA); Wissenschaftliche Berichte, FZKA; Forschungszentrum Karlsruhe: Karlsruhe, Germany, 2000. [Google Scholar]
  30. Zhou, D.K.; Larar, A.M.; Liu, X.; Smith, W.L.; Strow, L.L.; Yang, P.; Schlüssel, P.; Calbet, X. Global Land Surface Emissivity Retrieved From Satellite Ultraspectral IR Measurements. IEEE Trans. Geosci. Remote Sens. 2011, 49, 1277–1290. [Google Scholar] [CrossRef]
  31. Carn, S.A.; Froyd, K.D.; Anderson, B.E.; Wennberg, P.; Crounse, J.; Spencer, K.; Dibb, J.E.; Krotkov, N.A.; Browell, E.V.; Hair, J.W.; et al. In situ measurements of tropospheric volcanic plumes in Ecuador and Colombia during TC4. J. Geophys. Res. Atmos. 2011, 116. [Google Scholar] [CrossRef] [Green Version]
  32. INGV. Bollettino Settimanale sul Monitoraggio Vulcanico, Geochimico e Sismico del Vulcano Etna, 12/03/2012–18/03/2012; Technical Report; INGV: Roma, Italy, 2012. [Google Scholar]
  33. Carboni, E.; Grainger, R.; Walker, J.; Dudhia, A.; Siddans, R. A new scheme for sulphur dioxide retrieval from IASI measurements: Application to the Eyjafjallajökull eruption of April and May 2010. Atmos. Chem. Phys. 2012, 12, 11417–11434. [Google Scholar] [CrossRef] [Green Version]
  34. Carboni, E.; Grainger, R.G.; Mather, T.A.; Pyle, D.M.; Thomas, G.E.; Siddans, R.; Smith, A.J.A.; Dudhia, A.; Koukouli, M.E.; Balis, D. The vertical distribution of volcanic SO2 plumes measured by IASI. Atmos. Chem. Phys. 2016, 16, 4343–4367. [Google Scholar] [CrossRef] [Green Version]
  35. Saunders, R.; Hocking, J.; Turner, E.; Rayer, P.; Rundle, D.; Brunel, P.; Vidot, J.; Roquet, P.; Matricardi, M.; Geer, A.; et al. An update on the RTTOV fast radiative transfer model (currently at version 12). Geosci. Model Dev. 2018, 11, 2717–2737. [Google Scholar] [CrossRef] [Green Version]
  36. Walker, J.C.; Dudhia, A.; Carboni, E. An effective method for the detection of trace species demonstrated using the MetOp Infrared Atmospheric Sounding Interferometer. Atmos. Meas. Tech. 2011, 4, 1567–1580. [Google Scholar] [CrossRef] [Green Version]
  37. Mailler, S.; Menut, L.; Khvorostyanov, D.; Valari, M.; Couvidat, F.; Siour, G.; Turquety, S.; Briant, R.; Tuccella, P.; Bessagnet, B.; et al. CHIMERE-2017: From urban to hemispheric chemistry-transport modeling. Geosci. Model Dev. 2017, 10, 2397–2423. [Google Scholar] [CrossRef] [Green Version]
  38. Lachatre, M.; Mailler, S.; Menut, L.; Turquety, S.; Sellitto, P.; Guermazi, H.; Salerno, G.; Carboni, T.C.E. New strategies for vertical transport in chemistry-transport models: Application to the case of the Mount Etna eruption on March 18, 2012. Geosci. Model Dev. 2020. under review. [Google Scholar] [CrossRef]
  39. Skamarock, W.C.; Klemp, J.B.; Dudhia, J.; Gill, D.O.; Barker, D.; Duda, M.G.; Powers, J.G. A Description of the Advanced Research WRF Version 3 (No. NCAR/TN-475+STR); Technical Report; University Corporation for Atmospheric Research: Boulder, CO, USA, 2008. [Google Scholar]
  40. Briant, R.; Tuccella, P.; Deroubaix, A.; Khvorostyanov, D.; Menut, L.; Mailler, S.; Turquety, S. Aerosol–radiation interaction modelling using online coupling between the WRF 3.7.1 meteorological model and the CHIMERE 2016 chemistry-transport model, through the OASIS3-MCT coupler. Geosci. Model Dev. 2017, 10, 927–944. [Google Scholar] [CrossRef] [Green Version]
  41. Van Leer, B. Towards the ultimate conservative difference scheme. V A second order sequel to Godunov’s method. J. Comput. Phys. 1979, 32, 101–136. [Google Scholar] [CrossRef]
  42. Després, B.; Lagoutière, F. Un schéma non linéaire anti-dissipatif pour l’équation d’advection linéaire. C. R. l’Académie Sci. Math. 1999, 328, 939–943. [Google Scholar] [CrossRef]
  43. Salerno, G.G.; Burton, M.; di Grazia, G.; Caltabiano, T.; Oppenheimer, C. Coupling Between Magmatic Degassing and Volcanic Tremor in Basaltic Volcanism. Front. Earth Sci. 2018, 6, 157. [Google Scholar] [CrossRef]
  44. Vehkamäki, H.; Kulmala, M.; Napari, I.; Lehtinen, K.E.J.; Timmreck, C.; Noppel, M.; Laaksonen, A. An improved parameterization for sulfuric acid–water nucleation rates for tropospheric and stratospheric conditions. J. Geophys. Res. Atmos. 2002, 107, AAC3-1–AAC3-10. [Google Scholar] [CrossRef]
  45. Steck, T.; von Clarmann, T. Constrained profile retrieval applied to the observation mode of the Michelson Interferometer for Passive Atmospheric Sounding. Appl. Opt. 2001, 40, 3559–3571. [Google Scholar] [CrossRef]
  46. Guermazi, H.; Sellitto, P.; Serbaji, M.M.; Legras, B.; Rekhiss, F. Assessment of the Combined Sensitivity of Nadir TIR Satellite Observations to Volcanic SO2 and Sulphate Aerosols after a Moderate Stratospheric Eruption. Geosciences 2017, 7, 84. [Google Scholar] [CrossRef] [Green Version]
Figure 1. (a) An IASI spectrum (blue) taken in the Mount Etna plume observed during daytime overpass on 19 March 2012 (location identified with a black cross in Figure 3). The AEROIASI-H2SO4 fitted spectrum is shown in red and a fitted spectrum without SA is in green; (b) same as (a), but in the spectral range 850–950 cm 1 ; (c) spectral radiance differences of the IASI observed spectrum and the fitted spectrum without SA (yellow) and of the fitted spectra with and without SA (blue). In (ac), the following SA size distribution is considered: log-normal distribution with mean radius 0.50 μm and standard deviation 0.50; (df) the same as (ac) but for a different SA size distribution (log-normal distribution with mean radius 0.20 μm and standard deviation 0.20); (gi) same as (ac) but for a different SA size distribution (log-normal distribution with mean radius 0.20 μm and standard deviation 0.50).
Remotesensing 13 01808 g001
Figure 2. (a) The AEROIASI-H2SO4 fitted spectrum of Figure 1 (in blue) along with spectra at the same conditions but 1 K colder temperature (orange), same temperature but SA plume at 3 km lower altitude (yellow) and without SA plume (purple); (b) Spectral radiance variation of the AEROIASI-H2SO4 fitted spectrum and the different conditions of (a). The spectral micro-windows of AEROIASI-H2SO4 are indicated as vertical lines in (a).
Remotesensing 13 01808 g002
Figure 3. (a) AEROIASI-H2SO4 AOD retrievals at 8 μm, on 19 March 2012, morning IASI overpass (approximately 9:30 LT), (b) MODIS AOD retrievals at 550 nm, for the same scene as in (a) (approximately 1 h later than IASI overpass), (c,d) CHIMERE SO 2 raw column amounts and column amounts convolved using AEROIASI-H2SO4 AK and projected on the IASI swath (volcanic-only run in (c), volcanic+anthropogenic run in (d), at 10:00 LT). Pixels affected by clouds (in grey) and dust (orange) are also shown in (d), (e) IASI-SO 2 Oxford SO 2 column amounts, for the same IASI overpass as in (a). The black cross in (a) identifies the pixel of the spectra of Figure 1 and Figure 2.
Remotesensing 13 01808 g003
Figure 4. (a) Averaging kernels (AK) for a selected pixel into the eastern plume of Figure 3. Green are AK for surface-6 km, red for 7–12 km and blue 13–20 km; (b) vertical profile of the percent retrieval error of SA number density retrieval due to radiometric measurement noise (cyan profile), vertical smoothing (sky blue), and size distribution assumptions (red). Total random errors (blue) and total error (random plus size distribution, purple) are also shown.
Remotesensing 13 01808 g004
Figure 5. CHIMERE SO 2 raw column amount (anthropogenic-only run).
Remotesensing 13 01808 g005
Figure 6. Detections of SA (from AEROIASI-H2SO4, in red), SO 2 (from IASI-Oxford, in blue) and dust (from AEROIASI-Dust, in yellow). Simultaneous detections of SA and SO 2 are shown in violet. Cloudy (CF > 20%) and clear-sky pixels (CF < 20%) are indicated with black and light grey contour, respectively.
Remotesensing 13 01808 g006
Figure 7. (a) AEROIASI-H2SO4 mass column concentration for IASI daytime overpass on 19 March 2012; (b) average vertical profile of AEROIASI-H2SO4 mass concentration for the eastern section of the plume region. Horizontal lines represent the average altitude of the maximum in the SO 2 profiles for volcanic-only CHIMERE run, with its standard deviation, in the same plume area.
Remotesensing 13 01808 g007
Table 1. AEROIASI-H2SO4 main inputs.
InputDescription
Spectral micro-windows (cm 1 )(830.75,831.00), (842.75,844.00), (855.00,856.00), (861.50,862.00)
(863.00,863.50), (867.25,868.75), (873.25,875.50), (892.00,896.25)
(898.75,905.75), (906.75,908.25), (909.50,916.25), (917.50,918.00)
(918.75,919.25), (920.50,921.00), (922.75,924.50), (925.50,926.00)
(956.75,957.50), (974.50,975.25), (978.00,979.75), (1250.00,1250.50)
Mean radius of the SA layer size distribution0.50 μm
Standard deviation of the SA layer size distribution0.50
SA refractive indexBiermann et al. [26]
H 2 SO 4 mixing ratio57%
A-priori SA profile0.2 particles/cm 3 in the altitude range 4–21 km, zero elsewhere
R Constraint matrixConstant with altitude
Surface temperature and water vapor profiles, first guessERA-Interim reanalyses interpolated for IASI pixels
Publisher’s Note: MDPI stays neutral with regard to jurisdictional claims in published maps and institutional affiliations.

