
Inter-Urban Analysis of Pedestrian and Drivers through a Vehicular Network Based on Hybrid Communications Embedded in a Portable Car System and Advanced Image Processing Technologies


Abstract

1. Introduction
1.1. Automotive Safety and Future Perspectives
1.2. Motivation in the Field of Road Safety
2. Related Work
2.1. Vehicular Communication and Driving Safety Applications Issue, Related Works and Methods
2.1.1. Current Stages in DSRC, V2V, V2I, and V2X Communications
2.1.2. Debate on the Directions of Development in Road and Pedestrian Safety
2.1.3. Debating the Current State of RF-VLC Hybrid Communications in Road Safety Applications
3. Methods
3.1. Research Trends in Automotive Safety Applications and Hardware Design and Implementation
3.1.1. Description of Prototypes and Practical Scenarios
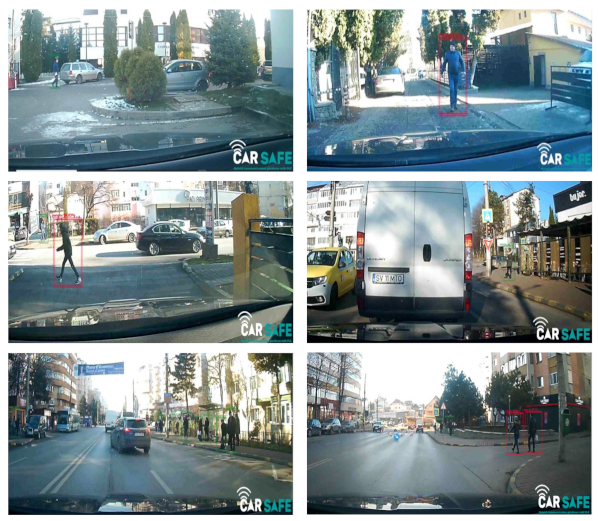
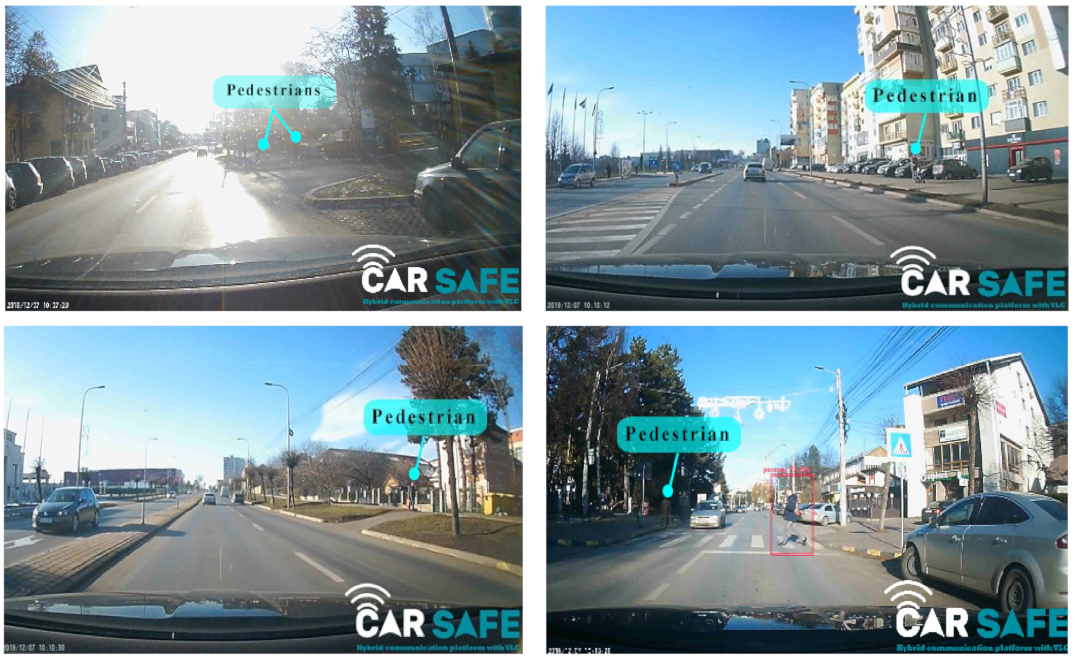
3.1.2. Description Pedestrian Setup and Practical Scenarios
3.1.3. Discussion on the Architecture and Algorithms
4. Results
4.1. Experimental Evaluation and Results
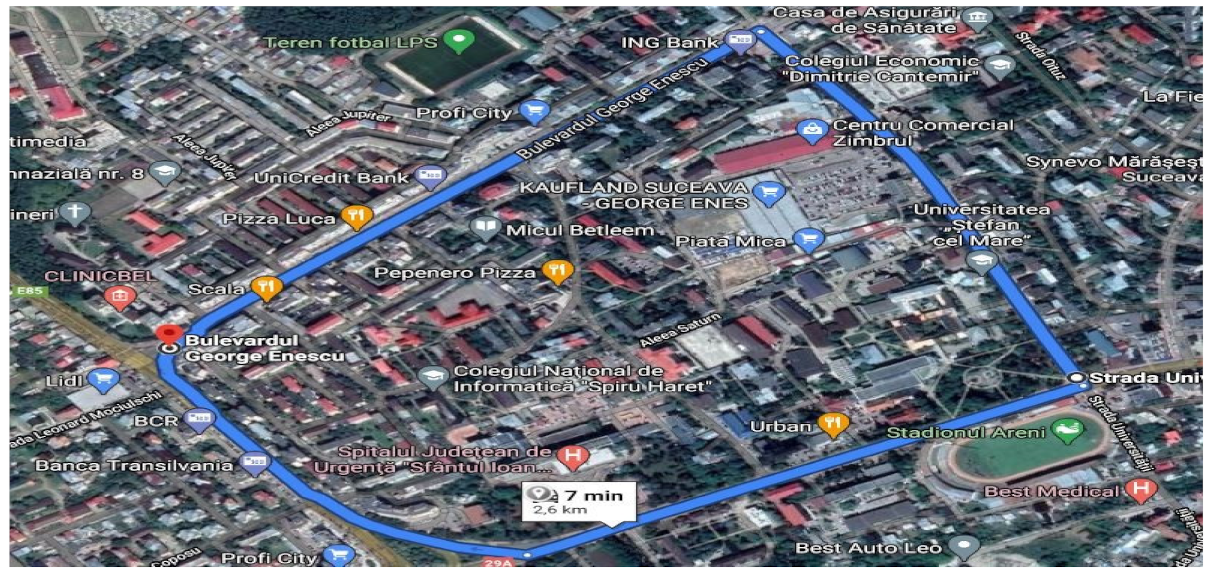
4.2. Description of External Environment and Practical Scenarios
4.2.1. Description of External Environment and Practical Scenarios
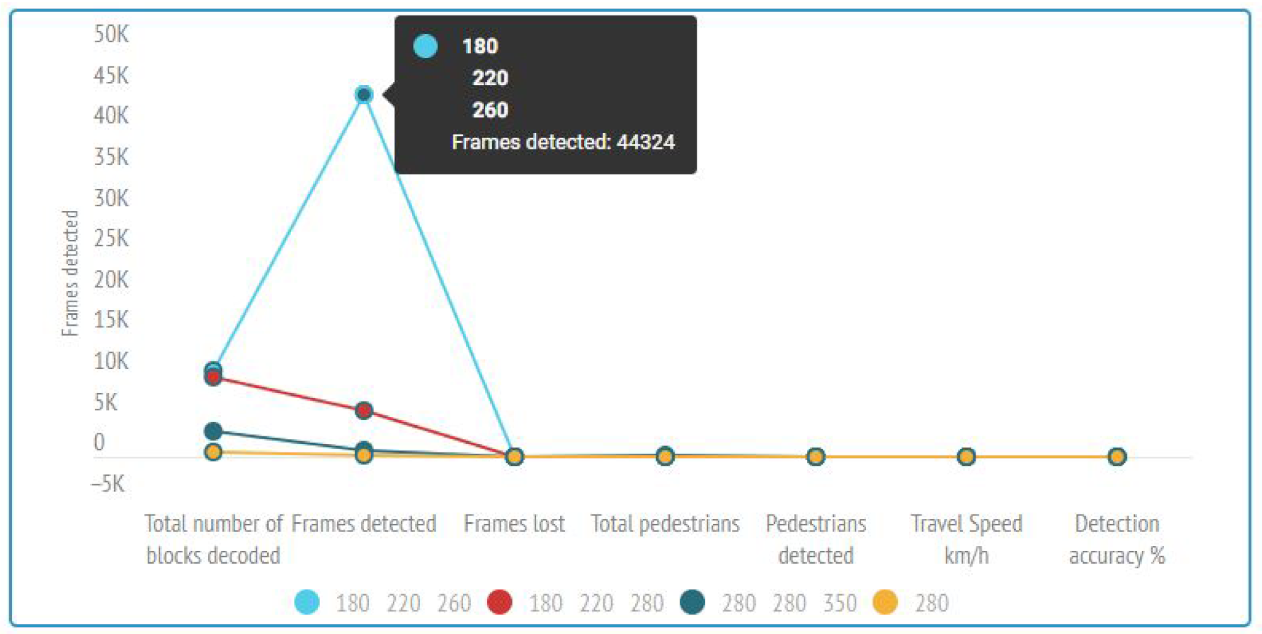
4.2.2. Experimental Evaluation and Experimental Results

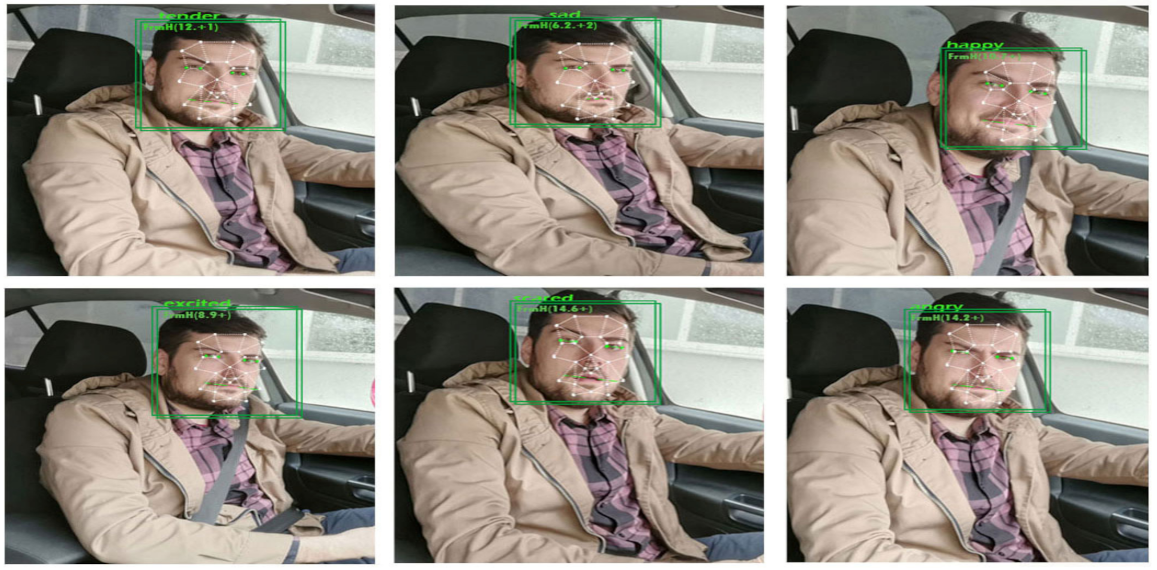
4.3. Description Emotion Drivers Setup and Practical Scenarios
4.3.1. Description of Emotion, Drivers Setup and Practical Scenarios
4.3.2. Description of Emotions, Drivers Setup and Practical Scenarios

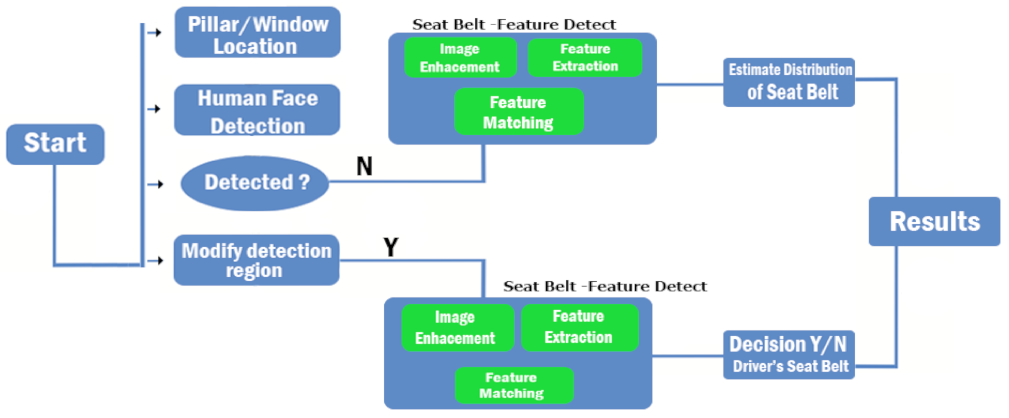
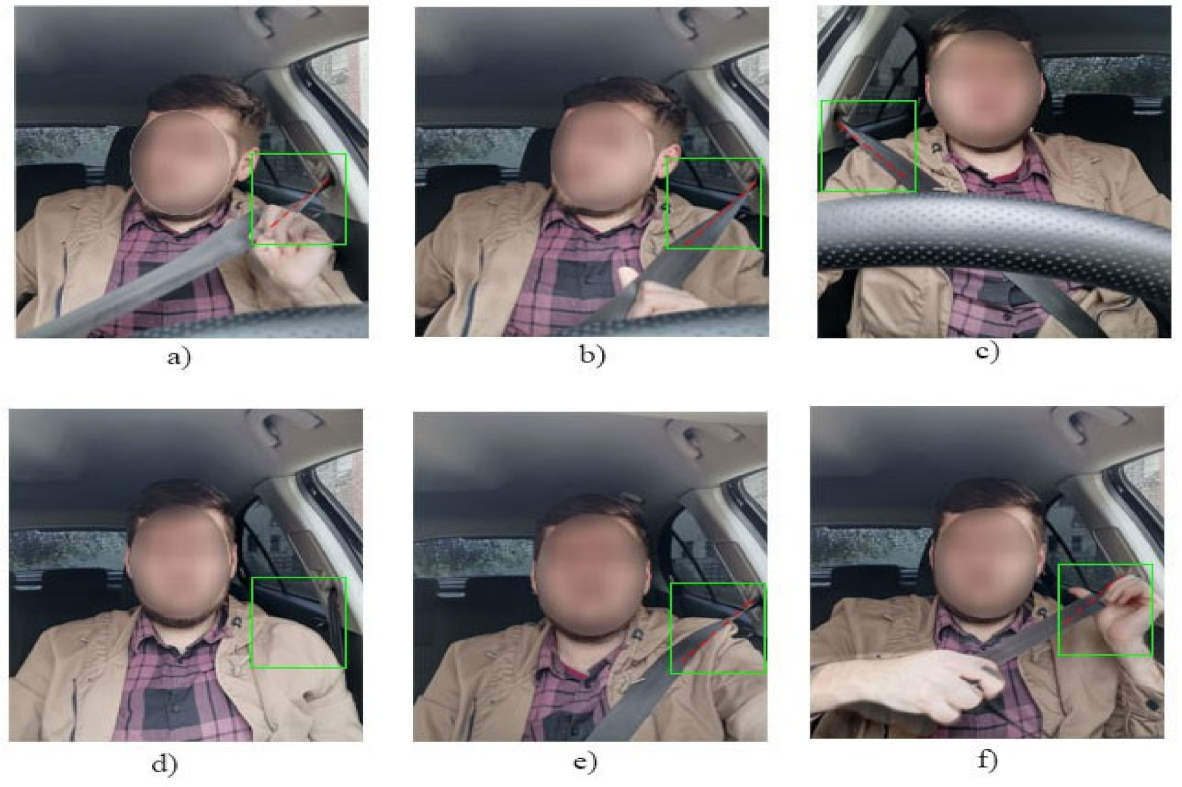
4.4. Description of Seatbelt Setup and Practical Scenarios
4.4.1. Discussion of Architecture

4.4.2. Experimental Evaluation and Practical Results
5. Final Discussion Concerning the Proposed System
6. Conclusions
Author Contributions
Funding
Institutional Review Board Statement
Informed Consent Statement
Conflicts of Interest
Abbreviations
| Key Acronyms Used in this Paper | |
| HOG | Oriented Gradient Histogram |
| V2V | Vehicle-to-Vehicle |
| V2I | Vehicle-to-Infrastructure |
| V2X | Vehicle-to-Everything |
| VLC | Visible Light Communication |
| I2V | Infrastructure-to-Vehicle |
| ITS | Intelligent Transportation System |
| NHTSA | National Traffic Safety Administration |
| DSRC | Dedicated Short Range Communication |
| LiDAR | Light Detection and Ranging |
| RF | Radio Frequency |
| AI | Artificial Intelligence |
| IoT | Internet of Things |
| NLP | Natural Language Processing |
| V2R | Vehicle-to-Road |
| MRI | Magnetic Resonance Imaging |
| CAN | Controller Area Network |
| OBD | On-Board Diagnostics |
| LTE | Long-Term Evolution |
| API | Application Programming Interface |
| R-CNN | Region Based Convolutional Neural Networks |
| SSD | Single Shot MultiBox Detector |
| YOLO | You Only Look Once |
| COCO | Common Objects in Context |
| R-FCN | Region-based Fully Convolutional Networks |
| T-CNN | Tube Convolutional Neural Network |
| IOU | Intersection over Union |
| FOV | Field-of-View |
| ReLU | Rectified Linear Units |
References
- World Health Organization. Fact Sheet 358—Road Traffic Injuries; World Health Organization: Geneva, Switzerland, 2016. [Google Scholar]
- World Health Organization. Global Status Report on Road Safety; Licence: CC BYNC-SA 3.0 IGO; World Health Organization: Geneva, Switzerland, 2018. [Google Scholar]
- U.S. Department of Transportation Research and Innovative Technology Administration. Frequency of Target Crashes for IntelliDrive Safety Systems; Technical Report; U.S. Department of Transportation Research and Innovative Technology Administration: Washington, DC, USA, 2010. [Google Scholar]
- Badler, N.I.; Smoliar, S.W. Digital Representations of Human Movement. ACM Comput. Surv. 1979, 11, 19–38. [Google Scholar] [CrossRef]
- Wang, J.; Badler, N.; Berthouze, N.; Gilmore, R.; Johnson, K.; Lapedriza, A.; Lu, X.; Troje, N. Panel: Bodily Expressed Emotion Understanding Research: A Multidisciplinary Perspective; Springer: Berlin/Heidelberg, Germany, 2020. [Google Scholar]
- Ferranti, L.; Brito, B.; Pool, E.; Zheng, Y.; Ensing, R.M.; Happee, R.; Shyrokau, B.; Kooij, J.F.P.; Alonso-Mora, J.; Gavrila, D.M. SafeVRU: A Research Platform for the Interaction of Self-Driving Vehicles with Vulnerable Road Users. In Proceedings of the 2019 IEEE Intelligent Vehicles Symposium (IV), Paris, France, 9–12 June 2019; pp. 1660–1666. [Google Scholar]
- Roth, M.; Jargot, D.; Gavrila, D.M. Deep End-to-end 3D Person Detection from Camera and Lidar. In Proceedings of the 2019 IEEE Intelligent Transportation Systems Conference (ITSC), Auckland, New Zealand, 27–30 October 2019; pp. 521–527. [Google Scholar]
- Mikolajczyk, K.; Tuytelaars, T.; Schmid, C.; Zisserman, A.; Matas, J.; Schaffalitzky, F.; Kadir, T.; Van Gool, L. A Comparison of Affine Region Detectors. Int. J. Comput. Vis. 2005, 65, 43–72. [Google Scholar] [CrossRef]
- Mikolajczyk, K.; Schmid, C.; Zisserman, A. Human Detection Based on a Probabilistic Assembly of Robust Part Detectors. Comput. Vis. ECCV 2004, 3021, 69–82. [Google Scholar]
- Dalal, N.; Triggs, B. Histograms of Oriented Gradients for Human Detection. In Proceedings of the International Conference on Computer Vision & Pattern Recognition (CVPR’05), San Diego, CA, USA, 20–25 June 2005; pp. 886–893. [Google Scholar]
- Boyraz, P.; Hansen, J.H. Active vehicle safety system design based on driver characteristics and behaviour. Int. J. Veh. Saf. 2009, 4, 330. [Google Scholar] [CrossRef]
- Kenney, J.B. Dedicated Short-Range Communications (DSRC) Standards in the United States. Proc. IEEE 2011, 99, 1162–1182. [Google Scholar] [CrossRef]
- Wu, X.; Subramanian, S.; Guha, R.; White, R.G.; Li, J.; Lu, K.W.; Bucceri, A.; Zhang, T. Vehicular Communications Using DSRC: Challenges, Enhancements, and Evolution. IEEE J. Sel. Areas Commun. 2013, 31, 399–408. [Google Scholar]
- Ligo, A.K.; Peha, J.M.; Ferreira, P.; Barros, J. Throughput and Economics of DSRC-Based Internet of Vehicles. IEEE Access 2017, 6, 7276–7290. [Google Scholar] [CrossRef]
- Koziol, M. MWC Barcelona 2019: On the Road to Self-Driving Cars, 5G Will Make Us Better Drivers; IEEE Spectrum Press: New York, NY, USA, 2019. [Google Scholar]
- Zadobrischi, E.; Cosovanu, L.; Avătămăniţei, S.; Căilean, A. Complementary Radiofrequency and Visible Light Systems for Indoor and Vehicular Communications. In Proceedings of the 2019 23rd International Conference on System Theory, Control and Computing (ICSTCC), Sinaia, Romania, 9–11 October 2019; pp. 419–423. [Google Scholar]
- Mannoni, V.; Berg, V.; Sesia, S.; Perraud, E. A Comparison of the V2X Communication Systems: ITS-G5 and C-V2X. In Proceedings of the IEEE Vehicular Technology Conference (VTC), Kuala-Lumpur, Malaysia, 28 April–1 May 2019. [Google Scholar]
- Zadobrischi, E.; Dimian, M. Vehicular Communications Utility in Road Safety Applications: A Step toward Self-Aware Intelligent Traffic Systems. Symmetry 2021, 13, 438. [Google Scholar] [CrossRef]
- Liu, S.; Gaudiot, J. Autonomous vehicles lite self-driving technologies should start small, go slow. IEEE Spectr. 2020, 57, 36–49. [Google Scholar] [CrossRef]
- Haider, A.S.; Hwang, S.-H. Adaptive Transmit Power Control Algorithm for Sensing-Based Semi-Persistent Scheduling in C-V2X Mode 4 Communication. Electronics 2019, 8, 846. [Google Scholar] [CrossRef]
- Cohen, S.A.; Hopkins, D. Autonomous vehicles and the future of urban tourism. Ann. Tour. Res. 2019, 74, 33–42. [Google Scholar] [CrossRef]
- Zheng, W.; Liang, L. Fast car detection using image strip features. In Proceedings of the 2009 IEEE Conference on Computer Vision and Pattern Recognition, Miami, FL, USA, 20–25 June 2009; pp. 2703–2710. [Google Scholar]
- Du, X.; Ang, M.H.; Rus, D. Car detection for autonomous vehicle: LIDAR and vision fusion approach through deep learning framework. In Proceedings of the 2017 IEEE/RSJ International Conference on Intelligent Robots and Systems (IROS), Vancouver, BC, Canada, 24–28 September 2017; pp. 749–754. [Google Scholar]
- Zhou, Y.; Wang, G.; Xu, G.; Fu, G. Safety driving assistance system design in intelligent vehicles. In Proceedings of the 2014 IEEE International Conference on Robotics and Biomimetics (ROBIO 2014), Bali, Indonesia, 5–10 December 2014; pp. 2637–2642. [Google Scholar]
- Chen, S.; Hu, J.; Shi, Y.; Zhao, L.; Li, W. A Vision of C-V2X: Technologies, Field Testing, and Challenges with Chinese Development. IEEE Internet Things J. 2020, 7, 3872–3881. [Google Scholar] [CrossRef]
- Qi, W.; Landfeldt, B.; Song, Q.; Guo, L.; Jamalipour, A. Traffic Differentiated Clustering Routing in DSRC and C-V2X Hybrid Vehicular Networks. IEEE Trans. Veh. Technol. 2020, 69, 7723–7734. [Google Scholar] [CrossRef]
- Sadio, O.; Ngom, I.; Lishou, C. Controlling WiFi Direct Group Formation for Non-Critical Applications in C-V2X Network. IEEE Access 2020, 8, 79947–79957. [Google Scholar] [CrossRef]
- Jamal, S.; Zeid, H.; Malli, M.; Yaacoub, E. Safe driving: A mobile application for detecting traffic accidents. In Proceedings of the 2018 IEEE Middle East and North Africa Communications Conference (MENACOMM), Jounieh, Lebanon, 18–20 April 2018; pp. 1–6. [Google Scholar]
- Croce, D.; Giarre’, L.; Pascucci, F.; Tinnirello, I.; Galioto, G.E.; Garlisi, D.; Valvo, A.L. An Indoor and Outdoor Navigation System for Visually Impaired People. IEEE Access 2019, 7, 170406–170418. [Google Scholar]
- Das, K. A Theoretical Approach to Define and Analyze Emotions. Int. J. Emerg. Ment. Health Hum. Resil. 2017, 19, 1–14. [Google Scholar]
- Girish, K.; Syeda, A.; Shireen, D. Magnetic resonance imaging (MRI)—A review. Int. J. Dent. Clin. 2011, 3, 65–70. [Google Scholar]
- Joyce, E.; Readinger, W.O.; Bora, K. Decision-Making and Cognitive Biases. Encycl. Ment. Health 2016. [Google Scholar] [CrossRef]
- Nuijten, A.; Benschop, N.; Rijsenbilt, A.; Wilmink, K. Cognitive Biases in Critical Decisions Facing SME Entrepreneurs: An External Accountants’ Perspective. Adm. Sci. 2020, 10, 89. [Google Scholar] [CrossRef]
- Zamkah, A.; Hui, T.; Andrews, S.; Dey, N.; Shi, F.; Sherratt, R.S. Identification of Suitable Biomarkers for Stress and Emotion Detection for Future Personal Affective Wearable Sensors. Biosensors 2020, 10, 40. [Google Scholar] [CrossRef]
- D’Errico, F.; Leone, G.; Schmid, M.; D’Anna, C. Prosocial Virtual Reality, Empathy, and EEG Measures: A Pilot Study Aimed at Monitoring Emotional Processes in Intergroup Helping Behaviors. Appl. Sci. 2020, 10, 1196. [Google Scholar] [CrossRef]
- Portilla-Tamarit, J.; Reus, S.; Portilla, I.; Fuster Ruiz-de-Apodaca, M.J.; Portilla, J. Impact of Advanced HIV Disease on Quality of Life and Mortality in the Era of Combined Antiretroviral Treatment. J. Clin. Med. 2021, 10, 716. [Google Scholar] [CrossRef] [PubMed]
- Christelle, P.; Céline, L.; Jean-Marie, C. The Influence of Emotions on Driving Behavior; Hennessy, D., Ed.; Nova Science Publishers: New York, NY, USA, 2011. [Google Scholar]
- Căilean, A.-M.; Dimian, M.; Popa, V. Noise-Adaptive Visible Light Communications Receiver for Automotive Applications: A Step Toward Self-Awareness. Sensors 2020, 20, 3764. [Google Scholar] [CrossRef] [PubMed]
- Zadobrischi, E.; Avatamanitei, S.-A.; Cailean, A.-M.; Dimian, M.; Negru, M.; Eduard, Z. Toward a hybrid vehicle communication platform based on VLC and DSRC technologies. In Proceedings of the 2019 IEEE 15th International Conference on Intelligent Computer Communication and Processing (ICCP), Cluj-Napoca, Romania, 5–7 September 2019; pp. 103–107. [Google Scholar]
- Cailean, A.-M.; Dimian, M. Current Challenges for Visible Light Communications Usage in Vehicle Applications: A Survey. IEEE Commun. Surv. Tutor. 2017, 19, 2681–2703. [Google Scholar] [CrossRef]
- Verbruggen, F.J.R.; Silvas, E.; Hofman, T. Electric Powertrain Topology Analysis and Design for Heavy-Duty Trucks. Energies 2020, 13, 2434. [Google Scholar] [CrossRef]
- Francisco, B.; Benjamin, K.; Dirk, H.; Tobias, K. A Systemic View on Autonomous Vehicles: Policy Aspects for a Sustainable Transportation Planning. disP Plan. Rev. 2018, 54, 12–15. [Google Scholar]
- Cailean, A.; Cagneau, B.; Chassagne, L.; Popa, V.; Dimian, M. A survey on the usage of DSRC and VLC in communication-based vehicle safety applications. In Proceedings of the IEEE 21st Symposium on Communications and Vehicular Technology in the Benelux (SCVT), Delft, The Netherlands, 10 November 2014; pp. 69–74. [Google Scholar]
- Cailean, S.A.; Dimian, M.; Done, A. Enhanced design of visible light communication sensor for automotive applications: Experimental demonstration of a 130 m link. In Proceedings of the 2018 Global LIFI Congress (GLC), Paris, France, 8–9 February 2018; pp. 1–4. [Google Scholar] [CrossRef]
- Romeo, F.; Campolo, C.; Molinaro, A.; Berthet, A.O. DENM Repetitions to Enhance Reliability of the Autonomous Mode in NR V2X Sidelink. In Proceedings of the 2020 IEEE 91st Vehicular Technology Conference (VTC2020-Spring), Antwerp, Belgium, 25–28 May 2020; pp. 1–5. [Google Scholar]
- Rohling, H. Car-to-car communications. In Proceedings of the 2012 International Symposium on Signals, Systems, and Electronics (ISSSE), Potsdam, Germany; 2012; pp. 1–5. [Google Scholar] [CrossRef]
- Moniaga, J.V.; Manalu, S.R.; Hadipurnawan, D.A.; Sahidi, F. Diagnostics vehicle’s condition using obd-ii and raspberry pi technology: Study literature. J. Phys.: Conf. Ser. 2018, 978, 012011. [Google Scholar] [CrossRef]
- Rimpas, D.; Papadakis, A.; Samarakou, M. OBD-II sensor diagnostics for monitoring vehicle operation and consumption. Energy Rep. 2020, 6, 55–63. [Google Scholar] [CrossRef]
- Moussa, M.; Moussa, A.; El-Sheimy, N. Steering Angle Assisted Vehicular Navigation Using Portable Devices in GNSS-Denied Environments. Sensors 2019, 19, 1618. [Google Scholar] [CrossRef] [PubMed]
- Avătămăniţei, S.; Căilean, A.; Zadobrischi, E.; Done, A.; Dimian, M.; Popa, V. Intensive Testing of Infrastructure-to-Vehicle Visible Light Communications in Real Outdoor Scenario: Evaluation of a 50 m link in Direct Sun Exposure. In Proceedings of the 2019 Global LIFI Congress (GLC), Paris, France, 12–13 June 2019; pp. 1–5. [Google Scholar]
- O’Brien, D.C.; Zeng, L.; Le-Minh, H.; Faulkner, G.; Walewski, J.W.; Randel, S. Visible light communications: Challenges and possibilities. In Proceedings of the IEEE 19th International Symposium on Personal, Indoor and Mobile Radio Communications, Cannes, France, 15–18 September 2008; pp. 1–5. [Google Scholar]
- Redmon, J.; Divvala, S.; Girshick, R.; Farhadi, A. You Only Look Once: Unified, Real-Time Object Detection. In Proceedings of the 2016 IEEE Conference on Computer Vision and Pattern Recognition (CVPR), Las Vegas, NV, USA, 27–30 June 2016; pp. 779–788. [Google Scholar] [CrossRef]
- Wu, F.; Jin, G.; Gao, M.; He, Z.; Yang, Y. Helmet Detection Based on Improved YOLO V3 Deep Model. In Proceedings of the 2019 IEEE 16th International Conference on Networking, Sensing and Control (ICNSC), Banff, AB, Canada, 9–11 May 2019; pp. 363–368. [Google Scholar]
- Yang, H.; Chen, L.; Chen, M.; Ma, Z.; Deng, F.; Li, M.; Li, X. Tender Tea Shoots Recognition and Positioning for Picking Robot Using Improved YOLO-V3 Model. IEEE Access 2019, 7, 180998–181011. [Google Scholar] [CrossRef]
- Liu, W.; Anguelov, D.; Erhan, D.; Szegedy, C.; Reed, S.E.; Fu, C.; Berg, A. SSD: Single Shot MultiBox Detector. In Proceedings of the 14th European Conference on Computer Vision, Amsterdam, The Netherlands, 11–14 October 2016. [Google Scholar]
- Deng, Z.; Sun, H.; Zhou, S.; Zhao, J.; Lei, L.; Zou, H. Fast multiclass object detection in optical remote sensing images using region based convolutional neural networks. In Proceedings of the 2017 IEEE International Geoscience and Remote Sensing Symposium (IGARSS), Fort Worth, TX, USA, 23–28 July 2017. [Google Scholar]
- Chen, E.; Tang, X.; Fu, B. A Modified Pedestrian Retrieval Method Based on Faster R-CNN with Integration of Pedestrian Detection and Re-Identification. In Proceedings of the 2018 International Conference on Audio, Language and Image Processing (ICALIP), Shanghai, China, 16–17 July 2018; pp. 63–66. [Google Scholar]
- Jockel, L.; Klas, M.; Martinez-Fernandez, S. Safe Traffic Sign Recognition through Data Augmentation for Autonomous Vehicles Software. In Proceedings of the 2019 IEEE 19th International Conference on Software Quality, Reliability and Security Companion (QRS-C), Sofia, Bulgaria, 22–26 July 2019; pp. 540–541. [Google Scholar]
- Bao, C.; Chen, C.; Kui, H.; Wang, X. Safe Driving at Traffic Lights: An Image Recognition Based Approach. In Proceedings of the 2019 20th IEEE International Conference on Mobile Data Management (MDM), Hong Kong, China, 10–13 June 2019; pp. 112–117. [Google Scholar]
- Chen, Y.-Y.; Jhong, S.-Y.; Li, G.-Y.; Chen, P.-H. Thermal-Based Pedestrian Detection Using Faster R-CNN and Region Decomposition Branch. In Proceedings of the 2019 International Symposium on Intelligent Signal Processing and Communication Systems (ISPACS), Taipei, Taiwan, 3–6 December 2019; pp. 1–2. [Google Scholar]
- Vasuki, P.; Veluchamy, S. Pedestrian detection for driver assistance systems. In Proceedings of the 2016 International Conference on Recent Trends in Information Technology (ICRTIT), Chennai, India, 8–9 April 2016; pp. 1–4. [Google Scholar]
- Szegedy, C.; Liu, W.; Jia, Y.; Sermanet, P.; Reed, S.; Anguelov, D.; Erhan, D.; Vanhoucke, V.; Rabinovich, A. Going deeper with convolutions. In Proceedings of the 2015 IEEE Conference on Computer Vision and Pattern Recognition (CVPR), Columbus, OH, USA, 23–28 June 2014. [Google Scholar]
- Setio, A.A.A.; Ciompi, F.; Litjens, G.; Gerke, P.; Jacobs, C.; Van Riel, S.J.; Wille, M.M.W.; Naqibullah, M.; Sanchez, C.I.; Van Ginneken, B. Pulmonary Nodule Detection in CT Images: False Positive Reduction Using Multi-View Convolutional Networks. IEEE Trans. Med. Imaging 2016, 35, 1160–1169. [Google Scholar] [CrossRef]
- Milletari, F.; Navab, N.; Ahmadi, S.-A. V-net: Fully convolutional neural networks for volumetric medical image segmentation. In Proceedings of the 2016 Fourth International Conference on 3D Vision (3DV), Stanford, CA, USA, 25–28 October 2016. [Google Scholar]
- Rezatofighi, H.; Tsoi, N.; Gwak, J.; Sadeghian, A.; Reid, I.; Savarese, S. Generalized Intersection over Union: A Metric and A Loss for Bounding Box Regression. arXiv 2019, arXiv:1902.09630. [Google Scholar]
- Güven, J. Investigating Techniques for Improving Accuracy and Limiting Overfitting for YOLO and Real-Time Object Detection on iOS. Bachelor’s Thesis, Malmö Universitet, Malmö, Sweden, 2019. [Google Scholar]
- Buzzy, M.; Thesma, V.; Davoodi, M.; Mohammadpour Velni, J. Real-Time Plant Leaf Counting Using Deep Object Detection Networks. Sensors 2020, 20, 6896. [Google Scholar] [CrossRef]
- Joshi, R.C.; Yadav, S.; Dutta, M.K.; Travieso-Gonzalez, C.M. Efficient Multi-Object Detection and Smart Navigation Using Artificial Intelligence for Visually Impaired People. Entropy 2020, 22, 941. [Google Scholar] [CrossRef] [PubMed]
- Zadobrischi, E.; Cosovanu, L.-M.; Dimian, M. Traffic Flow Density Model and Dynamic Traffic Congestion Model Simulation Based on Practice Case with Vehicle Network and System Traffic Intelligent Communication. Symmetry 2020, 12, 1172. [Google Scholar] [CrossRef]
- Qiu, X.; Yuan, C. Improving Object Detection with Convolutional Neural Network via Iterative Mechanism. Bioinform. Res. Appl. 2017, 10636, 141–150. [Google Scholar]
- Kim, J.; Lee, J.K.; Lee, K.M. Accurate Image Super-Resolution Using Very Deep Convolutional Networks. In Proceedings of the 2016 IEEE Conference on Computer Vision and Pattern Recognition (CVPR), Las Vegas, NV, USA, 26 June–1 July 2016; pp. 1646–1654. [Google Scholar]
- Redmon, J.; Farhadi, A. YOLO9000: Better, Faster, Stronger. In Proceedings of the 2017 IEEE Conference on Computer Vision and Pattern Recognition (CVPR), Honolulu, HI, USA, 21–26 July 2017; pp. 6517–6525. [Google Scholar]
- Takatori, N.; Nojima, K.; Matsumoto, M.; Yanashima, K.; Magatani, K. Development of voice navigation system for the visually impaired by using IC tags. In Proceedings of the 2006 International Conference of the IEEE Engineering in Medicine and Biology Society, New York, NY, USA, 30 August–3 September 2006; pp. 5181–5184. [Google Scholar]
- Yang, X.; Yuan, S.; Tian, Y. Assistive Clothing Pattern Recognition for Visually Impaired People. IEEE Trans. Hum. Mach. Syst. 2014, 44, 234–243. [Google Scholar] [CrossRef]
- Garcia-Garcia, A.; Orts-Escolano, S.; Oprea, S.; Villena-Martinez, V.; Garcia-Rodriguez, J. A Review on Deep Learning Techniques Applied to Semantic Segmentation. arXiv 2017, arXiv:1704.06857. [Google Scholar]
- Banerjee, C.; Mukherjee, T.; Pasiliao, E. An Empirical Study on Generalizations of the ReLU Activation Function. In Proceedings of the 2019 ACM Southeast Conference, Kennesaw, GA, USA, 18–20 April 2019. [Google Scholar]
- Favorskaya, M.; Andreev, V. The Study of Activation Functions in Deep Learning for Pedestrian Detection and Tracking. ISPRS-International Archives of the Photogrammetry, Remote Sensing and Spatial Information Sciences. ISPRS Int. Arch. Photogramm. Remote Sens. Spat. Inf. Sci. 2019, XLII-2/W12, 53–59. [Google Scholar] [CrossRef]
- Wang, W.; Wang, L.; Ge, X.; Li, J.; Yin, B. Pedestrian Detection Based on Two-Stream UDN. Appl. Sci. 2020, 10, 1866. [Google Scholar] [CrossRef]
- Hadi, R.A.; Sulong, G.; George, L.E. Vehicle Detection and Tracking Techniques: A Concise Review. Signal Image Process. Int. J. 2014, 5, 1–12. [Google Scholar] [CrossRef]
- Stephen, S.; Chetan, T.; Vancheswaran, A.; Ahmed, E.; Liviu, I. Improving Bicycle Safety through Automated Real-Time Vehicle Detection. 2010. Available online: https://scholarship.libraries.rutgers.edu/discovery/fulldisplay/alma991031549992004646/01RUT_INST:ResearchRepository (accessed on 19 January 2021).
- Ross, D.A.; Lim, J.; Lin, R.-S.; Yang, M.-H. Incremental learning for robust visual tracking. Int. J. Comput. Vis. 2008, 77, 125–141. [Google Scholar] [CrossRef]
- Fleyeh, H.; Dougherty, M. Road and traffic sign detection and recognition. In Proceedings of the 16th Mini-EURO Conference and 10th Meeting of EWGT, Poznan, Poland, 13–16 September 2015; pp. 644–653. [Google Scholar]
- Dewi, C.; Chen, R.-C.; Tai, S.-K. Evaluation of Robust Spatial Pyramid Pooling Based on Convolutional Neural Network for Traffic Sign Recognition System. Electronics 2020, 9, 889. [Google Scholar] [CrossRef]
- Zhang, Z.; Cui, L.; Liu, X.; Zhu, T. Emotion Detection Using Kinect 3D Facial Points. In Proceedings of the 2016 IEEE/WIC/ACM International Conference on Web Intelligence (WI), Omaha, NE, USA, 13–16 October 2016; pp. 407–410. [Google Scholar]
- Kumar, G.A.R.; Kumar, R.K.; Sanyal, G. Facial emotion analysis using deep convolution neural network. In Proceedings of the 2017 International Conference on Signal Processing and Communication (ICSPC), Coimbatore, India, 28–29 July 2017; pp. 369–374. [Google Scholar]
- De, A.; Saha, A. A comparative study on different approaches of real time human emotion recognition based on facial expression detection. In Proceedings of the 2015 International Conference on Advances in Computer Engineering and Applications, Ghaziabad, India, 19–20 March 2015; pp. 483–487. [Google Scholar]
- Shojaeilangari, S.; Yau, W.-Y.; Nandakumar, K.; Li, J.; Teoh, E.K. Robust Representation and Recognition of Facial Emotions Using Extreme Sparse Learning. IEEE Trans. Image Process. 2015, 24, 2140–2152. [Google Scholar] [CrossRef]
- Verma, A.; Singh, P.; Alex, J.S.R. Modified Convolutional Neural Network Architecture Analysis for Facial Emotion Recognition. In Proceedings of the 2019 International Conference on Systems, Signals and Image Processing (IWSSIP), Osijek, Croatia, 5–7 June 2019; pp. 169–173. [Google Scholar]
- Ko, K.; Sim, K. Development of a Facial Emotion Recognition Method Based on Combining AAM with DBN. In Proceedings of the 2010 International Conference on Cyberworlds, Singapore, 20–22 October 2010; pp. 87–91. [Google Scholar]
- Zhou, B.; Chen, L.; Tian, J.; Peng, Z. Learning-based seat belt detection in image using salient gradient. In Proceedings of the 2017 12th IEEE Conference on Industrial Electronics and Applications (ICIEA), Siem Reap, Cambodia, 18–20 June 2017; pp. 547–550. [Google Scholar]
- Qin, X.-H.; Cheng, C.; Li, G.; Zhou, X. Efficient seat belt detection in a vehicle surveillance application. In Proceedings of the 2014 9th IEEE Conference on Industrial Electronics and Applications, Hangzhou, China, 9–11 June 2014; pp. 1247–1250. [Google Scholar]
- Arimitsu, S.; Sasaki, K.; Hosaka, H.; Itoh, M.; Ishida, K.; Ito, A. Seat Belt Vibration as a Stimulating Device for Awakening Drivers. IEEE/ASME Trans. Mechatron. 2007, 12, 511–518. [Google Scholar] [CrossRef]
- Huh, J.H.; Cho, S.H. Seat Belt Reminder System in Vehicle Using IR-UWB Radar. In Proceedings of the 2018 International Conference on Network Infrastructure and Digital Content (IC-NIDC), Guiyang, China, 22–24 August 2018; pp. 256–259. [Google Scholar]
- Malathi, M.; Sujitha, R.; Revathy, M. Alcohol detection and seat belt control system using Arduino. In Proceedings of the 2017 International Conference on Innovations in Information, Embedded and Communication Systems (ICIIECS), Coimbatore, India, 17–18 March 2017; pp. 1–3. [Google Scholar]
- Joshi, K.; Roy, N.; Singh, G.; Bohara, V.A.; Srivastava, A. Experimental Observations on the Feasibility of VLC-Based V2X Communications under various Environmental Deterrents. In Proceedings of the 2019 IEEE International Conference on Advanced Networks and Telecommunications Systems (ANTS), Goa, India, 16–19 December 2019; pp. 1–4. [Google Scholar]
- Jia, J.; Zou, P.; Hu, F.; Zhao, Y.; Chi, N. Flexible Data Rate V2X Communication System beyond 1.84 Gb/s Based on MIMO VLC and Radar Integration. Appl. Sci. 2020, 10, 6636. [Google Scholar]
- Yeh, C.H.; Chow, C.W.; Gu, C.S.; Guo, B.S.; Chang, Y.J.; Weng, J.H.; Wu, M.C. 400 Mbit/s OOK green-LED visible light communication with low illumination. Opt. Quantum Electron. 2018, 50, 430. [Google Scholar] [CrossRef]
- Li, H.; Chen, X.; Guo, J.; Chen, H. A 550 Mbit/s real-time visible light communication system based on phosphorescent white light LED for practical high-speed low-complexity application. Opt. Express 2014, 22, 27203–27213. [Google Scholar] [CrossRef] [PubMed]
- Bazzi, A.; Masini, B.M.; Zanella, A.; Calisti, A. Visible light communications as a complementary technology for the internet of vehicles. Comput. Commun. 2016, 93, 39–51. [Google Scholar] [CrossRef]
- Masini, B.M.; Bazzi, A.; Zanella, A. Vehicular Visible Light Networks for Urban Mobile Crowd Sensing. Sensors 2018, 18, 1177. [Google Scholar] [CrossRef] [PubMed]


| Video Duration in Seconds | Total Number of Blocks Decoded | Frames Detected | Frames Lost | Total Pedestrians | Pedestrians Detected | Travel Speed km/h | Detection Accuracy % |
|---|---|---|---|---|---|---|---|
| 180 | 10,562 | 44,324 | 2 | 96 | 86 | 15–20 | 89.50% |
| 220 | 9803 | 3876 | 12 | 125 | 91 | 15–25 | 72.80% |
| 260 | 5992 | 2461 | 22 | 128 | 84 | 15–20 | 65.60% |
| 180 | 9762 | 5803 | 31 | 101 | 56 | 35–40 | 55.40% |
| 220 | 7893 | 2876 | 54 | 133 | 76 | 30–40 | 57.10% |
| 280 | 3942 | 1461 | 45 | 98 | 67 | 35–45 | 68.30% |
| 280 | 3162 | 803 | 76 | 176 | 56 | 40–50 | 31.80% |
| 280 | 2403 | 476 | 87 | 105 | 48 | 55–60 | 45.70% |
| 350 | 1242 | 461 | 123 | 178 | 61 | 60–65 | 34.20% |
| 280 | 743 | 324 | 134 | 144 | 54 | 60–65 | 37.50% |
| Video Duration in Seconds | Scenario | Frames Detected | Frames Lost | Total Objects | Objects Detected | Travel Speed km/h | Detection Accuracy % |
|---|---|---|---|---|---|---|---|
| 180 | 1 | 8964 | 12 | 196 | 146 | 15–20 | 74.40% |
| 220 | 2 | 7895 | 19 | 225 | 111 | 15–25 | 49.30% |
| 260 | 3 | 6785 | 27 | 328 | 184 | 15–20 | 56.10% |
| 180 | 4 | 8465 | 45 | 201 | 126 | 35–40 | 62.60% |
| 220 | 5 | 5683 | 32 | 333 | 176 | 30–40 | 52.80% |
| 280 | 6 | 6433 | 67 | 198 | 97 | 35–45 | 48.90% |
| 280 | 7 | 3453 | 146 | 444 | 104 | 60–65 | 23.40% |
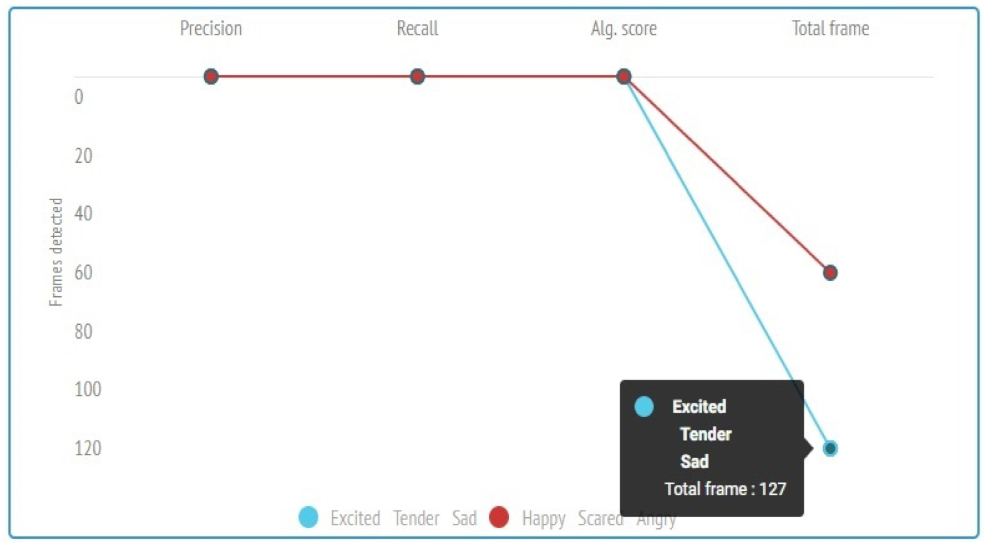
| Emotional States | Precision | Recall | Alg. | Total Frame |
|---|---|---|---|---|
| Score | ||||
| Excited | 0.68 | 0.69 | 0.71 | 127 |
| Tender | 0.37 | 0.96 | 0.38 | 77 |
| Sad | 0.24 | 0.98 | 0.29 | 98 |
| Happy | 0.77 | 0.89 | 0.84 | 67 |
| Scared | 0.55 | 0.58 | 0.33 | 89 |
| Angry | 0.78 | 0.78 | 0.71 | 67 |
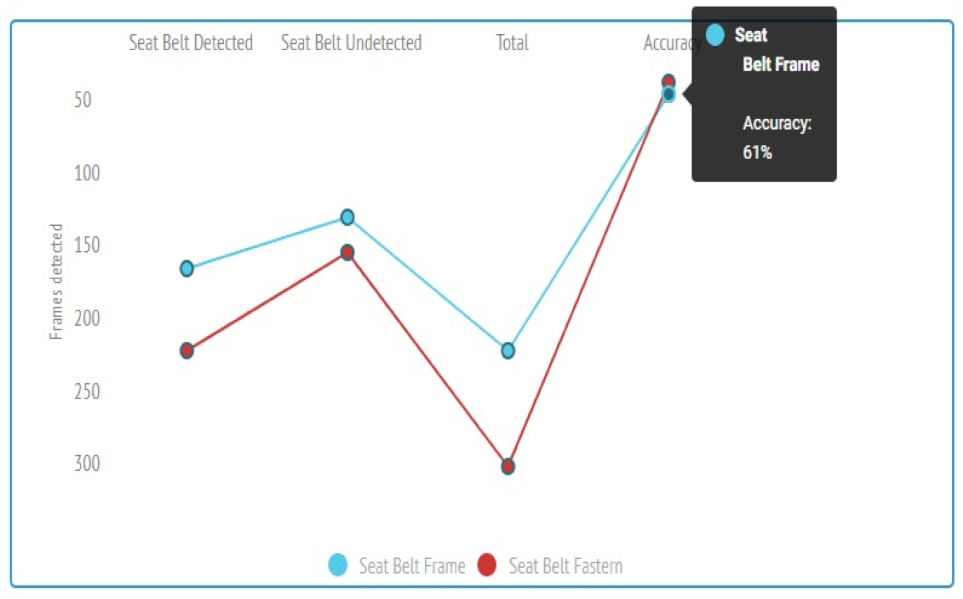
| Seat Belt Detected | Seat Belt Undetected | Total | Accuracy | |
|---|---|---|---|---|
| Seat Belt Frame | 181 | 146 | 237 | 61.7% |
| Seat Belt Fasten | 237 | 170 | 317 | 53.6% |
Publisher’s Note: MDPI stays neutral with regard to jurisdictional claims in published maps and institutional affiliations. |
© 2021 by the authors. Licensee MDPI, Basel, Switzerland. This article is an open access article distributed under the terms and conditions of the Creative Commons Attribution (CC BY) license (http://creativecommons.org/licenses/by/4.0/).
Share and Cite
Zadobrischi, E.; Dimian, M. Inter-Urban Analysis of Pedestrian and Drivers through a Vehicular Network Based on Hybrid Communications Embedded in a Portable Car System and Advanced Image Processing Technologies. Remote Sens. 2021, 13, 1234. https://doi.org/10.3390/rs13071234
Zadobrischi E, Dimian M. Inter-Urban Analysis of Pedestrian and Drivers through a Vehicular Network Based on Hybrid Communications Embedded in a Portable Car System and Advanced Image Processing Technologies. Remote Sensing. 2021; 13(7):1234. https://doi.org/10.3390/rs13071234
Chicago/Turabian StyleZadobrischi, Eduard, and Mihai Dimian. 2021. "Inter-Urban Analysis of Pedestrian and Drivers through a Vehicular Network Based on Hybrid Communications Embedded in a Portable Car System and Advanced Image Processing Technologies" Remote Sensing 13, no. 7: 1234. https://doi.org/10.3390/rs13071234
APA StyleZadobrischi, E., & Dimian, M. (2021). Inter-Urban Analysis of Pedestrian and Drivers through a Vehicular Network Based on Hybrid Communications Embedded in a Portable Car System and Advanced Image Processing Technologies. Remote Sensing, 13(7), 1234. https://doi.org/10.3390/rs13071234