Technical Note

Determining the Intangible: Detecting Land Abandonment at Local Scale

Department of Land Management and Landscape Architecture, Faculty of Environmental Engineering and Land Surveying, University of Agriculture in Krakow, 253c Balicka Street, 30-149 Krakow, Poland
*
Author to whom correspondence should be addressed.
Remote Sens. 2021, 13(6), 1166; https://doi.org/10.3390/rs13061166
Submission received: 9 February 2021 / Revised: 10 March 2021 / Accepted: 16 March 2021 / Published: 18 March 2021

Abstract

:
Precisely determining agricultural land abandonment (ALA) in an area is still difficult, even with recent progress in data collection and analysis. It is especially difficult in fragmented areas that need more tailor-made methods. The aim of this research was to determine ALA using airborne laser scanning (ALS) data, which are available in Poland with 4 to 6 points per square metre resolution. ALS data were processed into heat maps and modified with chosen kernel functions: triweight and Epanechnikov. The results of ALS data processing were compared to the control method, i.e., visual interpretation of an orthophotomap. This study shows that ALS data modelled with kernel functions allow for a good identification of ALA. The accuracy of results shows 82% concordance as compared to the control method. When comparing triweight and Epanechnikov functions, higher accuracy was achieved when using the triweight function. The research shows that ALS data processing is a promising method of detection of ALA and could provide an alternative to well-known methods such as the analysis of satellite images.

Graphical Abstract

1. Introduction

In times of population growth and climate changes, there is an increased demand for food [1,2,3] and one could logically assume that all agricultural land would be used for crop production. However, the developments in agricultural techniques and globalisation [4] have led to imparity [5], and therefore some areas are being affected by intensive agriculture, often monoculture [6], with other areas being abandoned [7].
Agricultural land abandonment (ALA) is a widespread phenomenon influencing regions throughout world [8,9,10]. However, it is particularly prevalent in mountainous areas [8,11,12] and in areas with more fragmented plot structures [13,14], which are the focus of this paper.
There is not a single, universal definition of ALA. Corbelle Rico and Crecente Maseda [15] suggest that while the land’s agricultural activity may be abandoned, this does not imply that the area is not used for other purposes or not used at all, which is reflected in its land cover. Keenleyside and Tucker [16] take the latter idea and define abandoned land as one in which all agricultural management has stopped and plant succession has started. Gałecka-Drozda and Zachariasz [17] take this notion further and emphasise that for the land to be defined as abandoned, the plant succession needs to be advanced. Land is considered to be abandoned if there is no agricultural activity for 5 years or more [16,18,19]. This definition is useful but, at the same time, it is difficult to use it for ALA detection as it relates to time. It is difficult to state, based on images or even a field trip, the amount of time for which a field has been already abandoned. Therefore, in this paper, we will rely on the visual and biological effects of land abandonment, which can be determined in the field. Cocca et al. [20] noted that some of the major consequences of ALA were the expansion of forests and shrubs and the decline of agricultural land. Abandoned fields are quickly overgrown with invasive species, which soon results in the disappearance of traditional land use patterns.
As Pointereau et al. [21] pointed out, various definitions provided in the literature prove the complexity of farmland abandonment. Moreover, these definitions depend on the type of their approach (e.g., administrative, economic, social). Furthermore, Benayas et al. [22] identified environmental and social problems related to abandonment, which include “(1) the reduction of landscape heterogeneity and promotion of vegetation homogenisation (often associated with increased fire risk); (2) soil erosion and desertification; (3) the reduction of water stocks; (4) biodiversity loss and reduced population of adapted species; and (5) the loss of cultural and aesthetic value”. The driving forces of agricultural land abandonment are most commonly social and economic factors, which is stressed in the etymology of the German term “Sozialbrache” (meaning, literally, social fallow land) [23] for land abandonment. Other factors include natural constraints, such as demographic structure changes and the institutional framework [24], and factors related to agricultural systems, such as land fragmentation [25,26].
Depending on the region of the world and various other factors, abandonment is thought to either positively or negatively influence biodiversity. In Europe, land abandonment is usually perceived negatively [9,27] and often causes lower biodiversity and the introduction of invasive ruderal species [28], which may be related to the long history of agriculture in the region.
ALA is not only difficult to define but also difficult to identify and measure [16]. It is not practical to construct research solely on the definition based on the time of the withdrawal of agricultural management, as there are usually no data on when the abandonment started. Therefore, research has to be conducted on the basis of the state of land cover in the research area. Bürgi et al. [29] have attempted to deduce the major processes in such changes, while Bieling et al. [30] have empirically evaluated the processes. To provide a more rigorous identification of specific locations of land abandonment, it is feasible to establish the plant succession within a general area.
Land abandonment is measured on many scales, mostly on the coarse scale of a satellite scene [7,31,32,33]. One of the well-known and widely used data sources which provides sufficient information on ALA in Europe is CORINE Land Cover, but this level of accuracy is not satisfactory for precise analyses at the regional and local level. There is also research on a more local level in the buffer zones of national parks [34] based on the expert evaluation of orthophotomaps. Further research involves field work [35] but this activity is both time-consuming and labour-intensive. As Bożek and Janus [13] pointed out, data which identify ALA at the level of individual villages, farms, and even individual plots are needed. This is particularly important in countries where agricultural production ceases but the land is maintained as agricultural land [16], a situation which also occurs in Poland. Currently, in Poland, there are no data on ALA in the official cadastral register as there is no dedicated class for these lands [19]. As such, there are no data on land abandonment, and research on land abandonment in Poland is scarce. Consequently, there is no basis for policymakers to regulate such lands or to create new policies for them.
Therefore, our overall goal was to develop and test a new method that captures agricultural land abandonment by combining both the spatial and statistical approaches. Our objectives were to separate ALA from active agriculture or forest using ALS data freely available for the research purposes. The methodology is based on ALS data used to determine the height of vegetation. High vegetation covering areas that are officially agricultural is an indication of ALA and shows its advancement. Therefore, there is also an attempt to quantify the extent to which the process of ALA has progressed and which methods of processing the data are most helpful in obtaining more accurate results in fragmented areas at a local scale. The paper aims to offer methodological insights into ALA detection in Poland since accurate detection and distribution of ALA is crucial as it could facilitate informed decision-making.

2. Materials and Methods

The province of Małopolska experienced one of the strongest declines in agricultural land in Poland between 2010 and 2019, which amounted to 70 thousand hectares [36], as well as a high level of land fragmentation. The mean size of parcels in this region is 0.37 ha [37] and, furthermore, the parcels tend to be long and narrow [38]. Many plots of between 0.06 ha and 0.1 ha are only 11 metres wide, with a length reaching even 125 metres [39]. Despite the fact that the land use patterns are not the most favourable for agriculture, Małopolska is well known for its agricultural traditions and produce. The southern part of the province is mountainous, making farming challenging and leading to a reduction in agricultural function in the area in favour of tourism and recreation. While choosing the research area, we considered the presence of some slopes as an asset as this is a driving force of ALA. Therefore, we selected an area that was hilly yet not typically mountainous. The subsidies in mountainous areas are high enough to incentivise maintaining the land in preparation for use for agriculture. The landscape of the research area—Okocim—is hilly, and its climate is mild, which makes it suitable for agriculture, and it has a ready-to-use set of digital cadastre data. The location of Okocim is illustrated in Figure 1, Figure 2, Figure 3 and Figure 4. The total area of the village is 1285 ha, including 638.67 ha of agricultural land. We considered only the land that was officially designated as agricultural land in our research. Agricultural land includes, according to official cadastral data, 78.82 ha of meadows, 118.7 ha of pastures, and 441.15 ha of arable land, which was the extent of study area.
We used airborne laser scanning data (ALS) for the analysis. The choice of data was dictated by their accessibility and precision. Collection of ALS datasets in Poland is required [40] for flood protection purposes within the ISOK Project (IT System of the Country’s Protection against Extreme Hazards). ALS data are collected in Standard I (min. 4 p/m2) for rural areas and in Standard II (min. 12 p/m2) for cities. We used Standard I data. The density of ALS data was 4-6 points per square metre [41] and the average error of the z coordinate was 0.2 m. We used 15 tiles of data that covered the whole test area of 1285 ha. Each tile had a surface area of 100 ha. The ISOK data were collected only in winter. Early winter or late autumn are favourable seasons for ALA detection, as the crops are already collected (therefore excluding the potentially confounding factor of reaching a certain height), and there was no snow cover yet. Naturally, using data collected in winter means that vegetation will be less developed than during the summer. It could result in an underestimation of ALA, which was taken into account at the later stage of the research (extrapolation was necessary to adjust the full process).
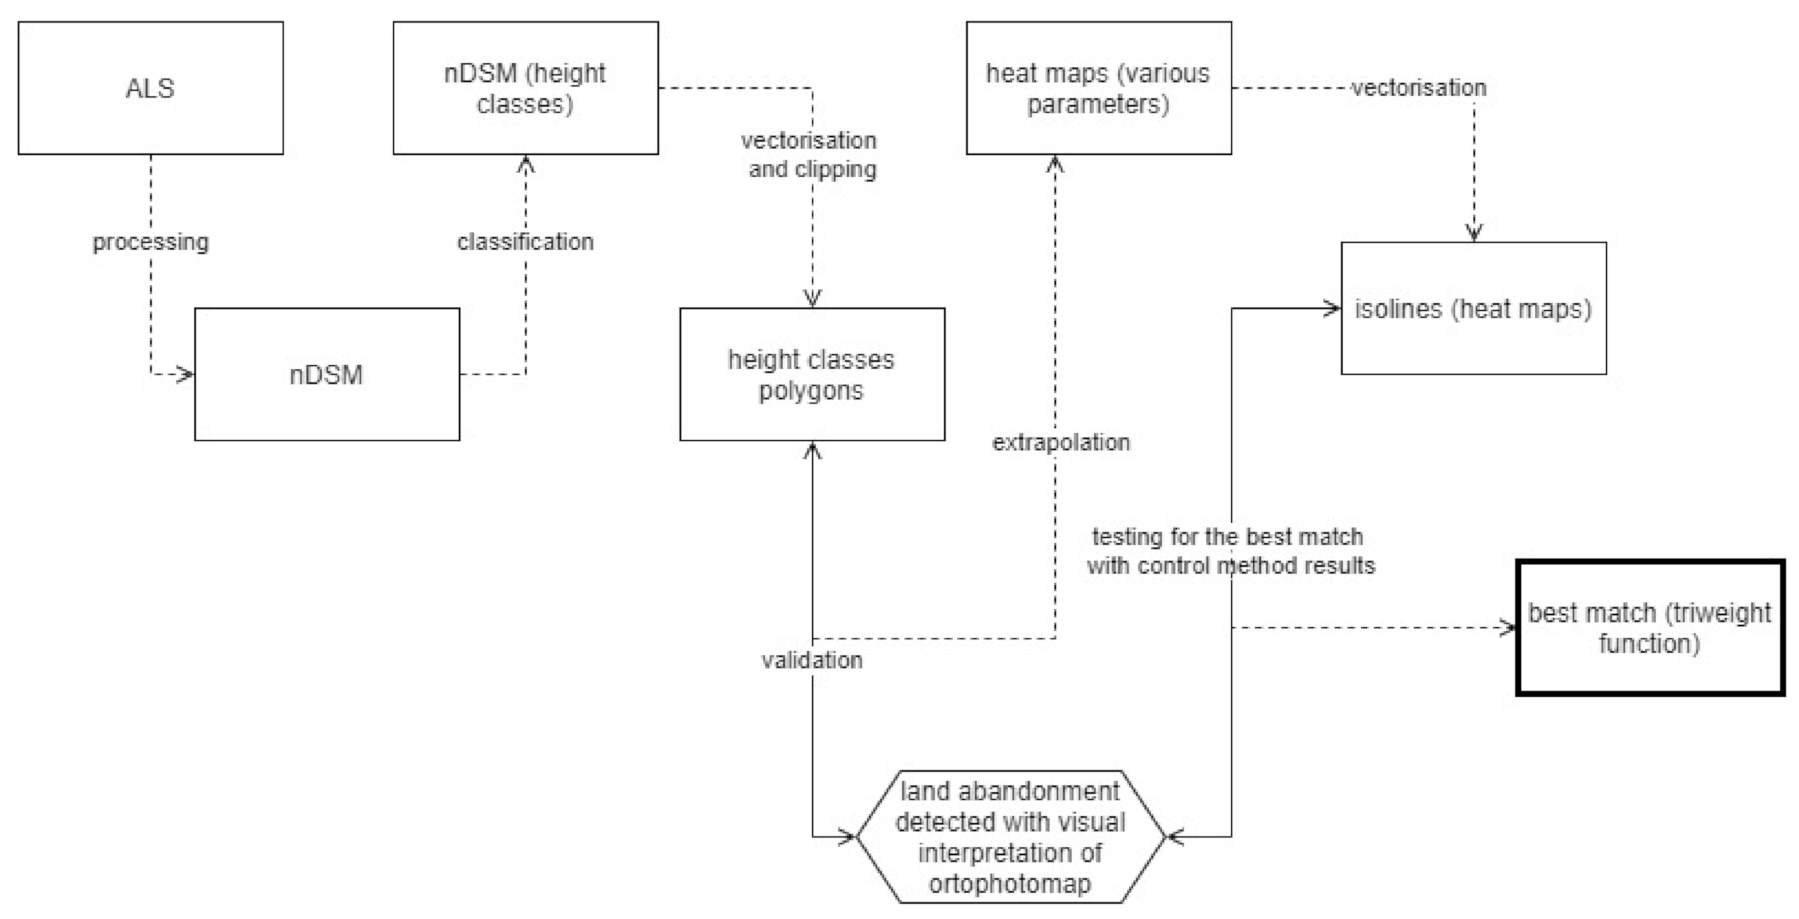
First, ALS data were processed into a normalised digital surface model (nDSM)—a raster that shows the absolute height of pixels. According to Szostak et al. [42], nDSM pixels of 1 m and more representing vegetation can be suggestive of ALA in the area that is officially designated as agricultural land. The land cover can be divided even further as the heights of mixed vegetation differ; for example, the highest grasses in this area can reach 2 m, and bushes or trees can be significantly higher. Therefore, for the purposes of this study, the land cover represented by pixels in the nDSM was divided into 6 height classes (Figure 4a) in order to make more accurate observations. The first height class included all the pixels with a height of up to 30 cm. This class acted as a filter for the data to eliminate uncertainties as the z accuracy of ALS data is +/−20 cm. The second class of up to 1 m was made according to the recommended approach for the detection of ALA [42]. The third class was set between 1 m and 2 m, and from this class onwards, we could consider ALA. In addition, according to the field observations made in a previous study [35], bushes are more likely to develop in such cases. All the other classes, class 4 (from 2 to 3 m), class 5 (from 3 to 4 m), and class 6 (everything over 4 m), were intended to include high bushy and definitely wooded land cover. The nDSM was vectorised to facilitate the analyses. In such a way, we obtained vector data with a designated height of each polygon. The analyses were meant to be performed only on agricultural land, i.e., meadows, pastures, and arable land; therefore, the vectorised nDSM was clipped to exclude other areas.
At this point, we conducted the first validation of the ALS method. In order to do this, we compared the surface area of the polygons with a height of over 1 m to the results of the visual interpretation of the orthophotomap using the control method. During visual interpretation of orthophotomap, all meadows, pastures, and arable land covered in trees and shrubs were classified as abandoned. Field observations in this area were also carried out, independently of this analysis [35], and confirmed land cover was observed on the orthophotomap. Only the areas designated as agricultural land (pastures, meadows, and arable land) in the cadastre were analysed both in the visual interpretation and in ALS data analyses (Figure 3). Forests and other land uses were excluded from the analyses. Further steps were dictated by the preliminary analyses of nDSM, which showed that classes from 3 to 6 (classified as ALA) were covering an underestimated area when compared to the results of the visual interpretation of the orthophotomap. This, in turn, created a necessity to extrapolate the data to establish the method that would provide the estimated area of land abandonment closest to the results of visual interpretation of the orthophotomap. This process led to the next stage in the methodology—the identification of the parameters of the extrapolation.
The extrapolation was based on a ready-made tool embedded in QGIS, the heat map, which was used to extrapolate the extent of land abandonment that was shown by the height classes from 3 to 6. It also provides an indication of where the abandonment is more advanced (Figure 4b). The tool was chosen as its algorithm permits the user to modify and choose its parameters: the radius (can be chosen on the basis of the layer attributes, or manually), the weight (height class), and the kernel function. A closer examination of the functionality of the tool revealed that the kernel function significantly impacts upon the analysis. Therefore, it was necessary to analyse the five different kernel functions that can be used for heat map generation (Figure 2). The graph of the functions (Figure 2) reveals that the Epanechnikov kernel function provides more weight to those observations close to the border of the range in comparison to other kernel functions. In addition, the Epanechnikov kernel is the most effective as it minimises the asymptotic mean integrated squared error (AMISE) [43]. The triweight function gives more weight to observations in the middle of the range. Therefore, these two functions were chosen for the analysis.
Based on the chart (Figure 2), we assume that the Epanechnikov function will better reflect the border values and therefore generate larger areas than the triweight function. Changes in vegetation can be quite subtle, particularly in winter, and therefore the method of data analysis should be sensitive to small changes in values.
To analyse and compare the surface areas of the heat maps modified using various parameters, the vector data were necessary. Therefore, isolines (Figure 4c) were generated from a raster heat map. Each isoline was given a unified number from 0 to 100, starting from the edge to the middle of the cluster (see Figure 4c). Some isolines are polygons, whilst others are a set of unconnected segments. The isolines were analysed to establish which case provided the greatest number of closed polygons with the largest surface area. Additionally, a coefficient of variation was generated for each isoline map. This allowed us to determine which parameters gave the results closest to the control method.
The first polygon isoline from the edge of the cluster depicts the extent and distribution of the ALA. The sum of such surface area defined by these closed polygons is the total surface area of the ALA obtained from the ALS data. To determine which isoline gave the optimal surface area of the ALA, the surface areas delimited by the isolines 2, 4, 6, 8, 10, and 20 were compared.
The comparison was made for the data generated by both the Epanechnikov kernel and triweight kernel (Figure 5). Isolines 2, 4, 6, 8, 10, and 20 were extracted from each dataset and, in addition, the accuracy of the distribution was compared with the results of the visual interpretation of the orthophotomap (Figure 6).
Comparison of the ALS data processing results with the visual interpretation of the orthophotomap indicates that the ALS data processing identified many objects that were too small to be visually recognised on the orthophotomap. Therefore, the results of ALS processing include many small objects that were disjointed from the results of the visual interpretation of the orthophotomap. Therefore, to be able to compare the surface area from both methods, it was necessary to exclude these disjointed objects from further analyses.
Figure 3 depicts the method step by step.

3. Results

The height classes applied to the ALS data identified those areas that could be treated as abandoned (Figure 4a).
The coefficient of variation generated for each isoline map is smaller in each case for the data modelled by the triweight kernel (all other parameters being equal) (Table 1). It provides a slight indication that the triweight function depicts the actual area of the abandoned land more successfully.
A visual interpretation of the orthophotomap showed that there are 107.46 ha of ALA in Okocim, which provides a control reference dataset that shows the real distribution and extent of ALA in Okocim.
As the ALS data were collected in winter and the density of the point cloud was relatively low (4 points per square metre), it was assumed that the area of ALA identified by ALS would be smaller than the real cover of brushwood and trees. Therefore, we assumed that the highest sum of surface area generated from the dataset in each case was closest to the real surface area of ALA (Figure 5).
To check the accuracy of ALS data processing, all the highest sums of surfaces without disjointed objects generated from the isolines were compared with the surface area generated in the visual interpretation of the orthophotomap (Table 2).
The sums of surface areas without disjointed objects constitute up to 82% of the area identified in the visual interpretation of orthophotomap. In the case of data modified with the triweight function, i.e., cases 2, 4, and 6, the accuracy is higher than for the Epanechnikow kernel (Figure 6), constituting 82%, 74%, and 46% of the surface areas identified with visual interpretation of the orthophotomap.

4. Discussion

In Poland, the area of agricultural land shrank from 15.5 million hectares in 2010 to 14.7 million hectares in 2018. Notably, Małopolska experienced the strongest agricultural land decline in Poland between 2010 and 2019 (between 50 and 70 thousand hectares) [36]. Some of the driving forces include urbanisation, land fragmentation, and the low quality of agricultural land [36]. The population of Małopolska is distributed evenly between rural and urban areas. In 2019, 51.8% of the population lived in rural areas and the rural population grew in comparison to 2018, which is confirmation of the vast research potential.
The case of Okocim shows that official land designation is not consistent with land cover, and ALA occurs in villages. This could be remedied by an update in the official land use database, which is costly and, therefore, infrequent [44]. The approach used for the purpose of this study focused on land officially designated as agricultural. While it is a very useful method to detect and analyse ALA in areas where it officially should not exist, the authors admit that there is still vast potential for research on ALA in areas with other official designations, which would in itself present a direction for new studies.
In many studies, coarse resolution [32,33] free satellite data are used to detect land abandonment; however, in highly fragmented areas, a higher level of precision is preferred and the easily accessible ALS data were an obvious choice. A study on a small control area [42] confirmed that ALS data are precise enough to show agricultural land abandonment at pixels of nDSM over 1 m. Our study agrees with this finding, and the use of various height classes helped to confirm such a threshold. Additionally, seasonal variation means that there are times when all vegetation is covered in snow or when crops could potentially exceed 1 m in height. Therefore, a solid knowledge of agricultural timeframes is crucial for adequate data collection. An ideal time for data collection is, for example, late autumn, after harvest, or early winter, when there is no snow cover yet (as was the case in our study).
The preliminary assumption was that dividing the data into height classes could be helpful in determining the period of time over which the land was agriculturally abandoned. We assumed that during the first two years of abandonment, grasses and annual and biennial species would start to appear, followed, during the next two years, by shrubs and perennial herbs [45]. The germination of trees is likely to occur when ALA has been present in the area for more than 5 years [46]. However, such division could not be directly linked with the period of time as the vegetation growth differs between species. This proves Jucha and Marszałek’s [47] conclusion that determining the point in time when the process of land abandonment started is challenging. Height classes 3, 4, 5, and 6 covered only small areas; therefore, it was necessary to extrapolate them with heat maps. The height classes were used as modifying parameters in two heat maps.
Presentation of the data as heat maps is helpful to show where the intensity of the phenomenon is highest, rather than merely illustrating the surface cover of the phenomenon. It also helps to extrapolate land abandonment as the control method (visual interpretation of orthophotomap) shows that the results of laser scanning do not always account for the full extent of the phenomenon. The method used in this research can be therefore a means to visualise the stage of land abandonment similarly to the coarser visualisation of land abandonment presented by Krysiak et al. [48]. The heat map could be useful for the decision-makers as it identifies where the land abandonment is the most advanced and how it progressed after the political transformation of 1990. Other research on ALA was performed across the entire province of Małopolska by Janus and Bożek [13], but it was less detailed and was conducted at a different scale. The ratios obtained for the municipality in that study are lower than the ratio obtained in our study. One of the reasons for this may be that the municipality contained part of a city, which was excluded from the research but was considered in counting the percentage of the surface area of the whole municipality. Therefore, the results obtained included urban areas and differed from the results of our study as our research was conducted in a region that did not include any heavily built-up areas. The results of our study show the percentage of land abandonment on only agricultural areas in the village, which demonstrate that around 17% of all agricultural land is abandoned, according to the visual interpretation of orthophotomap. Accordingly, it gives a result of 14% from the laser scanning data, which is not a significant difference.
Accurate detection of ALA may be important in many different settings. For instance, in Poland, there is a recommendation to have tress or bushes between plots [49] to prevent erosion [50], reduce the impact of wind on the crops, and increase water retention in the soil [51]. Accurate detection of such practices can be helpful in distinguishing purposeful plot division from ALA. Conversely, being able to accurately detect the size of such phenomena can aid in the early recognition of ALA where it is not intended to be situated.
One might be safe to define the modern world as an ever-changing structural system. Close monitoring of changes in something that may seem as unchangeable as agriculture is therefore crucial to be able to analyse it well. The importance of being able to conduct such analyses is highlighted by the growing attention being paid to issues such as food security, the key to which are rigorous databases upon which we can base our informed decisions. ALA becomes an important topic and being able to confidently define its progress and extent can have crucial consequences for the population. According to Rega [52], agricultural land has traditionally received less attention from spatial planners than urban areas and urbanised landscapes, therefore further highlighting the importance of studies such as ours and of developing this field.

5. Conclusions

The research shows that the ALA identified with ALS processing used in the research depends on the chosen parameters, mostly on the kernel function. Higher accuracies were obtained with the triweight function in comparison with the Epanechnikov kernel.
Processing of ALS data gives results similar to time-consuming and labour-intensive visual interpretation of orthophotomaps. The proposed method can be treated as a semi-automated method for the identification of agricultural land abandonment in highly fragmented areas.
Even though the ALS data were collected in the winter, the research proved that ALS data are a fine source of information on agricultural land abandonment. The Central Geodetic and Cartographic Office provides information on the weather conditions and snow cover during the ALS survey, and therefore even the data collected during the winter allow for the identification of ALA, despite the low leaf cover. However, the method could be more effective if performed on data with higher point cloud density or on data collected in the summer.
The method should be further calibrated and performed in other areas to verify the best results and to make further improvements to the method. It would also help to adapt the method and make it applicable in a more general sense.

Author Contributions

Conceptualisation, B.C. and T.S.; Formal analysis, B.C.; Investigation, B.C.; Methodology, B.C. and T.S.; Project administration, B.C.; Resources, B.C., T.S. and J.H.; Supervision, J.H.; Visualisation, B.C. and R.R.-C.; Writing—original draft, B.C., R.R.-C. and R.D.-G.; Writing—review and editing, B.C., R.R.-C. and R.D.-G. All authors have read and agreed to the published version of the manuscript.

Funding

This research was funded by the project “Cultural heritage of small homelands”, no. PPI/APM/2018/1/00010/U/001, financed by the Polish National Agency for Academic Exchange as a part of the International Academic Partnerships.

Institutional Review Board Statement

Not applicable.

Informed Consent Statement

Not applicable.

Data Availability Statement

Publicly available datasets were analyzed in this study. This data can be requested here: [https://mapy.geoportal.gov.pl/imap/Imgp_2.html?SRS=2180&resources=map:wms@https://mapy.geoportal.gov.pl/wss/service/PZGIK/DanePomNMT/WMS/SkorowidzeWUkladzieKRON86] (accessed on 30 June 2020).

Conflicts of Interest

The funders had no role in the design of the study; in the collection, analyses, or interpretation of data; in the writing of the manuscript, or in the decision to publish the results.

References

  1. De Amorim, W.S.; Borchardt Deggau, A.; do Livramento Gonçalves, G.; da Silva Neiva, S.; Prasath, A.R.; Salgueirinho Osório de Andrade Guerra, J.B. Urban challenges and opportunities to promote sustainable food security through smart cities and the 4th industrial revolution. Land Use Policy 2019, 87, 104065. [Google Scholar] [CrossRef]
  2. World Economic Forum. Global Risks Report 2019; World Economic Forum: Geneva, Switzerland, 2019; ISBN 9781944835156. [Google Scholar]
  3. De Amorim, W.S.; Valduga, I.B.; Ribeiro, J.M.P.; Williamson, V.G.; Krauser, G.E.; Magtoto, M.K.; de Andrade Guerra, J.B.S.O. The nexus between water, energy, and food in the context of the global risks: An analysis of the interactions between food, water, and energy security. Environ. Impact Assess. Rev. 2018, 72, 1–11. [Google Scholar] [CrossRef]
  4. Piniero, M.-C. Globalization and industrialization of agriculture: Impacts on rural Chocontá, Colombia. Luna Azul 2016, 43, 468–498. [Google Scholar] [CrossRef] [Green Version]
  5. Marsden, T. Mobilities, vulnerabilities and sustainabilities: Exploring pathways from denial to sustainable rural development. Sociol. Rural. 2009, 49, 113–131. [Google Scholar] [CrossRef]
  6. Azhar, B.; Lindenmayer, D.B.; Wood, J.; Fischer, J.; Zakaria, M. Ecological impacts of oil palm agriculture on forest mammals in plantation estates and smallholdings. Biodivers. Conserv. 2014, 23, 1175–1191. [Google Scholar] [CrossRef]
  7. Alcantara, C.; Kuemmerle, T.; Prishchepov, A.V.; Radeloff, V.C. Mapping abandoned agriculture with multi-temporal MODIS satellite data. Remote Sens. Environ. 2012, 124, 334–347. [Google Scholar] [CrossRef]
  8. Li, S.; Li, X. Global understanding of farmland abandonment: A review and prospects. J. Geogr. Sci. 2017, 27, 1123–1150. [Google Scholar] [CrossRef]
  9. Queiroz, C.; Beilin, R.; Folke, C.; Lindborg, R. Farmland abandonment: Threat or opportunity for biodiversity conservation? A global review. Front. Ecol. Environ. 2014, 12, 288–296. [Google Scholar] [CrossRef]
  10. Ramankutty, N.; Foley, J.A. Estimating historical changes in land cover North American croplands from 1850 to 1992. Glob. Ecol. Biogeogr. 1999, 8, 381–396. [Google Scholar] [CrossRef]
  11. MacDonald, D.; Crabtree, J.R.; Wiesinger, G.; Dax, T.; Stamou, N.; Fleury, P.; Gutierrez Lazpita, J.; Gibon, A. Agricultural abandonment in mountain areas of Europe: Environmental consequences and policy response. J. Environ. Manag. 2000, 59, 47–69. [Google Scholar] [CrossRef]
  12. Savulescu, I.; Mihai, B.A.; Vîrghileanu, M.; Nistor, C.; Olariu, B. Mountain arable land abandonment (1968–2018) in the Romanian Carpathians: Environmental conflicts and sustainability issues. Sustainability 2019, 11, 6679. [Google Scholar] [CrossRef] [Green Version]
  13. Janus, J.; Bozek, P. Land abandonment in Poland after the collapse of socialism: Over a quarter of a century of increasing tree cover on agricultural land. Ecol. Eng. 2019, 138, 106–117. [Google Scholar] [CrossRef]
  14. Kolecka, N.; Kozak, J.; Kaim, D.; Dobosz, M.; Ostafin, K.; Ostapowicz, K.; Wężyk, P.; Price, B. Understanding farmland abandonment in the Polish Carpathians. Appl. Geogr. 2017, 88, 62–72. [Google Scholar] [CrossRef]
  15. Corbelle Rico, E.; Crecente Maseda, R. Land Abandonment Concept and Consequences. Rev. Galega Econ. 2008, 17, 1–13. [Google Scholar]
  16. Keenleyside, C.; Tucker, G. Farmland Abandonment in the EU: An Assessment of Trends and Prospects; Report prepared for WWF; Institute for European Environmental Policy: London, UK, 2010. [Google Scholar]
  17. Gałecka-Drozda, A.; Zachariasz, A. Tereny postagrarne w największych miastach Polski. Pr. Kom. Kraj. Kult. Cult. Landsc. Comm. 2017, 38, 57–70. [Google Scholar]
  18. FAO FAOSTAT. Methods & Standards. Available online: http://www.fao.org/ag/agn/nutrition/Indicatorsfiles/Agriculture.pdf (accessed on 30 June 2020).
  19. Krysiak, S. Odłogi w krajobrazach Polski środkowej—Aspekty przestrzenne, typologiczne i ekologiczne. Probl. Ekol. Kraj. 2011, 41, 89–96. [Google Scholar]
  20. Cocca, G.; Sturaro, E.; Gallo, L.; Ramanzin, M. Is the abandonment of traditional livestock farming systems the main driver of mountain landscape change in Alpine areas? Land Use Policy 2012, 29, 878–886. [Google Scholar] [CrossRef]
  21. Pointereau, P.; Coulon, F.; Girard, P.; Lambotte, M.; Stuczynski, T.; Sánchez Ortega, V.; Del Rio, A. Analysis of Farmland Abandonment and the Extent and Location of Agricultural Areas that are Actually Abandoned or are in Risk to be Abandoned; Anguiano, E., Bamps, C., Terres, J., Red, M., Eds.; European Commission Joint Research Centre: Brussels, Belgium, 2008; ISBN EUR 23411EN. [Google Scholar]
  22. Rey Benayas, J.; Matins, A.; Nicolau, J.M.; Schulz, J.J. Abandonment of agricultural land: An overview of drivers and consequences. CAB Rev. Perspect. Agric. Vet. Sci. Nutr. Nat. Resour. 2007, 2, 1–14. [Google Scholar] [CrossRef] [Green Version]
  23. Ruppert, K. Zur Definition des Begriffes “Sozialbrache” (The Meaning of the Term “Sozialbrache” (Social Fallow)). Erdkunde 1958, 12, 226–231. [Google Scholar]
  24. Terres, J.M.; Scacchiafichi, L.N.; Wania, A.; Ambar, M.; Anguiano, E.; Buckwell, A.; Coppola, A.; Gocht, A.; Källström, H.N.; Pointereau, P.; et al. Farmland abandonment in Europe: Identification of drivers and indicators, and development of a composite indicator of risk. Land Use Policy 2015, 49, 20–34. [Google Scholar] [CrossRef]
  25. Satola, L.; Wojewodzic, T.; Sroka, W. Barriers to exit encountered by small farms in light of the theory of new institutional economics. Agric. Econ. 2018, 64, 277–290. [Google Scholar]
  26. Wojewodzic, T. Procesy Dywestycji i Dezagraryzacji w Rolnictwie na Obszarach o Rozdrobnionej Strukturze Agrarnej. In Zeszyty Naukowe Uniwersytetu Rolniczego; Wydawnictwo Uniwersytetu Rolniczego: Kraków, Poland, 2017. [Google Scholar]
  27. Perpiña Castillo, C.; Kavalov, B.; Diogo, V.; Jacobs-Crisioni, C.; Batista e Silva, F.; Lavalle, C. JRC Policy Insights: Agricultural Land Abandonment in the EU within 2015–2030; JRC Working Papers JRC113718; Joint Research Centre (Seville site): Ispra, Italy, 2018; pp. 1–7. [Google Scholar]
  28. Rola, J.; Rola, H. Solidago SPP. biowskaźnikiem występowania odłogów na gruntach rolnych. Fragm. Agron. 2010, 27, 122–131. [Google Scholar]
  29. Schneeberger, N.; Bürgi, M.; Kienast, P.D.F. Rates of landscape change at the northern fringe of the Swiss Alps: Historical and recent tendencies. Landsc. Urban Plan. 2007, 80, 127–136. [Google Scholar] [CrossRef]
  30. Bieling, C.; Plieninger, T.; Schaich, H. Patterns and causes of land change: Empirical results and conceptual considerations derived from a case study in the Swabian Alb, Germany. Land Use Policy 2013, 35, 192–203. [Google Scholar] [CrossRef]
  31. Witmer, F.D.W.; O’Loughlin, J. Satellite Data Methods and Application in the Evaluation of War Outcomes: Abandoned Agricultural Land in Bosnia-Herzegovina After the 1992–1995 Conflict. Ann. Assoc. Am. Geogr. 2009, 99, 1033–1044. [Google Scholar] [CrossRef]
  32. Alcantara, C.; Kuemmerle, T.; Baumann, M.; Bragina, E.V.; Griffiths, P.; Hostert, P.; Knorn, J.; Müller, D.; Prishchepov, A.V.; Schierhorn, F.; et al. Mapping the extent of abandoned farmland in Central and Eastern Europe using MODIS time series satellite data. Environ. Res. Lett. 2013, 8, 035035. [Google Scholar] [CrossRef]
  33. Prishchepov, A.V.; Radeloff, V.C.; Dubinin, M.; Alcantara, C. The effect of Landsat ETM/ETM+ image acquisition dates on the detection of agricultural land abandonment in Eastern Europe. Remote Sens. Environ. 2012, 126, 195–209. [Google Scholar] [CrossRef]
  34. Majchrowska, A. Abandonment of agricultural land in central Poland and its ecological role. Ekológia 2013, 32, 320–327. [Google Scholar] [CrossRef]
  35. Czesak, B.; Cegielska, K.; Cherkes, B.; Różycka-Czas, R.; Salata, T. Fieldwork approach to determining the extent of agricultural land abandonment-case study. Geomat. Landmanag. Landsc. 2016, 3, 21–31. [Google Scholar] [CrossRef]
  36. Ministerstwo Rolnictwa i Rozwoju Wsi. Diagnoza Sutuacji Społęczno-Gospodarczej Rolnictwa, Obszarów Wiejskich i Rybactwa w Polscie; Ministerstwo Rolnictwa i Rozwoju Wsi: Warszawa, Poland, 2019.
  37. Janus, J.; Taszakowski, J. The Idea of Ranking in Setting Priorities for Land Consolidation Works. Geomat. Landmanag. Landsc. 2015, 1, 31–43. [Google Scholar] [CrossRef]
  38. Janus, J.; Glowacka, A.; Bozek, P. Identification of Areas With Unfavorable Agriculture Development. Eng. Rural Dev. 2016, 1260–1265. [Google Scholar]
  39. Król, Ż. Charakterystyka szachownicy gruntów o układzie wstęgowym na przykładzie miejscowości Brzeziny Gmina Puchaczów. Infrastrukt. Ekol. Teren. Wiej. 2014, II, 423–435. [Google Scholar]
  40. Directive 2007/60/EC of the European Parliament and of the Council of 23 October 2007 on the Assessment and Management of Flood Risks. Available online: https://eur-lex.europa.eu/LexUriServ/LexUriServ.do?uri=OJ:L:2007:288:0027:0034:EN:PDF (accessed on 30 June 2020).
  41. Wężyk, P. (Ed.) Podręcznik dla Uczestników Szkoleń z Wykorzystania Produktów LiDAR; Główny Urząd Geodezji i Kartografii: Warszawa, Poland, 2015; ISBN 9788325421007. [Google Scholar]
  42. Szostak, M.; Wężyk, P.; Tompalski, P. Aerial Orthophoto and Airborne Laser Scanning as Monitoring Tools for Land Cover Dynamics: A Case Study from the Milicz Forest District (Poland). Pure Appl. Geophys. 2013, 171, 857–866. [Google Scholar] [CrossRef] [Green Version]
  43. Łukasik, S. Identyfikacja rozkładu w systemach rzeczywistych za pomocą estymatorów jądrowych. Czas. Tech. Wydaw. Politech. Krakowiskiej 2008, 1, 1–12. [Google Scholar]
  44. Noszczyk, T.; Hernik, J. Kompleksowa modernizacja ewidencji gruntów i budynków. Acta Sci. Pol. Form. Circumiectus 2016, 15, 3–17. [Google Scholar] [CrossRef]
  45. Kolecka, N.; Kozak, J. Wall-to-Wall parcel-level mapping of agricultural land abandonment in the Polish Carpathians. Land 2019, 8, 129. [Google Scholar] [CrossRef] [Green Version]
  46. Tasser, E.; Walde, J.; Tappeiner, U.; Teutsch, A.; Noggler, W. Land-use changes and natural reforestation in the Eastern Central Alps. Agric. Ecosyst. Environ. 2007, 118, 115–129. [Google Scholar] [CrossRef]
  47. Jucha, W.; Marszałek, A. Zastosowanie danych ALS do interpretacji dawnych i współczesnych form użytkowania terenu na przykładzie wzgórza Grojec. Rocz. Geomatyki 2016, 14, 465–476. [Google Scholar]
  48. Krysiak, S.; Papińska, E.; Majchrowska, A.; Adamiak, M.; Koziarkiewicz, M. Detecting Land Abandonment in Lodz Voivodeship Using Convolutional Neural Networks. Land 2020, 9, 82. [Google Scholar] [CrossRef] [Green Version]
  49. Kujawa, A.; Chmielowiec-tyszko, D. Zadrzewienia na Obszarach Wiejskich—Dobre Praktyki i Rekomendacje. 2019. Available online: http://drzewa.org.pl/wp-content/uploads/2018/10/Zadrzewienia-na-obszarach-wiejskich_draft.pdf (accessed on 30 June 2020).
  50. Scott, P.R.; Branch, R.; Division, P.I. The Role of Trees in Sustainable Agriculture A National Conference Resource Management Technical Report No. 138 Prepared for the National Land and Water Resource Audit; Department of Agriculture and Food: Western Australia, 1992.
  51. Baumhardt, R.L.; Blanco-Canqui, H. Soil: Conservation Practices. Encycl. Agric. Food Syst. 2014, 153–165. [Google Scholar]
  52. Rega, C. Ecological Rationality in Spatial Planning Concepts and Tools for Sustainable Land-Use Decisions; Springer: Cham, Switzerland, 2020. [Google Scholar]
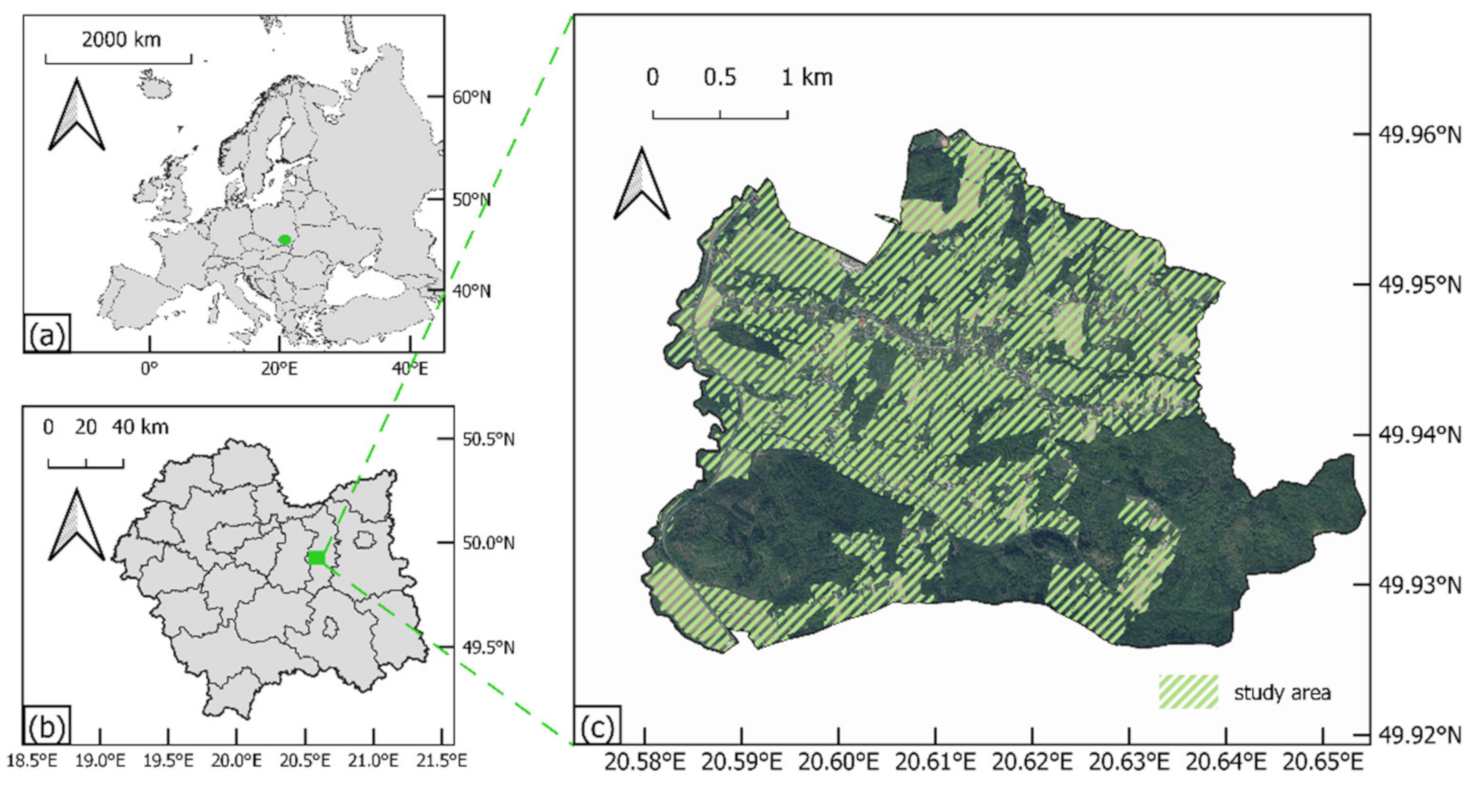
Figure 1. Location of the study area.
Remotesensing 13 01166 g001
Figure 2. Kernel functions that can be applied to create a heat map.
Remotesensing 13 01166 g002
Figure 3. Method.
Figure 3. Method.
Remotesensing 13 01166 g003
Figure 4. (a) Height classes applied to the normalised digital surface model (nDSM) generated from ALS (airborne laser scanning) data—pictorial view of a part of the research area; (b) heat map—pictorial view of a part of the research area; (c) isolines.
Remotesensing 13 01166 g004
Figure 5. Comparison of surface areas (expressed in hectares) generated with triweight and Epanechnikov function for isolines: 2, 4, 6, 8, 10, and 20.
Remotesensing 13 01166 g005
Figure 6. Spatial distribution of land abandonment in comparison to visual interpretation of the orthophotomap (test area): (a) spatial distribution of land abandonment detected with Epanechnikov kernel function; (b) spatial distribution of land abandonment detected with triweight kernel function.
Remotesensing 13 01166 g006
Table 1. Coefficients of variation for all cases of cluster analysis.
IDKernelRadiusWeightCoefficient of Variation
1Epanechnikov5-1.29
2triweight5-0.77
3Epanechnikov5class of height1.3
4triweight5class of height0.85
5Epanechnikovclass of height-1.1
6triweightclass of height-0.92
Table 2. Accuracy in comparison to the real extent of agricultural land abandonment determined on the basis of visual interpretation of orthophotomap in the total study area.
IDKernelIsolineSum of Surface Areas [ha]Sum of Surface Area without Disjoint Objects (ha)Surface Area (Visual Interpretation of Orthophotomap) (ha)Accuracy (%)
1Epanechnikov897.409856.7156107.460053
2triweight4141.899088.290982
3Epanechnikov890.659453.729250
4triweight2143.482079.078674
5Epanechnikov878.541047.969145
6triweight682.385649.422646
Publisher’s Note: MDPI stays neutral with regard to jurisdictional claims in published maps and institutional affiliations.