Abstract
The Karakoram mountain range is prone to natural disasters such as glacial surging and glacial lake outburst flood (GLOF) events. In this study, we aimed to document and reconstruct the sequence of events caused by glacial debris flows that dammed the Immit River in the Hindu Kush Karakoram Range on 17 July 2018. We used satellite remote sensing and field data to conduct the analyses. The order of the events in the disaster chain were determined as follows: glacial meltwater from the G2 glacier (ID: G074052E36491N) transported ice and debris that dammed the meltwater at the snout of the G1 glacier (ID: G074103E36480N), then the debris flow dammed the Immit River and caused Lake Badswat to expand. We surveyed the extent of these events using remote sensing imagery. We analyzed the glaciers’ responses to this event chain and found that the glacial debris flow induced G1 to exhibit accelerating ice flow in parts of the region from 25 July 2018 to 4 August 2018. According to the records from reanalysis data and data from the automatic weather station located 75 km from Lake Badswat, the occurrence of this disaster chain was related to high temperatures recorded after 15 July 2018. The chains of events caused by glacially related disasters makes such hazards more complex and dangerous. Therefore, this study is useful not only for understanding the formation of glacial disaster chains, but also for framing mitigation plans to reduce the risks for vulnerable downstream/upstream residents.
1. Introduction
Huge stores of ice and snow are located on the Tibetan Plateau (TP) and in the surrounding mountains, which is why this region has been designated as the “Third Pole” of the planet [1,2]. However, global warming weakens the inherent stability of glaciers [3]. Consistent warming of the TP is well documented; despite the protection of debris cover, 13–20% of the glacial mass in the Karakoram mountain range will be lost by the end of the 21st century if the background global temperature increases by 1.5 °C [4]. Glaciers in the TP have been shrinking since the 1960s in response to global warming. Unlike those in other parts of the Himalayas, the glaciers in the Karakoram are affected by complex dynamics. The Karakoram glaciers exhibit irregular behaviors such as glacial surging [5,6,7], which is known as the” Karakoram anomaly” [5,8]. Several glaciers in the Karakoram exhibit surge-type behavior, meaning that they speed up and advance rapidly [6,9,10], which demonstrates the unique behavior of glaciers in this region [11]. Furthermore, decreased annual precipitation and increased precipitation during the winter has been reported in the Karakoram [12,13]. Consequently, early reports suggest that both the extent and the mass of the glaciers in the central Karakoram region have remained nearly constant since 1970 [14,15,16].
Global warming has caused the rapid melting of glacial ice in recent decades. The irregular behavior of glaciers in the Karakoram range has caused the expansion of existing lakes in the region and the creation of new ones, which ultimately results in glacial lake outburst flood (GLOF) hazards downstream [17,18,19]. Additionally, the frequency and intensity of natural hazards related to glacial variations (such as glacial debris flows, flash floods, and GLOFs) have increased. Glacial debris flows and GLOFs not only present acute risks to local habitats and inhabitants, but they can also have latent and long-term effects on adjacent and distal environments due to the transport of contaminated glacial river water [20]. Between 1998 and 2017, floods were the most frequently reported type of disaster worldwide, representing 43% of all recorded events and affecting at least two billion people [21].
At present, glacier-related natural hazards in the TP that are driven in part by climate change are increasing both in magnitude and frequency. Since 2015, there have been a number of glacial collapses/surges in the TP. For example, in 2015, the Karayaylak glacial surge occurred on Kongur Tagh (7719 m a.s.l.) in the Pamir Mountains [22]. In July and September of 2016, the Aru village in the TP experienced two ice collapses associated with Glacier No. 53 [23], and in October 2016, glacier 5J352E0017 in the Amnye Machen Mountains (eastern Tibet) experienced an ice collapse [24]. Ice collapses have become an important disaster type in High Mountain Asia (HMA). Glacial collapses/surges act as part of a cascading chain process. For example, in September 2002, the Kolka–Karmadon event (in the Caucasus) underwent rock/ice calving that stopped 20 km downstream, but then continued to form a 15 km long debris flow in the downriver reaches, resulting in the deaths of nearly 140 people [25,26]. In October 2018, ice/rock falls in the Sedongpu basin induced debris flows that blocked the Yarlung Zangbo River [27]. Such glacial disasters pose a great threat to adjacent villages in valleys, downstream populations, and infrastructure [28,29]. This is particularly critical because institutional mechanisms and the means to deal with cascading multihazard environmental disasters are lacking in this region. Hence, it is necessary to find reasonable ways to mitigate glacier-related hazards such as glacial debris flows, the creation and expansion of glacial lakes, and GLOFs. To do so, it is necessary to assess the regional and local vulnerabilities to develop a better understanding of the influence of cryospheric changes on humanity [30,31]. It is also necessary to raise awareness regarding the potential risks of cascading glacial hazards [32].
In this study, we observed a typical glacial disaster in the Karakoram Range and identified the disaster development process using remote sensing imagery and field sampling methods. We also evaluated the impacts of the disaster on the environment (glaciers) and human settlements and habitats. Through this local disaster case, we hope to renew the cognition of glacial disasters.
2. Study Area
The Gilgit River originates from a high alpine glacier in an area where two mountain systems (the Hindu Kush and the Karakoram) meet. It is a tributary of the Indus River and flows through the town of Gilgit. The climate is hot in summer and cold in winter. Summer prevails in months from June to August. In July and August, the mean maximum temperature at Gilgit station (35.6°N, 74.2°E, 1460 m a.s.l.) is normally above 35 °C. Winter starts in November and remains until the end of March. January is the coldest month, with a mean minimum temperature reaching below −2 °C. The mean annual precipitation (1961–2014) is 134 mm, of which ~70% is usually received from April to September [33,34].
Glacier inventories that have been issued in the region include the Randolph Glacier Inventory (RGI) [35], the Glacier Area Mapping for Discharge from the Asian Mountains (GAMDAM) [36], and the glacier inventories for Karakoram and Pamir [15]. In this study, we used data from the GAMDAM inventory, in which the glacial extents were delineated in 1999. Approximately 1800 km2 of the Gilgit River basin is glaciated [35], which includes 156 glaciers that cover a total area of 270.55 ± 6.20 km2 in the Immit Basin. The largest glacier in the area is the Karambar glacier, with an area of 65.32 ± 0.72 km2 (Figure 1). As of 10 July 2018, eight glacial lakes were located in the basin, covering a total area of 3.33 ± 0.12 km2. Of these, Karambar Lake is the largest, with an area of 2.55 ± 0.08 km2. In addition to the glaciers in the Immit Basin, an additional two adjacent glaciers (G1 and G2) are of importance to this study (Figure 1). The G1 is developed on Purian Sar (6240 m a.s.l.). The areas and lengths of G1 and G2 are 15.65 km2 and 2.95 km2, and 10.2 km and 3.3 km, respectively.
Figure 1.
The location of the Badswat village in Pakistan. The dammed point is marked in green. The automatic weather station (AWS) is sited in the southeast of Badswat. The glacial debris flow was initiated from G2 (Background images: Landsat 8 OLI Path: 150, Row: 34–35, acquired on 11 August 2018).
Historical flow data from the Gilgit River have exhibited a decreasing water volume from 1961 to 1985 and an increasing water volume from 1986 to 2010. The recent increasing trend could be due to increasing temperatures and rainfall [37]. The Ishkoman valley, located at the headwater of the Gilgit River, is located in northern Pakistan in Gilgit–Baltistan, in the Immit Valley (Figure 1). The elevation of the valley ranges from 2100 to 3700 m a.s.l. On 17 July 2018, the Badswat and Bilhanz villages in the Immit Valley were affected by a glacial debris flow, which led to the expansion of a dammed lake (Lake Badswat, 74.0327°E, 36.5455°N, 2610 m a.s.l.). This study focused on glacier behavior in and adjacent to the Immit River, where this glacial debris flow impacted Lake Badswat. Landsat images, Sentinel 2 images, and GF-1 images (among others) were used to investigate the factors that triggered this event.
3. Data and Methods
3.1. Satellite Data
To survey the glacial event, we used optical data from different sources (Table 1) and images from a number of satellite platforms, including Sentinel 2, Landsat 8 Operational Land Imager (OLI), GF-1 WFV1/2, and CB04 P5M (http://www.cresda.com, accessed on 15 January 2019). Landsat 8 OLI images and Sentinel 2 data were acquired from the United States Geological Survey (USGS; http://earthexplorer.usgs.gov/, accessed on 20 December 2018) and corrected for georeferenced terrain within prescribed tolerances (<12 m root mean square error, RMSE). The GF-1 WFV1/2 system is a multispectral scanning radiometer with a temporal resolution of 4 days and a spatial resolution of 16 m. The CB04 P5M system is a panchromatic (PAN) image with a spatial resolution of 5 m. Both the WFV1/2 and CB04 P5M images were orthorectified using a rational polynomial coefficient (RPC) in the Environment for Visualizing Images (ENVI) 5.0 software package (ITT Visual Information Solutions). The WFV1/2 and Landsat 8 images were coregistered with each other and had an RMSE of less than 1 pixel. Additionally, we also used very high-resolution imagery from Google Earth, such as worldview satellite data acquired on 20 July 2017. This imagery was analyzed directly at its maximum resolution using the Google Earth platform.

Table 1.
The data resources used in this study.
3.2. Climate Data
Air temperature and precipitation are two important parameters in the study of cryospheric hazards. Considering the scarcity of in-situ temperature and precipitation data in complex mountain terrain, grid-based reanalysis data (such as ERA-Interim (the European Center for Medium Range Weather Forecasts (ECMWF) reanalysis)) have generally been used for climate studies. In this study, daily air temperature data acquired from ERA-Interim and daily precipitation data acquired from the Climate Hazards Group InfraRed Precipitation with Station data (CHIRPS) were used to determine the impact of climate change on the occurrence of GLOF events.
ERA-Interim is a global atmospheric reanalysis product generated by ECMWF [38]. This product continuously updates forward in time from 1979 to the present. ERA-Interim reanalysis data contains dozens of climate elements at multiple resolution scales (0.125°, 0.25°, 0.5°, 0.75°, and 1°). Previous studies have suggested that ERA-Interim exhibits a better overall performance than other reanalysis datasets for representing air temperatures and hydrological cycles in mountainous regions [39,40].
CHIRPS is a 30+ year quasiglobal rainfall dataset [41]. It covers the area from 50°S to 50°N, and extends from 1981 to the near-present. CHIRPS utilizes 0.05° resolution satellite imagery with in-situ station data to generate gridded rainfall time series and was initially developed for trend analysis and seasonal drought monitoring, but is now widely used for climate change analysis [42,43].
We also used temperature and precipitation data recorded by the automatic weather station (AWS) that was installed on the Ghukin glacier (36.43°N, 74.86°E, 2641 m a.s.l) in May, 2018 (Figure 1). This AWS is located 75 km from Lake Badswat and is not in the Gilgit watershed. This dataset can be used to validate the reanalysis data.
3.3. Glacier and Glacial Lake Mapping
Landsat 8 OLI images were interpreted visually. The 2018 boundaries of the glaciers and glacial lakes were delineated manually, due to their small sizes and other challenging mapping characteristics of debris-covered glaciers. Glacier and glacial lake mapping uncertainties originate from the coverage of glaciers and glacial lakes by debris, shadows, and inaccuracies in the mapping process [44,45,46]. We estimated the uncertainties using Equation (1), since there was no ground truthing or reference data for any larger set of glaciers in the study region [44].
where e is uncertainty (km2), s is area (km2), p is 0.70, and e1 = 0.039, which is the estimated fractional error in a measured area of 1 km2. The correction factor k was set as 1. Consequently, the uncertainty of the mapped glacier area was less than 2.3% and the uncertainty of the mapped glacial lake was 3.6%.
3.4. Glacier Velocity
Surface velocity is a key factor in glacial surging. In this study, we surveyed the glacier surface velocity during the flood event using Landsat 8 OLI images (panchromatic band, band 8) and Sentinel 2 images (near-infrared band, band 8). For automatic surface tracking, the feature tracking method (including cross-correlation and offset-tracking) was primarily used [47,48], and software packages, including the Coregistration of Optically Sensed Images and Correlation (COSI-Corr) and CIAS, were utilized [49,50]. The COSI-Corr software package is a plug-in for the ENVI remote sensing software that allows for automatic and precise orthorectification, coregistration, and subpixel correlation of satellite and aerial images without ground control points [50]. We used the image correlation algorithm in the frequency domain implemented in the COSI-Corr software package [50] to estimate the glacier surface displacements; a 64 by 64 pixel window was used as the initial search window, and an 8 by 8 pixel window was used as the final window. The signal-to-noise ratio was set at a threshold of 0.95 to avoid a correlation bias, and four robustness iterations were applied. The step size was set to 8 pixels to produce velocity maps with a 120/80 m resolution. The uncertainty was evaluated by measuring displacements on a glacier free region, and was less than 5.0 m for each Landsat-derived displacement map. Surface displacements were then converted to daily velocities.
3.5. Field Survey
A field survey was conducted at Lake Badswat on 21 July 2019 to investigate the deposition and material sources of the glacial debris flow (Figure 2). The whole debris flow gully average gradient is about 29‰ and the width is about 110 m (as derived from Google Earth). The composition of the debris flow was dominated by gravel, while the lateral moraine was mostly composed of glacifluvial deposit gravel. Consequently, we determined that the lateral moraines were the source of the debris flow (Figure 2).
Figure 2.
Photograph of the debris flow taken on 21 July 2019 (taken by Anjum, Muhammad Naveed).
4. Results
4.1. Determination of Disaster Chain Process Using Remote Sensing
Three steps were taken to identify the disaster chain process using remote sensing techniques. First, visual examination of the Sentinel 2 images was conducted. We observed that a change in the surface at the 3600 m contour (Figure 3b) occurred at the end of G2, which was the origin of the debris flow. Furthermore, there was also a fresh trace from an “ice debris flow” to an “ice dam”. Therefore, we deduced that water came from the G2 foreland and that meltwater from G2 (~3600 m a.s.l) drained through and eroded the G1 lateral moraine on 25 July 2018.
Figure 3.
Overview of Sentinel 2 images before (a) and after (b) the debris flow event (15 July and 25 July 2018, respectively).
Second, we analyzed the satellite images to understand the glacial debris flow. We determined that the glacial debris flow strengthened below the “ice dam” (Figure 4b). We observed a region of fresh changes (ice dam region, Figure 4c) in the image from 25 July 2018. Additionally, after the event, an end moraine lake was observed (Figure 4c,d). Consequently, we inferred that ice dammed the debris flow route because the glacial debris flow initiated from G2 eroded ice bodies in the G1 ablation region, which caused some of the ice bodies to collapse. This event did not destroy the supraglacial lake between 15 July 2018 and 15 August 2018. Consequently, this debris flow went from 3600 m a.s.l. to 2610 m a.s.l., with a distance of 3.4 km through two steps.
Figure 4.
Satellite images of the G1 snout (a–d) before and after the events from 15 July 2018 to 15 August 2018 (background: Planet Scope. (a) before the event at G1; (b) after the event without end moraine lake; (c,d) after the event with end moraine lake).
In the final step, we visually assessed the sediment movement and deposition. We observed that the glacial debris flow from G1 carried lateral moraine sediments mixed with collapsed ice. This mixture flowed into the Immit River at 2610 m a.s.l. The debris flow triggered the formation of a sediment fan of approximately 1300 m × 500 m, and dammed the Immit River (Figure 3). After this occurred, the area of Lake Badswat expanded rapidly within a short time.
4.2. Dammed Lake
The area of Lake Badswat was 0.16 km2 on 10 July 2018 and 0.14 km2 on 15 July 2018, both of which were measured before the debris flow dammed the Immit River. After the event, the area of Lake Badswat expanded to 0.53 km2 on 25 July and to 0.63 km2 on 4 August 2018. However, based on the Sentinel 2 images acquired on 25 July 2018, the Immit River was not completely blocked. Figure 5 shows a time series visualization of the extent of Lake Badswat from 10 July 2018 to 23 October 2018.
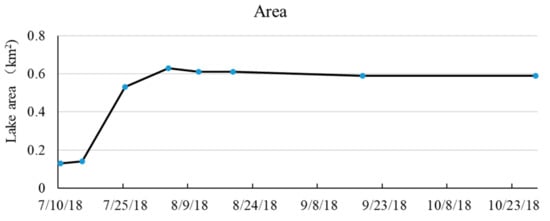
Figure 5.
Variations in the area of Lake Badswat before and after the event.
4.3. Exposure and Loss Analyses
Vulnerability is primarily the result of exposure to the debris flow and the damming of the lake. There are two aspects of vulnerability: physical and environmental vulnerabilities of people, livelihoods, infrastructure, and buildings; and socioeconomic vulnerabilities, including poverty, lack of preparedness, susceptibility, and adaptive capacity. We found that some vegetation and the main road were destroyed by the debris fan. Additionally, over 40 houses, farmland, and smaller roads were inundated as a result of the expansion of Lake Badswat (Figure 6). The access road that serves 10 villages (located upstream of the Immit River) was also blocked, which forced the relocation of 1000 people to safety (https://www.akdn.org/gallery/akdns-response-glacial-lake-outburst-flood-immit-valley-gilgit-baltistan, accessed on 12 October 2018).
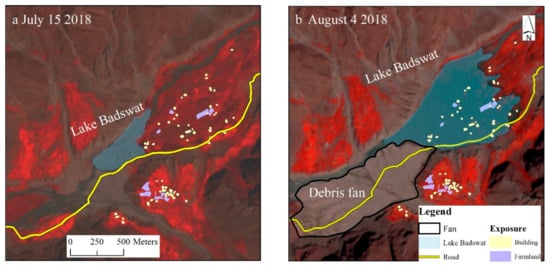
Figure 6.
Surface exposure before and after the event. (a) Before the event (the background image is from Sentinel 2, acquired on 15 July 2018). (b) After the event (the background image is from Sentinel 2, acquired on 4 August 2018).
4.4. Glacial Response to Disaster Events
Analysis of the Landsat ETM+ and OLI images suggests that the total areas of the 156 glaciers in the Immit basin in 1999 and 2018 were 277.97 ± 6.39 km2 and 273.95 ± 6.30 km2, respectively. The area covered by glaciers decreased by up to 4.02 km2 (1.4%) during this time period. The G1 glacier is located at the edge of the Immit basin and appears to have undergone little change in its extent from 1999 to 2018; however, the bare ice lower edge of G1 receded by ~700 m. The area of the G2 glacier decreased from 4.62 km2 in 1999 to 4.56 km2 in 2018, accounting for a 1.3% decrease in the total areal extent of G2.
Understanding glacial movement is important in the assessment of potentially unstable zones [23,51]. Identifying such areas is vital for detecting the cause of a current hazard, or for assessing how a glacier might respond to a current hazard. A glacier’s dynamic is one of the factors used to detect a potentially unstable zone. Due to the limited availability of cloud-free images, we derived the glacier surface velocities from 10 July 2018 to 12 September 2018 using a combination of images from Landsat 8 OLI and Sentinel 2. Longitudinal profiles were extracted to provide insight into the evolution of the glacier’s dynamic. We determined that the glacial surface velocity was less than 1.5 m d−1 from 10 July to 12 September 2018 using Landsat images (Figure 7), and that the glacier moved at a greater velocity during the flood event (10 July to 11 August 2018) than after the flood event (11 August to 12 September 2018). The glacier surface velocity was unusually large from 10 July to 11 August 2018 in Region A (Figure 7). Further analysis using Sentinel 2 images (band 8) found that rapid movement occurred from 25 July to 14 August 2018. These images show that unusually fast glacial movement occurred after the event.
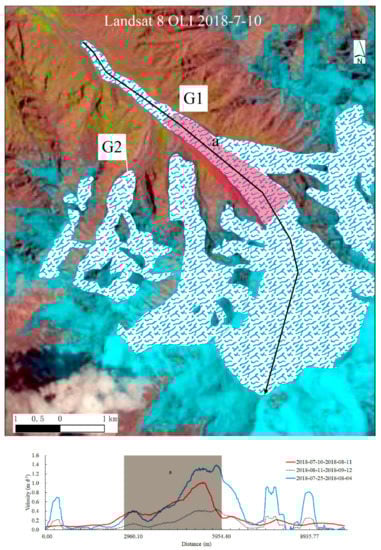
Figure 7.
The ice velocities and longitudinal profiles of G1 from 10 July 2018 and 12 September 2018 (from glacier tongue to glacier accumulation).
5. Discussion
5.1. Role of Cascading Glacial Hazards in Disasters
Two local residents from the Badswat area provided insight into the causes of the event. They informed us that collapsed ice blocked the melting channel of the glaciers, which in turn led to the formation of a small pool in the vicinity of the ice collapse. After passing the short-term weir, the meltwater opened the dammed point and gained momentum to form a debris flow, which blocked the Immit River and caused the expansion of Lake Badswat. This anecdotal tale of the events was similar to the results determined from the visual analysis of the satellite images. Thus, we deduced that meltwater from G2 triggered the debris flow (Figure 8a,b). We also determined that ice collapse was the strengthening factor in the glacier debris flow from G2. In summary, the ice collapse in the glacial area caused a small ice-blockage in the river, strengthened the debris flow, and dammed the Immit River, which caused the expansion of Lake Badswat. This series of events presented a disaster chain initiated by a glacial hazard. Finally, as the last step in the disaster chain, a GLOF occurred that endangered the residents’ lives and threatened infrastructure in the basin (Figure 8).
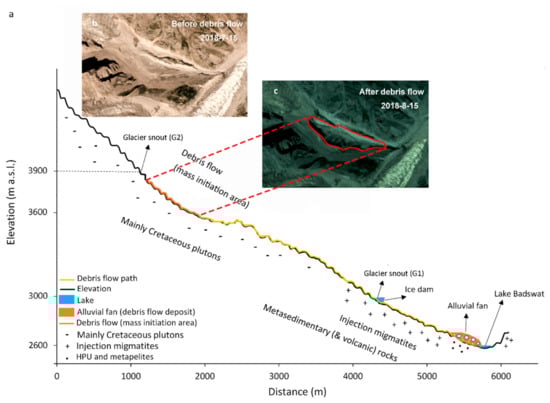
Figure 8.
Delineation of the processes involved in the glacial debris flow event. (a) Geological information of Karamber valley is obtained from Debon and Ali Khan (1996) [52]. (b) the image of glacier snout (G2) before debris flow. (c) the image of glacier snout (G2) after debris flow.
The Hindu Kush Himalayan (HKH) Range, as part of the Third Pole, is one of the most hazardous regions of the world due to glacial surges, flash floods and GLOFs, avalanches, landslides, droughts, and earthquakes. This is because of its steep terrain, fragile geological formations, high seismicity, intense and highly variable precipitation, and enormous quantities of snow and ice [53,54,55,56,57,58]. The meltwater in this region can cause the expansion of glacial lakes [59]. Consequently, glacial shrinkage and glacial lake expansion are closely related to several types of natural hazards that occur in response to changing climatic conditions in the Himalayas and TP [19,60]. In this study, due to accessibility limitations in the field, we were unable to assess in-situ conditions at the snout of G2 to determine why the debris flow from G2 occurred. Despite the lack of a site visit, based on the findings from the satellite images and the corroborating accounts from local inhabitants, we are certain that the debris flow caused the expansion of Lake Badswat and led to the previously described disaster event chain.
5.2. Analysis of Climatic and Triggering Factors
Since no suitable temperature and precipitation data were available in the study area, we used reanalysis data and observation data from the adjacent AWS at the Ghukin glacier. The temperature data from the two datasets show a good correlation (correlation coefficient = 0.68). The datasets identified 3 days with high temperatures before 17 July 2018 (Figure 9a,b), which accelerated the melting of the ice. As for precipitation, there were notable differences between the two datasets regarding days and timing of rain (Figure 9). Despite these discrepancies, both data records indicate that there was no precipitation between 14 and 17 July 2018.
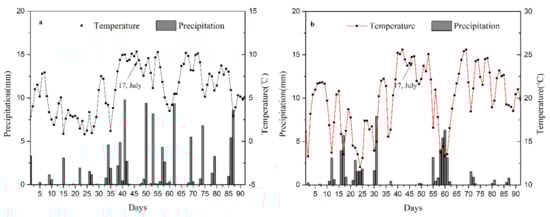
Figure 9.
Temporal variations in temperature and precipitation from June to August 2018; (a) temperature and precipitation derived from reanalysis data; (b) temperature and precipitation derived from the AWS at the Ghukin glacier.
Climatic factors (especially extreme climatic conditions), glacier collapse, rock/ice falls, and earthquakes can induce GLOFs [55,61,62] (Table 2). High air temperatures have been reported in several cases as a driving factor behind glacial debris flow/GLOF events in the Karakoram and the TP [63,64,65], and may also be associated with rock/ice falls, which in turn drive debris flow events [25,26,66]. Furthermore, intense rainfall is an important factor that can induce debris flows/GLOFs in high mountain regions [67]. The event investigated in this study occurred in July 2018 after high temperature conditions occurred. Consequently, we believe that temperature was an important factor in this event. Moreover, before the event, the velocity of the G2 glacier exhibited abnormalities, but we were unable to survey the G2 collapse and/or rock/ice falls close to G2. Therefore, the evidence strongly points towards a climate-induced cause for this event sequence, although it is unclear whether or not precipitation contributed significantly.
Table 2.
Comparisons of various glacial-related hazards.
6. Conclusions
Multitemporal remote sensing images were visually interpreted to assess glacial movement, debris flow processes, and variations in the areal extent of glacial lakes. This assessment helped us to understand the event mechanism and evolution of this disaster cascade. We found that the debris flow from G2 was the origin of the event. The ice collapse at G1 was caused by the debris flow from G2, which blocked the supraglacial river. Following this, the debris flow gained momentum and carried gravel downstream, blocking the Immit River. Consequently, Lake Badswat was dammed, leading to its expansion and the inundation of nearby houses and roads. This series of events constituted a glacier disaster chain. The framework of this analysis shows the benefit of using high-resolution spatial remote sensing images as a data component to determine and document a chain of events. Due to the lack of in-situ observation data and direct weather observations, we could only analyze the development and cause of the expansion of Lake Badswat through remote sensing images, reanalysis data, and data sourced from the AWS station located 75 km away. The area of the G1 glacier changed little between 1999 and 2018. However, we observed an increase in the velocity of the local glacier movement from 25 July to 14 August 2018, but cannot definitively say whether or not this change was related to the ice collapse. The predisposing factors associated with the onset of this event were high temperatures recorded on the days preceding the event.
Author Contributions
Conceptualization, D.S., Y.D., and D.L.; methodology, D.S.; software, D.S.; validation, M.N.A., Y.L., and J.L.; formal analysis, D.S.; investigation, D.S., D.L., and M.N.A.; writing—original draft preparation, D.S.; writing—review and editing, M.N.A. and W.G.; visualization, D.S. and J.L.; supervision, Y.D. All authors have read and agreed to the published version of the manuscript.
Funding
This research was funded by the Ministry of Science and Technology (Grant No. 2018FY100502), the Strategic Priority Research Program of the Chinese Academy of Sciences (Grant No. XDA19070501), and the National Natural Science Foundation of China (Grants: 41671066, 41950410575, & 41671075).
Institutional Review Board Statement
Not applicable.
Informed Consent Statement
Not applicable.
Data Availability Statement
Not applicable.
Acknowledgments
We thank the USGS for providing the Landsat data and Sentinel 2 (http://glovis.usgs.gov/ accessed on 20 December 2018) images, the China Centre for Resources Satellite Data and Application for providing the CB04 and GF-1 (http://www.cresda.com/ accessed on 15 January 2019) data, Planet image (https://www.planet.com accessed on 23 November 2018), and ECMWF for the ERA-Interim Daily data (https://apps.ecmwf.int/ accessed on 7 December 2018) used in this study.
Conflicts of Interest
The authors declare no conflict of interest.
References
- Qiu, J. The third pole. Nature 2008, 454, 393–396. [Google Scholar] [CrossRef]
- Liu, W.; Carling, P.A.; Hu, K.; Wang, H.; Zhou, Z.; Zhou, L.; Liu, D.; Lai, Z.; Zhang, X. Outburst floods in China: A review. Earth Sci. Rev. 2019, 197, 102895. [Google Scholar] [CrossRef]
- Ding, Y.; Zhang, S.; Zhao, L.; Li, Z.; Kang, S. Global warming weakening the inherent stability of glaciers and permafrost. Sci. Bull. 2019, 64, 245–253. [Google Scholar] [CrossRef]
- Kraaijenbrink, P.D.A.; Bierkens, M.F.P.; Lutz, A.F.; Immerzeel, W.W. Impact of a global temperature rise of 1.5 degrees Celsius on Asia’s glaciers. Nature 2017, 549, 257–260. [Google Scholar] [CrossRef] [PubMed]
- Hewitt, K. Glaciers receive a surge of attention in the Karakoram Himalaya. Eos Trans. Am. Geophys. Union 1998, 79, 104–105. [Google Scholar] [CrossRef][Green Version]
- Quincey, D.J.; Braun, M.; Glasser, N.F.; Bishop, M.P.; Hewitt, K.; Luckman, A. Karakoram glacier surge dynamics. Geophys. Res. Lett. 2011, 38, L18504. [Google Scholar] [CrossRef]
- Kääb, A.; Berthier, E.; Nuth, C.; Gardelle, J.; Arnaud, Y. Contrasting patterns of early twenty-first-century glacier mass change in the Himalayas. Nature 2012, 488, 495–498. [Google Scholar] [CrossRef]
- Gardelle, J.; Berthier, E.; Arnaud, Y. Impact of resolution and radar penetration on glacier elevation changes computed from DEM differencing. J. Glaciol. 2012, 58, 419–422. [Google Scholar] [CrossRef]
- Bhambri, R.; Hewitt, K.; Kawishwar, P.; Pratap, B. Surge-type and surge-modified glaciers in the Karakoram. Sci. Rep. 2017, 7, 15391. [Google Scholar] [CrossRef]
- Gray, L.; Burgess, D.; Copland, L.; Cullen, R.; Galin, N.; Hawley, R.; Helm, V. Interferometric swath processing of Cryosat data for glacial ice topography. Cryosphere 2013, 7, 1857–1867. [Google Scholar] [CrossRef]
- Hewitt, K. The Karakoram anomaly? glacier expansion and the “elevation effect,” Karakoram Himalaya. Mt. Res. Dev. 2005, 25, 332–340. [Google Scholar] [CrossRef]
- Rajbhandari, R.; Shrestha, A.B.; Kulkarni, A.; Patwardhan, S.K.; Bajracharya, S.R. Projected changes in climate over the Indus river basin using a high resolution regional climate model (PRECIS). Clim. Dyn. 2015, 44, 339–357. [Google Scholar] [CrossRef]
- Zhan, Y.-J.; Ren, G.-Y.; Shrestha, A.B.; Rajbhandari, R.; Ren, Y.-Y.; Sanjay, J.; Xu, Y.; Sun, X.-B.; You, Q.-L.; Wang, S. Changes in extreme precipitation events over the Hindu Kush Himalayan region during 1961–2012. Adv. Clim. Chang. Res. 2017, 8, 166–175. [Google Scholar] [CrossRef]
- Cogley, G. Glaciology: No ice lost in the Karakoram. Nat. Geosci. 2012, 5, 305–306. [Google Scholar] [CrossRef]
- Mölg, N.; Bolch, T.; Rastner, P.; Strozzi, T.; Paul, F. A consistent glacier inventory for Karakoram and Pamir derived from Landsat data: Distribution of debris cover and mapping challenges. Earth Syst. Sci. Data 2018, 10, 1807–1827. [Google Scholar] [CrossRef]
- Gardelle, J.; Berthier, E.; Arnaud, Y.; Kääb, A. Region-wide glacier mass balances over the Pamir-Karakoram-Himalaya during 1999-2011. Cryosphere 2013, 7, 1263–1286. [Google Scholar] [CrossRef]
- Ashraf, A.; Roohi, R.; Naz, R.; Mustafa, N. Monitoring cryosphere and associated flood hazards in high mountain ranges of Pakistan using remote sensing technique. Nat. Hazards 2014, 73, 933–949. [Google Scholar] [CrossRef]
- Song, C.; Sheng, Y.; Wang, J.; Ke, L.; Madson, A.; Nie, Y. Heterogeneous glacial lake changes and links of lake expansions to the rapid thinning of adjacent glacier termini in the Himalayas. Geomorphology 2017, 280, 30–38. [Google Scholar] [CrossRef]
- Mir, R.A.; Jain, S.K.; Lohani, A.K.; Saraf, A.K. Glacier recession and glacial lake outburst flood studies in Zanskar basin, western Himalaya. J. Hydrol. 2018, 564, 376–396. [Google Scholar] [CrossRef]
- Zhang, Q.; Zhang, F.; Kang, S.; Cong, Z. Melting glaciers: Hidden hazards. Science 2017, 356, 495. [Google Scholar] [CrossRef] [PubMed]
- Wallemacq, P.; House, R. Economic Losses, Poverty & Disasters 1998–2017; United Nations Office for Disaster Risk Reduction (UNISDR): Geneva, Switzerland; Centre for Research on the Epidemiology of Disasters (CRED): Brussels, Belgium, 2018. [Google Scholar]
- Shangguan, D.; Liu, S.; Ding, Y.; Guo, W.; Xu, B.; Xu, J.; Jiang, Z. Characterizing the May 2015 Karayaylak Glacier surge in the eastern Pamir Plateau using remote sensing. J. Glaciol. 2016, 62, 944–953. [Google Scholar] [CrossRef]
- Kääb, A.; Leinss, S.; Gilbert, A.; Bühler, Y.; Gascoin, S.; Evans, S.G.; Bartelt, P.; Berthier, E.; Brun, F.; Chao, W.-A.; et al. Massive collapse of two glaciers in western Tibet in 2016 after surge-like instability. Nat. Geosci. 2018. [Google Scholar] [CrossRef]
- Paul, F. Repeat Glacier Collapses and Surges in the Amney Machen Mountain Range, Tibet, Possibly Triggered by a Developing Rock-Slope Instability. Remote Sens. 2019, 11, 708. [Google Scholar] [CrossRef]
- Haeberli, W.; Huggel, C.; Kääb, A.; Zgraggen-Oswald, S.; Polkvoj, A.; Galushkin, I.; Zotikov, I.; Osokin, N. The Kolka-Karmadon rock/ice slide of 20 September 2002: An extraordinary event of historical dimensions in North Ossetia, Russian Caucasus. J. Glaciol. 2004, 50, 533–546. [Google Scholar] [CrossRef]
- Huggel, C.; Zgraggen-Oswald, S.; Haeberli, W.; Kääb, A.; Polkvoj, A.; Galushkin, I.; Evans, S.G. The 2002 rock/ice avalanche at Kolka/Karmadon, Russian Caucasus: Assessment of extraordinary avalanche formation and mobility, and application of QuickBird satellite imagery. Nat. Hazards Earth Syst. Sci. 2005, 5, 173–187. [Google Scholar] [CrossRef]
- Liu, C.; Lv, J.; Tong, L.; Chen, H.; Liu, Q.; Xiao, R.; Tu, J. Research on glacial/rock fall-landslide-debris flows in Sedongpu basin along Yarlung Zangbo River in Tibet. Geol. China 2019, 46, 219–234, (In Chinese with English Abstract). [Google Scholar] [CrossRef]
- Narama, C.; Daiyrow, M.; Duishonakunov, M.; Tadono, T.; Sato, H.; Ukita, J.; Abrakhmatov, K. Large drainage from short-lived glacial lakes in the Teskey Range, Tien Shan Mountains, Central Asia. Nat. Hazards Earth Syst. Sci. 2018, 18, 983–995. [Google Scholar] [CrossRef]
- Nie, Y.; Sheng, Y.; Liu, Q.; Liu, L.; Liu, S.; Zhang, Y.; Song, C. A regional-scale assessment of Himalayan glacial lake changes using satellite observations from 1990 to 2015. Remote Sens. Environ. 2017, 189, 1–13. [Google Scholar] [CrossRef]
- Qin, D.; Ding, Y.; Xiao, C.; Kang, S.; Ren, J.; Yang, J.; Zhang, S. Cryospheric Science: Research framework and disciplinary system. Natl. Sci. Rev. 2017, nwx108. [Google Scholar] [CrossRef]
- Kirschbaum, D.; Watson, C.S.; Rounce, D.R.; Shugar, D.H.; Kargel, J.S.; Haritashya, U.K.; Amatya, P.; Shean, D.; Anderson, E.R.; Jo, M. The State of Remote Sensing Capabilities of Cascading Hazards Over High Mountain Asia. Front. Earth Sci. 2019, 7. [Google Scholar] [CrossRef]
- AghaKouchak, A.; Huning, L.S.; Chiang, F.; Sadegh, M.; Vahedifard, F.; Mazdiyasni, O.; Moftakhari, H.; Mallakpour, I. How do natural hazards cascade to cause disasters. Nature 2018, 561, 458–460. [Google Scholar] [CrossRef]
- Adnan, M.; Nabi, G.; Saleem Poomee, M.; Ashraf, A. Snowmelt runoff prediction under changing climate in the Himalayan cryosphere: A case of Gilgit River Basin. Geosci. Front. 2017, 8, 941–949. [Google Scholar] [CrossRef]
- Ahmad, I.; Zhang, F.; Tayyab, M.; Anjum, M.N.; Zaman, M.; Liu, J.; Farid, H.U.; Saddique, Q. Spatiotemporal analysis of precipitation variability in annual, seasonal and extreme values over upper Indus River basin. Atmos. Res. 2018, 213, 346–360. [Google Scholar] [CrossRef]
- Randolph Glacier Inventory. Randolph Glacier Inventory—A Dataset of Global Glacier Outlines: Version 6.0; Technical Report; Randolph Glacier Inventory, Digital Media: Boulder, CO, USA, 2017. [Google Scholar]
- Nuimura, T.; Sakai, A.; Taniguchi, K.; Nagai, H.; Lamsal, D.; Tsutaki, S.; Kozawa, A.; Hoshina, Y.; Takenaka, S.; Omiya, S.; et al. The GAMDAM glacier inventory: A quality-controlled inventory of Asian glaciers. Cryosphere 2015, 9, 849. [Google Scholar] [CrossRef]
- Adnan, M.; Nabi, G.; Kang, S.; Zhang, G.; Adnan, R.M.; Anjum, M.N.; Iqbal, M.; Ali, A.F. Snowmelt runoff modelling under projected climate change patterns in the Gilgit river basin of northern Pakistan. Pol. J. Environ. Stud. 2017, 26, 525–542. [Google Scholar] [CrossRef]
- Dee, D.P.; Uppala, S.M.; Simmons, A.J.; Berrisford, P.; Poli, P.; Kobayashi, S.; Andrae, U.; Balmaseda, M.A.; Balsamo, G.; Bauer, P.; et al. The ERA-Interim reanalysis: Configuration and performance of the data assimilation system. Q. J. R. Meteorol. Soc. 2011, 137, 553–597. [Google Scholar] [CrossRef]
- Wang, A.; Zeng, X. Evaluation of multireanalysis products with in situ observations over the Tibetan Plateau. J. Geophys. Res. Atmos. 2012, 117. [Google Scholar] [CrossRef]
- Wang, X.; Pan, G.; Yang, M.; Zhao, G. Evaluation of climate on the Tibetan Plateau using ERA-Interim reanalysis and gridded observations during the period 1979–2012. Quat. Int. 2017, 444, 76–86. [Google Scholar] [CrossRef]
- Funk, C.; Verdin, A.; Michaelsen, J.; Peterson, P.; Pedreros, D.; Husak, G. A global satellite-assisted precipitation climatology. Earth Syst. Sci. Data 2015, 7, 275–287. [Google Scholar] [CrossRef]
- Wu, Y.; Guo, L.; Zheng, H.; Zhang, B.; Li, M. Hydroclimate assessment of gridded precipitation products for the Tibetan Plateau. Sci. Total Environ. 2019, 660, 1555–1564. [Google Scholar] [CrossRef] [PubMed]
- Gao, F.; Zhang, Y.; Chen, Q.; Wang, P.; Yang, H.; Yao, Y.; Cai, W. Comparison of two long-term and high-resolution satellite precipitation datasets in Xinjiang, China. Atmos. Res. 2018, 212, 150–157. [Google Scholar] [CrossRef]
- Pfeffer, W.T.; Arendt, A.A.; Bliss, A.; Bolch, T.; Cogley, J.G.; Gardner, A.S.; Hagen, J.-O.; Hock, R.; Kaser, G.; Kienholz, C.; et al. The Randolph Glacier Inventory: A globally complete inventory of glaciers. J. Glaciol. 2014, 60, 537–552. [Google Scholar] [CrossRef]
- Paul, F.; Bolch, T.; Briggs, K.; Kääb, A.; McMillan, M.; McNabb, R.; Nagler, T.; Nuth, C.; Rastner, P.; Strozzi, T.; et al. Error sources and guidelines for quality assessment of glacier area, elevation change, and velocity products derived from satellite data in the Glaciers_cci project. Remote Sens. Environ. 2017, 203, 256–275. [Google Scholar] [CrossRef]
- Bolch, T.; Menounos, B.; Wheate, R. Landsat-based inventory of glaciers in western Canada, 1985-2005. Remote Sens. Environ. 2010, 114, 127–137. [Google Scholar] [CrossRef]
- Paul, F.; Bolch, T.; Kääb, A.; Nagler, T.; Nuth, C.; Scharrer, K.; Shepherd, A.; Strozzi, T.; Ticconi, F.; Bhambri, R.; et al. The glaciers climate change initiative: Methods for creating glacier area, elevation change and velocity products. Remote Sens. Environ. 2015, 162, 408–426. [Google Scholar] [CrossRef]
- Heid, T.; Kaab, A. Repeat optical satellite images reveal widespread and long term decrease in land-terminating glacier speeds. Cryosphere 2012, 6, 467–478. [Google Scholar] [CrossRef]
- Kääb, A.; Vollmer, M. Surface geometry, thickness changes and flow fields on creeping mountain permafrost: Automatic extraction by digital image analysis. Permafr. Periglac. Process. 2000. [Google Scholar] [CrossRef]
- Leprince, S.; Barbot, S.; Ayoub, F.; Avouac, J.P. Automatic and precise orthorectification, coregistration, and subpixel correlation of satellite images, Application to Ground Deformation Measurements. IEEE Trans. Geosci. Remote Sens. 2007, 45, 1529–1558. [Google Scholar] [CrossRef]
- Schaub, Y.; Huggel, C.; Cochachin, A. Ice-avalanche scenario elaboration and uncertainty propagation in numerical simulation of rock-/ice-avalanche-induced impact waves at Mount Hualcán and Lake 513, Peru. Landslides 2016, 13, 1445–1459. [Google Scholar] [CrossRef]
- Debon, F.; Ali Khan, N. Alkaline orogenic plutonism in the Karakorum batholith: The Upper Cretaceous Koz Sar complex (Karambar valley, N. Pakistan). Geodin. Acta 1996, 9, 145–160. [Google Scholar] [CrossRef]
- Kargel, J.S.; Leonard, G.J.; Shugar, D.H.; Haritashya, U.K.; Bevington, A.; Fielding, E.J.; Fujita, K.; Geertsema, M.; Miles, E.S.; Steiner, J.; et al. Geomorphic and geologic controls of geohazards induced by Nepal’s 2015 Gorkha earthquake. Science 2016, 351, aac8353. [Google Scholar] [CrossRef] [PubMed]
- Atta-ur-Rahman; Khan, A.N. Analysis of 2010-flood causes, nature and magnitude in the Khyber Pakhtunkhwa, Pakistan. Nat. Hazards 2013, 66, 887–904. [Google Scholar] [CrossRef]
- Korup, O.; Montgomery, D.R.; Hewitt, K. Glacier and landslide feedbacks to topographic relief in the Himalayan syntaxes. Proc. Natl. Am. Sci. USA 2010, 107, 5317–5322. [Google Scholar] [CrossRef]
- Veh, G.; Korup, O.; Roessner, S.; Walz, A. Detecting Himalayan glacial lake outburst floods from Landsat time series. Remote Sens. Environ. 2018, 207, 84–97. [Google Scholar] [CrossRef]
- Hewitt, K. Rock avalanches that travel onto glaciers and related developments, Karakoram Himalaya, Inner Asia. Geomorphology 2009, 103, 66–79. [Google Scholar] [CrossRef]
- Wester, P.; Mishra, A.; Mukherji, A.; Shrestha, A.B. The Hindu Kush Himalaya Assessment-Mountains, Climate Change, Sustainability and People; Springer Nature: Cham, Switzerland, 2019. [Google Scholar]
- Zhang, G.; Yao, T.; Shum, C.K.; Yi, S.; Yang, K.; Xie, H.; Feng, W.; Bolch, T.; Wang, L.; Behrangi, A.; et al. Lake volume and groundwater storage variations in Tibetan Plateau’s endorheic basin. Geophys. Res. Lett. 2017, 44, 5550–5560. [Google Scholar] [CrossRef]
- Cook, K.L.; Andermann, C.; Gimbert, F.; Adhikari, B.R.; Hovius, N. Glacial lake outburst floods as drivers of fluvial erosion in the Himalaya. Science 2018, 362, 53–57. [Google Scholar] [CrossRef]
- Worni, R.; Huggel, C.; Clague, J.J.; Schaub, Y.; Stoffel, M. Coupling glacial lake impact, dam breach, and flood processes: A modeling perspective. Geomorphology 2014, 224, 161–176. [Google Scholar] [CrossRef]
- Bhambri, R.; Hewitt, K.; Kawishwar, P.; Kumar, A.; Verma, A.; Snehmani; Tiwari, S.; Misra, A. Ice-dams, outburst floods, and movement heterogeneity of glaciers, Karakoram. Glob. Planet. Chang. 2019, 180, 100–116. [Google Scholar] [CrossRef]
- Chen, Y.; Xu, C.; Chen, Y.; Li, W.; Liu, J. Response of glacial-lake outburst floods to climate change in the Yarkant River basin on northern slope of Karakoram Mountains, China. Quat. Int. 2010, 226, 75–81. [Google Scholar] [CrossRef]
- Liu, J.J.; Cheng, Z.L.; Su, P.C. The relationship between air temperature fluctuation and Glacial Lake Outburst Floods in Tibet, China. Quat. Int. 2013. [Google Scholar] [CrossRef]
- Zou, Q.; Cui, P.; Jiang, H.; Wang, J.; Li, C.; Zhou, B. Analysis of regional river blocking by debris flows in response to climate change. Sci. Total Environ. 2020, 741, 140262. [Google Scholar] [CrossRef] [PubMed]
- Byers, A.C.; Rounce, D.R.; Shugar, D.H.; Lala, J.M.; Byers, E.A.; Regmi, D. A rockfall-induced glacial lake outburst flood, Upper Barun Valley, Nepal. Landslides 2019, 16, 533–549. [Google Scholar] [CrossRef]
- Tariq, S.; Mahmood, A.; Rasul, G. Temperature and Precipitation: GLOF Triggering Indicators in Gilgit-Baltistan, Pakistan. Pak. J. Meteorol. 2014, 10, 39–56. [Google Scholar]
Publisher’s Note: MDPI stays neutral with regard to jurisdictional claims in published maps and institutional affiliations. |
© 2021 by the authors. Licensee MDPI, Basel, Switzerland. This article is an open access article distributed under the terms and conditions of the Creative Commons Attribution (CC BY) license (http://creativecommons.org/licenses/by/4.0/).