Article

Uneven Frontiers: Exposing the Geopolitics of Myanmar’s Borderlands with Critical Remote Sensing

by
Mia M. Bennett
1,* and
Hilary Oliva Faxon
2
1
Department of Geography, Room 10.23, Jockey Club Tower, Centennial Campus, The University of Hong Kong, Hong Kong 999077, China
2
Department of Environmental Science, Policy and Management, 130 Mulford Hall, University of California, Berkeley, Berkeley, CA 94709, USA
*
Author to whom correspondence should be addressed.
Remote Sens. 2021, 13(6), 1158; https://doi.org/10.3390/rs13061158
Submission received: 17 January 2021 / Revised: 15 March 2021 / Accepted: 16 March 2021 / Published: 18 March 2021
(This article belongs to the Special Issue Remote Sensing of Geopolitics)

Abstract

:
A critical remote sensing approach illuminates the geopolitics of development within Myanmar and across its ethnic minority borderlands. By integrating nighttime light (NTL) data from 1992–2020, long-term ethnographic fieldwork, and a review of scholarly and gray literature, we analyzed how Myanmar’s economic geography defies official policy, attesting to persistent inequality and the complex relationships between state-sponsored and militia-led violence, resource extraction, and trade. While analysis of DMSP-OLS data (1992–2013) and VIIRS data (2013–2020) reveals that Myanmar brightened overall, especially since the 2010s in line with its now-halting liberalization, growth in lights was unequally distributed. Although ethnic minority states brightened more rapidly than urbanized ethnic majority lowland regions, in 2020, the latter still emitted 5.6-fold more radiance per km2. Moreover, between 2013 and 2020, Myanmar’s borderlands were on average just 13% as bright as those of its five neighboring countries. Hot spot analysis of radiance within a 50 km-wide area spanning both sides of the border confirmed that most significant clusters of light lay outside Myanmar. Among the few hot spots on Myanmar’s side, many were associated with official border crossings such as Muse, the formal hub for trade with China, and Tachileik and Myawaddy next to Thailand. Yet some of the most significant increases in illumination between 2013 and 2020 occurred in areas controlled by the Wa United State Party and its army, which are pursuing infrastructure development and mining along the Chinese border from Panghsang to the illicit trade hub of Mongla. Substantial brightening related to the “world’s largest refugee camp” was also detected in Bangladesh, where displaced Rohingya Muslims fled after Myanmar’s military launched a violent crackdown. However, no radiance nor change in radiance were discernible in areas within Myanmar where ethnic cleansing operations occurred, pointing to the limitations of NTL. The diverse drivers and implications of changes in light observed from space emphasize the need for political and economically situated remote sensing.

Graphical Abstract

1. Introduction

Since the late 1990s, nighttime light (NTL) has been used to examine socioeconomic patterns and processes including urbanization [1,2,3], population and economic activity [4,5], and electrification [6,7,8]. Much of this research has focused on countries experiencing growth in these trends, particularly China [9]. Less research has scrutinized places that appear as literal “black holes” in global maps of NTL, such as North Korea, Cambodia, or Myanmar, our area of focus (some recent exceptions are published elsewhere [10,11,12]). This is a surprising oversight, for one of the advantages of NTL is that it can expose dynamics in locations and at scales for which government data are scarce or unreliable. For instance, whereas the World Bank estimated average annual economic growth of 10% in Myanmar between 1992 and 2006, the same rate approximated from NTL was only 3.3% [13]. Moreover, unlike many official statistics, NTL represents a globally consistent measure unconfined by sovereign borders (although national differences in lighting practices exist [14]). The data can thus help illuminate cross-border disparities in development [15,16], which can even help predict where conflicts might occur [17]. Such insights are particularly relevant for regions such as Southeast Asia, where inequalities across a range of human development indicators both within and between countries are rising [18]. In the case of Myanmar, NTL may also demonstrate the extent to which government officials’ efforts to integrate the country with its more developed neighbors, namely China and Thailand, are materializing.
One of Southeast Asia’s poorest nations, Myanmar is characterized by heterogeneous and unequal patterns of development that hinge on resource extraction and complex internal and international geopolitics. From General Ne Win’s military coup of 1962 until the election of the National League for Democracy in 2015, successive military regimes governed the country. Although the ideologies and leaders of these regimes varied, they shared an isolationist stance and perpetuated a policy of “Burmanization”, advancing a national identity centered on Buddhist Burmans, the majority population concentrated within seven centrally located and more urbanized lowland regions, while violently suppressing ethnic minorities. Many of these groups reside within seven peripheral states and have resisted outside domination for centuries [19,20,21]. The Government of Myanmar has never fully controlled ethnic minority populations in the country’s resource-rich borderlands and, since shortly after achieving independence in 1948, has been engaged in perpetual civil war with dozens of Ethnic Armed Organizations (EAOs) ranging from modest militias to well-armed bureaucracies with authority over autonomous territories. In the 1990s, the signing of various ceasefires prompted new forms of extraction and export-oriented trade in timber, opium and minerals between elites of various militias [22,23,24,25,26]. Fledgling reforms and the 2015 election of a civilian government appeared to bring an end to a half-century of military rule, spurring foreign direct investment. The February 2021 military coup, however, suddenly halted this liberalization. In the context of Myanmar’s long authoritarian history and recent volatility, NTL data can offer powerful insights into geospatial patterns of development during a decade of reform.
In the 2010s, Myanmar’s 53.7 million people resided under a diverse array of governing authorities and factions, from areas firmly under the control of the national government to others controlled by EAOs, such as the autonomous tin-producing Wa Self-Administered Division on the Chinese border, known as Wa State. This uneven geography of authority, conflict, natural resource extraction, and informal migration has structured Myanmar’s development prospects, especially along its borders with China, Thailand, Laos, India, and Bangladesh. After reforms began, China’s Belt and Road Initiative (BRI), which launched in 2013, targeted Myanmar’s borderlands at the crossroads of South and Southeast Asia with ambitious plans for infrastructure projects ranging from domestic hydropower plants to cross-border transportation corridors [27,28,29,30,31]. At the same time, the Myanmar military’s violent persecution of the Rohingya in Rakhine State, in western Myanmar bordering Bangladesh, led over 900,000 people to flee the country after the genocide intensified in 2017 [32].
Despite the lack of NTL-based studies to investigate dynamics in Myanmar, researchers, think tanks, and multilateral and non-governmental organizations (NGOs) have used multispectral and optical imagery to examine the country, often with a focus on land use and land cover (LULC) change. Key areas of interest include agriculture—a backbone of rural household livelihoods and Myanmar’s economy [33,34]—and forests and soil health [35,36,37]. With the country losing 0.96% of its forests annually between 2010 and 2020, the world’s seventh-highest rate [38], deforestation has attracted particular attention [39,40,41,42,43,44,45,46,47,48,49]. Remote sensing also has assisted drug production monitoring, as demonstrated by Chinese- and Myanmar-state sponsored research to detect poppy fields near the Chinese border by combining high-resolution satellite imagery and field surveys [50]. NGOs and other stakeholders have also leveraged remote sensing to expose illicit and clandestine activities, including violations by governments [51,52,53]. Such research highlights the potential to use geospatial technologies to expose undertakings that powerful actors seek to hide, both in Myanmar and beyond.
In this vein, remote sensing has detected processes spilling over Myanmar’s borders, from atrocities committed by the Myanmar military to resource extraction. Satellite imagery has been used to capture the burning of Rohingya villages [54,55,56] and estimate the population of refugee camps in Bangladesh [57] and their ecological impacts [58,59], with displacement and deforestation positively correlated [60]. Researchers have also tracked natural resource extraction within the country’s borderlands, from mining in Shan State bordering China [61] to oil palm and rubber plantations in the southeast [62,63], and along the Chinese and Laotian borders [64]. Particularly relevant to our inquiry is Aung et al.’s (2020) analysis combining satellite imagery and field observations to measure LULC change spurred by the construction of the China–Myanmar oil and gas pipelines [65]. This research into the environmental impacts of energy infrastructure also demonstrates the ability to combine observations from above and below in order to connect locally situated insights with national and international dynamics.
In this paper, our objective is to first examine the geography of uneven development within Myanmar and along its borders using NTL and then identify the potential drivers of dynamics observed from space by drawing on our field observations. This allows us to “socialize the pixels” [66], linking NTL dynamics to processes of resource extraction and international, often illicit, resource trade to development in border regions. We thus overcome two key limitations apparent in previous remote sensing studies of Myanmar. Firstly, most employ daytime rather than nighttime data and privilege changes to the natural environment. One notable exception motivating our research is from Puttanapong and Zin (2019). They show that NTL can be used to approximate socioeconomic conditions in Myanmar’s townships and detect widening spatial inequality, especially between central cities and borderlands [67]. A second limitation is that remote sensing studies often neglect to embed their research questions and analysis within a wider interrogation of geopolitics and development. Changes observed in satellite imagery, however, cannot be understood separately from the historical trajectories and contemporary political economies in which they are situated. This is especially the case for Myanmar’s borderlands, given their centrality in longstanding regional conflicts and national political and economic transformations [68,69]. Promisingly, work at the intersection of political ecology and remote sensing examining connections between Rohingya refugees and deforestation suggests that such inquiries may be emerging [70]. This would also further bridge remote sensing of socioeconomic and environmental processes.
We apply a critical remote sensing approach [71] integrating satellite imagery and qualitative data drawn from a review of scholarly and gray literature and ethnographic fieldwork in Myanmar, where one of the article’s authors has conducted research on development, environment, and governance since 2013 with attention to resource frontiers in the country’s borderlands [72]. Our research brings geospatial data into conversation with debates on borderlands, contested authority, and territory [73,74,75] to offer two main contributions. Empirically, we build a more complete picture of the fractious geopolitics of development in Myanmar and its borderlands, highlighting the continued importance of resource extraction as well as the recent impacts of forced migration and internal displacement. Methodologically, we demonstrate how long-term ethnography and other qualitative studies can inform and contextualize NTL analysis of geopolitically complex spaces.
In the following section, we explain our methodology for analyzing the geopolitics of development through critical remote sensing. Then, we discuss our findings, documenting uneven brightening between ethnic majority central regions and ethnic minority states before analyzing specific hot spots of resource extraction, trade, and refugee camps along Myanmar’s borders with China, Thailand, India, and Bangladesh. Finally, we conclude and offer some directions for future research, particularly in view of the 2021 military coup.

2. Materials and Methods

2.1. Data Collection

2.1.1. Nighttime Light and Geospatial Data

We used two recently produced NTL datasets to analyze trends across two separate time periods. First, to examine longer-term trends in Myanmar from 1992 to 2013 with attention to regional disparities, we employed the Harmonized DMSP/OLS NTL (Version 4) composites generated by Li et al. (2020) [76], in which aurora, ephemeral lights, and fires have been removed. Second, to assess more recent trends from 2013 to 2020 with a focus on Myanmar’s borderlands, we used the Annual VIIRS Night Lights (VNL) Version 2 (V2) masked average radiance composites generated by Elvidge et al. (2021) [77]. A major advantage of this annual dataset derived from monthly composites in which sunlit, moonlit, and cloudy pixels, background light, aurora, and biomass burning have been eliminated is that all processing steps and thresholds are identical across the series, enhancing the reliability of interannual change estimates. VIIRS imagery also improves upon the spatial resolution of DMSP-OLS because its pixel footprint is 45-fold smaller [78]. We more closely inspected changes detected in the VNL composites with high-resolution daytime imagery from Google Earth.
Although it would have been preferable to examine change across our study period all at once, DMSP-OLS (1992–2013) and VIIRS (2013–present) data are not readily comparable. The former reports relative values of radiance on a scale from 0 to 63, while the latter reports absolute values of radiance in nW·cm−2·sr−1. Although the Harmonized DMSP-OLS dataset attempts to seamlessly integrate the two types of imagery, the DMSP-OLS simulated composites generated for 2013–2018 are unreliable for rural and dimly lit (Digital Number (DN) < 30) areas [76]. Myanmar is sparsely illuminated and has a relatively low (~30%) level of urbanization [79]; therefore, we expected that the DMSP-OLS simulated composites generated from VIIRS data would hold less value for examining the country’s dynamics. Inspecting the data confirmed this hypothesis, since the simulated composites showed unusually high gains in NTL between 2012 and 2013 that appeared to be artefacts of the intercalibration process rather than any sudden growth in actual lights (Figure S1). Despite the difficulties with the simulated composites, the harmonized dataset’s actual DMSP-OLS composites remained useful for examining dynamics from 1992 to 2013. The harmonized composites were also intercalibrated using Southeast Asia as a reference point, making interannual comparisons more reliable than estimations from data intercalibrated using other parts of the world as a reference point, typically Sicily. Still, there was a noticeable jump in the harmonized data in Myanmar between 2008 and 2009 (Figure 2), which merits further investigation.
We obtained geospatial data on Myanmar’s 15 first-level administrative divisions (among them seven regions, seven states, and one union territory comprising the capital) and six special administrative zones/divisions from the Myanmar Information Management Unit (MIMU) (http://themimu.info/ (accessed on 10 January 2021)), an entity managed by the United Nations Resident and Humanitarian Coordinator in Myanmar. Although we noted that these datasets were largely digitized at a 1:250,000 scale, and that administrative boundaries remain contested on the ground [67], MIMU’s data provided sufficient granularity and accuracy for our internal comparisons. Myanmar’s international land borders, which it shares with five countries—China (2185 km), Thailand (1800 km), India (1463 km), Laos (235 km), and Bangladesh (193 km) [80]—were delineated based on the Food and Agriculture Organization’s Global Administrative Unit Layers (GAUL) 2015 version (Figure 1). We also supplemented our visualizations with road data from the Open Street Map (2021), additional road and river data from Natural Earth (2021), and ESRI topographical base maps.

2.1.2. Ethnographic Observations and Secondary Sources

We defined our scope of inquiry and interpreted the results from our remote sensing analysis through the lens of long-term ethnographic research on Myanmar’s politics and development. One author’s previous research included over 150 interviews with farmers, activists, and officials, and almost three years of participant observation in borderland villages, government offices, and activist groups, with a focus on rural development, land reform, and resource frontiers. This qualitative research guided the development of our research, which ultimately focused on describing, analyzing, and contextualizing Myanmar’s uneven brightening in relation to its internal and international politics of development. After conducting preliminary NTL analysis, we drew on a selection of this author’s interviews and ethnographic field notes to interpret our findings. In addition, we reviewed academic articles and gray literature on Myanmar’s development, natural resources, and governance, focusing on sources that directly informed our discussion of NTL hot spots located within the country’s borderlands.

2.2. Methods

2.2.1. Critical Remote Sensing

One of this paper’s key objectives is to demonstrate the power of integrating qualitative and NTL data to understand inaccessible and complicated geopolitical spaces. In pursuit of this aim, we adopted a critical remote sensing approach [71], contributing to an emerging subfield that interrogates the political economy of satellite data [81] and employs remote sensing alongside ethnographic methods [66,82,83,84,85]. Such approaches are useful in data-scarce environments such as Myanmar and across the Lower Mekong Region, where a lack of geospatial infrastructure and accessible, standardized datasets inhibits mapping efforts and geospatial analysis [86]. Efforts to quantify Myanmar’s natural resources, especially in terms of their exports, exemplify the deficiencies of existing statistics: Estimates of the annual market value of the jade trade range widely from USD 1.5 to 31 billion: 2–50% of Myanmar’s GDP [87]. To overcome such opacity, Connette et al. (2016) [61] used Landsat and Google Earth imagery to map and classify mining areas across Myanmar, 71% of which were concentrated in the gold- and jade-rich north [61]. While small-scale and underground mining operations were difficult to detect (see also Kyba et al. (2019) [88]), the scientists were able to identify sites more accurately from space through fieldwork and consultations with local civil society actors. We followed a similar mixed-methods approach, combining views from above and below to provide a widely scaled yet locally situated analysis of the patterns and drivers of illuminated activities in Myanmar’s borderlands from 1992 to 2020.

2.2.2. Data Preprocessing

In ArcGIS 10.8.1, we transformed the Harmonized DMSP-OLS composites (1992–2013) and the VNL V2 composites (2013–2020) to the WGS 1984 UTM Zone 46N projection and resampled the DMSP-OLS data to 1000 m2 and the VNL data to 500 m2. DMSP-OLS values in 2009 appeared unusually low; therefore, we replaced these values with the mean of the 2008 and 2010 composites. We also altered the MIMU data on Myanmar’s administrative units, which divides large areas into sub-units for the purpose of targeting development aid, to align with political realities, combining Bago East and Bago West into a single “Bago” Region, and Shan (North), Shan (East), and Shan (South) into a single “Shan” State. This generated seven regions, seven states, and one union territory (the capital of Naypyitaw) for analysis, consistent with national designations.

2.2.3. Data Processing: Univariate Statistical Analysis and Optimized Hot Spot Analysis

To calculate total annual NTL for each of Myanmar’s administrative divisions, we summed the preprocessed DMSP-OLS and VNL V2 data in each year from 1992 to 2020. We also calculated total lights per km2 for each division, measured in DN in the DMSP-OLS data (Table S1) and radiance in the VNL V2 data (Table S2). To examine change in lights over time, we performed univariate statistical, geospatial, and visual analysis. First, we calculated the annual rate of change in lights for each division from 1992 to 2013 and 2013 to 2020. Then, for our geospatial and visual analysis, we generated a difference image of DMSP-OLS NTL from 1992 to 2013 and a tri-temporal composite of logged VNL data from 2013, 2016, and 2020, in which saturation was boosted equally across all three channels to enhance visualization. We used the logged VNL data for our geospatial and visual analysis to allow the detection of finer and dimmer features.
To examine dynamics along Myanmar’s borders from 2013 to 2020, we performed hot spot analyses of radiance in 2013 and 2020 within a 50 km-wide area spanning 25 km of each side of Myanmar’s land borders with Bangladesh, India, China, Laos, and Thailand. We generated a 50 km-wide buffer in ArcGIS 10.8.1, and determined that each side of the border covered a comparable area (117,143 km2 within Myanmar and 117,386 km2 outside the border). We then clipped the logged 2013 and 2020 VNL V2 rasters to the buffer and converted each to a set of point features, with each 500 m2 pixel converted to a single point, to permit geospatial analysis. To inspect hot spots and cold spots of change in radiance, we also ran the hot spot analysis on a percent change raster, which was generated by subtracting the unlogged 2013 VNL composite from the 2020 one, and then dividing the result by the 2013 composite.
Next, we used the Optimized Hot Spot tool, which calculates the Getis–Ord Gi* statistic, to identify hot spots, or statistically significant (p > 0.1) clusters of high radiance values, within the 50 km buffer zone in 2013 and 2020. We chose a distance band of 10 km after determining that compared to 5 km, 25 km, and 50 km, it produced the most meaningful insights, capturing local dynamics while still displaying broader regional patterns. We also ran the Optimized Hot Spot tool on the 2013–2020 percent change composite to identify hot and cold spots of change in radiance within this period. Here, hot spots refer to clusters of areas experiencing a high percent change in radiance, while cold spots are those experiencing a small percent change in radiance. Lastly, we inspected the areas associated with hot spots of change in radiance from 2013 to 2020 using Google Earth imagery.

3. Results and Discussion

The patterns of Myanmar’s illumination between 1992 and 2020 revealed highly unequal development. While these dynamics did not always align with central government policy, they corresponded to existing ethnic and geographic divisions. Although Myanmar brightened overall, especially in the 2010s, lights remained concentrated in the cities of the central lowland plains, which stretch from the commercial hub of Yangon through the administrative capital at Naypyitaw, newly constructed and established in 2005, and onward north to Mandalay. Although the country’s peripheral states, which are less urbanized, more mountainous, and home to dozens of ethnic minorities, thus remained much dimmer than its ethnic majority regions, they brightened more rapidly. Recent illumination was particularly apparent in and around the autonomous Wa Self-Administered Division bordering China, revealing the complexity of uneven development in Myanmar in which, alongside major cities, ethnic self-determination and illicit networks also fuel economic activity.
These findings, elaborated belowfirst with attention to dynamics in Myanmar and then to its borders—point to the ways in which critical remote sensing can reveal dynamics beyond state control that might evade official statistics or media reports in authoritarian countries. As we discuss in the context of the Rohingya in Section 3.3.3, however, other populations and processes, generally those not associated with development or growth, can be difficult to detect with satellite imagery. Low levels of economic activity, such as artisanal mining, can also be challenging to spot using NTL alone [88]. By leveraging a mixed-methods approach integrating satellite observations with qualitative knowledge, we generated rich, politically and economically contextualized results that directly inform contemporary debates over ethnic federalism and democratic governance in Myanmar. In the wake of the country’s military coup, addressing infrastructural disparities, determining relative autonomy, and delineating control over natural resources are central political questions with domestic and international relevance.

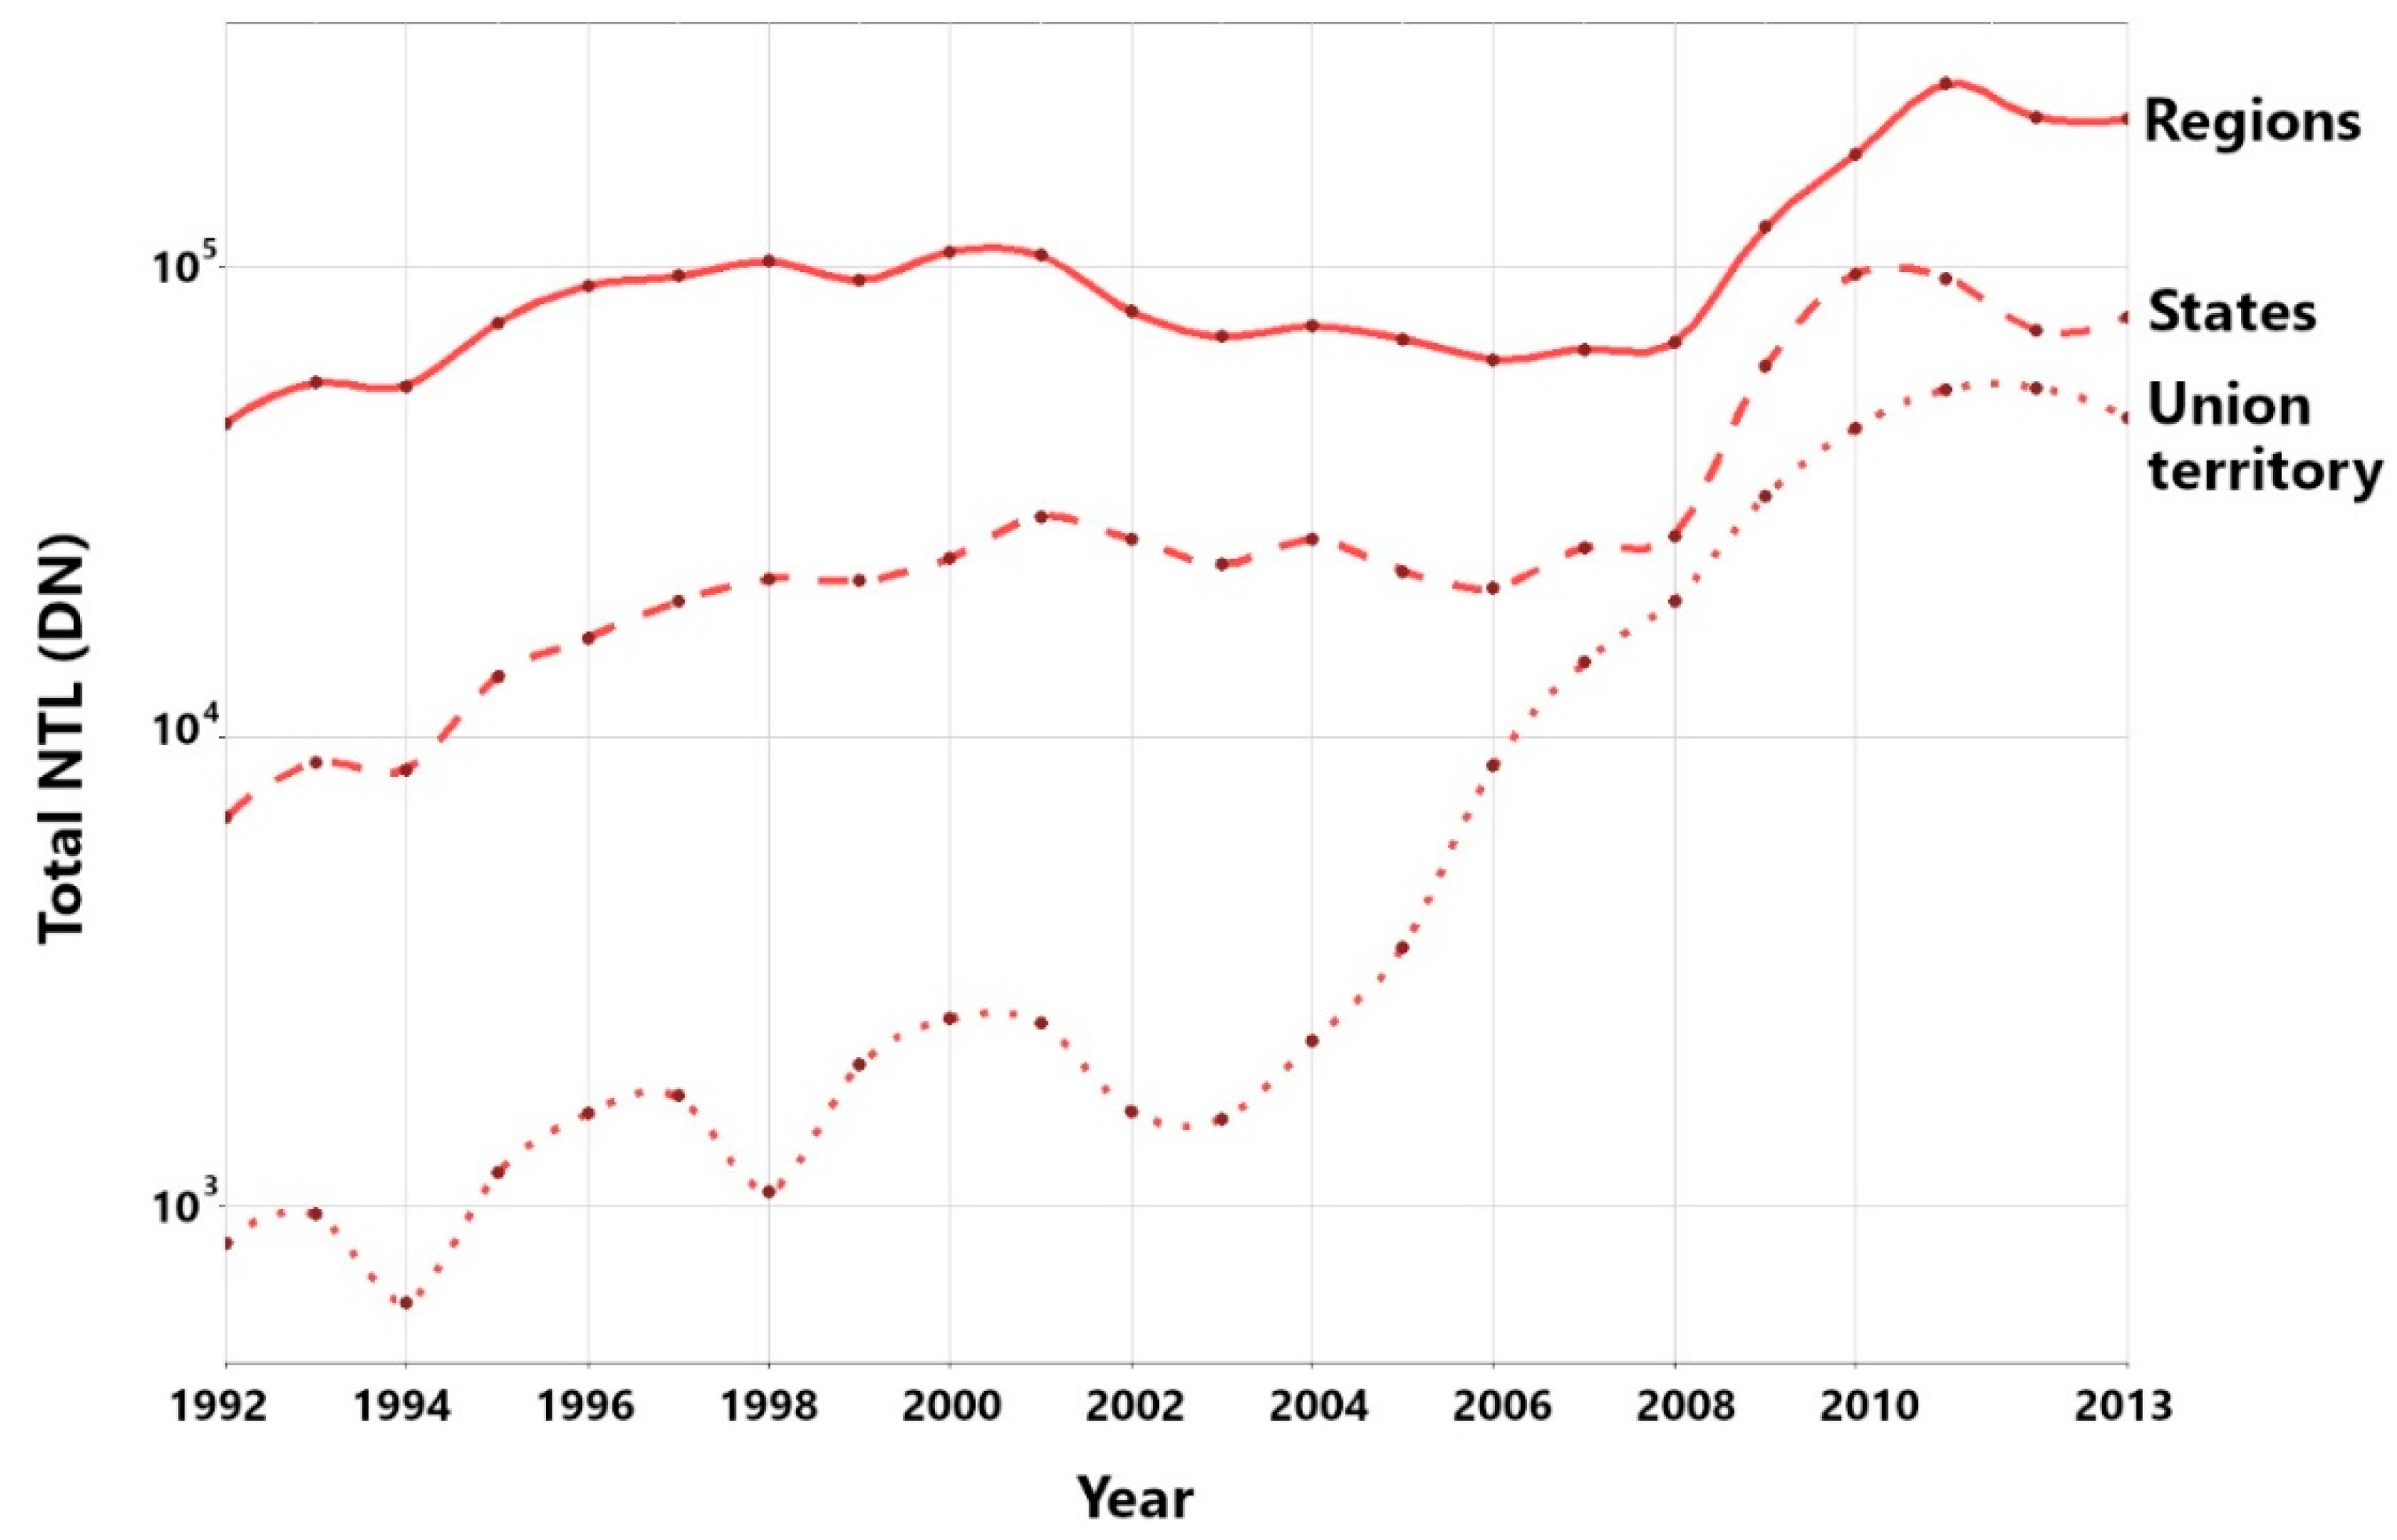
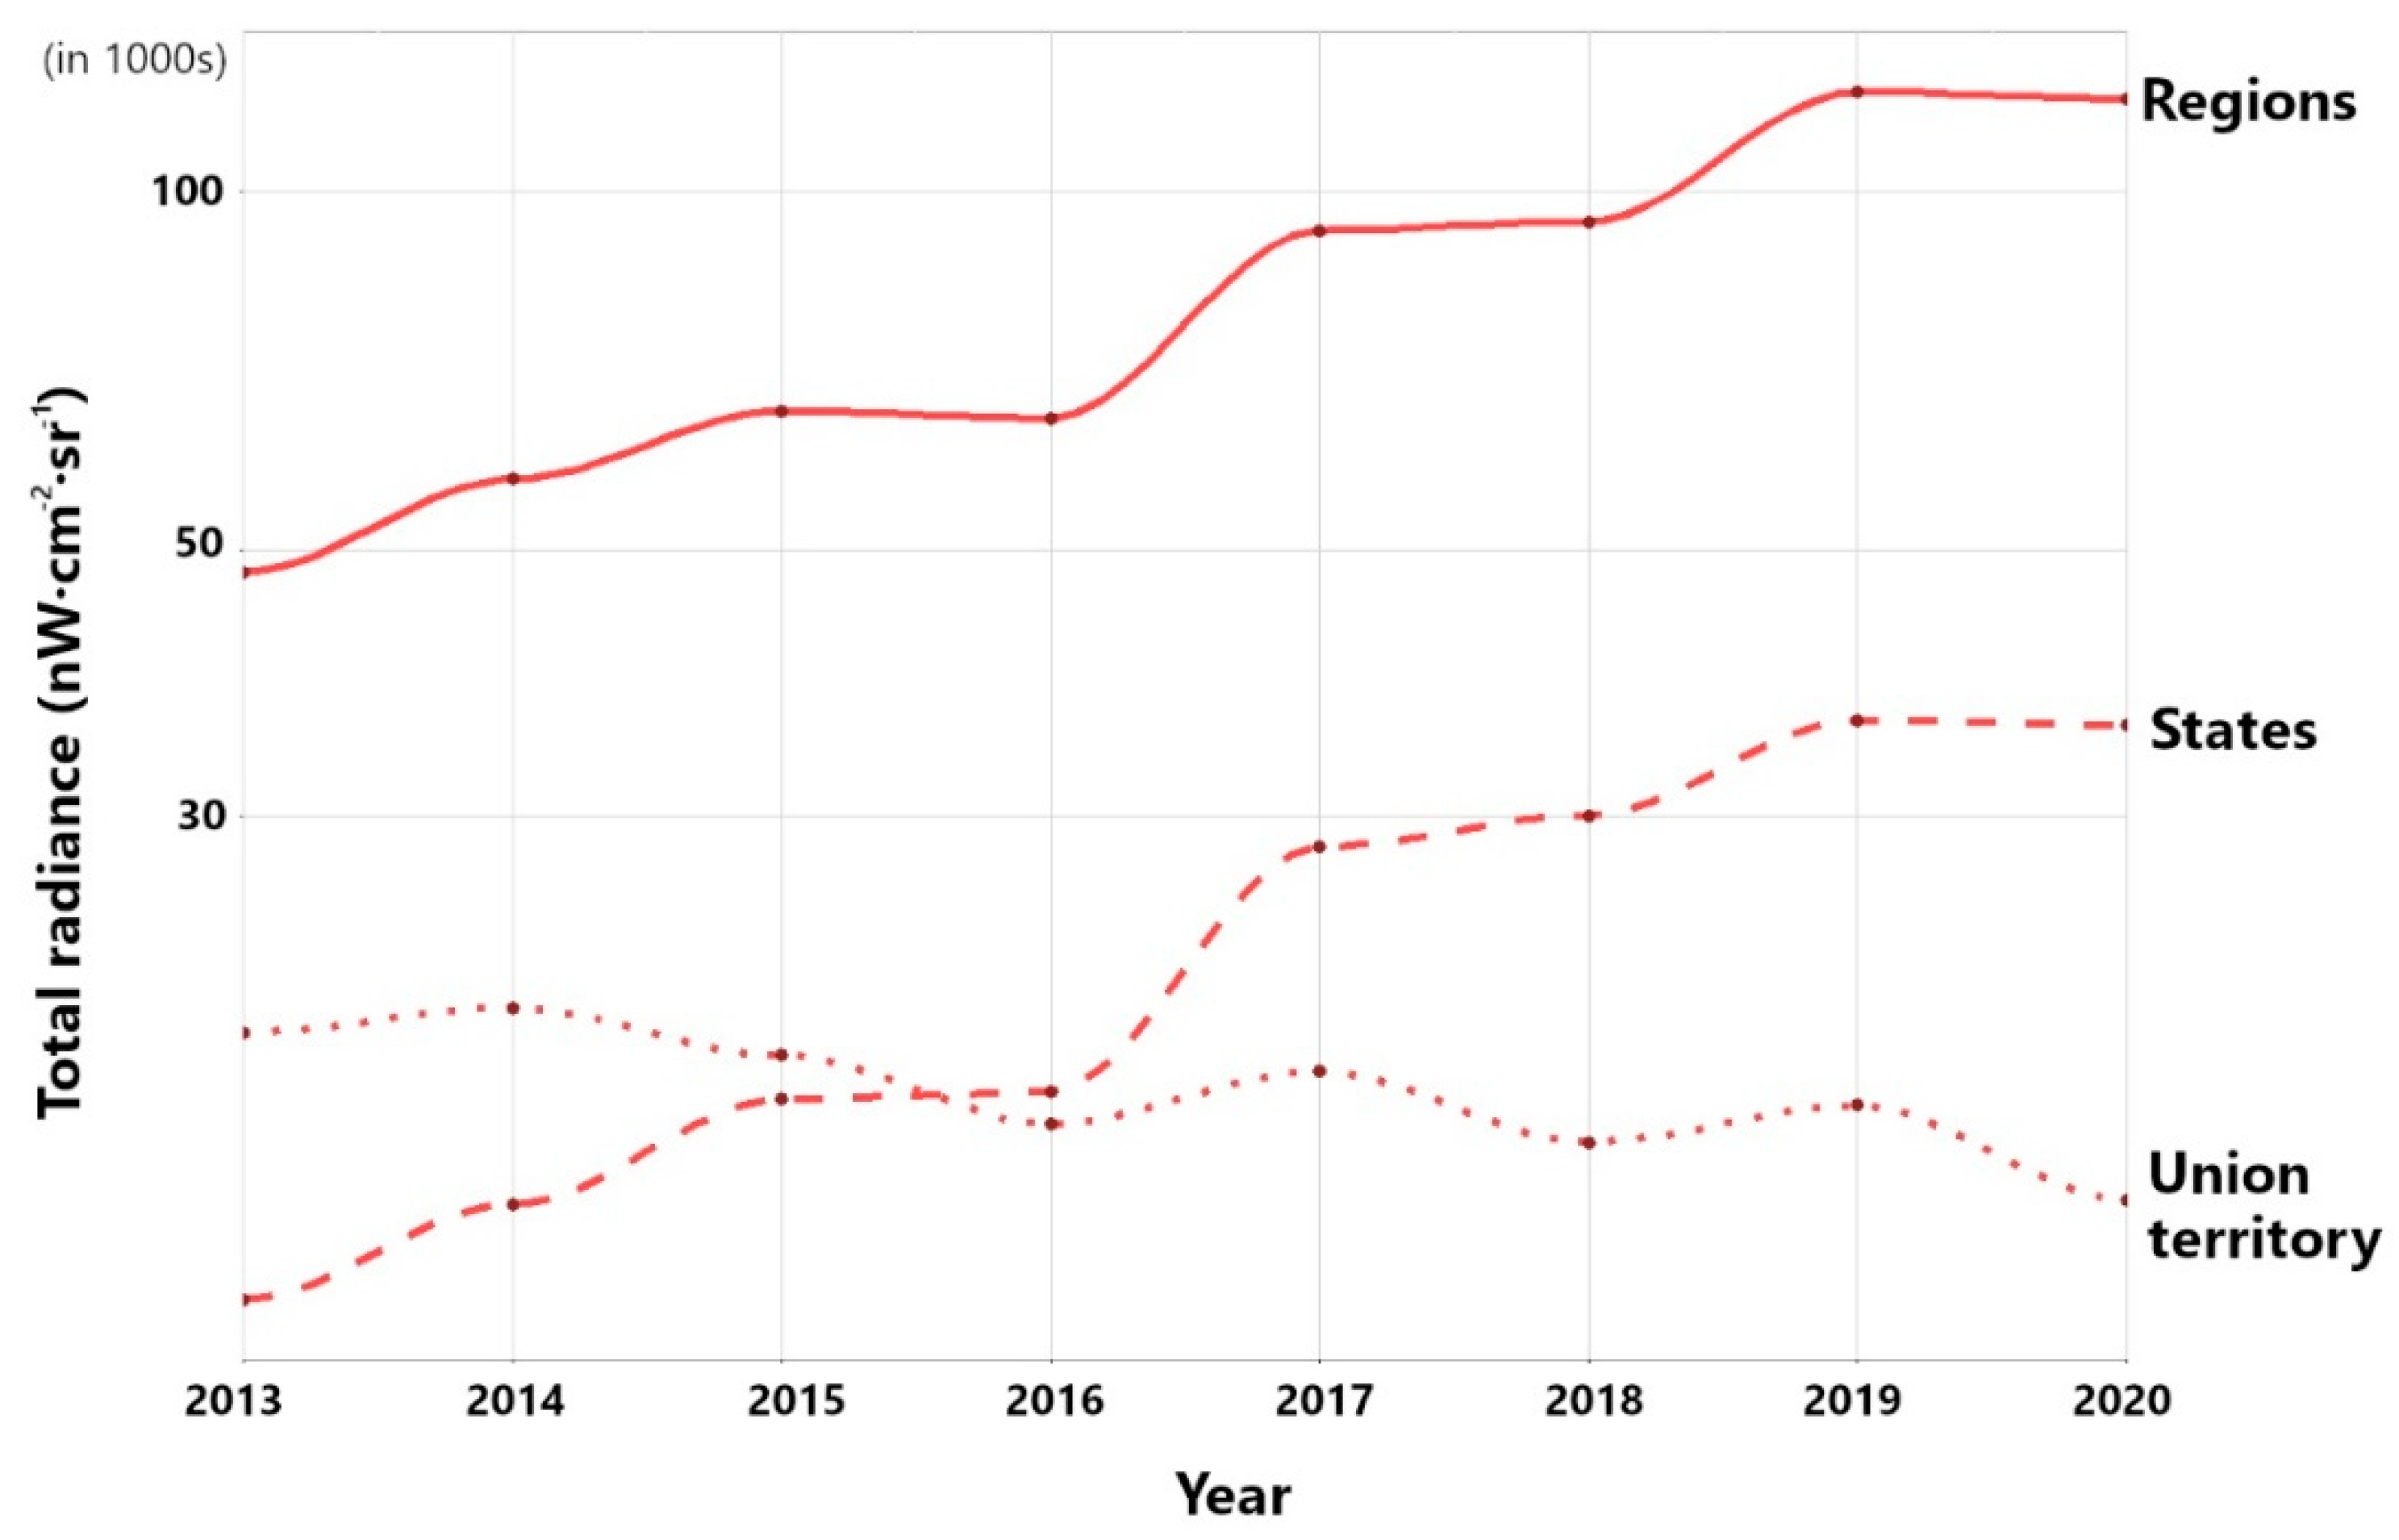
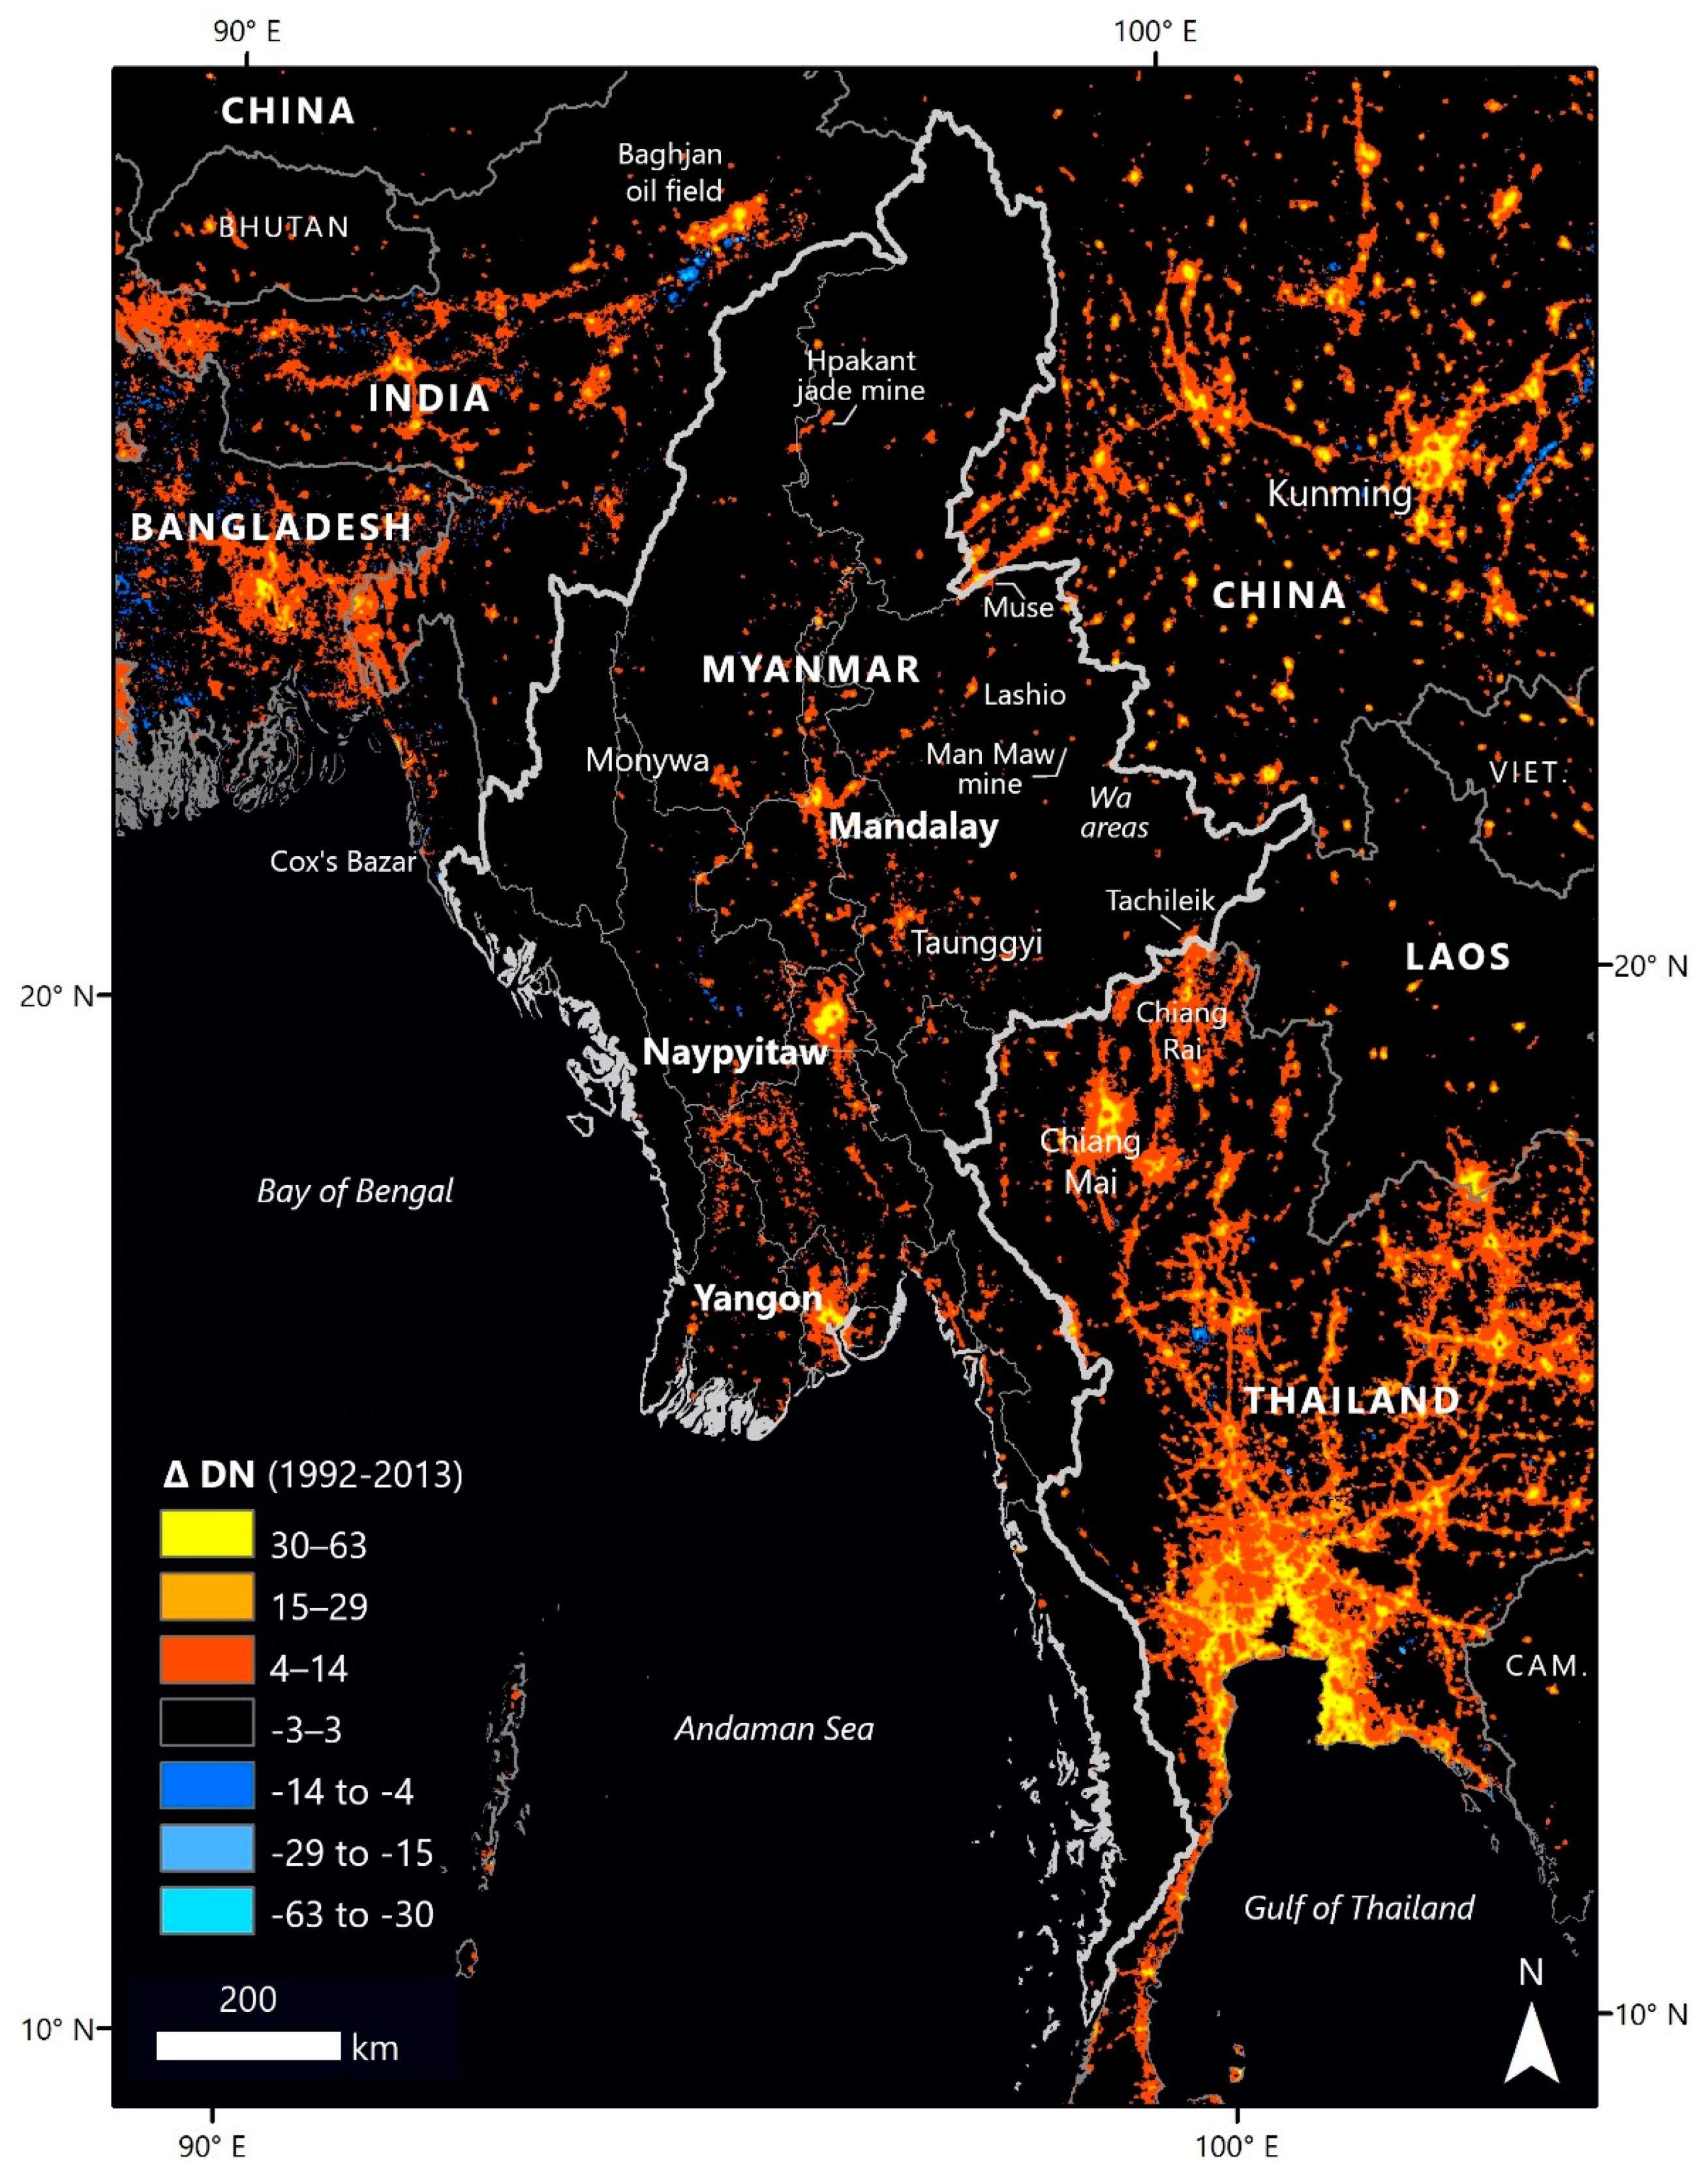
3.1. NTL Dynamics within Myanmar

Although Myanmar brightened overall, the stark difference between its seven central regions home to its three, brightly lit major cities and its dark borderlands persisted throughout the last three decades (Figure 2 and Figure 3). Yangon, Naypyitaw, and Mandalay—all located within the predominantly ethnic majority (Burman) regions—emitted 52% of Myanmar’s radiance in 2020, despite containing only ~30% of Myanmar’s citizens [89]. Encouragingly, lights brightened more quickly in Myanmar’s rural, largely ethnic minority states than in its more urbanized regions. On average, the seven states exhibited an annual rate of NTL change of 9.4% between 1992 and 2013 compared to 7.6% per year for regions (Table 1). From 2013 to 2020, states continued to brighten more rapidly each year (25.6%) than regions (15.6%) (Table 1). Due to differences between the DMSP-OLS and VIIRS sensors, it is difficult to explain whether the large increases in the magnitudes of change between 1992 and 2013, and 2013 and 2020 were because of measurement techniques or actually faster growth in radiance during the recent period of reform and liberalization. Regardless, in 2020, Myanmar’s regions were still on average 5.6-fold brighter per km2 than its seven states (regions: 0.85 nW·cm−2·sr−1/km2; states: 0.15 nW·cm−2·sr−1/km2). This divergence confirms the entrenched underdevelopment of Myanmar’s ethnic minority states [90].
Myanmar’s cities outshone its rural hinterlands up to the present, exemplifying disparities in rural versus urban development (Figure 4). Strikingly, the new capital of Naypyitaw emitted more radiance than all states combined each year from 2013 to 2015 (Figure 3). Although the city actually dimmed 4.5% annually from 2013 to 2020, the contrast between its sudden illumination after being chosen and erected by senior military generals and the persistent darkness over Myanmar’s rural areas encapsulates deep inequalities between a small class of elites and the country’s large, historically agrarian, population.

3.2. NTL Dynamics in Regional Context

Both the DMSP-OLS and VNL data captured Myanmar’s lack of infrastructure and economic activity compared to its Southeast Asian neighbors. From 1992 to 2013, Myanmar remained darker than China and Thailand to the east and Bangladesh and India to the west (Figure 5). Only Laos—a largely agrarian and underdeveloped country—stayed similarly dark and unchanging. Lights in China and Thailand brightened up to the border, particularly along a corridor stretching from the Chinese city of Kunming towards the Myanmar border town of Muse, and north of the Thai cities of Chiang Mai and Chiang Rai towards the Myanmar border town of Tachileik. In contrast, Myanmar’s borderlands remained relatively unlit, with brightening instead concentrated in the central lowland cities of Yangon, Naypyitaw, and Mandalay.
These regional NTL dynamics changed from 2013 to 2020, as Myanmar appeared to brighten more recently than its neighbors. In the tri-temporal VNL composite (Figure 6), yellow and red pixels within Myanmar indicated brightening between 2013 and 2020, with redder hues conveying consistent and recent brightening. In contrast, southwest China, characterized by bluish pixels, generally dimmed, although areas with purple pixels suggest that declines in 2016 were followed by brightening again in 2020. There was also a smattering of red pixels near the China–Myanmar border. In Thailand, while the green pixels centered on Bangkok suggested brightening until 2016 followed by dimming, there were many red pixels in the country’s northeast verging on Myanmar. Likewise, Bangladesh contained red pixels around Cox’s Bazar, to where many Rohingya Muslim refugees from Myanmar have fled. Finally, India appeared generally green and blue, meaning lights were dimmer in 2020 than in previous years. This trend may be due to the country’s particularly severe economic downturn and lockdowns associated with the COVID-19 pandemic.
Within Myanmar, yellow and red pixels were apparent around Yangon, Mandalay, and the two highways connecting the urban centers, as well around the smaller cities of Taunggyi and Monywa. Although these interior cities are located far from Myanmar’s borders, outside the scope of our study, resource extraction and trade in the borderlands fund substantial investments in their infrastructures [91]. Red pixels were also noticeable in Wa areas and around the Myawaddy–Mae Sot crossing on the Thai border, although most pixels were concentrated on the Thai side. Around Naypyitaw, blue pixels suggested consistent dimming since 2013. In 2015, one newspaper headline noted of the hastily constructed city, which failed to attract a population befitting its size and grandiosity: “The lights are on but no one’s home in Myanmar’s capital” [92]. In fact, it appeared the lights were already being turned off.

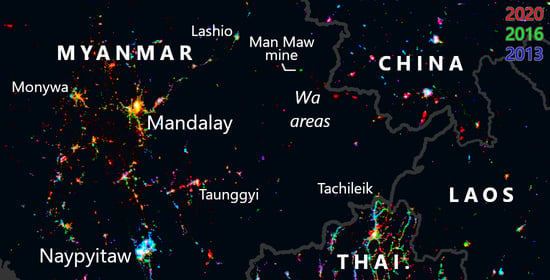
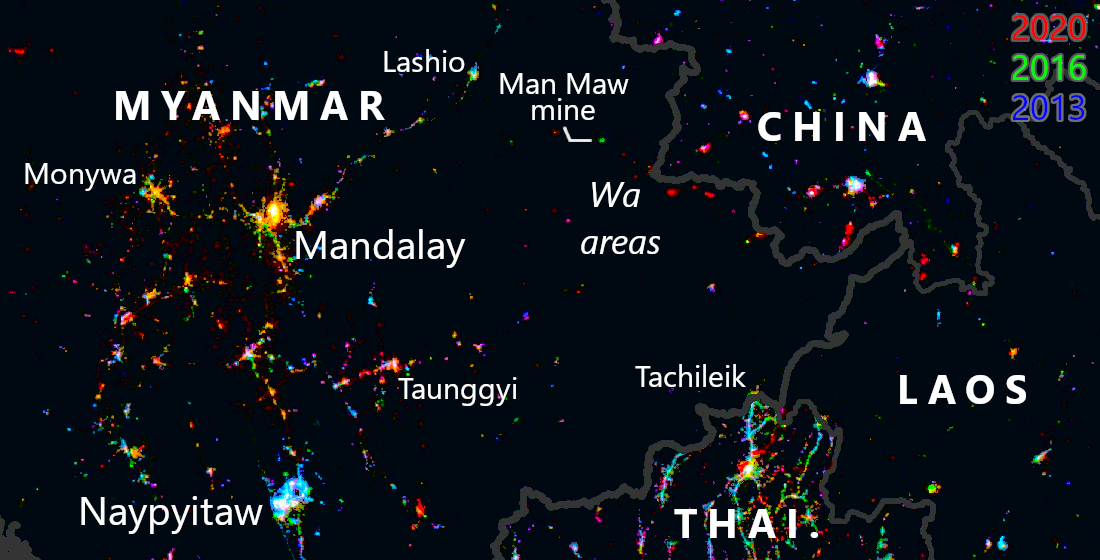
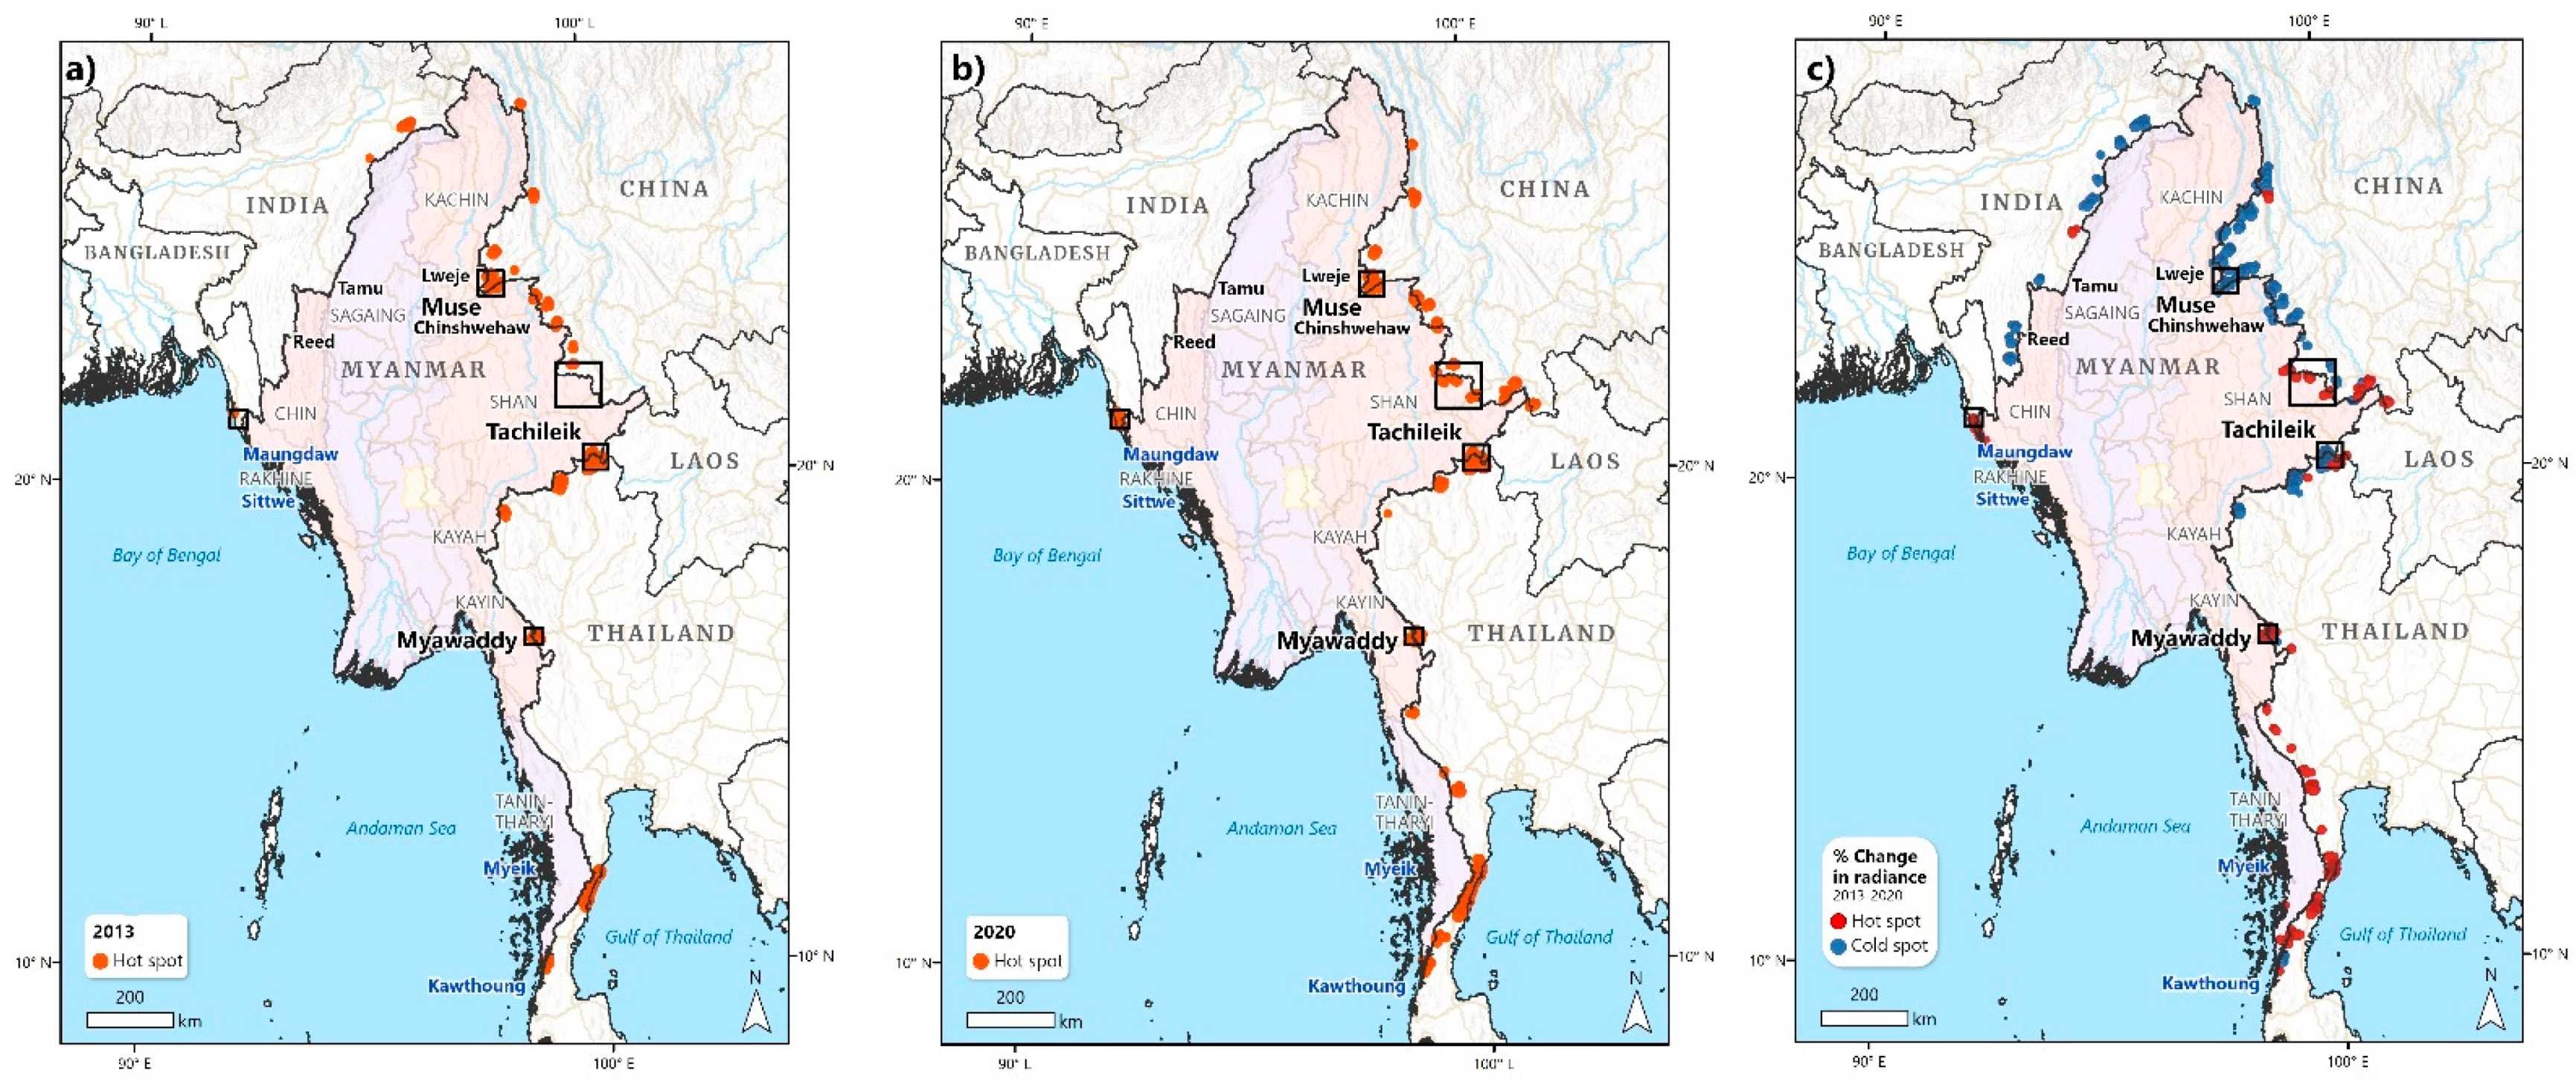
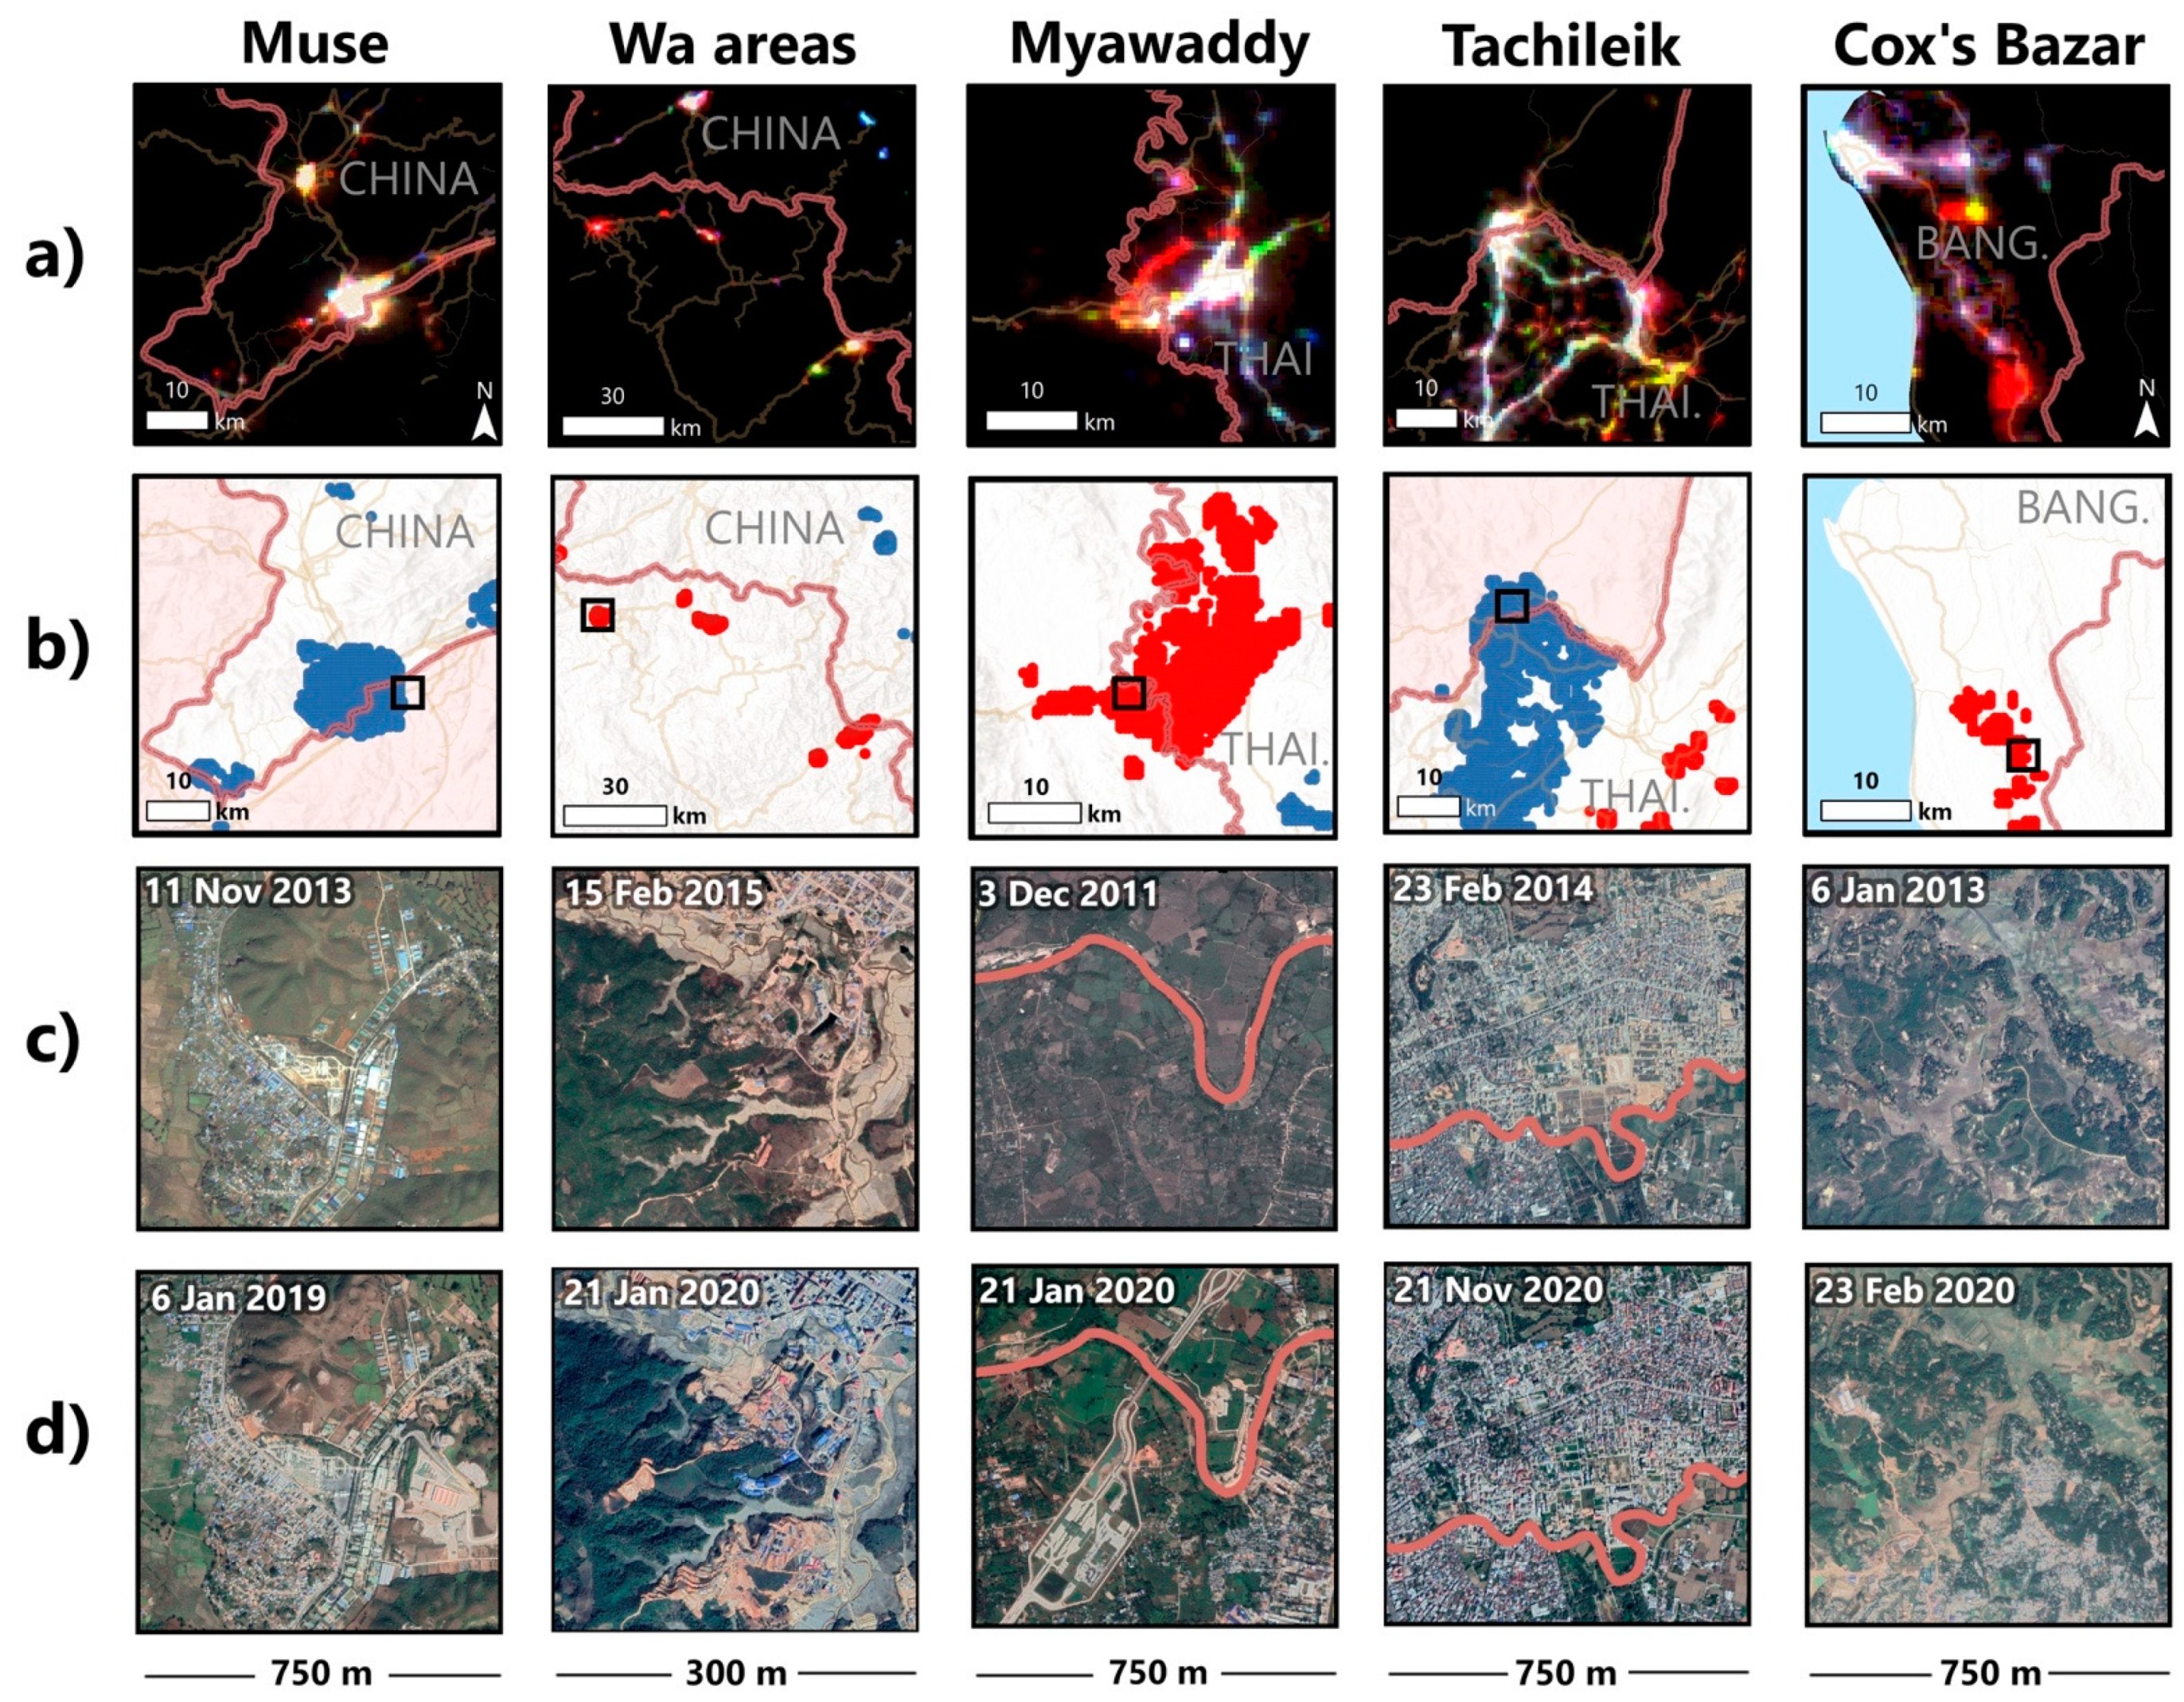
3.3. NTL Dynamics in Myanmar’s Borderlands

The recency and higher resolution of the VNL data allowed closer, more current inspection of NTL dynamics in Myanmar’s peripheral states and borderlands. While Myanmar government statistics emphasized a tripling of cross-border trade between 2012 and 2018 [93], NTL imagery suggested that the geography of this trade was highly uneven. From 2013 to 2020, the 25 km edge of Myanmar’s domestic borderlands was, on average, just 13% as bright as the 25 km-wide area just across the border. This disparity recently narrowed: in 2013, Myanmar’s domestic borderlands were only 10% as bright as its foreign borderlands; in 2020, they were 17% as bright (Table S3).
This persistent difference in illumination levels was corroborated by our finding that nearly all of the hot spots of both radiance and change in radiance were located across from rather than inside Myanmar’s borders (Figure 7 and Figure 8). In both 2013 (Figure 7a) and 2020 (Figure 7b), most hot spots were located on the foreign side of official border crossings and infrastructural corridors connecting the country with China and Thailand. Other hot spots associated with cross-border economic and geopolitical processes ranging from mining to infrastructure development and refugee flows were also concentrated in Myanmar’s foreign borderlands, with the notable exception of Wa State. The many hot spots along the borders with China, Thailand, and Bangladesh revealed an overall intensification and concentration of activities in the country’s eastern and southern borderlands. In contrast, the country’s northern borderlands had relatively minimal growth in lights since 2013, as depicted by the proliferation of cold spots of radiance change (Figure 7c).
To unpack the complexity of on-the-ground activities as well as the mismatch between hot spots and official border crossings, especially in terms of where radiance increased the most (Figure 7c), we situated our remote sensing results within their local and regional political and economic contexts. The following subsections analyze recent NTL dynamics along the four borders where hot spots were prevalent: China, Thailand, India, and Bangladesh. Although we do not explore the Laotian borderlands given their paucity of hot spots, we stress that their darkness did not necessarily indicate an absence of activities. Instead, the complex geopolitics of remote, less-connected frontiers may be better explored through fieldwork than satellite imagery.

3.3.1. Northeastern Border with China

China plays a key role in Myanmar’s borderlands as well as within its national economy and politics. Historically, the Chinese government has provided support for armed organizations in the borderlands, particularly the Communist Party of Burma. Today, China is an important mediator between EAOs and the Myanmar government. Between 1988 and 2011, Chinese capital accounted for 26.6% of official foreign investment [94]. A large proportion of Beijing’s recent and proposed investments have been slated for infrastructure development, including a high-speed railway from Yunnan to the proposed Kyaukphyu Deep Sea Port in Rakhine State on the Bay of Bengal, hydropower projects such as the contested Myitsone Dam in Kachin State, and three border economic cooperation zones [95]. Many of these undertakings are associated with China’s multitrillion-dollar BRI.
China’s importance to Myanmar’s infrastructure development manifested in our analysis along the countries’ shared border. Two of Myanmar’s three states bordering China, Shan and Kachin, experienced the third- and fourth-highest annual NTL growth rates of all of Myanmar’s divisions between 1992 and 2013 (Table 1). In Shan State, much of this increase was concentrated along Highway 3 between Mandalay and the city of Lashio (Figure 6). While the highway leads to the border town of Muse, brightening was more noticeable in the direction of Mandalay rather than the border, perhaps due to the continuation of armed conflict around the northern stretch of the road. This unrest, however, does not seem to have diminished Chinese influence in the area. During field visits to this area in 2016 and 2017, one of the authors saw signs written in Chinese, among them advertisements of land for sale, along the highway, including just 50 km outside of Mandalay. Around Lashio, the author also observed corn planted on large swaths of farmland adjacent to the road to Muse (Figure 9). Interlocutors explained that Chinese investors usually finance these new plantations. These changes to both land use and ownership were made in anticipation of planned BRI investments along the corridor, which may contribute to future activities (and illumination) driven by and oriented towards China.
The border town of Muse is Myanmar’s largest cross-border trade hub, accounting for approximately half of official border commerce [96]. The VNL data reflected this importance, with Muse having one of the highest concentrations of hot spots along Myanmar’s borders. The city is also important within a Chinese context; other research has shown it to be a hot spot along China’s own borders with 12 countries [71]. One key commodity traded at Muse is jade, of which production is driven by Chinese consumer demand [97]. Muse’s illumination is thus likely connected to the Hpakant mine nearly 200 km inland. Although the mine site brightened substantially between 1992 and 2013 (Figure 3), it dimmed between 2016 and 2020, as indicated by the green pixels in the VNL tri-temporal composite (Figure 4). The Chinese government reported USD 2.6 billion in jade imports from Myanmar between 2012 and 2016, a number that almost certainly underestimates the volume of trade, much of which is illicit [98]. The distance between the Hpakant mine and the border town at Muse where the precious stone “resurfaces”, often after being traded in the markets of the interior Myanmar cities of Myitkyina and Mandalay, belies the fact that cross-border patterns of illumination are often connected to development processes extending both within and across multiple countries.
Although Muse emitted a large amount of radiance, the most significant hot spots of radiance change between 2013 and 2020 lay farther south in Shan State in areas associated with the Wa people (Figure 8). Within Myanmar, the so-called “Wild Wa”, a Mon-Khmer speaking tribe, enjoy a ferocious reputation and the greatest level of territorial autonomy of any minority ethnic group [99]. One significant agglomeration of rapidly brightening lights was associated with the town of Mongla, an unofficial border crossing in the “Golden Triangle” region between Yunnan (China) and Thailand that facilitates illegal trade in products such as opium, ivory, and elephant parts [100,101]. These hot spots were unusual in that there are more on the Myanmar than Chinese side, reversing the typical pattern of Myanmar’s borderland development (Figure 8). Indeed, the location of Mongla’s casinos and markets outside of China’s legal jurisdiction is part of the city’s appeal for Chinese visitors seeking to engage in illegal activities or buy illicit goods. In Mongla, Chinese businessmen negotiate trade and development with local elites, often connected with armed conflict and drug trade [102]. Since 1989, the surrounding area, known as Special Region 4, has been controlled by the National Democratic Alliance Army (NDAA) as part of a ceasefire with the Myanmar military. Although Special Region 4 falls outside the Myanmar government’s recognized boundaries of the Wa Self-Administered Division, historically, the ruling United Wa State Party (UWSP) and its United Wa State Army (UWSA) have been close allies of the NDAA, sharing roots in the Communist Party of Burma and entering into ceasefires with Myanmar at similar times. Myanmar citizens need a special visa to visit Mongla, which operates on Beijing time, uses Chinese language and currency, and employs Yunnanese workers. The complexities of this economic activity highlight the challenges of attributing growth in NTL to any one country, particularly in border zones [71]—and especially in those where the national government’s sovereignty is contested.
Another agglomeration of hot spots of change in radiance that was also located in Special Region 4 was around the town of Mongpauk, located ~10 km from the border in Mongyang township. Although dispersed networks of mining and opium production have long sustained Wa autonomy in relation to powerful neighbors and colonial powers [103], since the late 1980s, the group has also pursued more conventional forms of development supported by international agencies and the governments of countries such as China and Japan [104,105]. In 1988, the UN Drug Control Programme and the Myanmar Government’s Central Committee for Drug Abuse Control launched the Wa Alternative Development Project, mirroring national and international development efforts to the north in Wa State [106]. More recently, large tracts of forest were cleared to make way for new infrastructure, as captured in Google Earth imagery (Figure 8). This land use change may have been driven by the UWSP’s relocation of hill tribes from farther north in Wa State to new riverside housing estates it built within areas it controls, where the hill tribes will need to share land with farmers already living there [107]. While NTL can therefore help identify the construction of illuminated, modernized settlements, it can obscure the forced relocations driving their construction, whether of hill tribes in Shan State or Rohingya fleeing from Myanmar to Bangladesh.
Just beyond the 50-km-wide borderlands we studied, one area of note within Wa State that merits future investigation is the Man Maw tin mine (Figure 10). Its sudden opening in 2014 propelled Myanmar to become the world’s third-largest producer of the commodity (after China and Indonesia) [108,109]. Tin ore is sent to China for smelting through the Myanmar border town of Panghsang [20], which is associated with a concentration of hot spots following the road into China. In the 1992-2013 DMSP-OLS change composite, the mine appears as an area experiencing an increase in light, likely reflecting the start of operations in the 2010s. In the 2013-2020 VNL composite, however, the mine is characterized by green pixels (Figure 6), indicating dimming since 2016. This decline in radiance corroborates reports from the same year of rapidly slowing production that could be “depleted in two to three years” [110]. Despite technically being “artisanal”, in that the tin mine is owned by senior UWSA and UWSP officials rather than well-established mining companies [111], its visibility in NTL imagery suggests industrial operations, especially because artisanal mines have been found to be generally undetectable in VIIRS imagery [88]. In short, the activities managed by the UWSA and UWSP ranging from infrastructure development to mining are of such a scale that their illumination is visible from space. When analyzed in combination with other data sources, NTL imagery can therefore help expose the supposed “shadow networks” enveloping these groups [112], which extend across Myanmar’s borders and below its surface.

3.3.2. Southeastern Border with Thailand

Rapid development within Myanmar’s three states (Shan, Kayah, and Kayin) and one region (Tanintharyi) bordering Thailand and along the border itself was clearly visible in NTL data throughout the entire time period. From 1992 to 2013, after Naypyitaw, Kayin State was the second-fastest brightening division in Myanmar. Illumination radiated outward from the regional capital of Hpa-An, lying on the Thanlwin (Salween) River at the junction of National Highway 8 (part of Asian Highway 1) leading to Mae Sot, just over the border in Thailand, and the highway leading upriver towards Yangon. In the 2010s, economic zones and transportation infrastructure were developed on both sides of the Myawaddy–Mae Sot crossing [113], driving a robust border trade with Thailand. Border capitalism is not merely confined to the exchange of goods, but also includes the movement of workers, as anthropologist Stephen Campbell shows in his account of how precarious, low-wage migrant labor from Myanmar fuels burgeoning Thai factories across the border [114]. This phenomenon is visible in the proliferation of hot spots across from Myawaddy in Mae Sot (Figure 8).
Dynamics in Myanmar’s borderlands near Thailand demonstrate that illumination and infrastructure development within a country should not always be attributed to its national government’s actions. The brightening observed along Kayin’s domestic transportation corridors, for instance, can likely be attributed to Thai government financing. In 2005, Thailand funded construction of an 18-km highway from Myawaddy to Thingan Nyi Naung. For the next decade, the following 38 km remained a narrow, one-way road that alternated between east- and west-bound traffic each day [115]. Improvements to this section, again financed by the Thai government, were completed in 2015, likely catalyzing its illumination. Yet even with direct Thai investment within Myanmar, cross-border development remains highly spatially unequal, as captured by the disproportionate number of hot spots on the Thai side (Figure 8).
From 2013 to 2020, Kayin continued to brighten rapidly at 18.5% per year, while Tanintharyi to its south brightened even more, at 22.2%. Growth in this region appeared driven by brightening in the coastal cities of Kawthoung, an official border station with a ferry crossing to the Thai town of Ranong, and Dawei, which is linked by an unimproved mountain road to Myanmar’s second most active border trade town, Htee Khee [96]. Another site of significant activity within the Thai borderlands, this time in Shan State, was at Tachileik, adjacent to the Thai town of Mae Sai. Although under the control of the Myanmar government, Tachileik’s economy, like that of Mongla to its north, has been built on illicit industries controlled by EAOs, including trade in wildlife, timber, opium, and, increasingly, methamphetamines. While the border crossing around Tachileik had numerous hot spots in 2020, it brightened less rapidly than Mongla, as illustrated by the prevalence of cold spots of change in radiance (Figure 7c). Gold and platinum mining that has been reported just north of Tachileik [61] also did not appear in the NTL imagery, suggesting smaller scales of extraction than at the Man Maw tin mine.
Finally, to Shan State’s immediate west is Kayah. Unlike Kayin and Tanintharyi, the highly rural state lacks any infrastructural corridors or formal border crossings with Thailand. However, the dearth of radiance, as noted before, corresponds to a lack of illuminated infrastructures rather than socioeconomic activity. Describing the border zones in Kayah and Shan States, Grundy Warr and Wong (2002) write: “Until recently… Pa-O, Shan, Chinese, Indian and Karenni merchants carried on a thriving cross-border trade, wending their way along jungle-paths, mule-tracks, or riverbeds to avoid the few routes controlled by the Myanmar/Burma Tatmadaw [main army]” [116]. On the one hand, such informal activities are unlikely to be brightly lit. On the other, the Myanmar government’s efforts to fortify and formalize its borders may genuinely undermine the vibrancy of such networks, especially when people are forcibly displaced. In the most dimly lit of spaces, granular, grounded research is required to grasp complex political and economic dynamics unrecognized and often repressed by the state.

3.3.3. Western Borders with India and Bangladesh

Myanmar’s states bordering India and Bangladesh to the west are home to some of the country’s most marginalized and sometimes persecuted populations. The region of Sagaing and the states of Chin and Rakhine are also poorly connected to their neighbors, reflecting both the national government’s indifference to infrastructure development and an absence of powerful and well-resourced autonomous actors that could fill that void, as in Wa areas.
With a population of three million people, the Indian city of Imphal in Manipur province is one of the largest metropolises in close proximity to any of Myanmar’s borders. Imphal also has a road connection to the India–Myanmar border town of Moreh, through which 99% of official overland trade with Myanmar flows (although extensive smuggling is conducted elsewhere around the porous border) [117]. However, NTL imagery suggests that Imphal does not seem deeply integrated with the neighboring Myanmar state of Sagaing in any formal way, as reflected by the dark border (Figure 6), and the proliferation of cold spots reflecting slow growth in radiance (Figure 7c). In 2001, the Indian government built and financed the India–Myanmar Friendship Road connecting Moreh and the adjacent Myanmar border town Tamu (Figure 11) to the interior towns of Kalaymyo and Kalaywa. While regional powers have discussed extending the road 1360 km all the way to Myawaddy as part of the India–Myanmar-Thailand Trilateral Highway Project [118], onward connections from Tamu to the rest of Myanmar were not yet perceptible in VNL imagery (Figure 6). Nevertheless, one author’s fieldwork in Kalaymyo revealed that many local merchants and some farmers frequently cross into India to sell local delicacies such as “monkey tear” beans and imported goods. They sometimes spend their earnings from this cross-border trade on building infrastructure, such as a multi-story concrete home in Kalaymyo in which the author rented a room in September and October 2018. The owner, who also owned a house in Imphal, explained that she had hitched rides through Mandalay and Lashio to the eastern border at Muse to buy cheap clothes and household goods in China, and then carried them back across Myanmar to sell at a profit in India. She recounted walking back into Myanmar through the jungle with cash hidden in her clothing to avoid military taxes and harassment, explaining that it was through decades of these journeys across not one, but two borders, that she had financed the house’s construction. These intimate and informal linkages, often facilitated by relatives on both sides of the India–Myanmar border, remain invisible to satellite imagery.
Farther south along the borders with both India and Bangladesh, Chin State, home to Myanmar’s second-smallest population (~479,000 in 2014), brightened the least of any division between 1992 and 2013 (0.43% per year) (Table 1). Located in the isolated Arakan Mountains, Chin State has been described as “literally a Southeast Asian frontier…it is where Southeast Asia ends, and where South Asia begins” [119]. In recent years, however, Chin State received more poverty-related grants from the central government than any other [119]. In a remarkable reversal that perhaps reflects these transfers as well as the role of NGO projects and remittances, from 2013 to 2020, Chin State brightened 60.7% per year, more than any other division. However, the state continued to be much dimmer than the rest of the country. In 2020, on average, Myanmar emitted 0.25 nW·cm−2·sr−1 per km2, whereas Chin state emitted a negligible 0.01 nW·cm−2·sr−1 per km2.
Immediately south of Chin State lies Rakhine State, which experienced the third-slowest growth in NTL (5.6%) of any division between 1992 and 2013. From 2013 to 2020, however, in a similar reversal as Chin State, Rakhine brightened more rapidly than all other states and regions (29.0%). Most of this growth was concentrated in the coastal city of Sittwe and towns such as Kyauktaw and Mrauk-U, while rural areas remained dark. In 2015, the central government forced an estimated 50,000 Rohingya, largely living in rural villages, to flee, continuing six generations of persecution against a people rendered stateless by a 1982 law [120]. After attacks by a Rohingya armed group in August 2017, the Myanmar military began a concerted campaign of violent ethnic cleansing, forcing 900,000 Rohingyas across the border to Bangladesh. The growth in hot spots between 2013 and 2020 on the outskirts of the city of Cox’s Bazar in Bangladesh attests to the rapid construction of what is often declared “the world’s largest refugee settlement” [121]. Meanwhile, the lack of hot spots on Myanmar’s side discloses a continued dearth of facilities or services such as electricity (Figure 8). The Myanmar Government has failed to develop this area in any meaningful way, producing bleak material conditions that can accelerate and enable racialized violence against the Rohingya [122].
A final point is that because many rural villages are “off the grid”—just two-thirds of Myanmar’s population had access to electricity in 2018 [123]—changes to these settlements are often invisible in NTL imagery (Figure 12). This data is thus severely limited in its ability to capture changes resulting from the Myanmar military’s clearance operations targeting Rohingya settlements, because most of these impoverished rural villages would never have appeared as illuminated pixels in the first place. In contrast, high-resolution optical imagery starkly illustrates the burning of villages such as Tula Toli in August 2017 (Figure 12), which has also been documented by Human Rights Watch [124]. Analyzing NTL data in concert with other types of satellite imagery and ethnography can provide a more complete picture of the geographies of development and violence, which includes both illuminated populations and those left in the dark.

4. Conclusions

Given Myanmar’s dearth of reliable official statistics and restricted research access, satellite imagery provides a compelling if incomplete resource to understand socioeconomic patterns and trajectories alongside the country’s more typically studied environmental problems. In order to enrich space-borne observations of geopolitically complex and volatile areas, we adopt a critical remote sensing lens integrating NTL analysis with qualitative studies, particularly long-term ethnography. Our mixed-methods approach generates new insights into the geopolitics of development in Myanmar from 1992 to 2020, from the local to cross-border and regional scales.
By analyzing the Harmonized DMSP-OLS data from 1992 to 2013 and the VNL V2 Annual Composites from 2013 to 2020, we identified persistent spatial inequality in lights in Myanmar. Even though ethnic majority lowland regions brightened more slowly than ethnic minority states over this nearly three-decade period, they still emitted 5.6-fold more radiance per km2 in 2020. Myanmar was also strikingly dimmer than its neighbors, although this difference slightly narrowed. In 2013, while Myanmar’s domestic borderlands were on average just 10% as bright as the 25-km-wide frontier across its borders with Bangladesh, India, China, Laos, and Thailand, by 2020, they were 17% as bright.
With higher-resolution VNL composites from 2013 to 2020, we examined hot spots of development in Myanmar’s borderlands, tracing some of the processes of international investment, resource extraction, illicit trade, and forced migration, which both produce and elude NTL data. The vast majority of hot spots were located on the foreign rather than Myanmar side of the borders. This trend was replicated at local scales, even at official border crossings such as Muse (China) and Tachileik (Thailand). In the context of Myanmar’s substantial and often illicit mining, timber, and drug production, brightening across the border points to the ways in which resources extracted from Myanmar spark accumulation and development elsewhere. At the same time, there were also hot spots at unofficial crossings, namely Mongla, where some of the most significant change in radiance within all of Myanmar’s borderlands occurred in areas controlled by the Wa Army and its allies. When historically and politically situated within a critical remote sensing approach, NTL imagery powerfully illustrates how Myanmar’s economic geography defies official policy, attesting to the complex relationships between state-sponsored and militia-led violence, extraction, and trade.
At the time of our initial research, Myanmar was moving forward with ambitious infrastructural plans and a second term for the civilian government. As of the February 2021 military coup, however, the country’s future is uncertain. If slated investments continue, NTL data may enable an evaluation of promises of economic growth without reliance on government statistics. Proposed projects that could be studied with remote sensing include road improvements from Hpa’an to the Thai border funded by the Asia Development Bank, special economic zones (SEZ) such as the China-backed Kyaukphyu Deep Sea port in Rakhine State, the Thai- and Japanese-funded Dawei SEZ and improved road to Htee Khee in Tanintharyi Region, and the expansion of the country’s largest city through the New Yangon project.
In the more immediate wake of the coup, NTL can provide rapid insights into conditions on the ground, for example by tracking the military’s alleged electricity and internet blackouts. These could be investigated using NTL data in tandem with location-based social media data (or lack thereof) to see which neighborhoods and populations are being cut off from power or communication, while recognizing the ethical sensitivity of such research [125]. NTL data can also be leveraged to measure the ongoing establishment and expansion of refugee camps, not only outside the country’s borders but also for internally displaced people in Rakhine, Kachin, and Shan States. Qualitative research into the ongoing ethnic and religious conflicts that drive displacement can inform future remote sensing analyses as part of an iterative process that, in turn, guides ethnographic fieldwork.
Our critical remote sensing approach demonstrates that NTL imagery can be analyzed in combination with fieldwork, high-resolution daytime imagery, and analysis of media reports to generate multiscalar insights into the dynamics and geopolitics of development in countries such as Myanmar, which are lacking statistical and political transparency. Plans to extend the DMSP-OLS dataset from 2012 to 2018 using recently uncovered pre-dawn nighttime data collected by the DMSP F15 satellite [126] may facilitate longer-term studies of socioeconomic activity. In Myanmar’s case, this would be especially useful for understanding how illumination changed before and during the reform period. Remote sensing can also provide quick and precise insights to urgent political questions when fieldwork is not possible, from tracking village burning associated with the Rohingya genocide [52] to the aftermath of the 2021 coup.
However, satellite imagery alone cannot offer answers to political problems. In explaining the limitations of digital tools for environmental monitoring in Myanmar, for instance, Goldstein and Faxon (2020: 16) write: “Satellite imagery can capture the expanding scale of deforestation, but cannot address the issues of who profits, who suffers, and who decides” [127]. This insight emphasizes the importance of critical remote sensing for understanding the geopolitical significance of changing pixels. Ascertaining the reasons for remotely sensed change demands knowledge built from on-the-ground experiences and relationships.
As a final note of caution, although NTL is increasingly a go-to data source for understanding socioeconomic dynamics, it often fails to capture the most marginalized populations—those who might lack access to electricity, live in small villages that do not produce much light, or which, at worst, may have been extinguished by brutal genocides. The international development sector is embracing data-driven solutions, machine learning, and algorithmic governance [128], but if the satellites observing socioeconomic development cannot perceive certain populations, they may be left out of policy solutions. The geopolitics of remote sensing thus must consider the implications of not only what satellites can see, but what they cannot see, too.

Supplementary Materials

The following are available online at https://www.mdpi.com/2072-4292/13/6/1158/s1, Figure S1. Comparison of NTL values of the Harmonized DMSP-OLS composites (1992–2013) and Simulated DMSP-OLS composites derived from VIIRS data (2013–2018) generated by Li et al. (2020) [55]. As the Simulated DMSP-OLS composites demonstrated a significant jump in the values, we chose not to use them in our analysis. Table S1. Total DMPS-OLS (in DN) by year for each administrative unit (1992–2013). Table S2. Total DMPS-OLS (in DN) by year for each administrative unit (2013–2020). Table S3. Total radiance (nW·cm−2·sr−1) in Myanmar’s domestic and foreign borderlands (2013–2020).

Author Contributions

Conceptualization; methodology; formal analysis; investigation; writing—original draft preparation; writing—review and editing; funding acquisition; M.M.B. and H.O.F. Visualization, M.M.B. All authors have read and agreed to the published version of the manuscript.

Funding

This research was funded by an International Dissertation Research Fellowship from the Social Science Research Council and by the Wenner-Gren Foundation, grant number 9594, and by the Regional Studies Association Early Career Scheme.

Institutional Review Board Statement

The study was conducted according to the guidelines of the Declaration of Helsinki, and approved by the Institutional Review Board of Cornell University (protocol code 1611006759, approved 31 January 2017).

Informed Consent Statement

Informed consent was obtained from all subjects involved in the study.

Data Availability Statement

Publicly available datasets (NTL data and geospatial boundaries from MIMU) were analyzed in this study. This data can be found as specified throughout the manuscript.

Conflicts of Interest

The authors declare no conflict of interest.

References

  1. Hu, X.; Qian, Y.; Pickett, S.T.A.; Zhou, W. Urban mapping needs up-to-date approaches to provide diverse perspectives of current urbanization: A novel attempt to map urban areas with nighttime light data. Landsc. Urban Plan. 2020, 195, 103709. [Google Scholar] [CrossRef]
  2. Zhang, Q.; Seto, K. Can night-time light data identify typologies of urbanization? A global assessment of successes and failures. Remote Sens. 2013, 5, 3476–3494. [Google Scholar] [CrossRef] [Green Version]
  3. Henderson, M.; Yeh, E.T.; Gong, P.; Elvidge, C.D.; Baugh, K. Validation of urban boundaries derived from global night-time satellite imagery. Int. J. Remote Sens. 2003, 24, 595–609. [Google Scholar] [CrossRef]
  4. Chen, X.; Nordhaus, W. A test of the new VIIRS lights data set: Population and economic output in Africa. Remote Sens. 2015, 7, 4937–4947. [Google Scholar] [CrossRef] [Green Version]
  5. Stathakis, D.; Baltas, P. Seasonal population estimates based on night-time lights. Comput. Environ. Urban Syst. 2018, 68, 133–141. [Google Scholar] [CrossRef]
  6. Min, B.; Gaba, K. Tracking electrification in Vietnam using nighttime lights. Remote Sens. 2014, 6, 9511–9529. [Google Scholar] [CrossRef] [Green Version]
  7. Falchetta, G.; Pachauri, S.; Parkinson, S.; Byers, E. A high-resolution gridded dataset to assess electrification in sub-Saharan Africa. Sci. Data 2019, 6, 1–9. [Google Scholar] [CrossRef] [PubMed] [Green Version]
  8. Dugoua, E.; Kennedy, R.; Urpelainen, J. Satellite data for the social sciences: Measuring rural electrification with night-time lights. Int. J. Remote Sens. 2018, 39, 2690–2701. [Google Scholar] [CrossRef]
  9. Bennett, M.M.; Smith, L.C. Advances in using multitemporal night-time lights satellite imagery to detect, estimate, and monitor socioeconomic dynamics. Remote Sens. Environ. 2017, 192, 176–197. [Google Scholar] [CrossRef]
  10. Ernst, M.; Jurowetzki, R. Satellite data, women defectors and black markets in North Korea: A quantitative study of the North Korean informal sector using night-time lights satellite imagery. North Korean Rev. 2016, 12, 64–83. [Google Scholar]
  11. Crespo Cuaresma, J.; Danylo, O.; Fritz, S.; Hofer, M.; Kharas, H.; Laso Bayas, J.C. What do we know about poverty in North Korea? Palgrave Commun. 2020, 6, 1–8. [Google Scholar] [CrossRef]
  12. Tanaka, K.; Keola, S. Shedding light on the shadow economy: A nighttime light approach. J. Dev. Stud. 2017, 53, 32–48. [Google Scholar] [CrossRef]
  13. Cauwels, P.; Pestalozzi, N.; Sornette, D. Dynamics and spatial distribution of global nighttime lights. EPJ Data Sci. 2014, 3, 2. [Google Scholar] [CrossRef] [Green Version]
  14. Kyba, C.C.M.; Garz, S.; Kuechly, H.; Sánchez de Miguel, A.; Zamorano, J.; Fischer, J.; Hölker, F. High-resolution imagery of earth at night: New sources, opportunities and challenges. Remote Sens. 2015, 7, 1–23. [Google Scholar] [CrossRef] [Green Version]
  15. Zhang, L.; Li, X.; Chen, F. Spatiotemporal analysis of Venezuela’s nighttime light during the socioeconomic crisis. IEEE J. Sel. Top. Appl. Earth Obs. Remote Sens. 2020, 13, 2396–2408. [Google Scholar] [CrossRef]
  16. Pinkovskiy, M.L. Growth discontinuities at borders. J. Econ. Growth 2017, 22, 145–192. [Google Scholar] [CrossRef]
  17. Coscieme, L.; Sutton, P.C.; Anderson, S.; Liu, Q.; Elvidge, C.D. Dark times: Nighttime satellite imagery as a detector of regional disparity and the geography of conflict. GISci. Remote Sens. 2017, 54, 118–139. [Google Scholar] [CrossRef]
  18. United Nations ESCAP. Inequality in Asia and the Pacific in the Era of the 2030 Agenda for Sustainable Development; ESCAP: Bangkok, Thailand, 2018. [Google Scholar]
  19. Scott, J.C. The Art of Not Being Governed; Yale University Press: London, UK, 2009; ISBN 978-0-300-15228-9. [Google Scholar]
  20. O’Morchoe, F. Teak & lead: Making borders, resources, and territory in colonial Burma. Geopolitics 2020. [Google Scholar] [CrossRef]
  21. Sadan, M. Being and Becoming Kachin: Histories Beyond the State in the Borderworlds of Burma; Oxford University Press: Oxford, UK, 2014; ISBN 9780191760341. [Google Scholar]
  22. Woods, K. Ceasefire capitalism: Military–private partnerships, resource concessions and military–state building in the Burma–China borderlands. J. Peasant Stud. 2011, 38, 747–770. [Google Scholar] [CrossRef]
  23. Woods, K. Rubber out of the ashes: Locating Chinese agribusiness investments in ‘armed sovereignties’ in the Myanmar–China borderlands. Territ. Polit. Gov. 2019, 7, 79–95. [Google Scholar] [CrossRef]
  24. Su, X. Fragmented sovereignty and the geopolitics of illicit drugs in northern Burma. Polit. Geogr. 2018, 63, 20–30. [Google Scholar] [CrossRef]
  25. Meehan, P. Fortifying or fragmenting the state? The political economy of the opium/heroin trade in Shan State, Myanmar, 1988–2013. Crit. Asian Stud. 2015, 47, 253–282. [Google Scholar] [CrossRef]
  26. Barbesgaard, M. Ocean and land control-grabbing: The political economy of landscape transformation in Northern Tanintharyi, Myanmar. J. Rural Stud. 2019, 69, 195–203. [Google Scholar] [CrossRef]
  27. Kiik, L. Inter-national conspiracy? Speculating on the Myitsone Dam controversy in China, Burma, Kachin, and a displaced village. Geopolitics 2020, 1–27. [Google Scholar] [CrossRef]
  28. Mark, S.; Overland, I.; Vakulchuk, R. Sharing the spoils: Winners and losers in the Belt and Road Initiative in Myanmar. J. Curr. Southeast Asian Aff. 2020, 39, 381–404. [Google Scholar] [CrossRef]
  29. Sarma, J.; Faxon, H.O. Remaking the resource frontier-Insights from Myanmar. Geopolitics 2021. [Google Scholar] [CrossRef]
  30. Buchanan, J.; Kramer, T.; Woods, K. Developing Disparity: Regional Investment in Burma’s Borderlands; Transnational Institute: Amsterdam, The Netherlands, 2013. [Google Scholar]
  31. Calabrese, L.; Cao, Y. Managing the Belt and Road: Agency and development in Cambodia and Myanmar. World Dev. 2020, 105297. [Google Scholar] [CrossRef]
  32. Barua, A.; Karia, R.H. Challenges faced by Rohingya refugees in the Covid-19 pandemic. Ann. Glob. Health 2020, 86, 1–3. [Google Scholar] [CrossRef]
  33. Torbick, N.; Chowdhury, D.; Salas, W.; Qi, J. Monitoring rice agriculture across Myanmar using time series Sentinel-1 assisted by Landsat-8 and PALSAR-2. Remote Sens. 2017, 9, 119. [Google Scholar] [CrossRef] [Green Version]
  34. Gumma, M.K.; Thenkabail, P.S.; Deevi, K.C.; Mohammed, I.A.; Teluguntla, P.; Oliphant, A.; Xiong, J.; Aye, T.; Whitbread, A.M. Mapping cropland fallow areas in Myanmar to scale up sustainable intensification of pulse crops in the farming system. GISci. Remote Sens. 2018, 55, 926–949. [Google Scholar] [CrossRef]
  35. Biswas, S.; Lasko, K.D.; Vadrevu, K.P. Fire disturbance in tropical forests of Myanmar-Analysis using MODIS satellite datasets. IEEE J. Sel. Top. Appl. Earth Obs. Remote Sens. 2015, 8, 2273–2281. [Google Scholar] [CrossRef]
  36. Hlaing, K.T.; Haruyama, S.; Aye, M.M. Using GIS-based distributed soil loss modeling and morphometric nalysis to prioritize watershed for soil conservation in Bago river basin of Lower Myanmar. Front. Earth Sci. China 2008, 2, 465–478. [Google Scholar] [CrossRef]
  37. Htun, N.Z.; Mizoue, N.; Yoshida, S. Classifying tropical deciduous vegetation: A comparison of multiple approaches in Popa mountain park, Myanmar. Int. J. Remote Sens. 2011, 32, 8935–8948. [Google Scholar] [CrossRef]
  38. Food and Agriculture Organization of the United Nations. Global Forest Resources Assessment; FAO: Rome, Italy, 2020. [Google Scholar]
  39. Leimgruber, P.; Kelly, D.S.; Steininger, M.K.; Brunner, J.; Müller, T.; Songer, M. Forest cover change patterns in Myanmar (Burma) 1990–2000. Environ. Conserv. 2005, 32, 356–364. [Google Scholar] [CrossRef] [Green Version]
  40. Webb, E.L.; Jachowski, N.R.A.; Phelps, J.; Friess, D.A.; Than, M.M.; Ziegler, A.D. Deforestation in the Ayeyarwady Delta and the conservation implications of an internationally-engaged Myanmar. Glob. Environ. Chang. 2014, 24, 321–333. [Google Scholar] [CrossRef]
  41. Gaw, L.Y.F.; Linkie, M.; Friess, D.A. Mangrove forest dynamics in Tanintharyi, Myanmar from 1989–2014, and the role of future economic and political developments. Singap. J. Trop. Geogr. 2018, 39, 224–243. [Google Scholar] [CrossRef]
  42. Biswas, S.; Huang, Q.; Anand, A.; Mon, M.S.; Arnold, F.-E.; Leimgruber, P. A multi sensor approach to forest type mapping for advancing monitoring of sustainable development goals (SDG) in Myanmar. Remote Sens. 2020, 12, 3220. [Google Scholar] [CrossRef]
  43. Mon, M.S.; Mizoue, N.; Htun, N.Z.; Kajisa, T.; Yoshida, S. Factors affecting deforestation and forest degradation in selectively logged production forest: A case study in Myanmar. For. Ecol. Manag. 2012, 267, 190–198. [Google Scholar] [CrossRef]
  44. Shimizu, K.; Ponce-Hernandez, R.; Ahmed, O.S.; Ota, T.; Win, Z.C.; Mizoue, N.; Yoshida, S. Using Landsat time series imagery to detect forest disturbance in selectively logged tropical forests in Myanmar. Can. J. For. Res. 2017, 47, 289–296. [Google Scholar] [CrossRef] [Green Version]
  45. Reddy, C.S.; Pasha, S.V.; Satish, K.V.; Unnikrishnan, A.; Chavan, S.B.; Jha, C.S.; Diwakar, P.G.; Dadhwal, V.K. Quantifying and predicting multi-decadal forest cover changes in Myanmar: A biodiversity hotspot under threat. Biodivers. Conserv. 2019, 28, 1129–1149. [Google Scholar] [CrossRef]
  46. Win, R.N.; Suzuki, R.; Takeda, S. Remote sensing analysis of forest damage by selection logging in the Kabaung Reserved Forest, Bago Mountains, Myanmar. J. For. Res. 2012, 17, 121–128. [Google Scholar] [CrossRef]
  47. Htun, N.Z.; Mizoue, N.; Kajisa, T.; Yoshida, S. Deforestation and forest degradation as measures of Popa Mountain Park (Myanmar) effectiveness. Environ. Conserv. 2009, 36, 218–224. [Google Scholar] [CrossRef]
  48. Sharma, P.; Thapa, R.B.; Matin, M.A. Examining forest cover change and deforestation drivers in Taunggyi District, Shan State, Myanmar. Environ. Dev. Sustain. 2020, 22, 5521–5538. [Google Scholar] [CrossRef] [Green Version]
  49. Wang, C.; Myint, S.W. Environmental concerns of deforestation in Myanmar 2001–2010. Remote Sens. 2016, 8, 728. [Google Scholar] [CrossRef] [Green Version]
  50. Tian, Y.; Wu, B.; Zhang, L.; Li, Q.; Jia, K.; Wen, M. Opium poppy monitoring with remote sensing in north Myanmar. Int. J. Drug Policy 2011, 22, 278–284. [Google Scholar] [CrossRef]
  51. Kelly, A.B.; Kelly, N.M. Validating the remotely sensed geography of crime: A review of emerging issues. Remote Sens. 2014, 6, 12723–12751. [Google Scholar] [CrossRef] [Green Version]
  52. Baker, J.C.; Williamson, R.A. Satellite imagery activism: Sharpening the focus on tropical deforestation. Singap. J. Trop. Geogr. 2006, 27, 4–14. [Google Scholar] [CrossRef]
  53. Rothe, D.; Shim, D. Sensing the ground: On the global politics of satellite-based activism. Rev. Int. Stud. 2018, 44, 414–437. [Google Scholar] [CrossRef]
  54. Marx, A.; Windisch, R.; Kim, J.S. Detecting village burnings with high-cadence smallsats: A case-study in the Rakhine State of Myanmar. Remote Sens. Appl. Soc. Environ. 2019, 14, 119–125. [Google Scholar] [CrossRef]
  55. Bremner, L. Sedimentary logics and the Rohingya refugee camps in Bangladesh. Polit. Geogr. 2020, 77, 102109. [Google Scholar] [CrossRef]
  56. Ruser, B.N.; Thomas, E. Mapping Conditions in Rakhine State; Australian Strategic Policy Institute: Canberra, Australia, 2019. [Google Scholar]
  57. Ahmed, N.; Diptu, N.A.; Shadhin, M.S.K.; Jaki, M.A.F.; Hasan, M.F.; Islam, M.N.; Rahman, R.M. Artificial neural network and machine learning based methods for population estimation of Rohingya refugees: Comparing data-driven and satellite image-driven approaches. Vietnam J. Comput. Sci. 2019, 6, 439–455. [Google Scholar] [CrossRef] [Green Version]
  58. Imtiaz, S. Ecological impact of Rohingya refugees on forest resources: Remote sensing analysis of vegetation cover change in Teknaf Peninsula in Bangladesh. Ecocycles 2018, 4, 16–19. [Google Scholar] [CrossRef] [Green Version]
  59. Rashid, K.J.; Hoque, M.A.; Esha, T.A.; Rahman, M.A.; Paul, A. Spatiotemporal changes of vegetation and land surface temperature in the refugee camps and its surrounding areas of Bangladesh after the Rohingya influx from Myanmar. Environ. Dev. Sustain. 2020. [Google Scholar] [CrossRef]
  60. Hassan, M.; Smith, A.; Walker, K.; Rahman, M.; Southworth, J. Rohingya refugee crisis and forest cover change in Teknaf, Bangladesh. Remote Sens. 2018, 10, 689. [Google Scholar] [CrossRef] [Green Version]
  61. Connette, K.J.L.J.; Connette, G.; Bernd, A.; Phyo, P.; Aung, K.H.; Tun, Y.L.; Thein, Z.M.; Horning, N.; Leimgruber, P.; Songer, M. Assessment of mining extent and expansion in Myanmar based on freely-available satellite imagery. Remote Sens. 2016, 8, 912. [Google Scholar] [CrossRef] [Green Version]
  62. Poortinga, A.; Tenneson, K.; Shapiro, A.; Nquyen, Q.; Aung, K.S.; Chishtie, F.; Saah, D. Mapping plantations in Myanmar by fusing Landsat-8, Sentinel-2 and Sentinel-1 data along with systematic error quantification. Remote Sens. 2019, 11, 831. [Google Scholar] [CrossRef] [Green Version]
  63. Nomura, K.; Mitchard, E.T.A.; Patenaude, G.; Bastide, J.; Oswald, P.; Nwe, T. Oil palm concessions in southern Myanmar consist mostly of unconverted forest. Sci. Rep. 2019, 9, 1–9. [Google Scholar] [CrossRef] [PubMed] [Green Version]
  64. Liu, X.; Feng, Z.; Jiang, L.; Li, P.; Liao, C.; Yang, Y.; You, Z. Rubber plantation and its relationship with topographical factors in the border region of China, Laos and Myanmar. J. Geogr. Sci. 2013, 23, 1019–1040. [Google Scholar] [CrossRef]
  65. Aung, T.S.; Fischer, T.B.; Buchanan, J. Land use and land cover changes along the China-Myanmar oil and gas pipelines–Monitoring infrastructure development in remote conflict-prone regions. PLoS ONE 2020, 15, e0237806. [Google Scholar] [CrossRef]
  66. Tellman, B.; Magliocca, N.R.; Turner, B.L.; Verburg, P.H. Understanding the role of illicit transactions in land-change dynamics. Nat. Sustain. 2020, 3, 175–181. [Google Scholar] [CrossRef]
  67. Puttanapong, N.; Zin, S.Z. Spatial inequality in Myanmar during 1992–2016: An application of spatial statistics and satellite data. Soc. Sci. Rev. 2018, 161–182. [Google Scholar]
  68. Callahan, M. Myanmar’s Perpetual Junta. New Left Rev. 2009, 60, 27–63. [Google Scholar]
  69. Jones, L. The political economy of Myanmar’s transition. J. Contemp. Asia 2014, 44, 144–170. [Google Scholar] [CrossRef] [Green Version]
  70. Ahmed, N.; Islam, M.N.; Hasan, M.F.; Motahar, T.; Sujauddin, M. Understanding the political ecology of forced migration and deforestation through a multi-algorithm classification approach: The case of Rohingya displacement in the southeastern border region of Bangladesh. Geol. Ecol. Landsc. 2019, 3, 282–294. [Google Scholar] [CrossRef]
  71. Bennett, M.M. Is a pixel worth 1000 words? Critical remote sensing and China’s belt and road initiative. Polit. Geogr. 2020, 78, 102127. [Google Scholar] [CrossRef]
  72. Faxon, H.O. After the rice frontier: Producing state and ethnic territory in Northwest Myanmar. Geopolitics 2021, 1–25. [Google Scholar] [CrossRef]
  73. Grundy-Warr, C. Coexistent borderlands and intra-state conflicts in mainland Southeast Asia. Singap. J. Trop. Geogr. 1993, 14, 42–57. [Google Scholar] [CrossRef]
  74. Barney, K. Laos and the making of a ‘relational’ resource frontier. Geogr. J. 2009, 175, 146–159. [Google Scholar] [CrossRef]
  75. Giersch, C.P. Across Zomia with merchants, monks, and musk: Process geographies, trade networks, and the Inner-East-Southeast Asian borderlands. J. Glob. Hist. 2010, 5, 215–239. [Google Scholar] [CrossRef]
  76. Li, X.; Zhou, Y.; Zhao, M.; Zhao, X. A harmonized global nighttime light dataset 1992–2018. Sci. Data 2020, 7, 1–9. [Google Scholar] [CrossRef]
  77. Elvidge, C.D.; Zhizhin, M.; Ghosh, T.; Hsu, F.; Taneja, J. Annual time series of global VIIRS nighttime lights derived from monthly averages: 2012 to 2019. Remote Sens. 2021, 13, 922. [Google Scholar] [CrossRef]
  78. Elvidge, C.D.; Baugh, K.; Zhizhin, M.; Hsu, F.C. Why VIIRS data are superior to DMSP for mapping nighttime lights. Proc. Asia-Pac. Adv. Netw. 2013, 62–69. [Google Scholar] [CrossRef] [Green Version]
  79. Puttilli, M. Everyday geographies in the changing city: Subjective photo-routes in Mandalay, Myanmar. GeoJournal 2020, 8. [Google Scholar] [CrossRef]
  80. Kudo, T. Border development in Myanmar: The case of the Myawaddy–Mae Sot border. In Border Economies in the Greater Mekong Sub-Region; Ishida, M., Ed.; Palgrave Macmillan UK: London, UK, 2013; pp. 186–205. [Google Scholar]
  81. Alvarez León, L.F.; Gleason, C.J. Production, property, and the construction of remotely sensed data. Ann. Am. Assoc. Geogr. 2017, 107, 1075–1089. [Google Scholar] [CrossRef]
  82. Devine, J.A.; Currit, N.; Reygadas, Y.; Liller, L.I.; Allen, G. Drug trafficking, cattle ranching and land use and land cover change in Guatemala’s Maya biosphere reserve. Land Use Policy 2020, 95, 104578. [Google Scholar] [CrossRef]
  83. Devine, J.A.; Wrathall, D.; Currit, N.; Tellman, B.; Langarica, Y.R. Narco-cattle ranching in political forests. Antipode 2020, 52, 1018–1038. [Google Scholar] [CrossRef]
  84. Kelley, L.C. The politics of uneven smallholder cacao expansion: A critical physical geography of agricultural transformation in southeast Sulawesi, Indonesia. Geoforum 2018, 97, 22–34. [Google Scholar] [CrossRef]
  85. Biermann, C.; Kelley, L.C.; Lave, R. Putting the Anthropocene into practice: Methodological implications. Ann. Am. Assoc. Geogr. 2020, 1–11. [Google Scholar] [CrossRef]
  86. Saah, D.; Johnson, G.; Ashmall, B.; Tondapu, G.; Tenneson, K.; Patterson, M.; Poortinga, A.; Markert, K.; Quyen, N.H.; San Aung, K.; et al. Collect Earth: An online tool for systematic reference data collection in land cover and use applications. Environ. Model. Softw. 2019, 118, 166–171. [Google Scholar] [CrossRef]
  87. Oak, Y.N. Even with New Data, Valuing Myanmar’s Jade Industry Remains a Challenge. Open Data: Myanmar Jade; Natural Resource Governance Institute n.d. Available online: https://openjadedata.org/Stories/how_much_jade_worth.html (accessed on 17 March 2021).
  88. Kyba, C.C.M.; Giuliani, G.; Franziskakis, F.; Tockner, K.; Lacroix, P. Artisanal and small-scale mining sites in the Democratic Republic of the Congo are not associated with nighttime light emissions. J Multidiscip. Sci. J. 2019, 2, 152–161. [Google Scholar] [CrossRef] [Green Version]
  89. Matelski, M.; Sabrié, M. Challenges and resilience in Myanmar’s urbanization: A special issue on Yangon. Moussons 2019, 11–31. [Google Scholar] [CrossRef] [Green Version]
  90. Walton, M.J. The “Wages of Burman-ness:” Ethnicity and Burman privilege in contemporary Myanmar. J. Contemp. Asia 2013, 43, 1–27. [Google Scholar] [CrossRef]
  91. Sarma, J.; Sidaway, J.D. Securing urban fontiers: A view from Yangon, Myanmar. Int. J. Urban Reg. Res. 2020, 44, 447–468. [Google Scholar] [CrossRef]
  92. Kennard, M.; Provost, C. The Lights Are on but no One’s Home in Myanmar’s Capital Naypyidaw. South China Morning Post. 4 April 2015. Available online: https://www.scmp.com/magazines/post-magazine/article/1755128/lights-are-no-ones-home-myanmars-new-capital-naypyidaw (accessed on 17 March 2021).
  93. Myanmar Ministry of Commerce. Trade Situation of Myanmar in 2012–2013 Fiscal Year to 2020–2021 Fiscal Year (October Monthly). 2021. Available online: https://www.commerce.gov.mm/en/content/ပံုုမွန္-နယ္စပ္-ပိုု႔ကုုန္-သြင္းကုုန္ (accessed on 10 January 2021).
  94. Republic of Myanmar Directorate of Investment and Company Administration. Yearly Approved Amount of Investment (By Country/Region) 2020. Available online: https://www.dica.gov.mm/sites/dica.gov.mm/files/document-files/yearly_country_11.pdf (accessed on 10 January 2021).
  95. Lwin, N. Myanmar Govt Unveils Four Projects as Part of China’s BRI Scheme. The Irrawaddy. 14 June 2020. Available online: https://www.irrawaddy.com/news/burma/myanmar-govt-unveils-four-projects-part-chinas-bri-scheme.html (accessed on 17 March 2021).
  96. Myanmar Ministry of Commerce. Border Trade Data. Available online: https://www.commerce.gov.mm/en/dobt/border-trade-data (accessed on 7 January 2021).
  97. Chang, W.-C. Beyond Borders: Stories of Yunnanese Chinese Migrants of Burma; Cornell University Press: Ithaca, NY, USA, 2016. [Google Scholar]
  98. Shortell, P. Losing Luster: Addressing Tax Evasion in Myanmar’s Jade and Gemstone Industry; Natural Resource Governance Institute: New York, NY, USA, 2019. [Google Scholar]
  99. Lintner, B. Who Are the Wa? The Irrawaddy. 2 June 2014. Available online: https://www.irrawaddy.com/news/military/wa.html (accessed on 17 March 2021).
  100. Nijman, V.; Shepherd, C.R. Emergence of Mong La on the Myanmar-China border as a global hub for the international trade in ivory and elephant parts. Biol. Conserv. 2014, 179, 17–22. [Google Scholar] [CrossRef] [Green Version]
  101. Rippa, A.; Saxer, M. Mong La: Business as usual in the China-Myanmar borderlands. Cross-Curr. East Asian Hist. Cult. Rev. 2016, 19, 240–252. [Google Scholar]
  102. Than, T. Mongla and the borderland politics of Myanmar. Asian Anthropol. 2016, 15, 152–168. [Google Scholar] [CrossRef]
  103. Fiskesjö, M. Mining, history, and the anti-state Wa: The politics of autonomy between Burma and China. J. Glob. Hist. 2010, 5, 241–264. [Google Scholar] [CrossRef]
  104. James, H. Security and sustainable development in Myanmar. Secur. Sustain. Dev. Myanmar 2006, 1–231. [Google Scholar] [CrossRef] [Green Version]
  105. United Nations Office on Drugs and Crime. Sustaining Opium Reduction in Southeast Asia: Sharing Experiences on Alternative Development and Beyond; UNODC: Washington, DC, USA, 2008. [Google Scholar]
  106. Ong, A.; Steinmüller, H. Communities of care: Public donations, development assistance, and independent philanthropy in the Wa State of Myanmar. Crit. Anthropol. 2020. [Google Scholar] [CrossRef]
  107. Inkey, M. UWSA Forcibly Relocate Mountain Dwelling Ethnic Wa to the Plains. Burma News International. 9 January 2015. Available online: https://www.bnionline.net/en/shan-herald-agency-for-news/item/18030-uwsa-forcibly-relocate-mountain-dwelling-ethnic-wa-to-the-plains.html (accessed on 17 March 2021).
  108. Heimig, C.; Schutte, P.; Franken, G.; Klein, C. Tin from Myanmar: A scenario for applying the European Union Regulation on supply chain due diligence. Commod. TopNews 2019, 61, 1–13. [Google Scholar]
  109. Gardiner, N.J.; Sykes, J.P.; Trench, A.; Robb, L.J. Tin mining in Myanmar: Production and potential. Resour. Policy 2015, 46, 219–233. [Google Scholar] [CrossRef]
  110. Lee, Y.; Slowkowski, A. Exclusive: Production Slowing Fast at Myanmar Mine that Rattled Tin Market. Reuters. 19 October 2016. Available online: https://www.reuters.com/article/us-myanmar-wa-tin-exclsuive/exclusive-production-slowing-fast-at-myanmar-mine-that-rattled-tin-market-idUSKCN12J02F (accessed on 18 March 2021).
  111. Bauer, A.; Kirk, N.; Sahla, S. Natural Resource Federalism: Considerations for Myanmar; Natural Resource Governance Institute: New York, NY, USA, 2018. [Google Scholar]
  112. Ong, A. Producing intransigence: (Mis) understanding the United Wa State Army in Myanmar. Contemp. Southeast Asia 2018, 40, 449–474. [Google Scholar] [CrossRef]
  113. May, S.Y. Migration as a Challenge for Myanmar’s Socio-Economic Development: Case Studies of Hpa-an and Mrauk-U Townships in Myanmar, Proceedings of the International Conference on Burma/Myanmar Studies, Chiang Mai, Thailand, 24–26 July 2015; University Academic Service Centre, Chiang Mai University: Chiang Mai, Thailand, 2015; pp. 1–14. [Google Scholar]
  114. Campbell, S. Border Capitalism, Disrupted; Cornell University Press: Ithaca, NY, USA, 2018. [Google Scholar]
  115. Naing, Y.Y.; Chulasai, L.; Panthamit, N. Characteristics of cross border trade in Myawaddy Township, Kayin State, Myanmar. C. J. Econ. 2010, 14, 100–122. [Google Scholar]
  116. Grundy-Warr, C.; Yin, E.W.S. Geographies of displacement: The Karenni and the Shan across the Myanmar-Thailand border. Singap. J. Trop. Geogr. 2002, 23, 93–122. [Google Scholar] [CrossRef]
  117. Mahadevan, P. Crossing the Line: Geopolitics and Criminality at the India-Myanmar Border; Global Initiative against Transnational Organized Crime: Geneva, Switzerland, 2020. [Google Scholar]
  118. Bana, N.; Yhome, K. The Road to Mekong: The India-Myanmar-Thailand Trilateral Highway Project. ORF Issue Br. 2017, 171, 1–12. [Google Scholar]
  119. Vicol, M.; Pritchard, B.; Htay, Y.Y. Rethinking the role of agriculture as a driver of social and economic transformation in Southeast Asia’s upland regions: The view from Chin State, Myanmar. Land Use Policy 2018, 72, 451–460. [Google Scholar] [CrossRef]
  120. Milton, A.; Rahman, M.; Hussain, S.; Jindal, C.; Choudhury, S.; Akter, S.; Ferdousi, S.; Mouly, T.; Hall, J.; Efird, J. Trapped in Statelessness: Rohingya refugees in Bangladesh. Int. J. Environ. Res. Public Health 2017, 14, 942. [Google Scholar] [CrossRef] [Green Version]
  121. Vince, G. The world’s largest refugee camp prepares for Covid-19. BMJ 2020, 368, 2–3. [Google Scholar] [CrossRef] [Green Version]
  122. Cheesman, N. How in Myanmar “National Races” came to surpass citizenship and exclude Rohingya. J. Contemp. Asia 2017, 47, 461–483. [Google Scholar] [CrossRef]
  123. World Bank. Access to Electricity (% of Population)-Myanmar. 2021. Available online: https://data.worldbank.org/indicator/EG.ELC.ACCS.ZS?locations=MM (accessed on 10 January 2021).
  124. Human Rights Watch. Massacre by the River: Burmese Army Crimes against Humanity in Tula Toli, 19 December 2017; ISBN 978-1-6231-35614.
  125. Jendryke, M.; Balz, T.; McClure, S.C.; Liao, M. Putting people in the picture: Combining big location-based social media data and remote sensing imagery for enhanced contextual urban information in Shanghai. Comput. Environ. Urban Syst. 2017, 62, 99–112. [Google Scholar] [CrossRef] [Green Version]
  126. Earth Observation Group. DMSP Nighttime Lights Extension. 2021. Available online: https://eogdata.mines.edu/products/dmsp/#extend (accessed on 7 March 2021).
  127. Goldstein, J.E.; Faxon, H.O. New data infrastructures for environmental monitoring in Myanmar: Is digital transparency good for governance? Environ. Plan. E Nat. Space 2020. [Google Scholar] [CrossRef]
  128. Gabor, D.; Brooks, S. The digital revolution in financial inclusion: International development in the fintech era. New Polit. Econ. 2017, 22, 423–436. [Google Scholar] [CrossRef]
Figure 1. Map of Myanmar’s first-level administrative divisions. See Section 2.1.1 and Section 2.2.2 for descriptions of borders.
Remotesensing 13 01158 g001
Figure 2. Total nighttime light (NTL) for states, regions, and the union territory (Naypyitaw) (1992–2013).
Remotesensing 13 01158 g002
Figure 3. Average radiance per km2 by type of administrative division (2013–2020).
Remotesensing 13 01158 g003
Figure 4. Yangon, Myanmar’s largest city (population 5 million in 2014), is densely urbanized. The former national capital expanded significantly during the British colonial era (1852–1948) and continues to do so today, despite the relocation of country’s administrative center to Naypyitaw in 2005. Author’s photo, March 2012.
Remotesensing 13 01158 g004
Figure 5. Change in DMSP-OLS NTL between 1992 and 2013 in Myanmar and the surrounding region in Southeast Asia.
Remotesensing 13 01158 g005
Figure 6. Tri-temporal VIIRS Night Light (VNL) composites of logged radiance in 2013 (blue), 2016 (green), and 2020 (red). Cooler colors indicate dimming since 2013, while warmer colors indicate brightening up to 2020. White pixels indicate steady levels of radiance over time.
Remotesensing 13 01158 g006
Figure 7. (a) Radiance (ln) hot spots in 2013; (b) radiance (ln) hot spots in 2020; (c) hot spots of percent change in radiance between 2013 and 2020. Myanmar’s 11 official border crossings are labeled (with maritime crossings in blue). Insets relate to the three locations inspected in Figure 8.
Remotesensing 13 01158 g007
Figure 8. (a) Tri-temporal logged VNL composite (2013–2016–2020) with international borders (pink) and roads (brown); (b) hot and cold spots of radiance change (2013–2020); (c,d) high-resolution daytime Google Earth imagery from as close as possible to 2013 and 2020.
Remotesensing 13 01158 g008
Figure 9. Chinese agribusiness investment is one factor catalyzing land conversion from swidden plots to contract-farmed corn along the road to Muse, north of Lashio. Author’s photo, June 2016.
Remotesensing 13 01158 g009
Figure 10. The Man Maw tin mine located within Wa State (inset). Source: Google Earth (Maxar Technologies), 1 March 2017.
Remotesensing 13 01158 g010
Figure 11. Myanmar vendors sell vegetables and Indian women wash laundry at the official (left) and unofficial (right) international border crossings between Myanmar and India at Tamu–Moreh. Author’s photos, December 2018.
Remotesensing 13 01158 g011
Figure 12. VNL imagery (left) shows no changes over Tula Toli (Rakhine State) before, shortly after, or 2.5 years after the burning of the Rohingya village, demonstrating the limits of NTL imagery. In contrast, high-resolution Google Earth imagery (right) does capture differences between the tree-lined village (25 March 2016), the burnt landscape two months after clearance operations (25 October 2017), and the reforested, seemingly abandoned village 2.5 years later (23 February 2020).
Remotesensing 13 01158 g012
Table 1. Rates of change in lights in Myanmar’s administrative divisions (1992–2013 and 2013–2020). Rows in light gray are regions, while the row in dark gray is the capital.
NameDivision TypeAnnual Rate of Change
in DN
(1992–2013)
Annual Rate of Change
in Radiance
(2013–2020)
nW·cm−2·sr−1/km2
(2020)
AyeyarwadyRegion8.0%16.5%0.20
BagoRegion10.0%11.7%0.31
ChinState0.4%60.7%0.01
KachinState12.9%16.9%0.05
KayahState7.7%20.6%0.13
KayinState14.6%18.5%0.09
MagwayRegion3.5%12.9%0.22
MandalayRegion9.0%16.3%1.16
MonState11.0%18.2%0.60
NaypyitawUnion territory21.3%−4.5%2.02
RakhineState5.5%29.0%0.07
SagaingRegion8.4%19.2%0.16
ShanState13.6%15.0%0.11
TanintharyiRegion8.4%22.2%0.07
YangonRegion5.8%10.8%3.87
All regions 7.6%15.6%0.85
All states 9.4%25.6%0.15
Publisher’s Note: MDPI stays neutral with regard to jurisdictional claims in published maps and institutional affiliations.

