Article

Validation of GRACE and GRACE-FO Mascon Data for the Study of Polar Motion Excitation

by
Justyna Śliwińska
1,*,
Małgorzata Wińska
2 and
Jolanta Nastula
1
1
Space Research Centre, Polish Academy of Sciences, 00-716 Warsaw, Poland
2
Faculty of Civil Engineering, Warsaw University of Technology, 00-637 Warsaw, Poland
*
Author to whom correspondence should be addressed.
Remote Sens. 2021, 13(6), 1152; https://doi.org/10.3390/rs13061152
Submission received: 19 January 2021 / Revised: 8 March 2021 / Accepted: 16 March 2021 / Published: 17 March 2021
(This article belongs to the Special Issue Geodesy for Gravity and Height Systems)

Abstract

:
In this study, we calculate the hydrological plus cryospheric excitation of polar motion (hydrological plus cryospheric angular momentum, HAM/CAM) using mascon solutions based on observations from the Gravity Recovery and Climate Experiment (GRACE) and GRACE Follow-On (GRACE-FO) missions. We compare and evaluate HAM/CAM computed from GRACE and GRACE-FO mascon data provided by the Jet Propulsion Laboratory (JPL), the Center for Space Research (CSR), and the Goddard Space Flight Center (GSFC). A comparison with HAM obtained from the Land Surface Discharge Model is also provided. An analysis of HAM/CAM and HAM is performed for overall variability, trends, and seasonal and non-seasonal variations. The HAM/CAM and HAM estimates are validated using the geodetic residual time series (GAO), which is an estimation of the hydrological plus cryospheric signal in geodetically observed polar motion excitation. In general, all mascon datasets are found to be equally suitable for the determination of overall, seasonal, and non-seasonal HAM/CAM oscillations, but some differences in trends remain. The use of an ellipsoidal correction, implemented in the newest solution from CSR, does not noticeably affect the consistency between HAM/CAM and GAO. Analysis of the data from the first two years of the GRACE-FO mission indicates that the current accuracy of HAM/CAM from GRACE-FO mascon data meets expectations, and the root mean square deviation of HAM/CAM components are between 5 and 6 milliarcseconds. The findings from this study can be helpful in assessing the role of satellite gravimetry in polar motion studies and may contribute towards future improvements to GRACE-FO data processing.

1. Introduction

The Gravity Recovery and Climate Experiment (GRACE) mission, jointly managed by the American National Aeronautics and Space Administration (NASA) and the German Aerospace Center (Deutsches Zentrum für Luft- und Raumfahrt; DLR), was operational between 2002 and 2017 [1,2,3,4]. GRACE was launched to provide continuous and high-quality observations of the temporal gravity field variations caused by mass changes of the atmosphere, oceans, hydrosphere, and cryosphere around the world. The mission concept was based on a constellation of twin satellites placed in the same low Earth orbit (about 500 km above the Earth surface), spaced approximately 220 km from each other. The payload of the GRACE mission allowed precise measurement of the variations of distance between two satellites, which reflected the Earth’s gravity field changes. The unquestionable success of the mission, which terminated in 2017, contributed to the development of another mission based on the same concept, GRACE Follow-On (GRACE-FO) [5,6], which began its measurements in May 2018 and continues to the present. The currently operating GRACE-FO mission, in addition to the microwave K-band ranging system (KBR) previously used on GRACE satellites, is testing the laser ranging interferometer (LRI), a new instrument for inter-satellite ranging.
The gravity field changes induced by global mass variations can be expressed as changes of the thickness of a hypothetical layer of water placed near the Earth’s surface. This water layer is usually called equivalent water thickness (EWT) or terrestrial water storage (TWS). The TWS variations processed from GRACE/GRACE-FO measurements are denoted as Level-3 data and can be determined in two ways. The first involves the use of spherical harmonic (SH) coefficients of geopotential (Level-2 data) to obtain TWS anomalies in regular latitude–longitude grids. In the second method, TWS anomalies are determined directly from measurements of changes in distance between satellites and acceleration using mass concentration (mascon) functions and provided in equal-area blocks called mascons [7,8]. In contrast to Level-2 products, some corrections and additional procedures are included in Level-3 datasets for better representation of TWS, e.g., removing signals from glacial isostatic adjustment (GIA), including degree-1 coefficients that are not measured by GRACE/GRACE-FO or correcting degree-2 zonal coefficients using data from satellite laser ranging (SLR). It should be noted that SH-based TWS distributions face some limitations resulting from the constellation of GRACE/GRACE-FO satellites, causing vertical stripes on the TWS maps and requiring data filtering [9]. The stripes are not visible for the TWS derived from mascons [8]. However, this not means that mascon solutions are free of such errors. The absence of vertical stripes in mascon data is caused by the fact that a priori constraints help to filter out noise from the GRACE observations at the Level-2 processing step, which is a more rigorous approach than the empirical post-processing filtering applied to TWS grids derived from SH coefficients. The GRACE/GRACE-FO Level-3 datasets are widely exploited to determine mass changes around the world for applications including monitoring variations in water resources [10,11,12,13,14], quantifying ice mass loss in polar regions [15,16], flood and drought analysis and detection [17,18,19], and analysis of groundwater storage changes [20,21,22,23,24,25,26].
The GRACE/GRACE-FO data are provided by various institutes, including the three official data centers at the Jet Propulsion Laboratory (JPL) in Pasadena, CA, USA; the Center for Space Research (CSR) in Austin, TX, USA; and the German Research Centre for Geosciences (GeoForschungsZentrum, GFZ) in Potsdam, Germany. Although all these data centers use the same GRACE/GRACE-FO observations, they exploit different solution strategies, input parameters, and background models, causing differences in the resulting solutions.
In geodesy, a key application of GRACE/GRACE-FO measurements is to determine and explain variations in polar motion (PM) resulting from changes in global mass redistribution [27,28]. GRACE/GRACE-FO datasets are particularly useful in assessing the role of continental water, snow, and ice, because of the removal of the atmosphere and ocean contribution from gravity fields using atmosphere and ocean de-aliasing (AOD) data [29]. This is particularly important because the role of atmosphere and ocean in PM excitation has been well established in previous research [27,30,31,32,33,34,35]; however, the impact of the land hydrosphere and cryosphere is still far from being fully understood. Therefore, gravimetric data from GRACE/GRACE-FO provide a great opportunity to assess the role of the land hydrosphere and cryosphere in PM [34,36,37,38,39,40,41,42,43,44,45,46,47,48,49].
The excitations of PM due to continental hydrosphere and cryosphere are usually analyzed together, since it is not easy to separate the cryospheric and hydrological signals [50]. Such impacts are described by two equatorial components (χ1, χ2) of hydrological plus cryospheric angular momentum (HAM/CAM). GRACE/GRACE-FO-based HAM/CAM can be obtained either from degree-2 order-1 coefficients of geopotential (ΔC21, ΔS21) or from the TWS distribution [42]. However, HAM/CAM obtained from the first method also includes other signals in addition to the hydrological and cryospheric ones, such as the barystatic sea-level variations due to influx of water from the continents into the ocean, post-glacial rebound, and tectonic signals resulting from large earthquakes. Moreover, this method preserves some residual ocean signals arising from not removing the entire ocean mass by AOD data and from ocean model errors [42]. In contrast, HAM/CAM determined using TWS data (GRACE/GRACE-FO Level-3 data) reflects only the effects of land water, snow, and ice as the area of the ocean is usually masked. In addition, signals from post-glacial rebound are always modelled and removed. Comparisons of HAM/CAM determined from Level-2 and Level-3 GRACE data have been provided in previous research (e.g., [42,47]).
Compared with TWS based on SH, TWS derived from mascon datasets has several advantages, such as better separation of land and ocean signals or no filtering required, and thus should be more appropriate for HAM/CAM determination. However, although many studies have used GRACE mascon datasets to study water and ice mass changes around the world (e.g., [11,51,52,53,54,55]), to date, there were only few studies that have used mascon solution to analyze the PM changes due to the land hydrosphere and cryosphere. The example work is [47], where HAM/CAM obtained from mascon-based TWS was compared to HAM/CAM computed from SH-based TWS, and HAM/CAM calculated using ΔC21, ΔS21 coefficients of geopotential. It was concluded that the use of mascon data provides the highest consistency between HAM/CAM and geodetic observations of PM excitation. However, only one mascon solution was tested in the mentioned study, while several solutions of this type are available. Therefore, in this paper, we determine HAM/CAM series from several available GRACE/GRACE-FO mascon solutions and analyze their variability. We also assess the quality of determined HAM/CAM and HAM by comparing them with the hydrological plus cryospheric signal in observed PM excitation (GAO), obtained from geodetic measurements and geophysical models. This could help decide which of the available mascon solutions is the most suitable for the study of PM excitation. Mascon-based HAM/CAM are also contrasted with HAM derived from the Land Surface Discharge Model (LSDM), a hydrological model that has demonstrated the highest consistency with GAO among the models tested to date [42,46]. The analyses are performed for the overall HAM/CAM series without considering specific oscillations, but also after decomposing them into trends and seasonal and non-seasonal variations. The mascon-based HAM/CAM series from the GRACE-FO mission are also considered, which may give a preliminary assessment of the accuracy of the new mission.

2. Data and Methods

2.1. GRACE and GRACE-FO Mascon Data

In this paper, we use the newest mascon data provided by JPL, CSR, and the NASA Goddard Space Flight Center (GSFC). Recently, the CSR team has released the new CSR RL06M v02 solution which, in contrast to other solutions, defines mascons on an ellipsoid. Therefore, for CSR, we consider both the newest (CSR RL06M v02) and the previous solution (CSR RL06M v01). Basic information about mascon solutions used in this study, together with corrections included, data sources, and references, are given in Table 1.
In the JPL RL06M v02 solution (abbreviated here as JPL), TWS anomalies were computed for each equal-area 3° × 3° spherical cap mascon block [8,56]. In the final dataset, the TWS variations are sampled to 0.5° × 0.5° longitude–latitude grids; however, it should be noted that the real resolution of JPL RL06M v02 is 3° and thus land-grid-scaling factors provided by JPL have to be used to undo the data smoothing resulting from the use of 3° mascons as the basis. Compared with the previous version (JPL RL05M), JPL RL06M v02 data have improved separation of land and ocean mascons, provided through the use of a Coastline Resolution Improvement (CRI) filter, which reduces leakage errors across coastlines [56]. The processing teams at JPL offer mascon solutions with and without the CRI filter applied. In the current study, we use JPL mascon data with the CRI filter applied.
In CSR RL06M v01 (abbreviated here as CSR v01), TWS anomalies are given in 0.25° × 0.25° longitude–latitude grids, but they represent the equal-area grids of size 1° [57]. However, it should be remembered that the neighboring grids are designed to be correlated with each other. In contrast to the previous CSR RL05M release, CSR RL06M solution uses a newly defined grid in which the hexagonal tiles that span the coastline are split into two (ocean and land tiles) to minimize the leakage between land and ocean signals. Because the CSR data are based on smaller mascons than those in the JPL solution and separate mascons into ocean and land along the coastlines, there is no need to apply scaling factors in this case.
The recently released CSR RL06M v02 solution (abbreviated here as CSR v02) has been processed similarly to CSR RL06M v01. There are only two differences between these releases. First, in contrast to the CSR RL06 v01 solution, CSR RL06 v02 mascon grids have been corrected for representation on ellipsoidal Earth according to methodology shown in [58]. This correction was applied separately for land and ocean areas to prevent any leakage of the land signal into the ocean [59]. Second, while computing GRACE-FO mascons in the new CSR solution, the ΔC30 coefficient was replaced with a more accurate estimate from SLR. All other processing steps remain unchanged.
Table 1. Basic information for the mascon solutions used in this study.
JPL RL06M v02CSR RL06M v01CSR RL06M v02GSFC v02.4
Abbreviation used in this studyJPLCSR v01CSR v02GSFC
Mean (static) gravity fieldGGM05CGGM05CGGM05CGOCO-05S
3rd bodies ephemeridesDE 430DE 430DE 430DE430
AOD modelsECMWF (atmosphere) + MPIOM (ocean)ECMWF (atmosphere) + MPIOM (ocean)ECMWF (atmosphere) + MPIOM (ocean)ECMWF (atmosphere) + MOG2D (ocean)
Ocean tidesGOT4.8 + SCEQ (Self-Consistent Equilibrium) modelGOT4.8 + SCEQ (Self-Consistent Equilibrium) modelGOT4.8 + SCEQ (Self-Consistent Equilibrium) modelGOT4.7 + SCEQ (Self-Consistent Equilibrium) model
Solid Earth and pole tidesIERS2010IERS2010IERS2010IERS2010
ΔC20 replacement from SLRTN11 [60]TN11 [61]TN14 [62]TN07 [63]
ΔC30 replacement from SLRTN14 [62]; for GRACE-FO only
Geocenter (degree-1 coefficients) correctionTN-13a [64]TN-13a [64]TN-13a [64][65]
GIA correctionICE6G-D model [66]ICE6G-D model [66]ICE6G-D model [66]ICE6G model [67] or A Geruo model [68]; in this study, we used ICE6G model
Correction for representation on ellipsoidal Earth[58]
Number and shape of mascons estimated4551 circle cells40 962 (40 950 hexagons and 12 pentagons)40 962 (40 950 hexagons and 12 pentagons)41,168 squares
Time span for GRACEApril 2002 – June 2017April 2002 – June 2017April 2002 – June 2017January 2003 – July 2016
Data for GRACE-FOYesNoYesNo
Reference[8][57][57][53]
Data sourcehttps://podaac-tools.jpl.nasa.gov/drive/files/GeodeticsGravity/tellus/L3/mascon (accessed on 1 July 2020)http://www2.csr.utexas.edu/grace (accessed on 1 July 2020)http://www2.csr.utexas.edu/grace (accessed on 1 July 2020)https://earth.gsfc.nasa.gov/geo/data/grace-mascons (accessed on 1 July 2020)
In the GSFC v02.4 solution (abbreviated here as GSFC), TWS anomalies were computed in each 1° × 1° equal-area square mascon [53]. In contrast to the mascon solutions from JPL and CSR, TWS variations are not sampled to the regular longitude–latitude grids. Another difference is that the regional constraints were applied using seven different regions (Greenland Ice Sheet with elevation above 2000 m, Greenland Ice Sheet with elevation below 2000 m, Antarctic Ice Sheet with elevation above 2000 m, Antarctic Ice Sheet with elevation below 2000 m, Gulf of Alaska glacier area, land, and ocean) to define each mascon according to its geographical category. As a result, mascons defined for a specific region do not overlap with any other area. Metadata for the defined basins are provided in the mascon data files and allow the user to select a region of interest. There is no need to apply scaling factors to the data.
The goal of this study is to determine the equatorial components (χ1, χ2) of HAM/CAM from the distribution of TWS provided by GRACE/GRACE-FO mascon solutions. To do so, we use a well-known formula [30,69]:
χ 1 = 1.0966 R e 2 C A Δ q φ , λ , t sin φ cos φ cos λ dS ,
χ 2 = 1.0966 R e 2 C A Δ q φ , λ , t sin φ cos φ sin λ dS ,
where C and A are Earth’s principal moments of inertia with C − A = 2.6398∙1035 kg m2 and C = 8.0103∙1037 kg m2 [70]; R e 2 is the square of the Earth’s mean radius; Δ q   is a change in TWS; φ , λ , and t are latitude, longitude, and time, respectively; and dS is the surface area. The factor 1.0966 reflects the yielding of the solid Earth to rotational deformation, surface load, and core–mantle decoupling [69].
It should be kept in mind that non-tidal atmospheric and ocean signals are mostly removed from all GRACE data products by using the AOD dataset [29]. However, there is always a residual signal above the ocean areas, which may be related to errors in ocean model used to determine AOD or leakage between land and ocean [71]. One method of separating the land signal from the residual ocean signal is to place a mask above the ocean area, and this is done in our study.

2.2. Land Surface Discharge Model (LSDM)

In this study, we also consider HAM series obtained from the LSDM provided by GFZ (ftp://esmdata.gfz-potsdam.de/EAM, accessed on 1 July 2020). LSDM is a hydrological model, elaborated in a regular 0.5° × 0.5° global latitude–longitude grid and with a daily time resolution [72]. LSDM provides global variations of water mass storage and water mass fluxes, and the HAM time series. The LSDM was processed consistently with the ECMWF (European Center for Medium-Range Weather Forecasts) [73] and MPIOM (Max Planck Institute Ocean Model) [74] models, which were also used in the GRACE/GRACE-FO AOD data product, therefore the mass balance is maintained when analyzing the results of LSDM, ECMWF and MPIOM. No sophisticated ice model is applied in LSDM, so it may not be possible to determine a reliable cryospheric angular momentum (CAM) series. However, LSDM includes the annual snow accumulation and melting in glaciated regions, which guarantees that the main part of the seasonal cycle over ice-sheets is captured. Nevertheless, the long-term ice mass is kept constant [72]. In contrast, total mass changes over polar ice sheets and mountain glaciers are measured by GRACE/GRACE-FO. Therefore, further in the paper, we use “HAM/CAM” for excitation series determined from GRACE/GRACE-FO solutions, and “HAM” from series taken from the LSDM. The LSDM also contains shallow groundwater layer that is not present in many other hydrological models.
In order to make a comparison of HAM from the hydrological model with HAM/CAM from GRACE and with GAO more reliable, the sea-level angular momentum (SLAM) should be considered [75]. SLAM reflects barystatic sea level changes resulting from the inflow of water from land into the oceans that may affect HAM. Considering SLAM is important to maintain the mass balance between the atmosphere, ocean, and land hydrosphere. The scientists from GFZ provide atmospheric angular momentum (AAM), oceanic angular momentum (OAM), HAM, and SLAM series, which were processed consistently in order to keep the global mass balance. Maintaining the mass balance means that the total mass in the atmosphere, oceans, and continental hydrosphere is constant at any given time. It was recommended by GFZ to add SLAM to HAM in order to obtain higher agreement with geodetic observations of PM. However, it has been found that considering the mass balance is of particular importance in the case of seasonal variations in length-of-day, while the impact on PM is smaller [75]. Nevertheless, in this study, we consider only the sum of HAM and SLAM (HAM+SLAM). The time series of χ1 and χ2 components of both HAM and SLAM, which are consistent with each other, are provided by GFZ (available at ftp://esmdata.gfz-potsdam.de/EAM, accessed on 1 July 2020) and used in this study.

2.3. Hydrological Plus Cryospheric Signal in Observed PM Excitation

The HAM/CAM series, determined from monthly GRACE/GRACE-FO gravity field estimates, and HAM series obtained from hydrological model LSDM, are evaluated here by comparison with the hydrological plus cryospheric signal in observed (or geodetic) PM excitation. The geodetic excitation, expressed as geodetic angular momentum (GAM), can be computed from measured variations in pole coordinates (x, y). The precise observations of (x, y) are provided by space geodesy techniques, such as SLR, VLBI (very long baseline interferometry), and GNSS (global navigation satellite systems). Pole coordinates, together with other Earth orientation parameters (EOP), namely length-of day and precession and nutation, are made available by the International Earth Rotation and Reference Systems Service (IERS) (https://www.iers.org/IERS/EN/Home/home_node.html, accessed on 1 March 2020). The calculation of (χ1, χ2) equatorial components of GAM from (x, y) pole coordinates can be performed using the algorithms shown in [69,76]. The resulting GAM series reflect PM variations due to all external effects, including those from land hydrosphere, cryosphere, atmosphere, and oceans.
In order to separate the hydrological and cryospheric signals from GAM, as needed for assessment of HAM/CAM and HAM, one should remove the impact of atmospheric pressure and winds (described by AAM), and ocean bottom pressure and currents (OAM). Usually, AAM and OAM are determined from geophysical models of the atmosphere and ocean. The resulting series are described as geodetic residuals, GAM−AAM−OAM or simply GAO. The choice of AAM and OAM models should not affect phases of GAO, but may have some influence on the amplitudes [42]. Details on GAO computation can be found in previous research (e.g., [42,46]).
The GAO series reflects mainly the impact of the land hydrosphere and cryosphere on PM excitation; however, similar to HAM/CAM from GRACE/GRACE-FO, they also contain effects from SLAM and tectonic events. In addition, signals from post-glacial rebound, which are modeled and removed in GRACE/GRACE-FO Level-3 data, remain in GAO. Nevertheless, the effects from post-glacial rebound mainly affect the trend in GAO and can be eliminated using a GIA model that applies a readjustment in response to the last deglaciation and current changes in ice mass [67,68].
To determine GAO, we use the time series of (x, y) coordinates of the pole, obtained from EOP 14 C04 combined solution [77], provided by the IERS (https://www.iers.org/IERS/EN/DataProducts/EarthOrientationData/eop.html, accessed on 1 March 2020). The (x, y) coordinates are used for computation of (χ1, χ2) components of GAM, according to the algorithm shown at http://hpiers.obspm.fr/eop-pc/index.php?index=excitactive&lang=en (data accessed on 1 March 2020). For AAM and OAM, we used ESMGFZ (Earth System Model GFZ) datasets, made available by GFZ (http://rz-vm115.gfz-potsdam.de:8080/repository, accessed on 1 March 2020). The ESMGFZ data provide time series of the χ1 and χ2 components of AAM and OAM (both mass and motion terms). AAM is based on the ECMWF model [73], while OAM is based on MPIOM [74]. These models were selected because they were used by the GRACE/GRACE-FO team to process the AOD data product, which is essential to remove atmospheric and oceanic non-tidal contributions from GRACE/GRACE-FO gravity fields. HAM from LSDM is also consistent with AAM from ECMWF and OAM from MPIOM (the mass balance is maintained).

2.4. Time Series Processing

It should be noted that GAM and HAM based on LSDM model are given at daily intervals, AAM and OAM are given at 3-hour intervals, while GRACE/GRACE-FO datasets are monthly. Therefore, some short-period signals present in GAM, OAM, AAM, and HAM are not included in GRACE/GRACE-FO estimates of HAM/CAM, which certainly affects the objective comparison of the time series. For this reason, we apply a Gaussian filter to the series to remove oscillations with periods shorter than one month. Our analyses are divided into those performed for the period of GRACE mission activity (between January 2003 and July 2016, because data for GSFC is not available before and after this period, Section 3.1) and analyses for the first two years of GRACE-FO operation (between June 2018 and July 2020, Section 3.2).
For the GRACE period, we analyze the following oscillations: Trends, overall detrended time series (without separating specific oscillations, but with trends removed), seasonal variations, and non-seasonal variations. In previous works, the seasonal oscillations in PM excitation have been of particular interest [27,28,73], because they are one of the strongest in PM. Trends and seasonal oscillations are computed together by fitting a seasonal model to the series using the least-squares method. This model consists of a first-degree polynomial (trend) and a sum of three sinusoids with the periods of 1 year (annual oscillation), 1/2 year (semiannual oscillation), and 1/3 year (terannual oscillation). The trend and seasonal fluctuations are then separated from each other and analyzed independently. Non-seasonal oscillations are obtained here after removing trends and seasonal oscillations from the overall time series. For the period of GRACE-FO activity, we consider only the overall detrended time series because of the short length of data (2 years).
To examine the amplitude distribution for different spectral bands, we use amplitude spectra of the complex-valued components of χ1 + iχ2, which is a common method used in PM studies [41,46,56,78].
The motion of the Earth’s pole is two-dimensional and is usually described by its coordinates (x, y) given in the terrestrial reference frame, while PM excitation is described by (χ1, χ2) components. Both (x, y) and (χ1, χ2) are expressed in a Cartesian plane coordinate system. However, it is known that the motion of the pole is a combination of two circular movements, namely prograde, which is a circular motion in a counter-clockwise direction, and retrograde, which is a circular motion in a clockwise direction [79,80,81]. The sum of prograde and retrograde terms gives an elliptic motion. The motion of the pole, P(t), can therefore be described by its amplitude and phase of prograde and retrograde components as follows [70]:
P t = A p e i α p   e i σ t t 0 + A r e i α r   e i σ t t 0 ,
where A is amplitude of oscillation, α is a phase of oscillation, σ is frequency of the motion, t0 is reference date, subscript p denotes prograde, and subscript r denotes retrograde. However, such representation is useful only for specific frequency, like, for example, annual (with frequency of 1 cycle per year), semiannual (with frequency of 2 cycles per year), or terannual (with frequency of 3 cycles per year). It is common in the study of PM excitation that the seasonal elliptical wave is represented as a combination of prograde and retrograde circular motion rather than equatorial χ1 and χ2 components related to the Earth-fixed system. Prograde and retrograde terms of seasonal variations are usually represented by their amplitudes and phases separately for annual, semiannual, and terannual oscillations [27,28,41,43,45,46,48,49,73]. Such amplitudes and phases are often shown as vectors plotted on phasor diagrams. Interpreting phasor diagrams is much easier than interpreting time series plots, which in the case of seasonal oscillations have the form of sinusoids. In phasor diagram, the length of a vector reflects a magnitude of amplitude, and the vector direction represents a phase, facilitating the simultaneous comparison of several seasonal series.
To interpret visually seasonal variations, apart from time series of equatorial components (χ1 and χ2) of seasonal oscillation which is the sum of annual, semiannual, and terannual variation, we also use phasor diagrams which display the amplitudes and phases of seasonal oscillation separately for prograde annual, retrograde annual, prograde semiannual, and retrograde semiannual terms. Such analysis is consistent with the approach taken in previous PM excitation research [27,28,41,43,45,46,48,49,73].
Finally, a detailed evaluation of each oscillation is performed based on comparison of HAM/CAM (or HAM) with GAO. The quality of HAM/CAM and HAM data is assessed by analysis of the following parameters: Error of standard deviation (STDerr), correlation coefficient (Corr) between HAM/CAM (or HAM) and GAO, percent of variance of GAO explained by HAM/CAM (or HAM) (relative explained variance, Varexp), and root mean square deviation (RMSD). To statistically analyze the significance of Corr values and the significance of the differences between them, we compute the critical value of Corr and the standard error of the difference between the two Corr values for assumed confidence level (see details in [40]).
STDerr is obtained here from the following equation:
STDerr = STD HAM / CAM STD GAO / STD GAO · 100 % .
The most favorable value of this parameter is 0%. The positive values indicate higher STD for HAM/CAM (or HAM) series than for GAO, whereas negative values indicate the opposite situation.
Varexp is computed using the following formula:
Var exp = Var GAO Var GAO HAM / CAM / Var GAO · 100 % ,
and the most favorable value is equal to 100%.
The centered RMSD is calculated according to the equation [82]:
RMSD = 1 N n = 1 N f n   f ¯ r n   r ¯ 2 1 / 2 ,
where f n and r n are modeled (HAM/CAM or HAM) and referenced (GAO) time series, respectively, and f ¯ and r ¯ are their mean values, respectively. The most favorable value of RMSD is 0.

3. Results

3.1. HAM/CAM Estimates from GRACE Mascon Data Provided by Different Data Centers

3.1.1. Trends

We begin with a comparison of trends in GAO, GRACE-based HAM/CAM, and LSDM-based HAM (Table 2). The signals from GIA are eliminated in all considered GRACE datasets and are also not present in LSDM; however, they remain in GAO. Therefore, for consistency of all trends, we remove the effect from post-glacial rebound from GAO trends using the ICE6G-D model described in [66]. Note that GAO trends with GIA signal retained are also reported for completeness; however, for objective comparison with HAM/CAM and HAM, only GAO trends with GIA removed should be considered.
Naturally, the removal of the GIA signal leads to higher consistency between GAO trends and HAM/CAM or HAM trends (Table 2). The GIA assumption has a higher influence on the χ2 trend than on the χ1 trend. This is as expected, because signals from post-glacial rebound mainly affect continental areas of the Northern Hemisphere [83], especially Fennoscandia and the northern part of North America, which also contribute more to the χ2 variability than the χ1 variability. This has been previously shown in many papers concerning HAM/CAM analysis (e.g., [41,42,45,46,48,49]). All these studies concluded that χ2 is more sensitive to mass changes over land areas, while χ1 is more responsible to the variations over oceans and the Greenland Ice Sheet. Moreover, it has been shown that HAM/CAM is correspondingly better correlated with GAO for χ2 than for χ1, and χ2 is characterized by higher variability than χ1 [39,42,46].
Table 2 shows that among all GRACE-derived HAM/CAM estimates, the series based on the GSFC solution have visibly smaller trends in both χ1 and χ2 than GAO and other HAM/CAM series. The trend difference between HAM/CAM from GSFC and HAM/CAM from other GRACE data centers may result from the use of different GIA models; CSR and JPL applied ICE6G-D [66], whereas GSFC used the previous version of this model, ICE6G [67]. However, it should be kept in mind that the GIA models are not perfect and some residual GIA errors are still anticipated. To test the influence of the GIA model on trends in χ1 and χ2, we computed χ1 and χ2 trends due to GIA signal for both ICE6G and ICE6G-D models, and the differences between them (Table 3). It can be seen that the differences between GIA models do not explain entirely the differences in χ1, χ2 trends observed for GSFC and other GRACE solutions. Thus, there are other factors influencing the trends in HAM/CAM. We suppose that the discrepancies in the determination of ice mass variations and their rates by various GRACE datasets may have some contribution to the trend difference in HAM/CAM.
Among all HAM/CAM series, the most consistent trends with GAO are provided by JPL (for χ1) and CSR v02 (for χ2). However, for χ2, the trends provided by JPL, CSR v01, and CSR v02 are quite similar. All these solutions use the same GIA model, and some small differences in trends may result from different native resolution or different sizes of mascons. It is also clear that a correction due to ellipsoidal Earth, which is applied in CSR v02 data increases the HAM/CAM trend compared with trends obtained for CSR v01, especially in χ1. For HAM from LSDM, a trend in χ1 is the lowest of all the considered series. This is probably because the LSDM does not contain signals from glaciated regions, especially Greenland, which is considered to noticeably contribute to the change in χ1. In recent years, an intensification of Greenland ice mass loss has been observed [15,16], which certainly has an impact on trends in PM excitation; however, this is not observed in LSDM-based HAM. In contrast, for χ2, the LSDM-based HAM trend is the most consistent with the trend observed for GAO. The finding that the χ2 trend is better determined by hydrological model than the χ1 trend is expected; however, it is quite surprising that the consistency in χ2 trends is better for LSDM than for GRACE. Groundwater storage, which has more long-lasting variability than other TWS components [84], should have bigger impact on χ2 trends than factors such as more rapidly changing soil moisture or water in biomass. However, while GRACE and GAO can reflect the whole contribution of groundwater, the LSDM models only a shallow layer of groundwater of a limited storage capacity [72].

3.1.2. Overall Detrended Time Series

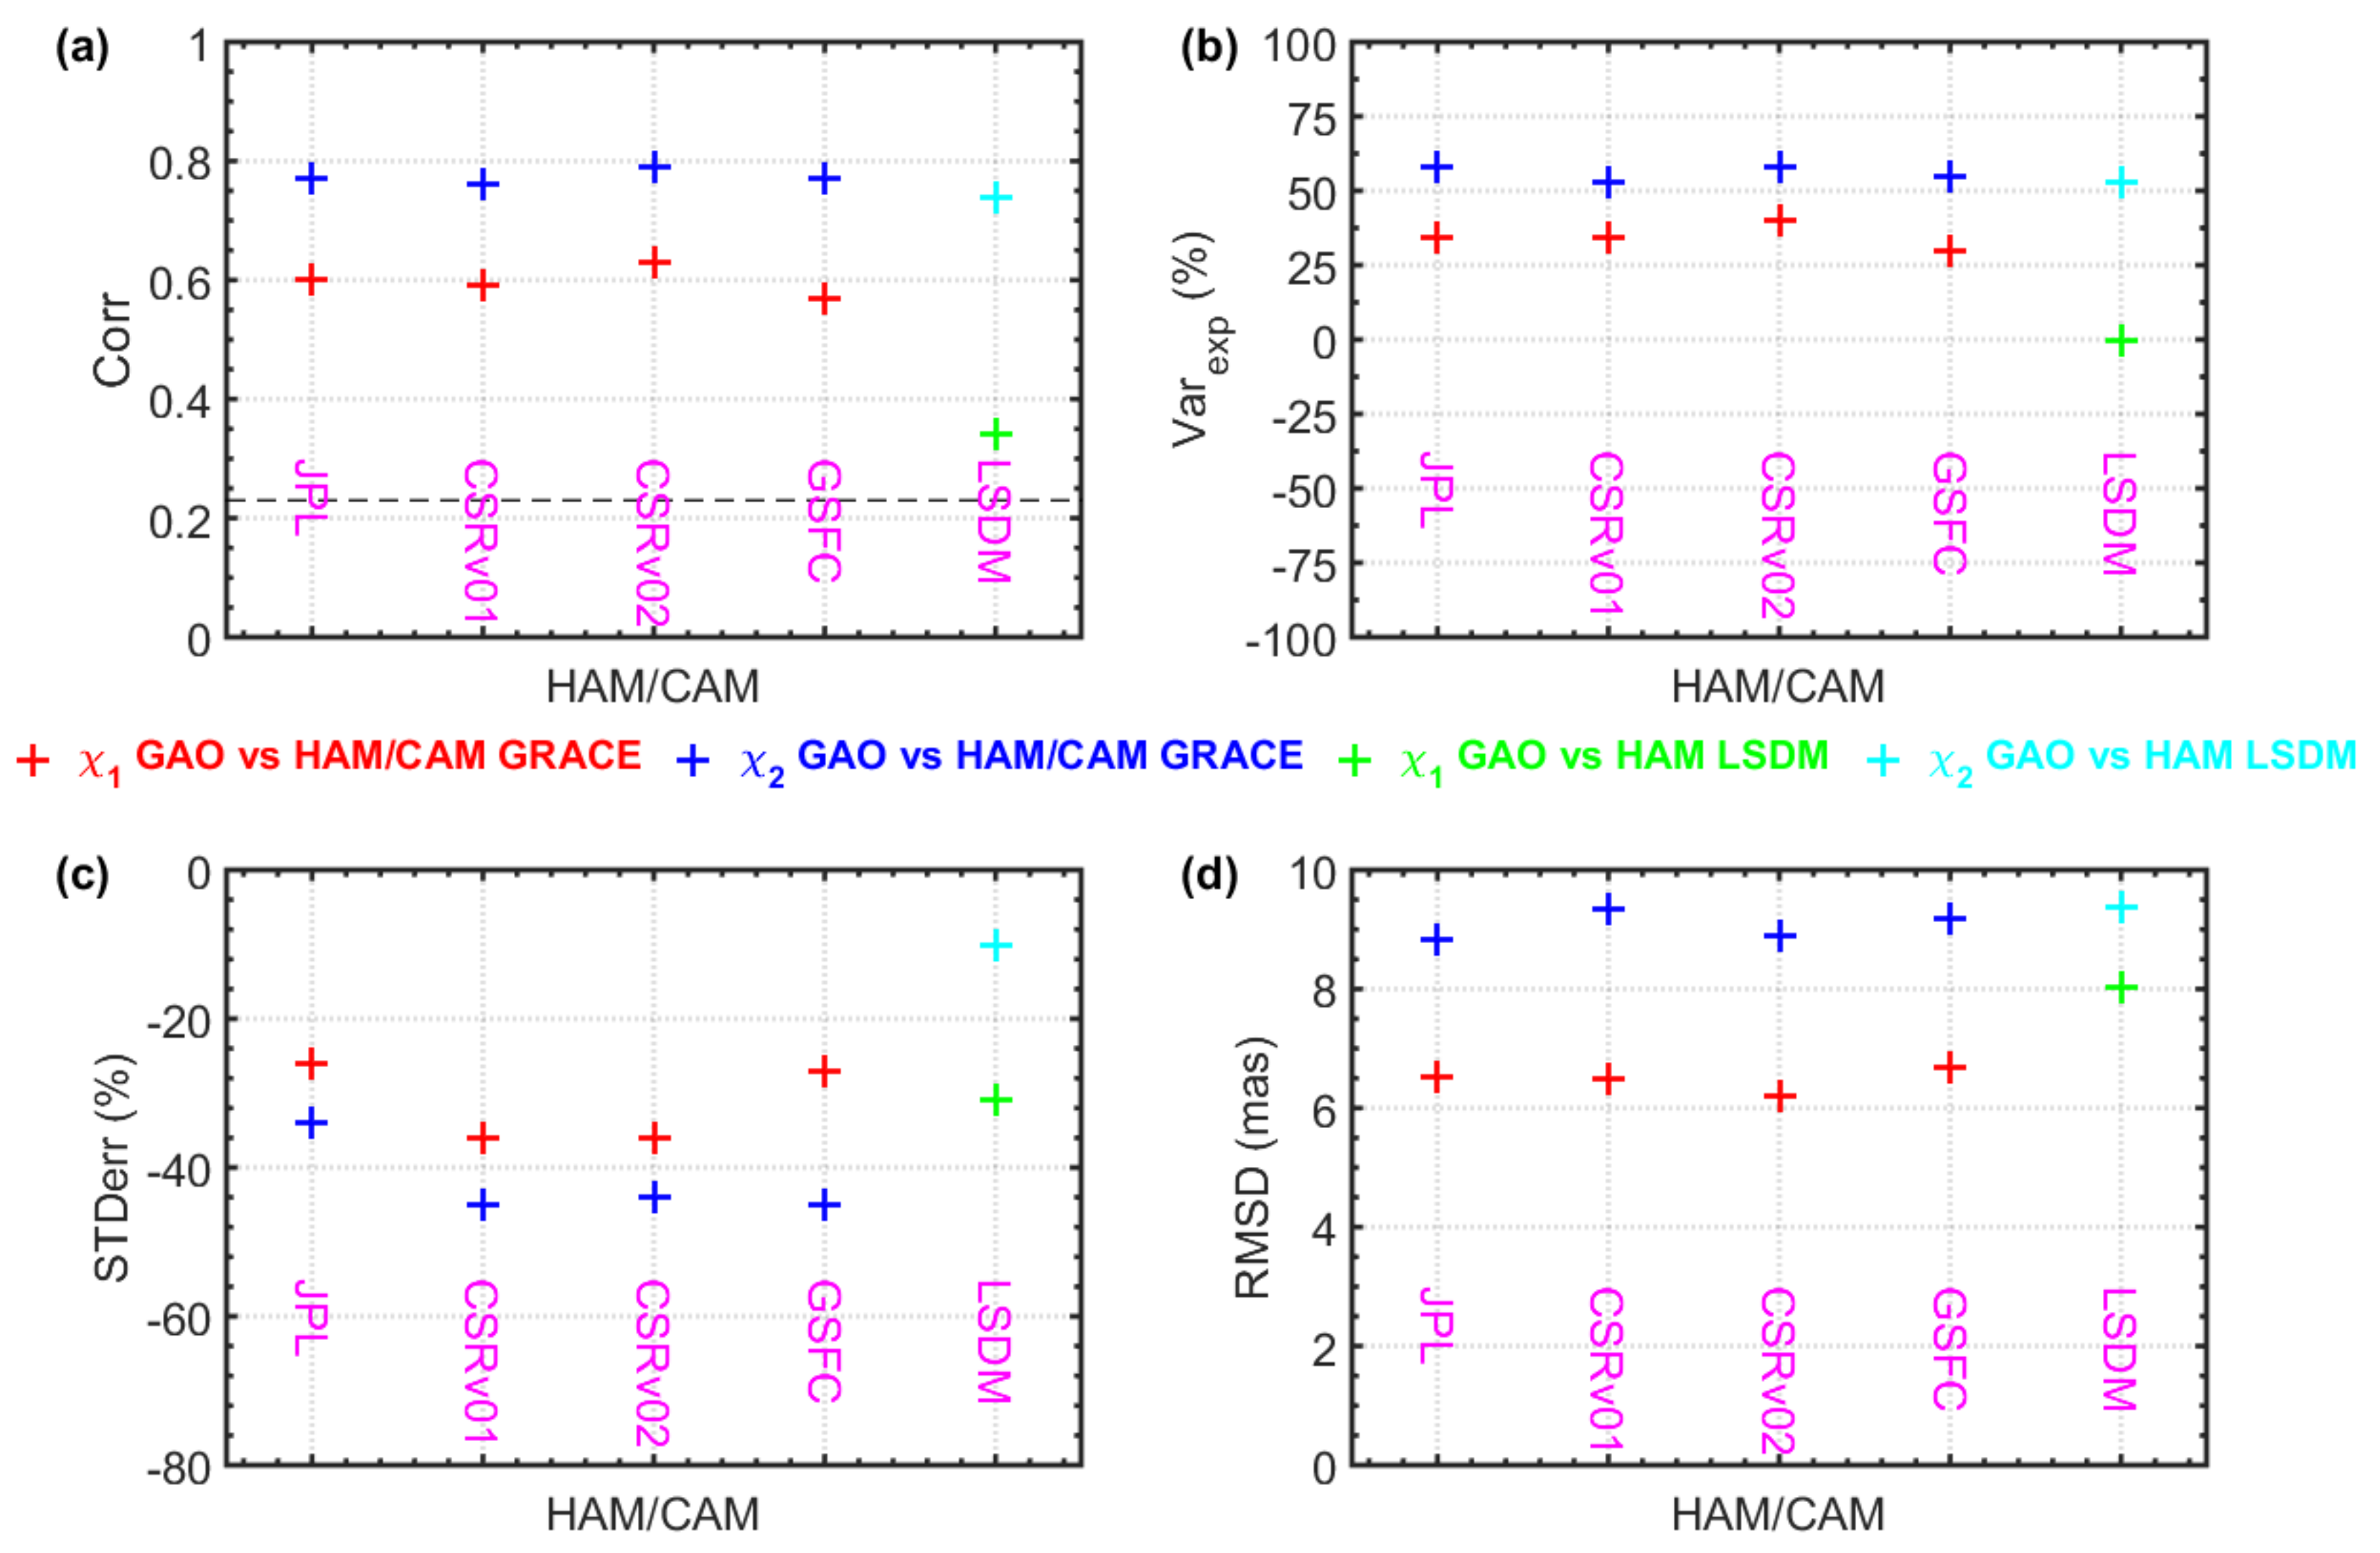
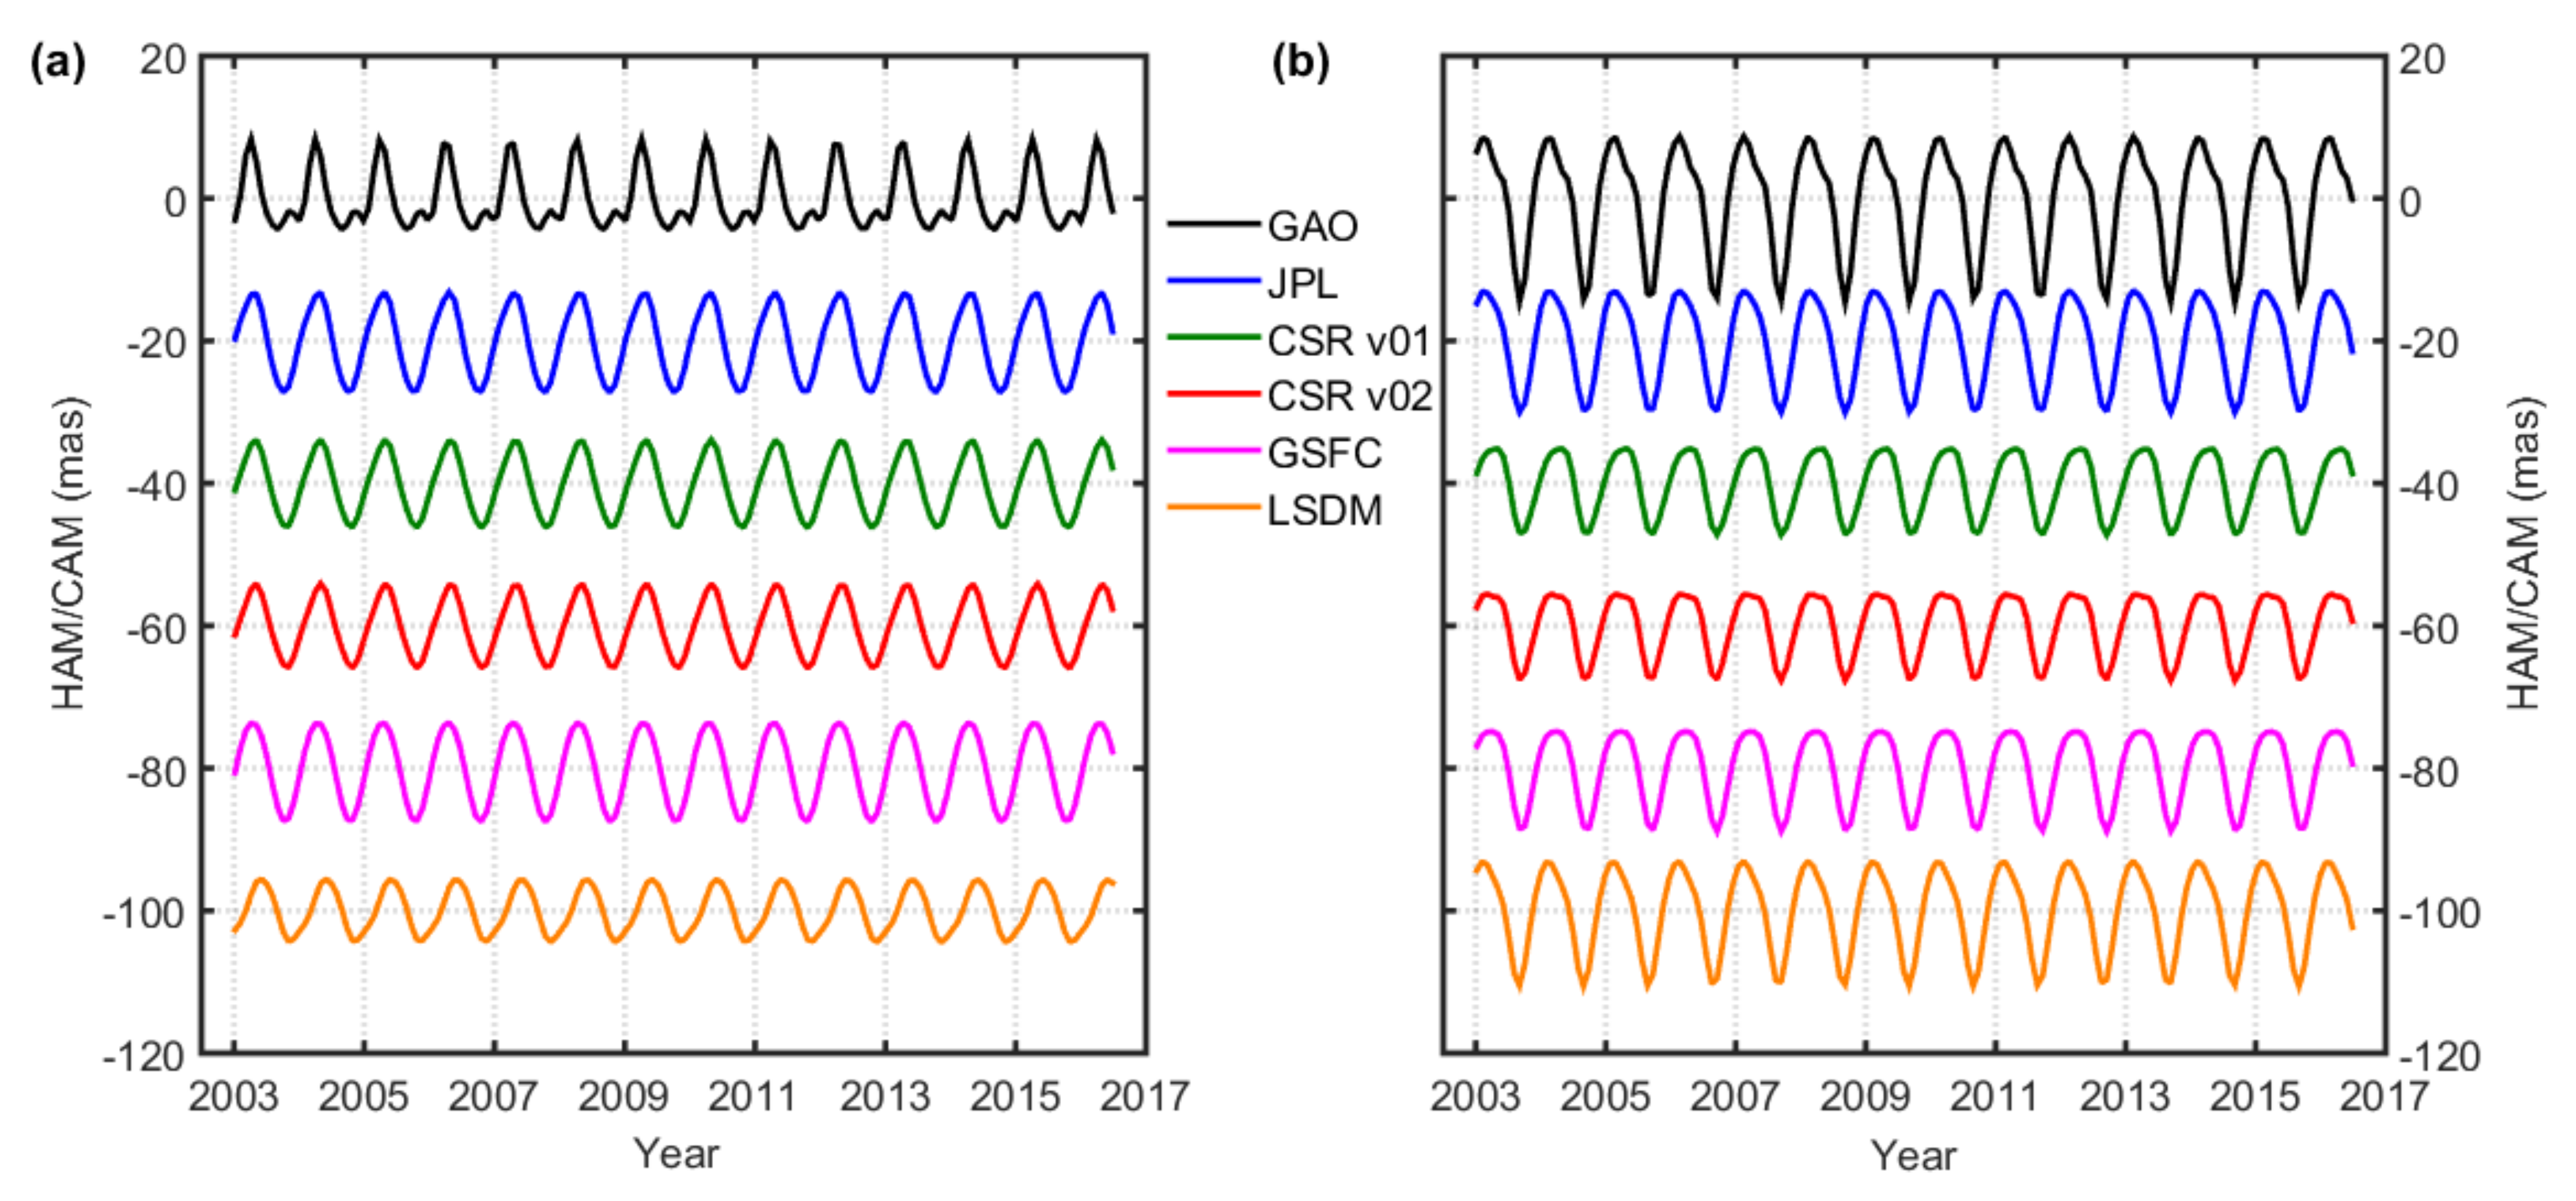
We now describe the overall variability of GAO, GRACE-based HAM/CAM, and LSDM-based HAM by showing their detrended time series (Figure 1) and validate them using STDerr, Corr, Varexp, and RMSD (Figure 2). The different HAM/CAM estimates and HAM agree well with each other in terms of amplitudes and phases, as shown by the similar parameter values shown in Figure 2. There is a common disturbance in χ1 in 2009 and 2011, and in χ2 in the period 2011–2013. Notably, for the χ2, we observe an oscillation across the course of a few years, with the minimum around late 2007 and the maximum around 2011 (Figure 1). Given this time scale, this oscillation might be related to groundwater variation. The authors of [85] showed that groundwater variations affect mainly interannual TWS variability, so it should indirectly influence HAM/CAM as well. Other authors [86,87] pointed out that the climate changes affect long-term groundwater loss, which can contribute to the change in polar motion. The few-year change in HAM/CAM might also be related to a variation in continental water distribution due to different precipitation patterns, as the trend in continental water distribution between 2007-2013 was different than in other years [46]. A similar 4–5-year oscillation is also visible for χ1, but is not as apparent. This variation has also been reported in our previous research [45,46].
There is quite good phase consistency between HAM/CAM or HAM with GAO, but they slightly underestimate GAO amplitudes, as indicated by the negative values of STDerr (Figure 2). The LSDM-based HAM reveals the highest STD consistency with GAO for χ2 (STDerr of around 10%). This shows that LSDM can successfully model the water storage variability over land. For χ1, LSDM provides a similar level of STDerr as that obtained for the GRACE solutions.
The HAM/CAM data from the CSR v02 solution provide the highest consistency with GAO for χ1 (Corr = 0.63, Varexp = 40% and RMSD = 6.21 mas), while HAM from LSDM is shown to be the least compatible with GAO for this component (Corr = 0.34, Varexp = 0% and RMSD = 8.02 mas). However, for χ2, all HAM/CAM and HAM results present a similar level of consistency with GAO (Corr ranges between 0.71 and 0.79, Varexp ranges between 53% and 58%, and RMSD ranges between 8.83 and 9.37 mas). It should be noted that the differences in Corr obtained for particular HAM/CAM and HAM are lower than errors of Corr determination, therefore, from statistical point of view, all series are correlated with GAO at the same level. Only LSDM-based HAM is distinguished by a lower Corr, but only for χ1. Overall, at this stage, it is difficult to choose which of the four mascon solutions is the most appropriate for analyzing the overall PM excitation induced by land hydrosphere and cryosphere as they present similar results.
The amplitude spectra of the series are dominated by annual oscillation, which is stronger for the retrograde term (Figure 3). Figure 3 also indicates that the GAO series have clearly stronger semiannual and terannual oscillations compared with other series. This is also apparent from visual inspection of Figure 1.

3.1.3. Seasonal Variations

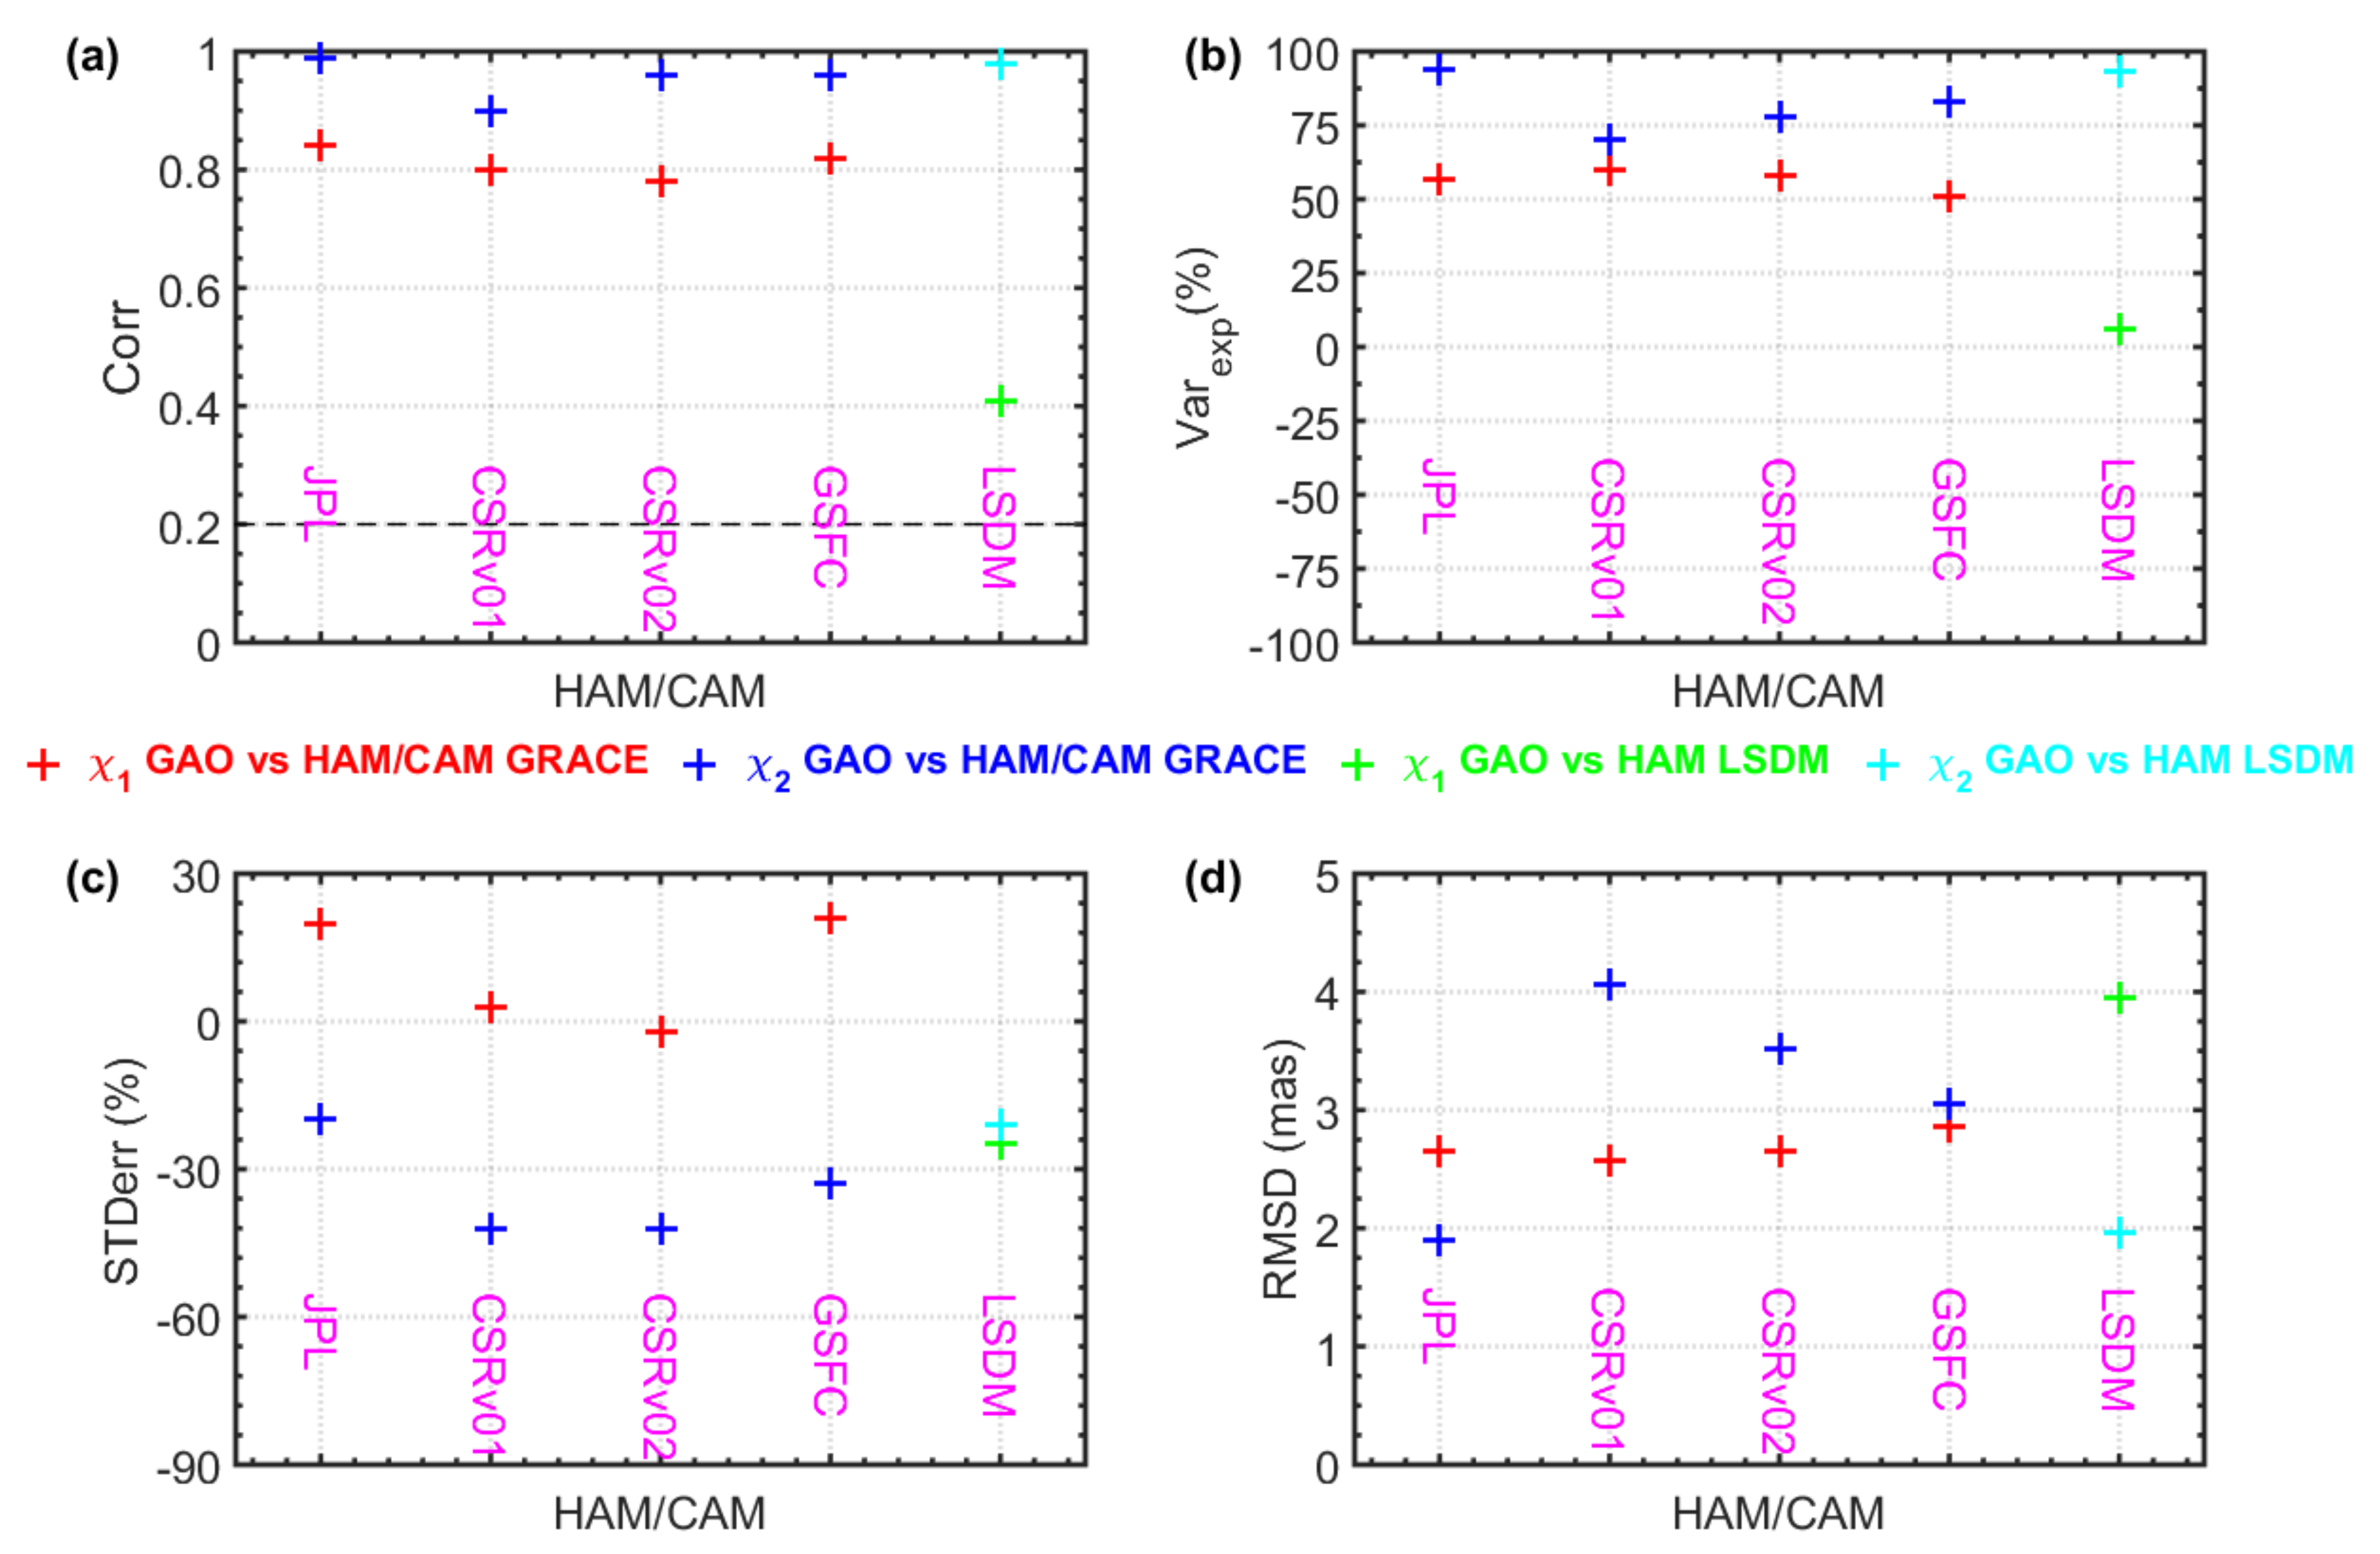
We now focus on analysis of seasonal oscillations visible in the spectra (Figure 3) of the abovementioned series. To present these oscillations, we show time series plots (Figure 4), which are supplemented with STDerr, Corr, Varexp, and RMSD diagrams (Figure 5). A comparison of the time series indicates a good phase consistency between HAM/CAM and GAO and between HAM and GAO (Figure 4) as indicated by high values of Corr (Figure 5). Some phase shift relative to other time series is apparent only for LSDM-based HAM in χ1, which is supported by the lower Corr value. For χ1, HAM also exhibits the lowest amplitude of all series, probably because some of the ice mass is excluded in LSDM, and is reflected by the most negative STDerr.
The parameters plotted in Figure 5 indicate that for seasonal variation in χ1, all mascon solutions provide a similar level of consistency with GAO, as they are characterized by congruous values of Corr (0.78–0.84), Varexp (51%–60%), and RMSD (2.58–2.66 mas). For χ2, however, HAM/CAM from the JPL solution has the highest consistency with GAO (Corr = 0.99, Varexp = 94%, RMSD = 1.90 mas). Nevertheless, the Corr values in χ2 are statistically similar for all the series, because a maximum difference between two Corr values is lower than standard error of the difference between the two correlation coefficients.
It is worth noting that ellipsoidal correction, which is included in the CSR v02 solution, but is not applied in the previous CSR v01 release, increases seasonal consistency between HAM/CAM and GAO in χ2, but slightly deteriorates results for χ1. However, for Corr, this difference is below statistical significance (a difference in Corr for CSR v01 and CSR v02 is lower than the standard error of the difference between the two correlation coefficients).
In addition, LSDM-based HAM provides high consistency with GAO for χ2, which indicates that the LSDM can reasonably model the seasonal rainfall and soil moisture fluctuations that contribute to the seasonal variability of TWS and the resulting seasonal HAM/CAM variations. This might also indicate that the variations in deep groundwater, which are not modeled in LSDM, do not have a noticeable impact on seasonal HAM/CAM variation. This might be true, because changes in groundwater storage are more long-lasting than seasonal changes in soil water and precipitation. Nevertheless, no strong agreement was found between HAM and GAO in χ1 because LSDM does not include the entire cryosphere.
More detailed information on amplitude and phase consistency among seasonal series are provided as phasor diagrams (Figure 6), which are plotted separately for annual and semiannual variations. Terannual oscillations are not considered in detail as it has been shown that their amplitudes are small compared with the annual and semiannual oscillations (Figure 3). The annual variation dominates in the seasonal spectral band, which is mainly caused by the annual variability of precipitation and the resulting seasonality of soil moisture and snow cover changes (Figure 6). For annual variation, the retrograde term is characterized by higher amplitudes than the prograde term, as reported in previous research [40,45,46] and is observed in amplitude spectra (Figure 3). For the annual retrograde oscillation, a higher consistency between GAO, HAM/CAM, and HAM is also observed. Of all GRACE-based HAM/CAM, the series obtained from JPL solution are most consistent with GAO in terms of amplitudes and phases for both prograde and retrograde annual variation. For semiannual oscillation, although HAM/CAM vectors remain quite consistent with each other, they are not in high agreement with the GAO indices. In particular, they visibly underestimate semiannual GAO amplitudes in the prograde term, while in the retrograde term they provide phases that are different than those of GAO. It is worth noting that LSDM enables a good amplitude consistency with GAO for annual retrograde (Figure 6b) and semiannual retrograde (Figure 6d) terms as the vectors are of similar length. Moreover, HAM based on LSDM is in the highest phase consistency with GAO for semiannual prograde term (Figure 6c). Nevertheless, the amplitude agreement for semiannual prograde oscillation is poor.

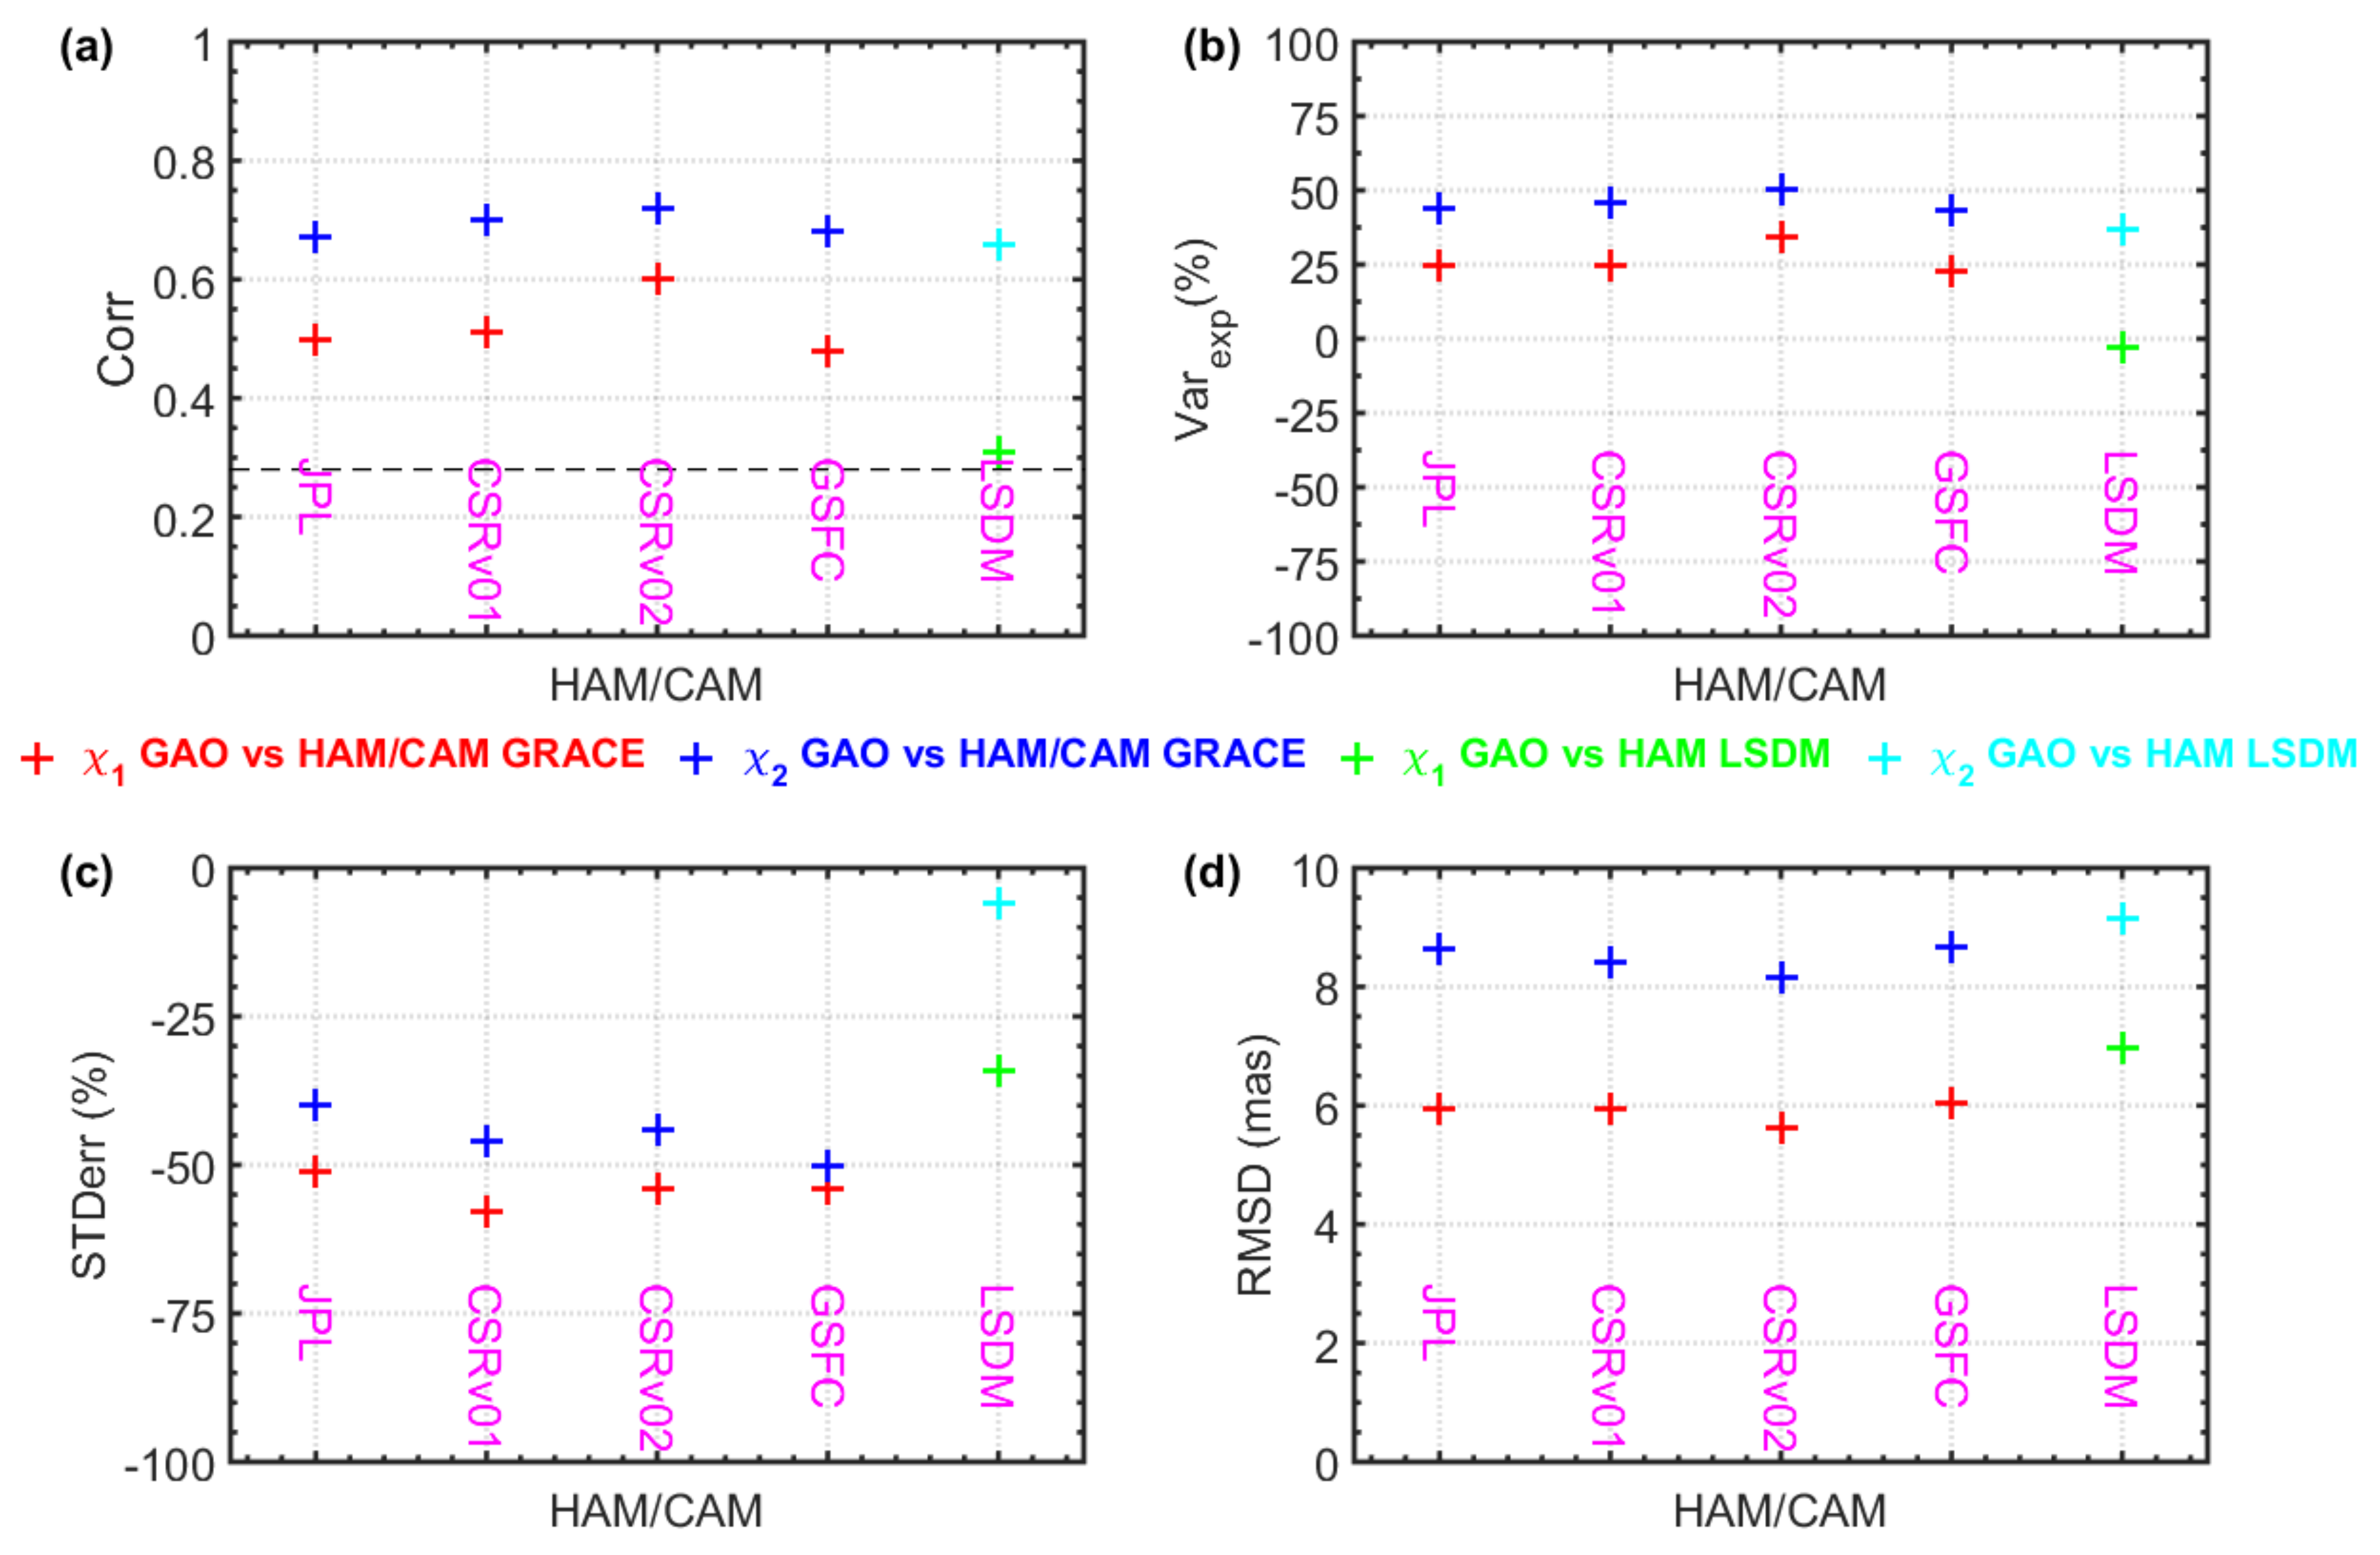
3.1.4. Non-Seasonal Variations

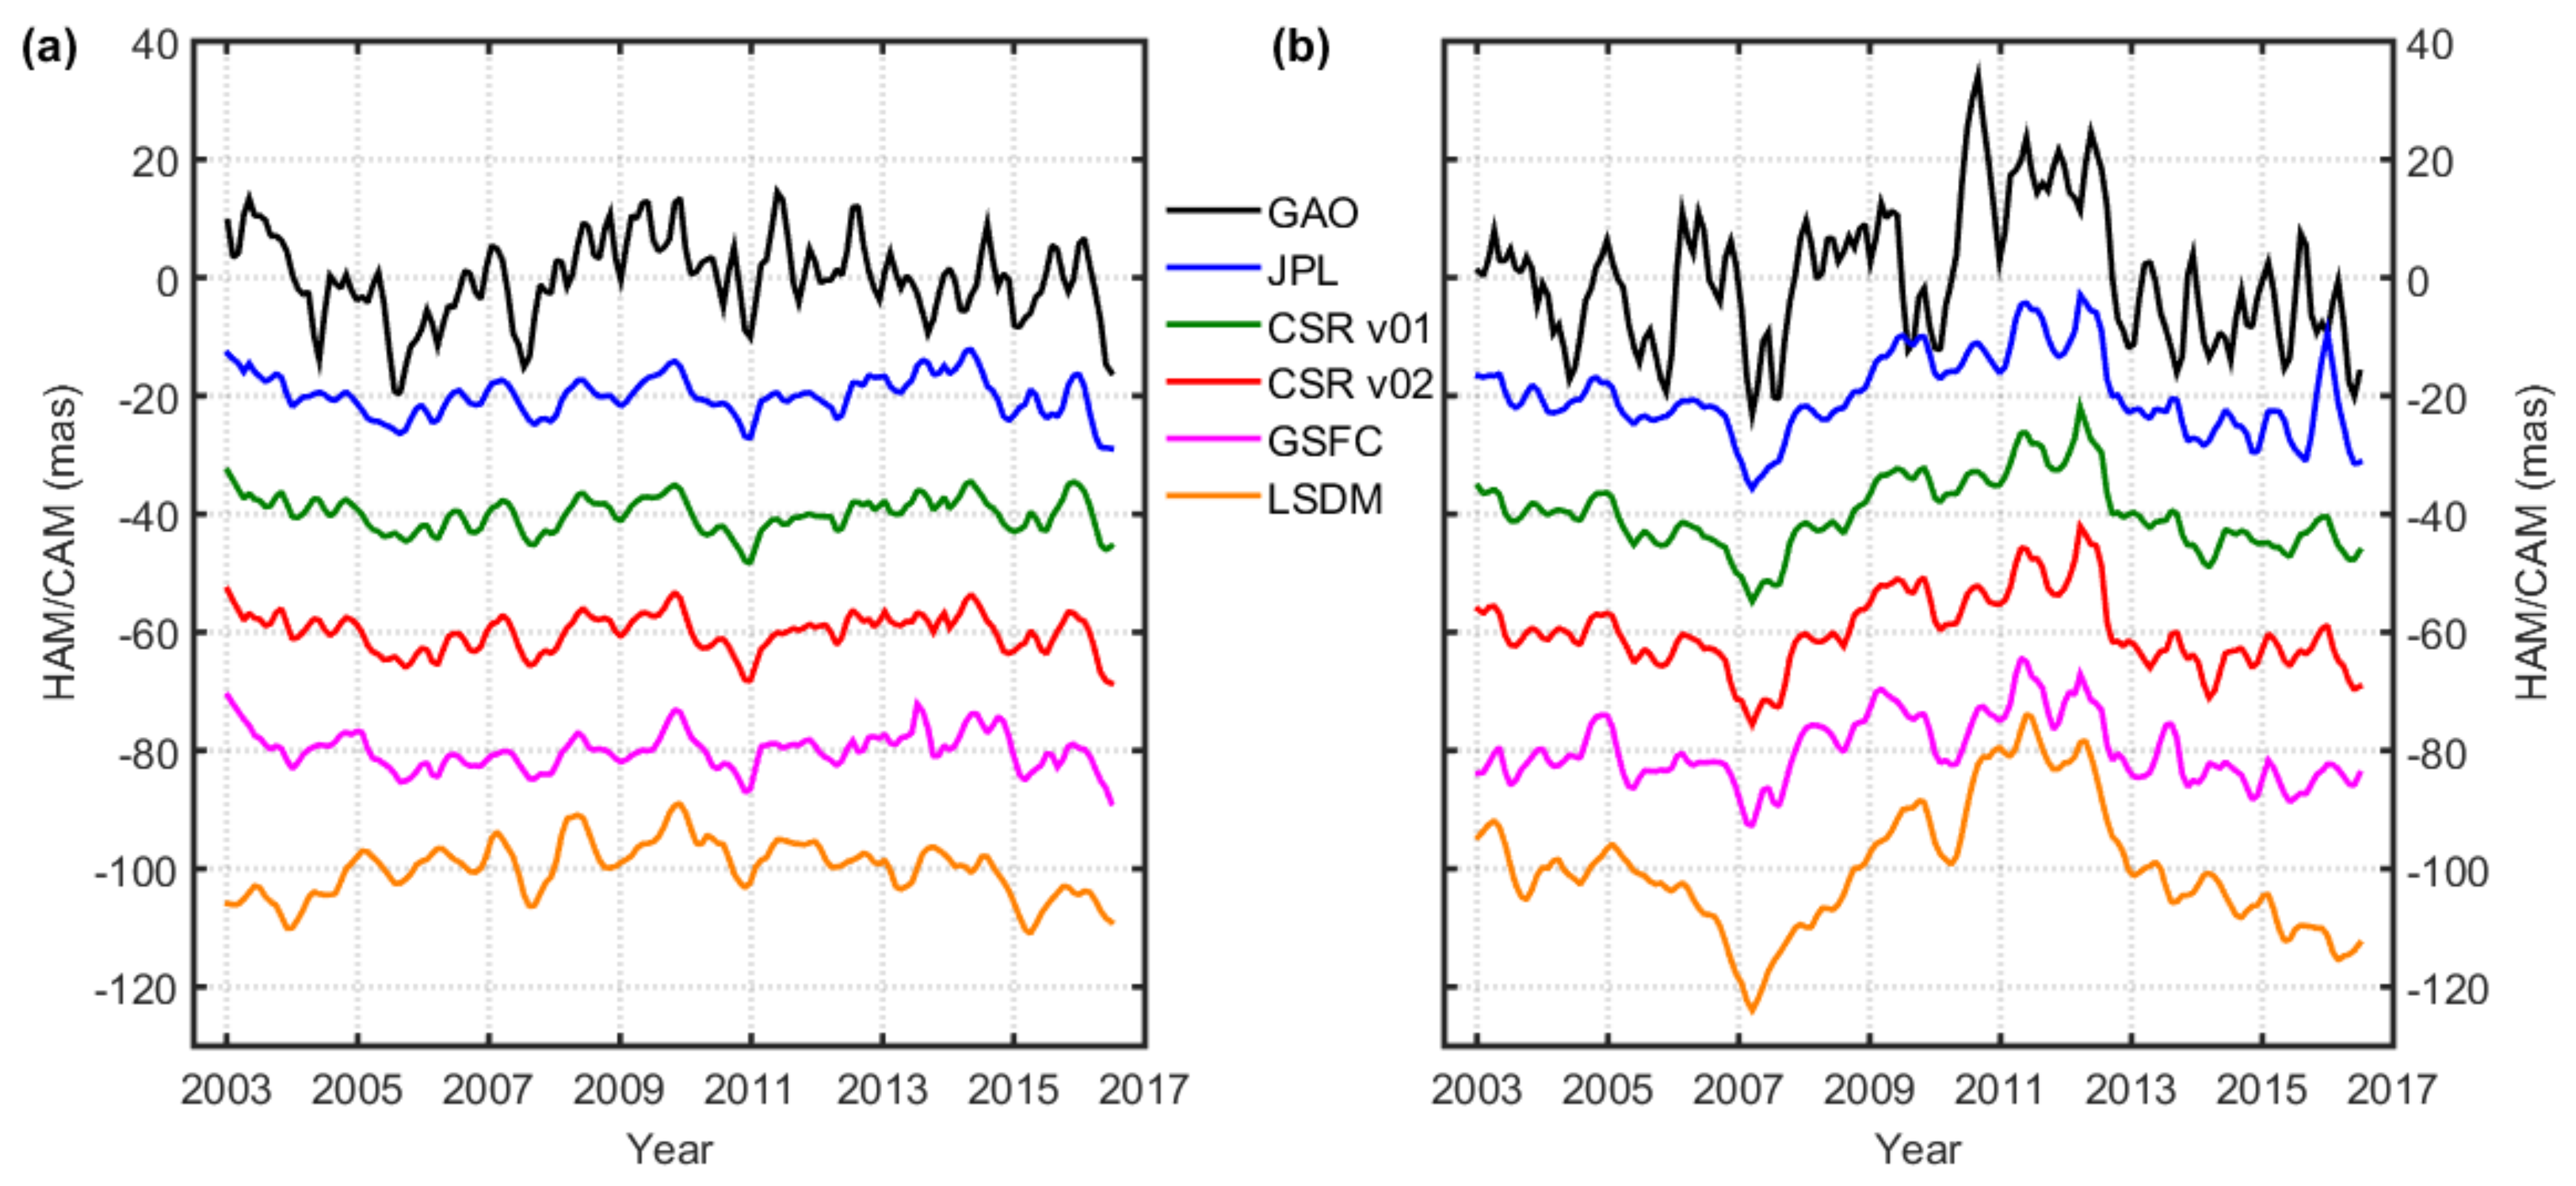
Finally, we analyze non-seasonal variations in GAO, HAM/CAM, and HAM. Time series of non-seasonal changes in GAO and HAM are presented in Figure 7, while STDerr, Corr, Varexp, and RMSD are shown in Figure 8. All HAM/CAM and HAM underestimate the variability of GAO, as indicated by the time series plots (Figure 7) and STDerr values (Figure 8). This suggests that in the non-seasonal spectral band, there is an additional signal in GAO, which is not captured by GRACE and LSDM. This effect may be caused by the residual ocean signal resulting, for example, from the errors of ocean model used for GAO determination [47]. This effect is eliminated from GRACE by masking ocean areas, and is not present in LSDM, as the hydrological model delivers data from land only. The interannual variability is well captured by both HAM/CAM and HAM (Figure 7). In particular, a similar 4–5-year oscillation is observed for all series and is probably related to groundwater variation [45]. The best agreement with GAO is for HAM/CAM obtained from the CSR v02 mascon solution (Corr of 0.60 and 0.72 for χ1 and χ2, respectively; Varexp of 34 and 50% for χ1 and χ2, respectively; and RMSD of 5.62 and 8.17 mas for χ1 and χ2, respectively). The inclusion of ellipsoidal correction in CSR v02, which is not present in CSR v01, improves the results more for χ1 than for χ2. It is also apparent that HAM/CAM based on GSFC solution has the lowest consistency with GAO of all GRACE estimates. However, the difference compared with the results from the other mascon solutions is not large; all HAM/CAM are characterized by similar level of correlation with GAO. The reason for the slightly lower consistency with GAO obtained for GSFC-based HAM/CAM compared with the other mascon solutions might be related to the use of a different AOD dataset. In particular, GSFC uses a different ocean model than CSR and JPL, namely MOG2D (2 Dimensions Gravity Waves model, [88]) instead of MPIOM. The atmosphere model is the same for all three data centers (ECMWF model). It is also worth noting that, for χ2, HAM obtained from the LSDM provides almost the same level of Corr, Varexp, and RMSD as HAM/CAM from GRACE, while the STDerr is even more satisfactory than for the GRACE estimates. This shows that the LSDM is particularly useful for determining interannual water mass variations over continents, which is consistent with previous research [42,46].

3.2. Preliminary Estimates of HAM/CAM from GRACE-FO Mascon Data

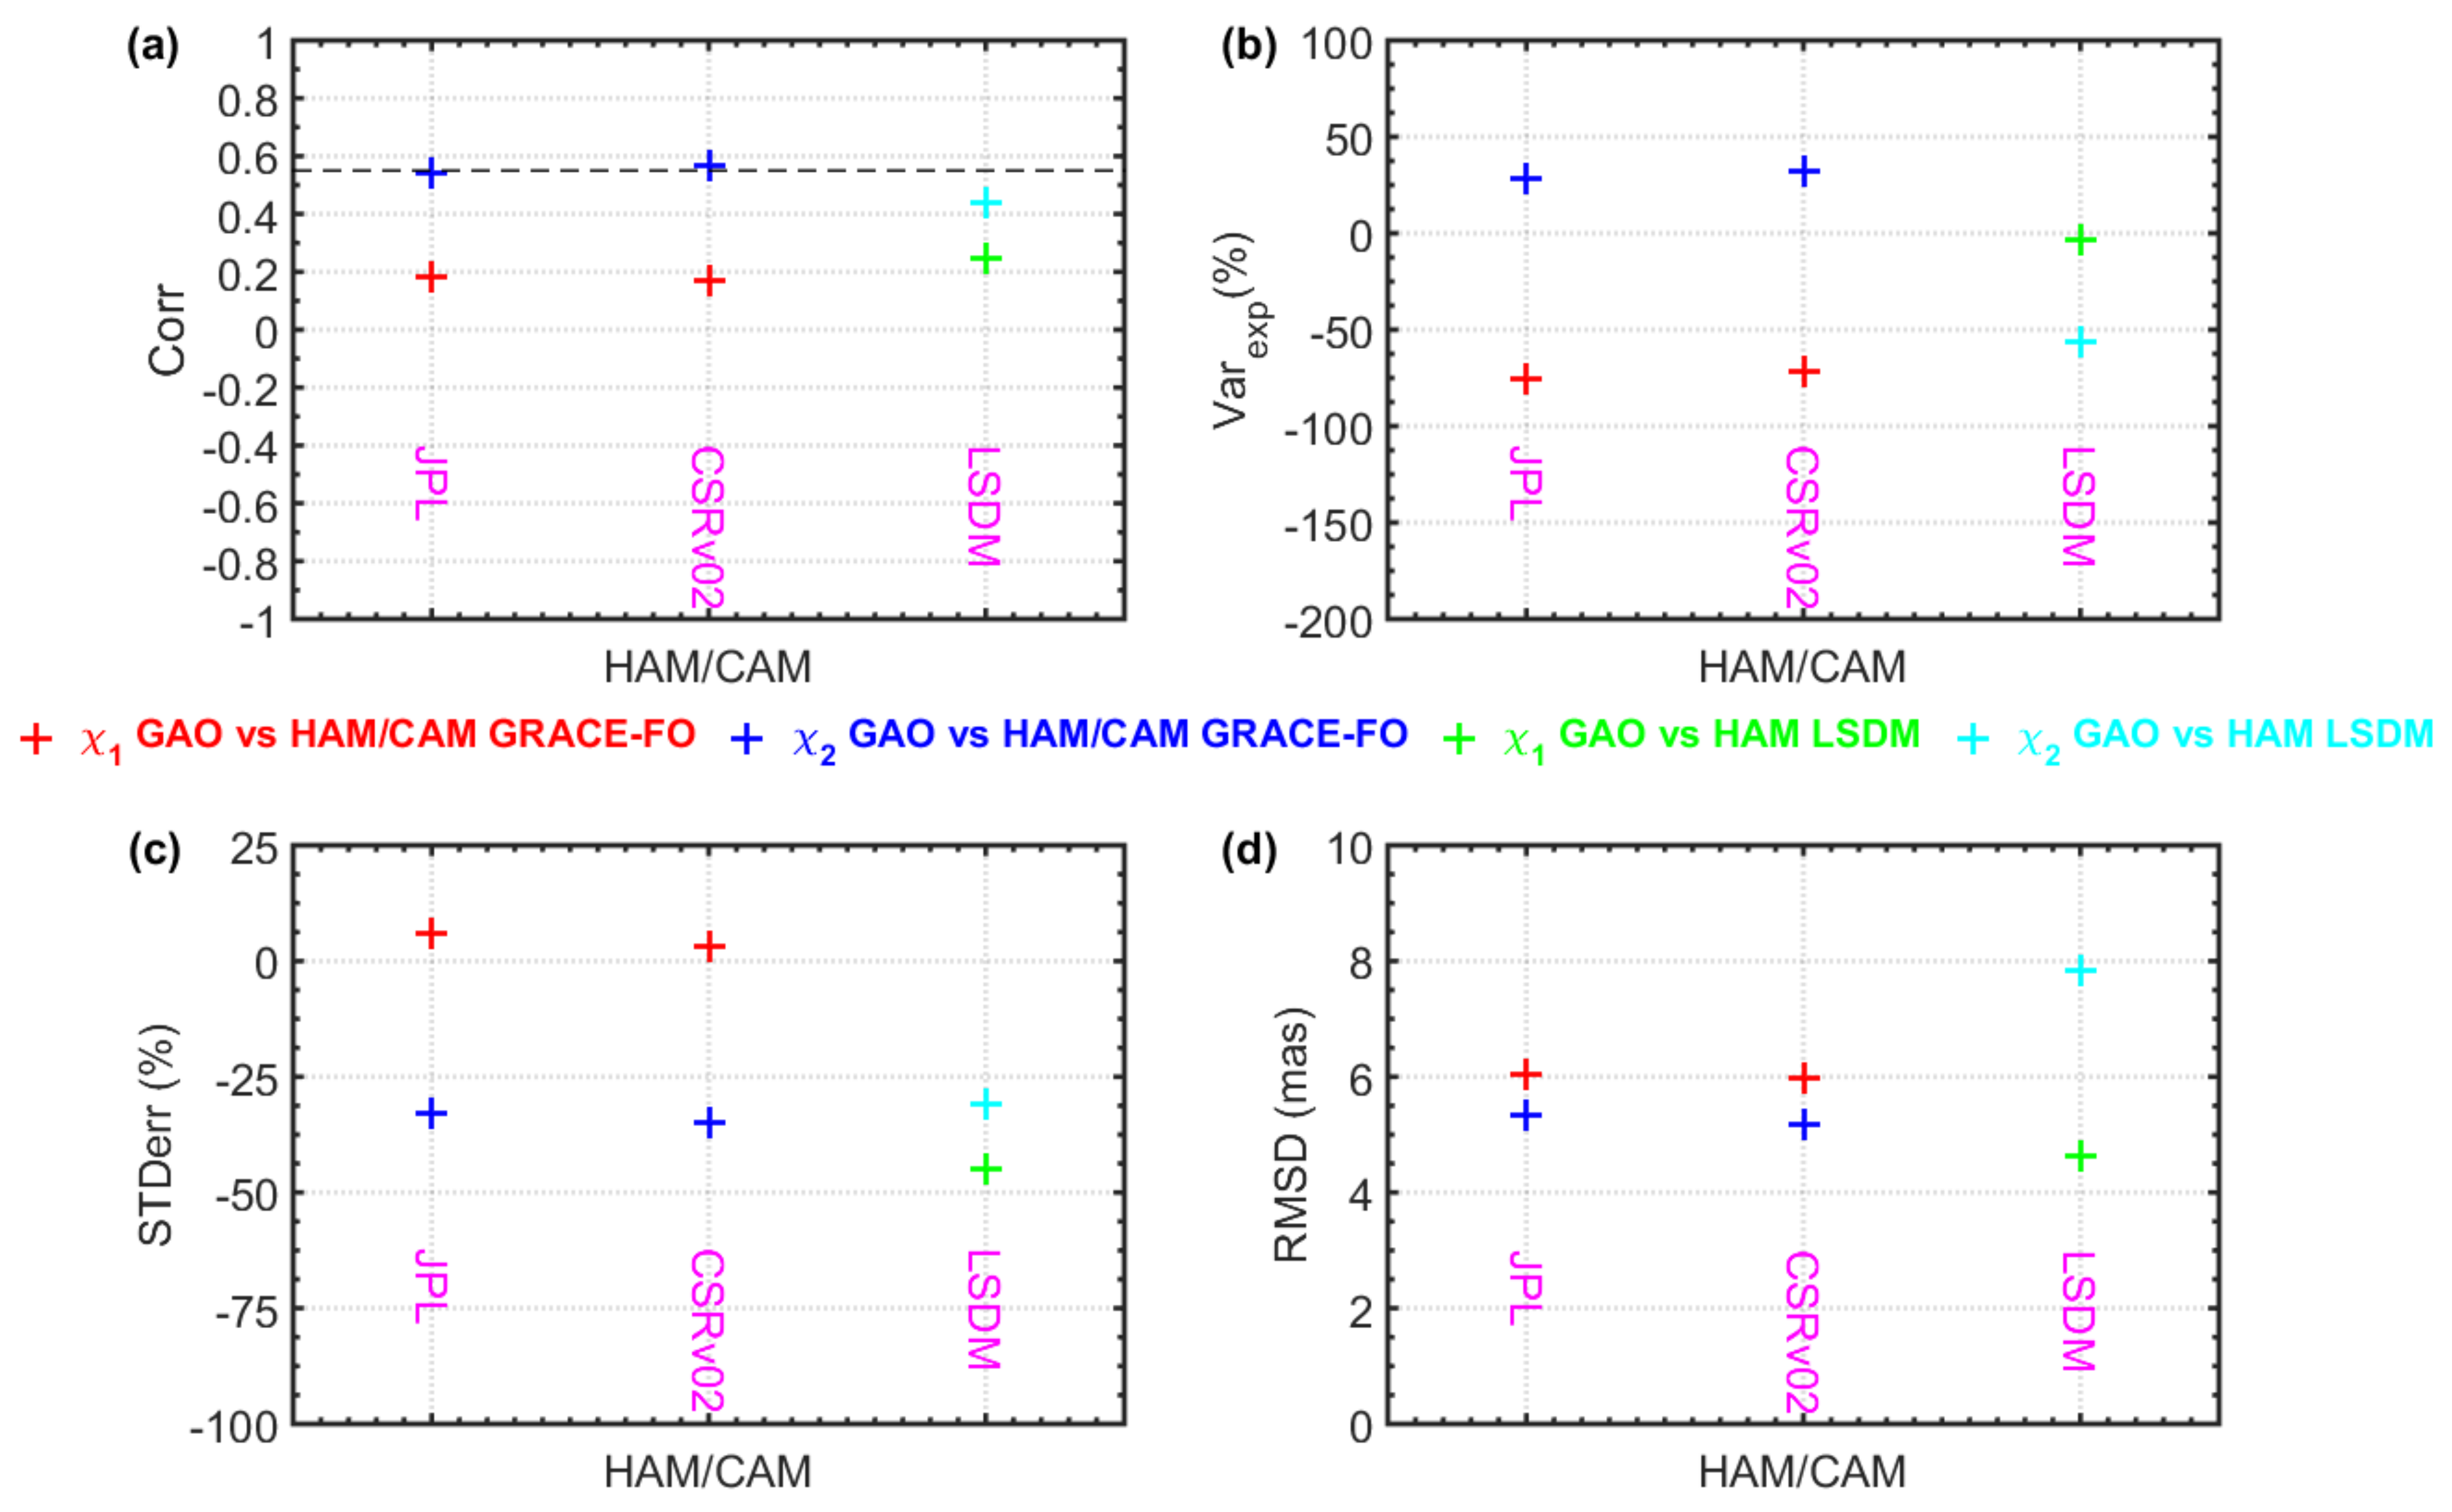
We now present preliminary estimates of HAM/CAM processed using mascon data from the first two years of the new GRACE-FO mission and contrast them with GAO and HAM obtained from the LSDM. We examine mascon solutions only from JPL and CSR v02, because CSR v01 and GSFC data do not cover the GRACE-FO period (Figure 9 and Figure 10). The time series plot indicates high consistency of HAM/CAM series obtained from both considered mascon solutions (Figure 9), which is supported by the similar parameter values shown in Figure 10. The HAM/CAM series is not consistent with GAO in χ1, which is reflected by the low Corr values. However, for χ2, the phase consistency between HAM/CAM and GAO is visibly better, including the same maximum peak around mid-2019 followed by a minimum in late 2019. There is no noticeable difference between results obtained from JPL and CSR v02 solutions. The latter solution only provides a slightly higher agreement between HAM/CAM and GAO, but this is not statistically significant. This might indicate that the use of ellipsoidal correction and ΔC30 replacement, which are applied only in CSR v02, does not have a noticeable impact on HAM/CAM over short time periods. Overall, the current quality of HAM/CAM determined from GRACE-FO mascon data is as expected (Corr values vary from 0.17 to 0.57, Varexp values vary from −75% to 32%, RMSD values vary from 5.18 to 6.03 mas, depending on the solution and equatorial component considered). The consistency between HAM/CAM and GAO is expected to increase with increasing length of the GRACE-FO time series. However, even for the observations from the initial phase of the GRACE-FO mission, the gravimetric data performed better than the hydrological model in χ2. The χ1 component of GRACE-FO-based HAM/CAM currently shows lower agreement with GAO than χ1 of LSDM-based HAM; however, as the GRACE-FO data lengthens, this compliance can be expected to improve.

4. Discussion

Analysis of HAM/CAM computed from mascon data provided by the three different processing centers indicated high consistency between estimates provided by JPL and CSR, and considerably lower agreement between the GSFC solution and other data. This is likely to be related to the strategy used for GSFC mascon computation, which is different from the methodology exploited by the CSR and JPL teams. The GSFC mascons, unlike JPL and CSR (both v01 and v02) mascons, are also not resampled to regular grids. The GSFC uses a different ocean model to determine de-aliasing data, and a different GIA model. Nevertheless, it was found that for each oscillation considered, there were no clear differences in consistency of GAO with HAM/CAM determined from various mascon solutions.
The ellipsoidal correction recently introduced in the newest mascon solution processed by the CSR team (CSR v02 solution) did not have a high impact on consistency between HAM/CAM and GAO, so it can be omitted in the studies related to PM variations. However, it may have a meaningful effect on length-of day variations since they are more closely related to the flattening of the Earth than PM. As GRACE and GRACE-FO datasets use a number of different corrections to improve the estimation of TWS distribution, future research should quantify the effect of each of them on PM excitation.
The main conclusion of this study is that, in general, all mascon solutions are equally suitable for determination of overall, seasonal, and non-seasonal HAM/CAM oscillations, and only trends are less accurately determined by GSFC than by other data centers. However, the inclusion of the newest GIA model in GSFC should partly improve the trend consistency between HAM/CAM and GAO. Therefore, we recommend all currently available mascon data for studies focusing on the interpretation of PM variations. At present, the GSFC team is working on their new mascon solution which, in contrast to the current one, will cover the time period of both GRACE and GRACE-FO missions and use the newest GIA model. Therefore, we might expect that this solution will perform better in PM excitation studies than the solution assessed in this paper. However, this hypothesis should be tested based on the validation with external PM data.

Author Contributions

Conceptualization, J.Ś.; methodology, J.Ś.; software, J.Ś., M.W. and J.N.; validation, J.Ś., M.W. and J.N.; formal analysis, J.Ś. and M.W.; investigation, J.Ś.; resources, J.Ś.; data curation, J.Ś.; writing—original draft preparation, J.Ś.; writing—review and editing, J.Ś., M.W. and J.N.; visualization, J.Ś.; supervision, J.Ś. and J.N.; project administration, J.Ś.; funding acquisition, J.Ś. All authors have read and agreed to the published version of the manuscript.

Funding

This research was funded by the National Science Center, Poland (NCN), grant number 2018/31/N/ST10/00209.

Informed Consent Statement

Not applicable.

Data Availability Statement

The data that support the findings of this study are available upon request from the corresponding author.

Acknowledgments

The authors thank the anonymous Reviewers for their thorough reviews and constructive comments that have contributed to the improvement of the paper.

Conflicts of Interest

The authors declare no conflict of interest.

References

  1. Tapley, B.D.; Bettadpur, S.; Watkins, M.; Reigber, C. The gravity recovery and climate experiment: Mission overview and early results. Geophys. Res. Lett. 2004, 31, L09607. [Google Scholar] [CrossRef] [Green Version]
  2. Tapley, B.; Watkins, M.M.; Flechtner, F.; Reigber, C.; Bettadpur, S.; Rodell, M.; Famiglietti, J.; Landerer, F.; Chambers, D.; Reager, J.; et al. Contributions of GRACE to understanding climate change. Nat. Clim. Chang. 2019, 9, 358–369. [Google Scholar] [CrossRef] [PubMed]
  3. Wahr, J.; Molenaar, M.; Bryan, F. Time variability of the Earth’s gravity field: Hydrological and oceanic effects and their possible detection using GRACE. J. Geophys. Res. 1998, 103, 30205–30229. [Google Scholar] [CrossRef]
  4. Wouters, B.; Bonin, J.A.; Chambers, D.P.; Riva, R.E.M.; Sasgen, I.; Wahr, J. GRACE, time-varying gravity, Earths system dynamics and climate change. Rep. Progress Phys. 2014, 77, 6801–116841. [Google Scholar] [CrossRef] [Green Version]
  5. Kornfeld, R.P.; Arnold, B.W.; Gross, M.A.; Dahya, N.T.; Klipstein, W.M. GRACE-FO: The Gravity Recovery and Climate Experiment Follow-On Mission. J. Spacecr. Rockets 2019, 56, 931–951. [Google Scholar] [CrossRef]
  6. Landerer, F.W.; Flechtner, F.M.; Save, H.; Webb, F.H.; Bandikova, T.; Bertiger, W.I. Extending the global mass change data record: GRACE Follow-On instrument and science data performance. Geophys. Res. Lett. 2020, 47, e2020GL088306. [Google Scholar] [CrossRef]
  7. Rowlands, D.D.; Luthcke, S.B.; McCarthy, J.J.; Klosko, S.M.; Chinn, D.S.; Lemoine, F.G.; Boy, J.-P.; Sabaka, T.J. Global mass flux solutions from GRACE: A comparison of parameter estimation strategies—Mass concentrations versus Stokes coefficients. J. Geophys. Res. 2010, 115, B01403. [Google Scholar] [CrossRef]
  8. Watkins, M.M.; Wiese, D.N.; Yuan, D.-N.; Boening, C.; Landerer, F.W. Improved methods for observing Earth’s time variable mass distribution with GRACE using spherical cap mascons. J. Geophys. Res. Solid Earth 2015, 120, 2648–2671. [Google Scholar] [CrossRef]
  9. Swenson, S.C.; Wahr, J. Post-processing removal of correlated errors in GRACE data. Geophys. Res. Lett. 2006, 33, 1–4. [Google Scholar] [CrossRef]
  10. Ndehedehe, C.; Awange, J.; Agutu, N.; Kuhn, M.; Heck, B. Understanding changes in terrestrial water storage over West Africa between 2002 and 2014. Adv. Water Resour. 2016, 88, 211–230. [Google Scholar] [CrossRef] [Green Version]
  11. Shamsudduha, M.; Taylor, R.G.; Jones, D.; Longuevergne, L.; Owor, M.; Tindimugaya, C. Recent changes in terrestrial water storage in the Upper Nile Basin: An evaluation of commonly used gridded GRACE products. Hydrol. Earth System Sci. 2017, 21, 4533–4549. [Google Scholar] [CrossRef] [Green Version]
  12. Syed, T.H.; Famiglietti, J.S.; Rodell, M.; Chen, J.; Wilson, C.R. Analysis of terrestrial water storage changes from GRACE and GLDAS. Water Resour. Res. 2008, 44. [Google Scholar] [CrossRef]
  13. Wang, L.; Chen, C.; Thomas, M.; Kaban, M.K.; Güntner, A.; Du, J. Increased water storage of Lake Qinghai during 2004–2012 from GRACE data, hydrological models, radar altimetry and in situ measurements. Geophys. J. Int. 2018, 212, 679–693. [Google Scholar] [CrossRef]
  14. Zhao, K.; Li, X. Estimating terrestrial water storage changes in the Tarim River Basin using GRACE data. Geophys. J. Int. 2017, 211, 1449–1460. [Google Scholar] [CrossRef]
  15. Velicogna, I. Increasing rates of ice mass loss from the Greenland and Antarctic ice sheets revealed by GRACE. Geophys. Res. Lett. 2009, 36, 2–5. [Google Scholar] [CrossRef] [Green Version]
  16. Velicogna, I.; Sutterley, T.C.; Van Den Broeke, M.R. Regional acceleration in ice mass loss from Greenland and Antarctica using GRACE time-variable gravity data. Geophys. Res. Lett. 2014, 41, 8130–8137. [Google Scholar] [CrossRef] [Green Version]
  17. Chen, J.L.; Wilson, C.R.; Tapley, B.D.; Yang, Z.L.; Niu, G.Y. 2005 drought event in the Amazon River basin as measured by GRACE and estimated by climate models. J. Geophys. Res. Solid Earth 2009, 114. [Google Scholar] [CrossRef]
  18. Reager, J.T.; Thomas, B.F.; Famiglietti, J.S. River basin flood potential inferred using GRACE gravity observations at several months lead time. Nat. Geosci. 2014, 7, 588–592. [Google Scholar] [CrossRef]
  19. Thomas, A.C.; Reager, J.T.; Famiglietti, J.S.; Rodell, M. A GRACE- based water storage deficit approach for hydrological drought characterization. Geophys. Res. Lett. 2014, 41, 1537–1545. [Google Scholar] [CrossRef] [Green Version]
  20. Chen, J.; Famigliett, J.S.; Scanlon, B.R.; Rodell, M. Groundwater Storage Changes: Present Status from GRACE Observations. Surv. Geophys. 2016, 37, 397–417. [Google Scholar] [CrossRef]
  21. Feng, W.; Shum, C.K.; Zhong, M.; Pan, Y. Groundwater storage changes in China from satellite gravity: An overview. Remote Sens. 2018, 10, 674. [Google Scholar] [CrossRef] [Green Version]
  22. Jin, S.; Feng, G. Large-scale variations of global groundwater from satellite gravimetry and hydrological models, 2002–2012. Glob. Planet. Chang. 2013, 106, 20–30. [Google Scholar] [CrossRef]
  23. Rodell, M.; Velicogna, I.; Famiglietti, J.S. Satellite-based estimates of groundwater depletion in India. Nature 2009, 460, 999–1002. [Google Scholar] [CrossRef] [PubMed] [Green Version]
  24. Rzepecka, Z.; Birylo, M. Groundwater storage changes derived from GRACE and GLDAS on smaller river basins—A case study in Poland. Geosciences 2020, 10, 124. [Google Scholar] [CrossRef] [Green Version]
  25. Śliwińska, J.; Birylo, M.; Rzepecka, Z.; Nastula, J. Analysis of groundwater and total water storage changes in Poland using GRACE observations, in-situ data, and various assimilation and climate models. Remote Sens. 2019, 11, 2949. [Google Scholar] [CrossRef]
  26. Voss, K.A.; Famiglietti, J.S.; Lo, M.; Linage, C.; Rodell, M.; Swenson, S.C. Groundwater depletion in the Middle East from GRACE with implications for transboundary water management in the Tigris-Euphrates-Western Iran region. Water Resour. Res. 2013, 49. [Google Scholar] [CrossRef] [PubMed] [Green Version]
  27. Brzeziński, A.; Nastula, J.; Kołaczek, B. Seasonal excitation of polar motion estimated from recent geophysical models and observations. J. Geodyn. 2009, 48, 235–240. [Google Scholar] [CrossRef] [Green Version]
  28. Seoane, L.; Nastula, J.; Bizouard, C.; Gambis, D. The use of gravimetric data from GRACE mission in the understanding of polar motion variations. Geophys. J. Int. 2009, 178, 614–622. [Google Scholar] [CrossRef] [Green Version]
  29. Dobslaw, H.; Wolf, I.; Dill, R.; Poropat, L.; Thomas, M.; Dahle, C.; Esselborn, S.; König, R.; Flechtner, F. A new high–resolution model of non–tidal atmosphere and ocean mass variability for de–aliasing of satellite gravity observations: AOD1B RL06. Geophys. J. Int. 2017, 211, 263–269. [Google Scholar] [CrossRef] [Green Version]
  30. Barnes, R.T.H.; Hide, R.; White, A.A.; Wilson, C.A. Atmospheric Angular Momentum Fluctuations, Length-of-Day Changes and Polar Motion. Proc. Royal Soc. A Math. Phys. Eng. Sci. 1983, 387, 31–73. [Google Scholar] [CrossRef]
  31. Gross, R.S.; Fukumori, I.; Menemenlis, D. Atmospheric and oceanic excitation of the Earth’s wobbles during 1980–2000. J. Geophys. Res. Solid Earth. 2003, 108, 2370. [Google Scholar] [CrossRef] [Green Version]
  32. Nastula, J.; Ponte, R.M. Further evidence for oceanic excitation of polar motion. Geophys. J. Int. 1999, 139, 123–130. [Google Scholar] [CrossRef] [Green Version]
  33. Nastula, J.; Ponte, R.M.; Salstein, D.A. Regional signals in atmospheric and oceanic excitation of polar motion. In Polar Motion: Historical and Scientific Problems; Dick, S., McCarthy, D., Luzum, B., Eds.; Astronomical Society of the Pacific: San Francisco, CA, USA, 2000; pp. 463–472. [Google Scholar]
  34. Nastula, J.; Ponte, R.M.; Salstein, D.A. Comparison of polar motion excitation series derived from GRACE and from analyses of geophysical fluids. Geophys. Res. Lett. 2007. [Google Scholar] [CrossRef]
  35. Nastula, J.; Salstein, D.A.; Kołaczek, B. Patterns of atmospheric excitation functions of polar motion from high–resolution regional sectors. J. Geophys. Res. 2009, 114, B04407. [Google Scholar] [CrossRef] [Green Version]
  36. Göttl, F.; Schmidt, M.; Seitz, F. Mass-related excitation of polar motion: An assessment of the new RL06 GRACE gravity field models. Earth Planets Space 2018, 70. [Google Scholar] [CrossRef]
  37. Jin, S.; Chambers, D.P.; Tapley, B.D. Hydrological and oceanic effects on polar motion from GRACE and models. J. Geophys. Res. 2010, 115, B02403. [Google Scholar] [CrossRef] [Green Version]
  38. Jin, S.; Hassan, A.A.; Feng, G.P. Assessment of terrestrial water contributions to polar motion from GRACE and hydrological models. J. Geodyn. 2012, 62, 40–48. [Google Scholar] [CrossRef]
  39. Meyrath, T.; van Dam, T. A comparison of interannual hydrological polar motion excitation from GRACE and geodetic observations. J. Geodyn. 2016, 99, 1–9. [Google Scholar] [CrossRef]
  40. Nastula, J.; Śliwińska, J. Prograde and Retrograde Terms of Gravimetric Polar Motion Excitation Estimates from the GRACE Monthly Gravity Field Models. Remote Sens. 2020, 12, 138. [Google Scholar] [CrossRef] [Green Version]
  41. Nastula, J.; Pasnicka, M.; Kolaczek, B. Comparison of the geophysical excitations of polar motion from the period 1980.0–2007.0. Acta Geophys. 2011, 59, 561–577. [Google Scholar] [CrossRef]
  42. Nastula, J.; Wińska, M.; Śliwińska, J.; Salstein, D. Hydrological signals in polar motion excitation—Evidence after fifteen years of the GRACE mission. J Geodyn 2019, 124, 119–132. [Google Scholar] [CrossRef]
  43. Seoane, L.; Nastula, J.; Bizouard, C.; Gambis, D. Hydrological excitation of polar motion derived from GRACE gravity field solutions. Int. J. Geophys. 2011. [Google Scholar] [CrossRef]
  44. Seoane, L.; Biancale, R.; Gambis, D. Agreement between Earth’s rotation and mass displacement as detected by GRACE. J. Geodyn. 2012, 62, 49–55. [Google Scholar] [CrossRef]
  45. Śliwińska, J.; Wińska, M.; Nastula, J. Terrestrial water storage variations and their effect on polar motion. Acta Geophys. 2019, 67, 17–39. [Google Scholar] [CrossRef] [Green Version]
  46. Śliwińska, J.; Nastula, J.; Dobslaw, H.; Dill, R. Evaluating Gravimetric Polar Motion Excitation Estimates from the RL06 GRACE Monthly-Mean Gravity Field Models. Remote Sens. 2020, 12, 930. [Google Scholar] [CrossRef] [Green Version]
  47. Śliwińska, J.; Wińska, M.; Nastula, J. Preliminary Estimation and Validation of Polar Motion Excitation from Different Types of the GRACE and GRACE Follow-On Missions Data. Remote Sens. 2020, 12, 3490. [Google Scholar] [CrossRef]
  48. Wińska, M.; Nastula, J.; Kołaczek, B. Assessment of the global and regional land hydrosphere and its impact on the balance of the geophysical excitation function of polar motion. Acta Geophys. 2016, 64, 1–23. [Google Scholar] [CrossRef] [Green Version]
  49. Wińska, M.; Nastula, J.; Salstein, D.A. Hydrological excitation of polar motion by different variables from the GLDAS model. J. Geodesy 2017, 17, 7110. [Google Scholar] [CrossRef] [Green Version]
  50. Chen, J.L. Satellite gravimetry and mass transport in the earth system. Geodesy Geodynam. 2018, 10, 402–415. [Google Scholar] [CrossRef]
  51. Jing, W.; Zhao, X.; Yao, L.; Jiang, H.; Xu, J.; Yang, J.; Li, Y. Variations in terrestrial water storage in the Lancang-Mekong river basin from GRACE solutions and land surface model. J. Hydrol. 2020, 580, 124258. [Google Scholar] [CrossRef]
  52. Long, D.; Pan, Y.; Zhou, J.; Chen, Y.; Hou, X.; Hong, Y.; Scanlon, B.R.; Longuevergne, L. Global analysis of spatiotemporal variability in merged total water storage changes using multiple GRACE products and global hydrological models. Remote Sens. Environ. 2017, 192, 198–216. [Google Scholar] [CrossRef]
  53. Luthcke, S.; Sabaka, T.; Loomis, B.; Arendt, A.; McCarthy, J.; Camp, J. Antarctica, Greenland and Gulf of Alaska land-ice evolution from an iterated GRACE global mascon solution. J. Glaciol. 2013, 59, 613–631. [Google Scholar] [CrossRef]
  54. Schrama, E.J.O.; Wouters, B.; Rietbroek, R. A mascon approach to assess ice sheet and glacier mass balances and their uncertainties from GRACE data. J. Geophys. Res. Solid Earth 2014, 119, 6048–6066. [Google Scholar] [CrossRef]
  55. Sun, Z.; Zhu, X.; Pan, Y.; Zhang, J.; Liu, X. Drought evaluation using the GRACE terrestrial water storage deficit over the Yangtze River Basin, China. Sci. Total Environ. 2018, 634, 727–738. [Google Scholar] [CrossRef] [PubMed]
  56. Wiese, D.N.; Landerer, F.W.; Watkins, M.M. Quantifying and reducing leakage errors in the JPL RL05M GRACE mascon solution. Water Resour. Res. 2016, 52, 7490–7502. [Google Scholar] [CrossRef]
  57. Save, H.; Bettadpur, S.; Tapley, B.D. High resolution CSR GRACE RL05 mascons. J. Geophys. Res. Solid Earth 2016, 121, 7547–7569. [Google Scholar] [CrossRef]
  58. Ditmar, P. Conversion of time-varying Stokes coefficients into mass anomalies at the Earth’s surface considering the Earth’s oblateness. J. Geodesy 2018, 92, 1401–1412. [Google Scholar] [CrossRef] [Green Version]
  59. Save, H. CSR GRACE and GRACE-FO RL06 Mascon Solutions v02. Available online: http://www2.csr.utexas.edu/grace/RL06_mascons.html (accessed on 1 July 2020). [CrossRef]
  60. Cheng, M.; Ries, J.C.; Tapley, B.D. Variations of the Earth’s figure axis from satellite laser ranging and GRACE. J. Geophys. Res. 2011, 116, B01409. [Google Scholar] [CrossRef] [Green Version]
  61. Cheng, M.; Ries, J. The unexpected signal in GRACE estimates of C20. J. Geodesy 2017, 91, 897–914. [Google Scholar] [CrossRef]
  62. Loomis, B.D.; Rachlin, K.E.; Wiese, D.N.; Landerer, F.W.; Luthcke, S.B. Replacing GRACE/GRACE-FO with satellite laser ranging: Impacts on Antarctic Ice Sheet mass change. Geophys. Res. Lett. 2020, 47, e2019GL085488. [Google Scholar] [CrossRef]
  63. Cheng, M.; Tapley, B.D.; Ries, J.C. Deceleration in the Earth’s oblateness. J. Geophys. Res. Solid Earth 2013, 118, 740–747. [Google Scholar] [CrossRef]
  64. Sun, Y.; Riva, R.; Ditmar, P. Optimizing estimates of annual variations and trends in geocenter motion and J2 from a combination of GRACE data and geophysical models. J. Geophys. Res. Solid Earth 2016, 121. [Google Scholar] [CrossRef] [Green Version]
  65. Swenson, S.; Chambers, D.; Wahr, J. Estimating geocenter variations from a combination of GRACE and ocean model output. J. Geophys. Res. 2008, 113, 8410. [Google Scholar] [CrossRef] [Green Version]
  66. Peltier, W.R.; Argus, D.F.; Drummond, R. Comment on “An Assessment of the ICE-6G_C (VM5a) Glacial Isostatic Adjustment Model” by Purcell et al. J. Geophys. Res. Solid Earth 2018, 123, 2019–2028. [Google Scholar] [CrossRef]
  67. Peltier, W.R.; Argus, D.F.; Drummond, R. Space geodesy constrains ice-age terminal deglaciation: The global ICE-6G C (VM5a) model. J. Geophys. Res. Solid Earth 2015, 120, 450–487. [Google Scholar] [CrossRef] [Green Version]
  68. Geruo, A.; Wahr, J.; Zhong, S. Computations of the viscoelastic response of a 3-D compressible Earth to surface loading: An application to Glacial Isostatic Adjustment in Antarctica and Canada. Geophys. J. Int. 2013, 192, 557–572. [Google Scholar] [CrossRef]
  69. Eubanks, T.M. Variations in the orientation of the Earth. In Contributions of Space Geodesy to Geodynamics: Earth Dynamics: Geodynamic Series; Smith, D.E., Turcotte, D.L., Eds.; American Geophysical Union: Washington, DC, USA, 1993; Volume 24, pp. 1–54. [Google Scholar]
  70. Gross, R. Theory of earth rotation variations. In VIII Hotine-Marussi Symposium on Mathematical Geodesy; Sneeuw, N., Novák, P., Crespi, M., Sansò, F., Eds.; Springer: Cham, Switzerland, 2015; Volume 142. [Google Scholar]
  71. Nastula, J. Polar Motion Excitation from Several Models of Land Hydrosphere. In Proceedings of the 19th EGU General Assembly, EGU2017, Vienna, Austria, 23–28 April 2017; p. 11866. Available online: https://meetingorganizer.copernicus.org/EGU2017/EGU2017-11866-1.pdf (accessed on 1 July 2020).
  72. Dill, R. Hydrological Model LSDM for Operational Earth Rotation and Gravity Field Variations. GFZ Scientific Technical Report STR; 08/09. Available online: https://gfzpublic.gfz-potsdam.de/pubman/faces/ViewItemFullPage.jsp?itemId=item_8770_4 (accessed on 15 January 2021).
  73. Dobslaw, H.; Dill, R.; Grötzsch, A.; Brzeziński, A.; Thomas, M. Seasonal polar motion excitation from numerical models of atmosphere, ocean, and continental hydrosphere. J. Geophys. Res. 2010, 115, B10406. [Google Scholar] [CrossRef] [Green Version]
  74. Jungclaus, J.H.; Fischer, N.; Haak, H.; Lohmann, K.; Marotzke, J.; Matei, D.; Mikolajewicz, U.; Notz, D.; von Storch, J.S. Characteristics of the ocean simulations in MPIOM, the ocean component of the MPI-Earth system model. J. Adv. Model. Earth Syst. 2013, 5, 422–446. [Google Scholar] [CrossRef]
  75. Dobslaw, H.; Dill, R. Effective Angular Momentum Functions from Earth System Modelling at GeoForschungsZentrum in Potsdam. Technical Report, Revision 1.1 (March 18, 2019), GFZ Potsdam, Germany. Available online: http://rz-vm115.gfz-potsdam.de:8080/repository (accessed on 15 January 2021).
  76. Brzezinski, A. Polar motion excitation by variations of the effective angular momentum function: Considerations concerning deconvolution problem. Manuscr. Geod. 1992, 17, 3–20. [Google Scholar]
  77. Bizouard, C.; Lambert, S.; Gattano, C.; Becker, O.; Richard, J.Y. The IERS EOP 14C04 solution for Earth orientation parameters consistent with ITRF 2014. J. Geodesy 2018. [Google Scholar] [CrossRef]
  78. Nastula, J.; Chin, T.M.; Gross, R.; Śliwińska, J.; Wińska, M. Smoothing and predicting celestial pole offsets using a Kalman filter and smoother. J. Geodesy 2020, 94. [Google Scholar] [CrossRef] [Green Version]
  79. Bizouard, C. Elliptic polarisation of the polar motion excitation. J. Geod. 2016, 90, 179–188. [Google Scholar] [CrossRef]
  80. Lambeck, K. The Earth’s Variable Rotation: Geophysical Causes and Consequences; Cambridge University Press: Cambridge, UK, 1980. [Google Scholar]
  81. Munk, W.H.; Mac Donald, G. The Rotation of the Earth; Cambridge University Press: Cambridge, UK, 1960. [Google Scholar]
  82. Taylor, K.E. Summarizing multiple aspects of model performance in a single diagram. J. Geophys. Res. Atmos. 2001, 106, 7183–7192. [Google Scholar] [CrossRef]
  83. Zhou, Y.; Yang, S.; Luo, J.; Ray, J.; Huang, Y.; Li, J. Global glacial isostatic adjustment constrained by GPS measurements: Spherical harmonic analyses of uplifts and geopotential variations. Remote Sens. 2020, 12, 1209. [Google Scholar] [CrossRef] [Green Version]
  84. Youm, K.; Seo, K.W.; Jeon, T.; Na, S.H.; Chen, J.; Wilson, C.R. Ice and groundwater effects on long term polar motion (1979–2010). J. Geodyn. 2017, 106, 66–73. [Google Scholar] [CrossRef]
  85. Güntner, A.; Stuck, J.; Werth, S.; Döll, P.; Verzano, K.; Merz, B. A global analysis of temporal and spatial variations in continental water storage. Water Resour. Res. 2007, 43, 1–19. [Google Scholar] [CrossRef]
  86. Adhikari, S.; Caron, L.; Steinberger, B.; Reager, J.T.; Kjeldsen, K.K.; Marzeion, B.; Larour, E.; Ivins, E.R. What drives 20th century polar motion? Earth Planet. Sci. Lett. 2018, 502, 126–132. [Google Scholar] [CrossRef] [Green Version]
  87. Adhikari, S.; Ivins, E.R. Climate-driven polar motion: 2003–2015. Sci. Adv. 2016, 2, 1–11. [Google Scholar] [CrossRef] [PubMed] [Green Version]
  88. Carrere, L.; Lyard, F. Modeling the barotropic response of the global ocean to atmospheric wind and pressure forcing—Comparisons with observations. Geophys. Res. Lett. 2003, 30, 1275. [Google Scholar] [CrossRef] [Green Version]
Figure 1. Comparison of detrended time series of the (a) χ1 and (b) χ2 components of GAO, GRACE-based HAM/CAM, and LSDM-based HAM. For better visibility, time series have been shifted relative to each other by adding a bias.
Remotesensing 13 01152 g001
Figure 2. (a) Correlation coefficients (Corr) between HAM/CAM and GAO and between HAM and GAO, (b) percentage of variance in GAO explained by HAM/CAM and HAM (Varexp), (c) error of standard deviation (STD) (STDerr) of HAM/CAM and HAM, and (d) root mean square deviation (RMSD) of HAM/CAM and HAM. The overall detrended time series are considered. Note that the critical value of the correlation coefficient for the overall time series for 53 independent points and a 95% confidence level is 0.23 (shown as a black dashed line), while the standard error of the difference between the two correlation coefficients is 0.20.
Remotesensing 13 01152 g002
Figure 3. Amplitude spectra of the GAO, GRACE-based HAM/CAM, and LSDM-based HAM computed in a broad band with (a) a 60–500-day cut-off and (b) 60–200-day cut-off. The minus time period on the plot indicates retrograde terms, while plus time period indicates prograde terms. Note that the periods shorter than 60 days are not considered, because all series were monthly sampled and their Nyquist frequency is about 6 cycles per year, which corresponds to the periods of about 60 days.
Remotesensing 13 01152 g003
Figure 4. Comparison of seasonal time series of the (a) χ1 and (b) χ2 components of GAO, GRACE-based HAM/CAM, and LSDM-based HAM. Plots (c,d) present the same series as (a,b), but without adding a bias and with a changed scale on the x axis for better visibility of the seasonal cycle. The time period for (c,d) is between October 2007 and October 2009.
Remotesensing 13 01152 g004aRemotesensing 13 01152 g004b
Figure 5. (a) Correlation coefficients (Corr) between HAM/CAM and GAO and between HAM and GAO, (b) percentage of variance in GAO explained by HAM/CAM and HAM (Varexp), (c) error of STD (STDerr) of HAM/CAM and HAM, and (d) root mean square deviation (RMSD) of HAM/CAM and HAM. Seasonal variations are considered. Note that for seasonal variations, the critical value of the correlation coefficient for 68 independent points and a 95% confidence level is 0.20, while the standard error of the difference between the two correlation coefficients is 0.18.
Remotesensing 13 01152 g005
Figure 6. Phasor diagrams of (a) annual prograde, (b) annual retrograde, (c) semiannual prograde, and (d) semiannual retrograde variation in χ1 + iχ2 for GAO, GRACE-based HAM/CAM, and LSDM-based HAM. Phase (ϕ) in (a,b) is defined by the annual term as sin(2π(t − t0) + ϕ), where t0 is the reference epoch (1 January 2004). ϕ in (c,d) is defined by the semiannual term as sin(4π(t − t0) + ϕ).
Remotesensing 13 01152 g006
Figure 7. Comparison of non-seasonal time series of the (a) χ1 and (b) χ2 components of GAO, GRACE-based HAM/CAM, and LSDM-based HAM.
Remotesensing 13 01152 g007
Figure 8. (a) Correlation coefficients (Corr) between HAM/CAM and GAO and between HAM and GAO, (b) percentage of variance in GAO explained by HAM/CAM and HAM (Varexp), (c) error of STD (STDerr) of HAM/CAM and HAM, and (d) root mean square deviation (RMSD) of HAM/CAM and HAM. Non-seasonal variations are considered. Note that for non-seasonal variations, the critical value of the correlation coefficient for 36 independent points and a 95% confidence level is 0.28, while the standard error of the difference between the two correlation coefficients is 0.25.
Remotesensing 13 01152 g008
Figure 9. Comparison of overall detrended time series of the (a) χ1 and (b) χ2 components of GAO, GRACE-FO-based HAM/CAM, and LSDM-based HAM.
Remotesensing 13 01152 g009
Figure 10. (a) Correlation coefficients (Corr) between HAM/CAM and GAO and between HAM and GAO, (b) percentage of variance in GAO explained by HAM/CAM and HAM (Varexp), (c) error of STD (STDerr) of HAM/CAM and HAM, (d) root mean square deviation (RMSD) of HAM/CAM and HAM. Overall detrended time series are considered. Note that the critical value of the correlation coefficient for 10 independent points and a 95% confidence level is 0.55, while the standard error of the difference between the two correlation coefficients is 0.53.
Remotesensing 13 01152 g010
Table 2. Trends in the χ1 and χ2 components of GAO, GRACE-based hydrological plus cryospheric angular momentum (HAM/CAM), and Land Surface Discharge Model (LSDM)-based HAM together with their errors.
Trend (Mas/Year)
χ1χ2
GAO (without GIA removed)+5.57 ± 0.59−0.72 ± 1.02
GAO (with GIA removed)+4.55 ± 0.59+3.88 ± 1.02
JPL+4.01 ± 0.44+2.04 ± 0.67
CSR v01+3.55 ± 0.38+2.02 ± 0.56
CSR v02+3.93 ± 0.38+2.09 ± 0.57
GSFC+0.86 ± 0.44+1.29 ± 0.56
LSDM+0.43 ± 0.41+3.39 ± 0.91
Table 3. Trends in the χ1 and χ2 components of HAM/CAM due to GIA signal obtained for ICE6G and ICE6G-D models, and the differences between the models.
Trend (Mas/Year)
χ1χ2
ICE6G-D+1.02‒4.60
ICE6G+0.90‒4.33
ICE6G ‒ ICE6G-D±0.12±0.27
Publisher’s Note: MDPI stays neutral with regard to jurisdictional claims in published maps and institutional affiliations.