
Geodetic-Gravimetric Monitoring of Mountain Uplift and Hydrological Variations at Zugspitze and Wank Mountains (Bavarian Alps, Germany)


Abstract
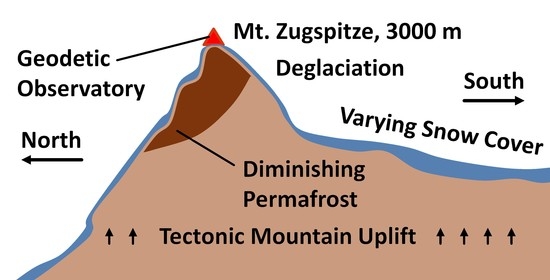
1. Introduction
2. Methodology and Observational Results
2.1. Absolute Gravimetry with the Hannover Free-Fall Gravimeter FG5 No. 220
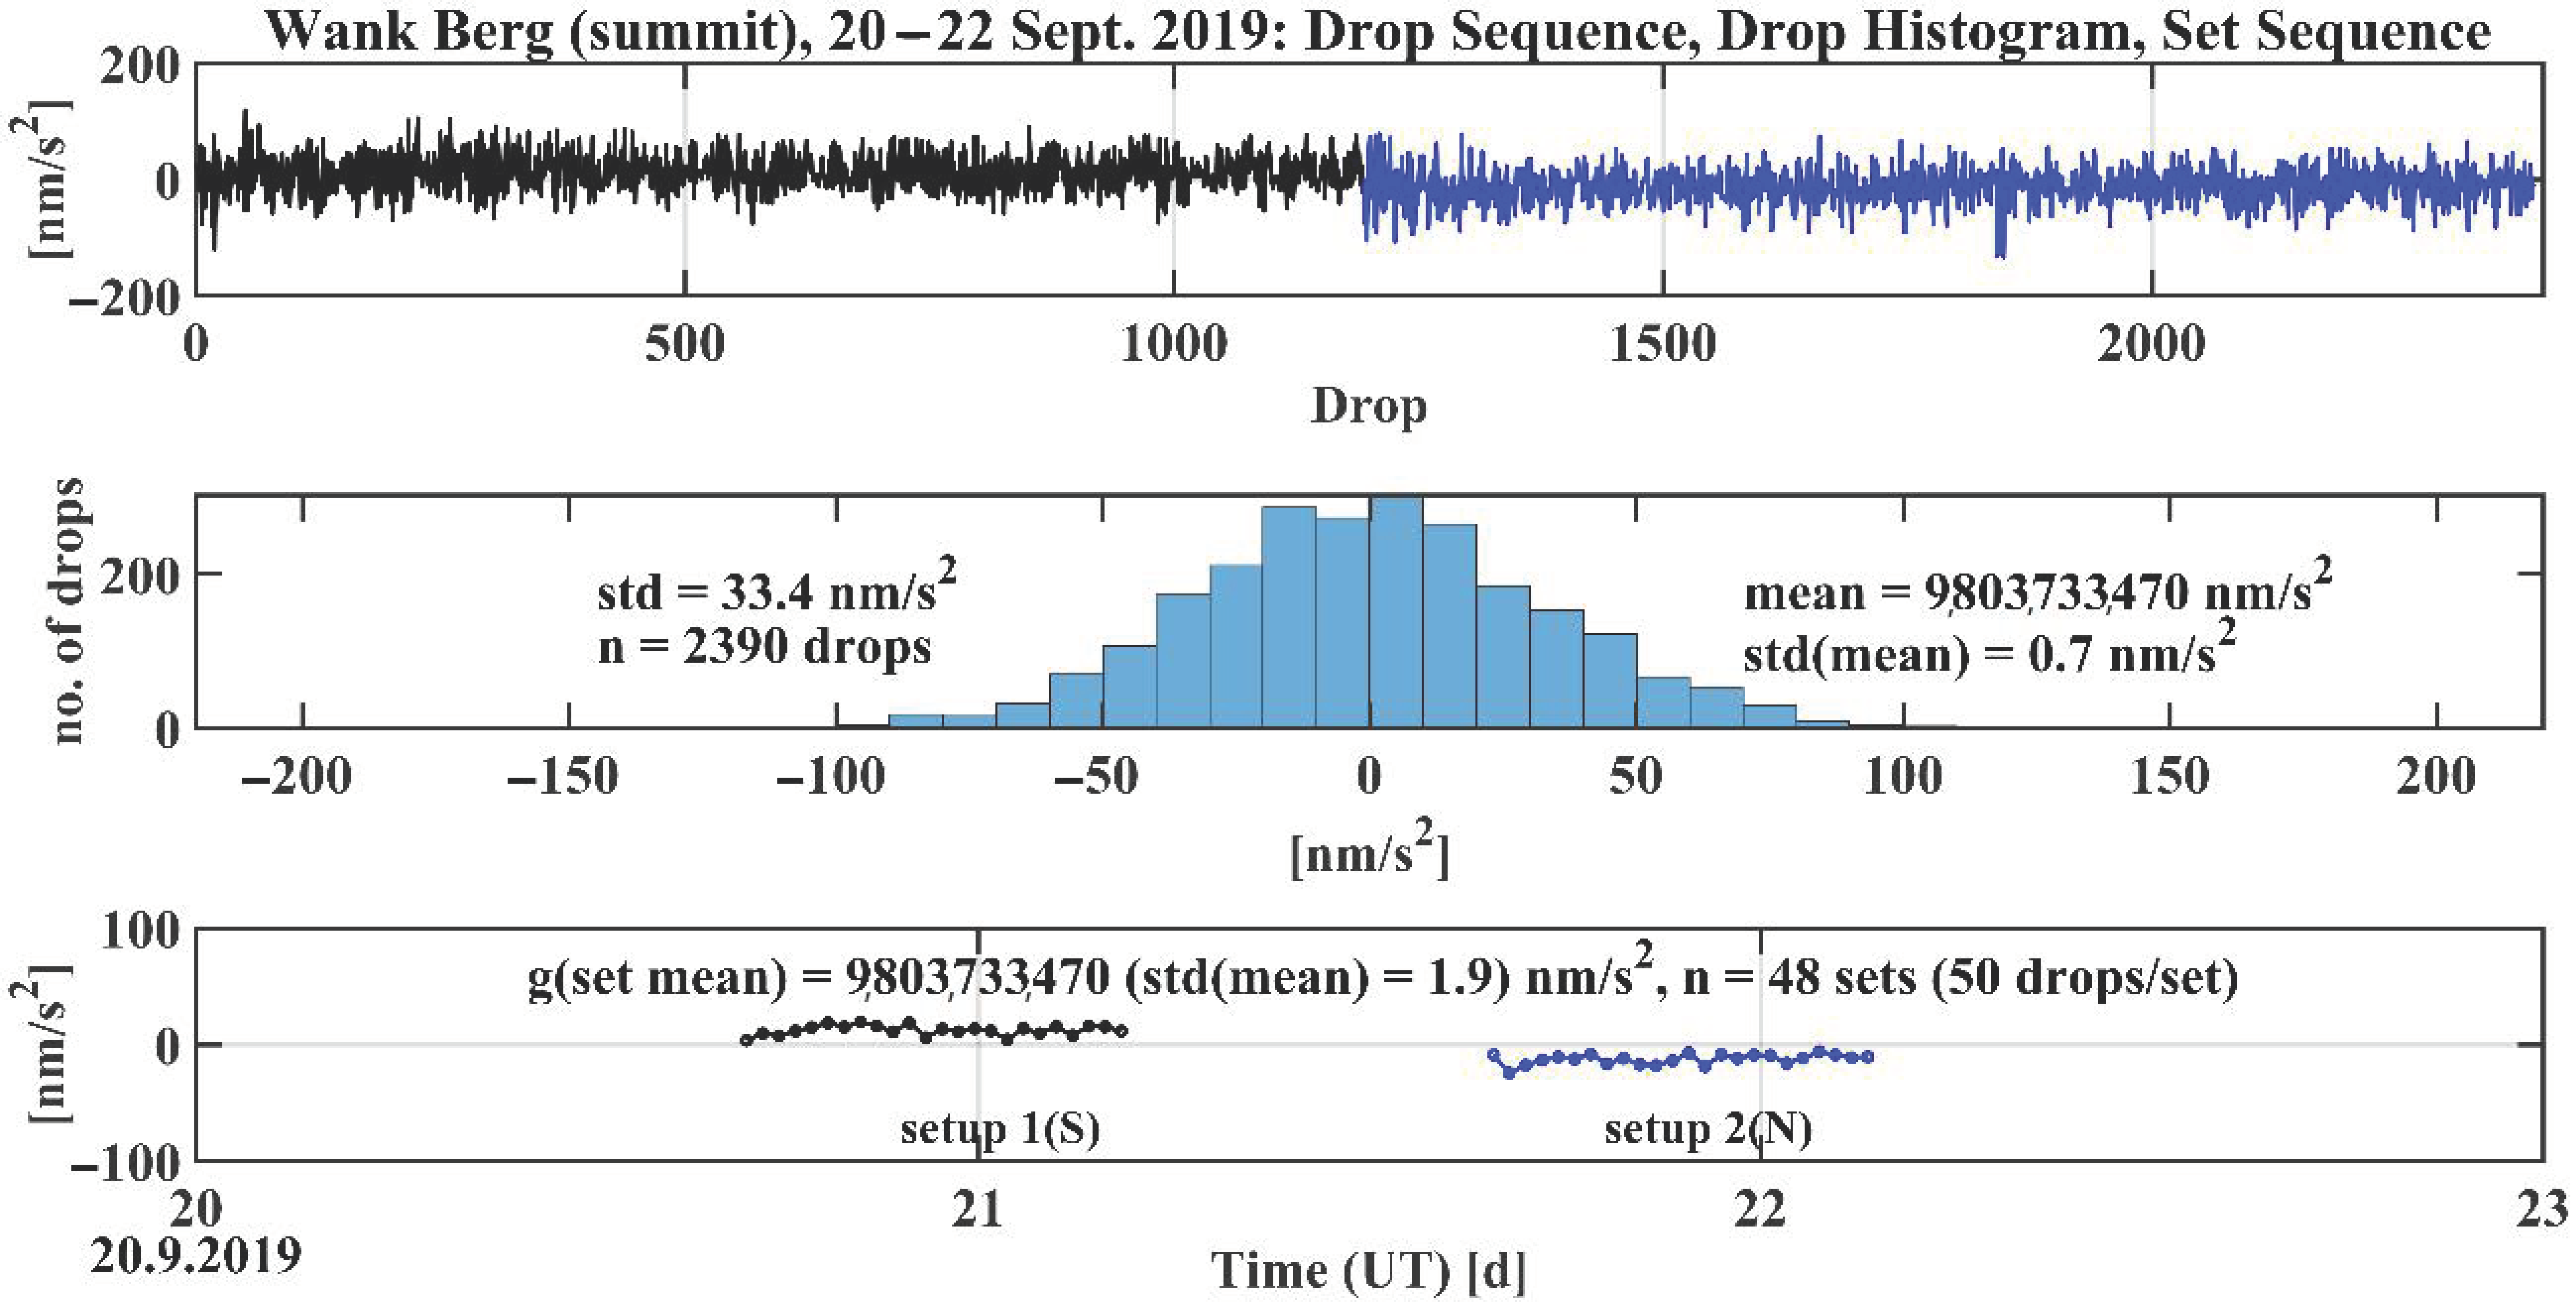
2.1.1. Long-Term Measuring Repeatability
2.1.2. Measurement Procedure and Applied Gravity Reductions
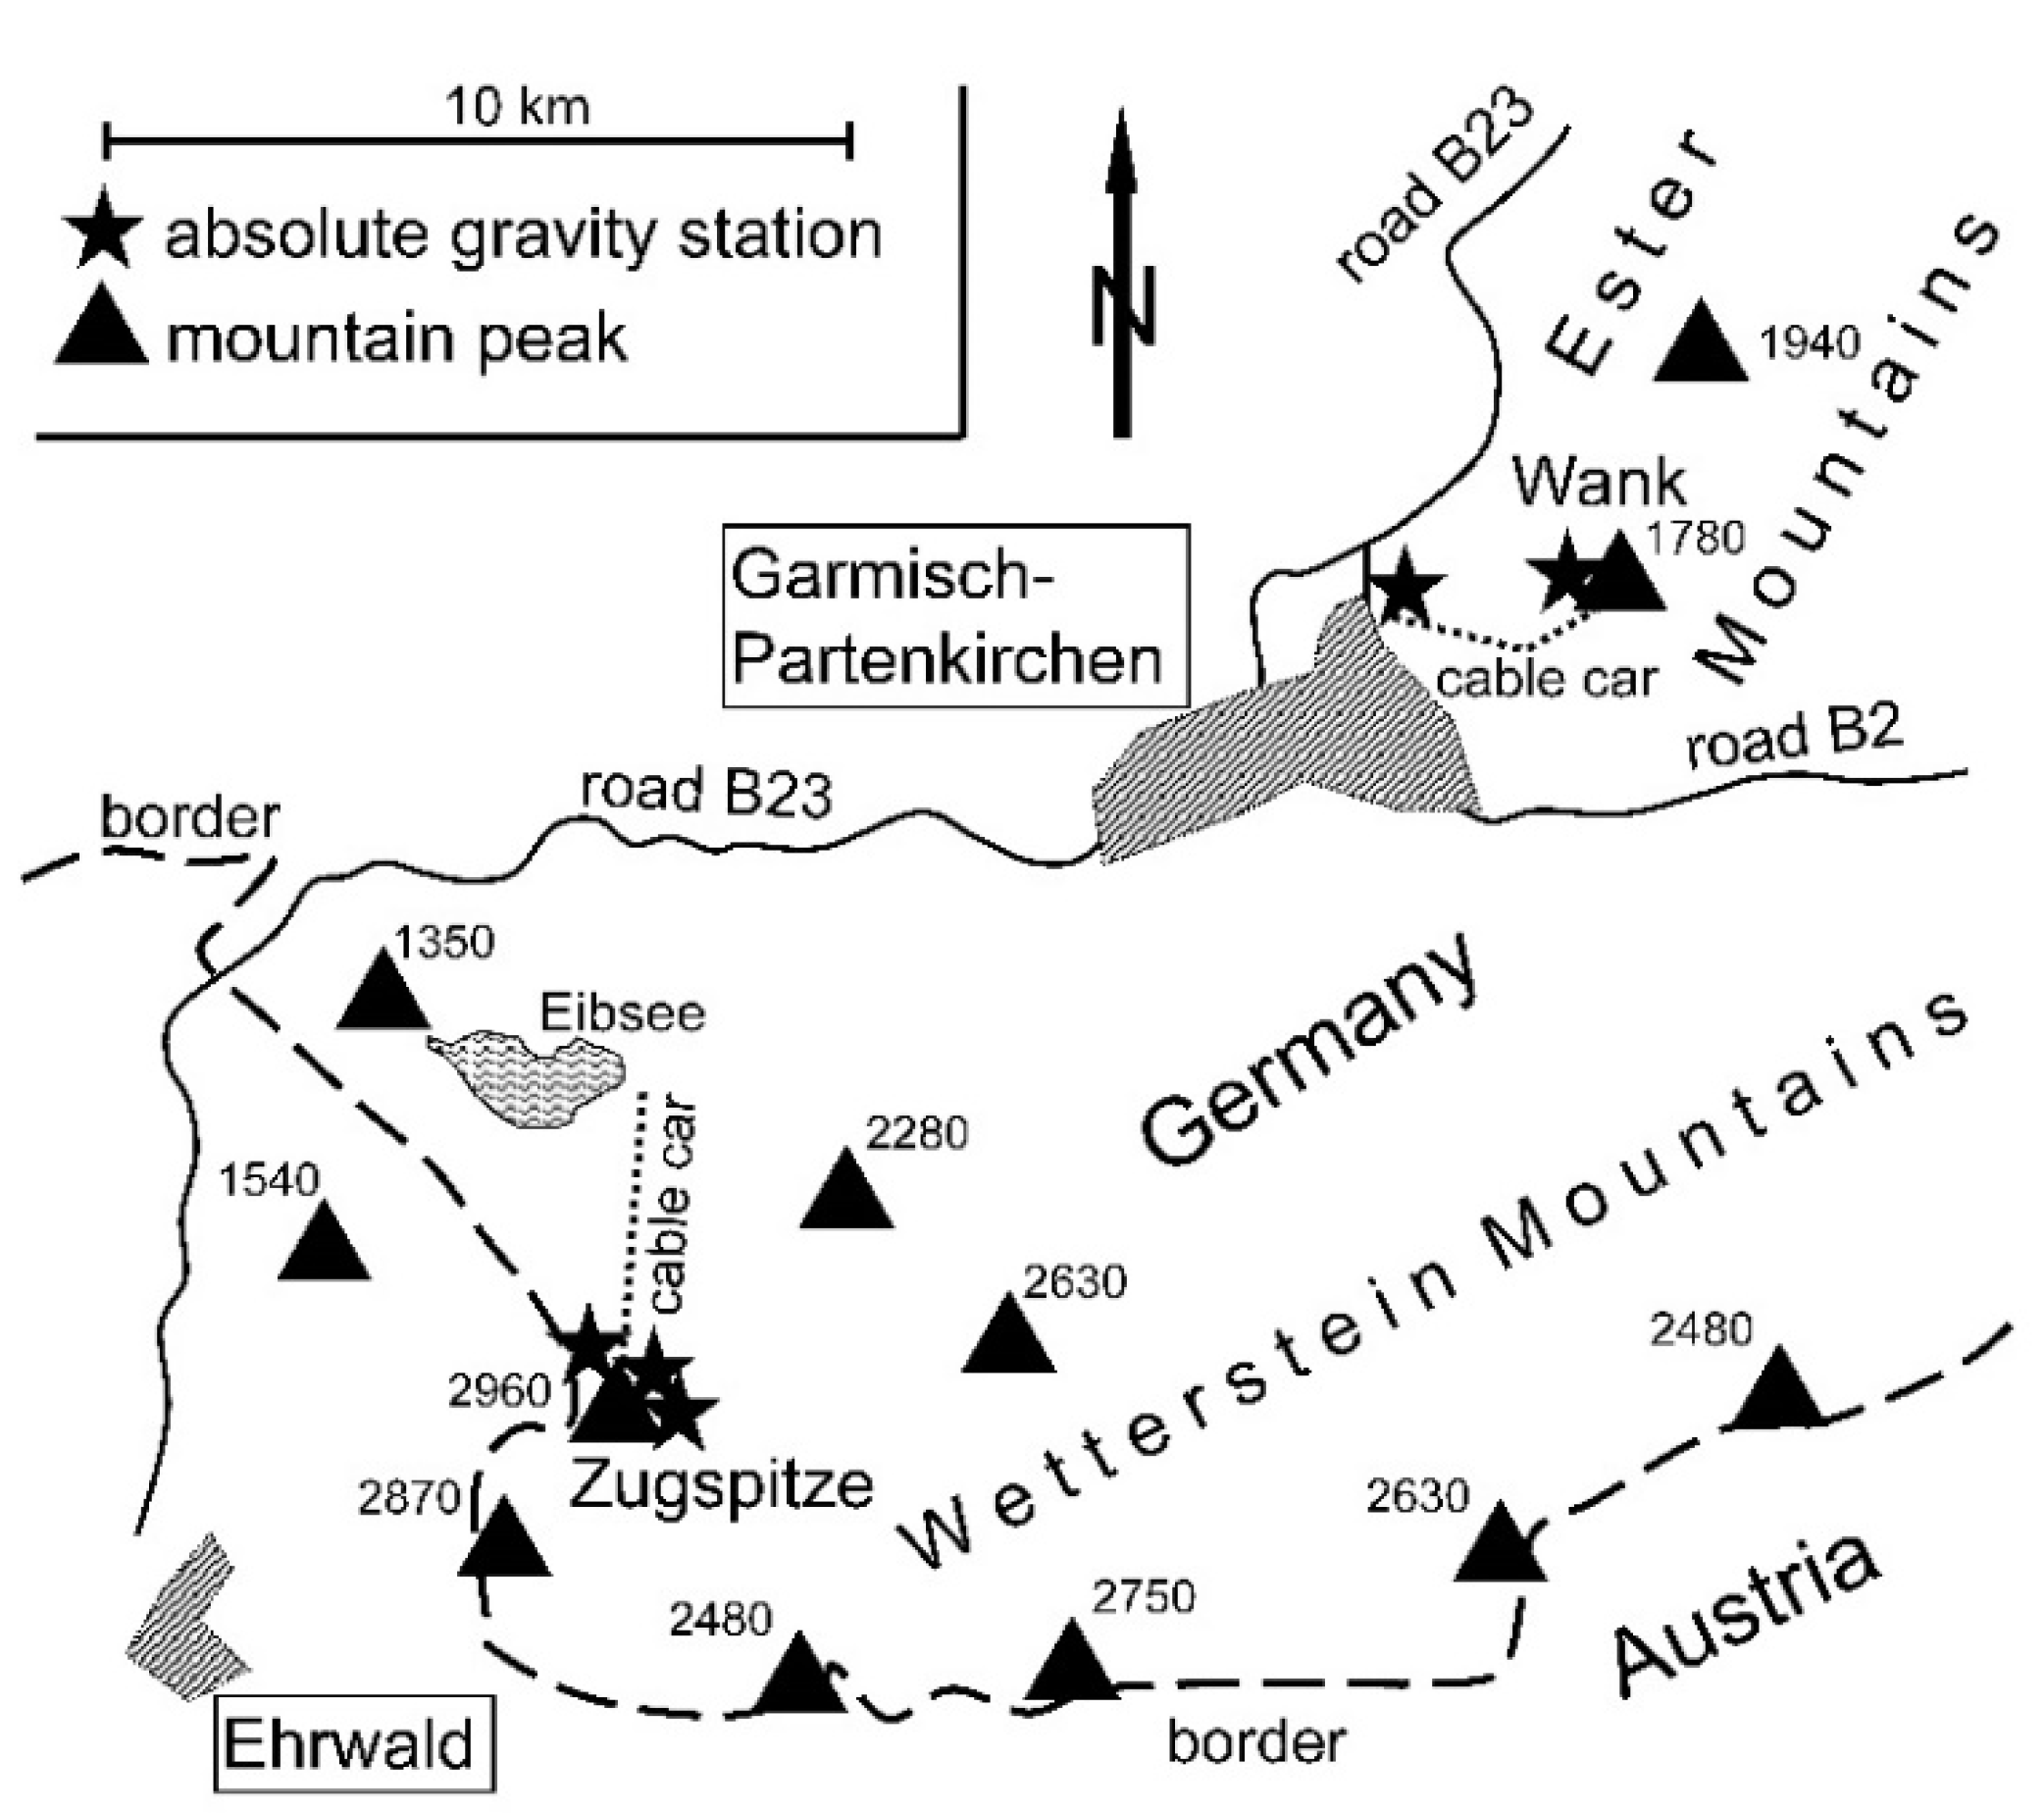
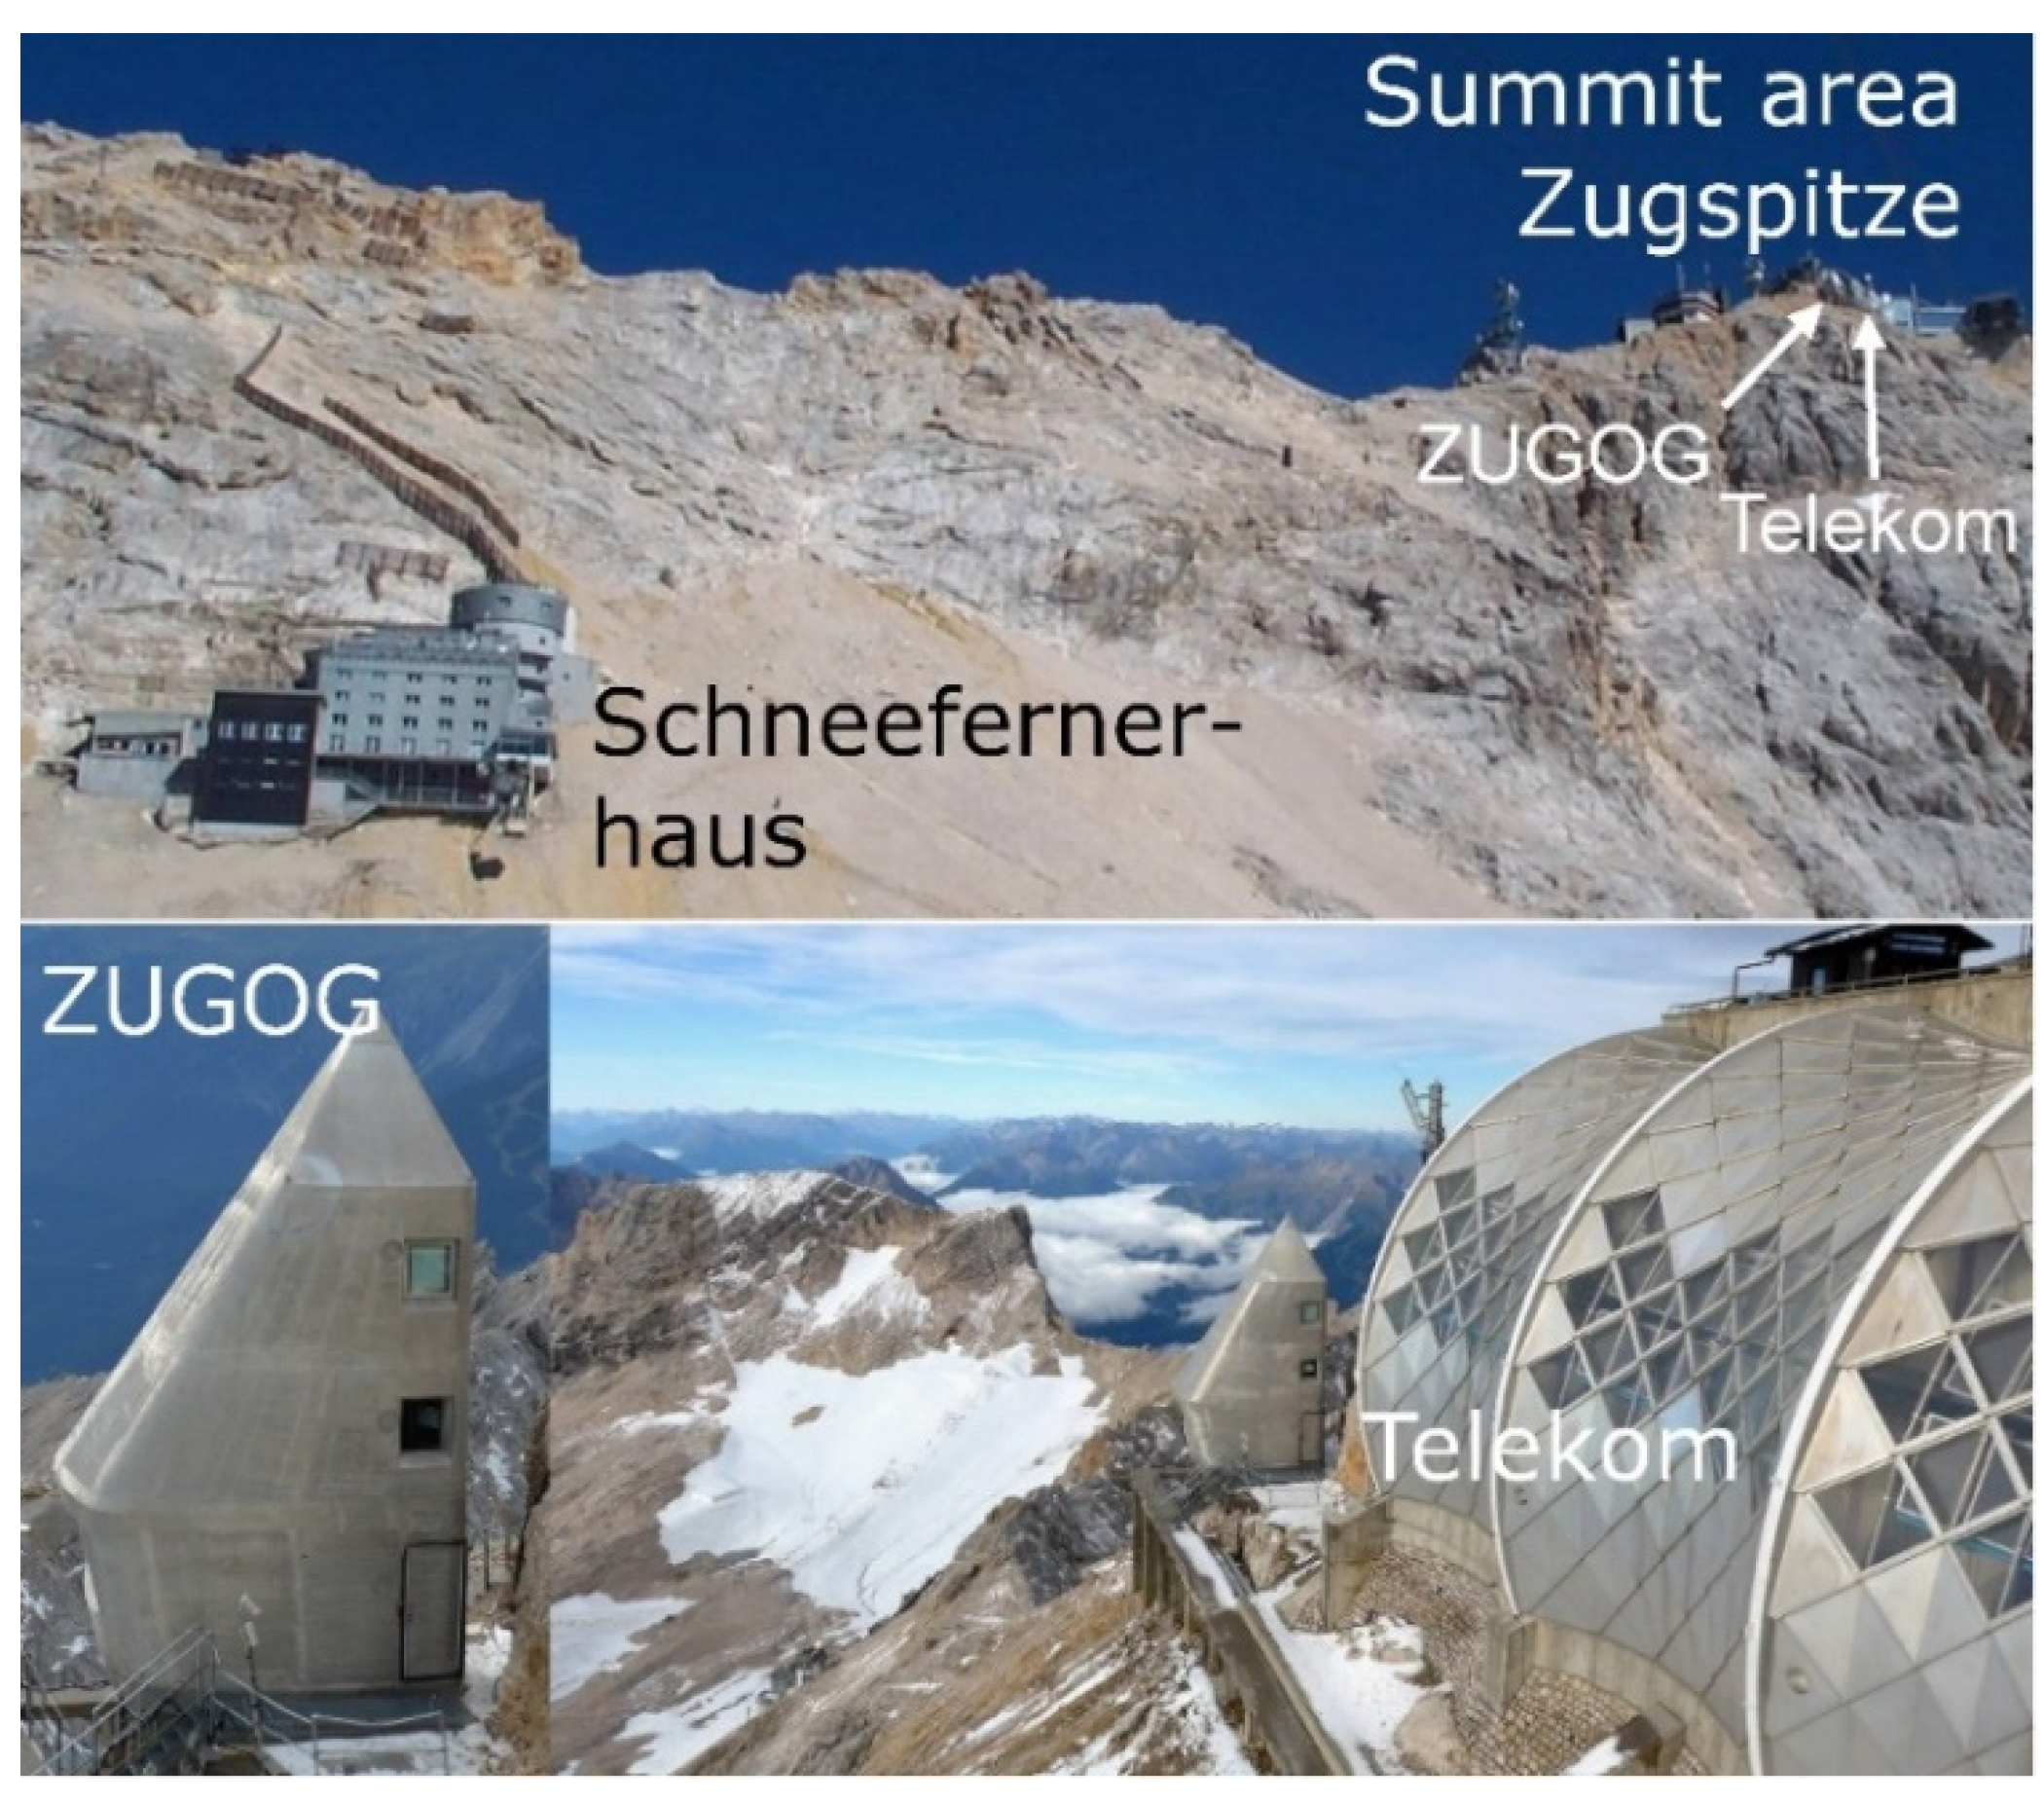
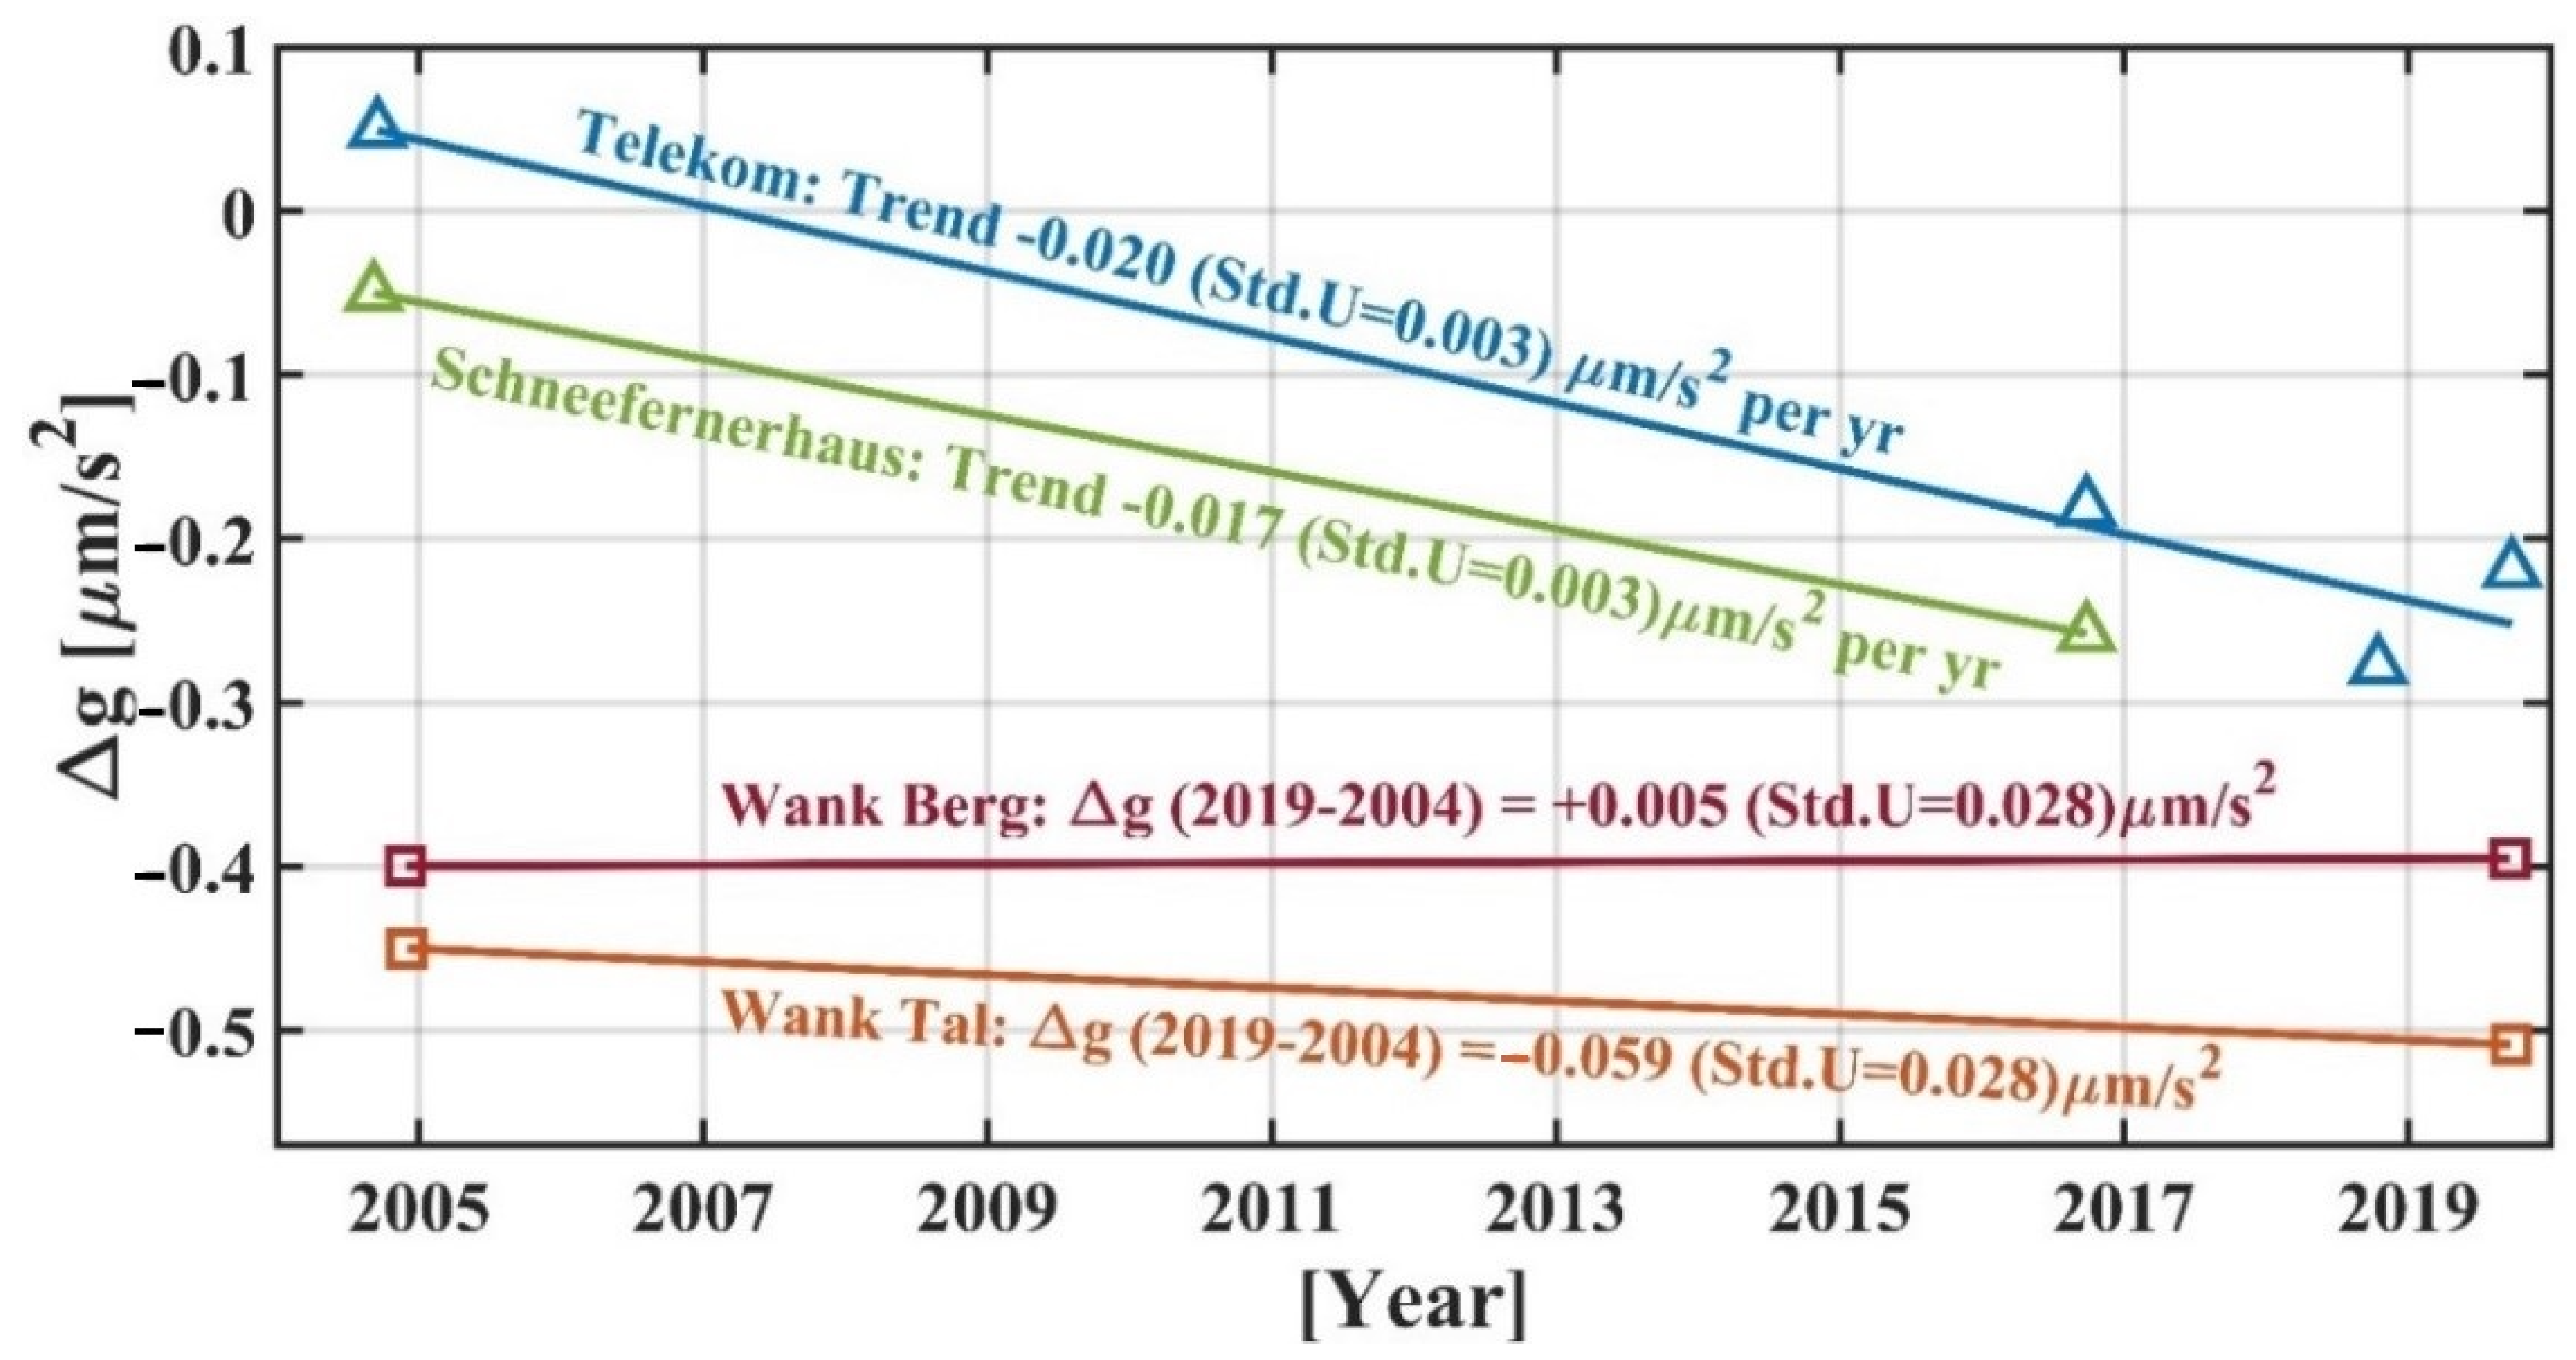
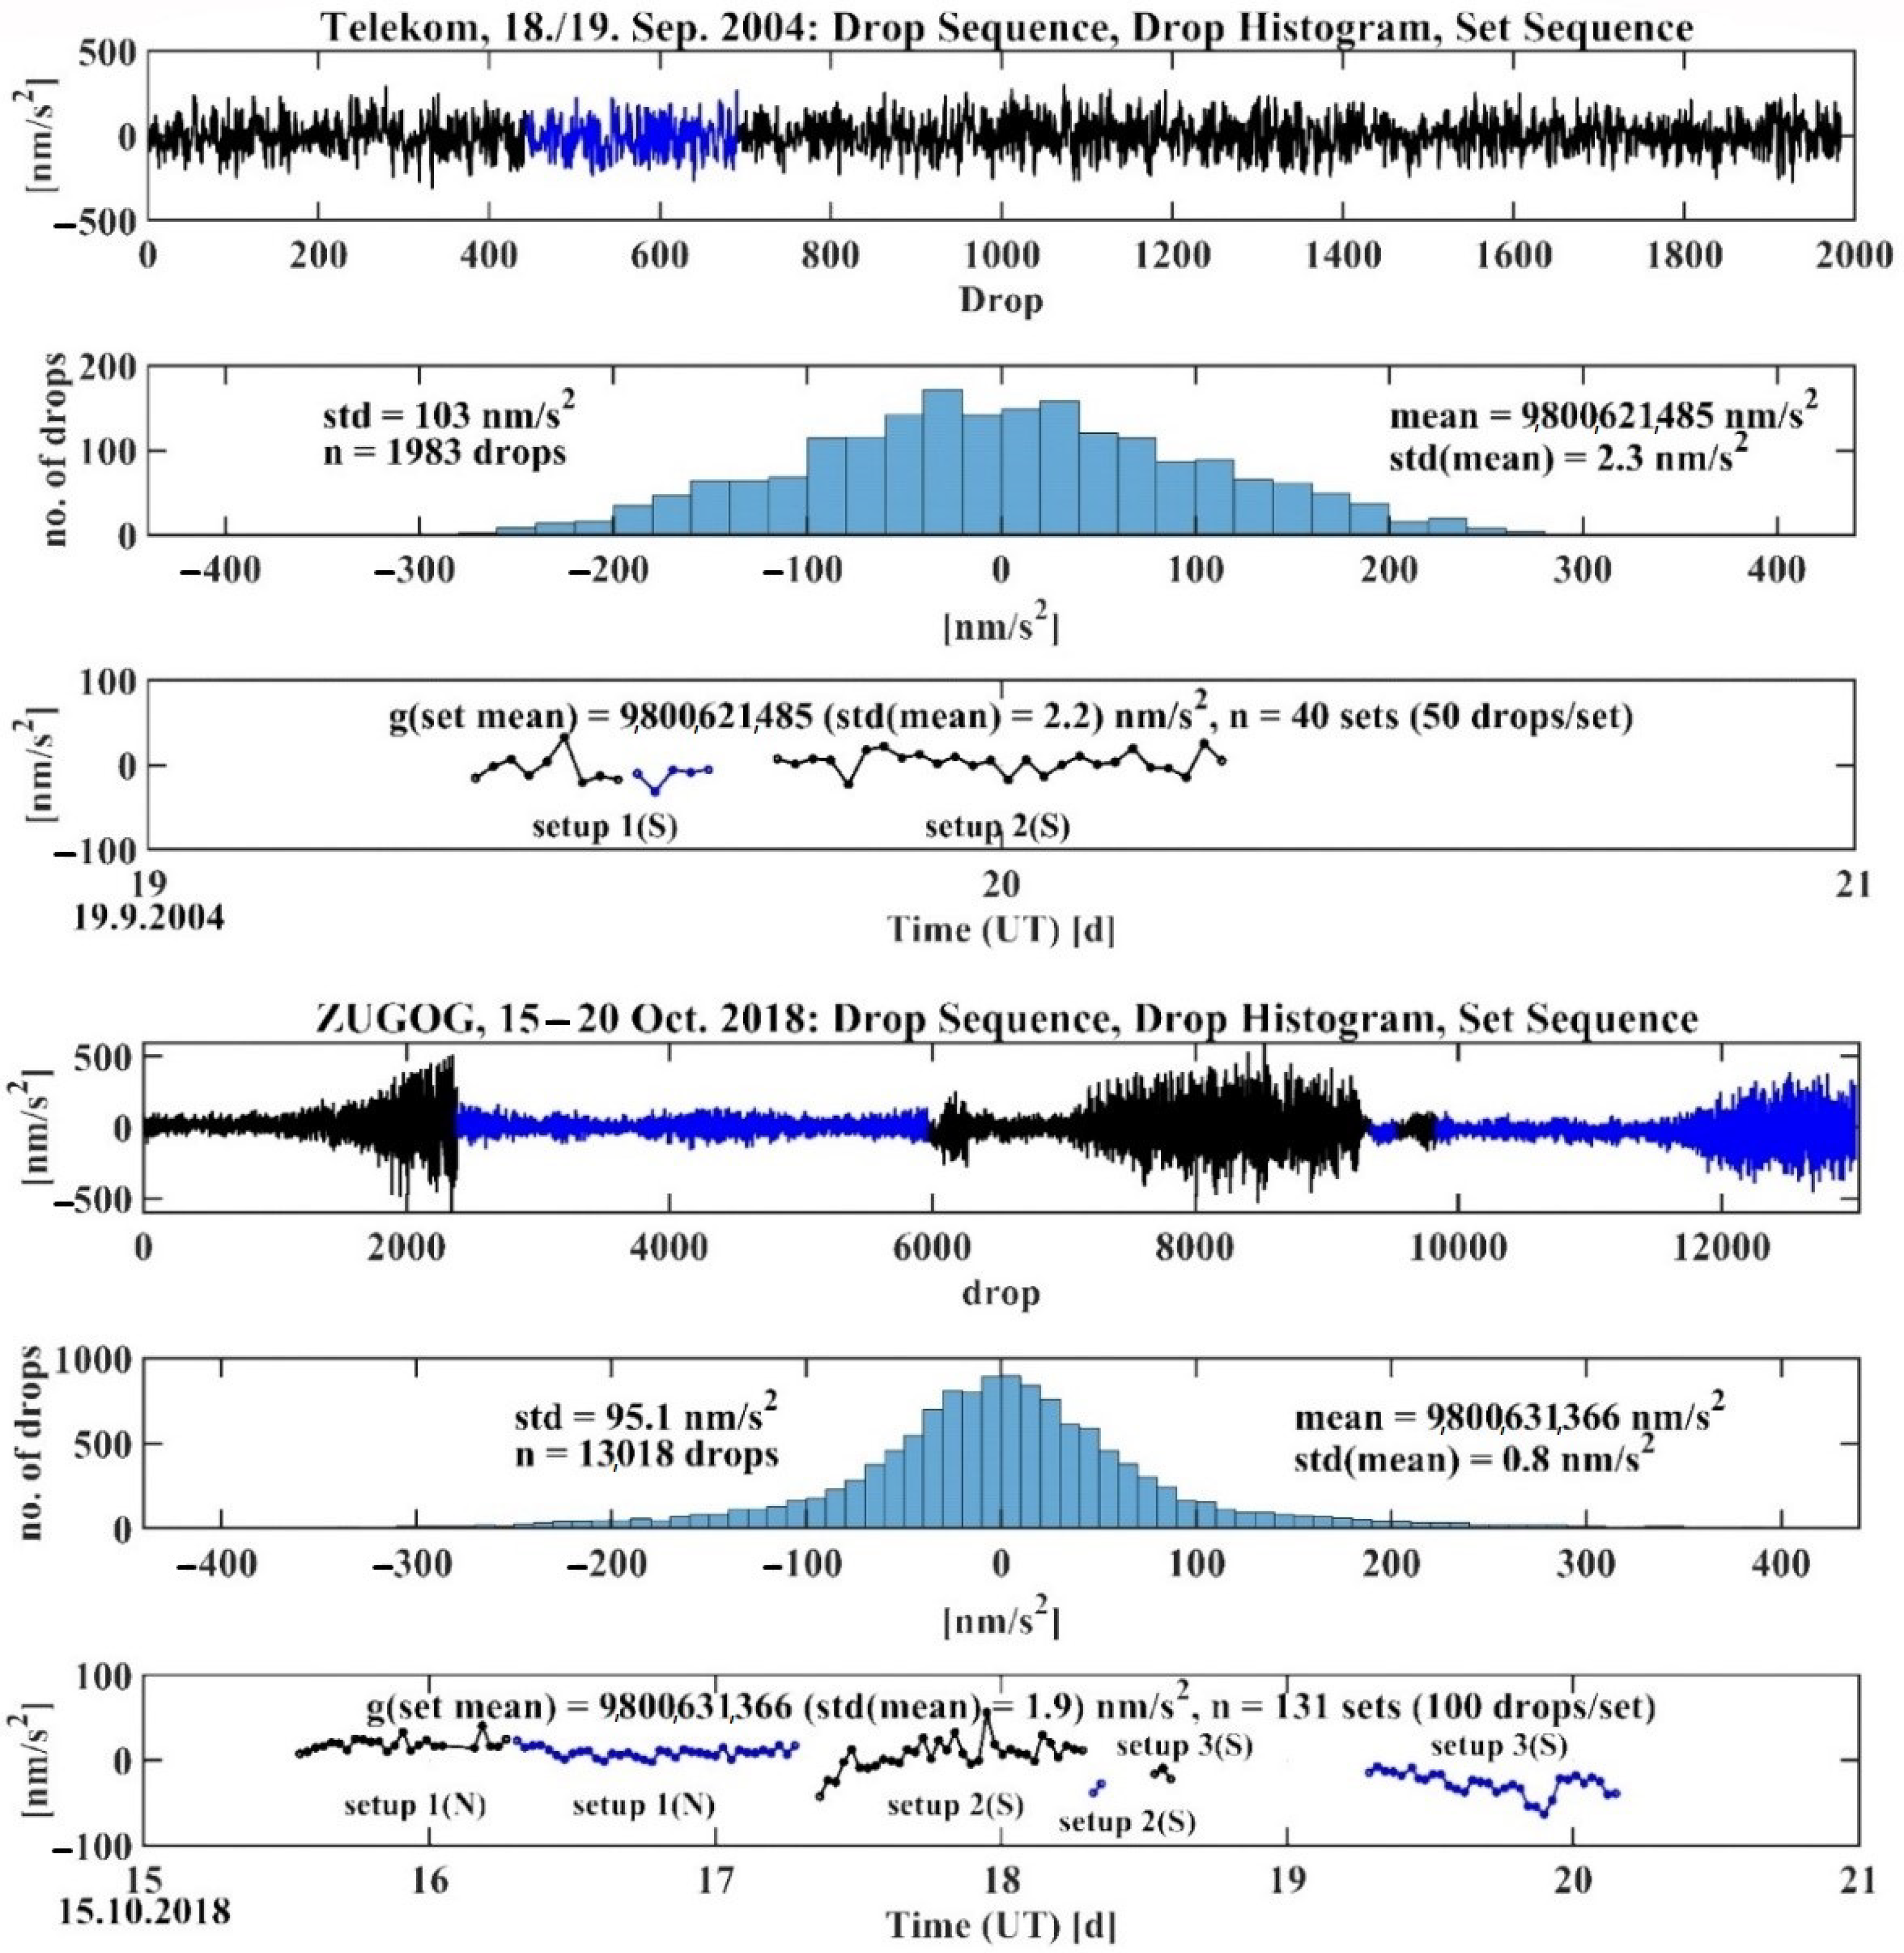
2.1.3. Absolute Gravimetric Measurements at Mt. Zugspitze and Mt. Wank since 2004
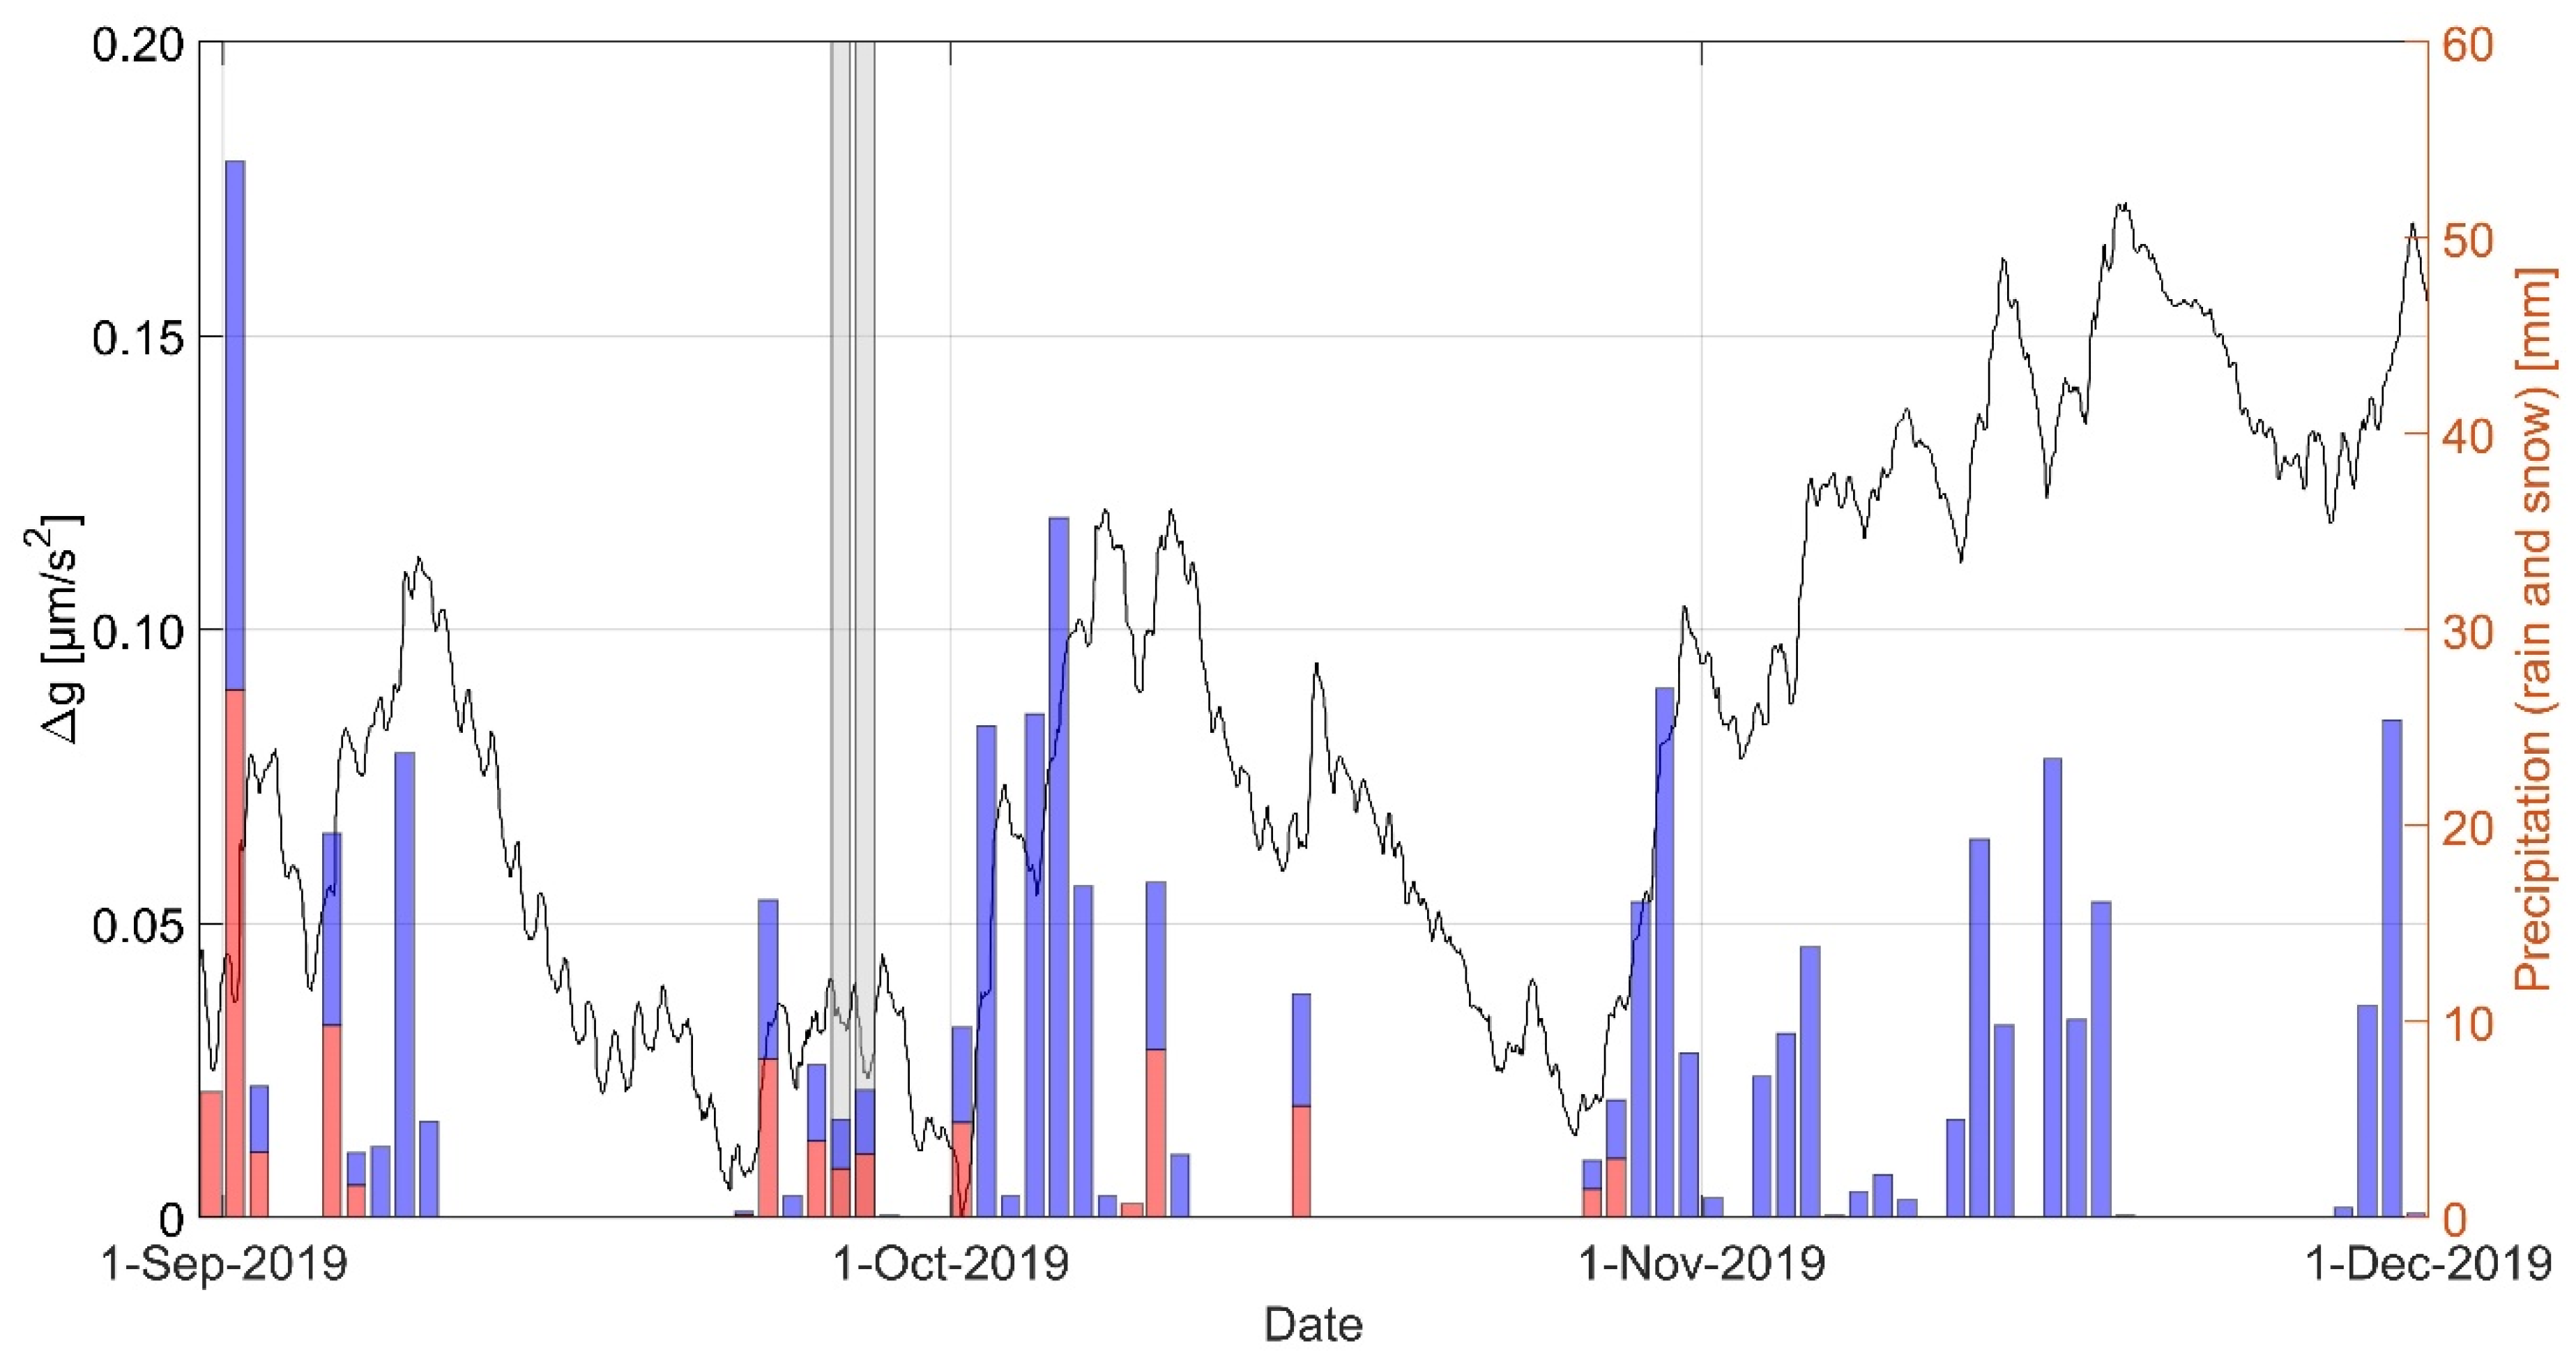
2.2. Superconducting Gravimetry
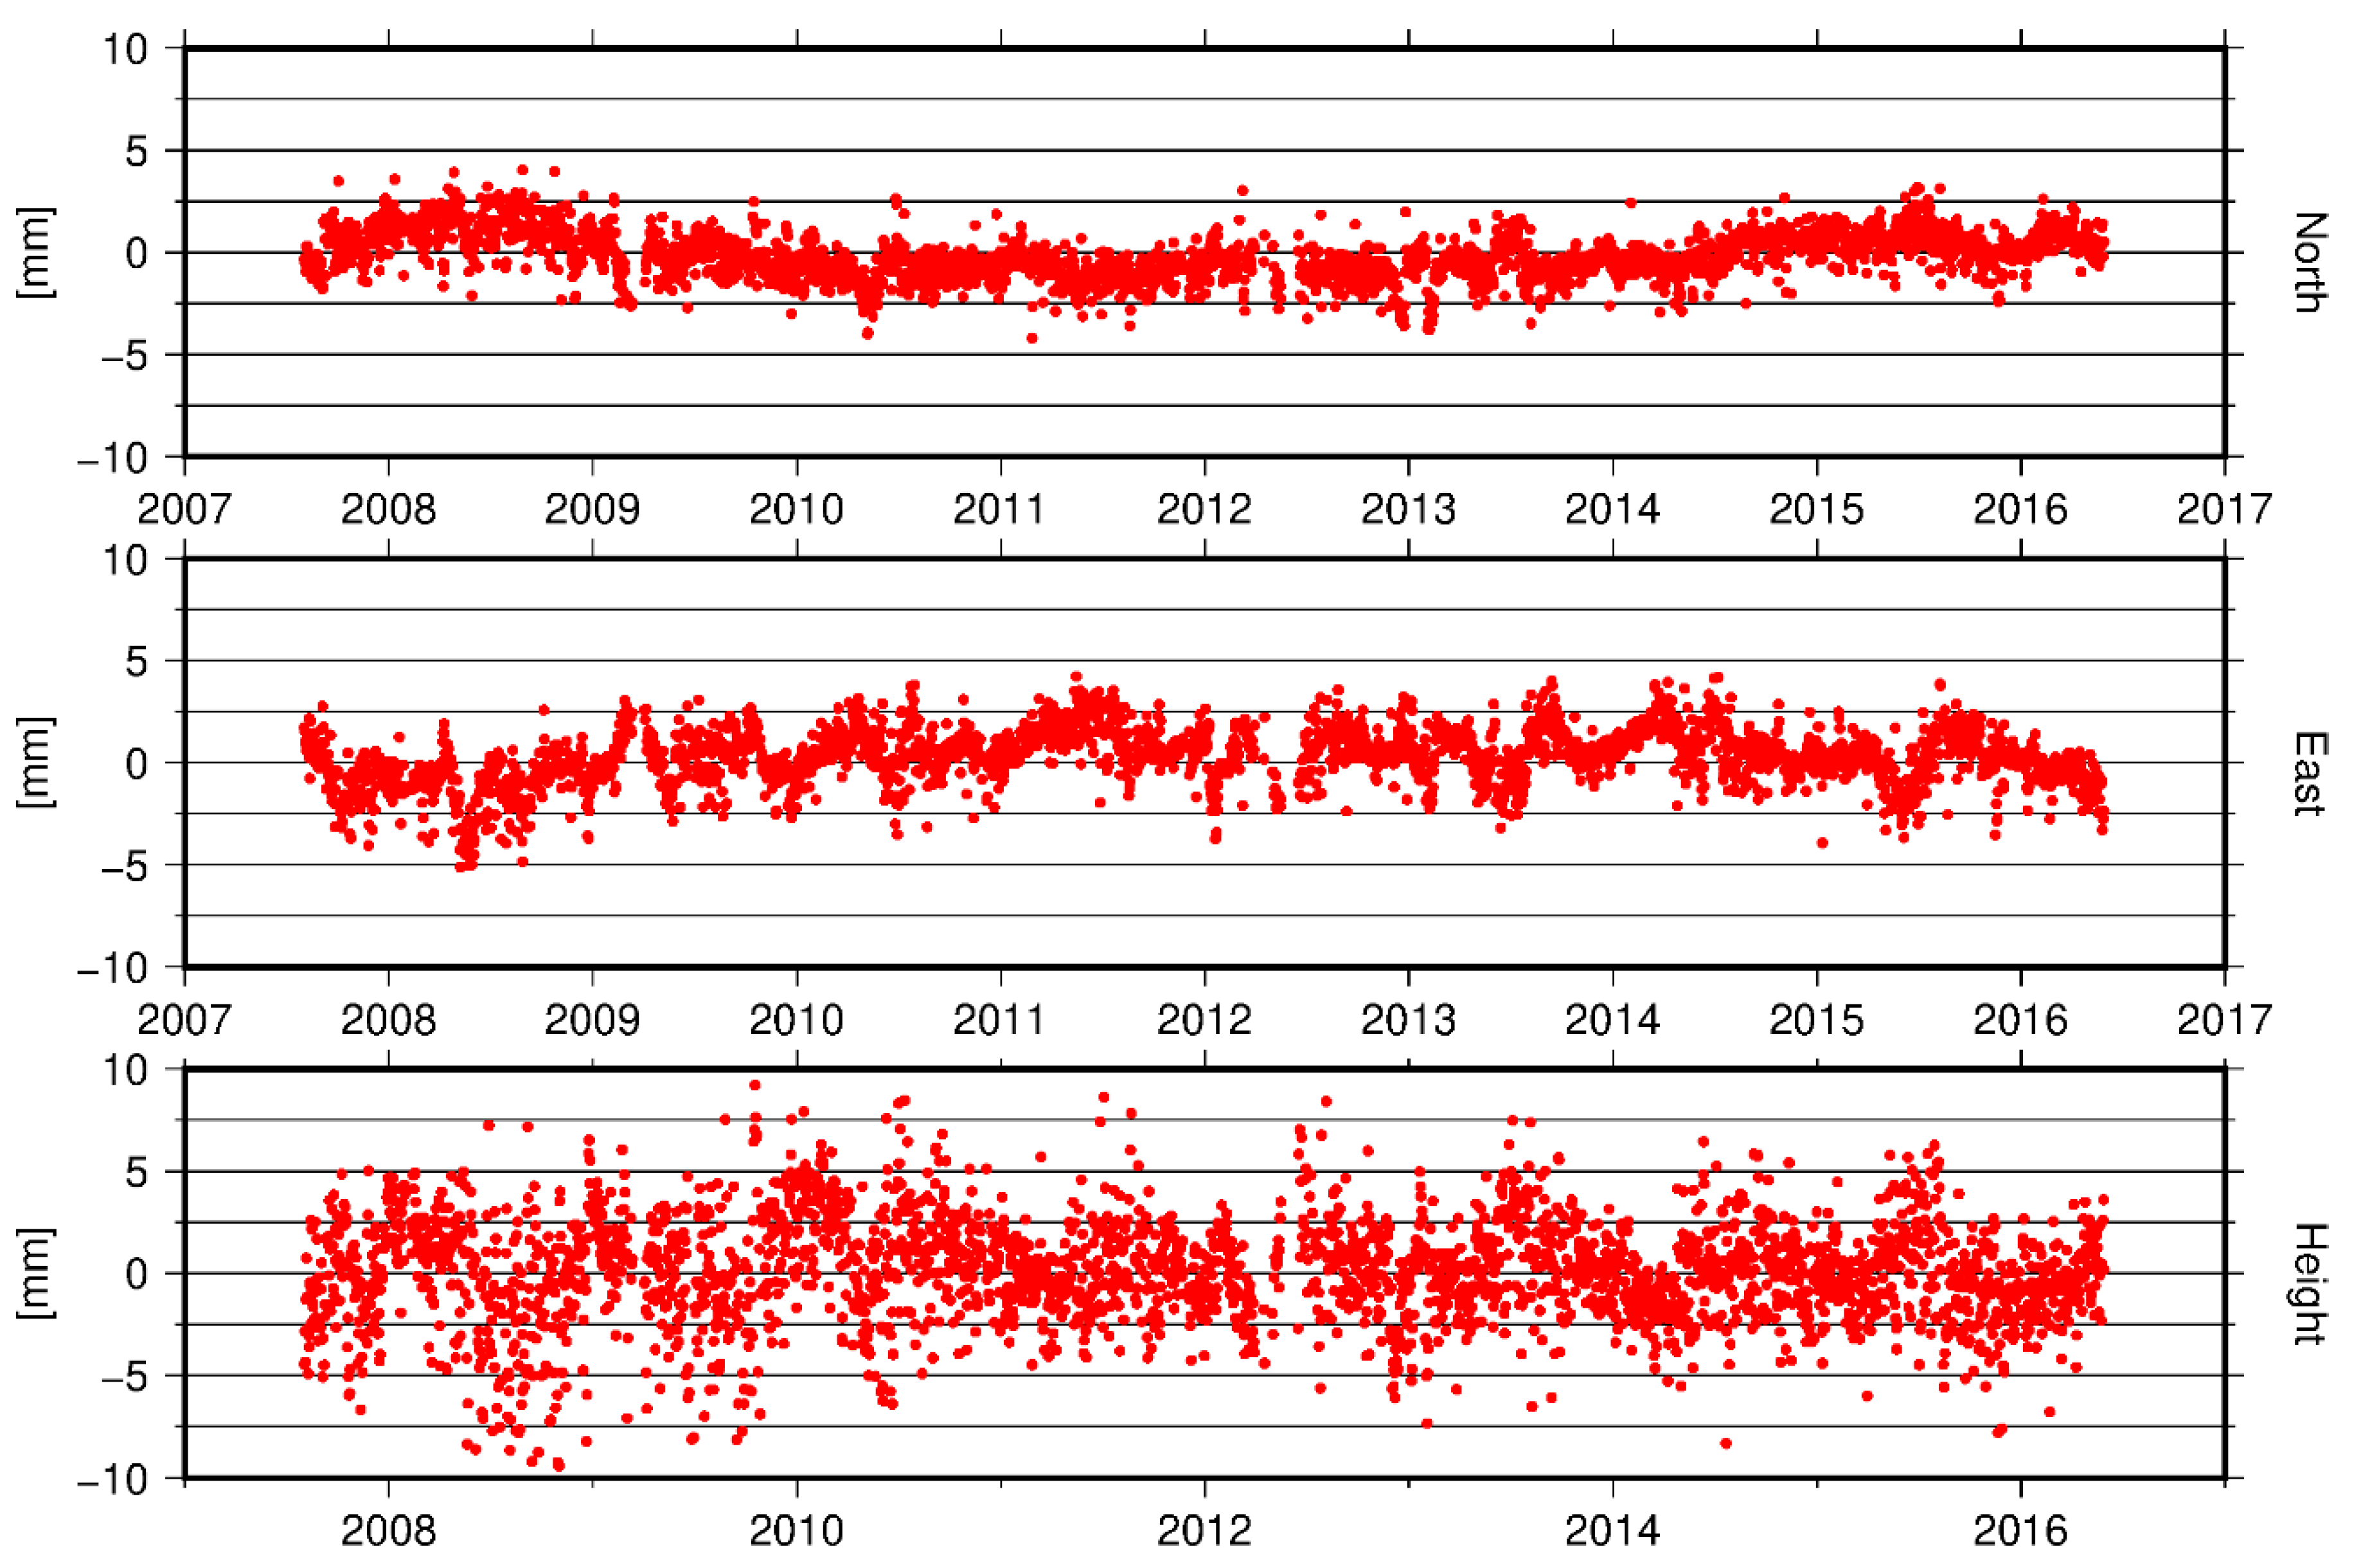
2.3. GNSS Observations
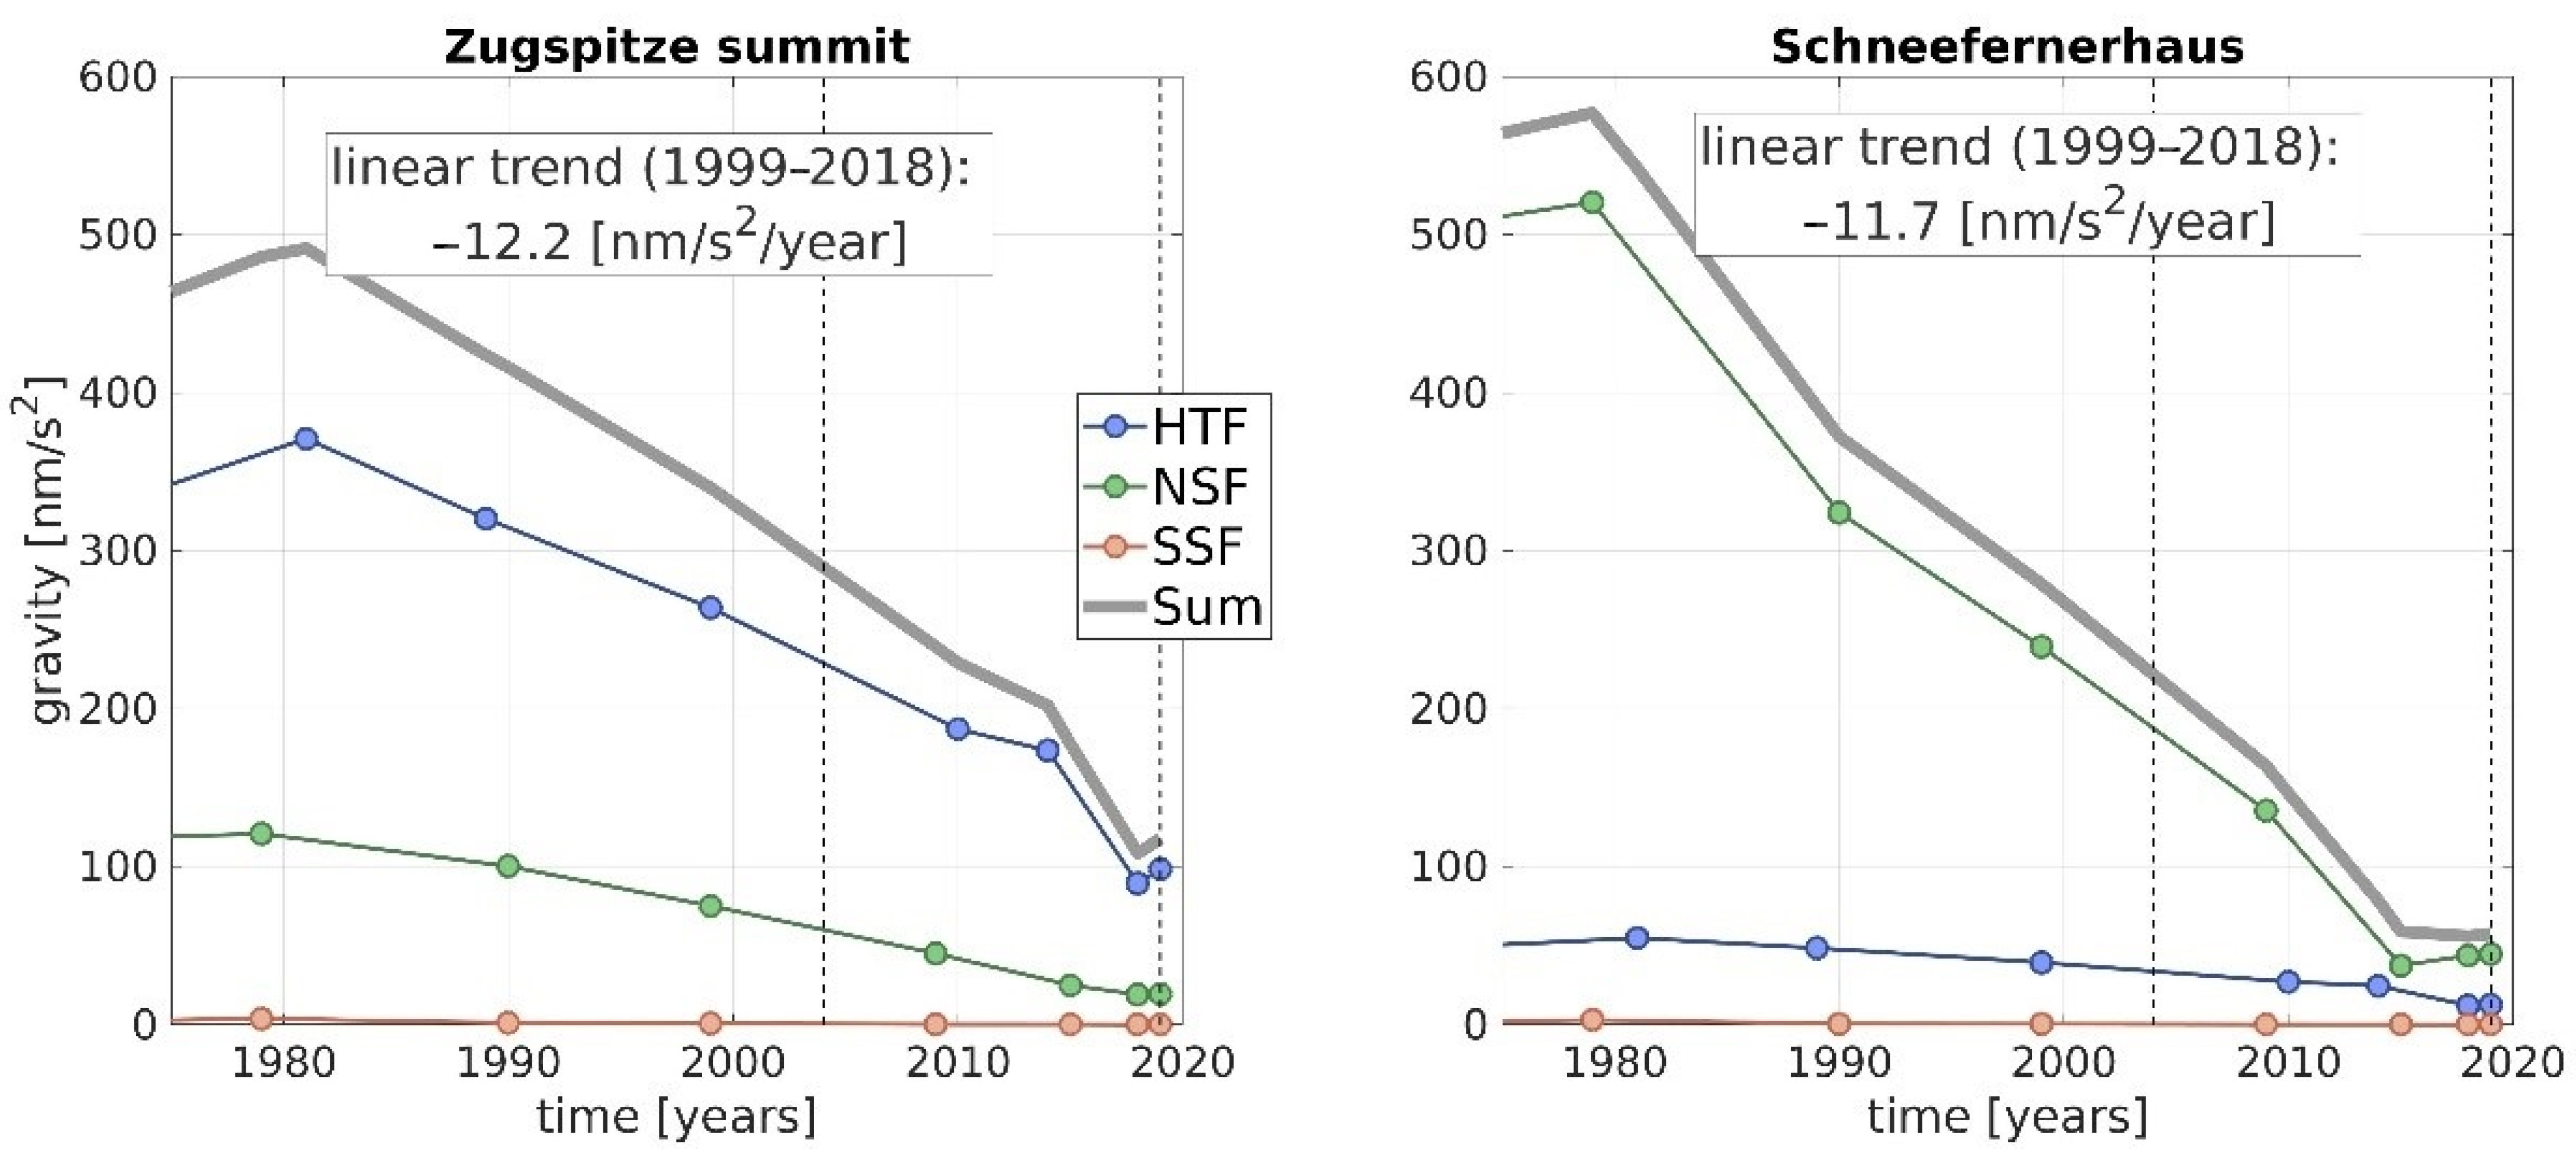
3. Results Compared with Predicted Secular Variations Caused by Glacier Retreat
4. Summary and Conclusions
Author Contributions
Funding
Data Availability Statement
Acknowledgments
Conflicts of Interest
Appendix A

| Frequency [cpd] [cpd] | Ampl. | Phase | Tide | |
|---|---|---|---|---|
| Start | End | Factor | Lead [°] | Symbol |
| 0.000000 | 0.000001 | 1.00000 | 0.0000 | DC |
| 0.000100 | 0.004107 | 1.16000 | 0.0000 | Long |
| 0.004108 | 0.020884 | 1.16000 | 0.0000 | SSA |
| 0.020885 | 0.054747 | 1.15470 | 7.5156 | MM |
| 0.054748 | 0.091348 | 1.09556 | 5.7125 | MF |
| 0.091349 | 0.122801 | 1.37233 | −8.4336 | MTM |
| 0.122802 | 0.501369 | 0.93361 | 15.5671 | MQM |
| 0.501370 | 0.911390 | 1.14762 | −0.2793 | Q1 |
| 0.911391 | 0.947991 | 1.15066 | 0.0377 | O1 |
| 0.947992 | 0.981854 | 1.14759 | 0.2371 | NO1 |
| 0.981855 | 0.998631 | 1.15131 | 0.0423 | P1 |
| 0.998632 | 1.001369 | 1.35650 | 22.1020 | S1 |
| 1.001370 | 1.023622 | 1.13835 | 0.1450 | K1 |
| 1.023623 | 1.035379 | 1.15820 | 1.1338 | TET1 |
| 1.035380 | 1.057485 | 1.15392 | 0.2098 | J1 |
| 1.057486 | 1.071833 | 1.12218 | −0.0208 | SO1 |
| 1.071834 | 1.470243 | 1.14903 | 0.3559 | OO1 |
| 1.470244 | 1.880264 | 1.16169 | 2.2840 | 2N2 |
| 1.880265 | 1.914128 | 1.17266 | 2.0763 | N2 |
| 1.914129 | 1.950419 | 1.18621 | 1.5197 | M2 |
| 1.950420 | 1.984282 | 1.17365 | 2.6148 | L2 |
| 1.984283 | 2.002736 | 1.18443 | 0.1055 | S2 |
| 2.002737 | 2.451943 | 1.18732 | 0.4413 | K2 |
| 2.451944 | 3.381378 | 1.07683 | −0.1141 | M3 |
| 3.381379 | 4.347615 | 0.06782 | 37.7596 | M4 |
| 4.347616 | 7.000000 | 2.68314 | 125.1959 | M5 |
| Site | Orientation: N(North)/S(South) | Mean Epoch | Drops | g1.200 m [μm/s2] | Std.dev. (Single gi) |
|---|---|---|---|---|---|
| Wank Berg (2004), δg/δh = −3.877 μm/s2/m, href =1.200 m | |||||
| Run 1/setup1 | S | 1 December 2004,10:19 | 198 | 9,803,733.437 | |
| Run 2/setup1 | S | 1 December 2004, 4:27 | 596 | 9,803,733.463 | |
| Run 3/setup2 | N | 2 December 2004, 00:40 | 1196 | 9,803,733.473 | |
| Average | 1990 | 9,803,733.465 | 0.085 | ||
| Wank Berg (2019), δg/δh = −3.877 μm/s2/m, href =1.200 m | |||||
| Run 1/setup1 | S | 20 September 2019, 22:38 | 1193 | 9,803,733.483 | |
| Run 2/setup2 | N | 21 September 2019, 21:32 | 1197 | 9,803,733.457 | |
| Average | 2390 | 9,803,733.470 | 0.033 | ||
| Wank Tal (2004), δg/δh = −2.847μm/s2/m, href =1.200 m | |||||
| Run 1/setup1 | S | 3 December 2004, 13:20 | 150 | 9,805,844.342 | |
| Run 2/setup1 | S | 3 December 2004, 15:14 | 150 | 9,805,844.335 | |
| Run 3/setup1 | S | 4 December 2004, 00:54 | 1392 | 9,805,844.296 | |
| Run 4/setup2 | N | 4 December 2004, 14:06 | 698 | 9,805,844.348 | |
| Run 5/setup2 | N | 4 December 2004, 21:32 | 799 | 9,805,844.362 | |
| Average | 3189 | 9,805,844.330 | 0.105 | ||
| Wank Tal (2019), δg/δh = −2.847μm/s2/m, href =1.200 m | |||||
| Run 1/setup1 | S | 23 September 2019, 20:03 | 1197 | 9,805,844.276 | |
| Run 2/setup2 | W | 24 September 2019, 12:27 | 797 | 9,805,844.267 | |
| Average | 1994 | 9,805,844.271 | 0.061 | ||
| Session | Orientation: N(North)/S(South) | Mean Epoch | Drops | ghref [μm/s2] | Std.dev. (Single gi) |
|---|---|---|---|---|---|
| Zugspitze Telekom (2004), δg/δh = −4.653 μm/s2/m, href =1.200 m | |||||
| Run 1/setup1 | S | 18 September 2004, 11:14 | 442 | 9,800,621.483 | |
| Run 2/setup1 | S | 18 September 2004, 14:47 | 249 | 9,800,621.475 | |
| Run 3/setup2 | S | 18 September 2004, 23:58 | 1292 | 9,800,621.490 | |
| Average | 1983 | 9,800,621.485 | 0.103 | ||
| Schneefernerhaus 200 (2004), δg/δh = −3.505 μm/s2/m, href =1.200 m | |||||
| Run 1/setup1 | N | 9 September 2004, 17:28 | 546 | 9,801,546.893 | |
| Run 2/setup2 | N | 10 September 2004, 01:03 | 938 | 9,801,546.854 | |
| Average | 1484 | 9,801,546.873 | 0.148 | ||
| Schneefernerhaus 202 (2016), δg/δh = −3.416 μm/s2/m, href =1.250 m | |||||
| Run 1/setup1 | ESE | 28 September 2016, 13:56 | 598 | 9,801,547.864 | 0.075 |
| Zugspitze ZUGOG (2018), δg/δh = −5.045 μm/s2/m, href =1.250 m | |||||
| Run 1/setup1 | N | 15 October 2018, 21:12 | 2386 | 9,800,631.389 | |
| Run 2/setup1 | N | 16 October 2018, 19:01 | 3584 | 9,800,631.378 | |
| Run 3/setup2 | S | 17 October 2018, 19:47 | 3366 | 9,800,631.368 | |
| Run 4/setup2 | S | 18 October 2018, 08:03 | 198 | 9,800,631.337 | |
| Run 5/setup3 | S | 18 October 2018, 13:34 | 298 | 9,800,631.355 | |
| Run 6/setup3 | S | 19 October 2018, 17:14 | 3186 | 9,800,631.348 | |
| Average | 13,018 | 9,800,631.366 | 0.095 | ||
| Zugspitze ZUGOG (2019), δg/δh = −5.045 μm/s2/m, href =1.250 m | |||||
| Run 1/setup1 | N | 26 September 2019, 10:18 | 194 | 9,800,631.451 | |
| Run 2/setup1 | N | 26 September 2019, 20:24 | 1798 | 9,800,631.452 | |
| Run 3/setup2 | S | 27 September 2019, 11:41 | 485 | 9,800,631.432 | |
| Average | 2477 | 9,800,631.442 | 0.091 | ||

References
- Schmid, S.M.; Fügenschuh, B.; Kissling, E.; Schuster, R. Tectonic map and overall architecture of the Alpine orogen. Eclogae Geol. Helv. 2004, 97, 93–117. [Google Scholar] [CrossRef]
- Mey, J.; Scherler, D.; Wickert, A.D.; Egholm, D.L.; Tesauro, M.; Schildgen, T.F.; Strecker, M.R. Glacial isostatic uplift of the European Alps. Nat. Commun. 2016, 7, 13382. [Google Scholar] [CrossRef] [PubMed]
- Ruess, D.; Mitterschiffthaler, P. Rezente Höhenänderungen in Österreich abgeleitet aus geodätischen Wiederholungsmessungen. In Proceedings of the 18th International Geodetic Week, Obergurgl, Austria, 8–14 February 2015; Hanke, K., Weinhold, T., Eds.; Herbert Wichmann Verlag, VDE VERLAG GMBH: Berlin/Offenbach, Germany, 2015; pp. 111–123, ISBN 978-3-87907-554-6. [Google Scholar]
- Sánchez, L.; Völksen, C.; Sokolov, A.; Arenz, H.; Seitz, F. Present-day surface deformation of the Alpine region inferred from geodetic techniques. Earth Syst. Sci. Data 2018, 10, 1503–1526. [Google Scholar] [CrossRef]
- Barletta, V.R.; Ferrari, C.; Diolaiuti, G.; Carnielli, T.; Sabadini, R.; Smiraglia, C. Glacier shrinkage and modeled uplift of the Alps. Geophys. Res. Lett. 2006, 33, L14307. [Google Scholar] [CrossRef]
- Stocchi, P.; Spada, G.; Cianetti, S. Isostatic rebound following the Alpine deglaciation: Impact on the sea level variations and vertical movements in the Mediterranean region. Geophys. J. Int. 2005, 162, 137–147. [Google Scholar] [CrossRef]
- Sigmund, A.; Freier, K.; Rehm, T.; Ries, L.; Schunk, C.; Menzel, A.; Thomas, C.K. Multivariate statistical air mass classification for the high-alpine observatory at the Zugspitze Mountain, Germany. Atmos. Chem. Phys. 2019, 19, 12477–12494. [Google Scholar] [CrossRef]
- Risius, S.; Xu, H.; Di Lorenzo, F.; Xi, H.; Siebert, H.; Shaw, R.A.; Bodenschatz, E. Schneefernerhaus as a mountain research station for clouds and turbulence. Atmos. Meas. Tech. 2015, 8, 3209–3218. [Google Scholar] [CrossRef]
- Hürkamp, K.; Zentner, N.; Reckerth, A.; Weishaupt, S.; Wetzel, K.-F.; Tschiersch, J.; Stumpp, C. Spatial and temporal variability of snow isotopic composition on Mt. Zugspitze, Bavarian Alps, Germany. J. Hydrol. Hydromech. 2019, 67, 49–58. [Google Scholar] [CrossRef]
- Weber, M.; Bernhardt, M.; Pomeroy, J.W.; Fang, X.; Härer, S.; Schulz, K. Description of current and future snow processes in a small basin in the Bavarian Alps. Environ. Earth Sci. 2016, 75, 1223. [Google Scholar] [CrossRef]
- Gallemann, T.; Haas, U.; Teipel, U.; von Poschinger, A.; Wagner, B.; Mahr, M.; Bäse, F. Permafrost-Messstation am Zugspitzgipfel: Ergebnisse und Modellberechnungen; UmweltSpezial, Geologica Bavaria 115; Bayerisches Landesamt f. Umwelt (LfU): Augburg, Germany, 2017; 77p. [Google Scholar]
- Murton, J.B.; Peterson, R.; Ozouf, J.-C. Bedrock Fracture by Ice Segregation in Cold Regions. Science 2006, 314, 1127–1129. [Google Scholar] [CrossRef]
- Gerlach, C.; Ackermann, C.; Falk, R.; Lothhammer, A.; Reinhold, A. Gravimetric investigations at Vernagtferner. In International Symposium on Gravity, Geoid and Height Systems 2016, IAG Symposia; Springer: Cham, Switzerland, 2017; Volume 148, pp. 53–60. [Google Scholar] [CrossRef]
- Scandroglio, R.; Heinze, M.; Schröder, T.; Pail, R.; Krautblatter, M. A first attempt to reveal hydrostatic pressure in permafrost-affected rock slopes with relative gravimetry. Geophys. Res. Abst. 2019, 21, EGU2019-12870. [Google Scholar]
- Voigt, C.; Schulz, K.; Koch, F.; Wetzel, K.-F.; Timmen, L.; Rehm, T.; Pflug, H.; Stolarczuk, N.; Förste, C.; Flechtner, F. Introduction of a superconducting gravimeter as novel hydrological sensor in the alpine research catchment Zugspitze. Hydrol. Earth Syst. Sc. 2021. submitted on 5 February 2021. [Google Scholar]
- Niebauer, T.M.; Sasagava, G.S.; Faller, J.E.; Hilt, R.; Klopping, F. A new generation of absolute gravimeters. Metrologia 1995, 32, 159–180. [Google Scholar] [CrossRef]
- Faller, J.E.; Guo, Y.G.; Geschwind, J.; Niebauer, T.M.; Rinker, R.L.; Xue, J. The JILA portable absolute gravity apparatus. Bur. Grav. Int. Bull d’Inf. 1983, 53, 87–97. [Google Scholar]
- Niebauer, T.M.; Billson, R.; Ellis, B.; Mason, B.; van Westrum, D.; Klopping, F. Simultaneous gravity and gradient measurements from a recoil-compensated absolute gravimeter. Metrologia 2011, 48, 154–163. [Google Scholar] [CrossRef]
- Timmen, L.; Gitlein, O.; Klemann, V.; Wolf, D. Observing Gravity Change in the Fennoscandian Uplift Area with the Hanover Absolute Gravimeter. Pure Appl. Geophys. 2012, 169, 1331–1342. [Google Scholar] [CrossRef][Green Version]
- Schilling, M.; Timmen, L. Traceability of the Hannover FG5X-220 to the SI Units. In International Symposium on Earth and Environmental Sciences for Future Generations, IAG Symp; Springer: Cham, Switzerland, 2016; Volume 147, pp. 69–75. [Google Scholar] [CrossRef]
- Marti, U.; Richard, P.; Germak, A.; Vitushkin, L.; Pálinkáš, V.; Wilmes, H. CCM—IAG Strategy for Metrology in Absolute Gravimetry. Available online: https://www.bipm.org/wg/CCM/CCM-WGG/Allowed/2015-meeting/CCM_IAG_Strategy.pdf (accessed on 12 December 2020).
- Jiang, Z.; Pálinkáš, V.; Arias, F.E.; Liard, J.; Merlet, S.; Wilmes, H.; Vitushkin, L.; Robertsson, L.; Tisserand, L.; Pereira Dos Santos, F.; et al. The 8th International Comparison of Absolute Gravimeters 2009: The first Key Comparison (CCM.G-K1) in the field of absolute gravimetry. Metrologia 2009, 49, 666–684. [Google Scholar] [CrossRef]
- Francis, O.; van Dam, T. Analysis of results of the International Comparison of Absolute Gravimeters in Walferdange (Luxembourg) of November 2003. Cah. Cent. Eur. Geodyn. Seismol. 2006, 26, 1–23. [Google Scholar]
- Francis, O.; van Dam, T.; Germak, A.; Amalvict, M.; Bayer, R.; Bilker-Koivula, M.; Calvo, M.; D’Agostino, G.-C.; Dell’Acqua, T.; Engfeldt, A.; et al. Results of the European Comparison of Absolute Gravimeters in Walferdange (Luxembourg) of November 2007. In Gravity, Geoid and Earth Observations, IAG Symposium; Mertikas, S.P., Ed.; Springer: Berlin/Heidelberg, Germany, 2010; Volume 135, pp. 31–35. [Google Scholar] [CrossRef]
- Pálinkáš, V.; Wziontek, H.; Vaľko, M.; Křen, P.; Falk, R. Evaluation of comparisons of absolute gravimeters using correlated quantities—Reprocessing and analyses of recent comparisons. J. Geod. 2021, 95, 1–23. [Google Scholar] [CrossRef]
- Timmen, L. Precise definition of the effective measurement height of free-fall absolute gravimeters. Metrologia 2003, 40, 62–65. [Google Scholar] [CrossRef]
- Pálinkáš, V.; Liard, J.; Jiang, Z. On the effective position of the free-fall solution and the self-attraction effect of the FG5 gravimeters. Metrologia 2012, 49, 552–559. [Google Scholar] [CrossRef]
- Wziontek, H.; Bonvalot, S.; Falk, R.; Gabalda, G.; Mäkinen, J.; Pálinkáš, V.; Rülke, A.; Vitushkin, L. Status of the International Gravity Reference System and Frame. J. Geod. 2021, 95, 7. [Google Scholar] [CrossRef]
- Goodkind, J.M. The superconducting gravimeter. Rev. Sci. Instrum. 1999, 70, 4131–4152. [Google Scholar] [CrossRef]
- Hinderer, J.; Crossley, D.; Warburton, R.J. 3.04—Superconducting gravimetry. In Treatise on Geophysics, 2nd ed.; Schubert, G., Ed.; Elsevier B.V.: Amsterdam, The Netherlands, 2015; Volume 3, pp. 59–115. [Google Scholar] [CrossRef]
- Timmen, L. Absolute and relative gravimetry. In Sciences of Geodesy-I, Advances and Future Directions; Xu, G.C., Ed.; Springer: Berlin/Heidelberg, Germany, 2010; pp. 1–48. [Google Scholar] [CrossRef]
- Timmen, L.; Flury, J.; Peters, T.; Gitlein, O. A New Absolute Gravity Base in the German Alps. Contrib. Geophys. Geod. 2006, 36, 7–20. Available online: https://www.researchgate.net/publication/237439323_A_new_absolute_gravity_base_in_the_German_Alps (accessed on 1 March 2021).
- Flury, J.; Peters, T.; Schmeer, M.; Timmen, L.; Wilmes, H.; Falk, R. Precision gravimetry in the new Zugspitze gravity meter calibration system. In Proceedings of the 1st International Symposium of the International Gravity Field Service, Gravity Field of the Earth, Istanbul, Turkey, 28 August–1 September 2006; Ayhan, M.E., Ed.; Special Issue 18. Harita Dergisi: Istanbul, Turkey, 2007. Available online: https://www.harita.gov.tr/uploads/files/mapmagazinespecialissues/harita-dergisi-18inci-ozel-sayisi-37.pdf (accessed on 1 March 2021).
- Fratepietro, F.; Baker, T.F.; Williams, S.D.P.; Van Camp, M. Ocean loading deformations caused by storm surges on the northwest European shelf. Geophys. Res. Lett. 2006, 33, L06317. [Google Scholar] [CrossRef]
- DWD Climate Data Center (CDC). Daily Station Observations Precipitation Height in mm and form of Precipitation for Germany, Version v19.3. Available online: https://cdc.dwd.de/portal/ (accessed on 9 November 2020).
- Hein, G.W. Status, perspectives and trends of satellite navigation. Satell. Navig. 2020, 1, 22. [Google Scholar] [CrossRef]
- Dow, J.M.; Neilan, R.E.; Rizos, C. The International GNSS Service in a hanging landscape of Global Navigation Satellite Systems. J. Geod. 2009, 83, 191–198. [Google Scholar] [CrossRef]
- Bruyninx, C.; Habrich, H.; Söhne, W.; Kenyeres, A.; Stangl, G.; Völksen, C. Enhancement of the EUREF Permanent Network Services and Products. In International Symposium on Geodesy for Planet Earth, International Association of Geodesy Symposia; Kenyon, S., Pacino, M., Marti, U., Eds.; Springer: Berlin/Heidelberg, Germany, 2012; Volume 136, pp. 27–34. [Google Scholar] [CrossRef]
- Petit, G.; Luzum, B. (Eds.) IERS Conventions 2010, IERS Technical Note 36; Verlag des Bundesamtes für Kartographie und Geodäsie: Frankfurt, Germany, 2010; 179p, Available online: https://www.iers.org/IERS/EN/Publications/TechnicalNotes/tn36.html (accessed on 1 March 2021).
- International GNSS Service. Specifications for the 2nd Data Reprocessing Campaign. Available online: http://acc.igs.org/reprocess2.html (accessed on 22 February 2021).
- Letellier, T. Etude des Ondes de Marée sur les Plateux Continentaux. Ph.D. Thesis, Université de Toulouse III, Ecole Doctorale des Sciences de l’Univers, de l’Environnement et de l’Espace, Toulouse, France, 2004; 237p. [Google Scholar]
- Van Dam, T.; Ray, R. S1 and S2 Atmospheric Tide Loading Effects for Geodetic Applications, October 2010. Available online: https://geophy.uni.lu/atmosphere/tide-loading-calculator/ (accessed on 1 March 2021).
- Rebischung, P.; Griffiths, J.; Ray, J.; Schmid, R.; Collilieux, X.; Garayt, B. IGS08: The IGS realization of ITRF2008. GPS Solut. 2012, 16, 483–494. [Google Scholar] [CrossRef]
- Dach, R.; Lutz, S.; Walser, P.; Fridez, P. Bernese GNSS Software Version 5.2; University of Bern: Bern, Switzerland, 2015; Available online: http://ftp.aiub.unibe.ch/BERN52/DOCU/DOCU52.pdf (accessed on 23 February 2021).
- Ostini, L. Analysis and Quality Assessment of GNSS–Derived Parameter Time Series. Ph.D. Thesis, Astronomical Institute, University of Bern, Bern, Switzerland, February 2012. [Google Scholar]
- Bos, M.S.; Fernandes, R.M.S.; Williams, S.D.P.; Bastos, L. Fast error analysis of continuous GNSS observations with missing data. J. Geod. 2013, 87, 351–360. [Google Scholar] [CrossRef]
- Rebischung, P.; Altamimi, Z.; Ray, J.; Garayt, B. The IGS contribution to ITRF2014. J. Geod. 2016, 90, 611–630. [Google Scholar] [CrossRef]
- Arneitz, P.; Meurers, B.; Ruess, D.; Ullrich, C.; Abermann, J.; Kuhn, M. Gravity effect of glacial ablation in the Eastern Alps—observation and modeling. Cryosphere 2013, 7, 491–498. [Google Scholar] [CrossRef]
- Hagg, W.; Mayer, C.; Mayer, E.; Heilig, A. Climate and glacier fluctuations in the Bavarian Alps in the past 120 years. Erdkunde 2012, 66, 121–142. [Google Scholar] [CrossRef]
- Zemp, M.; Paul, F.; Hoelzle, M.; Haeberli, W. Glacier fluctuations in the European Alps, 1850–2000: An overview and spatio-temporal analysis of available data. In Darkening Peaks: Glacier Retreat, Science, and Society; Orlove, B., Wiegandt, E., Luckman, B.H., Eds.; University of California Press: Berkeley, CA, USA, 2008; pp. 152–167. [Google Scholar] [CrossRef]
- Mader, K. Das Newtonsche Raumpotential Prismatischer Körper und Seine Ableitungen bis zur Dritten Ordnung; Sonderheft 11; Österreich. Verein f. Vermessungswesen: Wien, Austria, 1951. [Google Scholar]
- Olsson, P.-A.; Breili, K.; Ophaug, V.; Steffen, H.; Bilker-Koivula, M.; Nielsen, E.; Oja, T.; Timmen, L. Postglacial gravity change in Fennoscandia—Three decades of repeated absolute gravity observations. Geophys. J. Int. 2019, 217, 1141–1156. [Google Scholar] [CrossRef]


| Comparisons | Site | Epoch | No. of Gravimeters | Δg [μm/s2] (FG5-220 − CRV) | Std.U of Δg [μm/s2] |
|---|---|---|---|---|---|
| ECAG2003 | Wal. | November 2003 | 13 | −0.019 | 0.028 |
| ECAG2007 | Wal. | November 2007 | 19 | +0.024 | 0.022 |
| CCM.G-K1 | Sév. | October 2009 | 21 | +0.006 | 0.021 |
| EURAMET.M.G-K1 | Wal. | November 2011 | 21 | +0.014 | 0.020 |
| CCM.G-K2 | Wal. | November 2013 | 25 | +0.018 | 0.019 |
| EURAMET.M.G-K2 | Bel. | October 2015 | 17 | +0.038 | 0.021 |
| EURAMET.M.G-K3 | Wet. | April 2018 | 16 | 0.000 | 0.021 |
| Station | Start | φ [°] | λ [°] | H [m NN] | Description |
|---|---|---|---|---|---|
| Wank Berg | 2004 | 47.5072 | 11.1443 | 1738.03 | Station of the Wank cable car (summit) |
| Wank Tal | 2004 | 47.5041 | 11.1062 | 735.29 | Station of the Wank cable car (foot) |
| Zugspitze Telekom | 2004 | 47.4211 | 10.9851 | 2940.96 | Telecom building at summit |
| Schneefernerhaus 200 | 2004 | 47.4164 | 10.9798 | 2659.81 | Environmental Research Station Schneefernerhaus, point 200 destroyed |
| Schneefernerhaus 202 | 2011 | 47.4164 | 10.9798 | 2659 | New point 202 adjacent to former 200 |
| Zugspitze ZUGOG | 2018 | 47.4207 | 10.9847 | 2938 | Adjacent to the superconducting gravimeter OSG#052 in ZUGOG |
| From | To | Epoch | Δg | Std.U | Gravimeter | Remarks |
|---|---|---|---|---|---|---|
| (href = 0.260 m) | [μm/s2] | Scintrex | ||||
| Schneef. 308 | Schneef. 200 | 2004 | −22.616 | 0.008 | CG-3 #4492 | Point 308 inside Schneefernerhaus, witness point |
| Schneef. 308 | Schneef. 202 | 2011 | −22.333 | 0.012 | CG-3 #4492 | Tie to new abs. point |
| Schneef. 308 | Schneef. 202 | 2016 | −22.328 | 0.018 | CG-3 #4492 | Tie to new abs. point |
| Schneef. 202 | Zug. Telekom | 2016 | −925.618 | 0.020 | CG-3 #4492 | Tie between 2 abs. points |
| Zug. Telekom | Zug. ZUGOG | 2018 | +10.893 | 0.009 | CG-6 #0069 | Tie between old and new absolute point at summit |
| Zug. Telekom | Zug. ZUGOG | 2019 | +10.910 | 0.022 | CG-6 #0069 | Tie at summit like in 2018 |
| Station | Date | href [m] | g [μm/s2] | Std.U | Remarks |
|---|---|---|---|---|---|
| Wank Berg | 1–2 December 2004 | 1.200 | 9,803,733.465 | 0.02 | Absolute observation on mountain top |
| Wank Berg | 20–22 September 2019 | 1.200 | 9,803,733.470 | 0.02 | |
| Wank Berg | Δg2019–2004 = +0.005 μm/s2 | 0.03 | |||
| Wank Tal | 3–5 December 2004 | 1.200 | 9,805,844.330 | 0.02 | Absolute observation on mountain foot |
| Wank Tal | 23–24 September 2019 | 1.200 | 9,805,844.271 | 0.02 | |
| Wank Tal | Δg2019–2004 = −0.059 μm/s2 | 0.03 | |||
| Schneef. 202 | 9/10 September 2004 | 1.250 | 9,801,548.072 | 0.03 | Abs. obs. on Schneefernerhaus 200, centred |
| Schneef. 202 | 28 September 2016 | 1.250 | 9,801,547.864 | 0.02 | Abs. obs. on Schneef. 202 |
| Schneef. 202 | Δg2016–2004 = −0.208 μm/s2 | 0.04 | |||
| Zug. Telekom | 18/19 September 2004 | 1.200 | 9,800,621.485 | 0.02 | Absolute observation on Telekom |
| Zug. Telekom | 28 September 2016 | 1.200 | 9,800,621.254 | 0.03 | Abs. obs. on Schneef. 202, centred |
| Zug. Telekom | 15–20 October 2018 | 1.200 | 9,800,621.157 | 0.03 | Abs. obs. on ZUGOG, centred |
| Zug. Telekom | 26–27 September 2019 | 1.200 | 9,800,621.216 | 0.03 | Abs. obs. on ZUGOG, centred |
| Zug. Telekom | Δg2019–2004 = −0.269 μm/s2 | 0.04 | |||
| From | To | Epoch | Δg | Std.U | Remarks |
|---|---|---|---|---|---|
| (href = 1.200 m) | (href = 1.250 m) | [μm/s2] | |||
| Zug. Telekom | Schneef. 202 | September 2004 | +926.587 | 0.030 | Absolute observ. on Schneef. 200 (transferred to 202) and on Zug. Telekom |
| Zug. Telekom | Schneef. 202 | September 2016 | +926.618 | 0.020 | Relative gravity tie |
| Δg2016–2004 = +0.031 μm/s2 | 0.036 | ||||
| Mode | Period | North [mm/yr] | East [mm/yr] | UP [mm/yr] |
|---|---|---|---|---|
| continuous | 2007–2016 | 14.98 s = 0.11 | 20.55 s = 0.18 | 0.29 s = 0.16 |
| campaigns | 2004–2019 | 16.18 s = 0.1 | 21.25 s = 0.1 | 0.18 s = 0.2 |
Publisher’s Note: MDPI stays neutral with regard to jurisdictional claims in published maps and institutional affiliations. |
© 2021 by the authors. Licensee MDPI, Basel, Switzerland. This article is an open access article distributed under the terms and conditions of the Creative Commons Attribution (CC BY) license (http://creativecommons.org/licenses/by/4.0/).
Share and Cite
Timmen, L.; Gerlach, C.; Rehm, T.; Völksen, C.; Voigt, C. Geodetic-Gravimetric Monitoring of Mountain Uplift and Hydrological Variations at Zugspitze and Wank Mountains (Bavarian Alps, Germany). Remote Sens. 2021, 13, 918. https://doi.org/10.3390/rs13050918
Timmen L, Gerlach C, Rehm T, Völksen C, Voigt C. Geodetic-Gravimetric Monitoring of Mountain Uplift and Hydrological Variations at Zugspitze and Wank Mountains (Bavarian Alps, Germany). Remote Sensing. 2021; 13(5):918. https://doi.org/10.3390/rs13050918
Chicago/Turabian StyleTimmen, Ludger, Christian Gerlach, Till Rehm, Christof Völksen, and Christian Voigt. 2021. "Geodetic-Gravimetric Monitoring of Mountain Uplift and Hydrological Variations at Zugspitze and Wank Mountains (Bavarian Alps, Germany)" Remote Sensing 13, no. 5: 918. https://doi.org/10.3390/rs13050918
APA StyleTimmen, L., Gerlach, C., Rehm, T., Völksen, C., & Voigt, C. (2021). Geodetic-Gravimetric Monitoring of Mountain Uplift and Hydrological Variations at Zugspitze and Wank Mountains (Bavarian Alps, Germany). Remote Sensing, 13(5), 918. https://doi.org/10.3390/rs13050918