Article

Detecting Forest Degradation in the Three-North Forest Shelterbelt in China from Multi-Scale Satellite Images

1
Research Institute of Forest Resource Information Techniques, Chinese Academy of Forestry, Beijing 100091, China
2
Key Laboratory of Forestry Remote Sensing and Information System, National Forestry and Grassland Administration, Beijing 100091, China
3
Center for Science Communication and Achievement Transformation, National Natural Science Foundation of China, Beijing 100085, China
4
Survey & Planning Institute, National Forestry and Grassland Administration, Beijing 100029, China
5
The Three North Shelterbelt Program Construction Bureau, National Forestry and Grassland Administration, Yinchuan 750001, China
*
Author to whom correspondence should be addressed.
Remote Sens. 2021, 13(6), 1131; https://doi.org/10.3390/rs13061131
Submission received: 8 February 2021 / Revised: 26 February 2021 / Accepted: 13 March 2021 / Published: 16 March 2021

Abstract

:
Detecting forest degradation from satellite observation data is of great significance in revealing the process of decreasing forest quality and giving a better understanding of regional or global carbon emissions and their feedbacks with climate changes. In this paper, a quick and applicable approach was developed for monitoring forest degradation in the Three-North Forest Shelterbelt in China from multi-scale remote sensing data. Firstly, Normalized Difference Vegetation Index (NDVI), Enhanced Vegetation Index (EVI), Ratio Vegetation Index (RVI), Leaf Area Index (LAI), Fraction of Photosynthetically Active Radiation (FPAR) and Net Primary Production (NPP) from remote sensing data were selected as the indicators to describe forest degradation. Then multi-scale forest degradation maps were obtained by adopting a new classification method using time series MODerate Resolution Imaging Spectroradiometer (MODIS) and Landsat Enhanced Thematic Mapper Plus (ETM+) images, and were validated with ground survey data. At last, the criteria and indicators for monitoring forest degradation from remote sensing data were discussed, and the uncertainly of the method was analyzed. Results of this paper indicated that multi-scale remote sensing data have great potential in detecting regional forest degradation.

Graphical Abstract

1. Introduction

Forest degradation could be defined as a loss of carbon stocks from forestland without land cover change caused by either natural or anthropogenic activities with relating to climate change [1,2]. Deforestation and forest degradation have become an important issue concerning climate change, and have been the second leading cause of anthropogenic greenhouse emissions [3,4]. Studies have shown that global estimates of the carbon emissions from degradation range from 10% to 40% of the total global greenhouse gas emissions [2,5,6,7]. The uncertainty is mainly due to the difficulties in monitoring degradation over large areas as the forest kinds, climatic characteristics, forestry planning and management vary. Therefore, developing efficient methods for forest degradation is of great significance not only in revealing the process of forest quality deceased, stand structure destructed and permanent loss of forest but also giving a better understanding of regional or global carbon emissions and its relationship with climate change.
Recent advances in time series remote sensing data processing suggested that yearly vegetation indices derived from MODerate Resolution Imaging Spectroradiometer (MODIS) products could play a significant role in regional forest disturbance and degradation assessment [8,9]. Forest harvest, clearing and degradation could be detected using MODIS multispectral time series data with spatial resolution from 250 m to 500 m [10]. Studies also shown that the MODIS products were too coarse to detect the subtle changes in the density or structure of individual tree. To solve the problem, high resolution satellite data such as Landsat Enhanced Thematic Mapper Plus(ETM+)/ Operational Land Image (OLI) [2,3,11,12], IKONOS [13,14], Sentinel-2 images [15] which gained the ability to detect stresses and diseases at a crown level were adopted to classify forest health levels [16]. But the long revisit cycle and cloud contamination of high resolution satellite data have long limited their use in studying regional and global forest degradation. In addition, current studies were either applied on single sensor images or on time series data from multiple satellite sensors which have similar characteristics, it is still not easy to integrate time series data from different satellite sensors to apply in a large scale forest degradation detecting [16]. In this condition, advances and new methods are urgent to exploit multi-scale data streams for combing satellite data in multiple resolution to monitor forest degradation.
Some studies tried to detect forest degradation from the perspective of carbon reduction and the canopy fraction cover decreasing. Time series of multispectral Vegetation Index (VI), such as Normalized Difference Vegetation Index (NDVI) [17,18], Enhanced Vegetation Index (EVI), Normalized Difference Water Index (NDWI) [19], Enhanced Wetness Difference Index (EWDI) [20], which described the vegetation phenology, have been adopted to analyze the forest health and forest degradation level. Some other indicators to describe the forest productivity, such as Gross Primary Production (GPP)/Net Primary Production (NPP) and Above Ground Biomass (AGB) [12], and indicators to reflect the biodiversity of the forest, such as Canopy Fraction Cover (CFC) [21], were also used to assess the degradation level in regional areas. But it is noteworthy that accuracy and uncertainly varied when using different criteria and indicators [1,2,12,13,15], and the influence of multiscale remote sensing indicators on the effectiveness and sensibility of forest degradation is still unknown. In this case, studying regional forest degradation from multiple indicators based on satellite observations data, and analyzing the impact of indicators on the accuracy of degraded forest detection is of great significance.
As for the method to detect forest degradation, developing a robust approach to map the forest degraded level from satellite or airborne remote sensing imagery is still a challenge. Current methods tried to analyze changes in spectral response, spectral fractions and indices to separate degraded and intact forests from remote sensing [22]. Classification approaches, such as decision tree [19], machine learning (random forest, support vector machine) [3,23,24] have been developed to map the forest degradation level in recent years. But the impact of climate to forest degradation was not considered in the classification approaches in most studies, which was also one of the reasons leading to forest degradation [15,17]. Therefore, developing an applicable method which takes into account the influence of climate may increase the precision in forest degradation detecting from remote sensing.
The aims of this paper are (i) to set up the indicator system to estimate the forest degradation and to analyze the time series of the indicators from MODIS and Landsat images, (ii) to develop a method from multiple indicators to detect the forest degradation in Three-North Forest Shelterbelt in China, (iii) to validate the results by using the field data and the high-resolution Landsat ETM+ images. This paper would provide a quick and applicable approach for monitoring regional forest degradation.

2. Materials and Methods
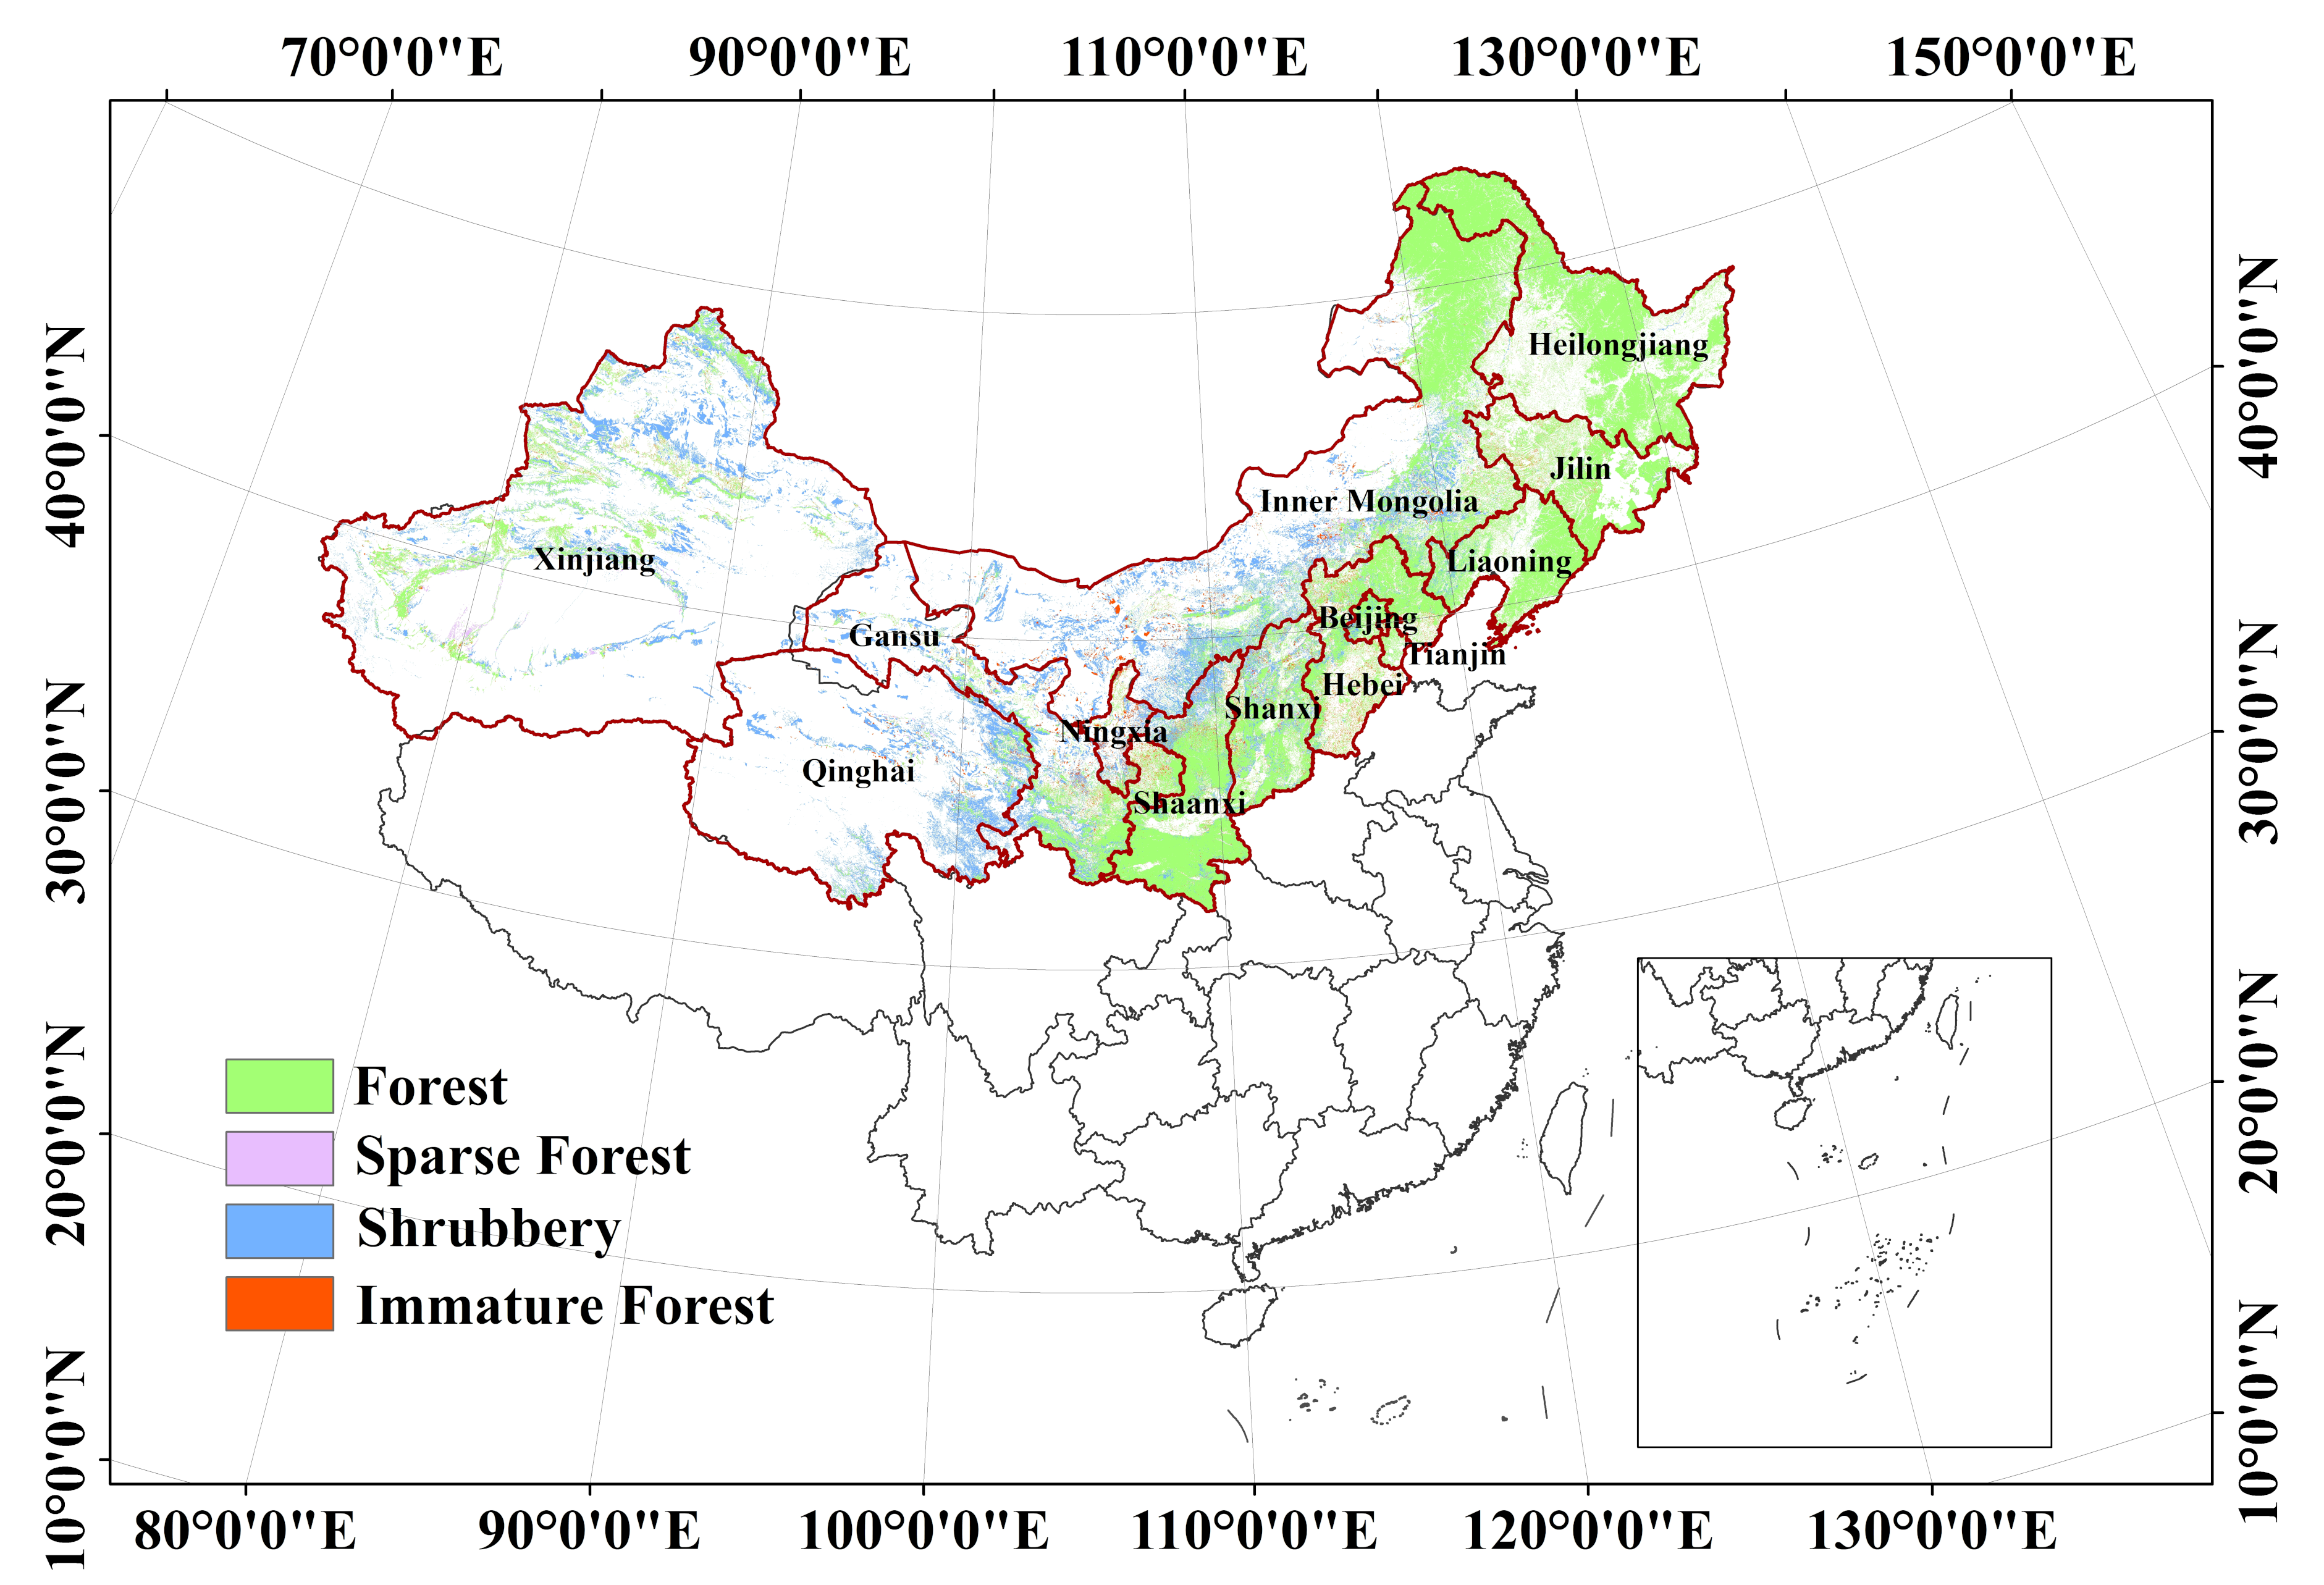
2.1. Study Area

The Three-North Forest Shelterbelt Program initiated in 1978 and scheduled to be completed in 2050, is the world’s largest afforestation project which coverages about 4.07 × 10⁶ km2 (42.40%) of China [25]. The objective of this project is to control sand and water erosion, harness soil, improve ecological environments and produce multiple forest products. This project area mainly locates in the semi-arid and arid lands in the northeastern, the northern and northwestern of China, where desertification and soil erosion are still in a serious situation [26], as shown in Figure 1. Since the implementation of the project, some accomplishments have been made. Specifically, the forest area increased about 244,690 km2, the forest coverage increased from 5.05% to 10.51%, forest volume increased from 720 million m3 to 1390 million m3, desert reduced about 10 km2 per year, and the soil erosion modulus decreased from 8000 t·(ha·year)−1 to 4000 t·(ha·year)−1 from 1978 to 2008 [26]. These ecological benefits are expected to contribute to reduce poverty, improve livelihood and develop rural economies. This study concentrates on the forest degeneration in the second stage of the project from 2000 to 2010.

2.2. Data and Data Processing

2.2.1. Remote Sensing Data

MODIS VI Products: MODIS VI products could provide consistent spatial and temporal comparisons of vegetation chlorophyll and canopy structure [27]. In this paper, the MODIS VI products (MOD13A1 C06) were generated with 16-day intervals and a spatial resolution of 500 m [28]. NDVI and EVI derived from atmospherically-corrected reflectance in the red, near-infrared and blue wavebands were used in this paper to assess the forest degradation. To minimize the impact of phenology, the mean NDVI and EVI from June to August from 2000 to 2010 were acquired in this paper. Ratio Vegetation Index (RVI) was well related to chlorophyll and biomass, which was defined as the ratio of the reflectance of near-infrared to the reflectance of red, was also obtained from MODIS VI products.
MODIS LAI/FPAR Products: MODIS Leaf Area Index (LAI)/Fraction of Photosynthetically Active Radiation (FPAR) products (MOD15A2H C06) [29] were provided on an 8-day basis with a spatial resolution of 500 m. The LAI/FPAR retrieve algorithm consisted of a main algorithm that employed a biome-dependent look-up table based on simulations with a stochastic radiative transfer model that considered three-dimensional canopy structure [30], and a back-up algorithm based on empirical relationships between NDVI and canopy LAI/FPAR [30]. Validation methods of the product included comparisons with in-situ data, comparisons with data from airborne and other space borne sensors, and analysis of trends [30]. The mean LAI/FPAR from June to August from 2000 to 2010 were calculated in this paper.
MODIS NPP Products: MODIS GPP/NPP products (MOD17A3 C06) with a spatial resolution of 500 m and temporal resolution of one year [31] were used to reflect the vegetation productivity of forest in this paper. NPP products were derived from the difference of the GPP and the maintenance respiration. The core science of the GPP algorithm is an application of the light use efficiency concept from MODIS LAI/FPAR product and NASA GMAO meteorological data [32]. A set of biome-specific radiation use efficiency parameters are extracted from the Biome Properties Look-Up Table [32]. The maintenance respiration was determined by the LAI and specific leaf area. NPP from 2000 to 2010 were used in this study to assess the vegetation productivity.
Landsat ETM+ Data: Landsat-7 Enhanced Thematic Mapper Plus (ETM+) images from June to August from 2000 to 2010 [33] were used to estimate high resolution (30 m) vegetation index. The data were first destriped, then surface reflectance was first obtained after radiometric correction and atmospheric correction. Relative radiometric normalization of multi-temporal satellite images was also the necessary process in detecting the forest change.
Climate Classification Map: As forest structure, function and degradation were closely related to the climate and climate changes, an improved Köppen–Geiger climate classification map (1980–2016) with the spatial resolution of 0.0083° (about 1 km) [34] was adopted in this paper when analyzing the degradation. The climate classification map was derived from an ensemble of high-resolution climatic datasets including WorldClim V1 and V2, CHELSA V1.2, and CHPclim V1. Validation with station observations data from Global Historical Climatology Network-Daily database and the Global Summary of the Day database demonstrated that the improved Köppen–Geiger climate classification map exhibited a high classification accuracy (80.0%) [34].
Forest Map: The forest map was obtained from the “Forest-Land one map” database from the National Forestry and Grassland Admiration of China. This map was built from the forest resource inventory and forest resource planning and design. The forest map was first aggregated to the MODIS resolution (500 m) and Landsat resolution (30 m). Then the forest map was used to extract the forest indicators from MODIS and Landsat datasets.

2.2.2. Field Data

The provincial degradation area and degradation level in the Three-North Forest Shelterbelt were collected from the Three North Shelterbelt Program Construction Bureau of National Forestry and Grassland Admiration of China to validate the degradation map. The ground forest degradation classes were measured according to the patterns of the shoot blight and dead of the forest, the decrease of the fractional vegetation coverage, and the loss of the forest function [35].

2.3. Methods

2.3.1. Indicators to Describe Forest Degradation

One of the fundamental principle of the selection of forest degradation indicators is knowledge of the reduction of biomass and carbon. According to this principle, NPP was selected as one of the indicators to reflect the potential of carbon storage under natural conditions, and to describe the forest productivity [36].
Considering that time series multispectral vegetation indices could describe the vegetation phenology, and monitor the terrestrial photosynthetic vegetation activity in support of change detection and biophysical interpretations [27], three vegetation indexes (NDVI, EVI and RVI) were selected as the indicators to study forest degradation. Specifically, NDVI has the advantage to minimize the band-correlated noise and the influences caused by variations in direct irradiance, clouds, sun and view angles, topography and atmospheric attenuation. EVI could not only detect the sparse vegetation, but also decouple the noise from aerosol scattering and soil background by including a blue reflectance and a feedback term for simultaneous correction. RVI is well related to chlorophyll and biomass, and is sensitive to the change of vegetation cover fraction. LAI was also taken into account as it is a key remote sensing based descriptor of vegetation density and represents a key input to a range of models, including those used for estimating forest carbon storage and forest biomass.
Moreover, FPAR characterizes the energy absorption ability of vegetation canopy, is able to present the vitality of the forest. It describes both the vegetation structure and the related material and the energy change process. Therefore, FPAR was also selected as an applicable indicator to study the forest degradation in this paper.

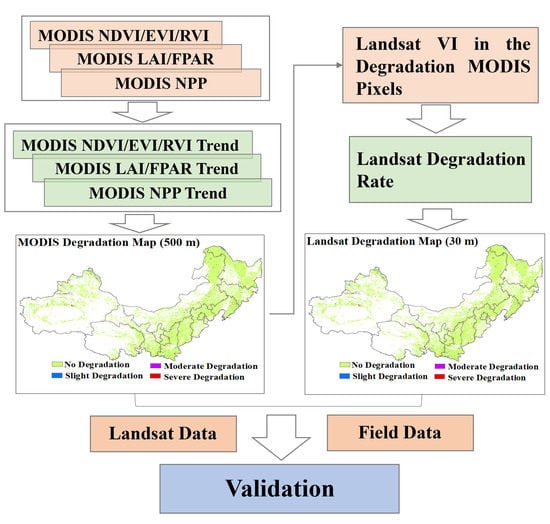
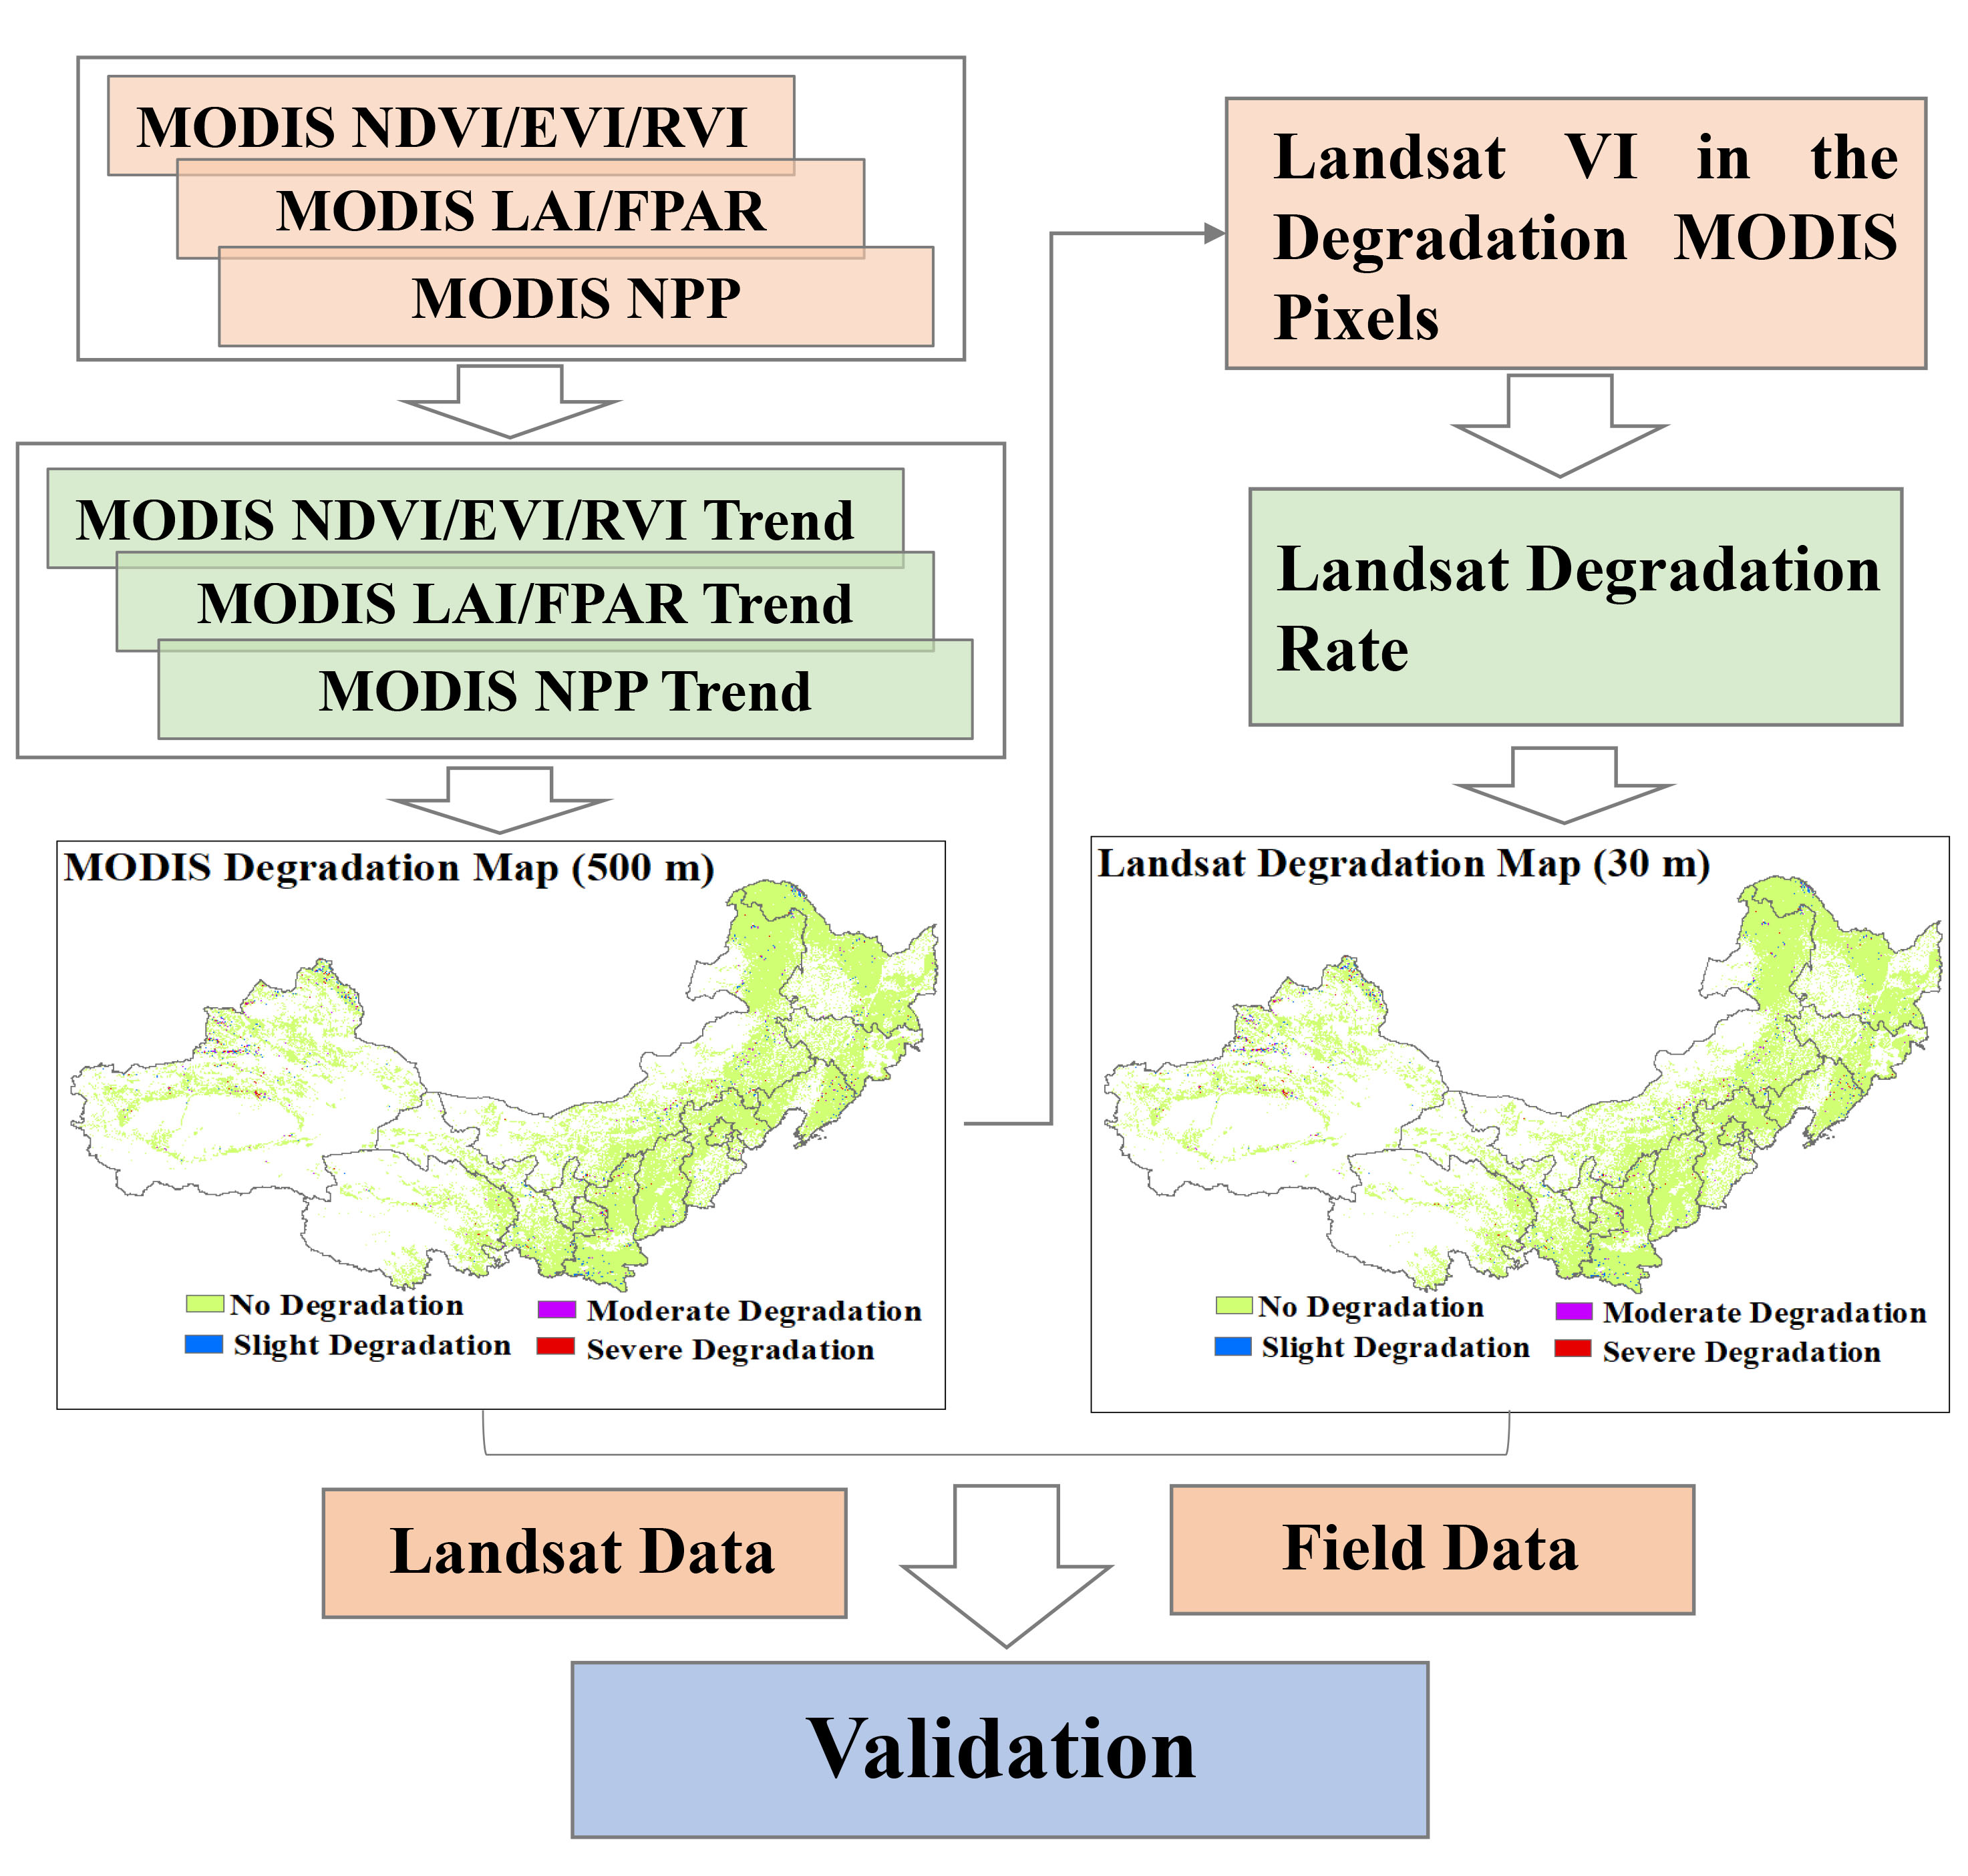
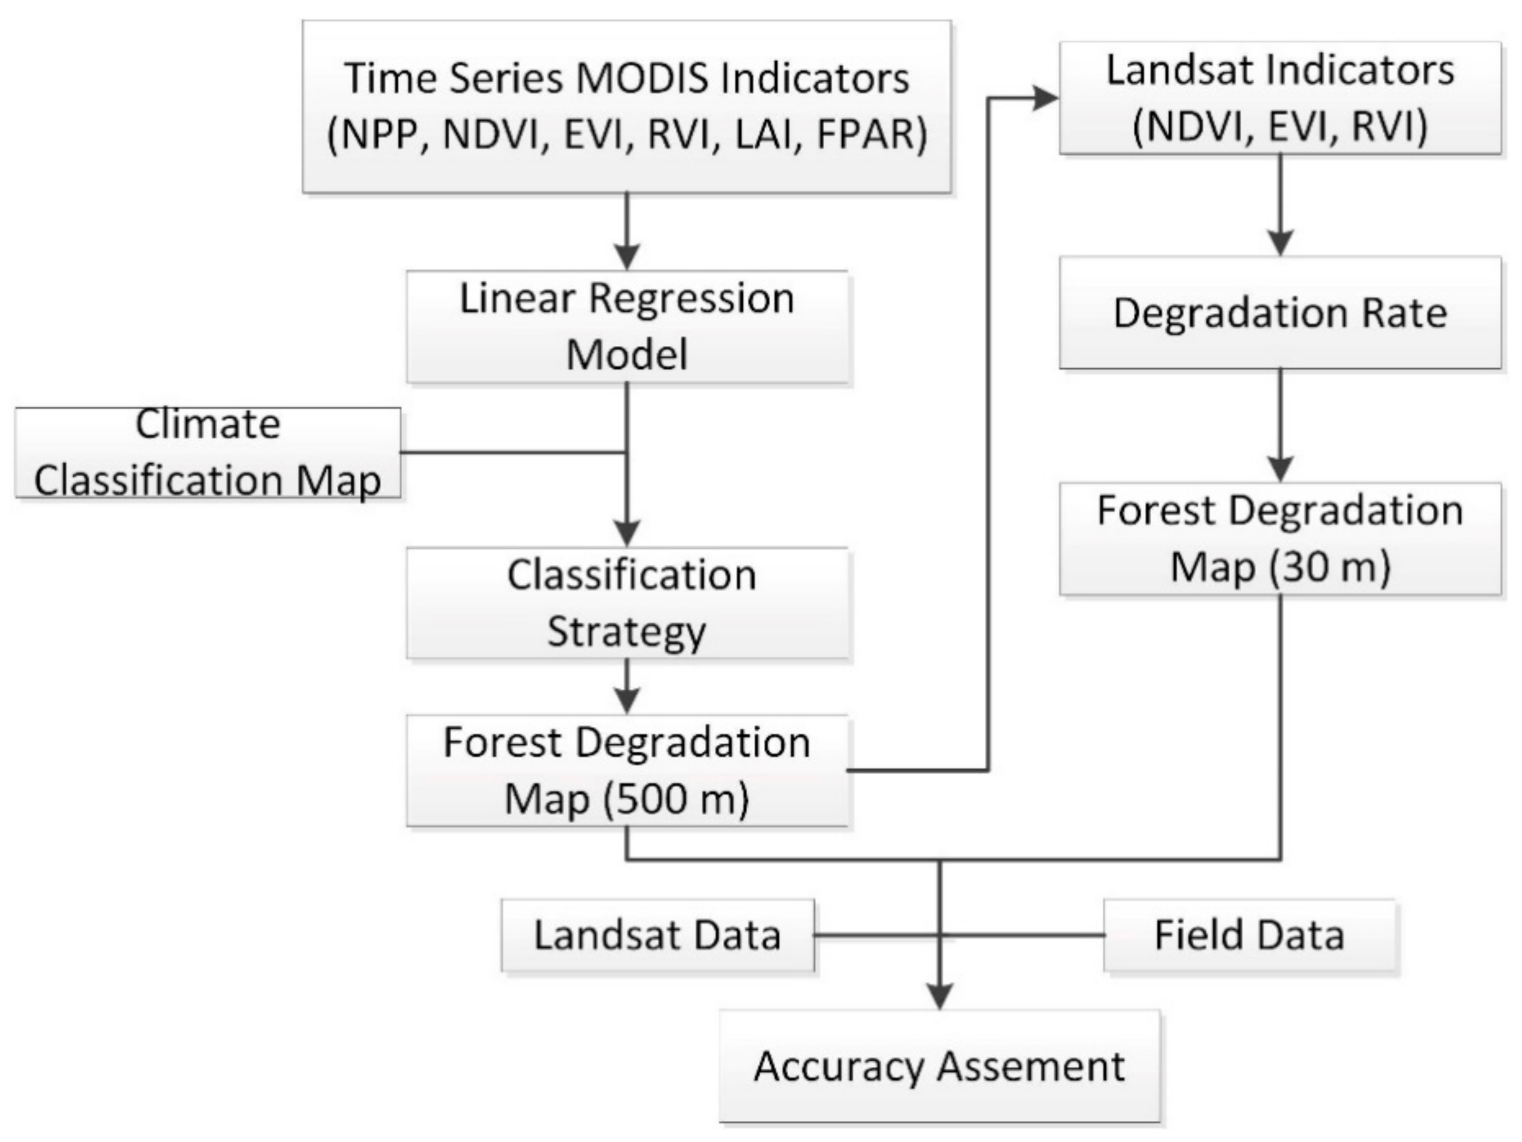
2.3.2. Methods to Detect Forest Degradation from Remote Sensing Data

To detect the forest degradation in multiple scales, a method based on MODIS and Landsat ETM+ data was adopted in this paper, as shown in Figure 2. First, simple linear regression models were adopted to analyze the trend using time series indicators (NPP, NDVI, EVI, RVI, LAI, FPAR) from MODIS products from 2000 to 2010. Then a classification model was established to analyze the degree of degradation based on the trend of indicators. To minimize the influence of the mixed pixels in a MODIS pixel, the Landsat ETM+ data were used to analyze the situation in the degraded areas from MODIS datasets. By analyzing the degradation rate from 2000 to 2010, and adopting the same classification strategy as the degradation from MODIS products, a forest degradation map with a high resolution of 30 m was obtained. Finally, to assess the performance of the method, the results were validated with the ground-based survey data, and were compared with the forest degradation derived from Landsat ETM+ data directly.
  • Analysis of the Time Series Indicators from MODIS Products
First, the average values of the indictors (NPP, NDVI, EVI, RVI, LAI, FPAR) derived from MODIS products in the growing season (from June to August) from 2000 to 2010 were acquired in this paper. By reviewing the quality flags in the MODIS products, the missing values and negative values were replaced with corresponding mean values before and after the specific time. To make the trends of different indicators comparable, the indicators were normalized. Then some linear regression models were established using the time series indicators (NDVI, EVI, RVI, LAI, FPAR, NPP) from MODIS data, and the regression slopes and standard deviations were obtained for each MODIS pixel.
Considering that forest ecosystems were sensitive to climate, its structure, function and degradation were closely related to the climate and climate changes, a decision tree classification model was established based on an improved Köppen–Geiger climate classification map to categorize the pixels into four classes according to the regression slopes: No degradation, slight degradation, moderate degradation and severe degradation. Noting that each classification model was built on a sliding window (150 km × 150 km). In the sliding window, MODIS indicators (500 m) were counted according to the Köppen–Geiger climate classification map (1 km) to generate the histograms of the indicators (See Figures S1 and S2 in Supplementary Materials). Then the classification strategy was built according to the histogram of the indicators [19]. Specifically, No degradation: k ≥ 0; slight degradation: δ k < 0 ; moderate degradation: 2 δ k < δ ; severe degradation: k < 2 δ . k is the regression slope, and δ is the standard deviation in the sliding window. Once the degradation trend was found in at least one indicator, the pixel was classified as degradation. And the degradation degree was determined according to the mode of degradation level from the six kinds of indicators.
  • Degradation Rate from Landsat Data
As the influence of heterogeneity of the land surface and mixed pixels in the MODIS pixels (500 m), the degradation map from MODIS products may have a low accuracy. To detecting the finer forest degradation in a MODIS pixel, the Landsat ETM+ data were used to study the degradation areas in the MODIS pixels which was identified as the degraded areas. Firstly, from the Landsat ETM+ data, the NDVI, EVI, RVI were obtained in the degradation MODIS pixel. And the indicators were normalized to make the trends of different indicators comparable. By analyzing the degradation rate, and adopting the same classification strategy as the degradation from MODIS products, the forest degradation map with a high resolution (30 m) was obtained. Degradation rate, defined as the area degraded over a given period of time compared to the initial forest area [37], could be described as follows:
θ = 1 1 I 1 I 2 I 1 1 Y
where θ is the degradation rate of the indicator, I 1 is the indicator at data 1 and I 2 is the indicator at date 2, Y is the weighted average time interval.
  • Validation of the Results
To assess the performance of the forest degradation detecting method, ground survey forest degradation data was collected to validate the results. Specifically, the forest degradation area and degree from satellite observation data were compared with the provincial ground survey data. Besides, forest degradation map was validated with high resolution forest degradation map from Landsat ETM+ data pixel by pixel. The Determination Coefficient (R2) and Root Mean Square Error (RMSE) were used to quantify the accuracy of the detection method.

3. Results

3.1. Forest Degradation Maps in the Three-North Forest Shelterbelt

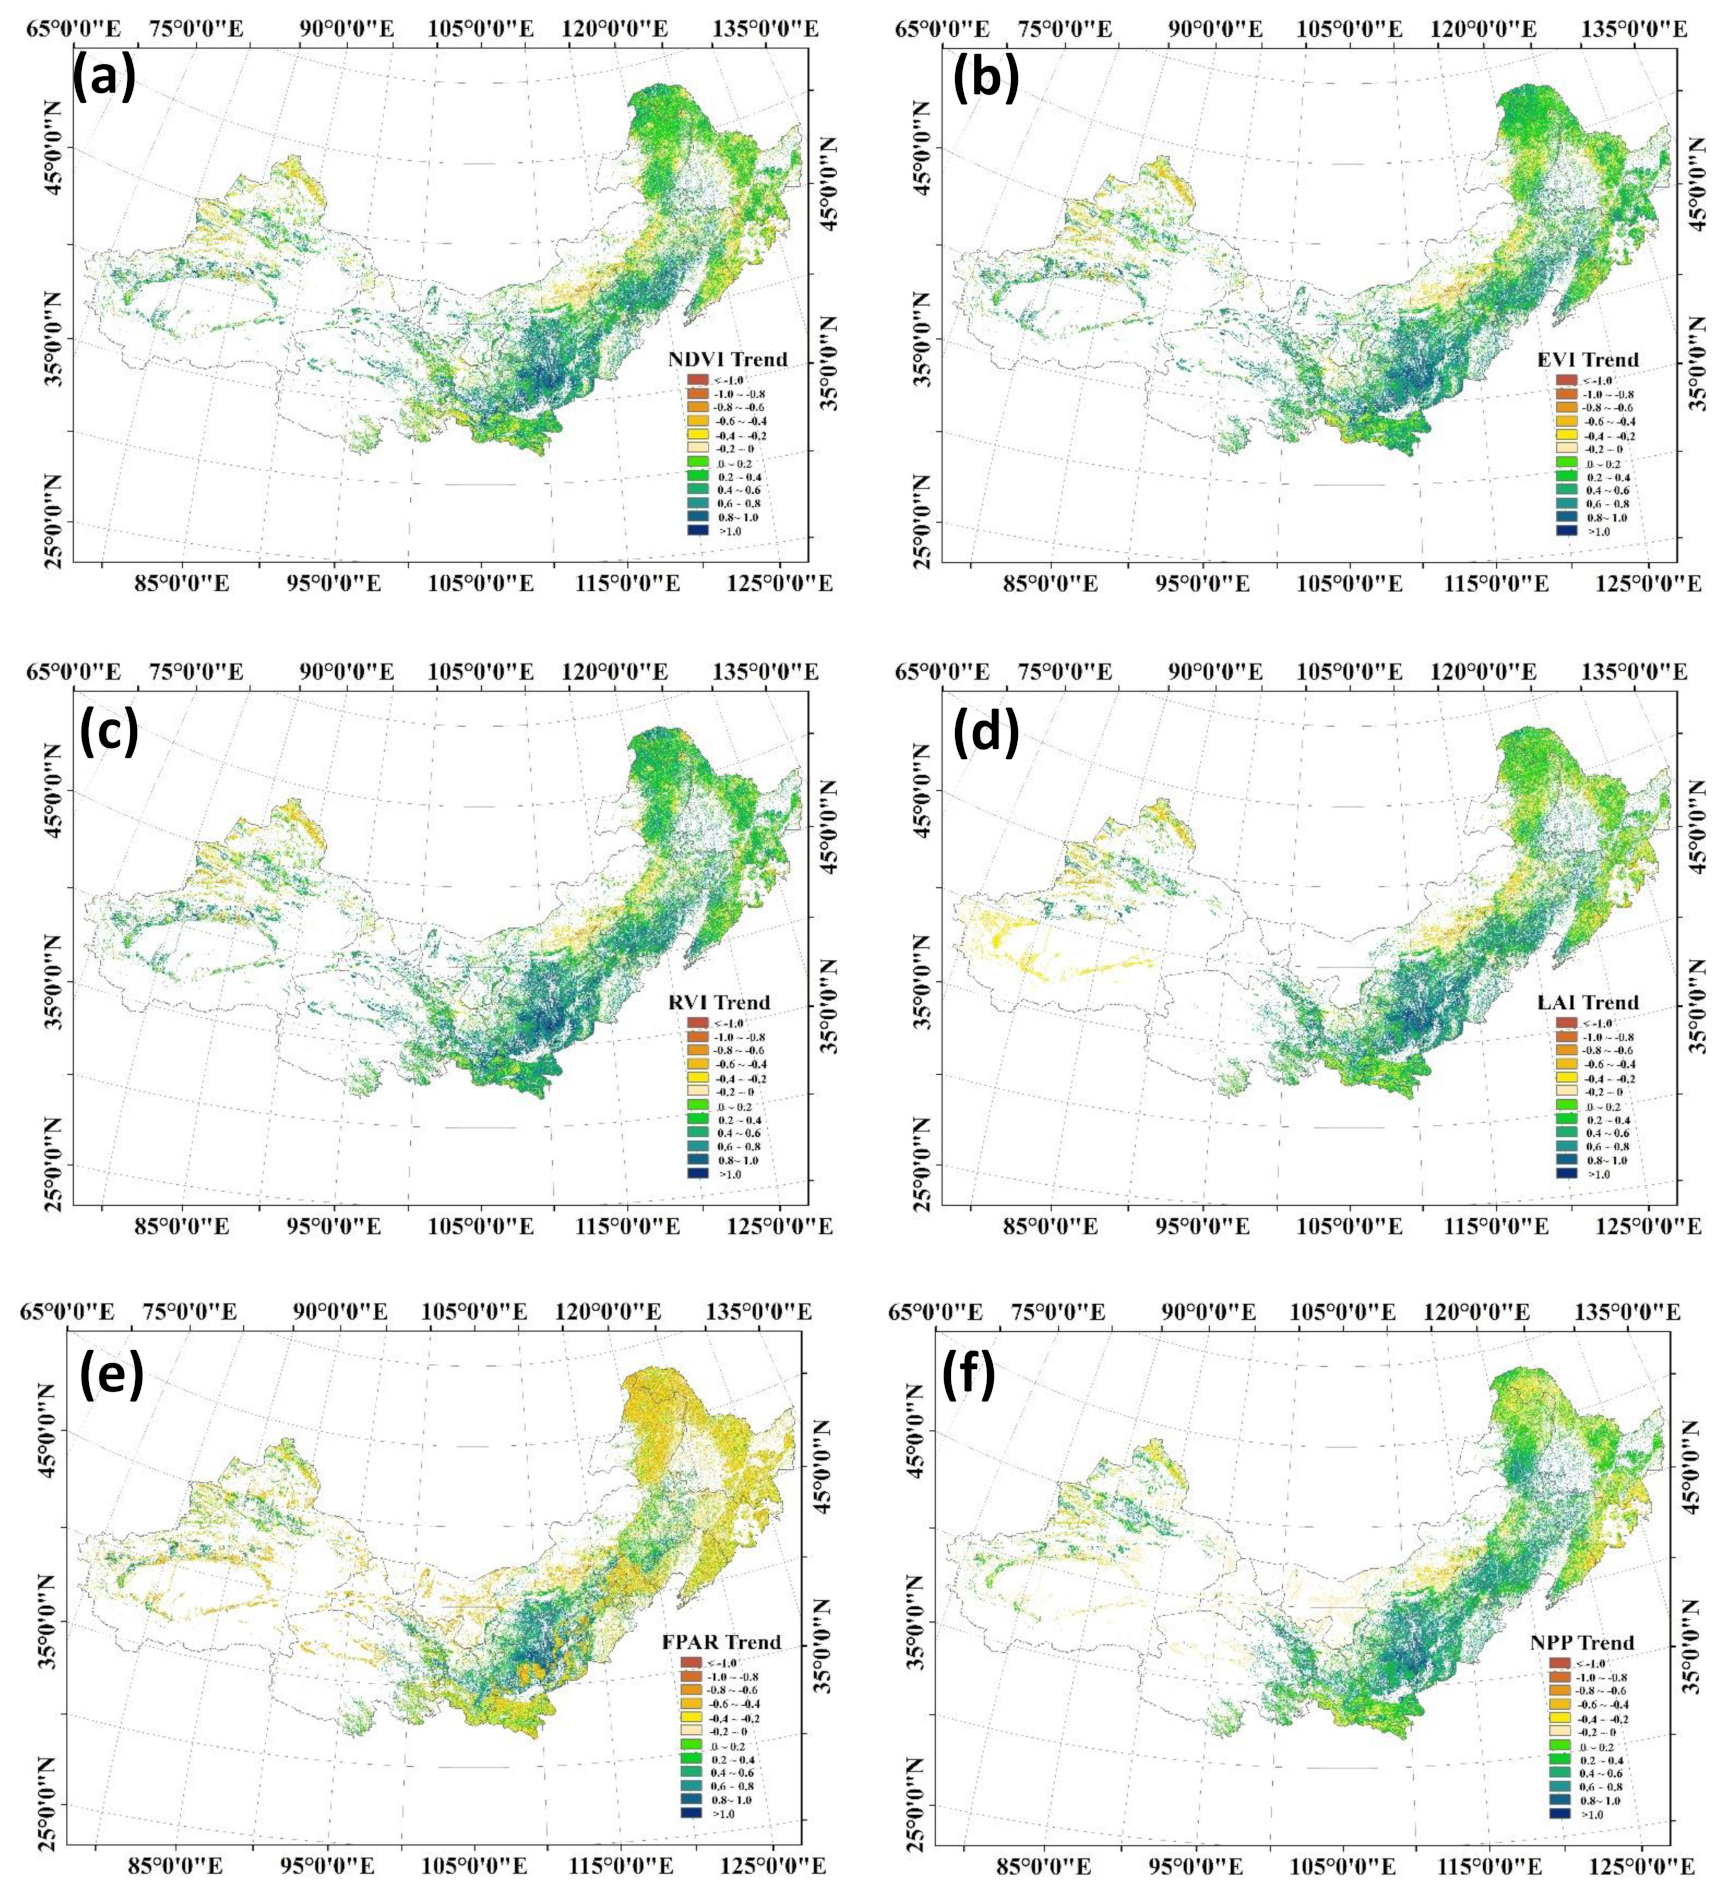
3.1.1. Trends of the Indicators from 2000 to 2010

Trends of the indicators from 2000 to 2010 in the Three-North Forest Shelterbelt were shown in Figure 3. Obviously, NDVI, EVI, RVI, LAI, FPAR and NPP showed an increasing trend in most areas of the Three-North Forest Shelterbelt, which also demonstrated that great achievements have been achieved since the implementation of the program, and the forests were in good condition in most areas. The decreasing trend mostly occurred in the middle areas of Inner Mongolia, northwestern areas in Xinjiang, some areas in Gansu, Ningxia and Shaanxi. It was worth noting that some difference existed among spatial distribution of the trends of indicators. Specifically, in some western areas in Xinjiang, NDVI, EVI and RVI showed an increasing trend from 2000 to 2010, while the LAI, FPAR and NPP showed an increasing trend. The same situation occurred in eastern and southeastern areas in Liaoning and Jilin, the NDVI, EVI, RVI and LAI were increasing while FPAR and NPP were decreasing.
The reasons for the different tends mainly that the sensitive levels of these indicators to the changes varied. Specifically, NDVI and RVI were chlorophyll sensitive, and were well related to the vegetation canopy background and fraction of vegetation coverage [38]; EVI was more responsive to canopy structural variations, including canopy type, plant physiognomy, and canopy architecture in high biomass regions through a de-coupling of the canopy background signal and a reduction in atmosphere influences [39]; LAI product was related to NDVI, and could be influenced by the forest types and observation angle [40]; FPAR was an indicator of both the vegetation structure and the material and energy change process, was a response to the changes in atmosphere and soil and was well related to NDVI [41]; The changes in NPP were well related to the changes of temperature and precipitation, and could reflect the productivity [42]. Besides, the mixed pixels in a MODIS pixel and the heterogeneity of the land surface could also induce some different characteristics occurred among the kinds of indicators.

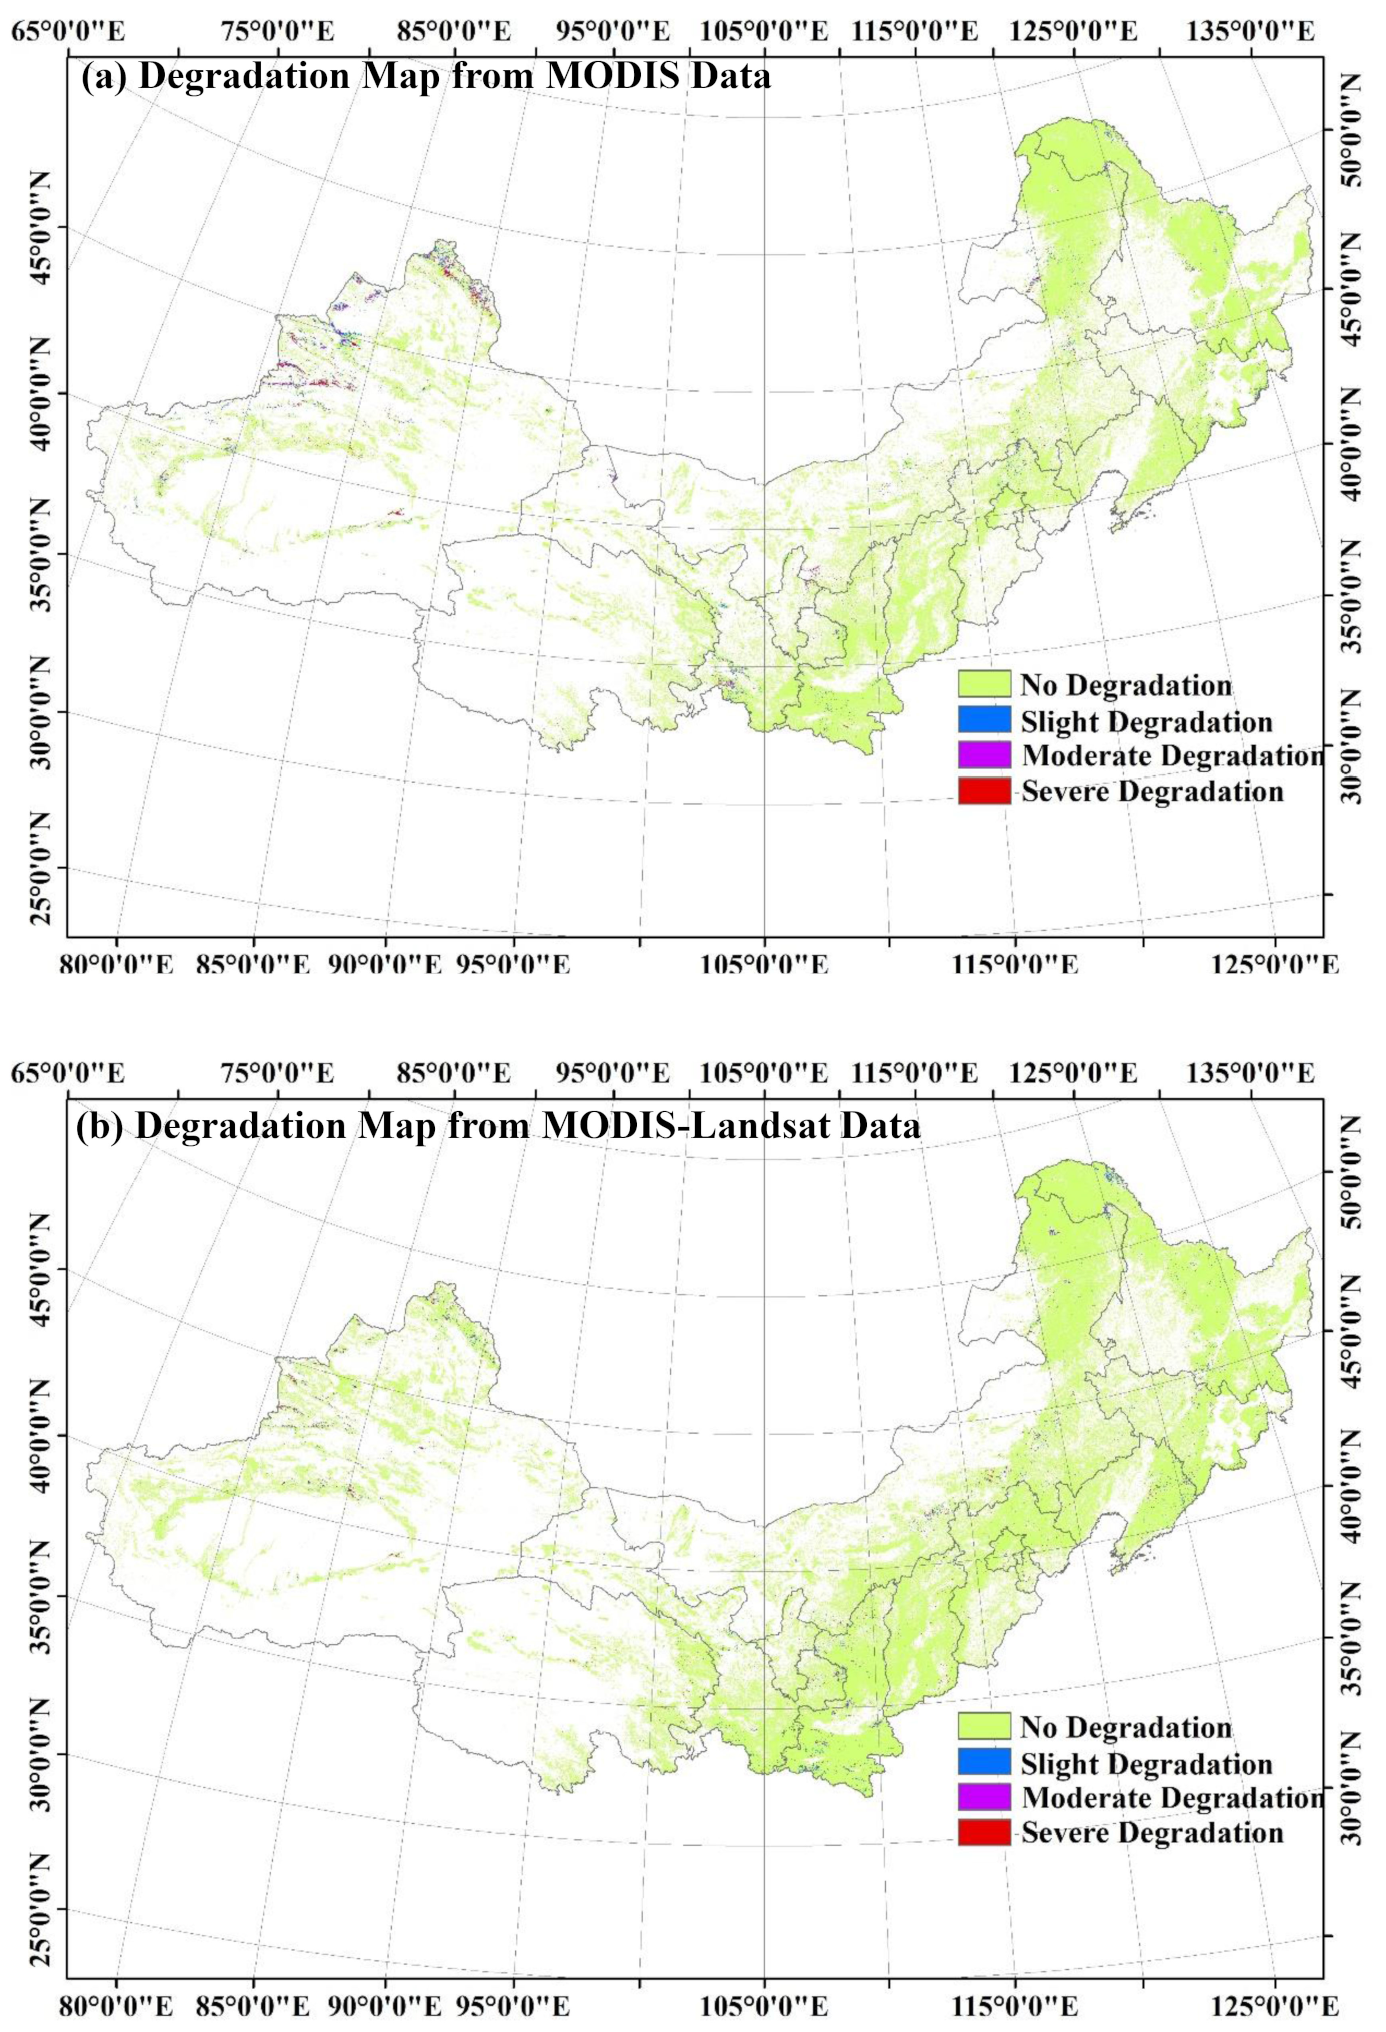
3.1.2. Forest Degradation Maps from MODIS and Landsat ETM+ Data

A forest degradation map with a spatial resolution of 500 m from the trend of time series MODIS products was obtained (Figure 4a). By using the Landsat ETM+ data to analyze the situation in the degraded areas from MODIS datasets, the forest degradation map with a resolution of 30 m was acquired (Figure 4b). Compared to use single time series data from MODIS, the degradation map from MODIS-Landsat demonstrated finer scale features with a clear identification by excluding the impact of non-forest in the coarse MODIS pixels.
In general, most forest in the Three-North Forest Shelterbelt were in good condition without degradation. The severe forest degradation was mainly located in the middle areas in Inner Mongolia, the northwestern areas in Xinjiang, the middle areas in Inner Mongolia, northern areas in Shannxi and Ningxia. In northeastern areas, such as Liaoning, Jilin and Heilongjiang, slight and moderate degradation also occurred in the forest. In general, the primary causes for forest degradation were poor quality of forest site, poor natural condition, over-mature forest, improper selection of the forest species, forest pest and disease, and the improper management measures.
Forest degradation area from MODIS data, forest degradation area from integrated MODIS-Landsat data, and the forest degradation area from ground survey in each province were shown in Figure 5. By excluding the non-degradation areas in a MODIS pixel, forest degradation areas in each province from integrated MODIS-Landsat data were lower than these from MODIS data. Due to the poor quality of forest site, drought, sandstorm, biological hazard, physiological aging of shelterbelt and other natural factors, ecological situation was grim in Inner Mongolia and Xinjiang (Degradation forest area was more than 80 × 104 hectares from MODIS data, and the severe degradation forest area was about 20 × 104 hectares). In Shaanxi and Gansu, forest degradation areas were more than 40 × 104 hectares. It was found that the forest degradation areas from satellite observations data were larger than those from ground survey data in most province (Especially in Xinjiang, where the degradation forest area was more than 80 × 104 hectares from remote sensing data, and the degradation area was only 13,000 hectares from ground survey data). The reasons for that were mainly the difference between indictors and standards to demonstrate the degradation of forest from remote sensing data and ground survey data.

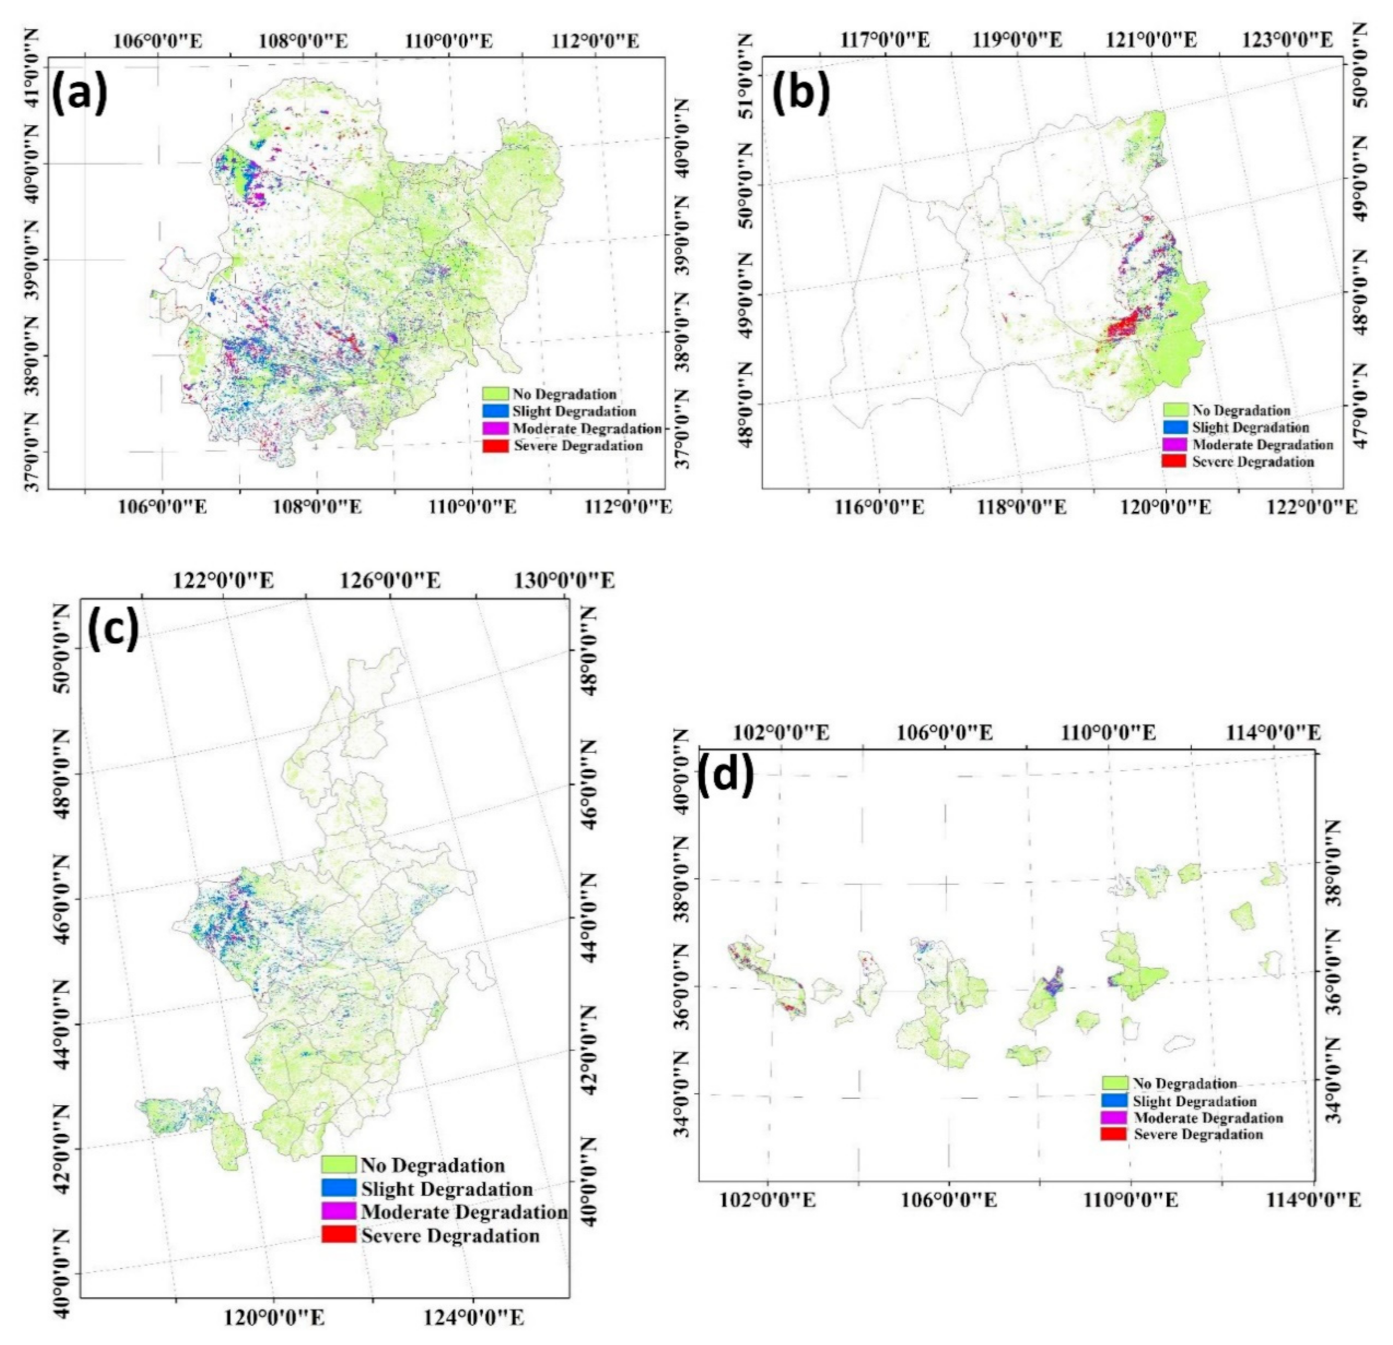
3.1.3. High Resolution (30 m) Forest Degradation Maps in Typical Areas

We obtained the high resolution (30 m) forest degradation map in four typical areas (Figure 6), Maowusu, Hulun Buir, Khorchin and Loess Plateau in the Three-North Forest Shelterbelt, in which forest degradation were in a serious situation. The high resolution (30 m) forest degradation maps were derived by using the classification strategy demonstrated in Section 2.3.2 based on the Landsat data from 2000 to 2010. Total forest degradation area in the four typical areas were about 250 × 104 hectares, occupying 52.87% of the total forest degradation area in the Three-North Forest Shelterbelt (The forest degradation area were 93.87 × 10⁴ hectares, 23.43 × 10⁴ hectares, 103.04 × 10⁴ hectares, 33.87 × 10⁴ hectares in Maowusu, Hulun Buir, Khorchin and Loess Plateau, respectively). We found that the serve forest degradation mainly distributed in the middle and southern areas of Maowusu (12.92 × 10⁴ hectares), eastern areas of Hulun Buir (6.66 × 10⁴ hectares) and some areas in the western Khorchin (4.56 × 10⁴ hectares).

3.2. Validation of the Degradation Areas and Degradation Level

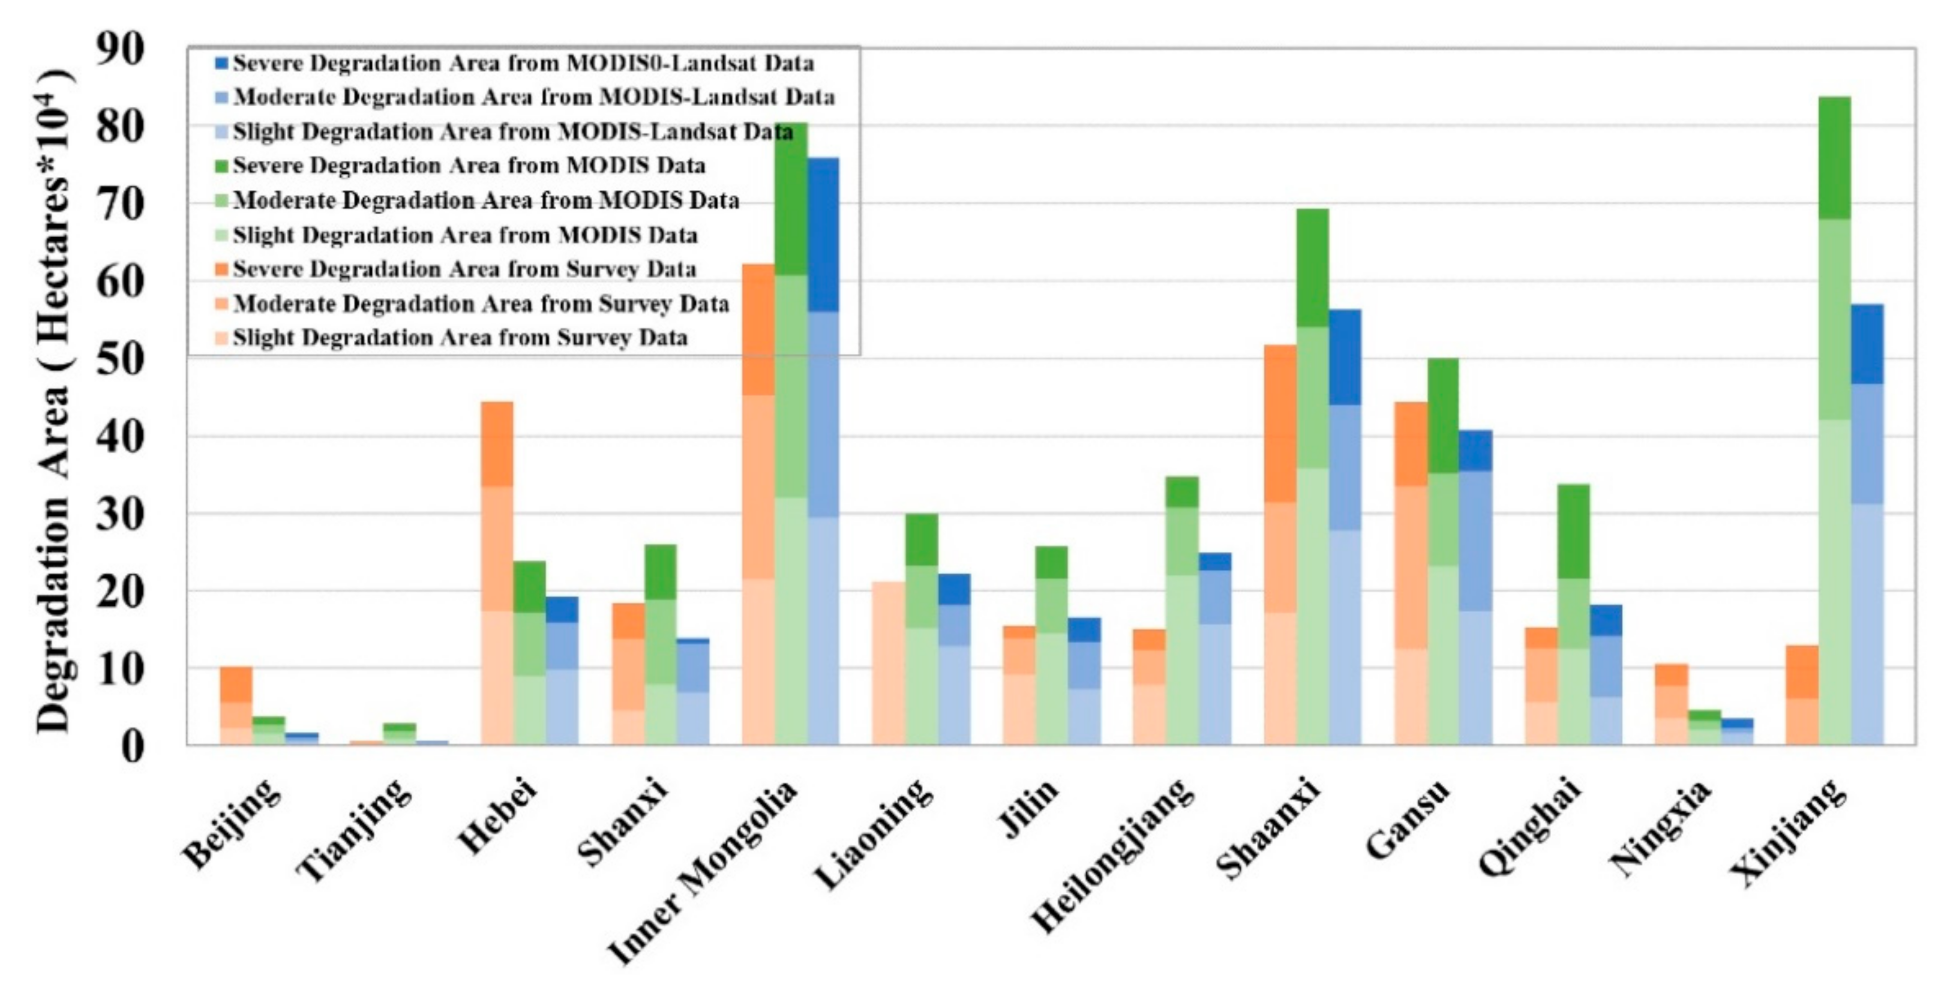
3.2.1. Validation with Ground Survey Data

We compared the forest degradation area from remote sensing data and those from provincial ground survey data (Figure 7). In general, a good linear relationship exists between the forest degradation areas from satellite observations data and those from ground survey data. R2 between degradation area from MODIS data and ground survey data was 0.48, and RMSE was 7.37 × 10⁴ hectares. A good agreement with ground survey data demonstrated that the method could be utilized to detect forest degradation for large forest areas using MODIS time series data. R2 between degradation area from MODIS-Landsat and ground survey data was as high as 0.62, and RMSE was only 4.73 × 10⁴ hectares. A higher R2 and lower RMSE demonstrated that forest degradation from MODIS-Landsat data achieved a better precision and indicated the applicability and reliability of detecting the forest degradation from integrated time series MODIS and Landsat data. From Figure 7, we could find that scatter plots of degraded forest areas from integrated MODIS-Landsat images were located closer to the 1:1 line, especially at the slight degraded forest. Besides, forest degraded area from time series MODIS indictors were obviously larger than those from integrated MODIS-Landsat time series data. The main reason may be that single pixel-time series MODIS data did not contain additional and useful information to differentiate forest degradation [15]. Some non-forest land-cover types existed in a coarse MODIS pixel (500 m), which lead to the overestimation of degraded forest areas.

3.2.2. Cross Validation with High Resolution Data

We compared the degradation map from MODIS and Landsat product with corresponding high resolution (30 m) degradation map in typical areas in which forest degradation were in a serious situation, as shown in Table 1 and Table 2. Specifically, the high resolution (30 m) degradation map was derived by using a decision tree model from Landsat data from 2000 to 2010. In general, high accuracy was achieved of the degradation map from MODIS-Landsat product. The overall accuracy of the classification of forest degradation level from MODIS product was as high as 80.40%, and the Kappa Coefficient was 0.79. And the overall accuracy of the classification of forest degradation level from MODIS-Landsat product was as high as 84.35%, and the Kappa coefficient was 0.82. The high overall accuracy and Kappa coefficient demonstrated that the degradation map from MODIS-Landsat product obtained high accuracy.

4. Discussion

4.1. Criteria and Indicators for Forest Degradation Detection from Remote Sensing

Selection of the indicators from remote sensing data is one of the key points, which have great influence on the accuracy of detecting and assessing the forest degradation. The main principle of selection of the degradation indicators is the reduction of biomass and carbon, the decreasing of canopy fraction cover and the biodiversity. Satellite observations data has the potential to be decidedly instrumental in the assessment of forest degradation at a much lower cost, therefore, becoming an applicable way to detecting forest degradation at a regional and global scale [43]. In previous study, as shown in Table 3, various kinds of indicators from the perspective of biodiversity (such as area of specific forest type, area fragmented, canopy fraction cover), vitality (such as VI) [2,44], carbon storage and productivity (such as above ground biomass and NPP) [12] were all selected as the indicators when detecting the forest degradation, and validated by field data or high resolution satellite data (user accuracy ranged from 82.00% to 88.00%, and producer accuracy ranged from 56.58% to 68.10%). In this paper, indicators from multi-scale remote sensing data on the basis of greenness (NDVI, EVI, RVI, LAI), vitality (FPAR) and productivity (NPP) were all taken into account, therefore, achieving a more persuasive and convincing result (overall accuracy 80.40% for MODIS data, and overall accuracy 84.35% for Landsat data).

4.2. Influence of Climate Map on Accuracy of Forest Degradation Detection

Forest sructure, function and degradation were sentitive to climate and climate changes [3]. In this study, we developed an appoach based on an improved Köppen–Geiger climate classification map to detect the degradated forest. To analyze the influence of this climate map on the accuracy of the results, we also validated the forest degradation area from remote sensing data using the data from the provincial ground survey when the climate map was not used in the classification tree model in Section 2.3.2 (R2 = 0.40 and RMSE = 12.65 × 10⁴ hectares from MODIS data, and R2 = 0.54 and RMSE = 6.58 × 10⁴ hectares from MODIS-Landsat data). A higher R2 and lower RMSE as shown in Figure 7 (R2 = 0.48 and RMSE = 7.37 × 10⁴ hectares from MODIS data, and R2 = 0.62 and RMSE = 4.73 × 10⁴ hectares from MODIS-Landsat data) indicated that the climate classification map could increase the accuracy in forest degradation detecting.

4.3. Uncertainly Analysis

The errors and uncertainly of the input data, and the method based on multi-scale remote sensing data would have some influence on the accuracy of the result in detecting forest degradation. Although MODIS VI, MODIS LAI/FPAR and MODIS NPP products have high accuracy [27,32,45], errors would certainly have some impact on the forest degradation model. Besides, results of this paper were cross validated by Landsat data. The scale difference between MODIS images (500 m) and Landsat images (30 m) would also bring some uncertainly when validating the degradation forest. Moreover, most MODIS 500 m pixels are mixed pixels, some other land-cover types existed in a mixed MODIS pixel. Land-cover changes from forest to a high vegetation density types (such as cropland and grassland), could not be detected using the coarse MODIS products [1]. Therefore, the changes of the land-cover could lead to some uncertainly when using MODIS products to describe the forest degradation. Finally, MODIS products were used to locate the forest degradation pixels, then Landsat ETM+ data were used to analyze the details in the degraded areas from MODIS datasets in this paper, leading to that some degraded areas outside the MODIS pixel were ignored, which could bring some omission of the degraded forest.

4.4. Limitations and Future Work

Time series MODIS data have potential to be used for detecting vegetation changes, hence, is applicable for identifying forest degradation processes in large-scale areas. But the starting time, ending time and the lasting term of the degradation trend was not expressed when using the linear regression. In the future, we may concentrate on the disturbances and breaks of the forest degradation trend by using the breakpoints analysis method, such as Breaks For Additive Season And Trend (BFAST) [45], and Detecting Breakpoints and Estimating Segments in Trend (DEBEST) [46]. Besides, forest degradation was difficult to detect and characterize using satellite observation images especially when trees were removed from forest with a high biomass or high vegetation density [1]. Lacking the field data of forest degradation, results of this paper were only cross validated by Landsat data. In the future, we may collect some field data to validate the results from remote sensing images. In addition, forest degradation events usually occur at a fine scale than easily available remote sensing data [47], but the cost of acquiring high resolution images over the same area makes routine monitoring problematic as the impact of visiting time and cloud [22]. Some data fusion methods may be adopted to generate data in both high spatial and temporal resolution to analyze the forest degradation process in future work.

5. Conclusions

This paper developed a quick and applicable approach for monitoring regional forest degradation in the Three-North Forest Shelterbelt Program area in China from multi-scale remote sensing data. Firstly, six indicators (NDVI, EVI, RVI, LAI, FPAR, NPP) from satellite observation data were selected to describe forest degradation. Then an approach to detect forest degradation using time series MODIS and Landsat ETM+ images was developed. At last, the degradation results were validated by ground survey data. Results of this paper demonstrated that multi-scale remote sensing data have great potential in monitoring regional forest degradation.
Generally, indicators used in this paper could detect a long term forest degradation effectively. And accuracy of forest degradation from MODIS-Landsat data was higher than that from MODIS data. Results of this paper also indicated that great achievements had been made since the implication of the Three-North Forest Shelterbelt Program in China. Most forest in the Three-North Forest Shelterbelt area was in good condition. The forest degradation was mainly located in the middle areas in Inner Mongolia, the northwestern areas in Xinjiang, the middle areas in Inner Mongolia, northern areas in Shannxi and Ningxia. In Liaoning, Jilin and Heilongjiang, some slight and moderate degradation also occurred in the forest.

Supplementary Materials

The following are available online at https://www.mdpi.com/2072-4292/13/6/1131/s1, Figure S1: Histograms of the indicators in a sliding window in the Köppen-Geiger BWk climate class, Figure S2: Histograms of the indicators in a sliding window in the Köppen-Geiger BSk climate class.

Author Contributions

Data curation, T.Y., P.L. and Y.R.; writing—original draft preparation, T.Y. and Q.Z.; writing—review and editing, P.L.; visualization, J.Y.; funding acquisition, P.L. All authors have read and agreed to the published version of the manuscript.

Funding

This research was funded by “The Three North Shelterbelt System Engineering Management and Service Platform” from the Three North Shelterbelt Program Construction Bureau of National Forestry and Grassland Administration of China.

Data Availability Statement

All data used during the study are available at https://modis.gsfc.nasa.gov/data/, https://earthexplorer.usgs.gov/ (accessed on 8 February 2021).

Acknowledgments

This research was funded by “The Three North Shelterbelt System Engineering Management and Service Platform” from the Three North Shelterbelt Program Construction Bureau of National Forestry and Grassland Administration of China. We also thank for the reviewer’s insightful suggestions.

Conflicts of Interest

The authors declare no conflict of interest.

References

  1. Bewernick, T. Mapping Forest Degradation in the Mau Forest Complex Using NDFI Time Series; Wageningen University: Wageningen, The Netherlands, 2016. [Google Scholar]
  2. Bullock, E.L.; Woodcock, C.E.; Olofsson, P. Monitoring tropical forest degradation using spectral unmixing and Landsat time series analysis. Remote Sens. Environ. 2020, 238, 110968. [Google Scholar] [CrossRef]
  3. Grinand, C.; Rakotomalala, F.; Gond, V.; Vaudry, R.; Bernoux, M.; Vieilledent, G. Estimating deforestation in tropical humid and dry forests in Madagascar from 2000 to 2010 using multi-date Landsat satellite images and the random forests classifier. Remote Sens. Environ. 2013, 139, 68–80. [Google Scholar] [CrossRef]
  4. Cui, T.; Sun, R.; Xiao, Z.; Liang, Z.; Wang, J. Simulating spatially distributed solar-induced chlorophyll fluorescence using a BEPS-SCOPE coupling framework. Agric. For. Meteorol. 2020, 295, 108169. [Google Scholar] [CrossRef]
  5. Berenguer, E.; Ferreira, J.; Gardner, T.A.; Aragão, L.E.O.C.; De Camargo, P.B.; Cerri, C.E.; Durigan, M.; De Oliveira, R.C.; Vieira, I.C.G.; Barlow, J. A large-scale field assessment of carbon stocks in human-modified tropical forests. Glob. Chang. Biol. 2014, 20, 3713–3726. [Google Scholar] [CrossRef] [PubMed] [Green Version]
  6. Baccini, A.; Walker, W.; Carvalho, L.; Farina, M.; Sulla-Menashe, D.; Houghton, R.A. Tropical forests are a net carbon source based on aboveground measurements of gain and loss. Science 2017, 358, 230–234. [Google Scholar] [CrossRef] [Green Version]
  7. Pearson, T.R.; Brown, S.; Murray, L.; Sidman, G. Greenhouse gas emissions from tropical forest degradation: An underestimated source. Carbon Balance Manag. 2017, 12, 1–11. [Google Scholar] [CrossRef] [PubMed] [Green Version]
  8. Bradley, B.A.; Jacob, R.W.; Hermance, J.F.; Mustard, J.F. A curve fitting procedure to derive inter-annual phenologies from time series of noisy satellite NDVI data. Remote Sens. Environ. 2007, 106, 137–145. [Google Scholar] [CrossRef]
  9. Lunetta, R.S.; Knight, J.F.; Ediriwickrema, J.; Lyon, J.G.; Worthy, L.D. Land-cover change detection using multi-temporal MODIS NDVI data. Remote Sens. Environ. 2006, 105, 142–154. [Google Scholar] [CrossRef]
  10. Spruce, J.P.; Sader, S.; Ryan, R.E.; Smoot, J.; Kuper, P.; Ross, K.; Pradose, D.; Russellf, J.; Gasserg, G.; McKelliph, R.; et al. Assessment of MODIS NDVI time series data products for detecting forest defoliation by gypsy moth outbreaks. Remote Sens. Environ. 2011, 115, 427–437. [Google Scholar] [CrossRef]
  11. Souza, C.M., Jr.; Siqueira, J.V.; Sales, M.H.; Fonseca, A.V.; Ribeiro, J.G.; Numata, I.; Cochrane, M.A.; Barber, C.P.; Roberts, D.A.; Barlow, J. Ten-year Landsat classification of deforestation and forest degradation in the Brazilian Amazon. Remote Sens. 2013, 5, 5493–5513. [Google Scholar] [CrossRef] [Green Version]
  12. Romero-Sanchez, M.E.; Ponce-Hernandez, R. Assessing and monitoring forest degradation in a deciduous tropical forest in Mexico via remote sensing indicators. Forests 2017, 8, 302. [Google Scholar] [CrossRef]
  13. Wang, C.; Qi, J.; Cochrane, M. Assessment of tropical forest degradation with canopy fractional cover from Landsat ETM+ and IKONOS imagery. Earth Interact. 2005, 9, 1–18. [Google Scholar] [CrossRef]
  14. Wang, H.; Pu, R.; Zhu, Q.; Ren, L.; Zhang, Z. Mapping health levels of Robinia pseudoacacia forests in the Yellow River delta, China, using IKONOS and Landsat 8 OLI imagery. Int. J. Remote Sens. 2015, 36, 1114–1135. [Google Scholar] [CrossRef]
  15. Hamunyela, E. Space-Time Monitoring of Tropical Forest Changes USING Observations from Multiple Satellites. Ph.D. Thesis, Wageningen University & Research, Laboratory of Geo-Information Science and Remote Sensing, Wageningen, The Netherlands, 2017. [Google Scholar]
  16. Lee, S.H.; Cho, H.K. Detection of the pine trees damaged by pine wilt disease using high spatial remote sensing data. In Proceedings of the ISPRS Commission VII Symposium “Remote Sensing: From Pixels to Processes”, Enschede, The Netherlands, 8–11 May 2006. [Google Scholar]
  17. Lambert, J.; Drenou, C.; Denux, J.P.; Balent, G.; Cheret, V. Monitoring forest decline through remote sensing time series analysis. GISci. Remote Sens. 2013, 50, 437–457. [Google Scholar] [CrossRef]
  18. Ogaya, R.; Barbeta, A.; Başnou, C.; Peñuelas, J. Satellite data as indicators of tree biomass growth and forest dieback in a Mediterranean holm oak forest. Ann. Forest Sci. 2015, 72, 135–144. [Google Scholar] [CrossRef] [Green Version]
  19. Wang, C.; Lu, Z.; Haithcoat, T.L. Using landsat images to detect oak decline in the Mark Twain national forest, Ozark highlands. For. Ecol. Manag. 2007, 240, 70–78. [Google Scholar] [CrossRef]
  20. Skakun, R.S.; Wulder, M.A.; Franklin, S.E. Sensitivity of the thematic mapper enhanced wetness difference index to detect mountain pine beetle red-attack damage. Remote Sens. Environ. 2003, 86, 433–443. [Google Scholar] [CrossRef]
  21. Hashim, M.; Pour, A.B.; Wei, C.K. Comparison of ETM+ and MODIS data for tropical forest degradation monitoring in the Peninsular Malaysia. J. Indian Soc. Remote. 2014, 42, 383–396. [Google Scholar] [CrossRef]
  22. Mitchell, A.L.; Rosenqvist, A.; Mora, B. Current remote sensing approaches to monitoring forest degradation in support of countries measurement, reporting and verification (MRV) systems for REDD+. Carbon Balance Manag. 2017, 12, 1–22. [Google Scholar] [CrossRef] [PubMed] [Green Version]
  23. Haywood, A.; Stone, C. Mapping eucalypt forest susceptible to dieback associated with bell miners (Manorina melanophys) using laser scanning, SPOT 5 and ancillary topographical data. Ecol. Model. 2011, 222, 1174–1184. [Google Scholar] [CrossRef]
  24. Wang, H.; Zhao, Y.; Pu, R.; Zhang, Z. Mapping Robinia pseudoacacia forest health conditions by using combined spectral, spatial, and textural information extracted from IKONOS imagery and random forest classifier. Remote Sens. 2015, 7, 9020–9044. [Google Scholar] [CrossRef] [Green Version]
  25. Zhu, J.; Zheng, X.; Wang, G.; Wu, B.; Liu, S.; Yan, C.; Li, Y.; Sun, Y.; Yan, Q.; Zeng, Y.; et al. Assessment of the world largest afforestation program: Success, failure, and future directions. BioRxiv 2017, 10, 105619. [Google Scholar]
  26. Li, M.; Liu, A.; Zou, C.; Xu, W.; Shimizu, H.; Wang, K. An overview of the “Three-North” Shelterbelt project in China. For. Stud. China 2012, 14, 70–79. [Google Scholar] [CrossRef]
  27. Ramon Solano, R.; Didan, K.; Jacobson, A.; Huete, A. Modis Vegetation Index User’s Guide; The University of Arizona: Tucson, AZ, USA, 2010. [Google Scholar]
  28. MODIS Vegetation Index Products. Available online: https://modis.gsfc.nasa.gov/data/dataprod/mod13.php (accessed on 5 January 2021).
  29. MODIS Leaf Area Index/FPAR Products. Available online: https://modis.gsfc.nasa.gov/data/dataprod/mod15.php (accessed on 5 January 2021).
  30. Knyazikhin, Y.; Glassy, J.; Privette, J.L.; Tian, Y.; Lotsch, A.; Zhang, Y.; Wang, Y.; Morisette, J.T.; Votava, T.; Myneni, R.B.; et al. MODIS Leaf Area Index (LAI) and Fraction of Photosynthetically Active Radiation Absorbed by Vegetation (FPAR) Product (MOD15) Algorithm Theoretical Basis Document. 1999. Available online: http://eospso.gsfc.nasa.gov/atbd/modistables.html (accessed on 5 January 2021).
  31. MODIS GPP/NPP Products. Available online: https://modis.gsfc.nasa.gov/data/dataprod/mod17.php (accessed on 5 January 2021).
  32. Running, S.W.; Zhao, M.S. User’s Guide. Daily GPP and Annual NPP (MOD17A2/A3) Products NASA Earth Observing SystemMODIS Land Algorithm. Version 3.0 for Collection 6. 2015. Available online: https://lpdaac.usgs.gov/sites/default/files/public/product_documentation/mod17_user_guide.pdf (accessed on 5 January 2021).
  33. United States Geological Survey. Available online: https://earthexplorer.usgs.gov (accessed on 5 January 2021).
  34. Beck, H.E.; Zimmermann, N.E.; Mcvicar, T.R.; Vergopolan, N.; Wood, E.F. Present and future kppen-geiger climate classification maps at 1-km resolution. Sci. Data 2018, 5, 180214. [Google Scholar] [CrossRef] [PubMed] [Green Version]
  35. National Forestry and Grassland Administration of China. Technical Regulation for the Restoration of Degraded Protective Forest (LY/T 3179—2020); NFGA: Beijing, China, 2020.
  36. Keith, H.; Mackey, B.; Berry, S.; Lindenmayer, D.; Gibbons, P. Estimating carbon carrying capacity in natural forest ecosystems across heterogeneous landscapes: Addressing sources of error. Glob. Chang. Biol. 2010, 16, 2971–2989. [Google Scholar] [CrossRef]
  37. Puyravaud, J.P. Standardising the calculation of the annual rate of deforestation. Forest Ecol. Manag. 2003, 177, 593–596. [Google Scholar] [CrossRef]
  38. Gupta, R.K.; Prasad, S.; Nadham, T.S.V.; Rao, G.H. Relative sensitivity of district mean RVI and NDVI over an agrometeorological zone. Adv. Space Res. 1993, 13, 261–264. [Google Scholar] [CrossRef]
  39. Huete, A.; Didan, K.; Miura, T.; Rodriguez, E.P.; Gao, X.; Ferreira, L.G. Overview of the radiometric and biophysical performance of the MODIS vegetation indices. Remote Sens. Environ. 2002, 83, 195–213. [Google Scholar] [CrossRef]
  40. Wang, Q.; Adiku, S.; Tenhunen, J.; André, G. On the relationship of ndvi with leaf area index in a deciduous forest site. Remote Sens. Environ. 2005, 94, 244–255. [Google Scholar] [CrossRef]
  41. Fensholt, R.; Sandholt, I.; Rasmussen, M.S. Evaluation of MODIS LAI, FAPAR and the relation between FAPAR and NDVI in a semi-arid environment using in situ measurements. Remote Sens. Environ. 2004, 91, 490–507. [Google Scholar] [CrossRef]
  42. Turner, D.P.; Ritts, W.D.; Cohen, W.B.; Gower, S.T.; Running, S.W.; Zhao, M.; Costa, M.H.; Kirschbaum, A.A.; Ham, J.M.; Saleska, S.R.; et al. Evaluation of MODIS NPP and GPP products across multiple biomes. Remote Sens. Environ. 2006, 102, 282–292. [Google Scholar] [CrossRef]
  43. Thompson, I.D.; Guariguata, M.R.; Okabe, K.; Bahamondez, C.; Nasi, R.; Heymell, V.; Sabogal, C. An operational framework for defining and monitoring forest degradation. Ecol. Soc. 2013, 18, 18. [Google Scholar] [CrossRef]
  44. Eckert, S.; Hüsler, F.; Liniger, H.; Hodel, E. Trend analysis of MODIS NDVI time series for detecting land degradation and regeneration in Mongolia. J. Arid Environ. 2015, 113, 16–28. [Google Scholar] [CrossRef]
  45. Verbesselt, J.; Hyndman, R.; Newnham, G.; Culvenor, D. Detecting trend and seasonal changes in satellite image time series. Remote Sens. Environ. 2010, 114, 106–115. [Google Scholar] [CrossRef]
  46. Jamali, S.; Jönsson, P.; Eklundh, L.; Ardö, J.; Seaquist, J. Detecting changes in vegetation trends using time series segmentation. Remote Sens. Environ. 2015, 156, 182–195. [Google Scholar] [CrossRef]
  47. Franke, J.; Navratil, P.; Keuck, V.; Peterson, K.; Siegert, F. Monitoring fire and selective logging activities in tropical peat swamp forests. IEEE J. Sel. Top. Appl. Earth Obs. Remote Sens. 2012, 5, 1811–1820. [Google Scholar] [CrossRef]
Figure 1. Location of Three-North Forest Shelterbelt Program in China. The program locates in the semi-arid and arid lands in the northeastern, the northern and northwestern provinces of China.
Remotesensing 13 01131 g001
Figure 2. Flowchart of detecting forest degradation from MODerate Resolution Imaging Spectroradiometer (MODIS) and Landsat Enhanced Thematic Mapper Plus (ETM+) data. Regression models were adopted to analyze the trend from MODIS Products, then a classification model was established to analyze the degradation level, ETM+ data were used to obtain details in the degraded MODIS pixels.
Remotesensing 13 01131 g002
Figure 3. Trends of the indicators from 2000 to 2010 in the Three-North Forest Shelterbelt. (a) Normalized Difference Vegetation Index (NDVI) trend; (b) Enhanced Vegetation Index (EVI) trend; (c) Ratio Vegetation Index (RVI) trend; (d) Leaf Area Index (LAI) trend; (e) Fraction of Photosynthetically Active Radiation (FPAR) trend; (f) Net Primary Production (NPP) trend.
Remotesensing 13 01131 g003
Figure 4. Forest degradation from MODIS data and MODIS-Landsat data. (a) was obtained from MODIS products (500 m), then Landsat ETM+ data were used to analyze the details in the degraded MODIS pixels, shown in (b) (30 m).
Remotesensing 13 01131 g004
Figure 5. Forest degradation area from remote sensing data and ground survey data. Degradation area from ground survey data is lower than that from remote sensing data in most province.
Remotesensing 13 01131 g005
Figure 6. Forest degradation maps (30 m in typical areas (a) Maowusu; (b) Hulun Buir; (c) Khorchin; (d) Loess Plateau. These maps were derived from the degradation rate from Landsat data.
Remotesensing 13 01131 g006
Figure 7. Validation of degradation area from remote sensing data against ground survey data. (a) is the validation from MODIS data, and (b) is the validation from MODIS-Landsat data. Forest degradation from MODIS-Landsat data achieved a better precision.
Remotesensing 13 01131 g007
Table 1. Accuracy of forest degradation from MODIS data.
Mean Producer’s Accuracy(%)Mean User’s Accuracy(%)Overall Accuracy(%)Kappa Coefficient
Maowusu80.7480.1380.640.77
Hulun Buir84.8985.4583.320.80
Khorchin82.5578.7480.220.81
Loess Plateau81.5476.5577.410.76
Average82.4380.2280.400.79
Table 2. Accuracy of forest degradation from MODIS-Landsat data.
Mean Producer’s Accuracy(%)Mean User’s Accuracy(%)Overall Accuracy(%)Kappa Coefficient
Maowusu88.5480.6384.780.81
Hulun Buir79.3788.5486.470.83
Khorchin86.2383.5583.500.85
Loess Plateau83.1079.6582.650.80
Average84.3283.0984.350.82
Table 3. Comparison of the accuracy of forest degradation detection from satellite data.
CriterionIndicatorsDataValidation DataAccuracyReference
Carbon storage and ProductionNPP, AGBLandsat ETM+Imagery from Google Earth, Forest Inventory Sampling PlotsR2: 0.48~0.90[12]
BiodiversityCFCLandsat ETM+IKONOSR2: 0.80[13]
MODIS, Landsat TMField data, MODIS EvapotranspirationR2: 0.704~0.843[21]
VitalityNDVIMODIS,Landsat TM, in-situ obervations [44]
NDFILandsat ETM+/OLIField dataUser accuracy: 84.31%, Producer accuracy: 56.58%[1]
Landsat ETM+/OLIField dataUser accuracy: 88.00%, Producer accuracy: 68.10%[2]
Landsat ETM+SpotUser accuracy: 82.00%[11]
Publisher’s Note: MDPI stays neutral with regard to jurisdictional claims in published maps and institutional affiliations.

