An Evaluation of the Effects of UAS Flight Parameters on Digital Aerial Photogrammetry Processing and Dense-Cloud Production Quality in a Scots Pine Forest
Abstract
1. Introduction
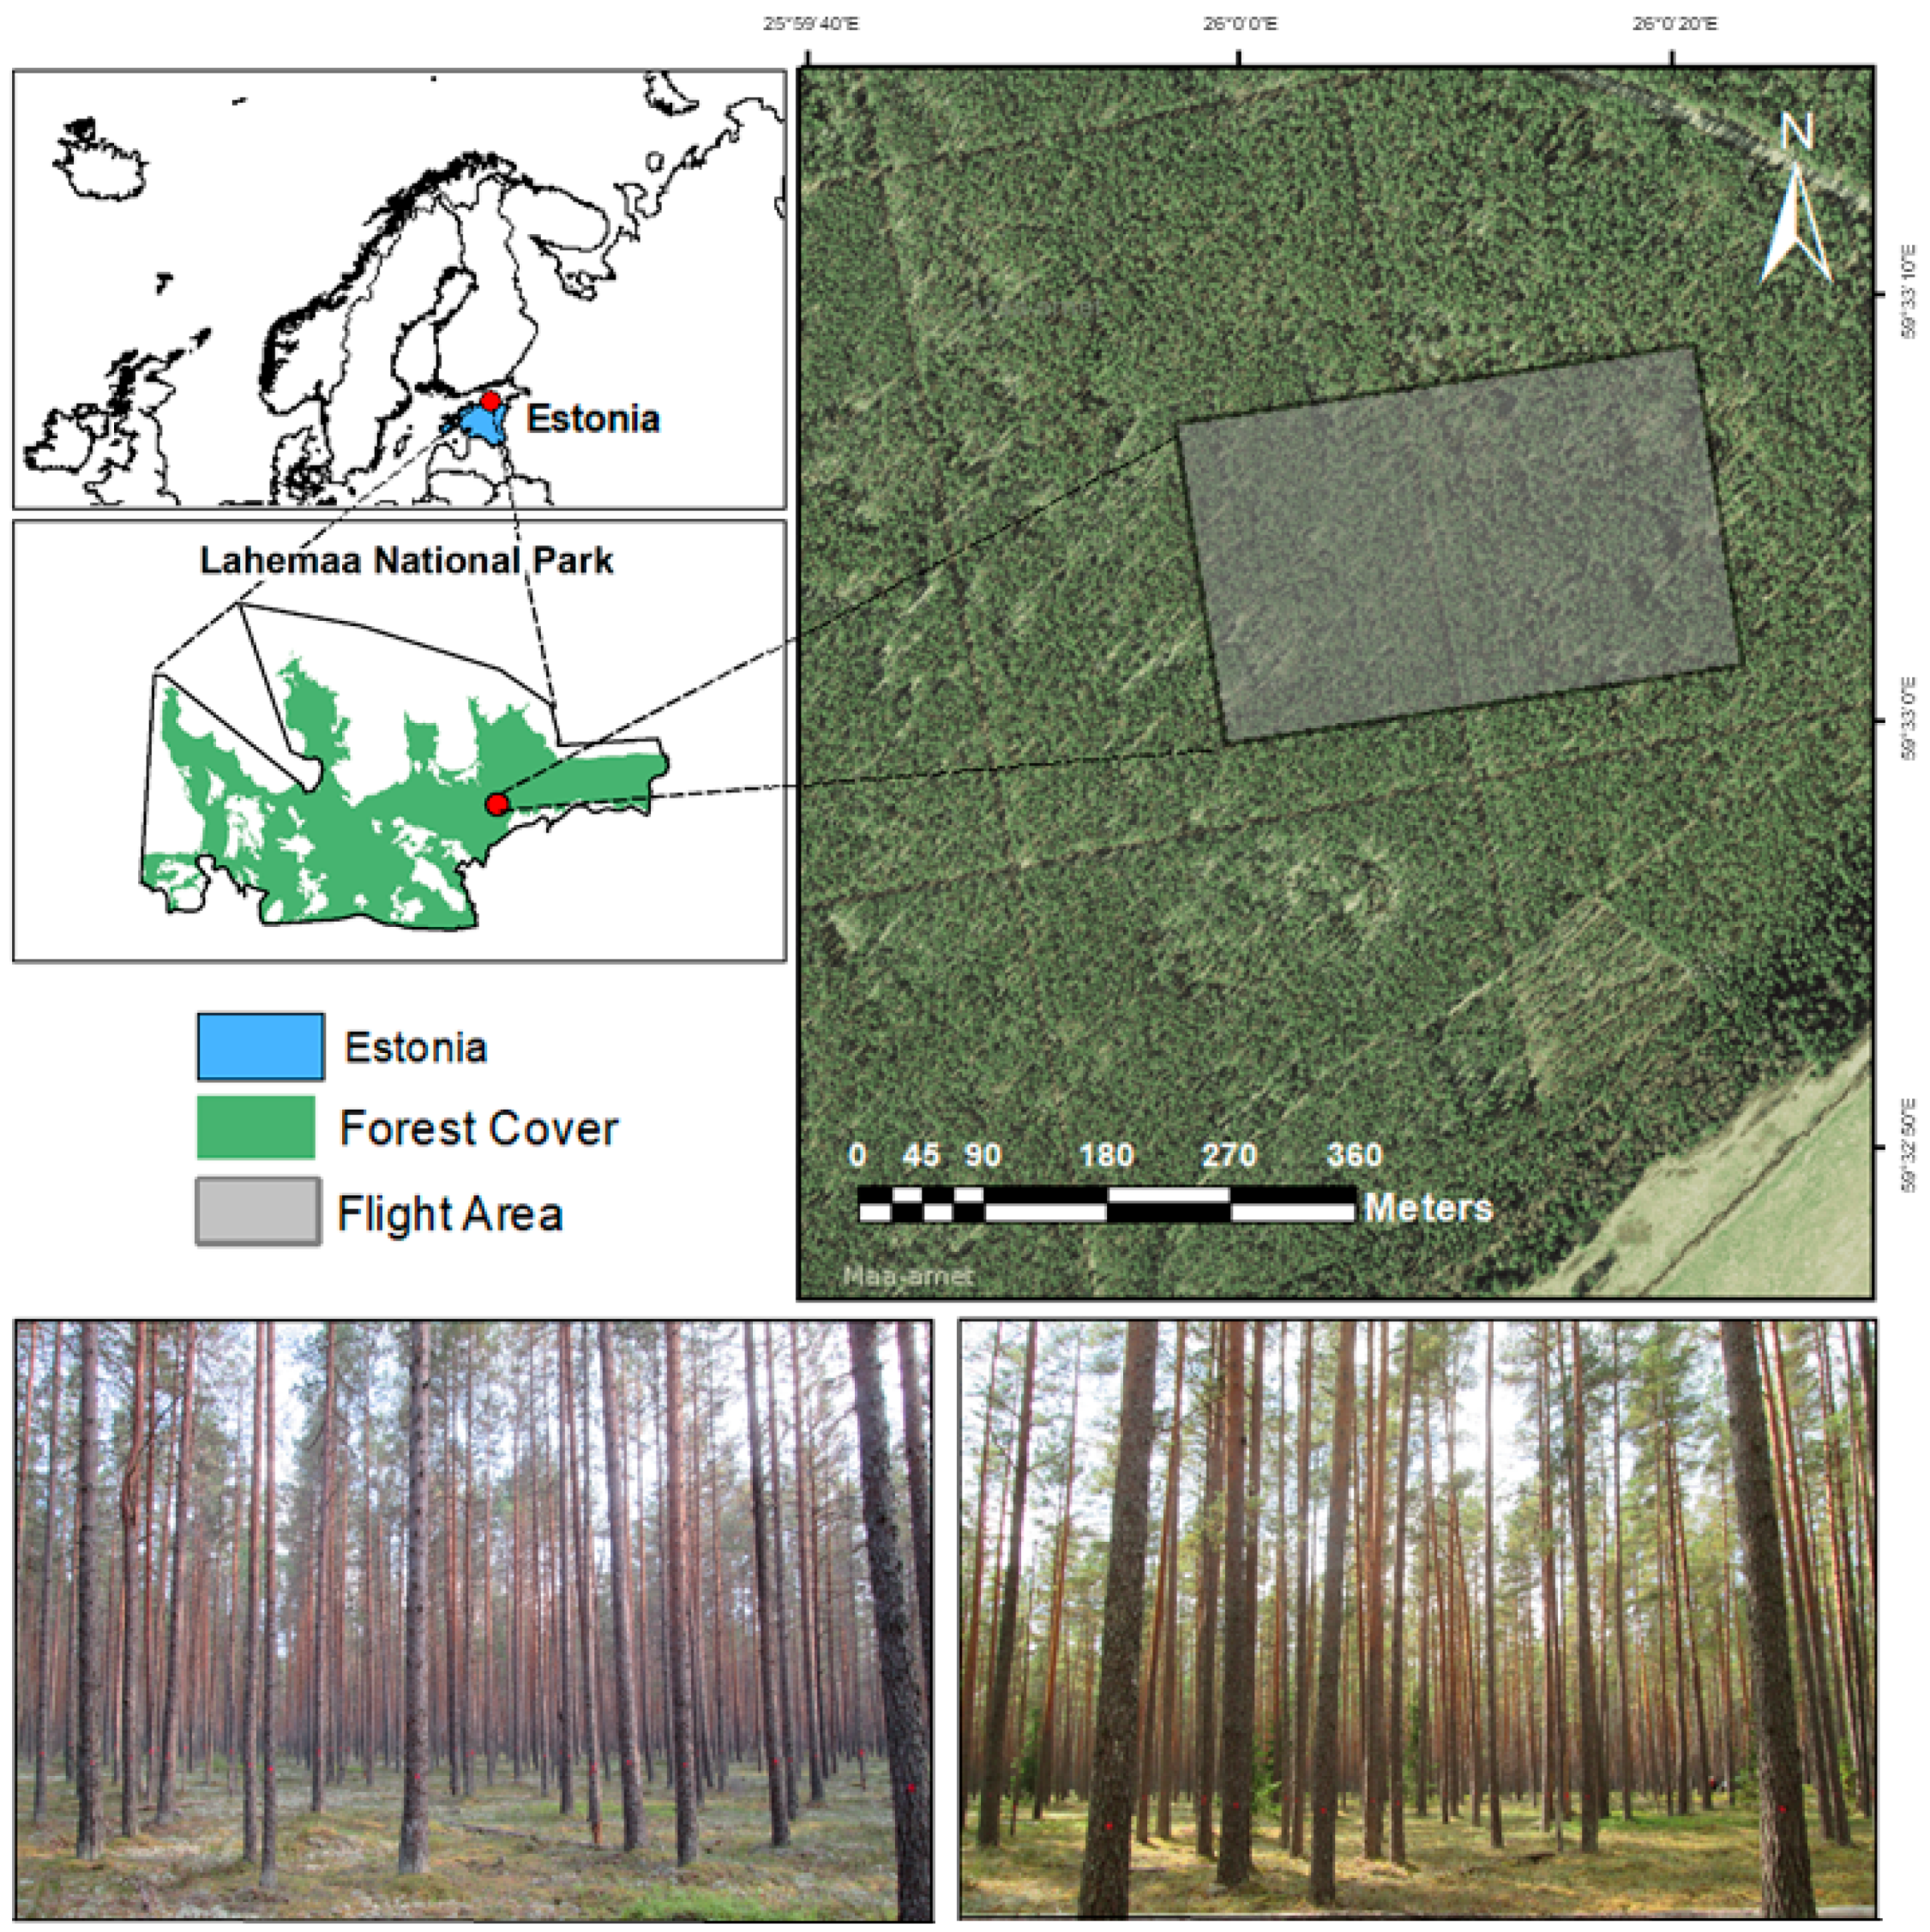
2. Study Area
3. Methodology
3.1. Data Acquisition
3.2. Data Processing
3.3. Statistical Analyses
4. Results
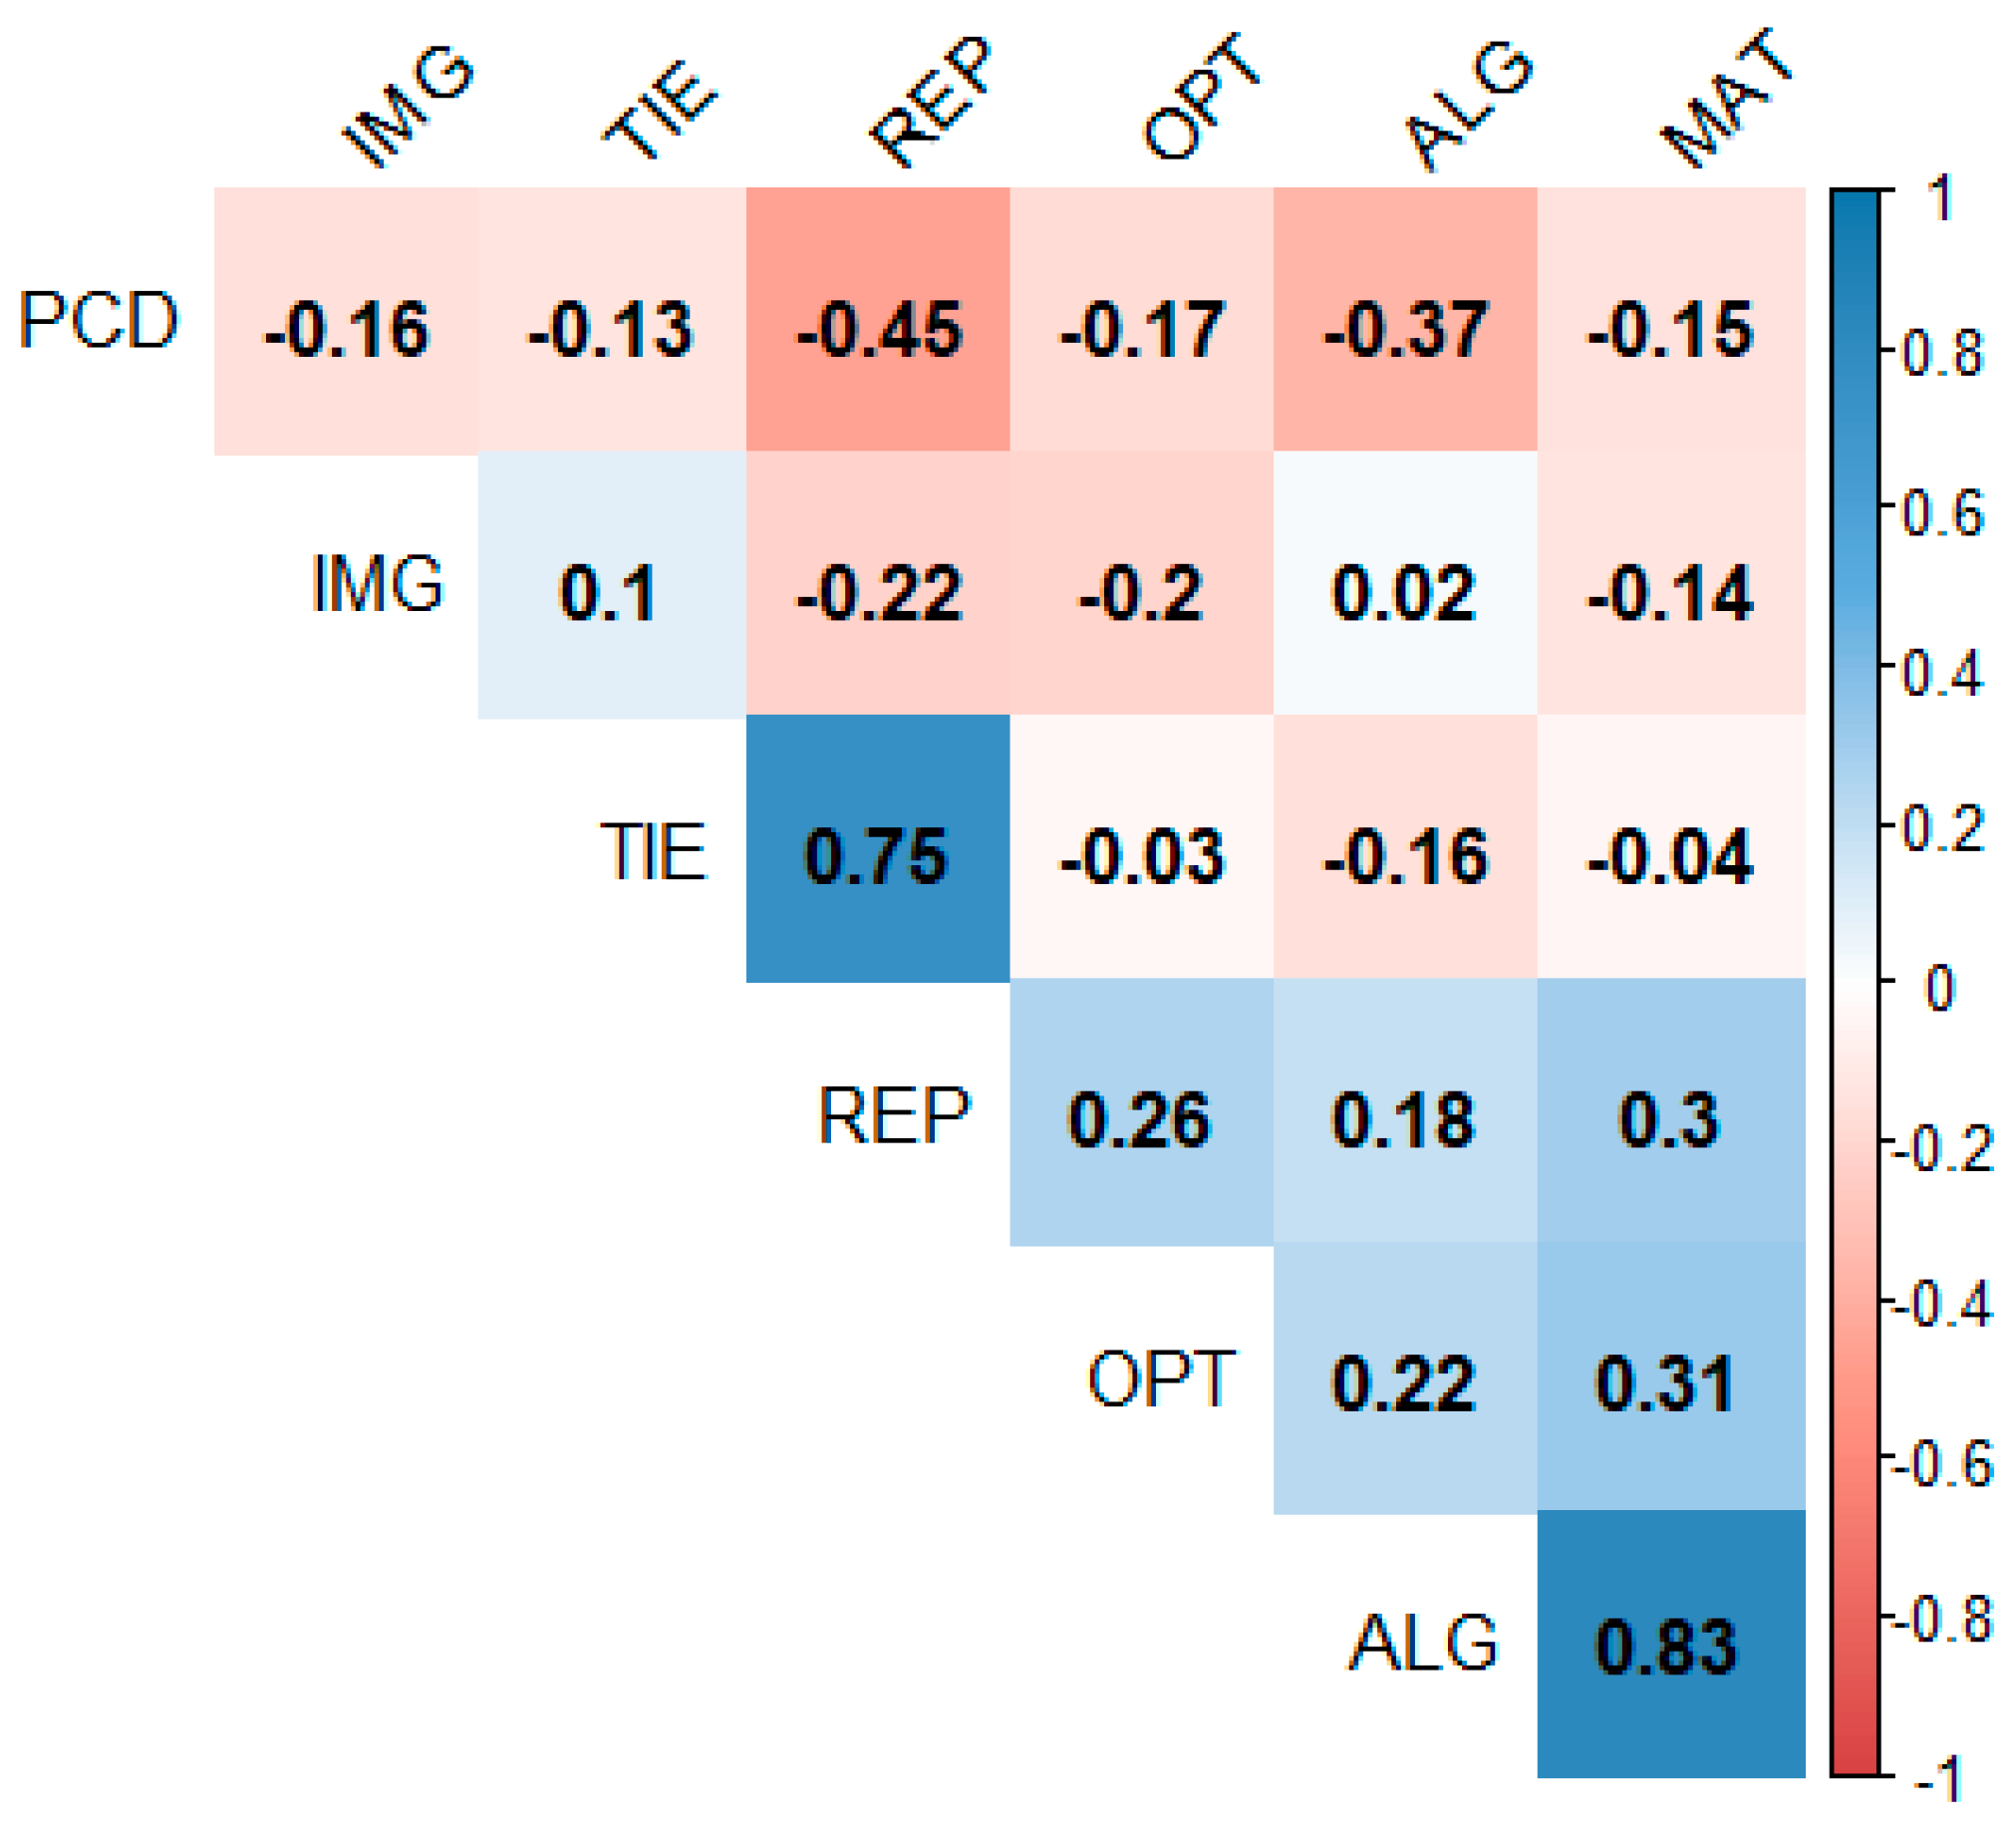
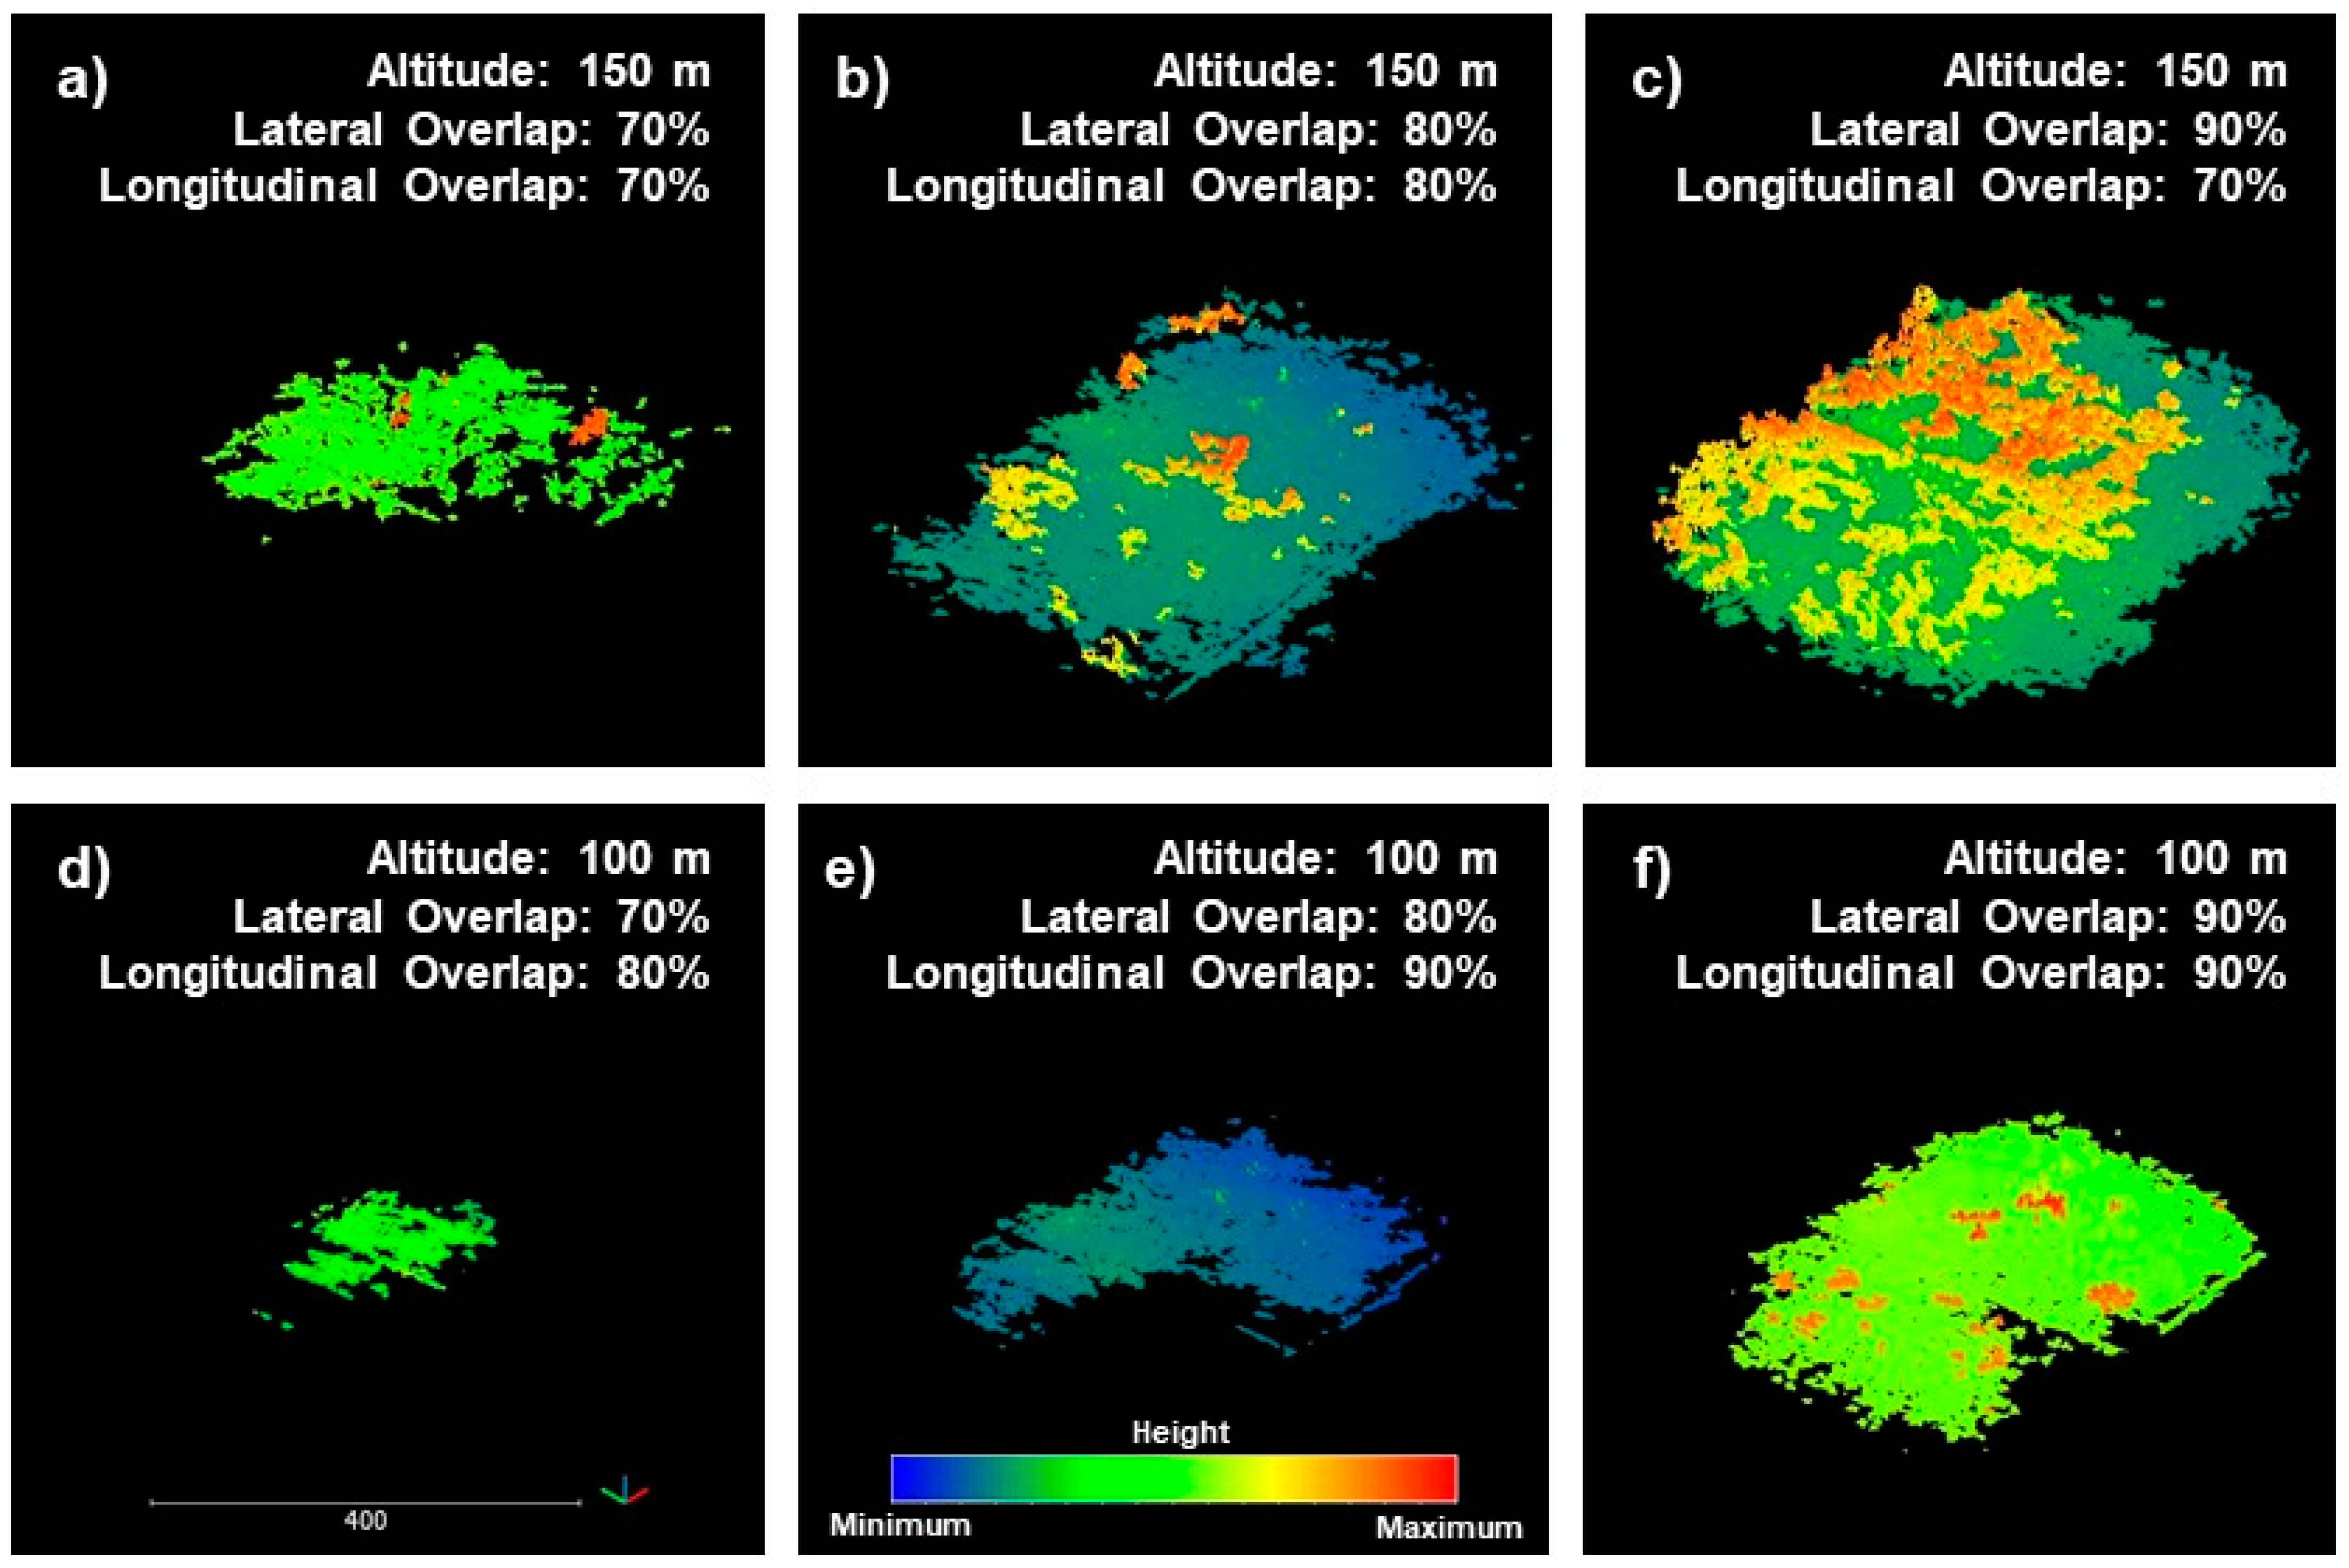
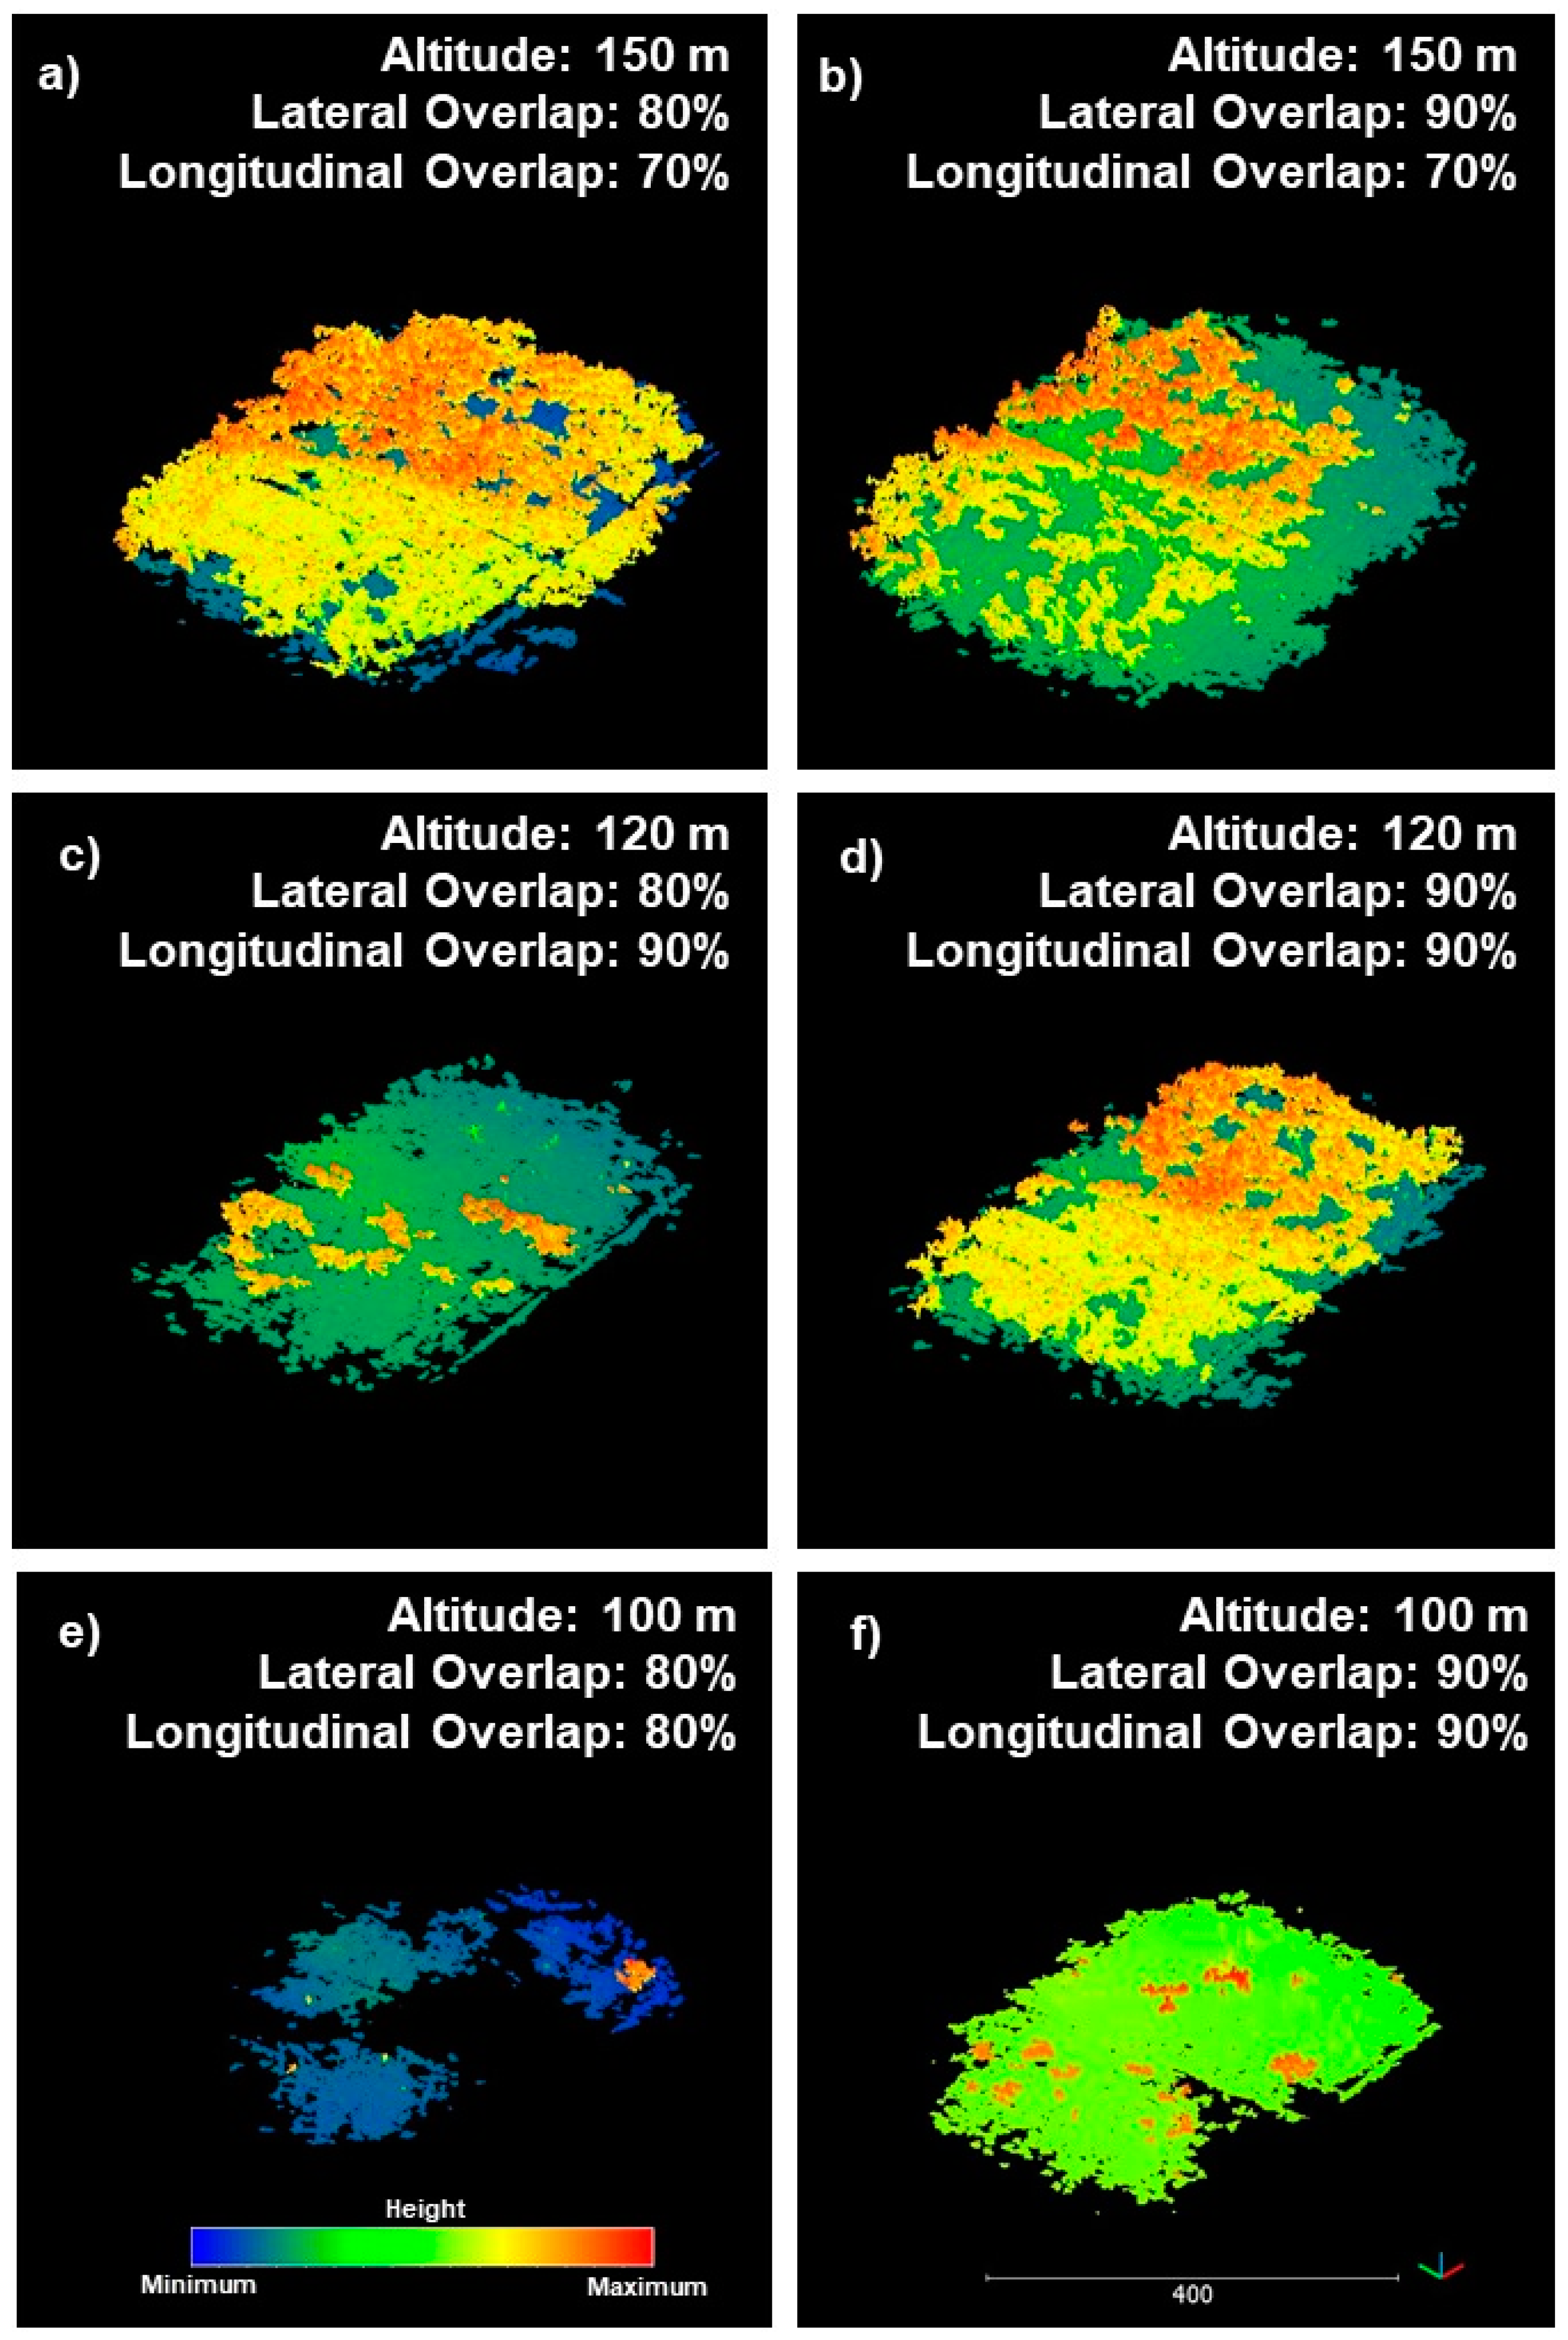
4.1. Effects of UAS Flight Setting on Quality of DAP Processing
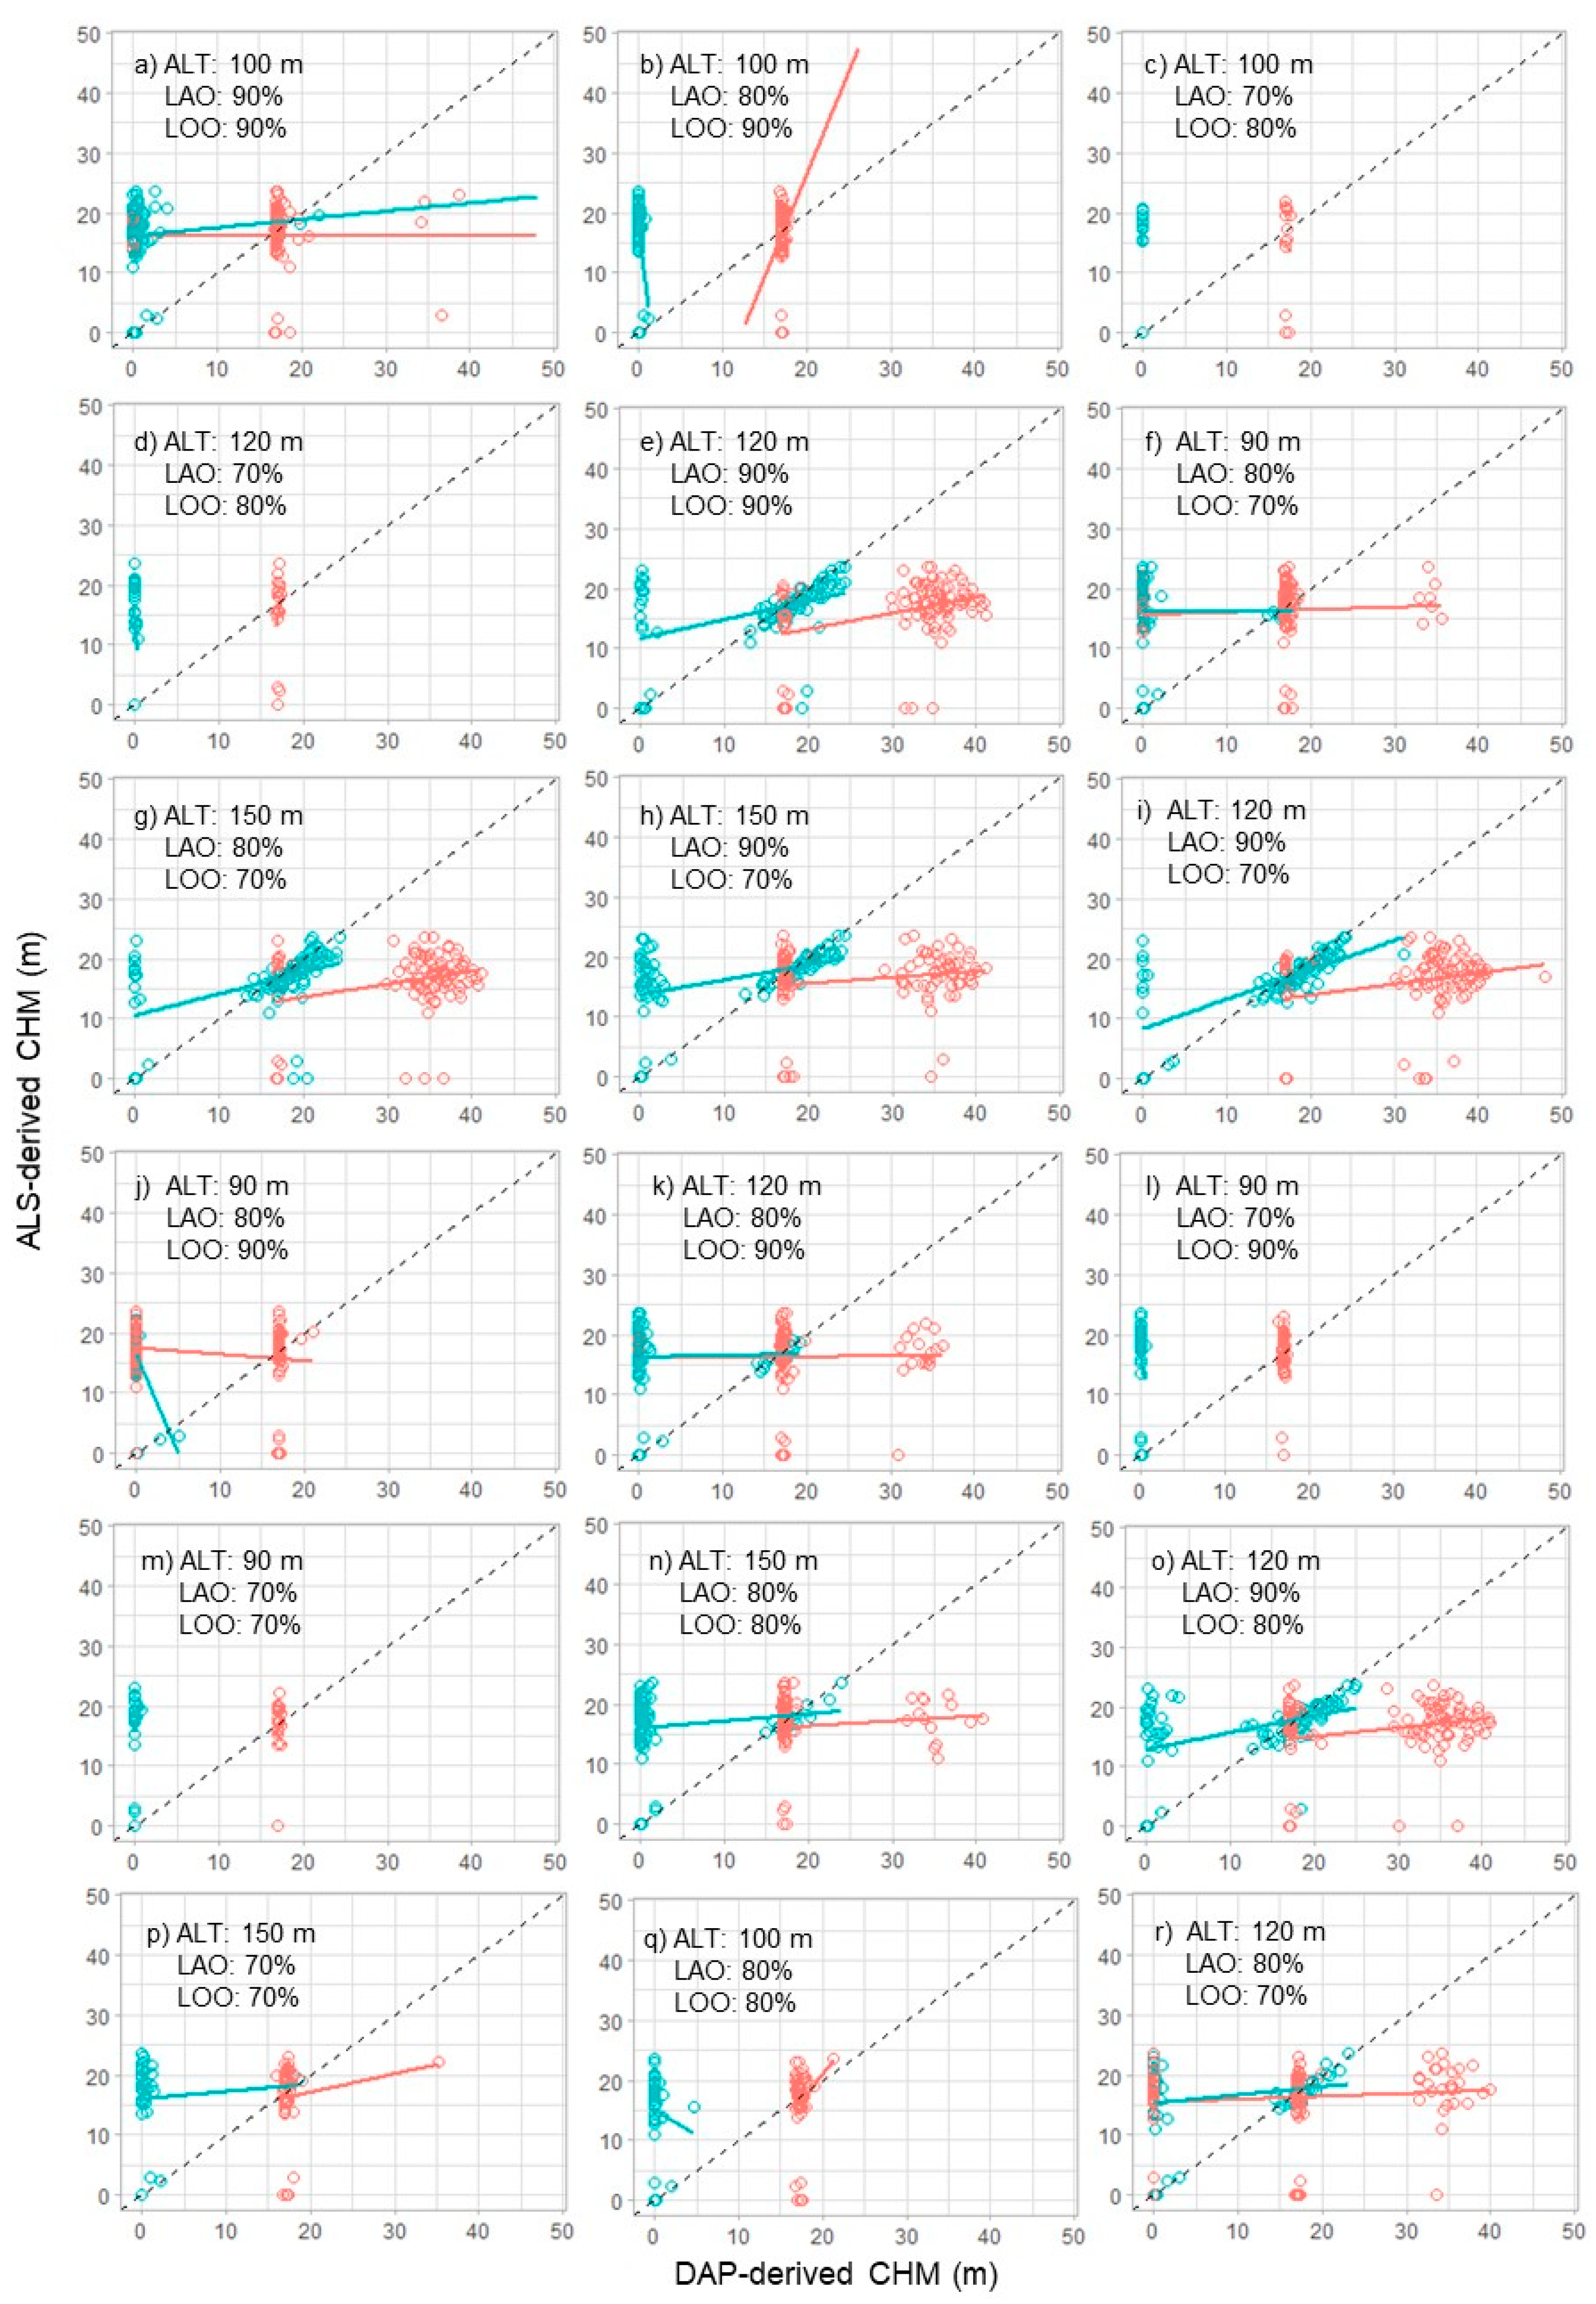
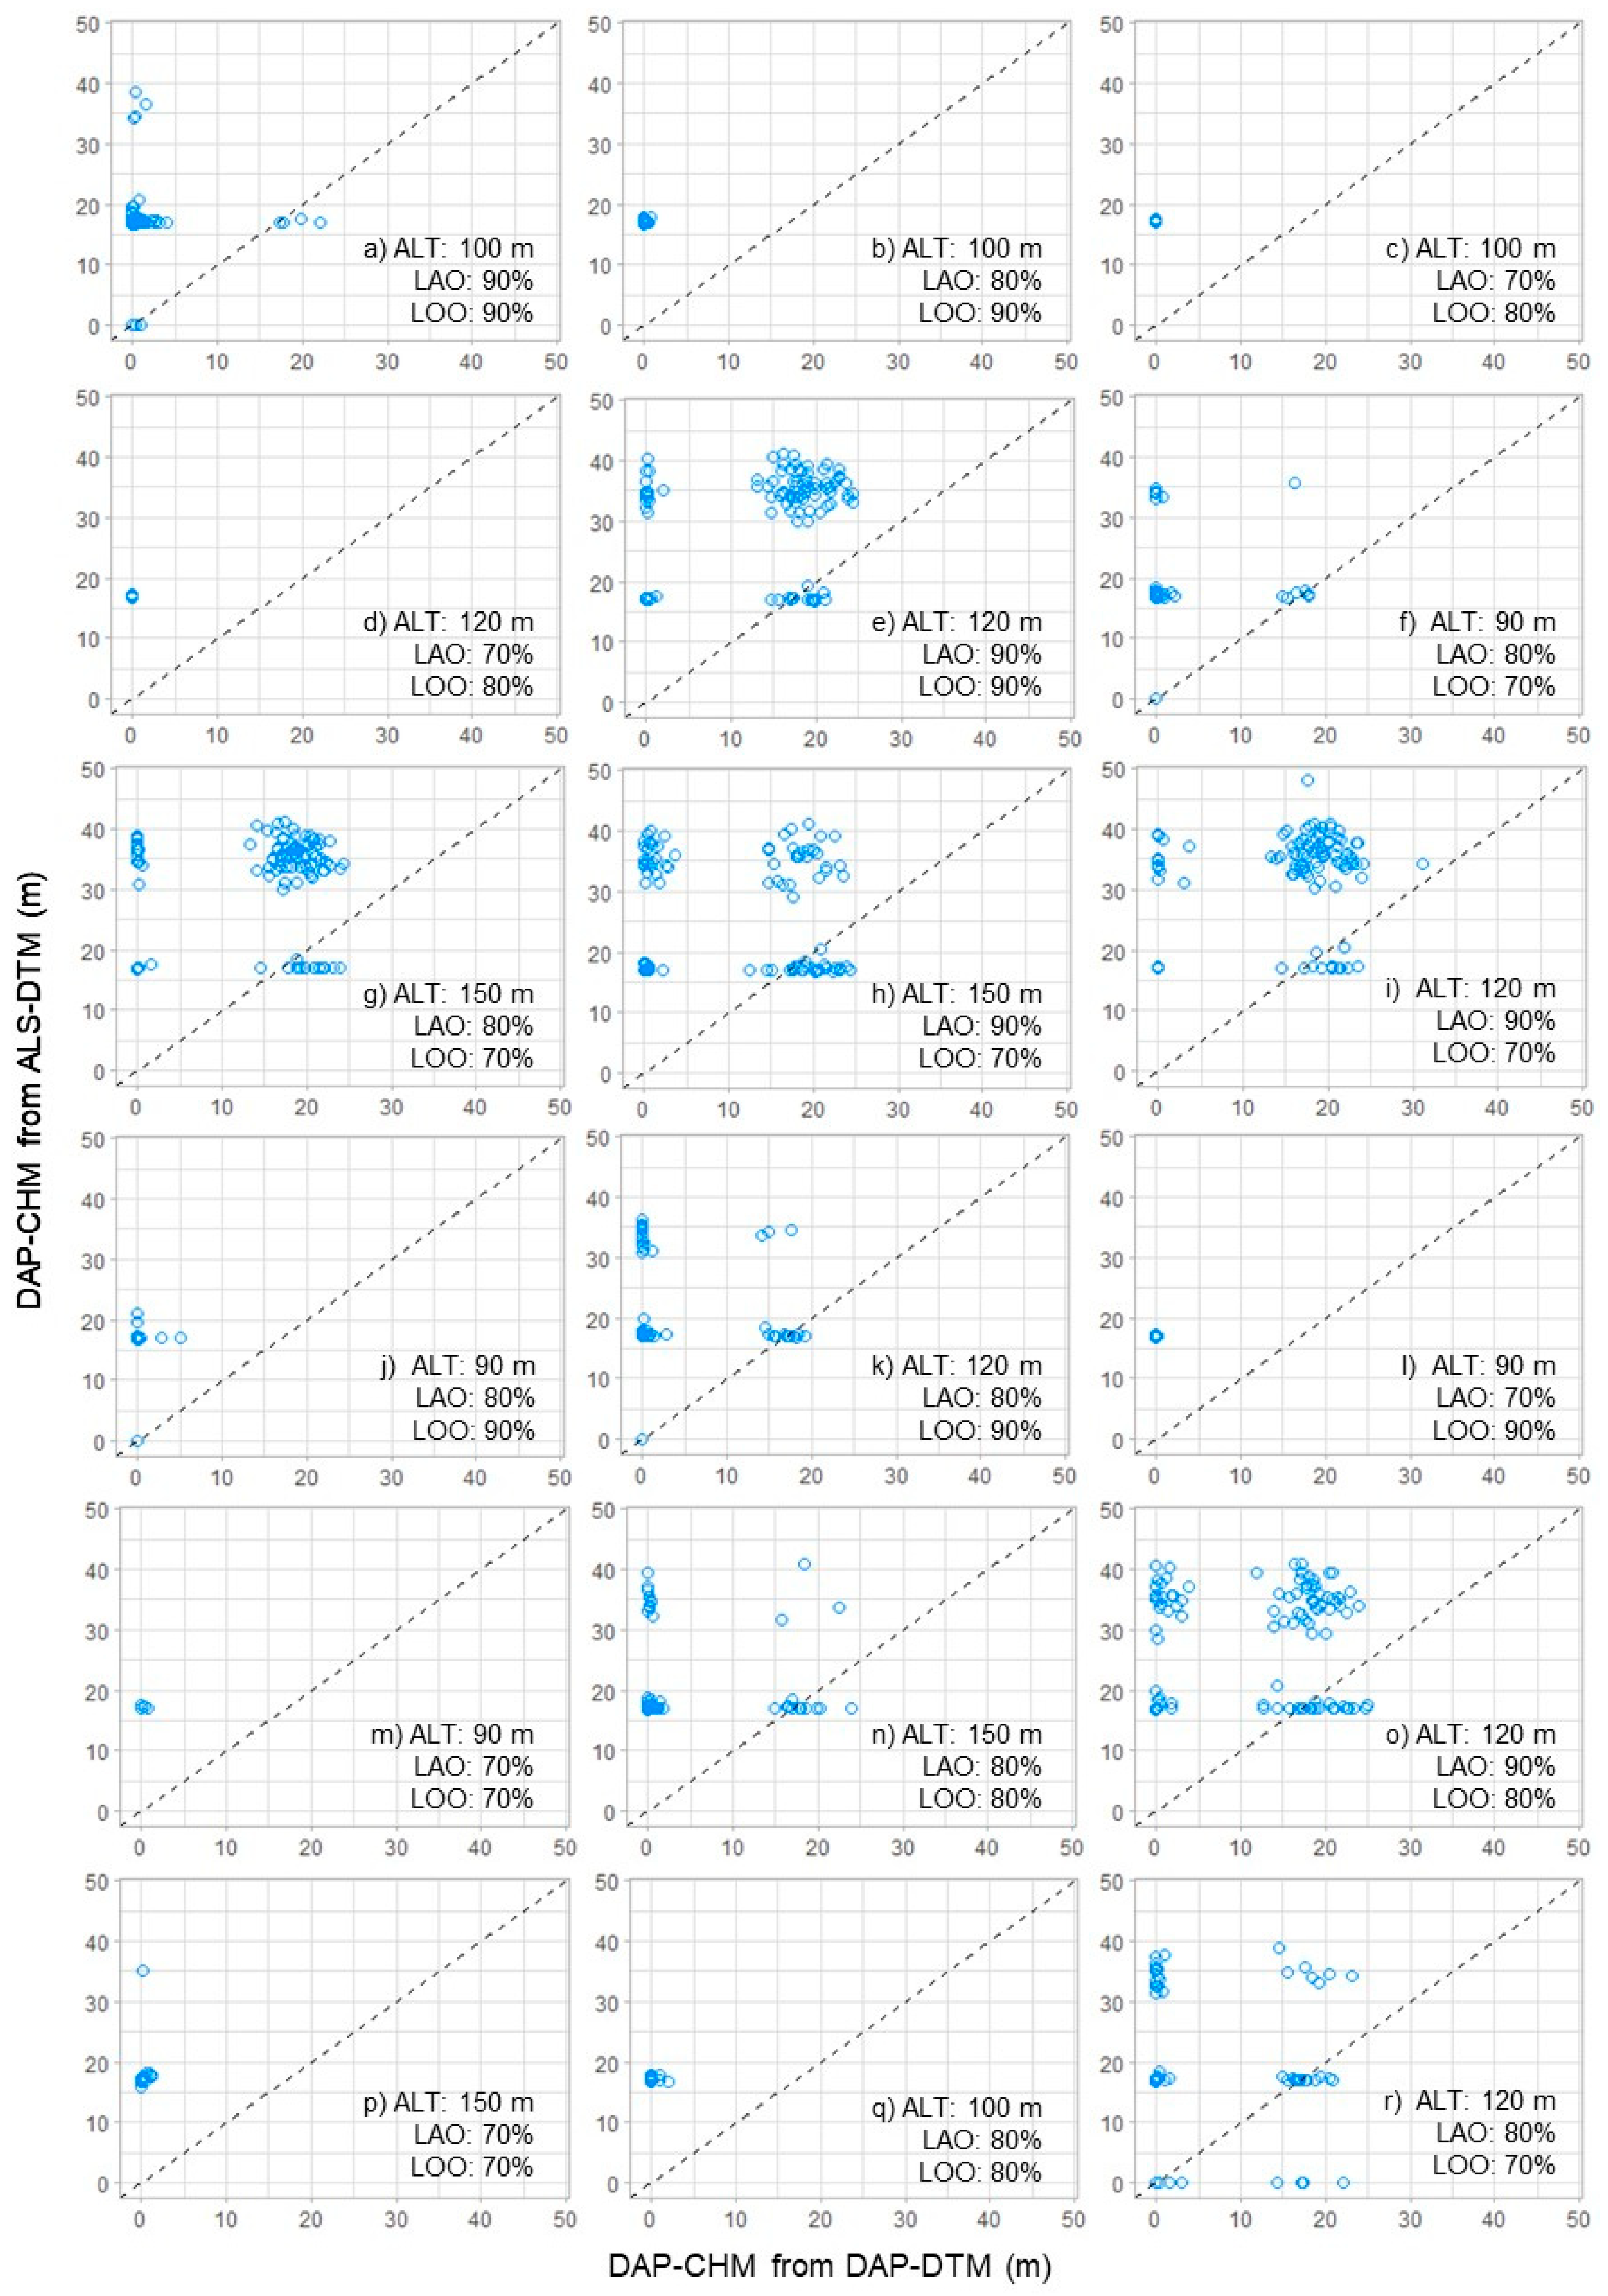
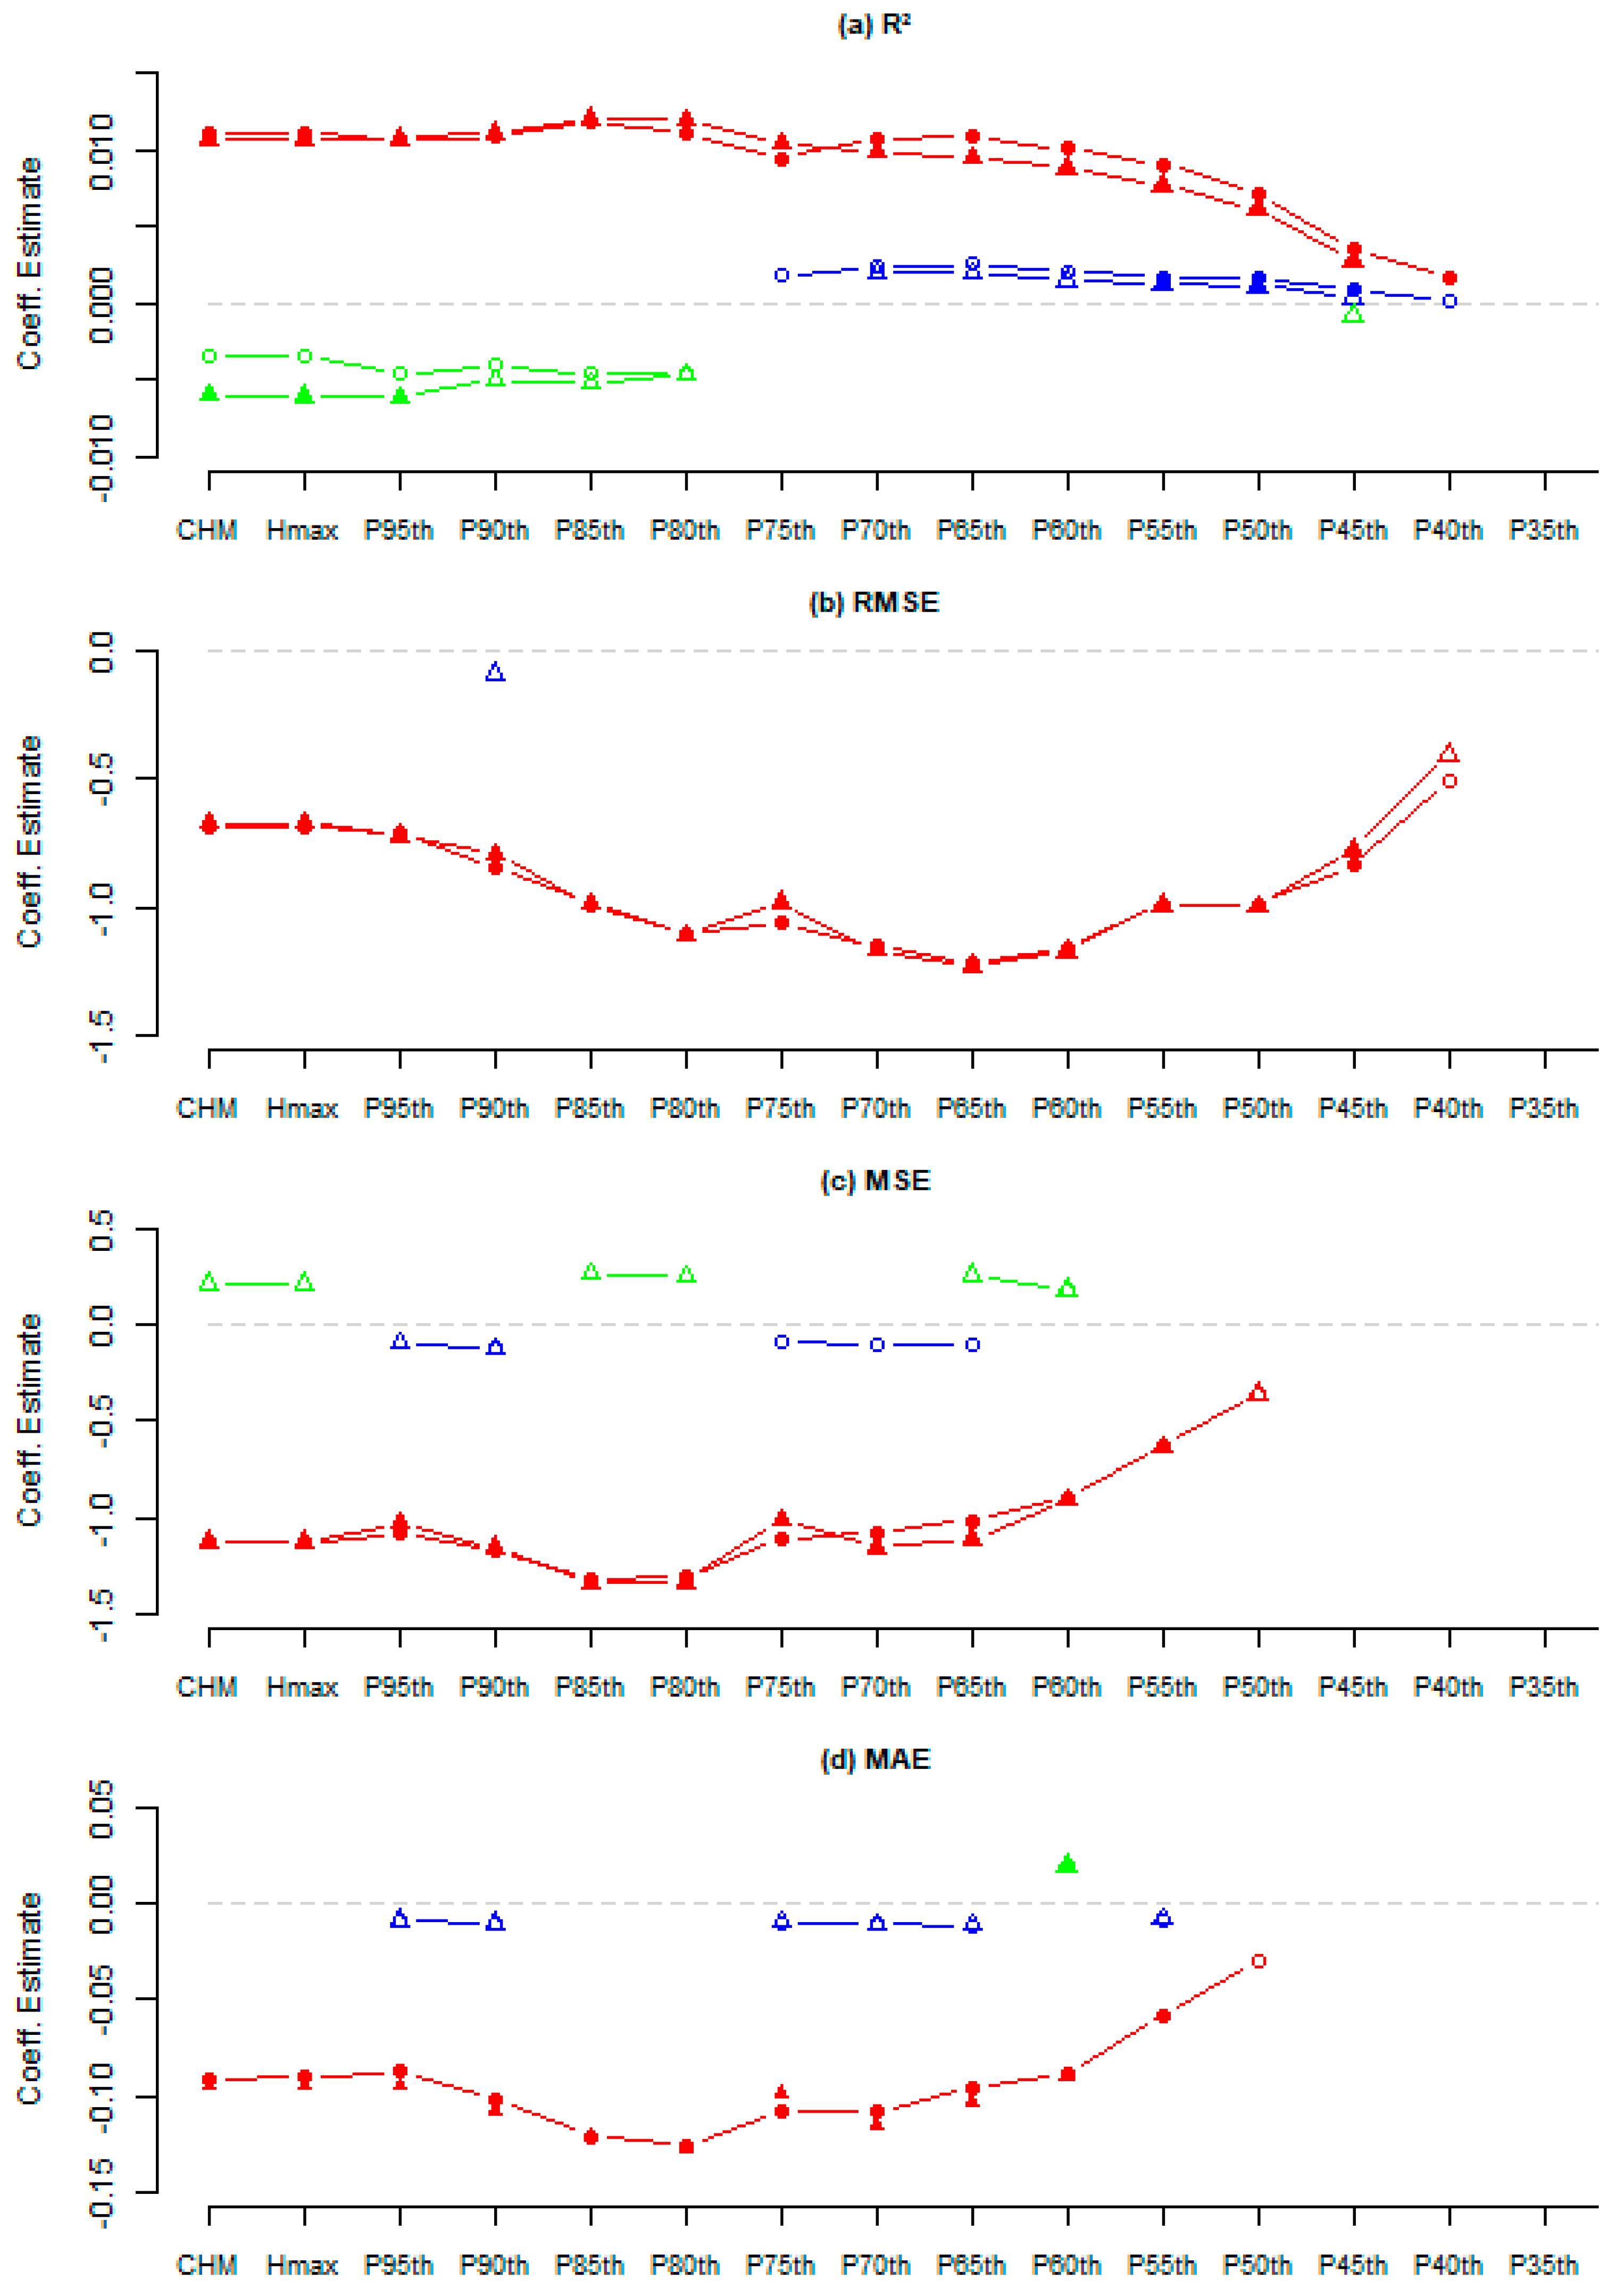
4.2. Effects of UAS Flight Setting on the Point Cloud Metrics and Comparison with ALS
5. Discussion
5.1. Effects of UAS Flight Setting on Quality of DAP Processing Results
5.2. Effects of UAS Flight Setting on the Ability to Reproduce ALS Metrics
5.3. Implications for Data Acquisition and Processing in Forest Environments
6. Conclusions
Supplementary Materials
Author Contributions
Funding
Institutional Review Board Statement
Informed Consent Statement
Data Availability Statement
Conflicts of Interest
References
- Ma, Y.; Wu, H.; Wang, L.; Huang, B.; Ranjan, R.; Zomaya, A. Remote Sensing Big Data Computing: Challenges and Opportunities. Futur. Gener. Comput. Syst. 2015, 51, 47–60. [Google Scholar] [CrossRef]
- Toth, C.; Józków, G. Remote Sensing Platforms and Sensors: A Survey. ISPRS J. Photogramm. Remote Sens. 2016, 115, 22–36. [Google Scholar] [CrossRef]
- Arumäe, T.; Lang, M.; Laarmann, D. Thinning- and Tree-Growth-Caused Changes in Canopy Cover and Stand Height and Their Estimation Using Low-Density Bitemporal Airborne Lidar Measurements—A Case Study in Hemi-Boreal Forests. Eur. J. Remote Sens. 2020, 53, 113–123. [Google Scholar] [CrossRef]
- Iglhaut, J.; Cabo, C.; Puliti, S.; Piermattei, L.; Connor, J.O.; Rosette, J. Structure from Motion Photogrammetry in Forestry: A Review. Curr. For. Rep. 2019, 155–168. [Google Scholar] [CrossRef]
- Torresan, C.; Berton, A.; Carotenuto, F.; Di Gennaro, S.F.; Gioli, B.; Matese, A.; Miglietta, F.; Vagnoli, C.; Zaldei, A.; Wallace, L. Forestry Applications of UAVs in Europe: A Review. Int. J. Remote Sens. 2017, 38, 2427–2447. [Google Scholar] [CrossRef]
- Kangas, A.; Astrup, R.; Breidenbach, J.; Fridman, J.; Gobakken, T.; Korhonen, K.T.; Maltamo, M.; Nilsson, M.; Nord-Larsen, T.; Næsset, E.; et al. Remote Sensing and Forest Inventories in Nordic Countries–Roadmap for the Future. Scand. J. For. Res. 2018, 33, 397–412. [Google Scholar] [CrossRef]
- Lang, M.; Anniste, J.; Arumäe, T. Estimation of Main Forest Inventory Variables from Spectral and Airborne Lidar Data in Aegviidu Test Site, Estonia. For. Stud. 2012, 56. [Google Scholar] [CrossRef]
- Klemas, V.V. Coastal and Environmental Remote Sensing from Unmanned Aerial Vehicles: An Overview. J. Coast. Res. 2015, 315, 1260–1267. [Google Scholar] [CrossRef]
- Puliti, S.; Ene, L.T.; Gobakken, T.; Næsset, E. Use of Partial-Coverage UAV Data in Sampling for Large Scale Forest Inventories. Remote Sens. Environ. 2017, 194, 115–126. [Google Scholar] [CrossRef]
- Kukkonen, M.; Maltamo, M.; Korhonen, L.; Packalen, P. Comparison of Multispectral Airborne Laser Scanning and Stereo Matching of Aerial Images as a Single Sensor Solution to Forest Inventories by Tree Species. Remote Sens. Environ. 2019, 231, 111208. [Google Scholar] [CrossRef]
- Puliti, S.; Saarela, S.; Gobakken, T.; Ståhl, G.; Næsset, E. Combining UAV and Sentinel-2 Auxiliary Data for Forest Growing Stock Volume Estimation through Hierarchical Model-Based Inference. Remote Sens. Environ. 2018, 204, 485–497. [Google Scholar] [CrossRef]
- Jayathunga, S.; Owari, T.; Tsuyuki, S. Evaluating the Performance of Photogrammetric Products Using Fixed-Wing UAV Imagery over a Mixed Conifer—Broadleaf Forest: Comparison with Airborne Laser Scanning. Remote Sens. 2018, 10, 187. [Google Scholar] [CrossRef]
- Kuželka, K.; Surový, P. Mapping Forest Structure Using UAS inside Flight Capabilities. Sensors 2018, 18, 2245. [Google Scholar] [CrossRef] [PubMed]
- Westoby, M.J.; Brasington, J.; Glasser, N.F.; Hambrey, M.J.; Reynolds, J.M. ‘Structure-from-Motion’ Photogrammetry: A Low-Cost, Effective Tool for Geoscience Applications. Geomorphology 2012, 179, 300–314. [Google Scholar] [CrossRef]
- Leberl, F.; Irschara, A.; Pock, T.; Meixner, P.; Gruber, M.; Scholz, S.; Wiechert, A. Point Clouds: Lidar versus 3D Vision. Photogramm. Eng. Remote Sens. 2010, 76, 1123–1134. [Google Scholar] [CrossRef]
- Dandois, J.P.; Olano, M.; Ellis, E.C. Optimal Altitude, Overlap, and Weather Conditions for Computer Vision UAV Estimates of Forest Structure. Remote Sens. 2015, 7, 13895–13920. [Google Scholar] [CrossRef]
- Puliti, S.; Ørka, H.O.; Gobakken, T.; Næsset, E. Inventory of Small Forest Areas Using a Unmanned Aerial System. Remote Sens. 2015, 7, 9632–9654. [Google Scholar] [CrossRef]
- Nurminen, K.; Karjalainen, M.; Yu, X.; Hyyppä, J.; Honkavaara, E. Performance of Dense Digital Surface Models Based on Image Matching in the Estimation of Plot-Level Forest Variables. ISPRS J. Photogramm. Remote Sens. 2013, 83, 104–115. [Google Scholar] [CrossRef]
- Ota, T.; Ogawa, M.; Shimizu, K.; Kajisa, T.; Mizoue, N.; Yoshida, S.; Takao, G.; Hirata, Y.; Furuya, N.; Sano, T.; et al. Aboveground Biomass Estimation Using Structure from Motion Approach with Aerial Photographs in a Seasonal Tropical Forest. Forests 2015, 6, 3882–3898. [Google Scholar] [CrossRef]
- Rahlf, J.; Breidenbach, J.; Solberg, S.; Næsset, E.; Astrup, R. Digital Aerial Photogrammetry Can Efficiently Support Large-Area Forest Inventories in Norway. Forestry 2017, 90, 710–718. [Google Scholar] [CrossRef]
- Tomaštík, J.; Mokroš, M.; Surový, P.; Grznárová, A.; Merganič, J. UAV RTK / PPK Method—An Optimal Solution for Mapping Inaccessible Forested Areas? Remote Sens. 2019, 11, 721. [Google Scholar] [CrossRef]
- Fraser, B.T.; Congalton, R.G. Issues in Unmanned Aerial Systems (UAS) Data Collection of Complex Forest Environments. Remote Sens. 2018, 10, 908. [Google Scholar] [CrossRef]
- Ni, W.; Sun, G.; Pang, Y.; Zhang, Z.; Liu, J.; Yang, A.; Wang, Y.; Zhang, D. Mapping Three-Dimensional Structures of Forest Canopy Using UAV Stereo Imagery: Evaluating Impacts of Forward Overlaps and Image Resolutions With LiDAR Data as Reference. IEEE J. Sel. Top. Appl. Earth Obs. Remote Sens. 2018, 11, 3578–3589. [Google Scholar] [CrossRef]
- Lõhmus, E. Forest Site Types of Estonia (Eesti Metsakasvukohatüübid); Eesti NSV Agrotööstuskoondise Info-ja Juurutusvalitsus: Tallinn, Estonia, 1984. [Google Scholar]
- Estonian Land Board. Soil Map, Land Board 2001. Available online: https://geoportaal.maaamet.ee/eng/Spatial-Data/Estonian-Soil-Map-p316.html (accessed on 1 June 2020).
- Estonian Environmental Board. Forest Register. Available online: https://register.metsad.ee/#/ (accessed on 2 June 2020).
- Metsar, J.; Kollo, K.; Ellmann, A. Modernization of the Estonian National Gnss Reference Station Network. Geod. Cartogr. 2018, 44, 55–62. [Google Scholar] [CrossRef][Green Version]
- Fraser, B.T.; Congalton, R.G. Evaluating the Effectiveness of Unmanned Aerial Systems (UAS) for Collecting Thematic Map Accuracy Assessment Reference Data in New England Forests. Forests 2019, 10, 24. [Google Scholar] [CrossRef]
- Kachamba, D.J.; Ørka, H.O.; Gobakken, T.; Eid, T.; Mwase, W. Biomass Estimation Using 3D Data from Unmanned Aerial Vehicle Imagery in a Tropical Woodland. Remote Sens. 2016, 8, 968. [Google Scholar] [CrossRef]
- Kachamba, D.J.; Eid, T.; Gobakken, T. Influence of Plot Size on Efficiency of Biomass Estimates in Inventories of Dry Tropical Forests Assisted by Photogrammetric Data from an Unmanned Aircraft System. Remote Sens. 2017, 9, 610. [Google Scholar] [CrossRef]
- Komárek, J.; Klouček, T.; Prošek, J. The Potential of Unmanned Aerial Systems: A Tool towards Precision Classification of Hard-to-Distinguish Vegetation Types? Int. J. Appl. Earth Obs. Geoinf. 2018, 71, 9–19. [Google Scholar] [CrossRef]
- Estonian Land Board. ALS III Ring (2016) 2017–2020. Available online: https://geoportaal.maaamet.ee/est/Ruumiandmed/Korgusandmed/Aerolaserskaneerimise-korguspunktid/ALS-III-ring-2016-20172020-p625.html (accessed on 15 March 2020).
- Pix4D. Reprojection Error. Available online: https://support.pix4d.com/hc/en-us/articles/202559369-Reprojection-error (accessed on 18 December 2019).
- Daniel Girardeau-Montaut. CloudCompare. 2020. Available online: https://www.danielgm.net/cc/ (accessed on 1 December 2020).
- Zhang, Y.; Wu, H.; Yang, W. Forests Growth Monitoring Based on Tree Canopy 3D Reconstruction Using UAV Aerial Photogrammetry. Forests 2019, 10, 1052. [Google Scholar] [CrossRef]
- Klápště, P.; Fogl, M.; Barták, V.; Gdulová, K.; Urban, R.; Moudrý, V. Sensitivity Analysis of Parameters and Contrasting Performance of Ground Filtering Algorithms with UAV Photogrammetry-Based and LiDAR Point Clouds. Int. J. Digit. Earth 2020, 1–23. [Google Scholar] [CrossRef]
- Roussel, J.-R.; Auty, D. LidR: Airborne LiDAR Data Manipulation and Visualization for Forestry Applications. 2019. Available online: https://CRAN.R-project.org/package=lidR (accessed on 1 December 2019).
- R Core Team. A Language and Environment for Statistical Computing; R Foundation for Statistical Computing: Vienna, Austria, 2018; Available online: https://www.R-project.org (accessed on 21 December 2018).
- Robinson, A.P.; Froese, R.E. Model Validation Using Equivalence Tests. Ecol. Modell. 2004, 176, 349–358. [Google Scholar] [CrossRef]
- Robinson, A.P.; Duursma, R.A.; Marshall, J.D. A Regression-Based Equivalence Test for Model Validation: Shifting the Burden of Proof. Tree Physiol. 2005, 25, 903–913. [Google Scholar] [CrossRef] [PubMed]
- Robinson, A.P. Equivalence: Provides Tests and Graphics for Assessing Tests of Equivalence. 2016. Available online: https://CRAN.R-project.org/package=equivalence (accessed on 1 December 2019).
- Smith, M.W.; Carrivick, J.L.; Quincey, D.J. Structure from Motion Photogrammetry in Physical Geography. Prog. Phys. Geogr. Earth Environ. 2016, 40, 247–275. [Google Scholar] [CrossRef]
- Sieberth, T.; Wackrow, R.; Chandler, J.H. UAV Image Blur-Its Influence and Ways to Correct It. Int. Arch. Photogramm. Remote Sens. Spat. Inf. Sci. ISPRS Arch. 2015, 40, 33–39. [Google Scholar] [CrossRef]
- James, M.R.; Robson, S. Straightforward Reconstruction of 3D Surfaces and Topography with a Camera: Accuracy and Geoscience Application. J. Geophys. Res. 2012, 117, F03017. [Google Scholar] [CrossRef]
- Dandois, J.P.; Ellis, E.C. Remote Sensing of Vegetation Structure Using Computer Vision. Remote Sens. 2010, 2, 1157–1176. [Google Scholar] [CrossRef]
- Joyce, M.J.; Erb, J.D.; Sampson, B.A.; Moen, R.A. Detection of Coarse Woody Debris Using Airborne Light Detection and Ranging (LiDAR). For. Ecol. Manag. 2019, 433, 678–689. [Google Scholar] [CrossRef]
- Bouvier, M.; Durrieu, S.; Fournier, R.A.; Renaud, J. Remote Sensing of Environment Generalizing Predictive Models of Forest Inventory Attributes Using an Area-Based Approach with Airborne LiDAR Data. Remote Sens. Environ. 2015, 156, 322–334. [Google Scholar] [CrossRef]
- Fekety, P.A.; Falkowski, M.J.; Hudak, A.T. Temporal Transferability of LiDAR-Based Imputation of Forest Inventory Attributes. Can. J. For. Res. 2014, 45, 422–435. [Google Scholar] [CrossRef]
| Date | Flight ID | Local Time | Temperature Range (°C) | Wind Speed (m/s) | Wind Direction | Light Condition | Altitude AGL (m) | GSD * (cm) | Lateral Overlap (%) | Longitudinal Overlap (%) |
|---|---|---|---|---|---|---|---|---|---|---|
| 07/jun/19 | 01 | 11:18 | 18–29 | 2.2 | SE | Sunny | 100 | 2.63 | 90 | 90 |
| 02 | 11:50 | 100 | 2.70 | 80 | 90 | |||||
| 03 | 12:04 | 29–30 | 3.3 | SE | Sunny | 100 | 2.72 | 70 | 80 | |
| 04 | 14:40 | 120 | 3.08 | 70 | 80 | |||||
| 05 | 15:09 | 120 | 3.15 | 90 | 90 | |||||
| 06 | 15:36 | 90 | 2.57 | 80 | 70 | |||||
| 07 | 15:54 | 150 | 3.82 | 80 | 70 | |||||
| 16/jun/19 | 08 | 13:42 | 22–23 | 4.4 | NW | Passing Clouds | 150 | 3.81 | 90 | 70 |
| 17/jun/19 | 09 | 10:30 | 16–24 | 3.6 | W | Sunny | 120 | 3.13 | 90 | 70 |
| 10 | 11:00 | 90 | 2.45 | 80 | 90 | |||||
| 11 | 11:25 | 120 | 3.15 | 80 | 90 | |||||
| 12 | 11:42 | 90 | 2.49 | 70 | 90 | |||||
| 13 | 12:01 | 22–24 | 8.1 | W | Sunny | 90 | 2.57 | 70 | 70 | |
| 14 | 12:17 | 150 | 3.88 | 80 | 80 | |||||
| 15 | 12:33 | 120 | 3.12 | 90 | 80 | |||||
| 16 | 15:15 | 150 | 3.81 | 70 | 70 | |||||
| 17 | 15:32 | 100 | 2.71 | 80 | 80 | |||||
| 18 | 16:02 | 120 | 3.16 | 80 | 70 |
| Specification | Value |
|---|---|
| Altitude | 2600 m |
| Flight Speed | 278 km h−1 |
| Wavelength | 1064 nm |
| Scan Frequency | 2 × 350 kHz |
| Field of View | 58° |
| Mean Point Density | 2.1 points m−2 |
| Mean Point Spacing | 0.72 m |
| Metric Name | Description |
|---|---|
| Hmax | Maximum height |
| Hmean | Mean height |
| SDH | Standard deviation of height distribution |
| SKEWH | Skewness of height distribution |
| KURTH | Kurtosis of height distribution |
| PH>mean | Percentage of points above Hmean |
| PH>2m | Percentage of points above 2 m |
| Pxth | xth percentile of height distribution (in 5% steps; e.g., P5th, P10th, P15th) |
| PH=ground | Percentage of returns classified as “ground” |
| Flight ID | ALT (m) | LAO (%) | LOO (%) | Images Acquired | Images Calibrated (%) | Camera Optimization (%) | Number of tie-Points (per Image) | Matches (per Calibrated Image) | Re-Projection Error (pixels) | Point Cloud Density (pts.m−2) |
|---|---|---|---|---|---|---|---|---|---|---|
| 01 | 100 | 90 | 90 | 248 | 94 | 0.37 | 81,420 | 2504 | 0.19 | 411 |
| 02 | 100 | 80 | 90 | 128 | 73 | 0.39 | 81,980 | 2201 | 0.17 | 387 |
| 03 | 100 | 70 | 80 | 100 | 23 | 0.42 | 79,878 | 1169 | 0.14 | 386 |
| 04 | 120 | 70 | 80 | 82 | 34 | 0.35 | 80,466 | 1756 | 0.15 | 247 |
| 05 | 120 | 90 | 90 | 214 | 100 | 0.38 | 80,383 | 2371 | 0.17 | 225 |
| 06 | 90 | 80 | 70 | 159 | 100 | 0.35 | 66,441 | 2425 | 0.14 | 504 |
| 07 | 150 | 80 | 70 | 106 | 100 | 0.40 | 56,298 | 2337 | 0.14 | 106 |
| 08 | 150 | 90 | 70 | 208 | 100 | 0.43 | 80,620 | 3423 | 0.20 | 138 |
| 09 | 120 | 90 | 70 | 262 | 100 | 0.42 | 76,634 | 3306 | 0.16 | 207 |
| 10 | 90 | 80 | 90 | 153 | 77 | 0.40 | 78,711 | 2103 | 0.14 | 565 |
| 11 | 120 | 80 | 90 | 122 | 100 | 0.41 | 79,975 | 2313 | 0.15 | 247 |
| 12 | 90 | 70 | 90 | 100 | 57 | 0.36 | 79,477 | 2016 | 0.14 | 483 |
| 13 | 90 | 70 | 70 | 115 | 33 | 0.47 | 79,747 | 2066 | 0.16 | 432 |
| 14 | 150 | 80 | 80 | 109 | 100 | 0.41 | 81,298 | 2369 | 0.17 | 133 |
| 15 | 120 | 90 | 80 | 231 | 100 | 0.43 | 80,483 | 2333 | 0.18 | 228 |
| 16 | 150 | 70 | 70 | 82 | 54 | 0.36 | 81,070 | 1443 | 0.18 | 126 |
| 17 | 100 | 80 | 80 | 147 | 55 | 0.35 | 81,027 | 1468 | 0.16 | 362 |
| 18 | 120 | 80 | 70 | 127 | 89 | 0.36 | 78,950 | 1513 | 0.16 | 208 |
| Flight | Regression Slope | Intercept | R2 | RMSE | MSE (m2) | MAE (m) | Slope Equivalence Test | Intercept Equivalence Test | |||||||||||
|---|---|---|---|---|---|---|---|---|---|---|---|---|---|---|---|---|---|---|---|
| (m) | (%) | 1% | 5% | 10% | 25% | 50% | 75% | 1% | 5% | 10% | 25% | 50% | 75% | ||||||
| 01 * | 0.00 | 48.57 | 0.00 | 0.16 | 103.4 | 0.25 | 0.42 | • | |||||||||||
| 02 | 0.99 | −15.95 | 0.91 | 0.10 | 32.3 | 0.02 | 0.11 | • | • | • | • | • | • | • | |||||
| 03 | 0.95 | −13.85 | 0.89 | 0.50 | 21.2 | 0.01 | 0.08 | • | • | • | • | • | • | • | |||||
| 04 | 0.43 | 20.60 | 0.22 | 0.10 | 52.5 | 0.07 | 0.18 | • | |||||||||||
| 05 | 0.90 | −10.16 | 0.90 | 0.16 | 31.8 | 0.02 | 0.10 | • | • | • | • | • | • | • | |||||
| 06 | 0.96 | −13.96 | 0.96 | 0.26 | 20.2 | 0.01 | 0.07 | • | • | • | • | • | • | • | |||||
| 07 | 0.10 | 42.07 | 0.10 | 0.50 | 97.7 | 0.23 | 0.39 | • | |||||||||||
| 08 | 0.63 | 7.34 | 0.61 | 0.26 | 64.5 | 0.10 | 0.21 | • | |||||||||||
| 09 | 0.97 | −14.90 | 0.98 | 0.17 | 12.9 | 0.00 | 0.05 | • | • | • | • | • | • | • | |||||
| 10 * | 0.00 | 48.94 | 0.01 | 0.09 | 102.5 | 0.25 | 0.42 | • | • | ||||||||||
| 11 | 0.97 | −14.83 | 0.97 | 0.06 | 18.2 | 0.01 | 0.06 | • | • | • | • | • | • | • | |||||
| 12 | 0.92 | −11.33 | 0.91 | 0.15 | 33.0 | 0.03 | 0.11 | • | • | • | • | • | • | • | |||||
| 13 | 0.87 | −8.41 | 0.74 | 0.20 | 37.7 | 0.03 | 0.12 | • | • | • | |||||||||
| 14 | 0.96 | −14.43 | 0.92 | 0.48 | 29.2 | 0.02 | 0.10 | • | • | • | • | • | • | • | |||||
| 15 | 0.74 | 0.49 | 0.71 | 0.31 | 55.7 | 0.07 | 0.17 | • | |||||||||||
| 16 | 0.96 | −13.94 | 0.85 | 0.18 | 42.0 | 0.04 | 0.14 | • | • | • | • | • | • | • | |||||
| 17 | 0.79 | −3.27 | 0.74 | 0.27 | 52.6 | 0.07 | 0.20 | • | • | • | |||||||||
| 18 | 0.77 | −1.61 | 0.88 | 0.14 | 35.8 | 0.03 | 0.12 | • | |||||||||||
Publisher’s Note: MDPI stays neutral with regard to jurisdictional claims in published maps and institutional affiliations. |
© 2021 by the authors. Licensee MDPI, Basel, Switzerland. This article is an open access article distributed under the terms and conditions of the Creative Commons Attribution (CC BY) license (http://creativecommons.org/licenses/by/4.0/).
Share and Cite
de Lima, R.S.; Lang, M.; Burnside, N.G.; Peciña, M.V.; Arumäe, T.; Laarmann, D.; Ward, R.D.; Vain, A.; Sepp, K. An Evaluation of the Effects of UAS Flight Parameters on Digital Aerial Photogrammetry Processing and Dense-Cloud Production Quality in a Scots Pine Forest. Remote Sens. 2021, 13, 1121. https://doi.org/10.3390/rs13061121
de Lima RS, Lang M, Burnside NG, Peciña MV, Arumäe T, Laarmann D, Ward RD, Vain A, Sepp K. An Evaluation of the Effects of UAS Flight Parameters on Digital Aerial Photogrammetry Processing and Dense-Cloud Production Quality in a Scots Pine Forest. Remote Sensing. 2021; 13(6):1121. https://doi.org/10.3390/rs13061121
Chicago/Turabian Stylede Lima, Raul Sampaio, Mait Lang, Niall G. Burnside, Miguel Villoslada Peciña, Tauri Arumäe, Diana Laarmann, Raymond D. Ward, Ants Vain, and Kalev Sepp. 2021. "An Evaluation of the Effects of UAS Flight Parameters on Digital Aerial Photogrammetry Processing and Dense-Cloud Production Quality in a Scots Pine Forest" Remote Sensing 13, no. 6: 1121. https://doi.org/10.3390/rs13061121
APA Stylede Lima, R. S., Lang, M., Burnside, N. G., Peciña, M. V., Arumäe, T., Laarmann, D., Ward, R. D., Vain, A., & Sepp, K. (2021). An Evaluation of the Effects of UAS Flight Parameters on Digital Aerial Photogrammetry Processing and Dense-Cloud Production Quality in a Scots Pine Forest. Remote Sensing, 13(6), 1121. https://doi.org/10.3390/rs13061121


