1. Introduction
The active tectonics of the entire area of Croatia, which includes the wider Pokupsko-Petrinja epicentral area [
1], are caused by the continuous movement of the Adriatic lithospheric microplate (Adria) to the north [
2]. Therefore, in the upper parts of the earth’s crust, strain occurs at the contact of the Dinarides and the Pannonian Basin. When the strain reaches a critical level, individual faults from that system are (re)activated. Sudden movements of the crustal blocks cause releases of a massive amount of energy, and earthquakes occur. In cases of M6+ events, in combination with a relatively shallow hypocentre, surface ruptures occur [
3].
The seismic activity of this epicentral area was characterized (up to Dec 2020) by the occurrence of a small number of strong earthquakes and a larger number of weaker ones (of the total number of earthquakes that occurred here, 80% were of magnitude less than 2.5).
In the Croatian Earthquake Catalog (CEC, with the updated version first described in [
4]), the first data about a strong earthquake in this area correspond to 17 August 1903. This earthquake had an epicentral intensity of VI° MCS in Petrinja and an estimated magnitude of 4.6. The earthquake caused moderate damage in Petrinja near the epicentre. According Kišpatić [
5], “… in Petrinja, the windows rattled, the rocks creaked, plaster fell from the vault and the vaults cracked.”
The strongest earthquake that occurred in this area (until 2020) after 1900 is one of the most famous earthquakes, not only in Croatia but across the world. It was an M5.8 event that occurred on 8 October 1909 with an epicentre north of Pokupsko (Kupa Valley) and is known as the Kupa Valley earthquake. The Kupa Valley earthquake is included in the several most important historical earthquakes that are regularly discussed in seismological textbooks and other books on the history of science. Based on this earthquake’s recordings, the great Croatian scientist, geophysicist Andrija Mohorovičić, improved knowledge of the mechanism of spreading near-earthquake waves through the earth and was the first in the world to discover the velocity discontinuity that separates the crust from the earth’s mantle. This discontinuity, in his honour, was called the Mohorovičić discontinuity. The main Kupa Valley earthquake was followed by a series of more than 50 aftershocks by the end of 1910. The strongest event occurred on 29 January 1910, with an epicentre about 15 kilometres east of the main earthquake epicentre and a magnitude of 5.3.
In the last 30 years, until Dec 2020, the strongest earthquake within this area occurred in 1996, with a magnitude of 4.5. In Petrinja, Komarevo, Glina, Maja, Sisak and Veliki Svinjička, it caused damage: Objects fell from shelves in houses and plaster, roofing tiles and parts of chimneys cracked.
However, at the end of 2020, in the wider Pokupsko-Petrinja area, an earthquake of higher magnitude than expected occurred that we will remember for a long time.
After the seismic sequence that followed, it was clear that this is an area for which the seismic potential exceeds that suggested in previous studies (e.g., analyses of seismicity, seismic hazard map of Croatia), and the geodynamic model is highly complicated (much more complicated than expected and with a larger part hitherto unknown). Due to the relatively low level of seismicity of the investigated area in the last 100 years, this has not been observed nor could be investigated. It has strong implications for seismic hazard, and thus for seismic risk, not only in the Pokupsko-Petrinja area, but also (due to its vicinity) in the area of Zagreb, the capital and the cultural, economic and political centre of Croatia and a city in which over 1 million people live. Therefore, immediately after the main earthquake, seismological analyses of the recorded data, along with satellite images and geotechnical data, were initiated. As soon as security conditions were appropriate, field research on geological manifestations and damage that was caused to buildings was conducted. Thus, the first multidisciplinary study of the area was performed (in contrast to the extensive published report [
6], which concentrated primarily on the descriptions and distribution of damage to buildings), and significant and hitherto unknown data were obtained, which will contribute to the future assessment of the seismic hazard and risk of this interesting area on the border of the Dinarides and the Pannonian Basin. This paper comprises macroseismic, geological, geodetic and civil engineering research. Each discipline is presented in a particular section, summing up the interdisciplinary observations of the analysis at the end of each section as well as in the discussion and the conclusion. The interdisciplinary approach jointly confirmed the assumption of the earthquake origin. It lies in the activation of the complex fault systems on the intersection of two main faults on the strike of the Dinarides (NW–SE).
Concerning the methodologies used in the analysis, seismological analysis relied on the Croatian earthquake catalogue, geological study on the orthophoto images and images taken directly on the field after the mainshock, geodetic analysis on the satellite synthetic aperture radar images prior to and after the earthquake, and civil engineered research on seismic intensity maps, earthquake risk assessment, general rules for buildings and their resistance.
In the first part of this study, detailed seismological and macroseismic analyses, in combination with geological and geodetic investigations and interpretations, were performed. In the second part, detailed earthquake performances of buildings within Eurocode 8 and macroseismic intensity were analysed and discussed. Finally, peak ground acceleration and response spectra, with consideration of local site effects in the vicinity of the Petrinja M6.2 epicentre, were estimated from the engineering seismology aspect. This is highly important because the results indicate the type of impact the Petrinja M6.2 earthquake will have on future seismic hazard calculations not only in the epicentral area, but also in Zagreb city, as discussed. Since seismic hazard is included in Eurocode 8 provisions, such a multidisciplinary preliminary analysis is highly important for future seismic hazard assessment of earthquake resilience and earthquake resistance design.
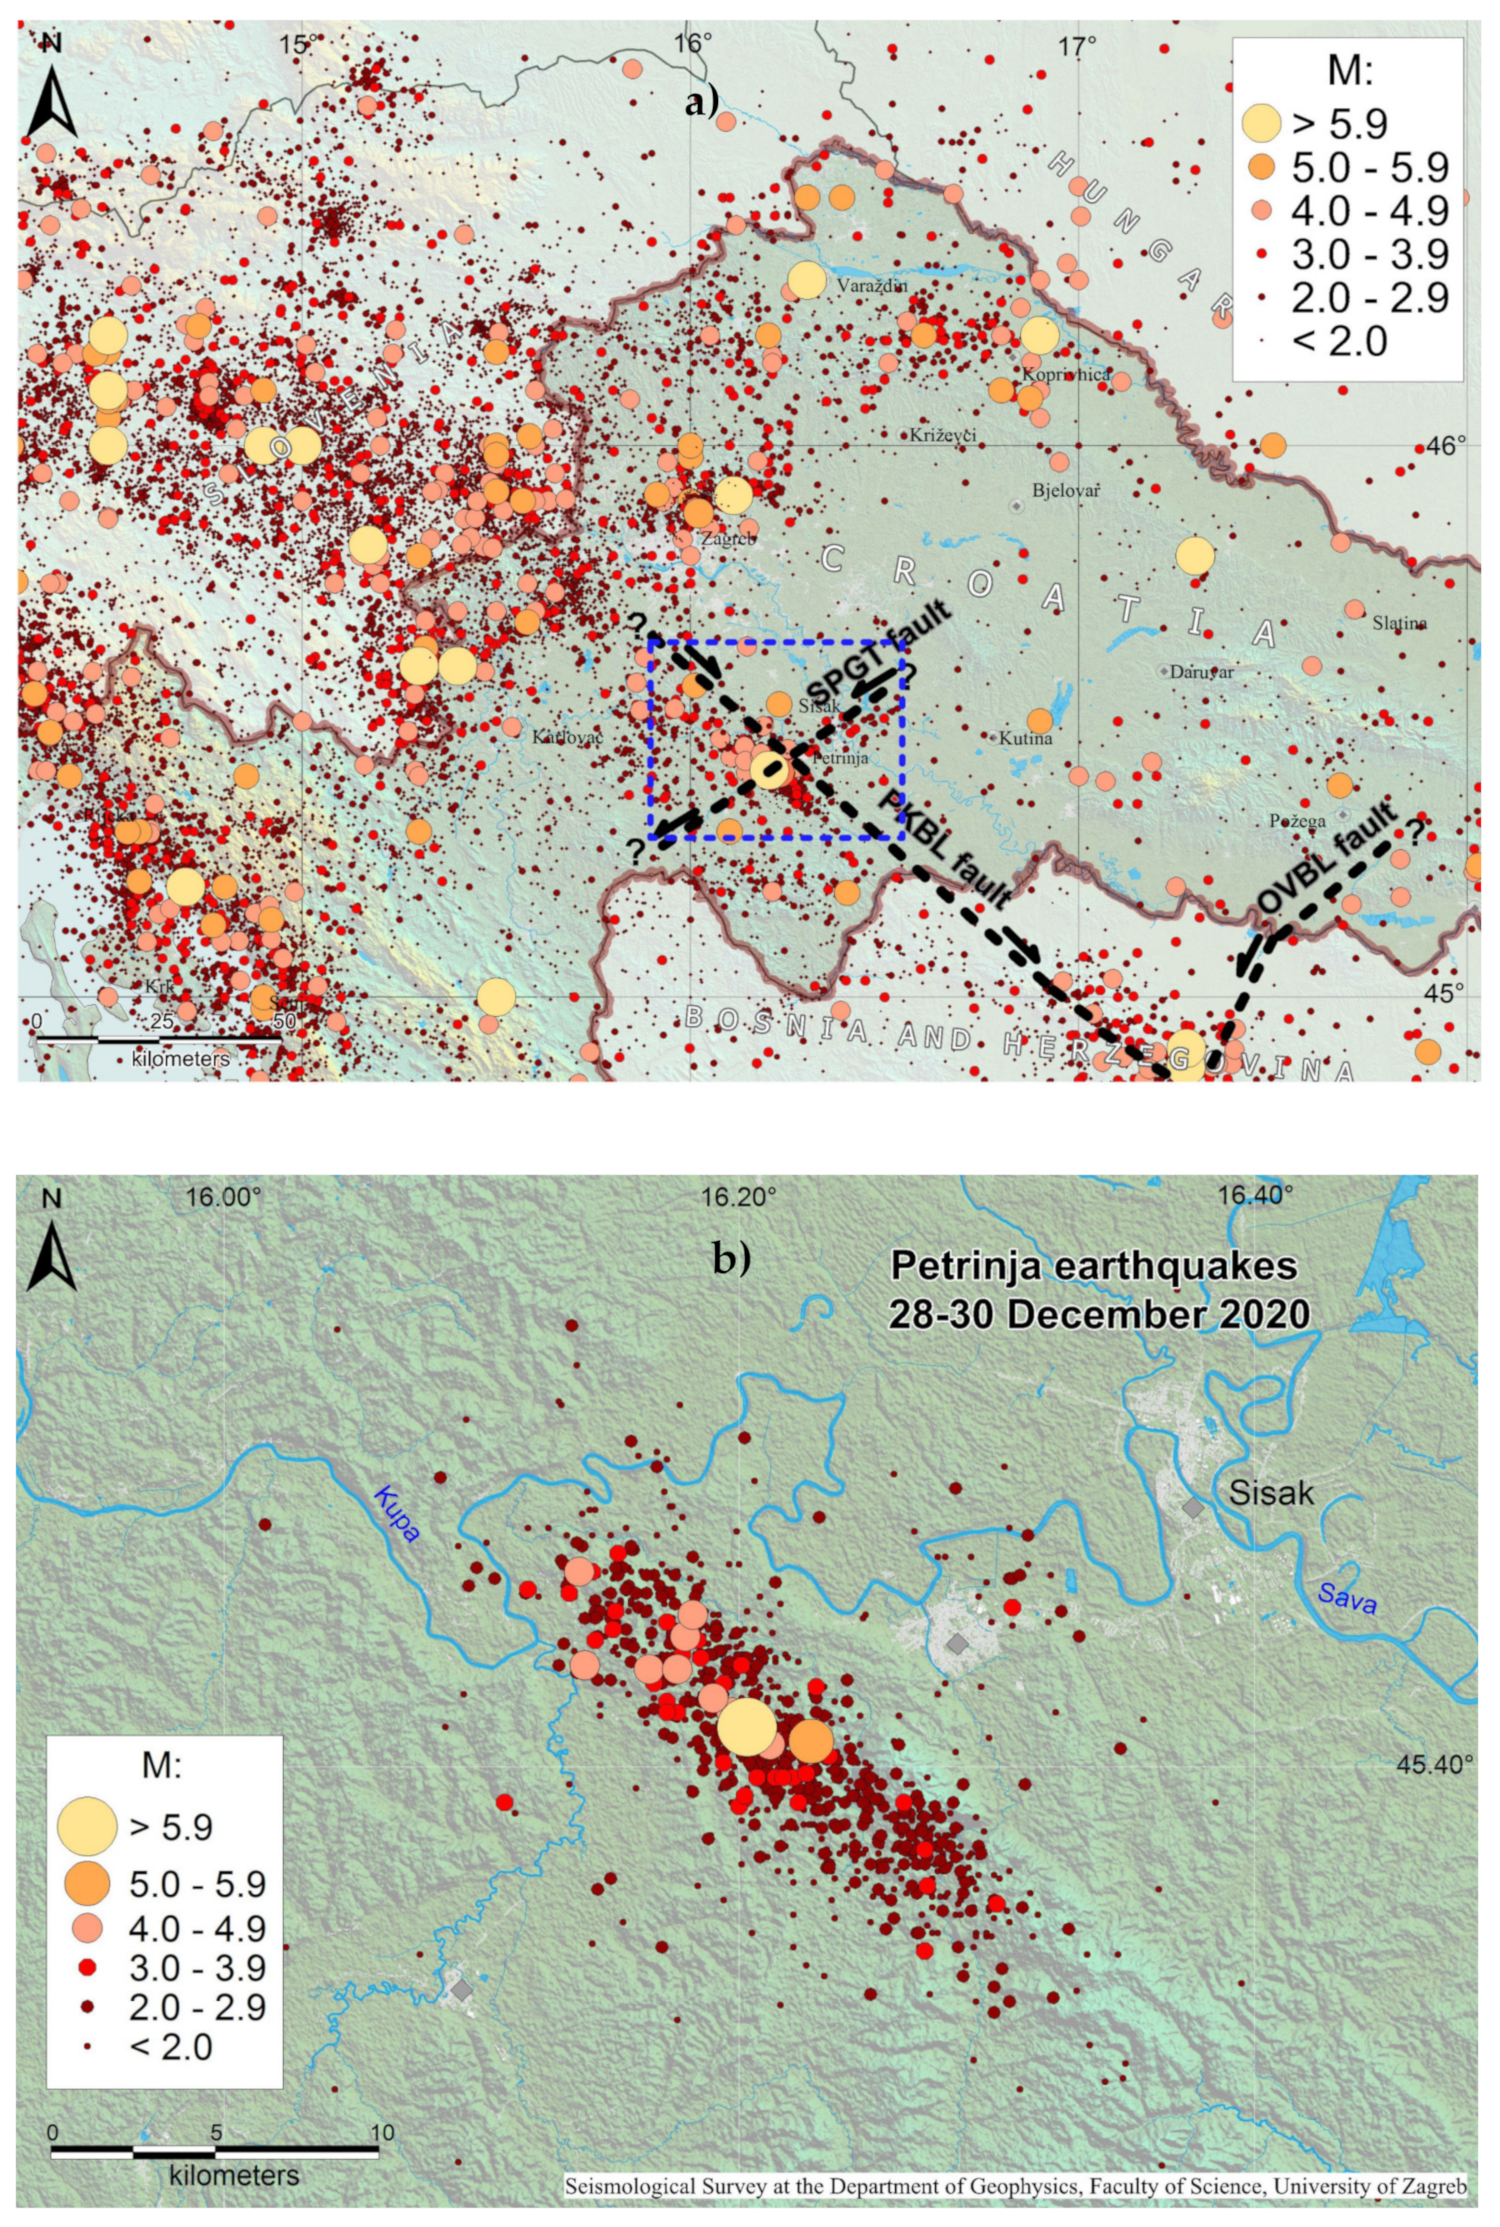
2. Petrinja Earthquakes in December 2020
The last week in 2020, for the citizens of Petrinja and its surroundings, along with Zagreb, began violently. On Monday, 28 December 2020 at 05:28 (UTC), a strong M5 earthquake occurred with an epicentre 5 km southwest of Petrinja. The earthquake disturbed the population in the epicentral area and caused extensive damage, which was aggravated by the series of earthquakes that followed. Namely, in the hour and a half after this earthquake, two stronger events followed with magnitudes of 4.5 and 3.8. Everyone assumed that a period of calming would follow.
However, a day later (after more than 40 weaker and stronger earthquakes), on 29 December 2020 at 11:19 (UTC), the wider area of Petrinja was hit by a destructive M6.2 earthquake, with its epicentre at almost the same location as the epicentre of the M5 foreshock. The tremor occurred at a depth of approximately 6 km, and strong to moderate shaking was felt in northern Croatia. Light to moderate shaking was likely felt across Croatia, Bosnia and Herzegovina; far northwestern Serbia; western Hungary; far southwestern Slovakia; southern Austria; Slovenia and far northeastern Italy. The first reports indicated significant damage to buildings, seven casualties and many injuries.
A day later, it was readily observable that the material damage was enormous, with many destroyed or damaged buildings and structures in towns near the epicentre, especially Petrinja, Glina and Sisak. In those areas, the ground shaking reached intensities of almost VIII-IX °EMS (European Macroseismic Scale). Hundreds of people who had evacuated from their homes were transferred to makeshift shelters, hotels and other temporary accommodations in the wider area.
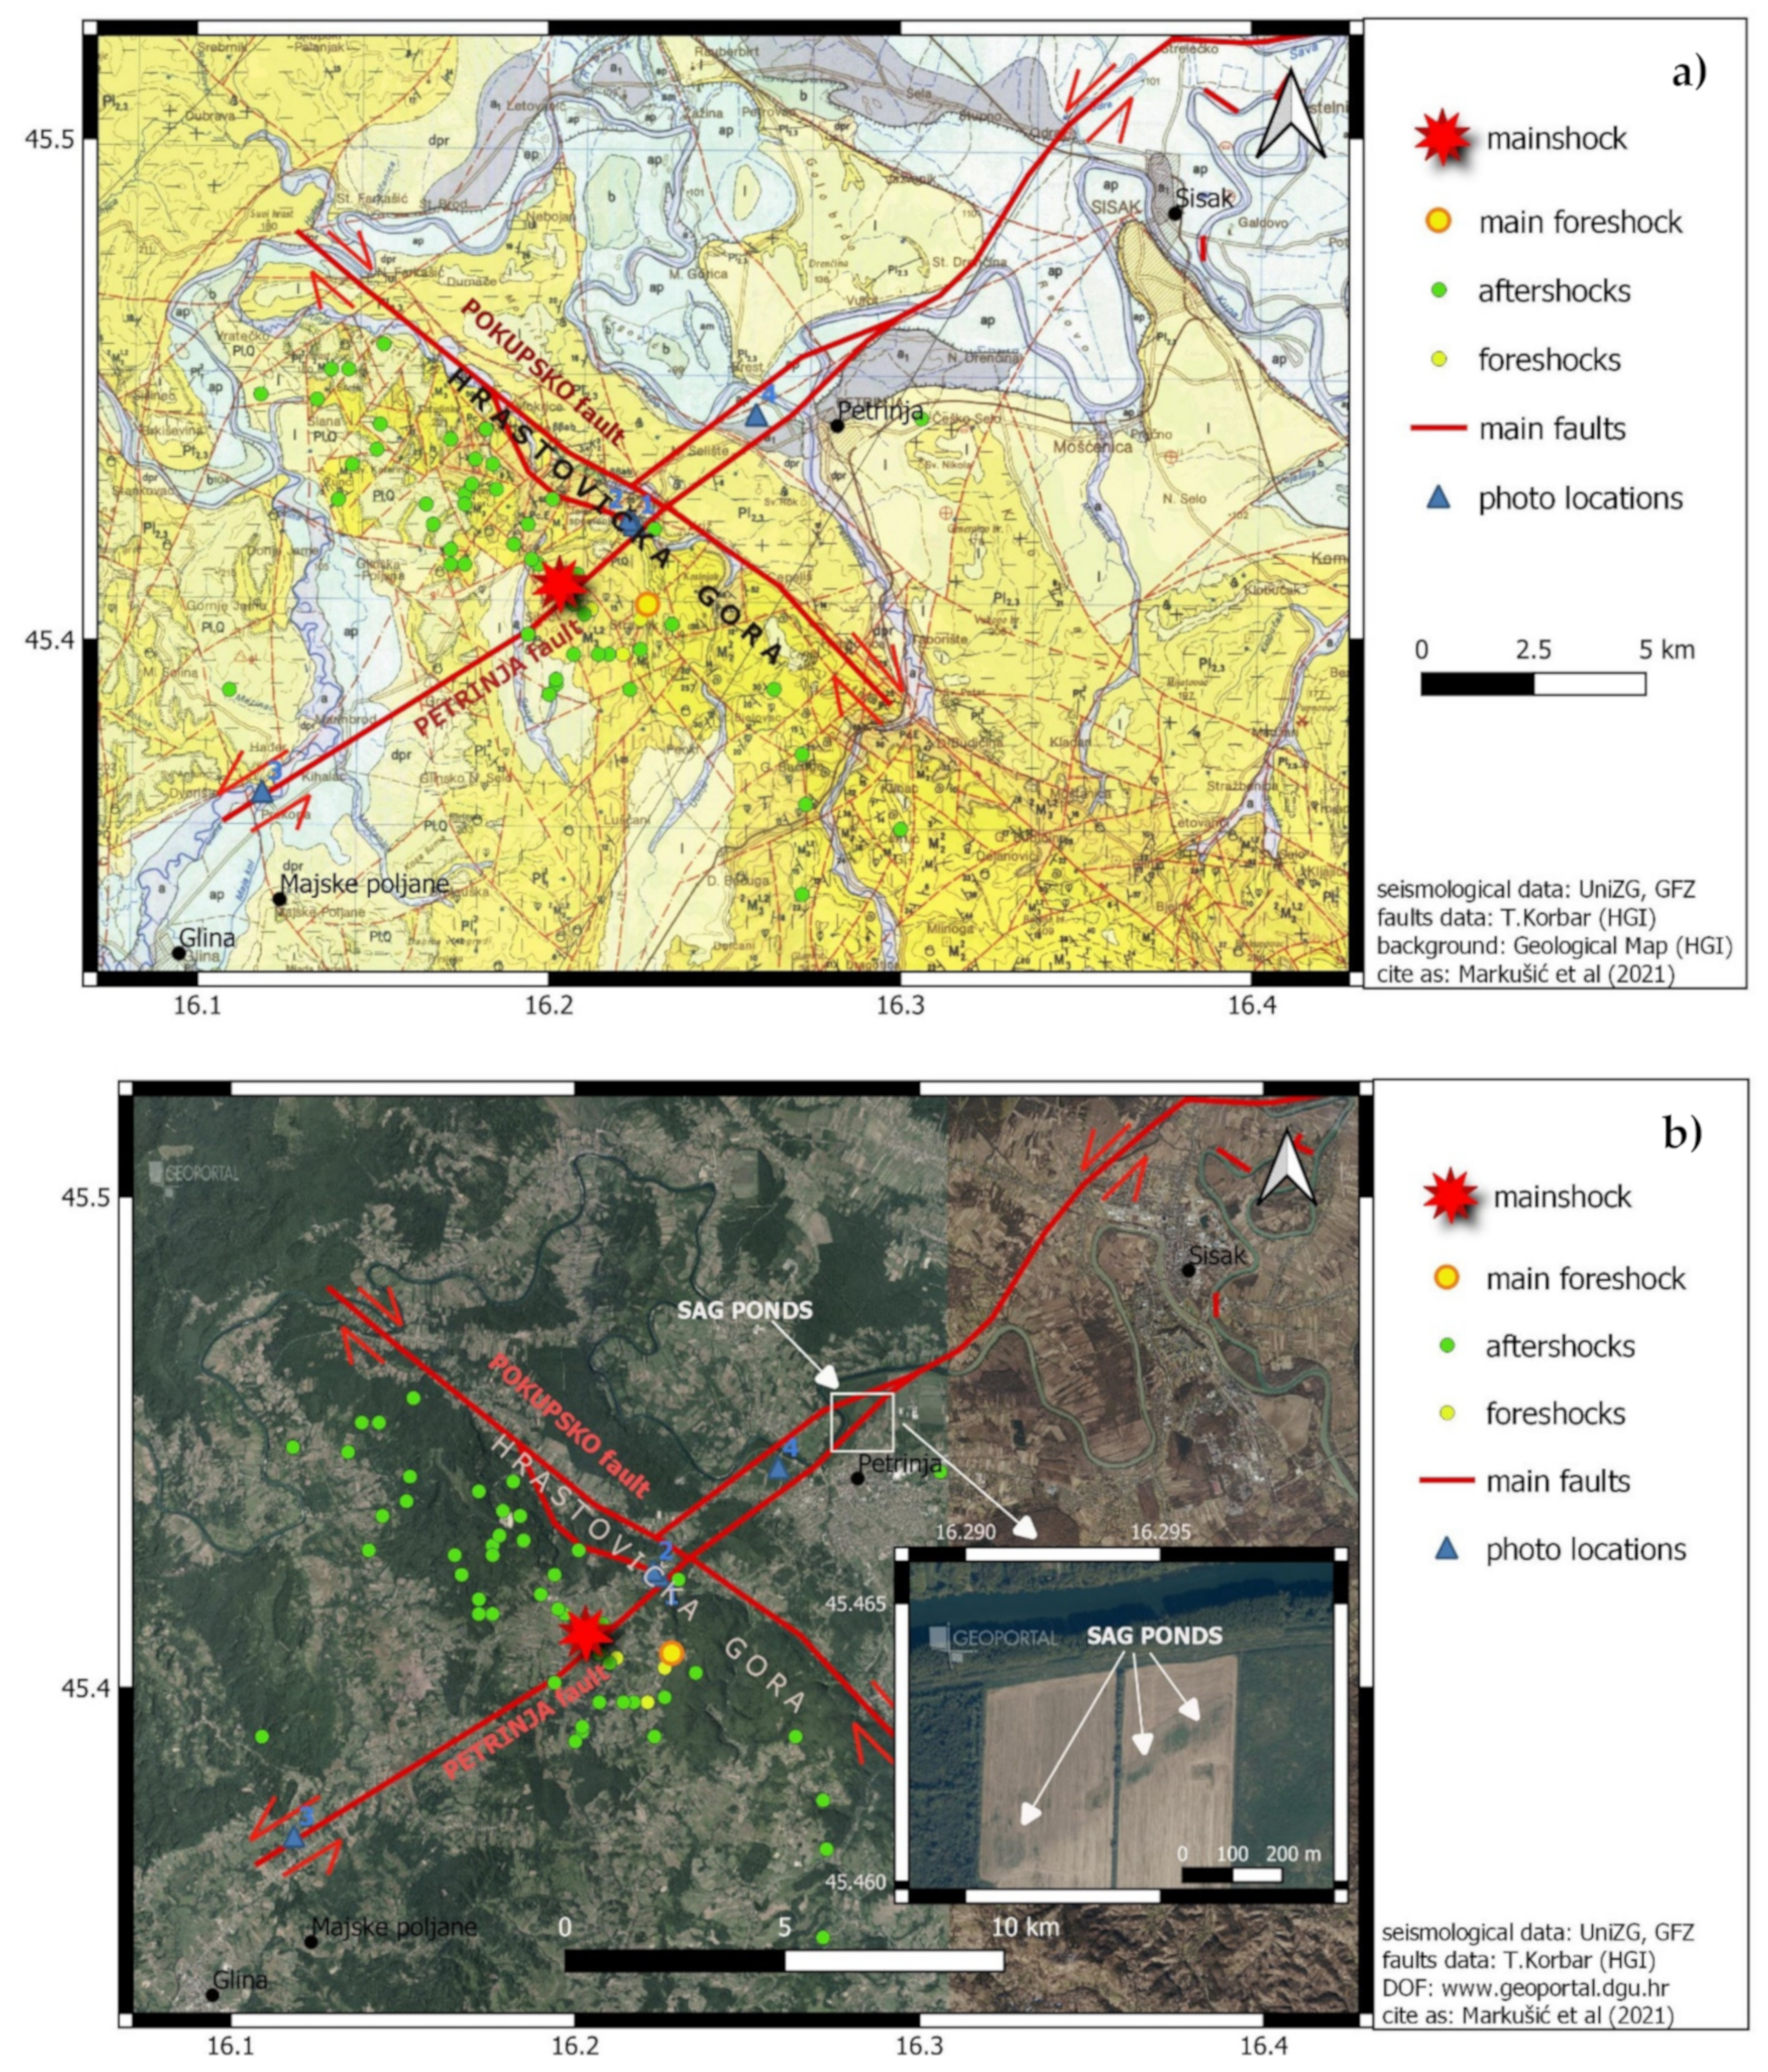
In less than three days after the main quake, almost 2000 aftershocks followed. Until 15 January 2021, there were nine M4+ aftershocks, of which the strongest was of magnitude 5.0 (
Figure 1).
4. Geological Investigations
Based on the shallow focal depth and QMTS that showed clear strike-slip focal mechanisms [
8], surface failures were expected after the mainshock [
3,
10]. Immediate reports in the media enabled quick online investigation of surface failures and linear infrastructure damage that occurred along an approximately 30 km-long section of the sinistral NE–SW striking Sisak–Petrinja–Glina–Topusko Fault. A quick field inspection revealed that fresh fault planes in the outcrops on the Hrastovička gora (
Figure 5) appeared mostly along the longitudinal NW–SE-striking (Dinaric strike) Pokupsko–Kostajnica–Banja Luka Fault and showed clear dextral coseismic strike-slip displacements (
Figure 5 and
Figure 6). A time-lapse analysis of the seismic sequence [
11] showed that an approximately 20 km-long section of the Pokupsko Fault was (re)activated. The two subvertical, mutually perpendicular faults intersected near the epicentres. The historically important Pokupsko earthquake occurred in the vicinity [
7] and was used by the famous Croatian geophysicist Andrija Mohorovičić to discover the Mohorovičić discontinuity.
According to preliminary geological analyses of the official geological maps [
12] and numerous field data that were published in the media, field prospecting results, available seismological data and preliminary geomorphological analyses of orthophoto images [
13], the earthquake sequence that started in the Petrinja epicentral area with the M5 foreshock on 28 December 2020 is related to the active crustal fault system in the broader area of Petrinja (
Figure 5).
Due to the large amount of released energy during the movement of fault blocks and a relatively shallow focal depth, ruptures in crustal rocks were also manifested on the surface. Both left-lateral (sinistral) and right-lateral (dextral) coseismic surface movements were recognized along the fault lines in the wider epicentral area (
Figure 6).
The intersection of two faults (longitudinal and transverse faults) on the extension of the Dinarides (NW–SE) can be identified (
Figure 5,
Figure 7 and
Figure 8). Both faults consist of multiple faults with horizontal strike-slip block movements. The transverse fault is a less known, nearly aseismic creeping fault, which is referred to as the sinistral Petrinja Fault. The longitudinal fault is the well-known regional dextral Pokupsko Fault. This fault system is a textbook example of deformations that occur in rock due to compressional stress along the generally north–south axis (
Figure 4) and the pre-existing fault net (
Figure 5).
Figure 5.
(
a) A geological map of the Sisak, Petrinja and Glina areas in Croatia [
14] with main faults (thick red lines) of the activated fault system highlighted, the activation of which caused earthquakes on 28 and 29 December 2020 (orange units = Paleogene (Pc, E), yellow units = Neogene (M), light yellow units = Quaternary loess (l) and colluvium (dpr), gray and light blue units = Quaternary alluvium (a, ap), light green units = palustrine); and (
b) An interpreted orthophoto image [
13] of the activated fault system that was captured a few years before the 2020 earthquakes. Numbers and blue triangles mark the positions of the field photographs that are shown in
Figure 6: 1–6A, 2–6B, 3–6C, 4–6D. The inset shows sag ponds along the main creeping sinistral fault line, appearing on an active agricultural land (the orthophoto image is taken in 2018).
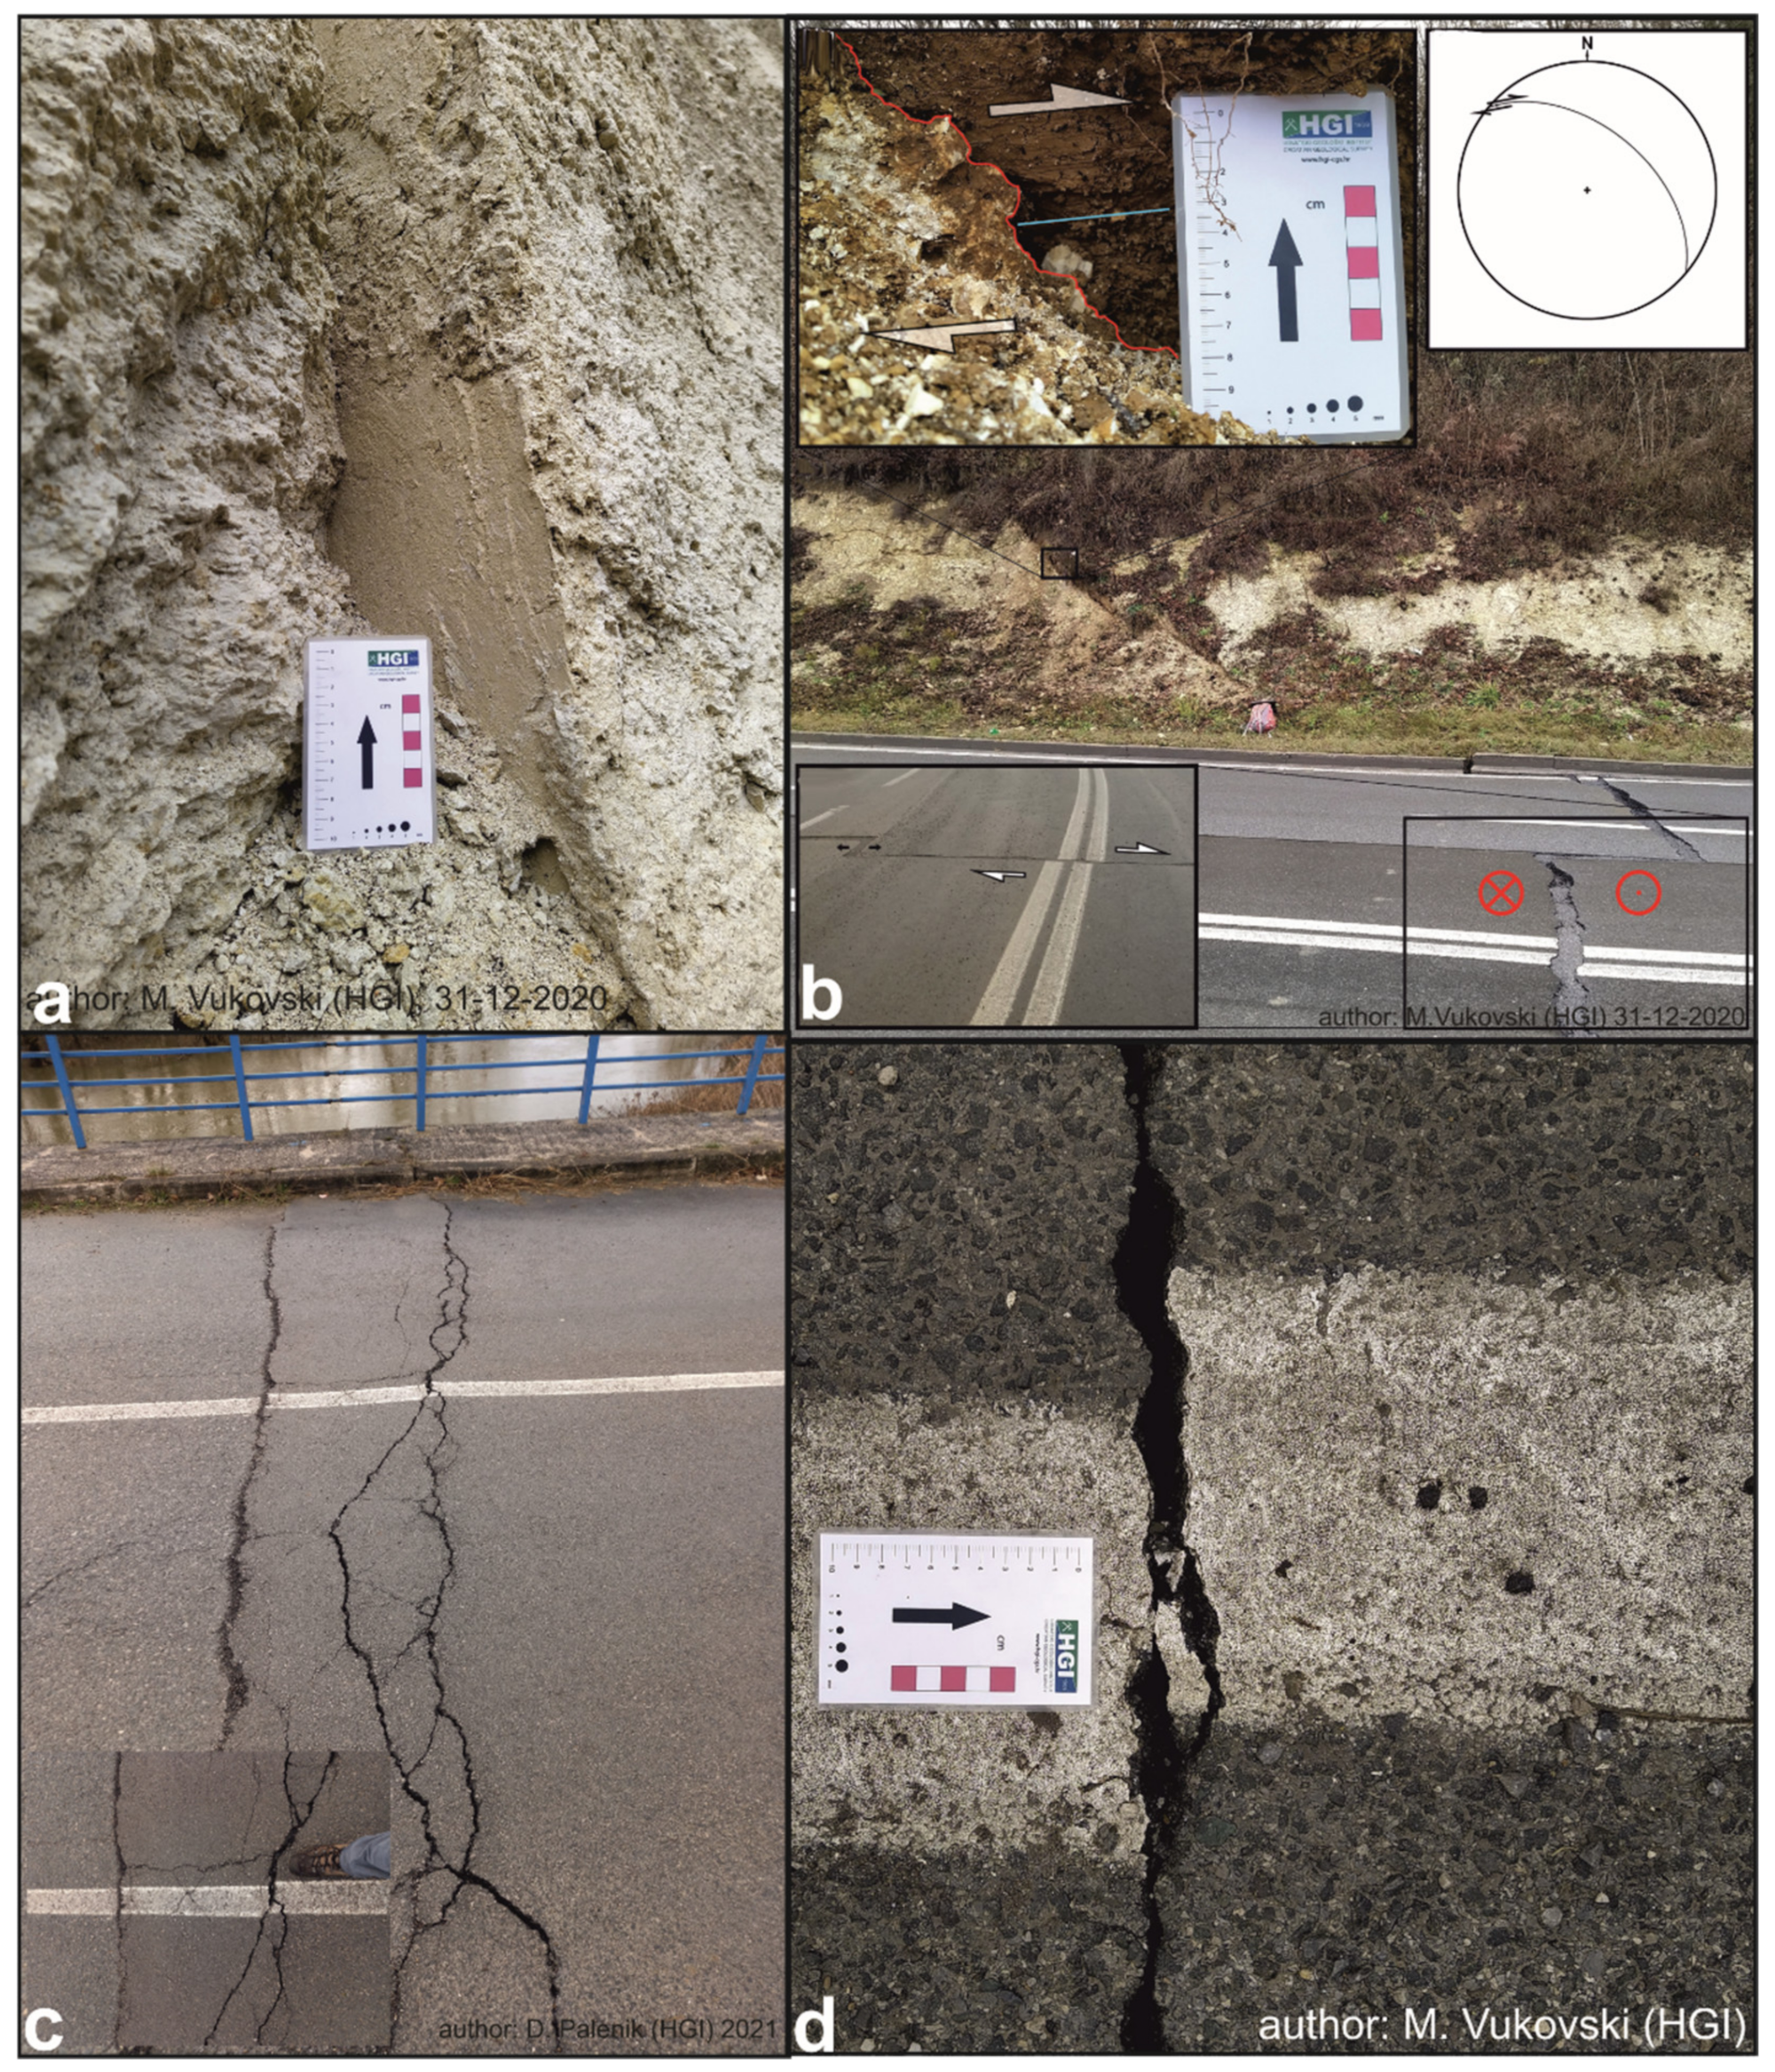
Figure 6.
(
a) The dextral coseismic displacement along the NW–SE striking subvertical fault plane in an abandoned quarry SW of Župić (WGS: 45.4229/16.2243); (
b) Dextral coseismic displacement across a road west of Župić. Note fresh sub-horizontal striations in the soil (WGS: 45.4239/16.2226). Insets show the fault details with marked displacement and the fault surface projection on the lower hemisphere; (
c) Sinistral displacement of a bridge NE of Glina (WGS: 45.3697/16.1183); and (
d) Sinistral displacement on the road W of Petrinja (WGS: 45.4449/16.2590). The locations of the field photographs are presented in
Figure 5.
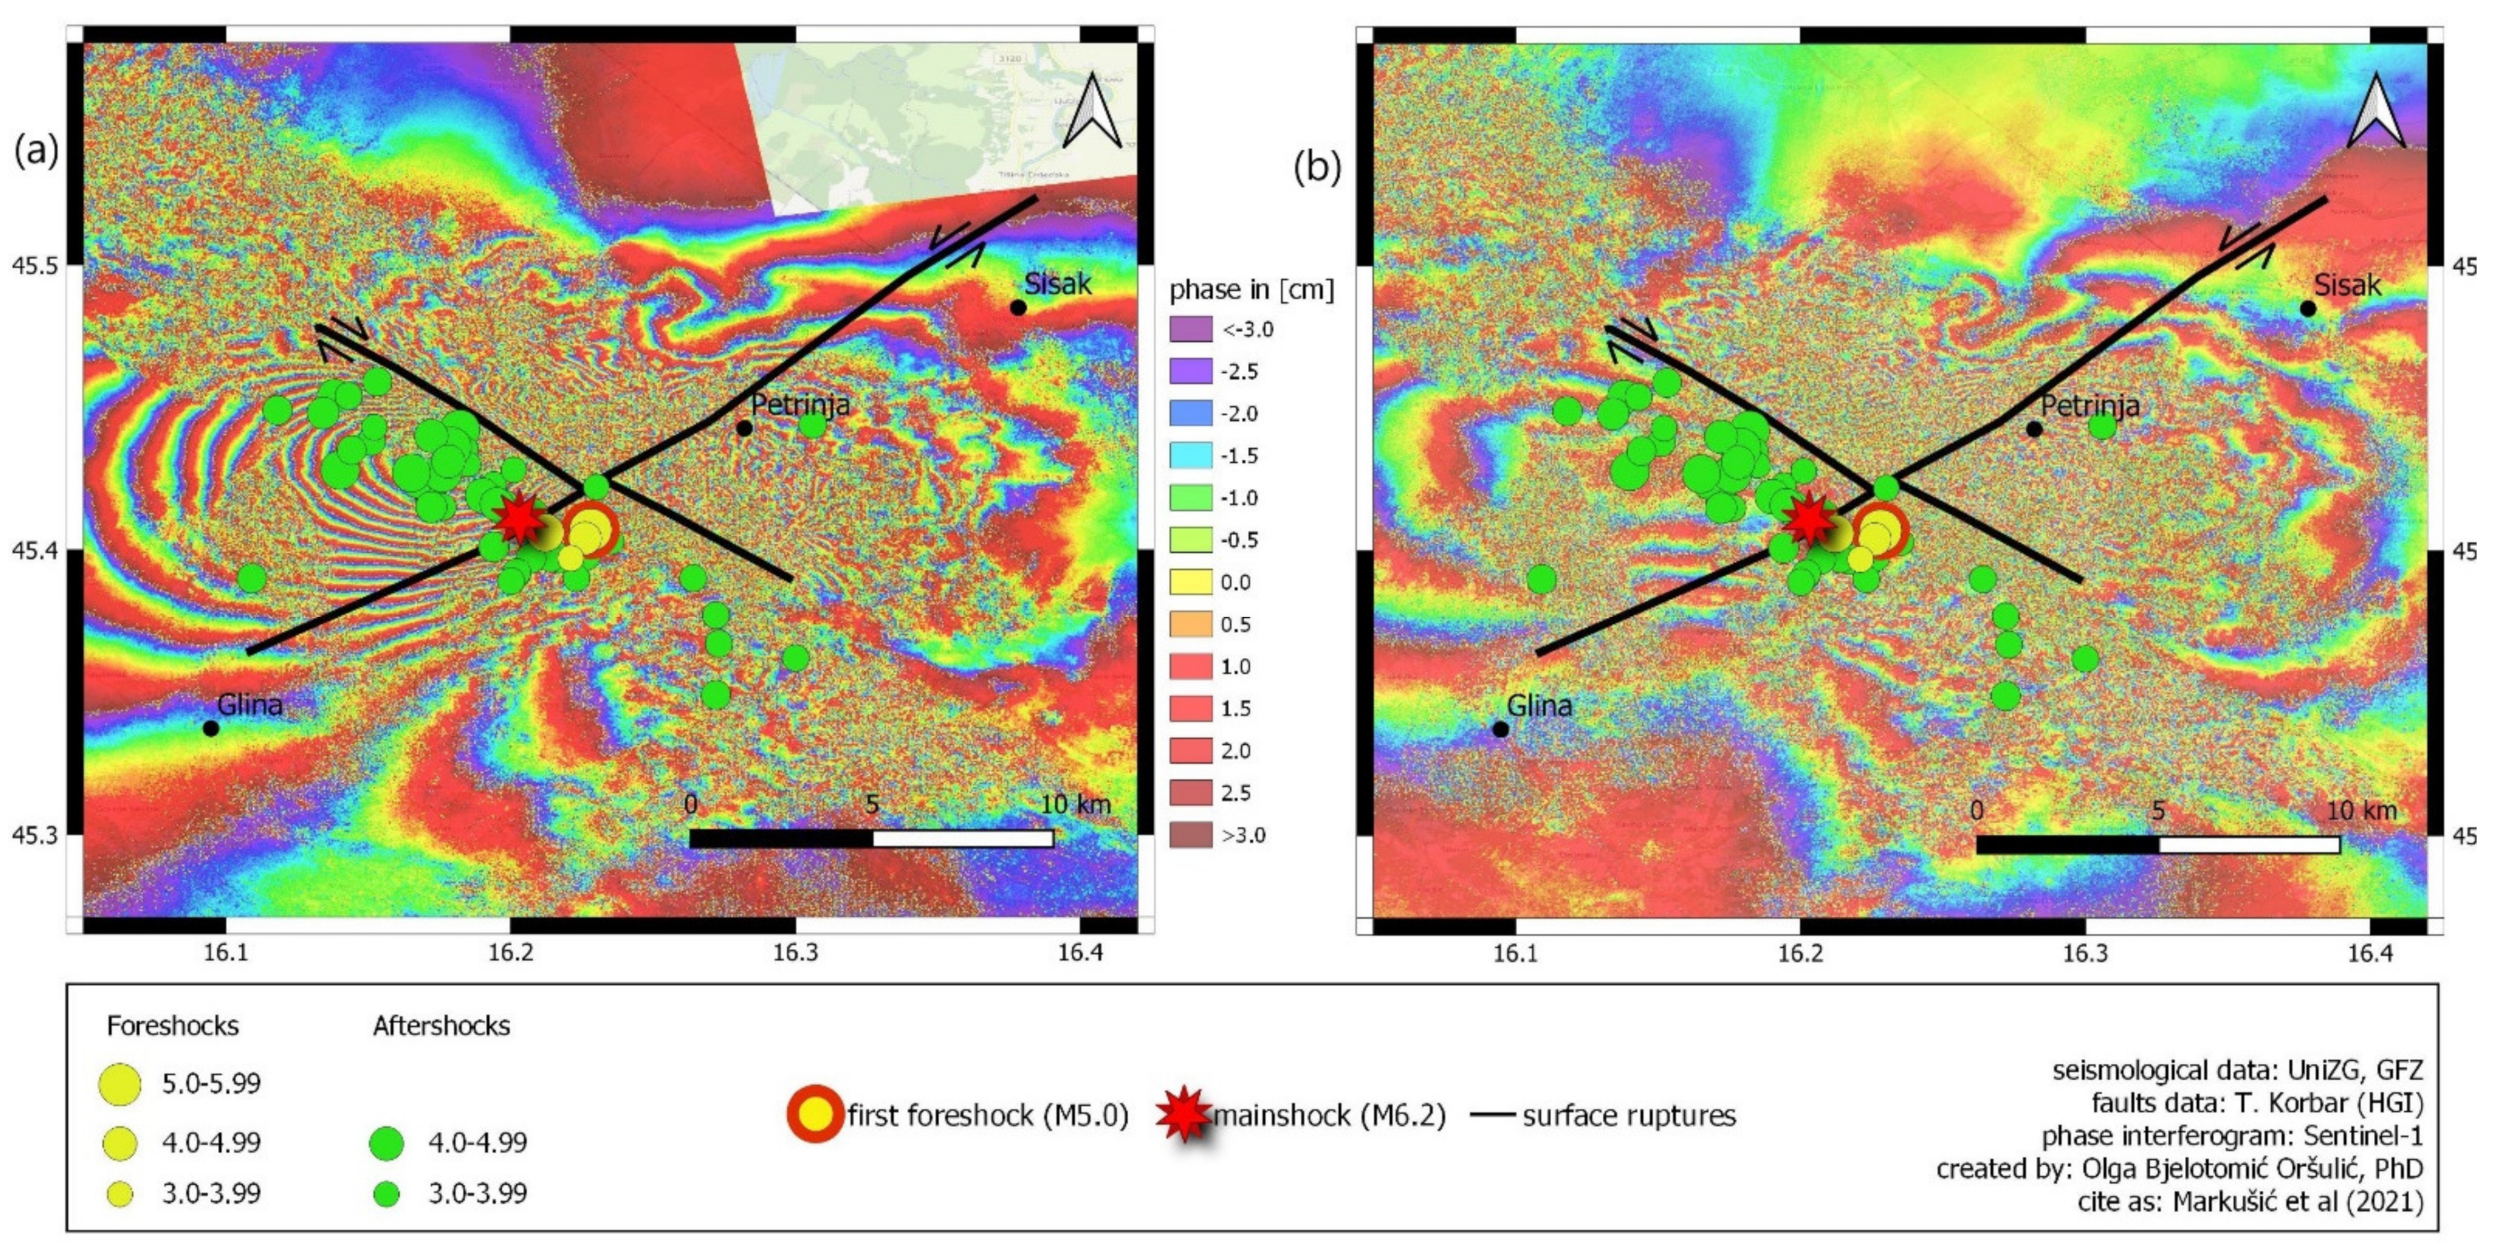
Figure 7.
Interferogram of the (a) Sentinel-1A ascending orbit T146 and (b) Sentinel 1-B descending orbit T124. Each colour fringe corresponds to 2.8 cm of ground displacement (corresponding to a displacement of half of a wavelength of 5.6 cm, since the origin of the data is C-band radar).
Figure 7.
Interferogram of the (a) Sentinel-1A ascending orbit T146 and (b) Sentinel 1-B descending orbit T124. Each colour fringe corresponds to 2.8 cm of ground displacement (corresponding to a displacement of half of a wavelength of 5.6 cm, since the origin of the data is C-band radar).
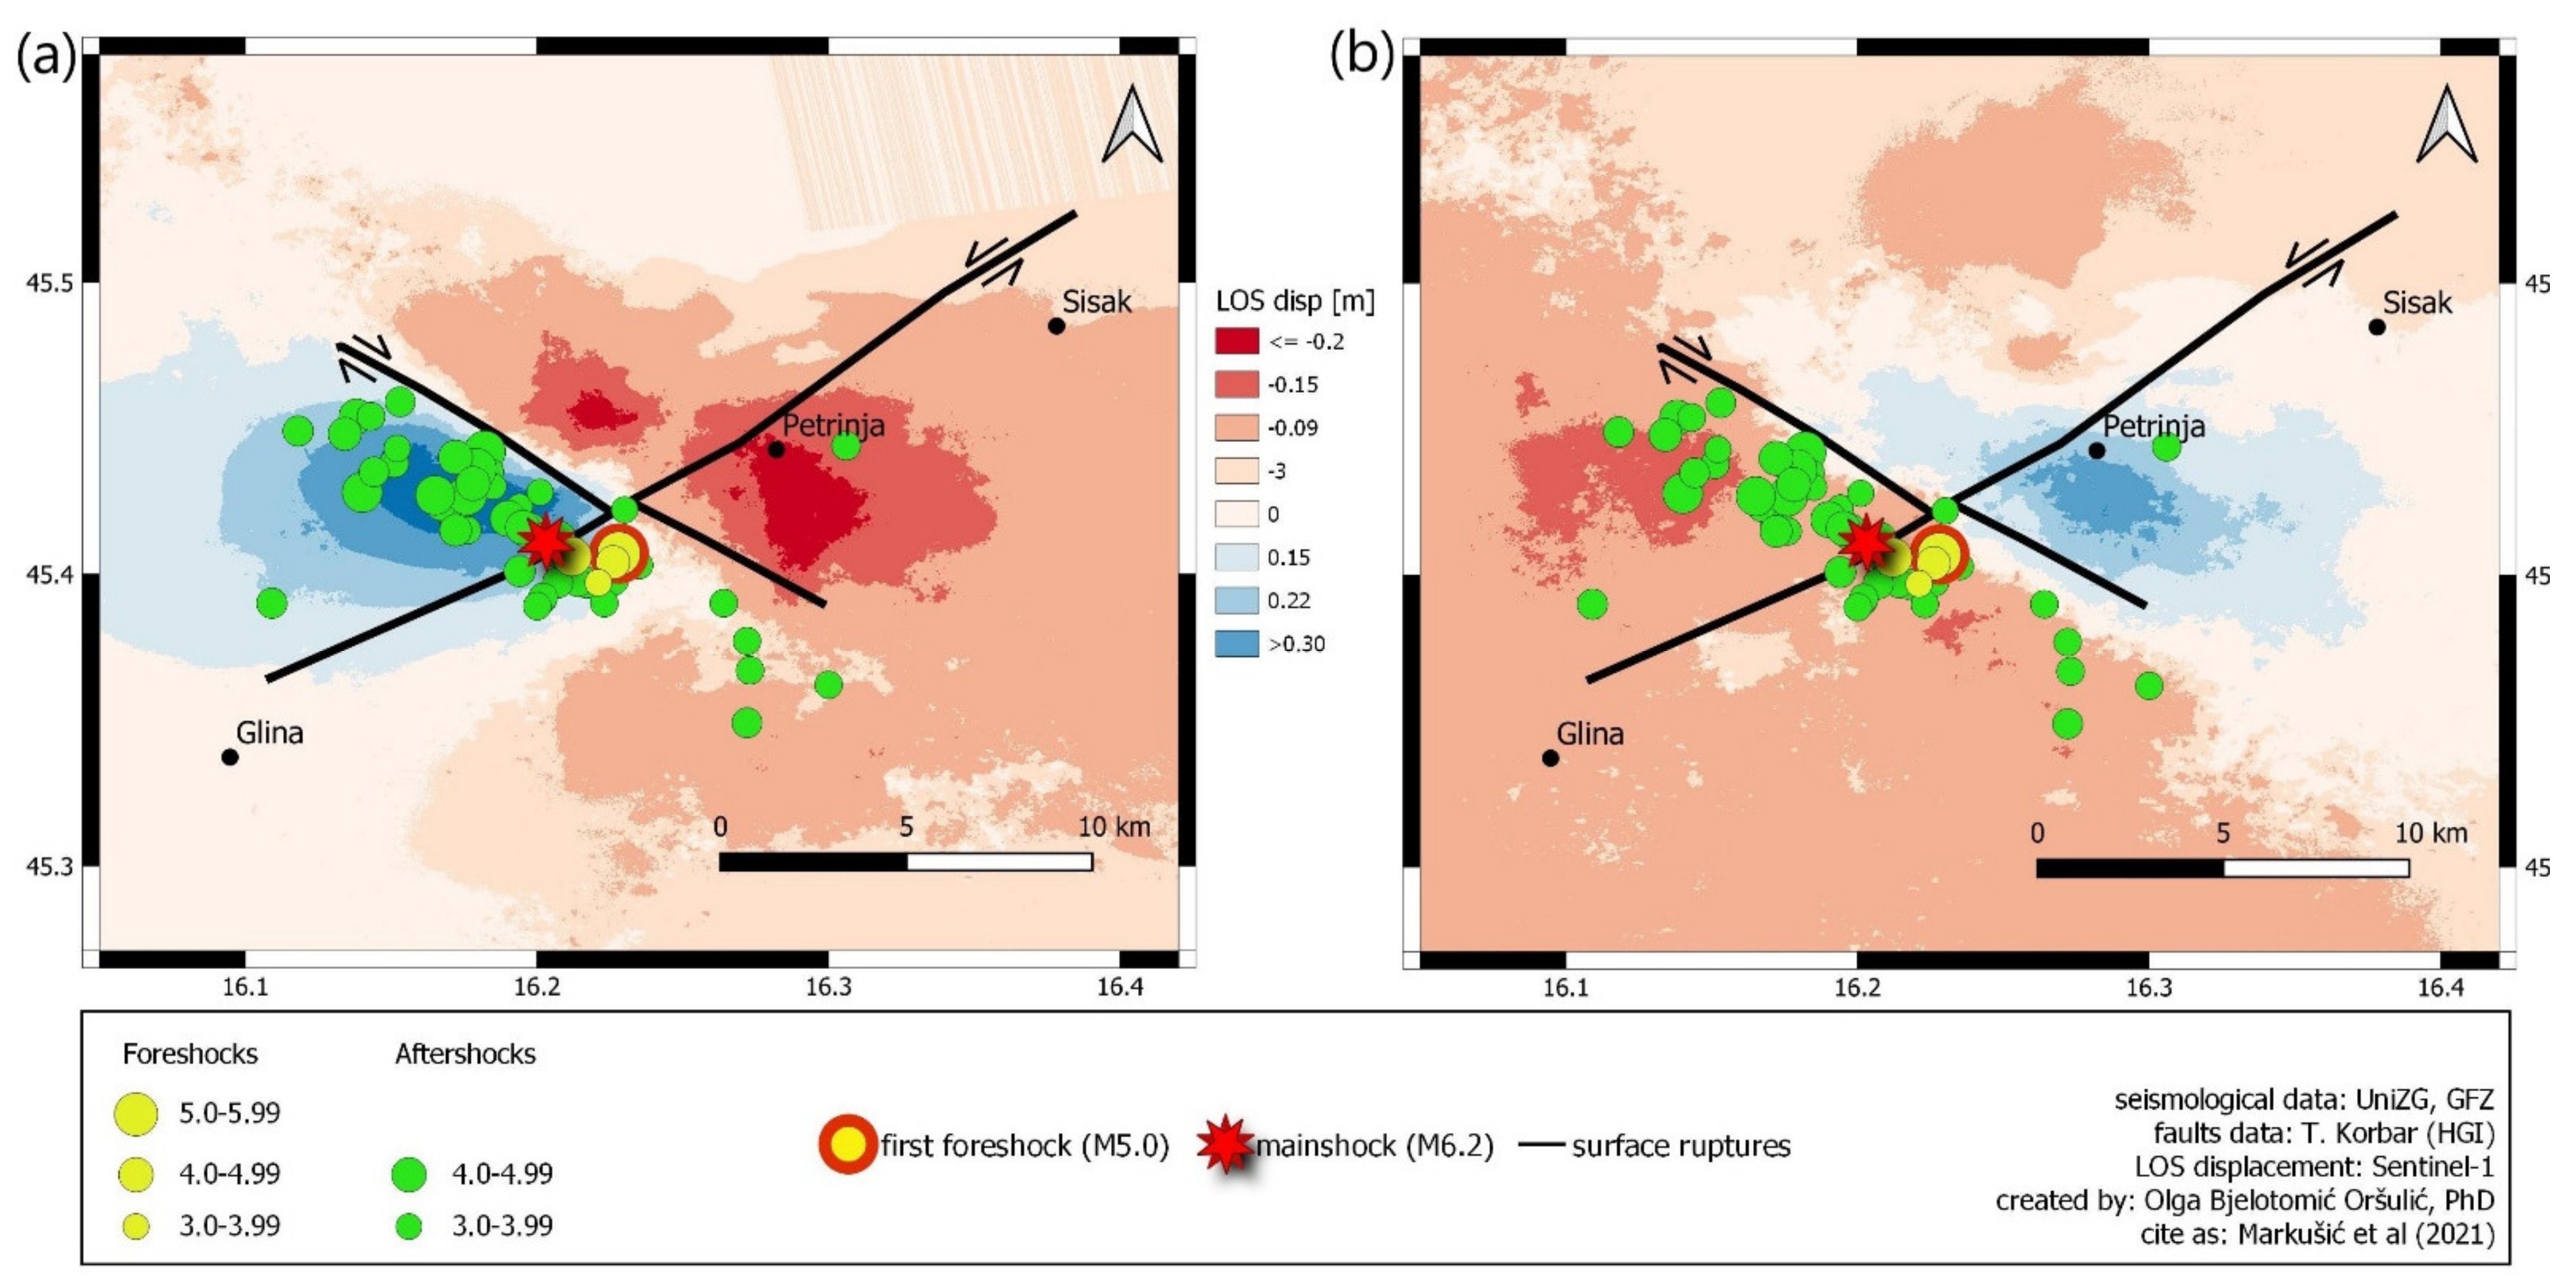
Figure 8.
Line of sight (LOS) displacements for (a) Sentinel-1A ascending orbit T146, which has an amplitude of 74 cm and (b) Sentinel-1B descending orbit T124, which has an amplitude of 53 cm.
Figure 8.
Line of sight (LOS) displacements for (a) Sentinel-1A ascending orbit T146, which has an amplitude of 74 cm and (b) Sentinel-1B descending orbit T124, which has an amplitude of 53 cm.
An orthophoto image (which was captured a few years before the 2020 earthquakes) of a section of the Petrinja Fault that strikes NE–SW and crosses the Kupa Valley (
Figure 5) shows typical strike-slip sag ponds, which were created due to probably continuous movements along the creeping Petrinja Fault. The sag ponds are clear evidence of the fault activity (creeping) during years before the 2020 earthquake [
13]. Interestingly, although the Pokupsko Fault has clearer geomorphological expression, the coseismic block movements were likely larger along the Petrinja Fault (
Figure 7 and
Figure 8). Seismological data clearly show that the Pokupsko Fault was/is characterized by stronger seismicity, while the Petrinja Fault is nearly aseismic (
Figure 1b). Nevertheless, foreshocks could occur along the Petrinja Fault, while most of the aftershocks were evidently related to the 20 km-long activated section of the Pokupsko Fault. While the former is part of the probably deep crustal Sisak–Petrinja–Glina–Topusko Fault line, the latter has an even longer and clearer geomorphological and geological expression and could be defined as the Pokupsko–Kostajnica–Banja Luka Fault line (
Figure 1a). Nevertheless, the mainshock was located strictly on the Petrinja Fault line (surface projection). Interestingly, the hypocentre of the mainshock was twice as shallow (6 km) as the strongest (first) foreshock (12 km). Furthermore, thermal and mineral water and hydrogen sulfide (H
2S) springs occur along Pokupsko fault line [
14]. The Pokupsko Fault produced most of its seismicity during the 2020 sequence along an approximately 20 km-long section characterized probably by the transpressional (positive flower) structure of the Hrastovička gora (
Figure 5). Similar but broader structures could be recognized on the NW extension of the fault (Vukomeričke gorice), while transtensional structures (pull-apart or negative flower) could be recognized on the geological maps on the SE extension of the fault in the Mečenčani and Kukuruzari areas [
15] The later area was characterized by extreme secondary postseismic near-surface effects, namely suffusion and opening of almost a hundred sinkholes during the first months after the first foreshock [
16]. This phenomenon could be related to sulfuric acid speleogenesis, since the water table is close to the surface in the area and close to contact with the underlying Miocene limestones and the late Quaternary alluvial cover that was deposited by the Sunja River [
15]. Thus, we suppose that after the 2020 event, there was increased circulation of H
2S along the fault line. H
2S could reacted with oxygen at the water table and above, and caused increased corrosion of the Miocene limestones [
17]. In combination with possible coseismic centimeterblock movements in the Mečenčani pull-apart structure, collapses of the karsified limestones led to the suffusion of the overlying alluvium and the soil.
5. Geodetical Investigations and Geological Interpretation
For the geodetic aspect of this study, satellite-based Synthetic Aperture Radar (SAR) images were used. Recently, SAR has become a well-established technology that is commonly used in studies of land displacements [
18,
19] and earthquakes [
20,
21,
22,
23]. SAR images can be acquired almost in real time and regardless of clouds or any weather condition. Therefore, we used multiple spatiotemporal images that were acquired by Sentinel-1, which is a constellation of satellites of the European Union’s Earth observation program [
24] Copernicus. It is jointly coordinated by European umbrella institutions and provides global satellite data in real time and free of charge.
The Sentinel-1 satellite constellation consists of two polar-orbiting satellites that are each equipped with a C-SAR (C-band SAR) sensor. The satellites are continuously circulating around the globe in two directions, namely ascending and descending, each with a revisiting time of 12 days, and they provide multiple images over the same area in different time periods. We used Level-1 images of the Sentinel-1 Single Look Complex (SLC) that were acquired in Interferometric Wide Swath (IWS) mode with 5x20 spatial resolution. We analysed pairs of Sentinel-1A and Sentinel-1B images, wherein Sentinel-1A images were captured in ascending orbit number T146 and Sentinel-1B images were captured in descending orbit number T124. For the before images, we used Sentinel-1A images that were captured on 18 December 2020 and Sentinel-1B images that were captured on 23 December 2020, and for the after-earthquake state-of-the-art images we used Sentinel-1A images that were captured on 30 December 2020 and Sentinel-1B images that were captured on 4 January 2020, respectively. The images were selected and downloaded via the Copernicus Sci Hub data site [
25].
Interferometry processing was conducted using a well-established procedure from InSAR processing (additional details are provided in [
26,
27]), and the analysis was performed in the Sentinel Application Platform (SNAP), which is the European Space Agency’s (ESA) open toolbox for Sentinel analysis [
28]. The most suitable feature of SAR images for earthquake detection is the phase that enables the determination of land displacement. It is expressed as a wavelength and can be mapped on an interferogram. The interferogrametric phase represents the difference in distance between recorded signals that were acquired from two SAR images captured with the same orbit direction. The interferograms in
Figure 7 show a satisfactory correlation with the signal dominated by deformations with negligible coherence. Subsequently, such interferograms are a reliable foundation for the detection of the range and behaviour of land deformations after hazardous earthquakes. The interferograms mutually differ due to the difference in the incident angles of the orbits, which range from 36.24 to 45.78 and 35.03 to 41.73 degrees for Sentinel-1A and Sentinel-1B, respectively.
Unwrapping the interferometric phase, we obtained the displacement in line of sight (LOS) of the SAR radar. It represents a spatial displacement vector in the direction of the radar signal [
29]. LOS displacement is not a value that expresses the real ground movement of the Earth’s surface, but it demonstrates the occurrence and implies the behaviour of land motion.
The results of the SAR analysis (
Figure 8) clearly show a fault zone that stretches from NW to SE, which is identified as the Pokupsko Fault, and it corresponds entirely to the geological data. The SE extension of the fault, which is not marked by clear surface ruptures, is also visible. In addition, the strike of the Petrinja Fault (NE to SW) is also recognized although it cannot be clearly identified by SAR analysis, which is likely due to the resultant vector of the dextral and sinistral movements along the fault system. The resultant vector is the largest in the eastern and western quadrants of the fault system; thus, the Petrinja earthquake 2020 resulted in clear east–west lateral extrusion of the faulted blocks that were delineated by the activated faults.
We assume, according to the preliminary multidisciplinary analyses of the fault system, that the creeping sinistral Sisak–Petrinja–Glina–Topusko Fault is locking the dextral Pokupsko–Kostajnica–Banja Luka Fault. Thus, the Petrinja 2020 seismic sequence could have been triggered by the first foreshock that occurred along the sinistral fault. A similar complex fault mechanism is also proposed for the Banja Luka area (
Figure 1a), since the dextral NW–SE striking fault at Banja Luka is cut by the sinistral NE–SW striking Vrbas Fault [
30], which is a regional fault that is mapped further to the NE, along the Orljava River in Croatia [
31].
6. Earthquake Performance of Buildings
In the design of earthquake-resistant buildings with regard to the peak ground acceleration
PGA, in accordance with the official probabilistic seismic hazard map for the Republic of Croatia for a return period of 475 years, the strong ground motion that is designated for Sisak-Moslavina County should not exceed a
PGAROCK of 0.16 g [
32]. However, the recent M6.2 event exerted ground motion with a
PGAROCK of approximately 0.3 g [
33], thereby exceeding this limit by approximately 0.15 g and placing the buildings in the higher category of earthquake demand grade in compliance with building code EN1998-1:2004 [
34] requirements (including [
35,
36] provisions). The highest historical intensity occurred in the county in 1909, and it was estimated as VIII °MCS scale. In addition, a question arises regarding the vulnerability of buildings that were constructed prior to the implementation of contemporary building code EN1998-1:2004 [
34] in 2013, which can be divided in principle according to the periods of development of building code regulations (until 1964, from 1965 to 1981 [
37], from 1982 to 1998 [
38] and from 1998 to 2012 [
39,
40,
41]). The update of the building codes was related to consequences of the 1963 Skopje, North Macedonia and 1979 Montenegro earthquakes (the first two earthquake code eras) and the establishment of the Eurocodes.
According to the Disaster Risk Assessment for the Republic of Croatia [
42], buildings that were built before 1964 (pre-earthquake code era) were not designed for earthquake resistance at all, while in later periods the values of horizontal accelerations or the corresponding calculated horizontal force, depending on the observed location, were much lower. As discussed in [
42], buildings’ earthquake resistance for the corresponding periods of construction, building regulations periods and vulnerability classes with respect to the EMS-98 scale [
43] (unreinforced masonry with timber floors, namely class B; unreinforced masonry with reinforced concrete (RC) floors and horizontal confining elements, namely class C; confined masonry, namely class D; RC frame ductility class low (DCL), ductility class medium (DCM) and ductility class high (DCH), namely classes C, D and E, respectively) could be estimated as follows:
Buildings that were built before 1945 possessed approximately 5% earthquake resistance, as required by [
34]. They were built as unreinforced masonry buildings with timber floors and without considerations of earthquake action (no building codes). According to the type of structure, they belonged to vulnerability class B in compliance with EMS-98 [
43];
Buildings that were built from 1946 to 1964 were approximately 10% earthquake resistant, as required by [
34]. They were unreinforced masonry buildings with predominantly reinforced concrete slabs without confining elements, which ultimately resulted in poor earthquake performance. An order on temporary technical regulations for building loads was introduced in the stated time period [
42]. Such buildings also belonged to vulnerability class B in compliance with the EMS-98 scale [
43];
Buildings that were built from 1965 to 1981, in the aftermath of the M6.9 1963 Skopje, North Macedonia earthquake, were constructed under the Ordinance on Temporary Technical Regulations for Construction in Seismic Areas [
37], which introduced the first building codes that considered earthquake action, including the earthquake hazard map from 1964. These buildings were designed and constructed with reinforced concrete or masonry with vertical and horizontal confining elements. However, they had low earthquake resistance of up to 30–50%, as required by [
34]. Such buildings belonged to vulnerability classes C and D in compliance with the EMS-98 scale [
43];
Medium earthquake resistance was realised by building code regulations in the period between 1982 and 1998, when the Ordinance on Technical Standards for the Construction of High-Rise Buildings in Seismic Areas [
38] was introduced (in the aftermath of the M7.1 1979 Montenegro earthquake). However, this resulted in poor performance of buildings with 30–50% of the required earthquake resistance realised, as defined by [
34]. Masonry infilled RC frame structures were frequently used for medium- and high-rise buildings (infill walls were considered to be non-structural partition walls). Such buildings belonged to vulnerability classes C and D in compliance with the EMS-98 scale [
43];
In the years between 1999 and 2012, building codes ENV 1998-1-1:1994 [
39] were introduced, which resulted in 70–100% of the required building earthquake resistance [
34]. They were superseded by contemporary building codes EN1998-1:2004 [
34] in 2013 (100% of the required building earthquake resistance). Such buildings belonged to vulnerability classes D and E in compliance with the EMS-98 scale [
43].
In any case, buildings possess an initial resistance that depends on the structural system and the construction method, which can be increased via retrofitting techniques, e.g., [
44,
45]. In
Tables S1 and S2 (see Supplementary Materials), the building code requirements on masonry buildings with respect to the building code era (e.g., on materials, wall and opening measures and confining elements) are summarised. Detailed information on the building code requirements of masonry and reinforced concrete buildings for earthquake-prone regions is available in [
34,
35,
36,
37,
38,
39,
40,
41].
In the seismic intensity maps for the period of building code provisions from 1965 to 1981 [
37], from 1982 to 1998 [
38] and from 1998 to 2012 [
39,
40,
41], intensities of VII (very strong) to VIII (severe) °MCS were assigned for Sisak-Moslavina County. They correspond to intensities of VII (damaging) and VIII (heavily damaging) °EMS, respectively. By considering the relationship between
PGA and the intensities according to the EMS-98 [
43] and MCS [
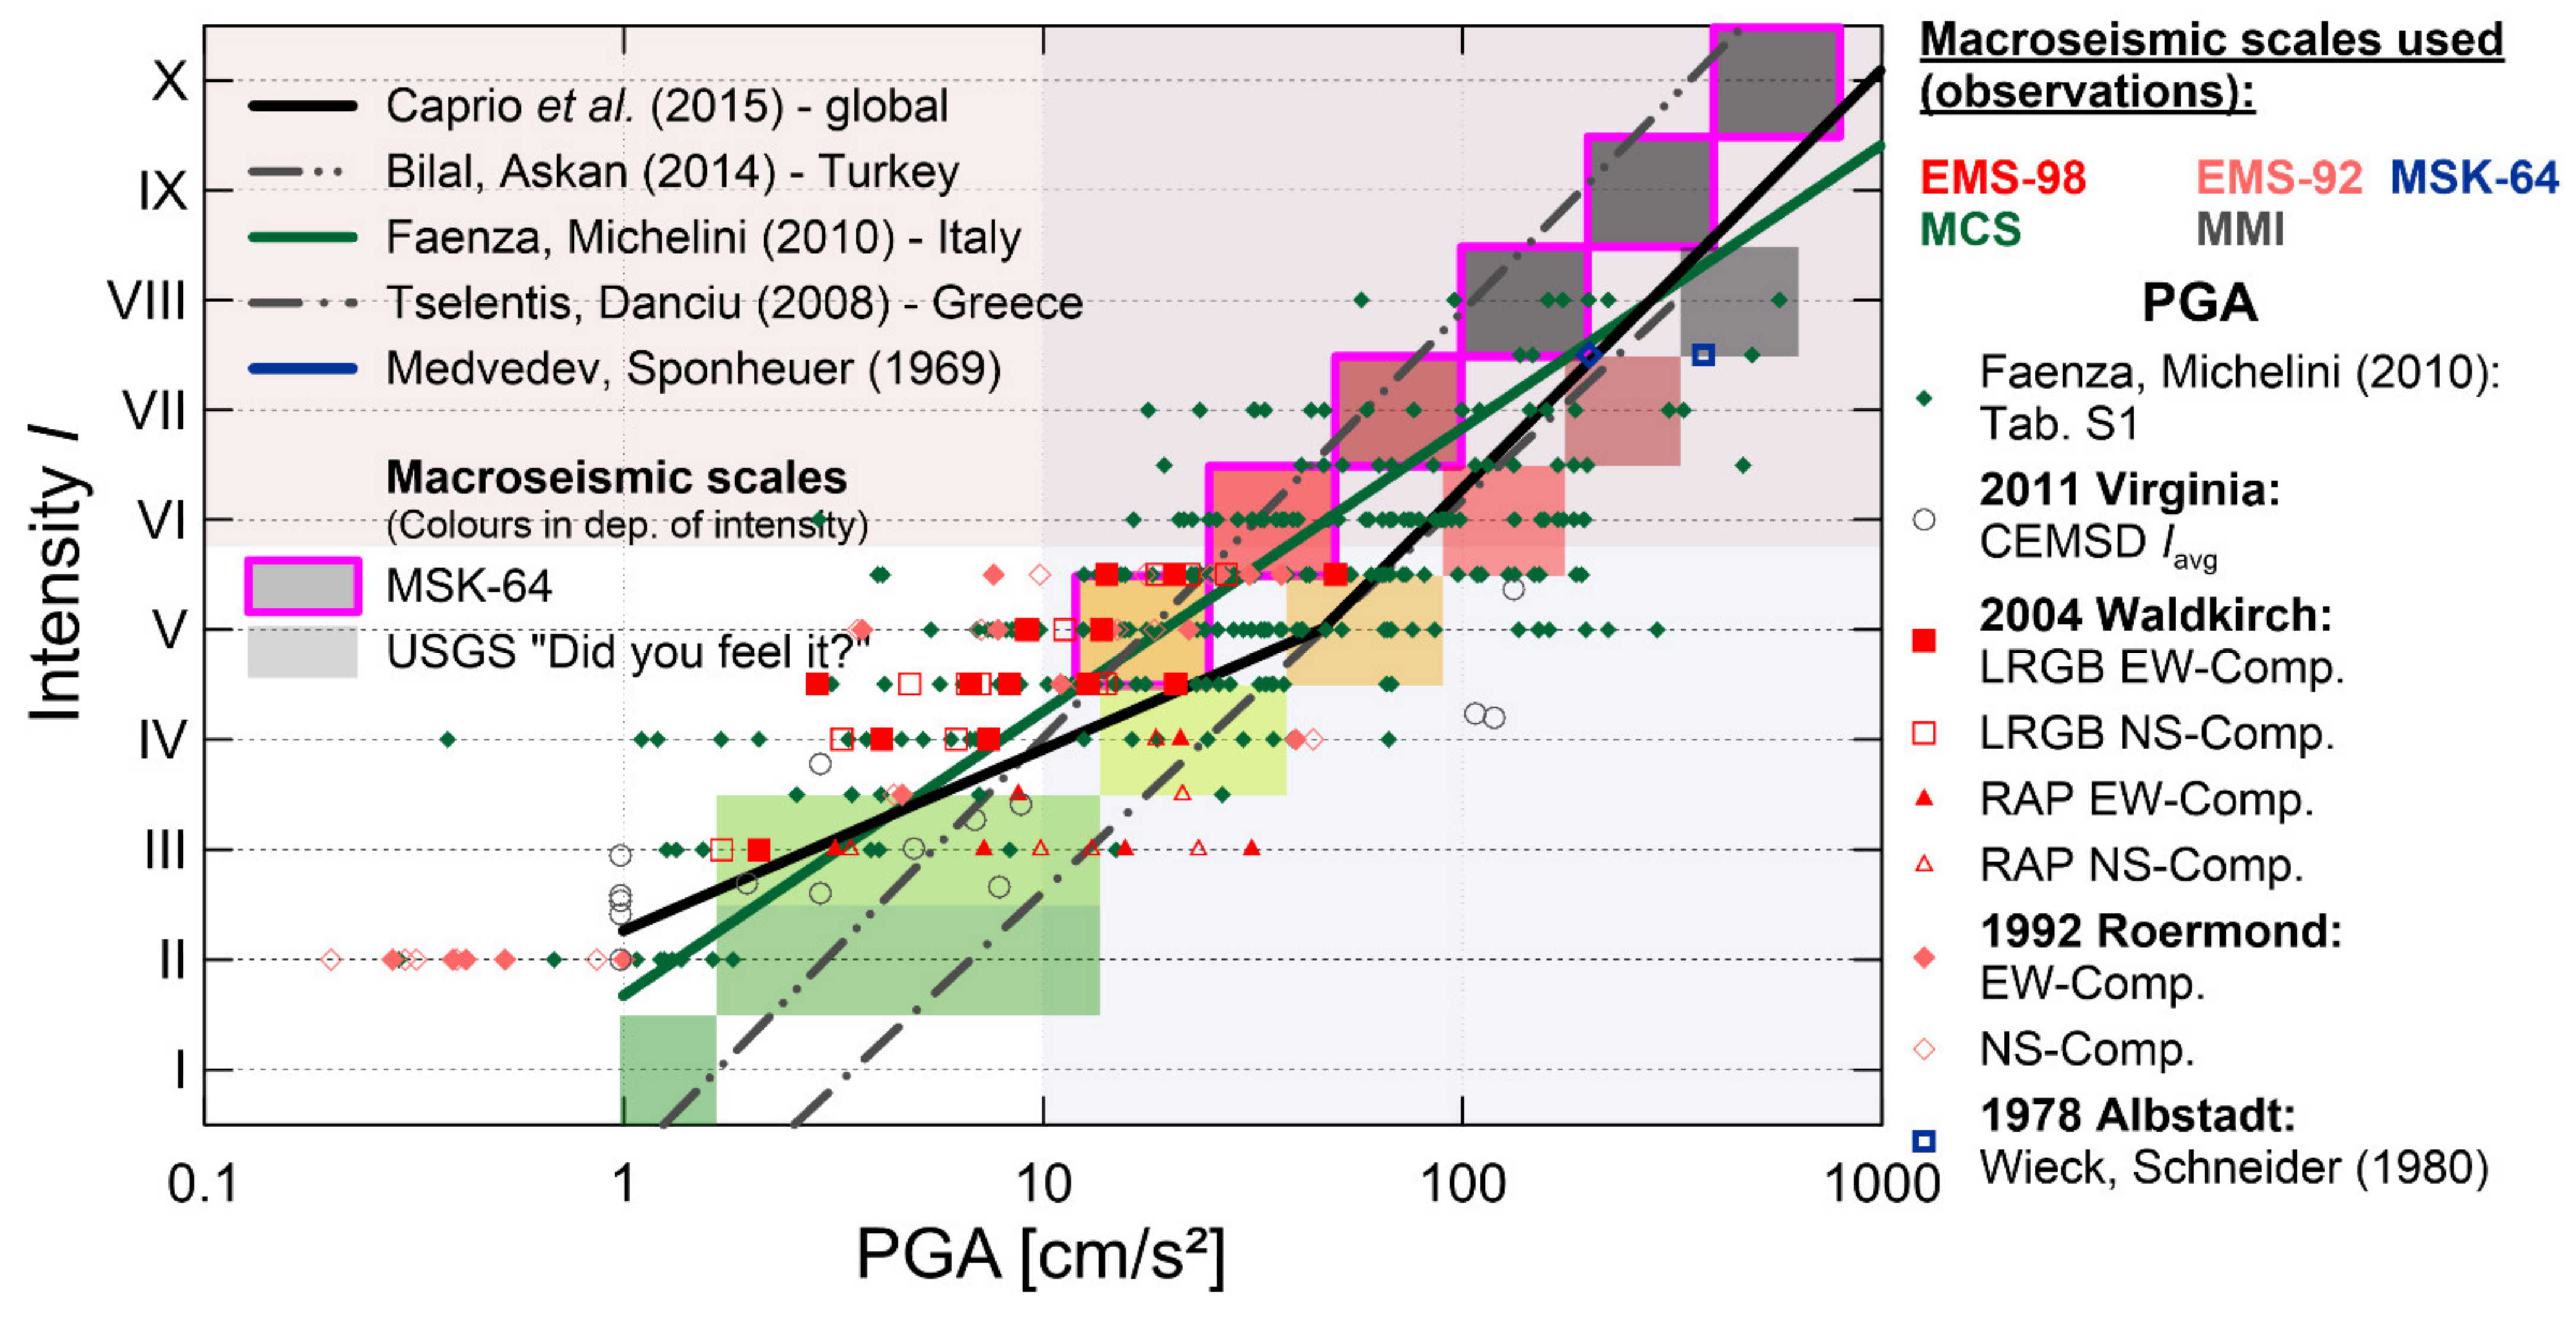
46] (subjective) intensity scales, e.g., as shown in
Figure 9 [
47], a mean
PGA values of 0.3 g could be related to intensity IX (violent) °MCS or EMS scale. Furthermore, mean
PGA values of 0.1 g could be related to an intensity of VIII °MCS or EMS scale, and a
PGA of 0.07 g to an intensity of VII °MCS or EMS scale. The two intensity scales, namely EMS-98 and MCS, correlate in a straightforward manner with the earthquake M6.2 event with a
PGA of 0.25 g that struck Sisak-Moslavina County in 2020 at intensities of VIII (heavily damaging, severe) to IX (destructive, violent) °MCS/EMS.
In a survey of damage to buildings in Sisak-Moslavina County after the M6.2 Petrinja 2020 earthquake that was conducted by structural engineers in the field, vulnerability classes and damage grades were defined in compliance with the EMS-98 scale. The damage grades (qualitative measures of vulnerability) are described as follows: Grade 1 (DG 1): negligible to slight damage; Grade 2 (DG 2): moderate damage; Grade 3 (DG 3): substantial to heavy damage; Grade 4 (DG 4): very heavy damage and Grade 5 (DG 5): destruction. The damage grades describe the degree of damage to the buildings (which range from 1 to 5) and could be regarded as a function of earthquake intensity. They provide a detailed description of building damage that results from an earthquake by differentiating building structural systems or elements (structural and non-structural). Therefore, they are the most suitable tool for the assessment of building conditions after earthquakes.
As reported by [
48], on 1 February 2021, a total of 34,056 damaged buildings were reported, of which 22,966 were examined. The distribution of damage grades (DG 1 to DG 5), in compliance with the EMS-98 scale [
43], was as follows: approximately 13% (3062) of the buildings had damage of Grade 4 (DG 4) or Grade 5 (DG 5) (very heavy damage or destruction), approximately 22% (5095) Grade 3 (DG 3), and approximately 65% (14,809), Grade 1 (DG 1) to Grade 2 (DG 2) (negligible to slight damage or moderate damage). Most of the damage of Grade 4 (DG 4) to Grade 5 (DG 5) was observed on masonry buildings that were constructed in the period before the 1964 building code requirements [
42], namely the pre-M6.9 1963 Skopje, North Macedonia earthquake era. They were constructed mostly as two- to three-storey unreinforced masonry buildings with timber floors that belonged to vulnerability class B in compliance with the EMS-98 scale [
43]. In most cases, these buildings were recommended for demolition.
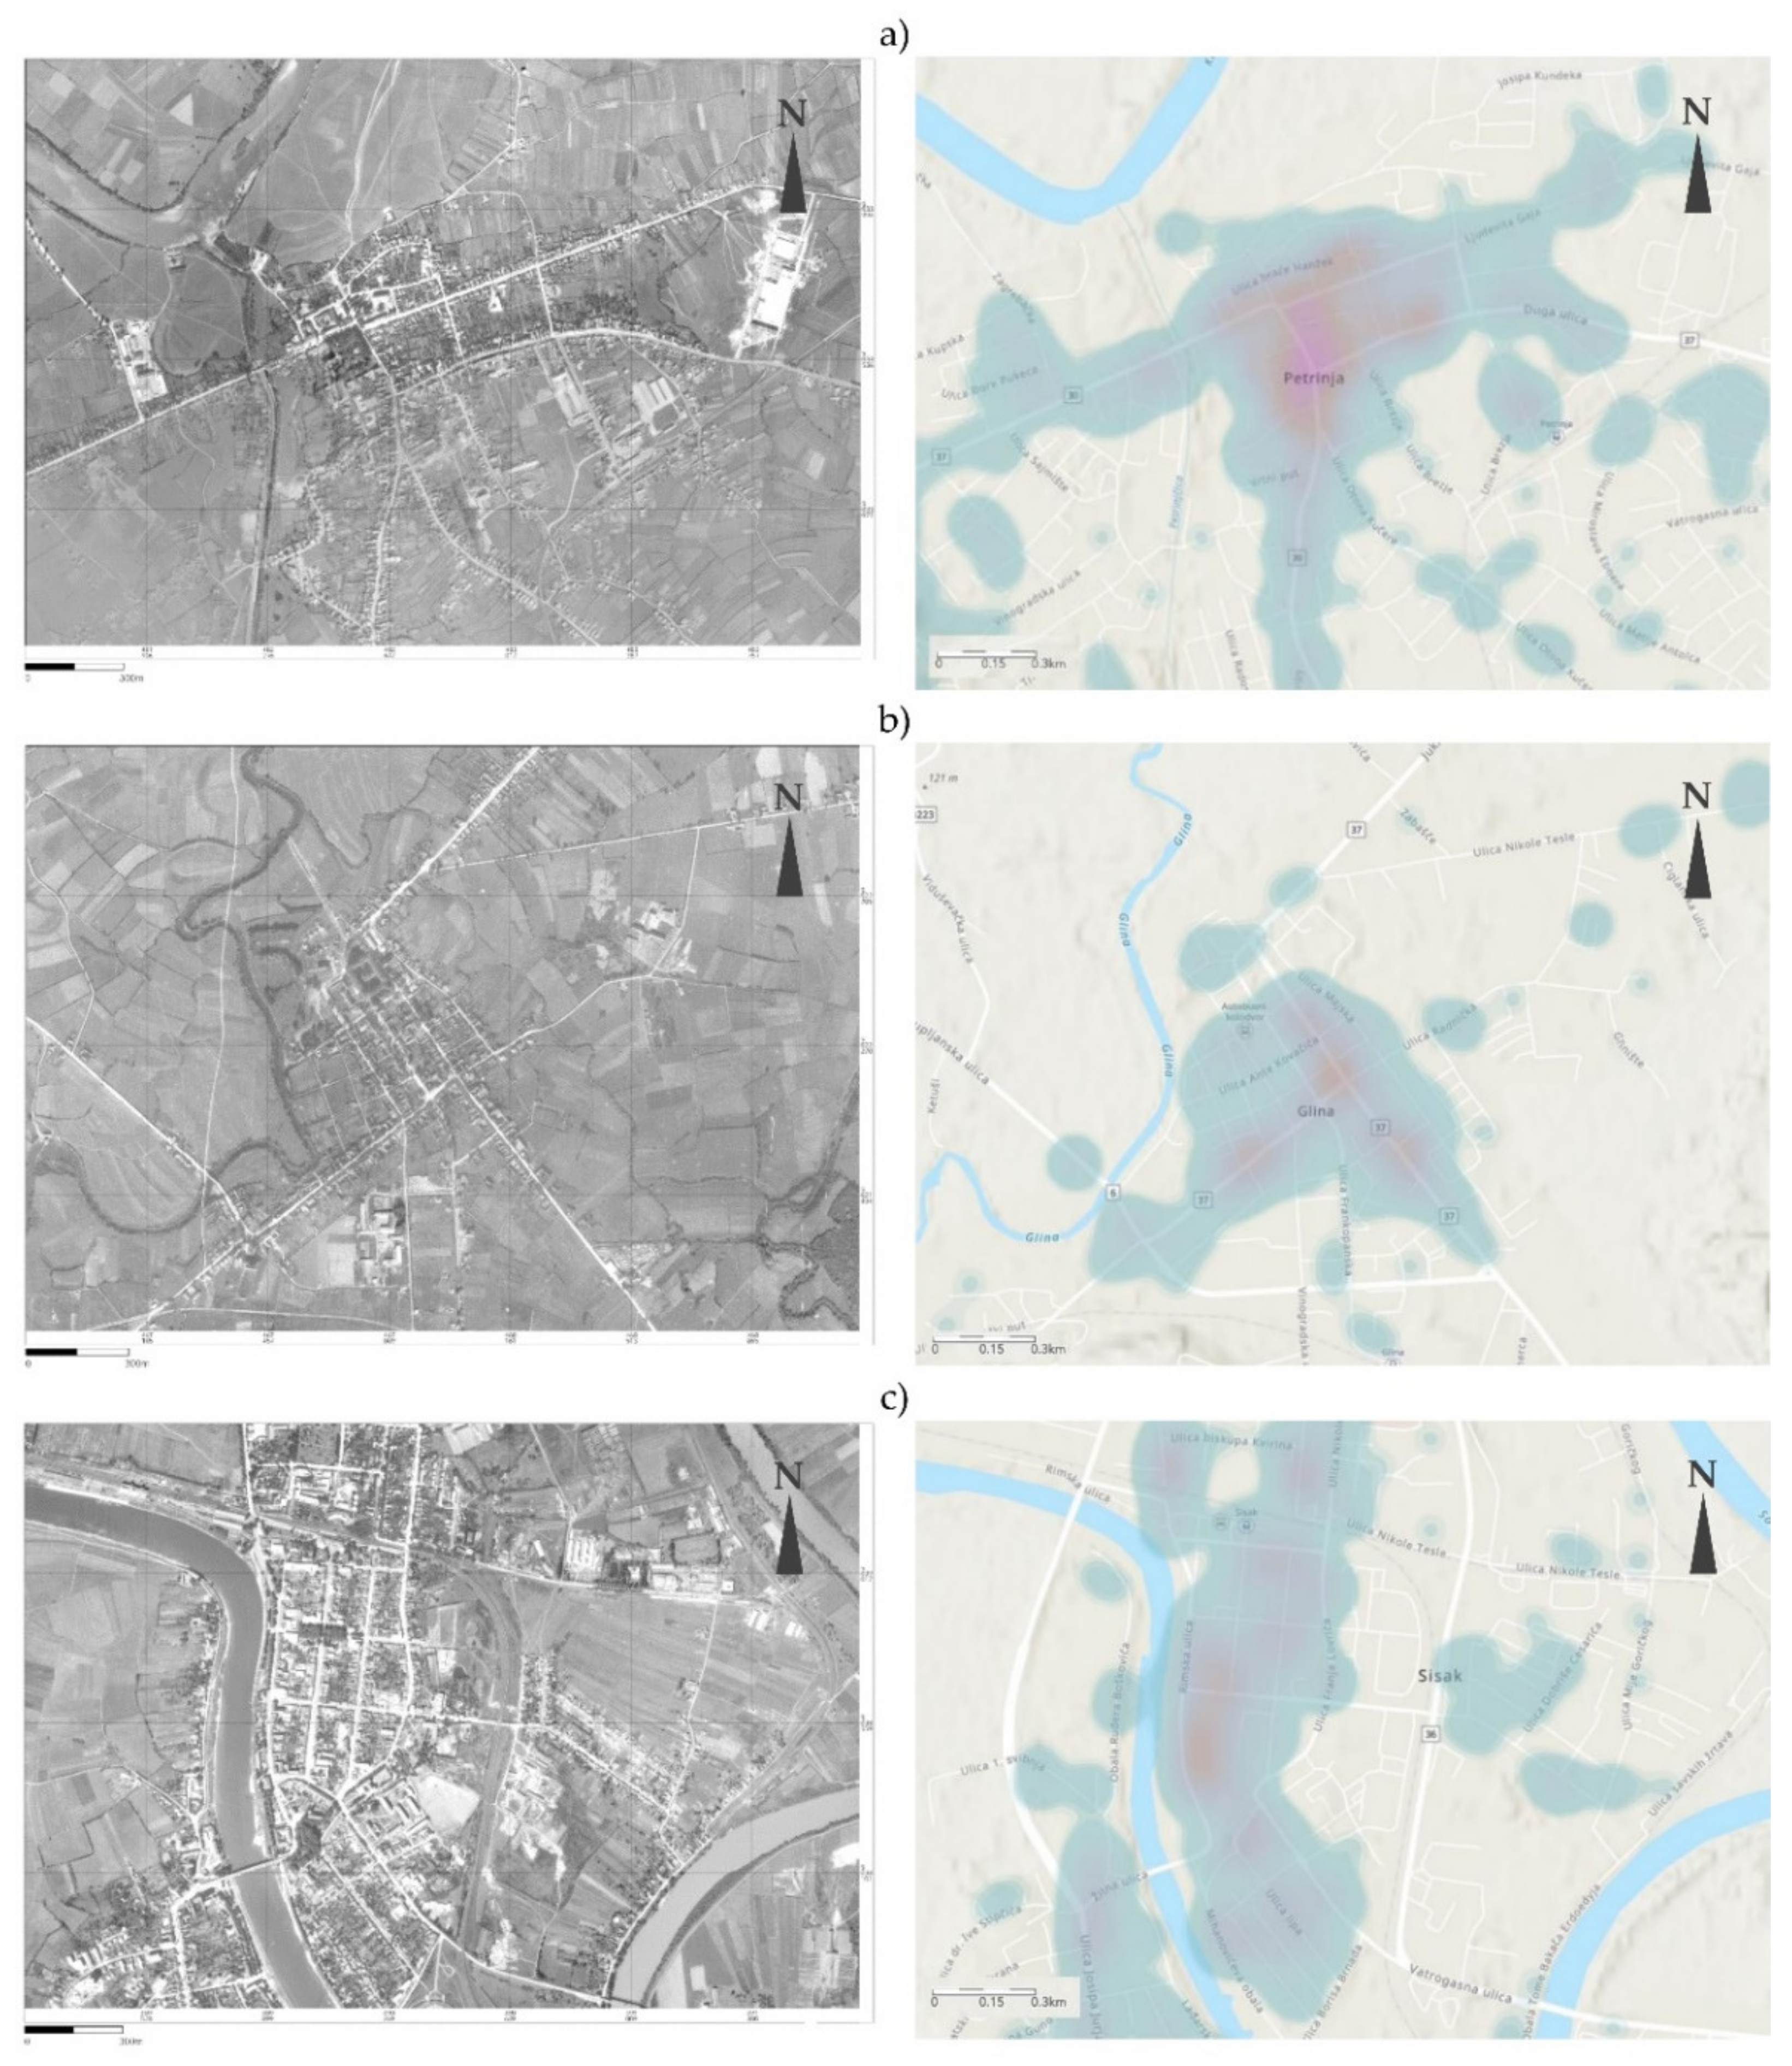
Figure 10a, b and c show aerial photographs of the cities of Petrinja and Sisak and the town of Glina, respectively, from the time period of 1950–1968, which were obtained from [
49]; the photographs show distribution of building damage of Grade 4 (DG 4) and Grade 5 (DG 5) for vulnerability building class B stock in compliance with the EMS-98 scale [
43]. The purpose of the
Figure 10 is qualitative, namely to illustrate the dispersion of damage to the buildings built prior to the Skopje earthquake.
However, unreinforced masonry buildings with RC slabs and horizontal confining elements, which belonged to vulnerability class C in compliance with the EMS-98 scale [
43] and that were built in the building code period from 1965 to 1981 [
37], along with those that were built in the later periods, namely from 1982 to 1998 [
38], also experienced Grade 3 (DG 3) to Grade 5 (DG 5) damage, which was due to workmanship issues. However, the confined masonry buildings that belonged to vulnerability class D in compliance with the EMS-98 scale [
43] and were built in the same building code periods performed significantly better when the damage was reduced to Grade 1 (DG 1) or Grade 2 (DG 2). These observations led to controversy, since residential masonry buildings (houses) were a part of a rebuilding programme that was conducted in 1997 after the Croatian War of Independence (1991–1995). The controversy was related primarily to the assumption of non-enforcement of standards at all stages of the design and construction process and consequently, to complaints that the government rebuilding programme did not satisfy the building code requirements (e.g., vertical confining elements were not inserted into existing buildings or used in the design of new buildings). As evident from the survey, their presence provided a significant degree of protection against the M6.4, which was a VIII (heavily damaging) to IX (destructive) °EMS earthquake event. The regulations of the corresponding time period [
37,
38,
39,
40,
41] allowed for masonry buildings of up to two storeys above ground to be built without vertical confining elements (see
Tables S1 and S2 in the Supplementary Materials).
In addition to the controversy, the building code requirements from 1965 to 1981 [
37], along with those in the later periods, namely from 1982 to 1998 [
38], were related to the seismic intensity maps, according to which Sisak-Moslavina County was in the VII (very strong) to VIII (severe) °MCS intensity areas. In addition, according to the current probabilistic seismic hazard map, wherein a
PGA value of 0.16 g is assigned for that county, the contemporary code provisions EN1998-1:2004 [
34] do not allow unreinforced masonry construction without vertical confining elements for “simple masonry buildings” (see
Tables S1 and S2 in the
Supplementary Materials).
According to further examination of the building code requirements from 1965 to 1981 [
37] and from 1982 to 1998 [
38], the consideration of horizontal confining elements in masonry construction was mandatory. However, vertical confining elements were mandatory only in the case of IX (violent) °MCS intensity designated areas, e.g., the Zagreb area. Even so, masonry buildings were constructed from the start (or with post-war retrofitting) in Sisak-Moslavina County with the implementation of vertical confining elements (at least in the building’s corners), contrary to the building code requirements, which enabled them to successfully endure earthquakes, thereby mitigating other potential structural flaws. The cost of vertical confining element construction is less than 3% of the costs of the whole house (e.g., 150,000 EUR), which is far less than the earthquake damage restoration costs.
The described problems are related to the relationship between the education of construction workers, construction company managers and code enforcement staff and the earthquake performance of structures. Strategies should be implemented to improve the education of, and existing training methods for, construction workers and building inspectors.
The M5 foreshock with a
PGA value of 0.05 g, which occurred at almost the same location on 28 December 2020, caused damage of grades that spanned from Grade 1 (DG 1) to Grade 3 (DG 3) to vulnerability class B building stock, while buildings that belonged to vulnerability classes C, D and E sustained Grade (DG 1) damage or no damage at all. The M5.3 earthquake that struck the capital city of Zagreb and its surroundings on 22 March 2020 [
51] caused Grade 4 (DG 4) to Grade 5 (DG 5) damage to the old city centre three- to five-storey unreinforced masonry buildings, which dated from the Austro–Hungarian monarchy to 1920 (vulnerability class B [
43]). The prevalence of Grade 4 (DG 4) to Grade (DG 5) damage to vulnerability class B buildings was also evident in the aftermath of the M6.4 2019 Durrës, Albania earthquake, which had a
PGA value of 0.19 g [
52]. However, buildings that were built in compliance with contemporary codes such as masonry infilled RC frames (vulnerability classes C and D [
43]) experienced Grade 1 (DG 1) and Grade 2 (DG 2) damage to RC frame structures but not Grade 4 (DG 4) or Grade 5 (DG 5) damage, namely very heavy damage or collapse, respectively, of masonry infill walls (prevailing out-of-plane damage). The M5.3 2020 Zagreb earthquake did not cause damage to RC frames but caused occasional Grade 1 (DG 1) damage, namely negligible to slight damage to masonry infill walls. The M6.2 Petrinja earthquake caused Grade 1 (DG 2) and Grade 2 (DG 2) damage, namely negligible to slight and moderate damage, respectively, to the masonry infill walls. The prevailing failure mechanisms of masonry construction that experienced Grade 4 (DG 4) and Grade 5 (DG 5) damage were diagonal tension cracking and bed-joint sliding in accordance with FEMA306 guidelines [
53]. By comparing them to the period–building relationship of
T = 0.016
H, as presented in [
51], these periods correspond to family houses and 3- to 4-storey (B1) and 4- to 15-storey buildings (C1) in the city of Zagreb and to 1- to 3-storey buildings in Sisak-Moslavina County. Buildings of special or outstanding historical or cultural heritage significance or value, such as St. Nikola church and St Vid’s Roman Catholic parish in the village of Žažina, Lekenik municipality (17 km from Petrinja), which were built in the late 18th century, mostly collapsed or became unserviceable during the earthquake. Without strengthening, very precious historical cultural heritage buildings such as the Cathedral of the Exaltation of the Holy Cross in Sisak sustained very heavy earthquake damage and had to be disfigured (wooden tower roof removal) due to safety threats (see
Figure 11). Buildings that corresponded to importance factors III and IV in compliance with [
34] were damaged as well; namely, the hospital in Sisak suffered very heavy damage to the management and old internal medicine buildings and heavy damage to the new internal medicine building. Public buildings in the old city centre of Petrinja, e.g., an elementary school, were either very heavily damaged or collapsed. As observed for masonry buildings during damage surveying, the collapse of masonry walls that were not protected or designed against out-of-plane actions widely occurred [
54,
55,
56].
As reported by the Ministry of Culture and Media of the Republic of Croatia on 4 January 2021, the earthquake damage to historical masonry buildings (built before the 1920s) was very heavy or completely destructive to approximately 50 sacral buildings and 527 buildings in the old city centre of Petrinja (including cultural heritage assets), while it was heavy to 800 of 1188 buildings in the old city/town centres in Sisak and Glina [
57].
Despite developments, time-varying building code requirements (updates) have not been widely adopted or namely, implemented as practice standards. The enforcement of these requirements could prevent the substantial economic consequences of the loss of many vulnerability B- and C-designated buildings in earthquakes and should be the main motivation behind earthquake risk-mitigation programs. Therefore, the main objective of such programs is social, namely to reduce loss of life and injuries to people, and to save buildings of historical and cultural significance.
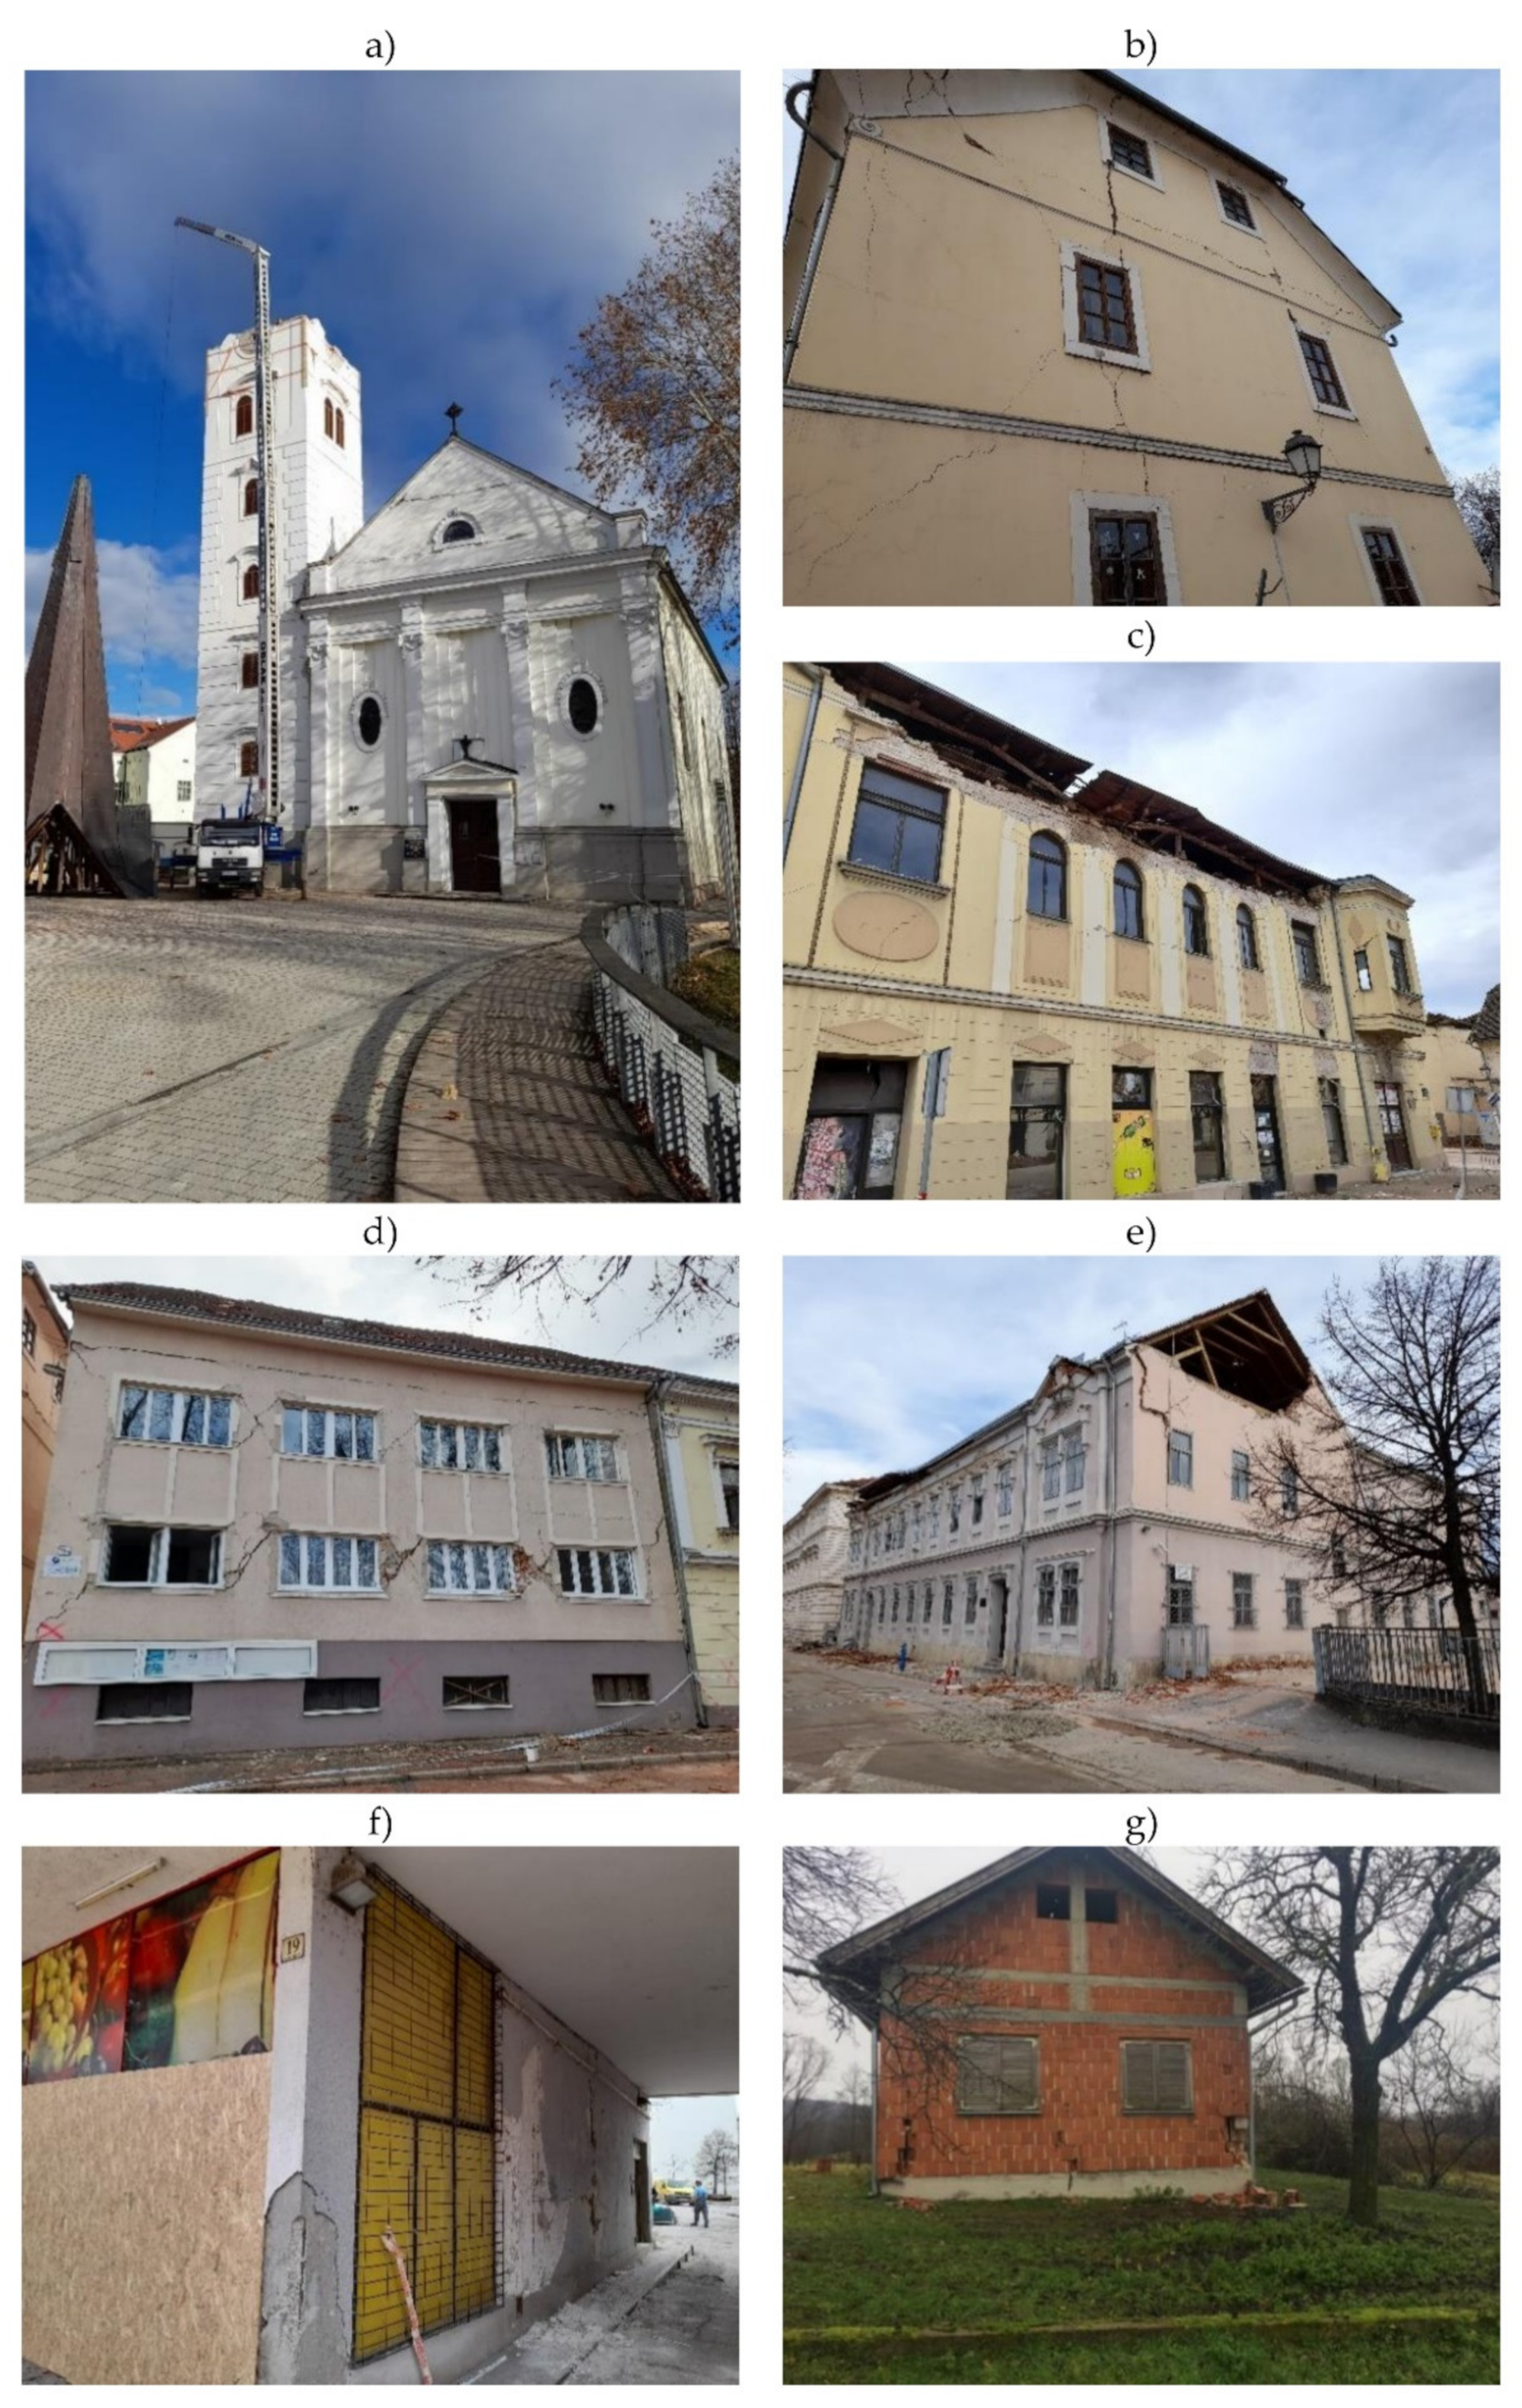
Figure 11.
Damages that were sustained by various building types built in the pre-code era (before 1964) and in various code eras: (
a) The Cathedral of the Exaltation of the Holy Cross in Sisak with the tower roof removed; (
b) Crack distribution in an old masonry building in Petrinja; (
c) Parapet wall collapse in an old masonry building in Petrinja; (
d) Masonry pier diagonal tension cracking; (
e) Gable wall out-of-plane collapse in an elementary school in Petrinja; (
f) Damage to the masonry-infilled RC frame (soft storey collapse); and (
g) Damage to a building that was built without vertical confining elements as part of a rebuilding programme in the post-war era [
58] (author of all photos: D. Penava).
7. Estimation of PGA and Response Spectra of the M6.2 Petrinja 2020 Earthquake
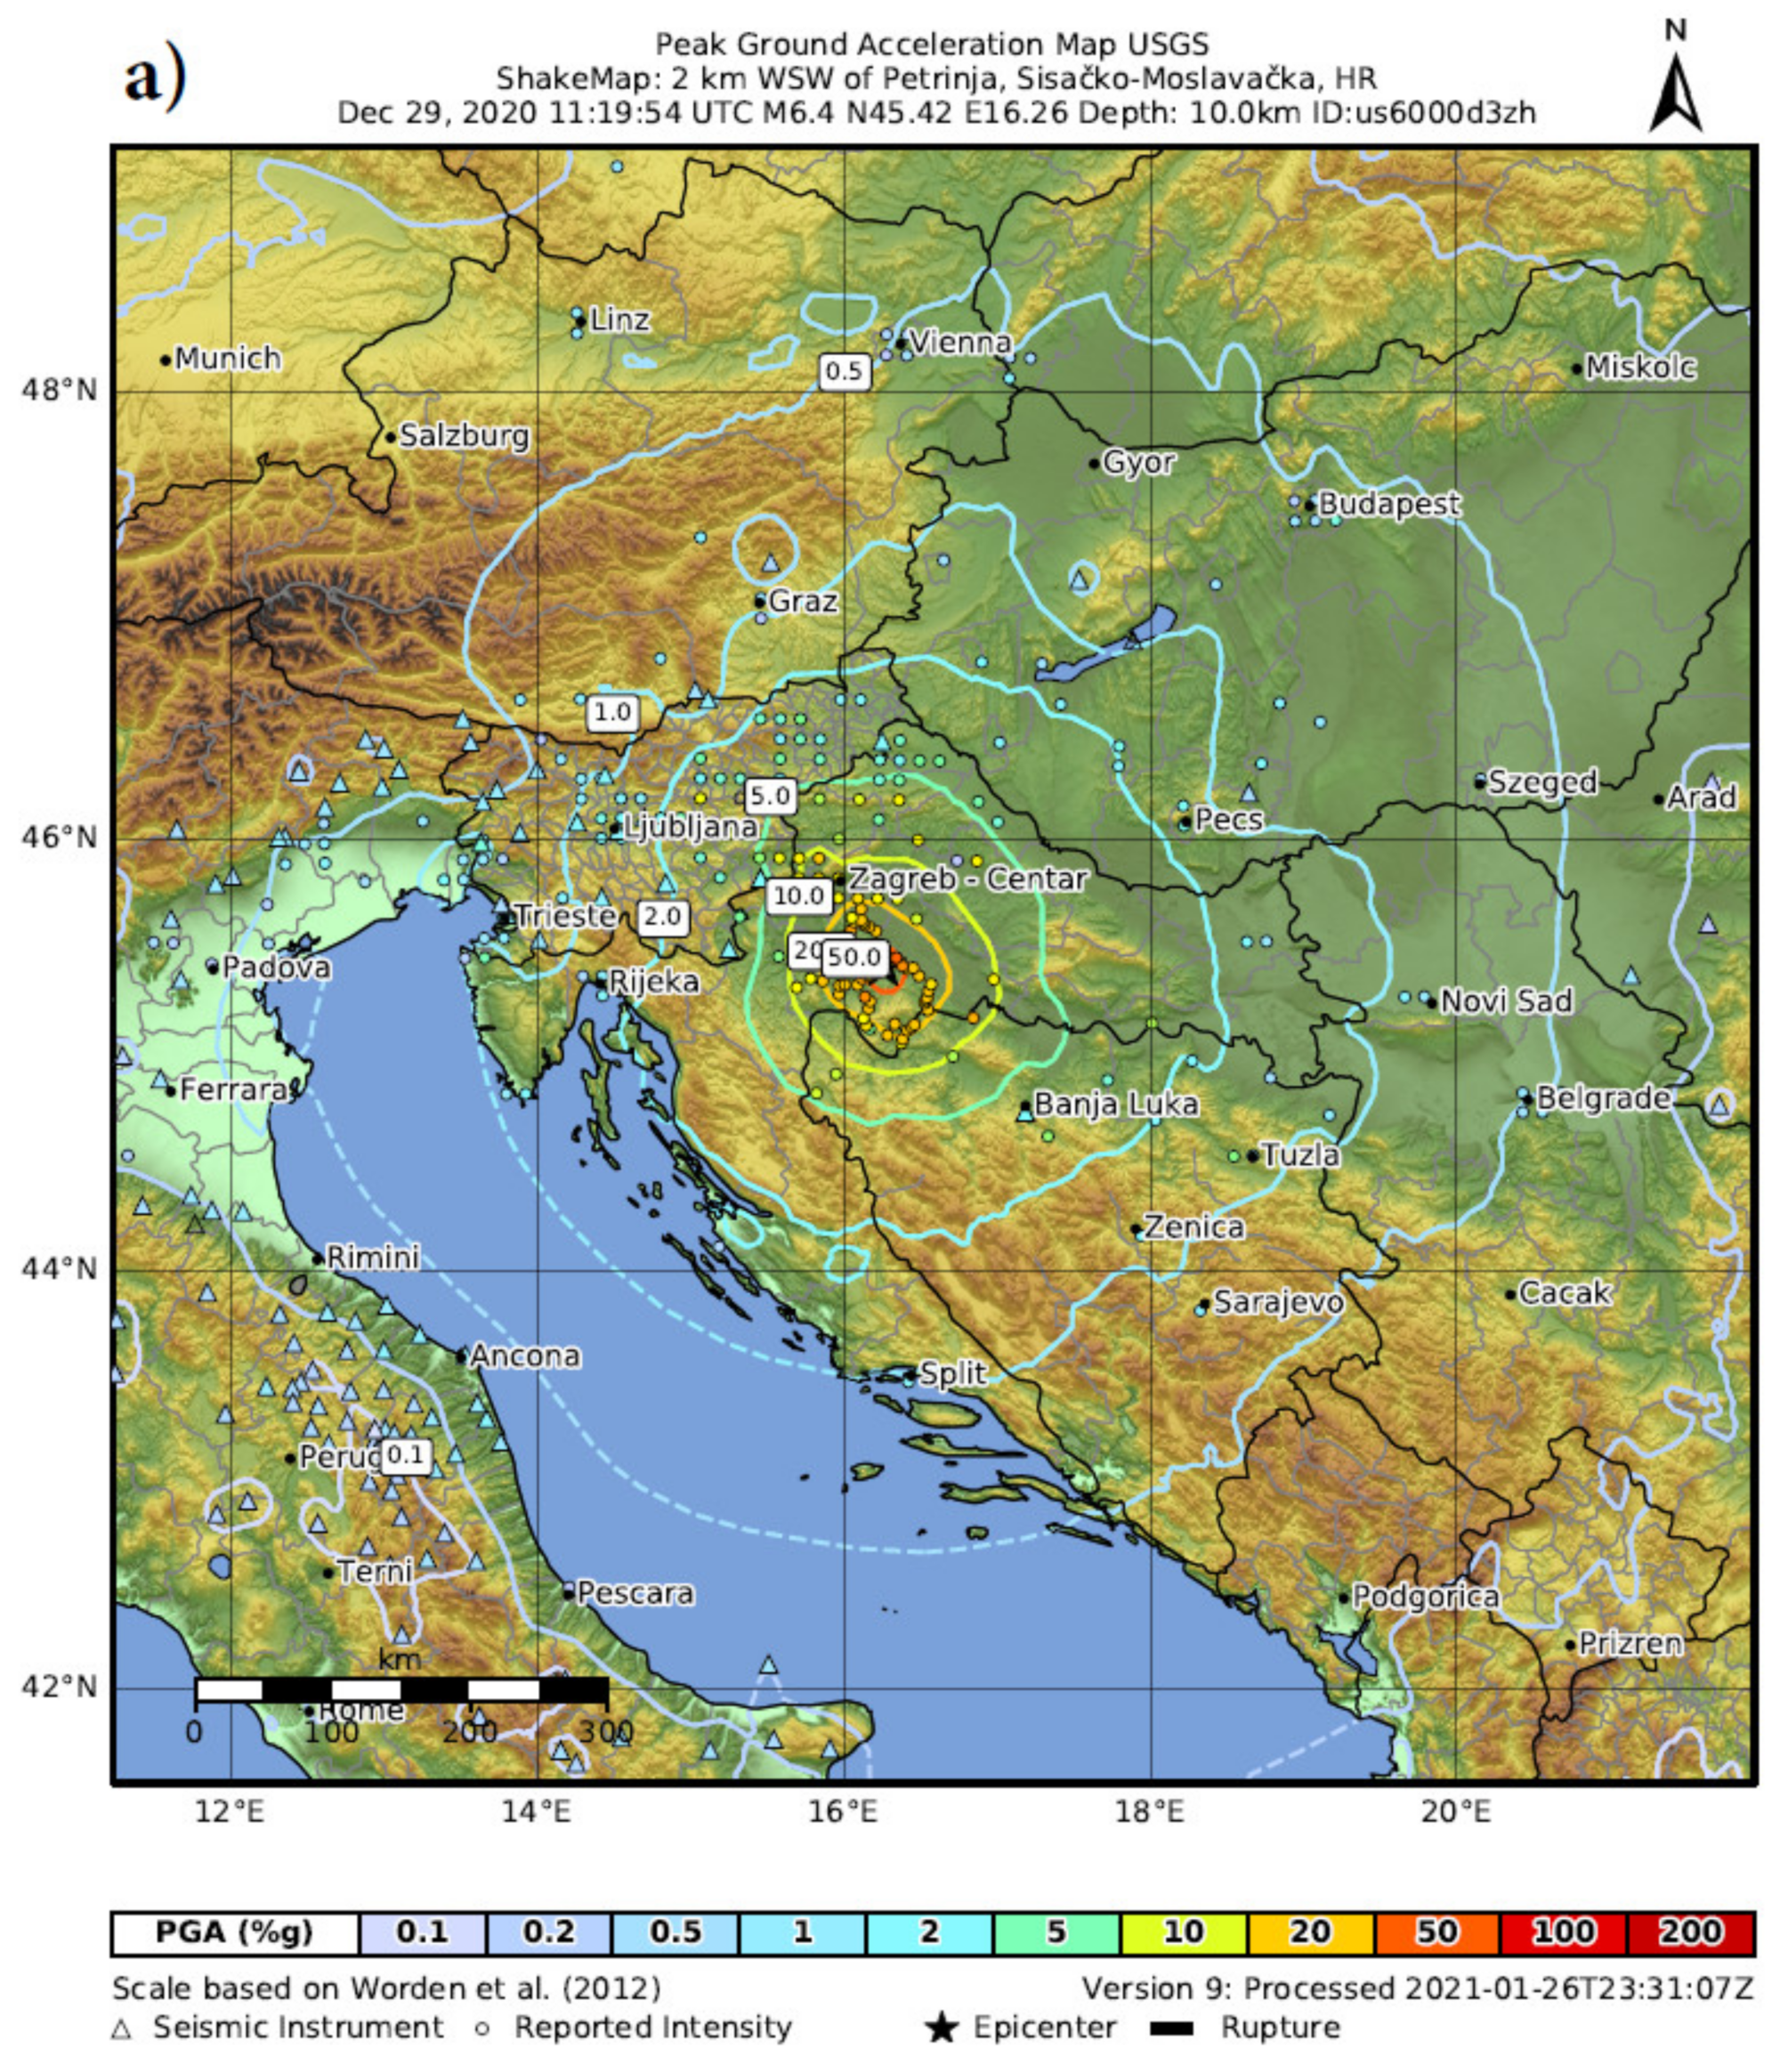
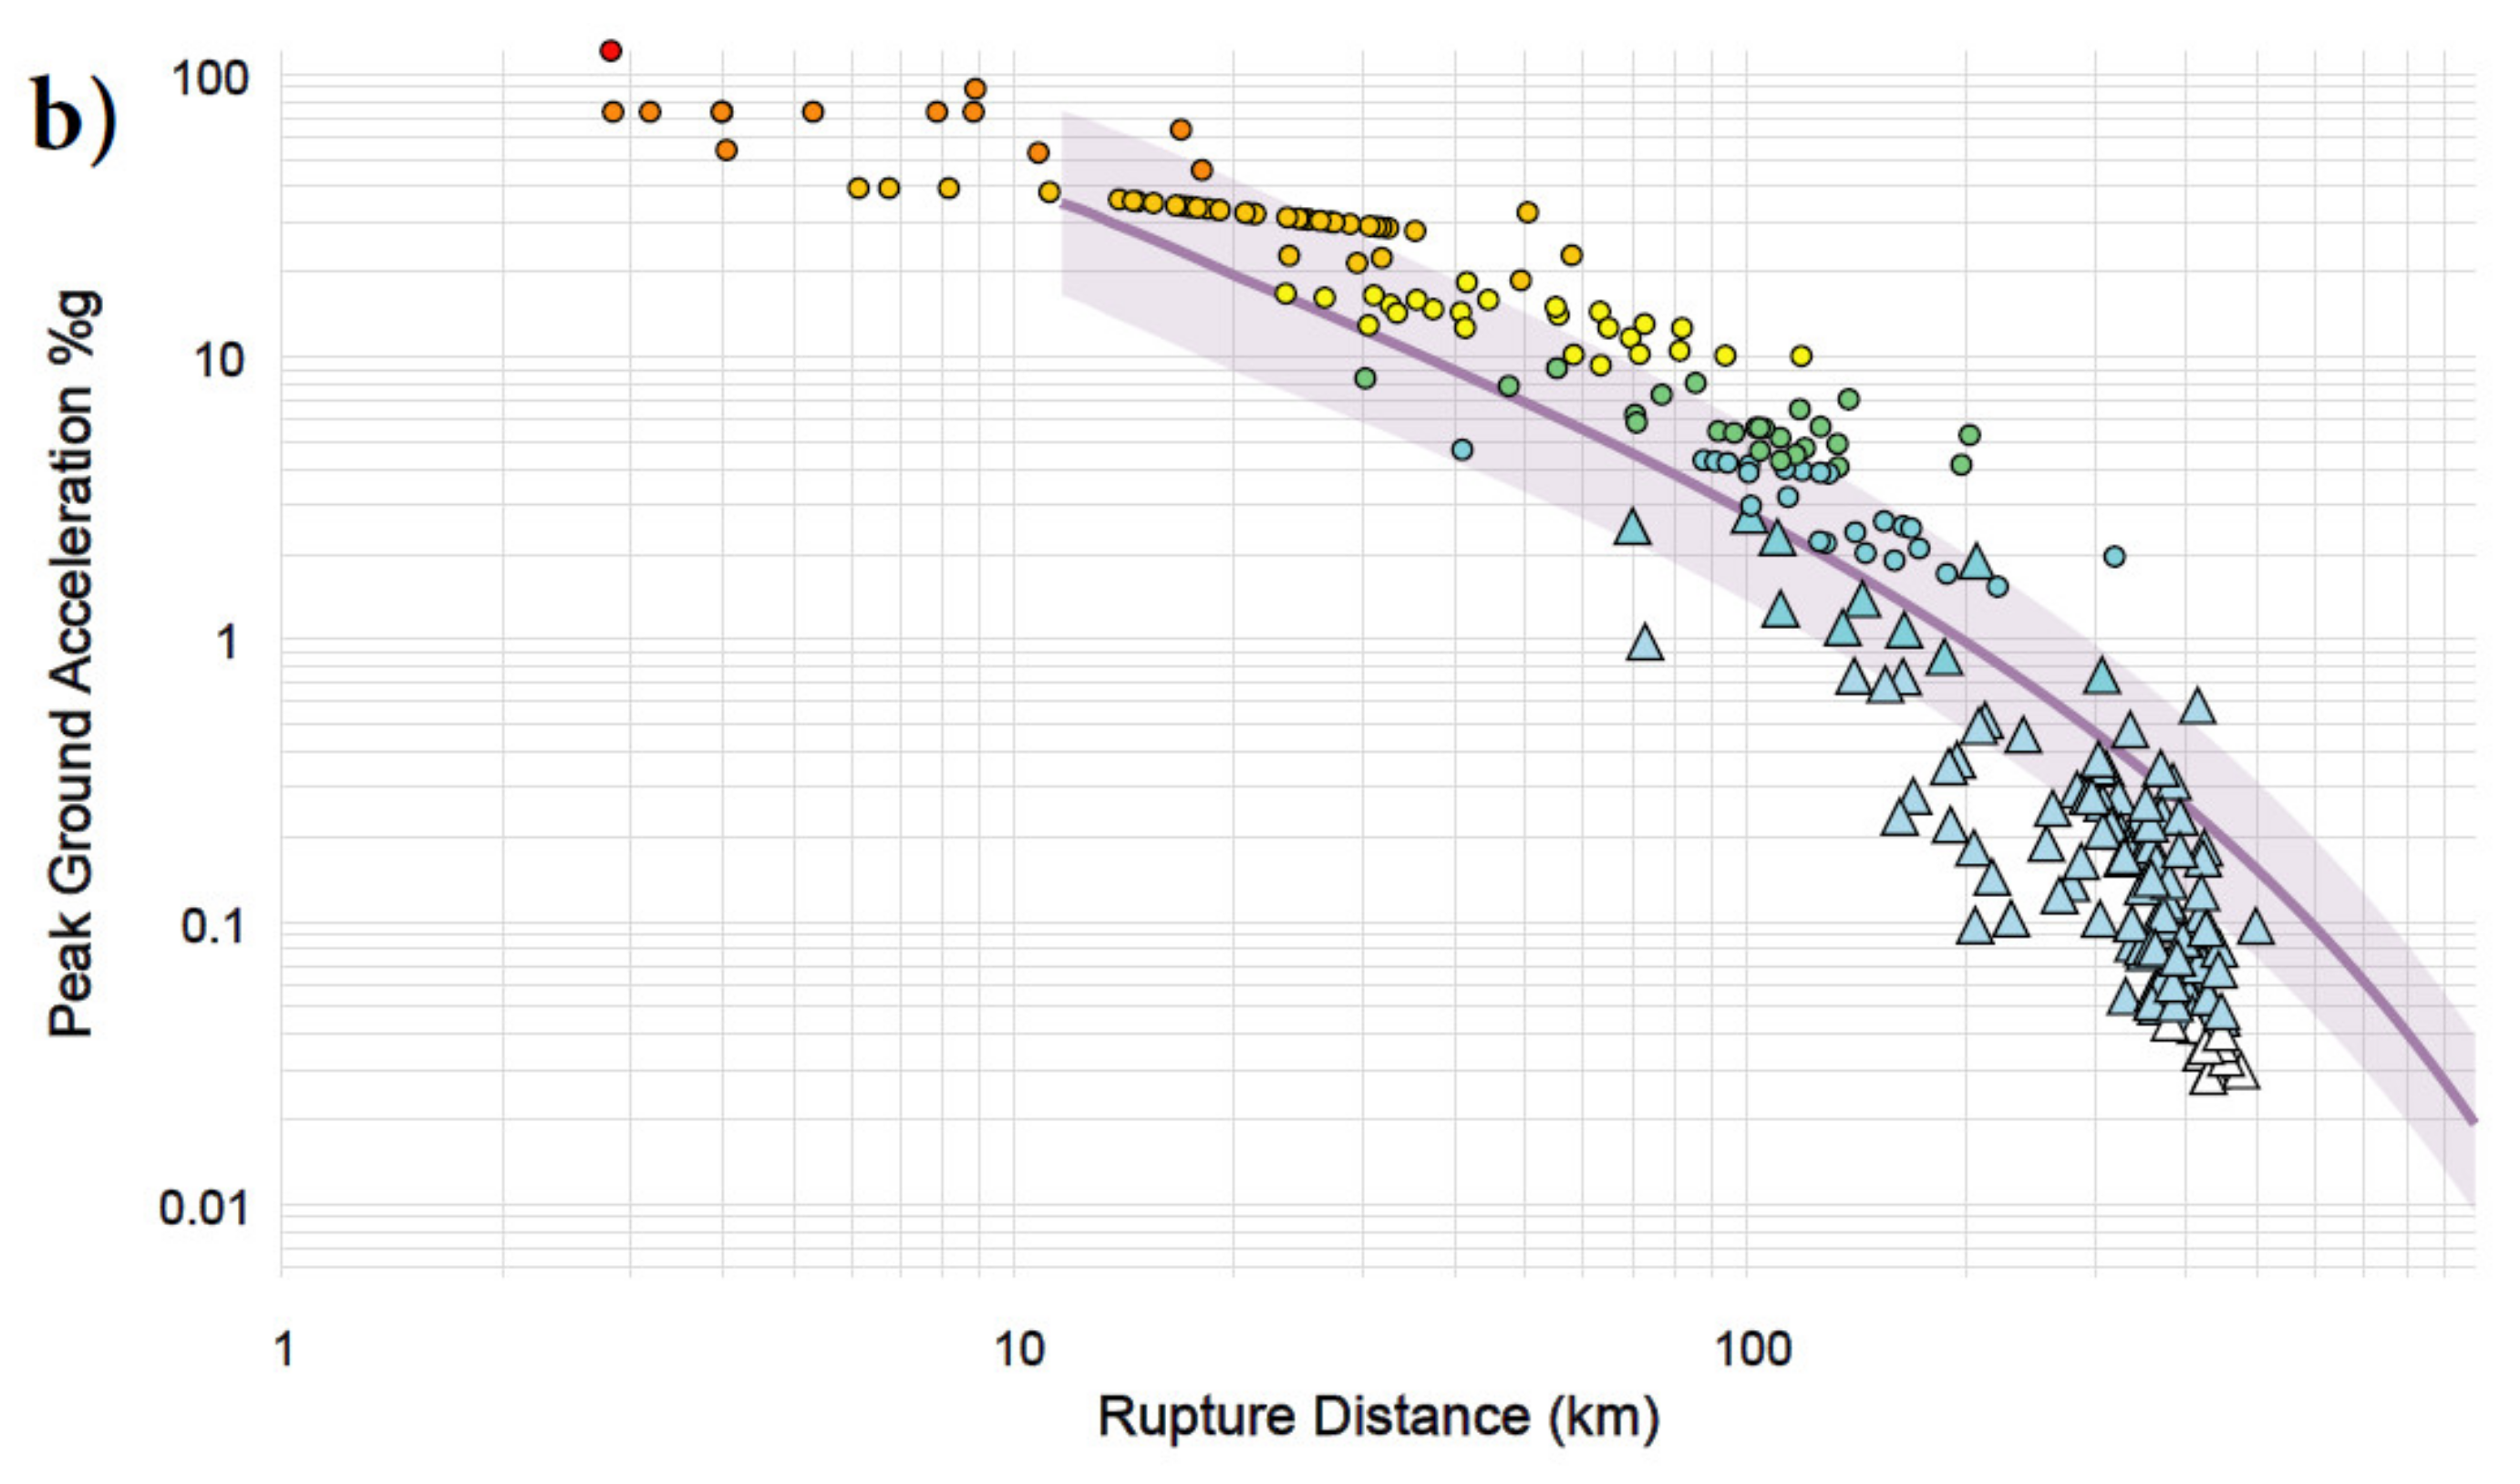
Following the destructive 29 December 2020 M6.2 earthquake near Petrinja, ShakeMap, which was developed by the U.S. Geological Survey (USGS), rapidly mapped earthquake ground motions [
59] and portrayed the distribution and severity of shaking in the area (
Figure 12). The peak ground acceleration was estimated to be approximately 0.5 g in an area approximately 5 km from the epicentre, 0.2 g at distances of 20–30 km and 0.1 g at a distance of 50 km (
Figure 12a). Comparison of predictions and observations of a
PGA scaling with rupture distance were estimated by GMPE Peak Ground Acceleration prediction (
Figure 12b) considering local site effects [
59].
We tested USGS ShakeMap using the attenuation of the peak horizontal acceleration in the Dinarides area relations that were developed by Herak et al. ([
60], HMI01) and Markušić et al. ([
61], MHHI02) to the level of the average rock or very stiff soil sites (
Figure 13a). We also selected three global, empirical ground-motion equations (GMPEs) that might be applicable to this region: (1) the hypocentral distance model of Akkar et al. ([
62], ASB14), which was derived using pan-European datasets and two NGA-WEST 2 models (referred to as NGA14) with weights of 0.5; (2) the model of Boore et al. ([
63], BSSA14) and (3) the model of Chiou and Youngs ([
64], CY14), which was tested by Šalić et al. [
65] for the Western Balkan BSHAP strong motion dataset (
Figure 13b). Additionally, we tested the Bora et al. ([
66], RVT-Bora14) model, which uses random vibration theory (RVT) to predict Fourier amplitude spectra and the duration of ground motion to estimate the response spectra from the RESORCE-2012 strong motion database of the SIGMA project. The same RVT method was used by Skendrović ([
67], RVT-Sk20) on the analogue recordings in the BSHAP strong motion database [
65,
68] and was used in this preliminary analysis, together with the Bora14 model, for comparison (
Figure 13c). Since this is a preliminary analysis and we do not have a full seismotectonic analysis of the fault mechanism, GMPE estimations were made for a strike-slip fault with a 90-degree dip using a point source distance model (
Re =
RJB and
Rhyp =
Rrup), similar to [
65]. For consistency and comparison, all
PGA-distance models in
Figure 13 are scaled to the epicentral distance
Re.
The preliminary analysis showed that for the M6.2 (or M
w6.4) earthquake in the epicentral area (1 km) for the rock site (
VS30 = 800 m/s), the estimated
PGA values from the Croatian attenuation relations are 0.327 g (HMI01) and 0.290 g (MHHI02), those from the GMPE models are 0.317 g (ASB14) and 0.298 g (NGA14), and those from the RVT models are 0.436 g (Bora14) and 0.321 g (Sk20). These values are reasonably comparable with USGS ShakeMap rock predictions in the epicentre [
59], namely 0.3 g. However, in comparison to
Figure 12, site effects significantly influence the amplification of seismic ground motion. According to the Croatian Seismic Hazard Map [
32] for the 95- and 475-year return periods (accepted as a part of the National Annex to Eurocode 8), the Petrinja area is located in a relatively moderate seismic hazard zone: 0.08 g (95 yrp) and 0.16 g (475 yrp) peak ground accelerations. The estimated
PGA values in
Figure 13 for M
w6.4 and for the close epicentral area (up to 10 km) substantially exceed the seismic hazard 95- and 475-yrp values. However, they are comparable with 0.33 g for 1000 yrp. This proves the significance of this earthquake within the known historical seismicity in this area. More important is the question of what type of impact this earthquake will have on future seismic hazard calculations not only for the epicentral area but also for the Zagreb city area, within which over 1 million people live.
Destructive earthquakes that occurred in the last three decades (Nepal, 2015; Christchurch, 2011; Chile, 2010; Sichuan, 2008; Kocaeli, 1999; Kobe, 1995; Northridge, 1994; Loma Prieta, 1989; Mexico City, 1985) proved that the effect of local soil conditions on the earthquake damage distribution was substantial compared to travel path effects and the effects that were induced by the proximity of earthquake sources. The site amplification factor can be estimated using predefined linear and nonlinear site amplification components that have been utilized in ground motion models (GMPEs) for shallow crustal and active tectonic regions (e.g., global NGA-West 1 and West 2 GMPEs, RESORCE models) as functions of the reference rock
PGArock and site
VS30. These models are included in the ASB14, BSSA14 and CY14 models. Bora14 did not include nonlinear amplification and neither did the Sk20 model; hence, their models showed only linear amplification with ln(
VS30) in their formulations. Based on the available
VS30 map [
69] that was derived on a topographic slope ([
70],
Figure 14), close and wider epicentral areas varied between two site categories, namely B (360–800 m/s) and C (180–360 m/s), based on the Eurocode 8 categories. Both Croatian attenuation relations, HMI01 and MHHI02, only derive reference rock
PGA values. In
Figure 15, we compare EC8-Type 1 (the importance factor is 1.0 for ordinary buildings) response spectra for 95, 475 and 1000 year return periods with ASB14 and NGA14 response spectra (5% of the critical damping) and with RVT response spectra from Bora14 and Sk20 for three site categories, namely C (300 m/s), B (500 m/s) and A (800 m/s), at close distances of 1 km, 5 km and 10 km from the epicentre.
From the response spectra comparisons that are shown in
Figure 15, for epicentral distances of close to 5 km, both GMPE spectra are within the 1000 yrp EC8 spectra for A, B and C sites, whereas at a distance of 10 km, the response spectra match the 475 yrp EC8 spectra only for A and B sites. For soft site category C, the GMPE spectra are between 1000 yrp and 475 yrp with a period lengthening (frequency shortening), thereby indicating soil nonlinearity, especially for the periods between 0.1–0.4 s. The RVT-based response spectra show significantly higher spectral accelerations in comparison to the GMPE and EC8 spectra in the mid-to-long period range with similar behaviour within 1000 yrp and 475 yrp. However, for site category C, the EC8 spectra heavily underestimate the RVT spectra. This is the effect of linear amplification (a function of only VS30) in the RVT models compared to nonlinear amplification (a function of
VS30 and
PGArock) in the GMPE models.
The
PGA distance attenuation that is shown in
Figure 13 for rock sites (800 m/s) can be compared with the spectral accelerations at the zero period within various sites (300 m/s, 500 m/s and 800 m/s). The site amplification as a difference between the
PGAsite and
PGArock response spectra shows variation between 1.1–1.3 within the nonlinear GMPE models (ASB14 and NGA14) and between 1.2–1.8 within the linear models (Bora14 and Sk20). Since no accelerograph was available in the close epicentral area, the estimated
PGArock/site values and corresponding spectra cannot be compared with the M6.2 acceleration recordings, which would certainly show various types of nonlinear soil behaviour from traditional high frequency deamplification (period lengthening) to liquefaction [
71].
Sandikkaya et al. [
72] showed that soil nonlinearity and period-dependent amplification site factors were poorly constrained in the current EC8 provisions regardless of variations in reference rock spectral amplitudes. A comparison of EC8 spectra within 95 yrp and 475 yrp with GMPE and RVT response spectra indicates that ordinary buildings that were constructed according to EC8 in the vicinity of the epicentre would likely sustain damage in the shorter period range, especially those that were built by 95 yrp spectra. The EC8 response spectra for 475 yrp would certainly match the estimated response spectra of M
w6.4 that were obtained using higher building importance factors (1.0–2.0). However, this significantly increases the cost of building and construction. For example, the importance factor of 1.25 is used for buildings for which seismic resistance is important in view of the consequences associated with a collapse, and 1.5 is used for buildings for which integrity is of vital importance. The comparison that is presented in
Figure 15 shows the importance of using Eurocode 8 in the seismic protection of buildings when subjected to destructive earthquakes.
8. Discussion
The fault system is a textbook example of a major failure in the upper crust along the pre-existing fault net [
5,
14] at the critical moment of likely centennial release of generally north–south oriented compressional strain that has accumulated in the crust due to continuous northward movement of the Adriatic microplate or Adria [
2]. Up to a few mm/yr, the Adria GPS generally northern velocities that are measured in the Adriatic foreland are generally accommodating along major External Dinarides active faults, since the Internal Dinarides GPS velocities are only 1–2 mm/yr, while the velocities in the Pannonian basin are near zero [
2]. The dextral Pokupsko–Kostajnica–Banja Luka Fault could be one of the main inherited active faults between the crustal segments of Adria, while the sinistral Petrinja Fault could represent a reactivated Mesozoic transform fault that bordered crustal fragments and probably played a significant role in the formation of the Dinarides fold-and-thrust belt [
72]. The Dinarides could be considered as the detached and deformed upper crust in the northern part of once greater Adria [
73], while the transform faults were probably inherited from the Jurassic closure of the ocean that existed north of the Adria. Such transform faults could dissect also the micro-continent margins during the main phases of the orogenesis, and could be still active.
The construction of the PGA and response spectra prediction assessment for the Petrinja M6.2 earthquake depends on judgments of the applicability of local and global ground motion models to the target region [
65]. The HMI01, MHHI02 and Sk20 models reflect the local GMPEs that were developed from regional datasets; hence, they are expected to reflect the regional tectonic characteristics better than other similar models. However, the uncertainties that are introduced by local GMPEs exceed those of global GMPEs because they are based on statistically less stable and more limited datasets. For this reason, we have used candidate NGA14 models BSSA14 and CY14, which were chosen by the BSHAP working group [
65] based on behavioural analyses of the BSHAP strong motion dataset with these approaches. We used the ASB14 most recent empirical GMPE model for point source and extended source crustal earthquake scenarios in Europe to evaluate the convergence with NGA14 models. The Bora14 model was used to evaluate the convergence with the Sk20 preliminary model from the analogue BSHAP strong motion data, which will be significantly updated in the following years with new empirical data [
71].
In the close Petrinja epicentral area, significant ground failures were reported within local site effects: karst sinkholes, visible ruptures at the surface, landslides and liquefaction. Due to these effects, we believe that soil nonlinearity is potentially masked in GMPE models and that the amount of local site amplification was significant and likely more linear within RVT estimations in the close epicentral areas at various micro locations. However, this depends heavily on the knowledge of the upper 10 or 20 m of the soil lithology, which is masked in a single
VS30 value. Based on field observations, geological data and borehole data [
72], clay is dominant in the upper layers. Medium to high plasticity clays exhibit linearly elastic behaviour for large
PGArock values and can be amplified at least twice, whereas soil nonlinearity is certainly most prominent in soft sites with deep deposits of sand and gravel as described by Stanko et al. [
73].
Based on reported ground failures and building damage, the resulting
PGAsite values were likely in the approximate range of 0.4–0.6 g depending on the local site characteristics and distance from the epicentre and are reasonably comparable with USGS ShakeMap soil site predictions at the epicentre and at close distances (
Figure 12). Additionally, this range of
PGAsite can be compared to the value for the Ston-Slano 1996 M6 earthquake: It was recorded as a
PGAsite of 0.64 g at the acceleration station in the Ston saltern, where the total thickness of the sedimentary cover (intermediate to high plasticity clay in the first 15 m) over the bedrock was between 35–50 m. The observed amplification was between 3.8 and 5.0, as reported by Herak et al. [
74], for
PGArock estimates of between 0.128 and 0.170 g at an epicentral distance of 16 km. Therefore, the design value of
PGA of approximately 0.3 g was exceeded in the Petrinja epicentral area, as evidenced by the very heavy damage or collapse of simple unreinforced masonry (regular) buildings.
Since there was no accelerograph close to the epicentral area to register the mainshock, estimated
PGArock/site values and corresponding spectra cannot be compared with the M6.2 Petrinja acceleration recordings, which would certainly show various types of nonlinear soil behaviour ranging from traditional high-frequency deamplification (period lengthening) to liquefaction [
71]. Dobry and Vučetić [
75] showed that high plasticity clays are more flexible than less plastic soils, thereby substantially amplifying ground shaking, as was observed in Mexico City in 1985. Moreover, according to these authors, large amplifications could occur due to the linear strain characteristics of soft clay deposits around the world. Since this study is only preliminary, the sizes of local site amplifications and the induced nonlinearity must be examined with site response modelling from subsurface profiles that will be collected from various geotechnical site characterization investigations in the Petrinja area and in NW Croatia. We must investigate the relationship between the surface lithology in the upper 10 and 20 m and deeper geophysical profiles beyond 30 m depth to investigate site response issues that are related to near-source effects. At larger distances (>20 km) and with
PGA attenuation, the resulting
PGAsite was certainly affected by local site amplification, primarily by the Sava Basin and Hrvatsko Zagorje Basin. This assumption corresponds with the macroseismic intensity map that is shown in
Figure 3 and with the reported damage in NW Croatia at larger distances (>50 km). Thus, future studies of site response modelling and GMPE testing in terms of estimated site amplifications and
PGAs should be compared with recorded strong motions and their response spectra from accelerometric stations. This event, together with its two strong foreshocks and particularly after a new mobile accelerometric network, was installed to capture all aftershock data and produced an impressive amount of data that remain to be analysed. Empirical response spectra from strong motion data in the epicentre vicinity would certainly determine the selection of suitable GMPE candidates.
The assignment of the vulnerability class (or selection of fragility function) has a strong influence on the damage prediction [
76,
77]. A simple (most likely) assignment of the vulnerability class ignoring the subsoil conditions leads to lower damage grades for low intensities and higher damage grades for high intensities in comparison to more engineered approaches. Therefore, realistic and reliable risk scenarios for master plans need a broad database to allocate empirical vulnerability and/or analytical fragility functions for the damage assessment. In any case, the engineer-assigned (most probable) vulnerability or building type-specific fragility function has to consider the uncertainty in building response characteristics and the particularities of local construction practice. Thus, building response measurements from various representatives of similar building types help to provide input parameters for the calibration and verification of reliable structural models and derivation fragility functions considering local construction practice.
Additionally, despite the development of new building regulations, time-varying building code requirements (updates) have not been widely adopted in affected areas, or namely, implemented as practice standards. The enforcement of these requirements could prevent the substantial economic consequences of the loss of many vulnerability B- and C-designated buildings in earthquakes and should be the main motivation behind earthquake risk-mitigation programs. Therefore, the main objective of such programs is social, namely to reduce loss of life and injuries to people and to save buildings of historical and cultural significance.
9. Conclusions
The strongest earthquake of the Petrinja (Croatia) 2020 seismic sequence on 29 December 2020 with a magnitude of 6.2 and an estimated intensity of VIII-IX °EMS, was preceded the day before by a series of earthquakes that began with the M5 foreshock. It was felt throughout Croatia and in the surrounding countries, and it caused substantial damage and numerous ground failures within local site effects.
Based on the shallow focal depth and clear strike-slip focal mechanisms, surface failures were expected after the mainshock. Immediate reports in the media enabled a quick online investigation of surface failures, which showed that linear infrastructure damage occurred along an approximately 30 km long section of the sinistral NE–SW striking Sisak–Petrinja–Glina–Topusko Fault. A quick field inspection showed that fresh fault planes in the bedrock appeared mostly along the longitudinal NW–SE striking (Dinaric strike) Pokupsko–Kostajnica–Banja Luka Fault and showed clear dextral coseismic strike-slip displacements. Simultaneously, an approximately 20 km long section of the Pokupsko Fault was (re)activated. The two subvertical, mutually perpendicular faults intersected near the epicentres. Based on preliminary geological and multiple SAR image analyses, the M6.2 earthquake was the result of the activation of complex fault systems, or the intersection of two main faults (longitudinal and transverse faults) on the strike of the Dinarides (NW–SE). Both faults consist of multiple faults with horizontal block movements (strike-slip). The fault system is a textbook example of major failure in the upper crust along the pre-existing fault net at the critical moment of likely centennial release of generally north–south oriented compressional strain that has accumulated in the crust due to continuous northward movement of the Adriatic microplate (Adria).
The dextral Pokupsko–Banja Luka Fault could be one of the main inherited active faults between the crustal segments of Adria, while the sinistral Petrinja Fault could represent a reactivated Mesozoic transform fault that borders crustal fragments and played a role in the formation of the Dinarides fold-and-thrust belt of once greater Adria.
According to a survey of damage to buildings that was conducted by structural engineers in the field, approximately 15% of buildings sustained DG 4 or DG 5 damage (very heavy damage or destruction), approximately 20% DG 3 and approximately 65% DG 1 to DG 2 (negligible to slight damage or moderate damage). Buildings of special or outstanding historical or cultural heritage significance or value, such as St. Nikola’s church and St. Vid’s Roman Catholic parish in the village of Žažina (17 km from Petrinja), which were built in the late 18th century, mostly collapsed or became unserviceable during the earthquake. According to a preliminary analysis of earthquake ground motion, in the close epicentral area for the rock, the estimated PGA values from selected GMPE relations are 0.29 to 0.33 g, whereas those from RVT models are 0.32 and 0.44 g. These values substantially exceed the PSHA values for 95 and 475 yrp but are comparable with 0.33 g for 1000 yrp, which proves the significance of this earthquake within the known historical seismicity in this area.
Based on all available data, we conclude that the resulting PGAsite values were likely between 0.4 and 0.6 g, depending on the local site characteristics and the distance from the epicentre.
The damage was observed to be more severe for two reasons: (a) underestimated PGAROCK values and (b) unsatisfactory building regulations. Therefore, the necessity of the establishment of a new seismic hazard assessment, analysis/correction of construction regulations and geophysical and geological analysis of the area with the objective of assessing local soil conditions (as the main cause of amplification of input seismic excitation) is evident.


 ,
, 


