Abstract
Using modelling approaches to predict stream flow from ungauged basins requires new model calibration strategies and evaluation methods that are different from the existing ones. Soil moisture information plays an important role in hydrological applications in basins. Increased availability of remote sensing data presents a significant opportunity to obtain the predictive performance of hydrological models (especially in ungauged basins), but there is still a limit to applying remote sensing soil moisture data directly to models. The Soil Moisture Active Passive (SMAP) satellite mission provides global soil moisture data estimated by assimilating remotely sensed brightness temperature to a land surface model. This study investigates the potential of a hydrological model calibrated using only global root zone soil moisture based on satellite observation when attempting to predict stream flow in ungauged basins. This approach’s advantage is that it is particularly useful for stream flow prediction in ungauged basins since it does not require observed stream flow data to calibrate a model. The modelling experiments were carried out on upstream watersheds of two dams in South Korea with high-quality stream flow data. The resulting model outputs when calibrated using soil moisture data without observed stream flow data are particularly impressive when simulating monthly stream flows upstream of the dams, and daily stream flows also showed a satisfactory level of predictive performance. In particular, the model calibrated using soil moisture data for dry years showed better predictive performance than for wet years. The performance of the model calibrated using soil moisture data was significantly improved under low flow conditions compared to the traditional regionalization approach. Additionally, the overall stream flow was also predicted better. In addition, the uncertainty of the model calibrated using soil moisture was not much different from that of the model calibrated using observed stream flow data, and showed more robust outputs when compared to the traditional regionalization approach. These results prove that the application of the global soil moisture product for predicting stream flows in ungauged basins is promising.
1. Introduction
Prediction of stream flows is an essential part of surface hydrology and is often carried out, but is undoubtedly quite difficult. This task is of particular importance in upstream watersheds. Accurate stream flow prediction is essential to manage water and design related infrastructures for human life, agriculture, industry, and the environment as well as ecosystems. Hydrologists around the world have made considerable efforts into developing approaches to predict stream flows in watersheds accurately.
Hydrological modeling approaches have been widely used to estimate stream flow series in watersheds [1]. It is necessary to accurately estimate the parameters of a hydrological model using observed hydrological data to improve the predictive performance of the model for stream flows [2,3,4,5]. Generally, hydrological models have been calibrated using observed stream flow data [2,6,7,8,9,10,11,12]. Although stream flow data are almost the only observation traditionally used to calibrate hydrological models, numerous studies have shown that this approach has limitations when the models are verified at internal points in a watershed, not at an observation point [13,14,15,16,17,18]. This is because stream flows represent an integrated watershed response, providing only limited insight into the overall behavior of the watershed [19,20,21,22,23,24]. Wi et al. [25] and Motavita et al. [26] also noted that special care should be taken in using a calibration approach that uses only stream flow observed at the outlet of the watershed for stream flow predictions under future climate conditions.
Moreover, many of the world’s watersheds remain ungauged, making it difficult to obtain sufficient stream flow data for calibration [27]. The observational data’s limited availability and poor quality degrade the reliability of simulated outputs from hydrological models [28,29]. Therefore, developing new schemes to improve the predictive performance of hydrological models in ungauged basins is a challenge facing the hydrology community preparing for routine hydrological cycle monitoring [30,31]. Stream flow prediction in an ungauged basin has no choice but to use the hydrological modeling approach and it has also been used widely in practice. However, due to the lack of observational information, the calibration for an ungauged basin generally uses information from a basin that is closest to or has the most similar physical and climate characteristics [32]. This approach has been successfully applied to predicting stream flows in data-rich regions [33], but it is hard to predict reliable stream flows in data-sparse regions, where there are few stream flow observations.
Remote sensing data are effectively strengthening existing observations. Since remote sensing data have a surpassing advantage of being available in regions where observational data are scarce [34], the recent increase in the availability of remote sensing data provides a significant opportunity to improve the predictive performance of hydrological models in ungauged basins [35,36]. Over the last few decades, advances in satellites’ remote sensing technology have enabled the use of hydrological data such as precipitation [37,38], soil moisture [39,40], terrestrial water storage [41], evapotranspiration [42,43], etc. Attempts to apply various satellite data to hydrological models have been found in many studies [44,45,46,47,48,49,50,51,52]. In hydrologic modelling, remote sensing data have generally been used in three ways: (1) forcing data for hydrologic models [53,54,55,56,57,58], (2) prior information on specific parameters [21,59], and (3) data for model calibration or data assimilation [45,60,61,62,63,64,65,66,67,68].
Soil moisture is one of the critical state variables in understanding hydrological processes in a watershed [69,70]. Most hydrologic models include soil moisture storage equations for dividing input precipitation into surface runoff and wetting (i.e., soil moisture) and re-dividing the wetting into actual evapotranspiration and percolation [60,71]. Soil moisture is used as a watershed wetting index, an essential initial condition when hydrological models are driven [72,73]. However, there are some limits to using remotely sensed soil moisture data immediately. The observation of soil moisture through satellites is highly sensitive to effects of land cover, vegetation, and topography, and in some parts of North America, Europe, and East Asia, the radio frequency interferences also appear [39]. Noise caused by various external influences amplifies errors in remote sensing soil moisture data, so many studies have been conducted to correct satellite data [74,75,76]. These studies have confirmed that satellite soil moisture data can be improved through field observations. However, the availability of soil moisture monitoring sites on the ground is extremely limited (especially in ungauged basins).
Nevertheless, remote sensing techniques have received much attention from the hydrological community since they provide an opportunity to obtain spatially distributed soil moisture information close to a surface [77]. As recent, remotely sensed observations have been extensively integrated into land surface models to improve the simulation performance of soil moisture in surface or rootzone, the hydrological community is also actively introducing soil moisture information to predict stream flow [36]. One unique feature of the soil moisture product provided by the National Aeronautics and Space Administration’s (NASA) Soil Moisture Active Passive (SMAP) satellite mission is that the observed brightness temperatures are assimilated into a land surface model to provide improved soil moisture product (L4_SM). The L4_SM simulated with a land surface model incorporating SMAP brightness temperatures and information such as land cover, vegetation, topography could provide reduced noise over pure satellite observations. The L4_SM product has already been successfully evaluated for a number of field soil moisture observations [78]. These advantages increase the applicability of satellite data in ungauged basins, which are difficult to calibrate and validate due to the lack of field observation data.
Stream flow prediction studies using soil moisture have put more effort into improving the forecasting performance of river flow by using data assimilation using soil moisture [79,80,81,82,83]. However, relatively few studies utilize remotely sensed soil moisture data for model calibration [29,84,85,86,87,88,89,90]. In particular, there are not many studies that have performed calibrations of hydrological models using only soil moisture data to predict stream flow in ungauged basins. According to our literature investigation, there were case studies that used satellite-sensed surface temperature data [91], NDVI data [92], water level data [93], and actual evapotranspiration data [32] to calibrate a model for ungauged basins. A number of studies have investigated the degree of improvement in the performance of stream flow prediction by calibrating hydrological models using soil moisture with observed stream flow data [88,94,95] or with other types of remotely sensed data [87,89,90]. It should be noted that the studies mentioned above all shared the same conclusion that including remote sensing data in model calibration and validation improves the overall performance of the model. In other words, soil moisture data based on satellite observations is highly likely to advance the stream flow predictive performance of hydrological models [96,97].
In summary, a global soil moisture product based on remotely sensed data can provide spatially distributed soil moisture information. However, using only soil moisture data for model calibration in specific internal locations of a basin, or in ungauged basins has not been fully investigated. This is the main question examined in this study. Our assumption is that the accuracy of hydrological models for simulating soil moisture is the key to simulating stream flow and actual evapotranspiration within the hydrological cycle. Therefore, we start from a hypothesis that it is possible to satisfactorily simulate stream flows via model calibration against soil moisture. To this end, this study attempts to use the SMAP L4_SM data to calibrate a hydrological model, and then simulates the stream flow time series using the optimized parameters. We investigate how reliably daily and monthly stream flow series can be simulated by calibrating a hydrological model using soil moisture data solely. To test a new benefit of using the global root zone soil moisture (GRZSM) data to simulate stream flow in ungauged basins, various calibration schemes using remotely sensed soil moisture and empirically obtained data are applied to a lumped parsimonious hydrological partitioning model and compared with the traditional calibration scheme using only stream flow and regionalization scheme.
2. Model
2.1. Lumped Parsimonious Hydrological Partitioning Model
In this study, a lumped hydrological model based on soil moisture simulations proposed by Lee et al. [31] and Choi et al. [98], the Lumped Parsimonious Hydrological Partitioning Model (L-PHPM), was used. The L-PHPM focuses on vertical, one-dimensional soil moisture balance processes in which precipitation falling on a surface of a natural watershed is divided into forms of wetting, surface flow, evapotranspiration, and percolation through hydrological processes. Borrowing the concept of the Tank model proposed by Sugawara [99], a watershed consists of the surface layer, soil layer, and aquifer layer (see Figure S1 in Supplementary Material). Watershed characteristics for model driving are spatially averaged Curve Number (CN), impermeable area ratio, and saturated hydraulic conductivity. All of these characteristics can be estimated from soil maps and land cover maps. Various hydrologic elements such as daily stream flow, actual evapotranspiration, and soil moisture are simulated using spatially averaged daily precipitation and reference evapotranspiration data.
The surface layer is divided into impervious and pervious areas, based on the surface layer composition of the Environmental Protection Agency’s Storm Water Management Model (EPA-SWMM). Surface storage depths that should be filled before surface flows occur are applied to each area. In the surface layer of the impervious area, the evapotranspiration process ( in Figure S1) is carried out to satisfy the reference crop evapotranspiration, , and the surface flow ( in Figure S1) occurs when the precipitation exceeding the surface storage depth, , enters. In the surface layer of the pervious area, the evapotranspiration process is carried out ( in Figure S1), and the precipitation exceeding the surface storage depth, , is sent into the soil layer ( in Figure S1).
Similar to the EPA-SWMM, a process in which precipitation exceeding the surface storage depth is divided into surface flow and wetting in the soil layer is implemented as follows:
where is the normalized soil moisture with a value from 0 to 1, and is the maximum effective soil depth (mm). If a concept of the Natural Resources Conservation Service runoff curve number (NRCS-CN) method [100] is applied, can be estimated from CN where the Antecedent soil Moisture Condition (AMC) is the driest (i.e., AMC-I).
The evapotranspiration in the soil layer, , is implemented as follows:
where is minus . The is a parameter that controls the evapotranspiration.
The percolation from the soil layer to the aquifer layer is calculated as follows:
where is the saturated hydraulic conductivity (mm/day), and is a parameter that controls the percolation.
Similar to the subsurface flow process of the SWAT model, the ground water table, (mm), and subsurface flow, (mm/day), in the aquifer layer are simulated as follows [101,102]:
where is a parameter that controls the subsurface flow. The is the specific yield of the aquifer (m/m) and is assumed to be 0.003, the default value presented in SWAT [103,104]. The stream flow generated at a watershed consists of from the impervious area, from the pervious area, and .
The L-PHPM requires calibration for seven parameters (, , CN, , , , and ) (see Table 1). Here, CN and are calibrated by applying correction factors ( and ) based on spatially averaged values ( and ) extracted from the geographic information system (GIS) data as follows:

Table 1.
Calibration parameters in hydrological model.
2.2. Study Watersheds
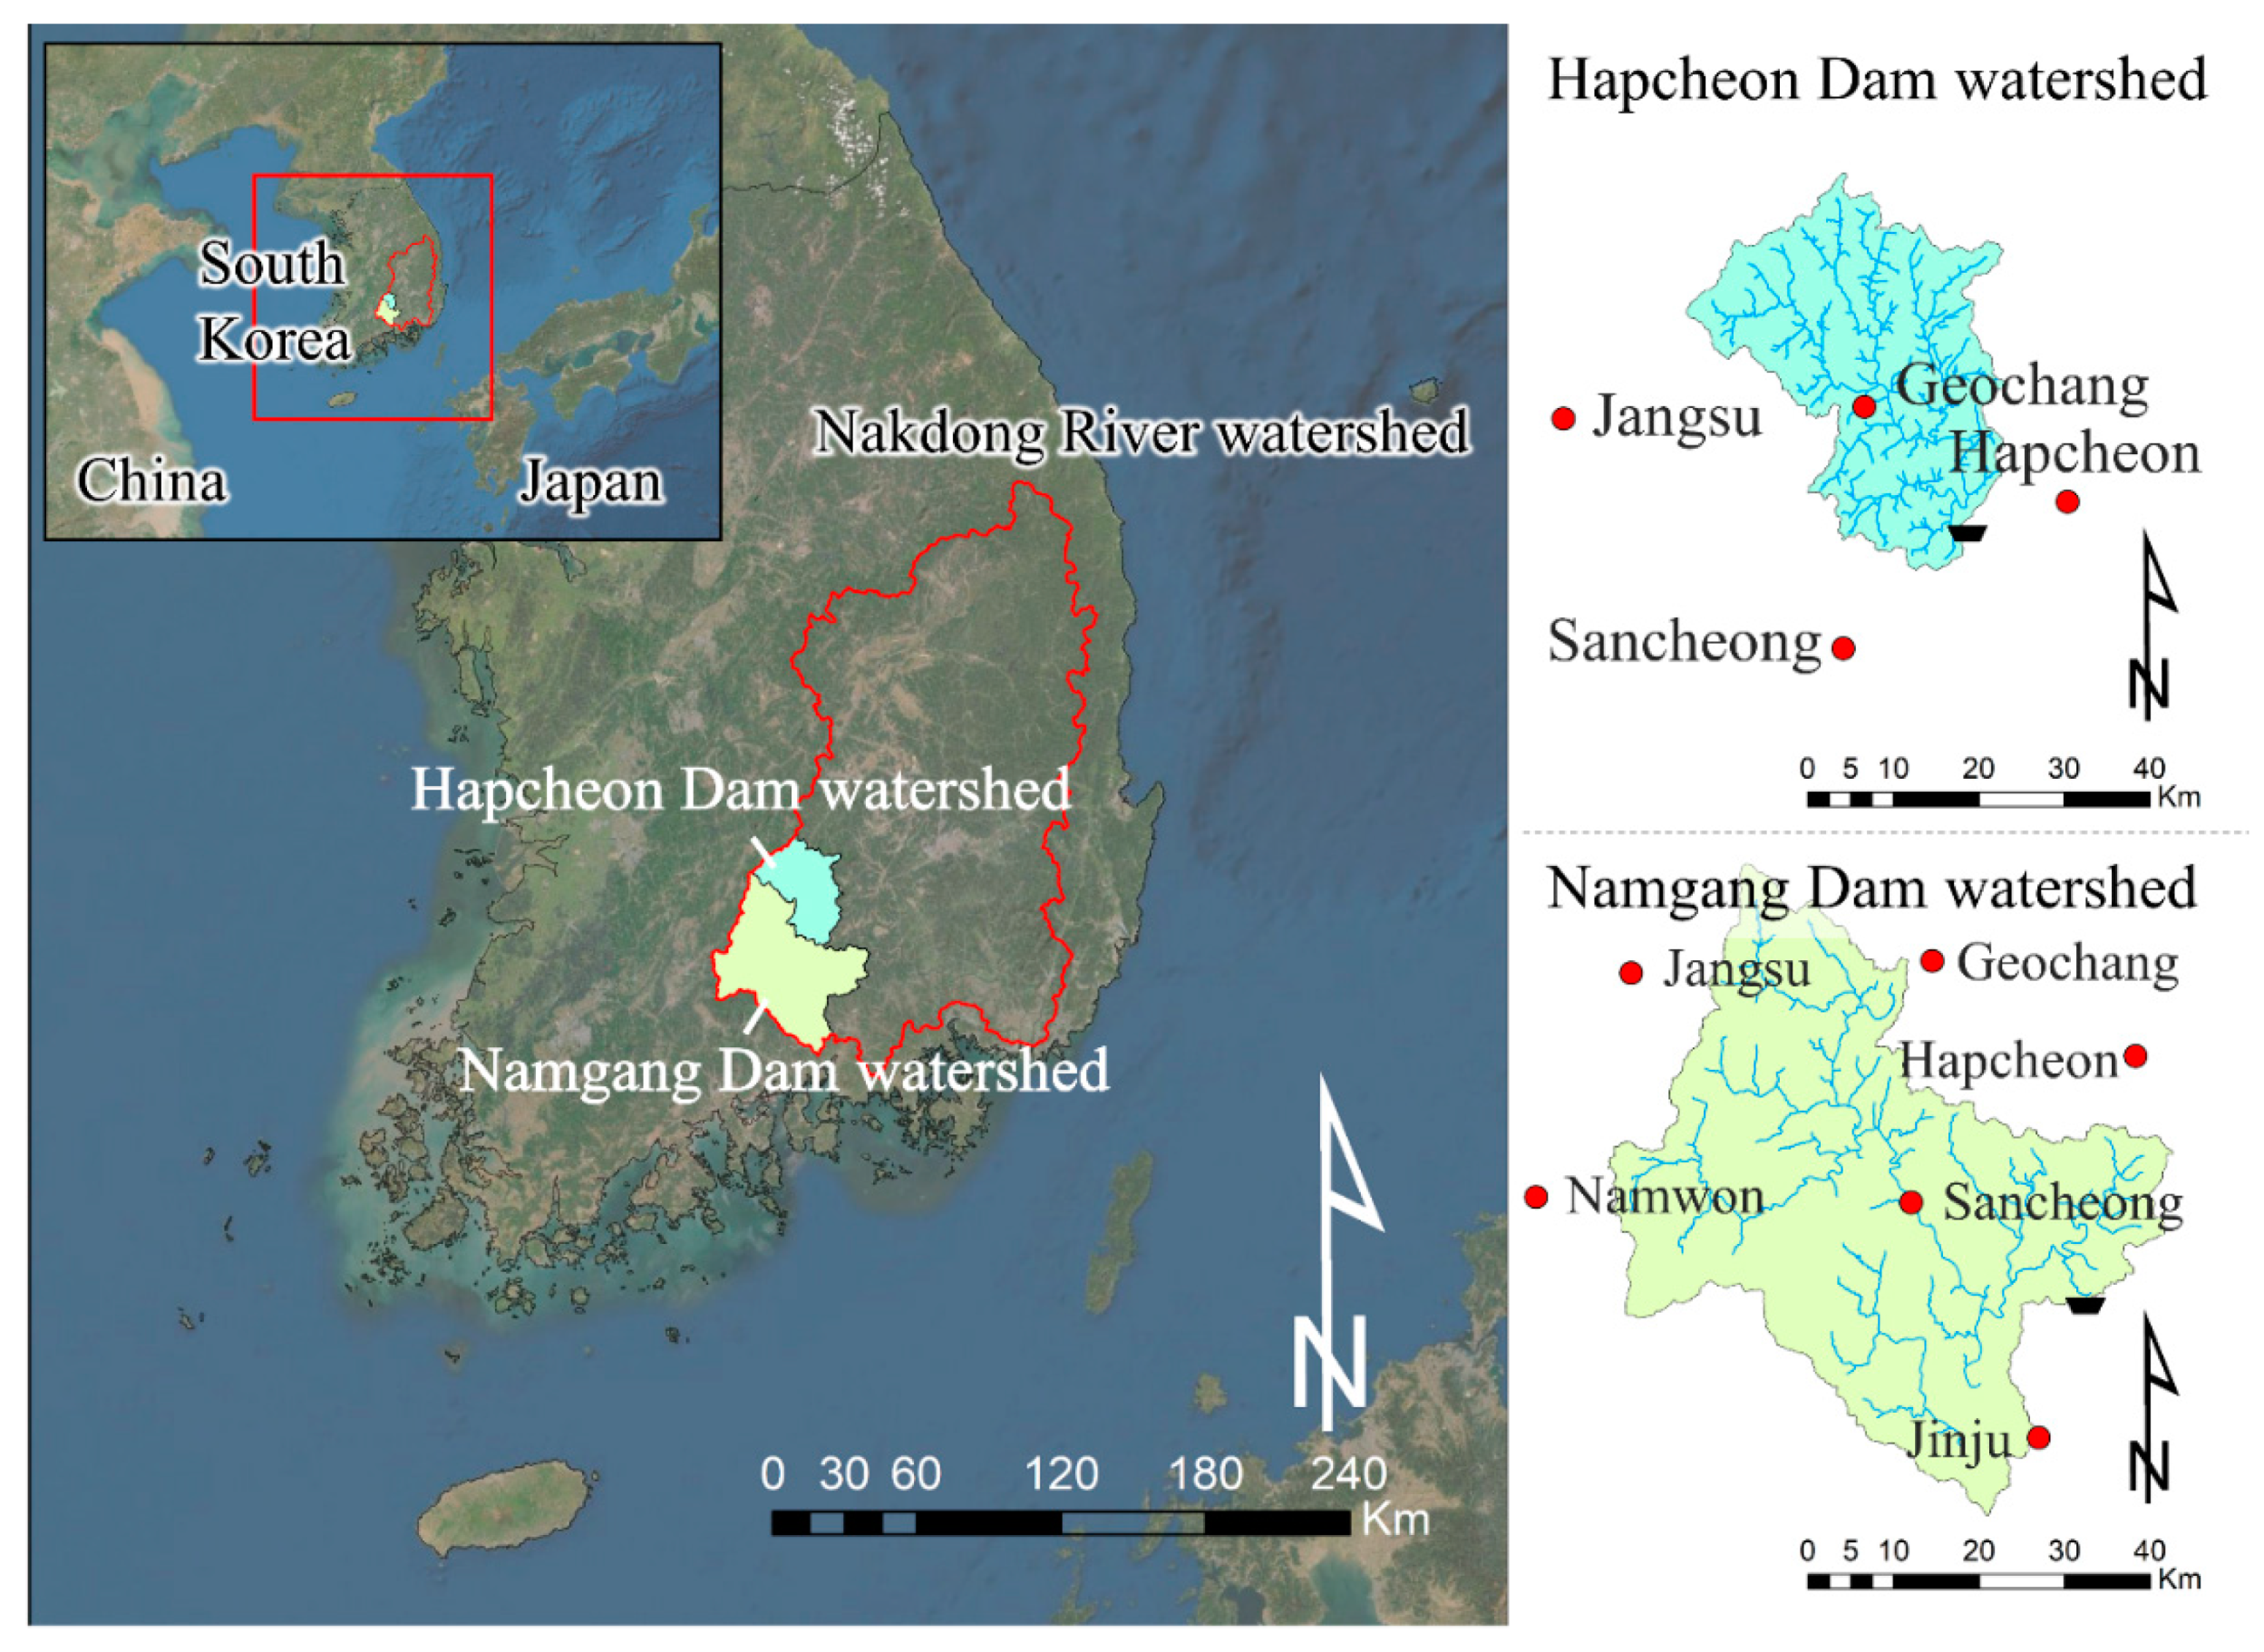
To compare outputs of the model calibrated by various calibration schemes including the exclusive use of the GRZSM, two watersheds with available observed stream flow data were assumed to be ungauged basins. As shown in Figure 1, the Hapcheon Dam (hereafter, HCD) watershed and Namgang Dam (hereafter, NGD) watershed, which belong to the Nakdong River watershed located in the southeastern part of the Korean Peninsula, have multi-purpose dams located at the ends of the basin. The daily dam inflow time series observed in each dam was regarded as the stream flow data observed in each watershed. In addition, various meteorological data, including precipitation, were collected from meteorological observation sites (circles in Figure 1). The spatially averaged daily meteorological input data (precipitation and ) were then obtained using the Thiessen method from the collected meteorological data. was estimated using the Penman–Monteith method. Table 2 shows the basic hydrological characteristics in the HCD and NGD watersheds.
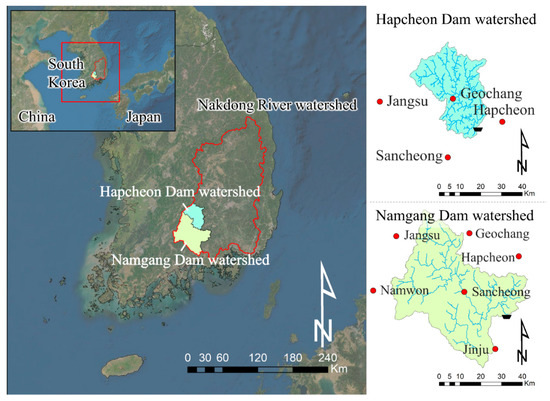
Figure 1.
Study watershed and location of meteorological observation sites. The red circular symbols and black trapezoid symbol indicate the location of meteorological observation sites and dam for each watershed, respectively.

Table 2.
Information of study watersheds.
The spatially averaged CN, saturated hydraulic conductivity (), and impervious surface ratio () of each watershed were obtained from GIS information (see Table 2). The average values of CN were extracted from the soil and land-use maps provided by the Korea Rural Development Administration [105] and the Korea Ministry of Environment [106], respectively. The average value of each watershed suitable for the NRCS hydrological soil group was estimated from the soil map, and the average value of each watershed was calculated using the land-use-specific impervious surface ratio presented by NIER [107] and U.S.EPA [108] based on the land-use map (Tables S1 and S2 in Supplementary material).
3. Calibration Data Sets
3.1. Daily Normalized Soil Moisture Time Series
NASA launched the SMAP satellite in 2015 and has since provided soil moisture products. Among the satellite’s products, the SMAP Level 4 Global 3-hour 9-km EASE-Grid Surface and Root zone Soil Moisture product (L4_SM) [109] contains global soil moisture data simulated by assimilating SMAP L-band brightness temperature observations in the NASA Catchment land surface model. One of the advantages of the L4_SM product is the fact that it provides normalized soil moisture of not only the surface layer (to 50 mm) but also in the root zone layer (to 1000 mm). Since the L-PHPM simulates soil moisture changes in the soil layer below the surface layer, the root zone data (i.e., the GRZSM data), which provides a relatively deep range of soil moisture, was used. However, since the maximum effective soil depth, , calculated from CN is used as the soil layer’s depth of the L-PHPM, there is a physical difference in the depths of the soil layer of the model and the root zone layer of the L4_SM product. Thus, it should be noted that the analysis results include errors due to these physical differences.
In addition to the errors arising from the difference in the depth of the soil layers, there are inherent errors in the data, so a bias-correction is required in advance to use the GRZSM data to calibrate a hydrological model. The bias-correction of the GRZSM data is ideally performed using soil moisture data observed on the ground, but soil moisture observed at a particular site cannot be considered to represent the spatially averaged characteristics of a basin, and the number of observation sites has also been limited.
Furthermore, since this study assumes that the study watersheds are ungauged, the bias of the GRZSM data was corrected based on the ideas of regionalization approach, commonly used to predict stream flow in an ungauged basin, that uses information from a gauged watershed (i.e., donor watershed). In general, the donor watershed is selected from among the watersheds that are closest to or have the most similar physical and climate characteristics [32]. This is why the geographically adjacent HCD and NGD watersheds, were chosen as the study watersheds in this study. Therefore, when performing the bias correction of GRZSM data for the HCD watershed, the NGD watershed is assumed to be the donor watershed, and the bias correction for the GRZSM for the NGD watershed is the opposite.
That is, to correct the bias of the spatially averaged GRZSM time series () for the HCD watershed (assumed as the ungauged basin), the parameters of the L-PHPM in the NGD watershed were first calibrated using stream flow data observed at the outlet of NGD watershed (selected as the nearby donor watershed). The parameters were fitted for the observed stream flow data by the Markov Chain Monte Carlo (MCMC) method using the Metropolis–Hastings algorithm. The relationship between soil moisture time series simulated using the optimized parameters () and the spatially averaged GRZSM time series in the NGD watershed () could be expressed stochastically using the quantile-mapping technique. The probabilistic relationship between the two data can be applied for the bias-correction of the as follows:
where is the cumulative probability distribution of , and is the inverse cumulative probability distribution of . The is the bias-corrected GRZSM data of the HCD watershed.
Conversely, the GRZSM time series for the NGD watershed (i.e., ) can be bias-corrected using the GRZSM time series simulated in the HCD watershed in the same way. Figure S2a shows the raw GRZSM data for the HCD and NGD watersheds and the soil moisture data simulated from the hydrological model calibrated using observed stream flow data in the NGD watershed. Since there are clear scale differences between the GRZSM data extracted from SMAP L4_SM and soil moisture data simulated by the model, it is not appropriate to use the raw GRZSM data directly for calibration of hydrological models without bias correction. Figure S2b shows the cumulative probability distributions of the raw GRZSM data and the GRZSM data bias-corrected by quantile-mapping. It can be recognized that a series of bias-correction processes are essential for the GRZSM data to be used to calibrate a hydrological model.
3.2. Monthly Surface Flow Time Series
In the case of a watershed where topographic information can be obtained, the NRCS-CN method can directly estimate surface flow depths (to be exact, excess rainfall depth) from precipitation data using the following formula:
where is the surface flow depth (mm), and is the potential maximum retention (mm), estimated by CN, which is calculated from soil and land-use maps. The is the initial abstraction (mm) and is generally considered 0.2. Since the surface flow varies depending on AMC even if the same precipitation occurs, the NRCS-CN method allows CN to change based on the 5-day antecedent precipitation (see Table S3 in Supplementary Material).
In this study, all precipitation events were extracted from observed daily precipitation time series (here, if dry days continue for more than 1-day, it is considered a separate precipitation event). Then, the surface flow depth was calculated for each precipitation event by applying the 5-day antecedent precipitation divided into the growing season (June to September) and the dormant season. The monthly surface flow time series was accumulated from the surface flow depth calculated based on the event. Figure S3 in Supplementary Material shows the monthly stream flows observed in the HCD and NGD watersheds and the monthly surface flow estimated by the NRCS-CN method. Although the estimated surface flows cannot be accurately evaluated since there is no observed surface flow data, the correlations between the observed stream flows and the estimated surface flows are relatively high. Additionally, when the stream flow is high (i.e., wet season), the surface flow is also estimated to be high, and when the stream flow is low (i.e., dry season), the surface flow is estimated to be close to zero. Hence, the surface flows using the NRCS-CN method were applied to this study as the simplest available calibration data in ungauged basins, even though at the monthly scale.
3.3. Monthly Actual Evapotranspiration Time Series
Szilagyi et al. [110] developed the Generalized Complementary Relationship (GCR) by generalizing the complementary relationship between the potential and actual evapotranspiration proposed by Bouchet [111]. If a watershed has meteorological data, such as daily maximum temperature, minimum temperature, relative humidity, wind speed, and solar radiation, for calculation of by the Penman–Monteith method available, the daily actual evapotranspiration can be estimated using GCR [112].
The most important parameter in estimating actual evapotranspiration (hereafter AET) by the GCR is the Priestley–Taylor (PT) coefficient [113]. Many studies have applied the GCR after calibrating the PT coefficient to be better in accordance with the observed AET [114]. Therefore, in this study, the PT coefficient in a gauged watershed (e.g., NGD watershed) has been calibrated to match estimated annual mean AET and observed annual mean AET (i.e., observed annual mean precipitation minus the observed mean streamflow) as well as possible. After that, the PT coefficients estimated in the gauged basin were applied to estimate the AET in the ungauged basin (e.g., HCD watershed). For reference, the PT coefficients in the HCD and NGD watersheds were calibrated at 1.1493 and 1.1169, respectively.
Although the GCR has generally been used to investigate the hydrological cycle at the annual scale, it has recently been reported to be applicable at the monthly scale [115]. In this study, the monthly AET time series was estimated by summing up the daily AET time series. Figure S4 shows the monthly AET calculated from the precipitation and stream flow data and those estimated using the GCR for the HCD and NGD watersheds. The seasonal patterns and annual totals of both the series are similar, but the quantitative differences between both the series widen greatly in some months. These differences are due to the carry-over effect of the AET estimates calculated from precipitation and streamflow. In other words, it is not appropriate to consider the amount of precipitation minus streamflow as AET since soil moisture in the antecedent time affects the streamflow in the subsequent time. However, this comparison was performed for the purpose of visually confirming the appropriateness of the actual evapotranspiration estimated by GCR on the monthly scale. The monthly AET estimated by the GCR was applied to this study as the simplest calibration data available in an ungauged watershed from which the meteorological data can be obtained.
4. Methods
4.1. Calibration andVvalidation Strategy
In this study, we used three datasets in calibration schemes: (1) the daily GRZSM soil moisture time series based on satellite observation (S in Table 3), (2) the monthly surface flow time series estimated using the NRCS-CN method based on only topographical information (Q in Table 3), and (3) the monthly actual evapotranspiration time series estimated using the GCR based on only meteorological data (E in Table 3). The hydrological model’s parameters were estimated by organizing the calibration schemes based on the three types of calibration data, as shown in Table 3. Additionally, scheme F, the best calibration scheme, uses the observed daily stream flow time series (F in Table 3). Finally, comparisons with the general regionalization approach (R in Table 3) are also required, as observed stream flow information of a nearby gauged watershed is used to correct for bias in soil moisture data. The scheme R is a regionalization approach traditionally used in an ungauged basin, and uses a parameter set estimated in a donor watershed to predict stream flow. At this time, the parameter set obtained using Scheme F in the HCD (or NGD) watershed, a donor watershed, is applied to the NGD (or HCD) watershed that is set as an ungauged watershed. The outputs of Schemes R and F were used to evaluate those of the other schemes.

Table 3.
Description of calibration schemes.
Considering that the available period of the SMAP L4_SM data is from 2016 to 2019, the period of data for calibration and validation was classified as period A (1 January 2016 to 31 December 2017) and period B (1 January 2018 to 31 December 2019). That is, we investigated the outputs calibrated for period A and validated for period B, and those calibrated for period B and validated for period A. The years 2015 and 2017 were used as warm-up periods for each period when driving the model. Scenarios calibrated using period A data for HCD and NGD watersheds were named and , respectively, and scenarios using period B data were also named and , respectively.
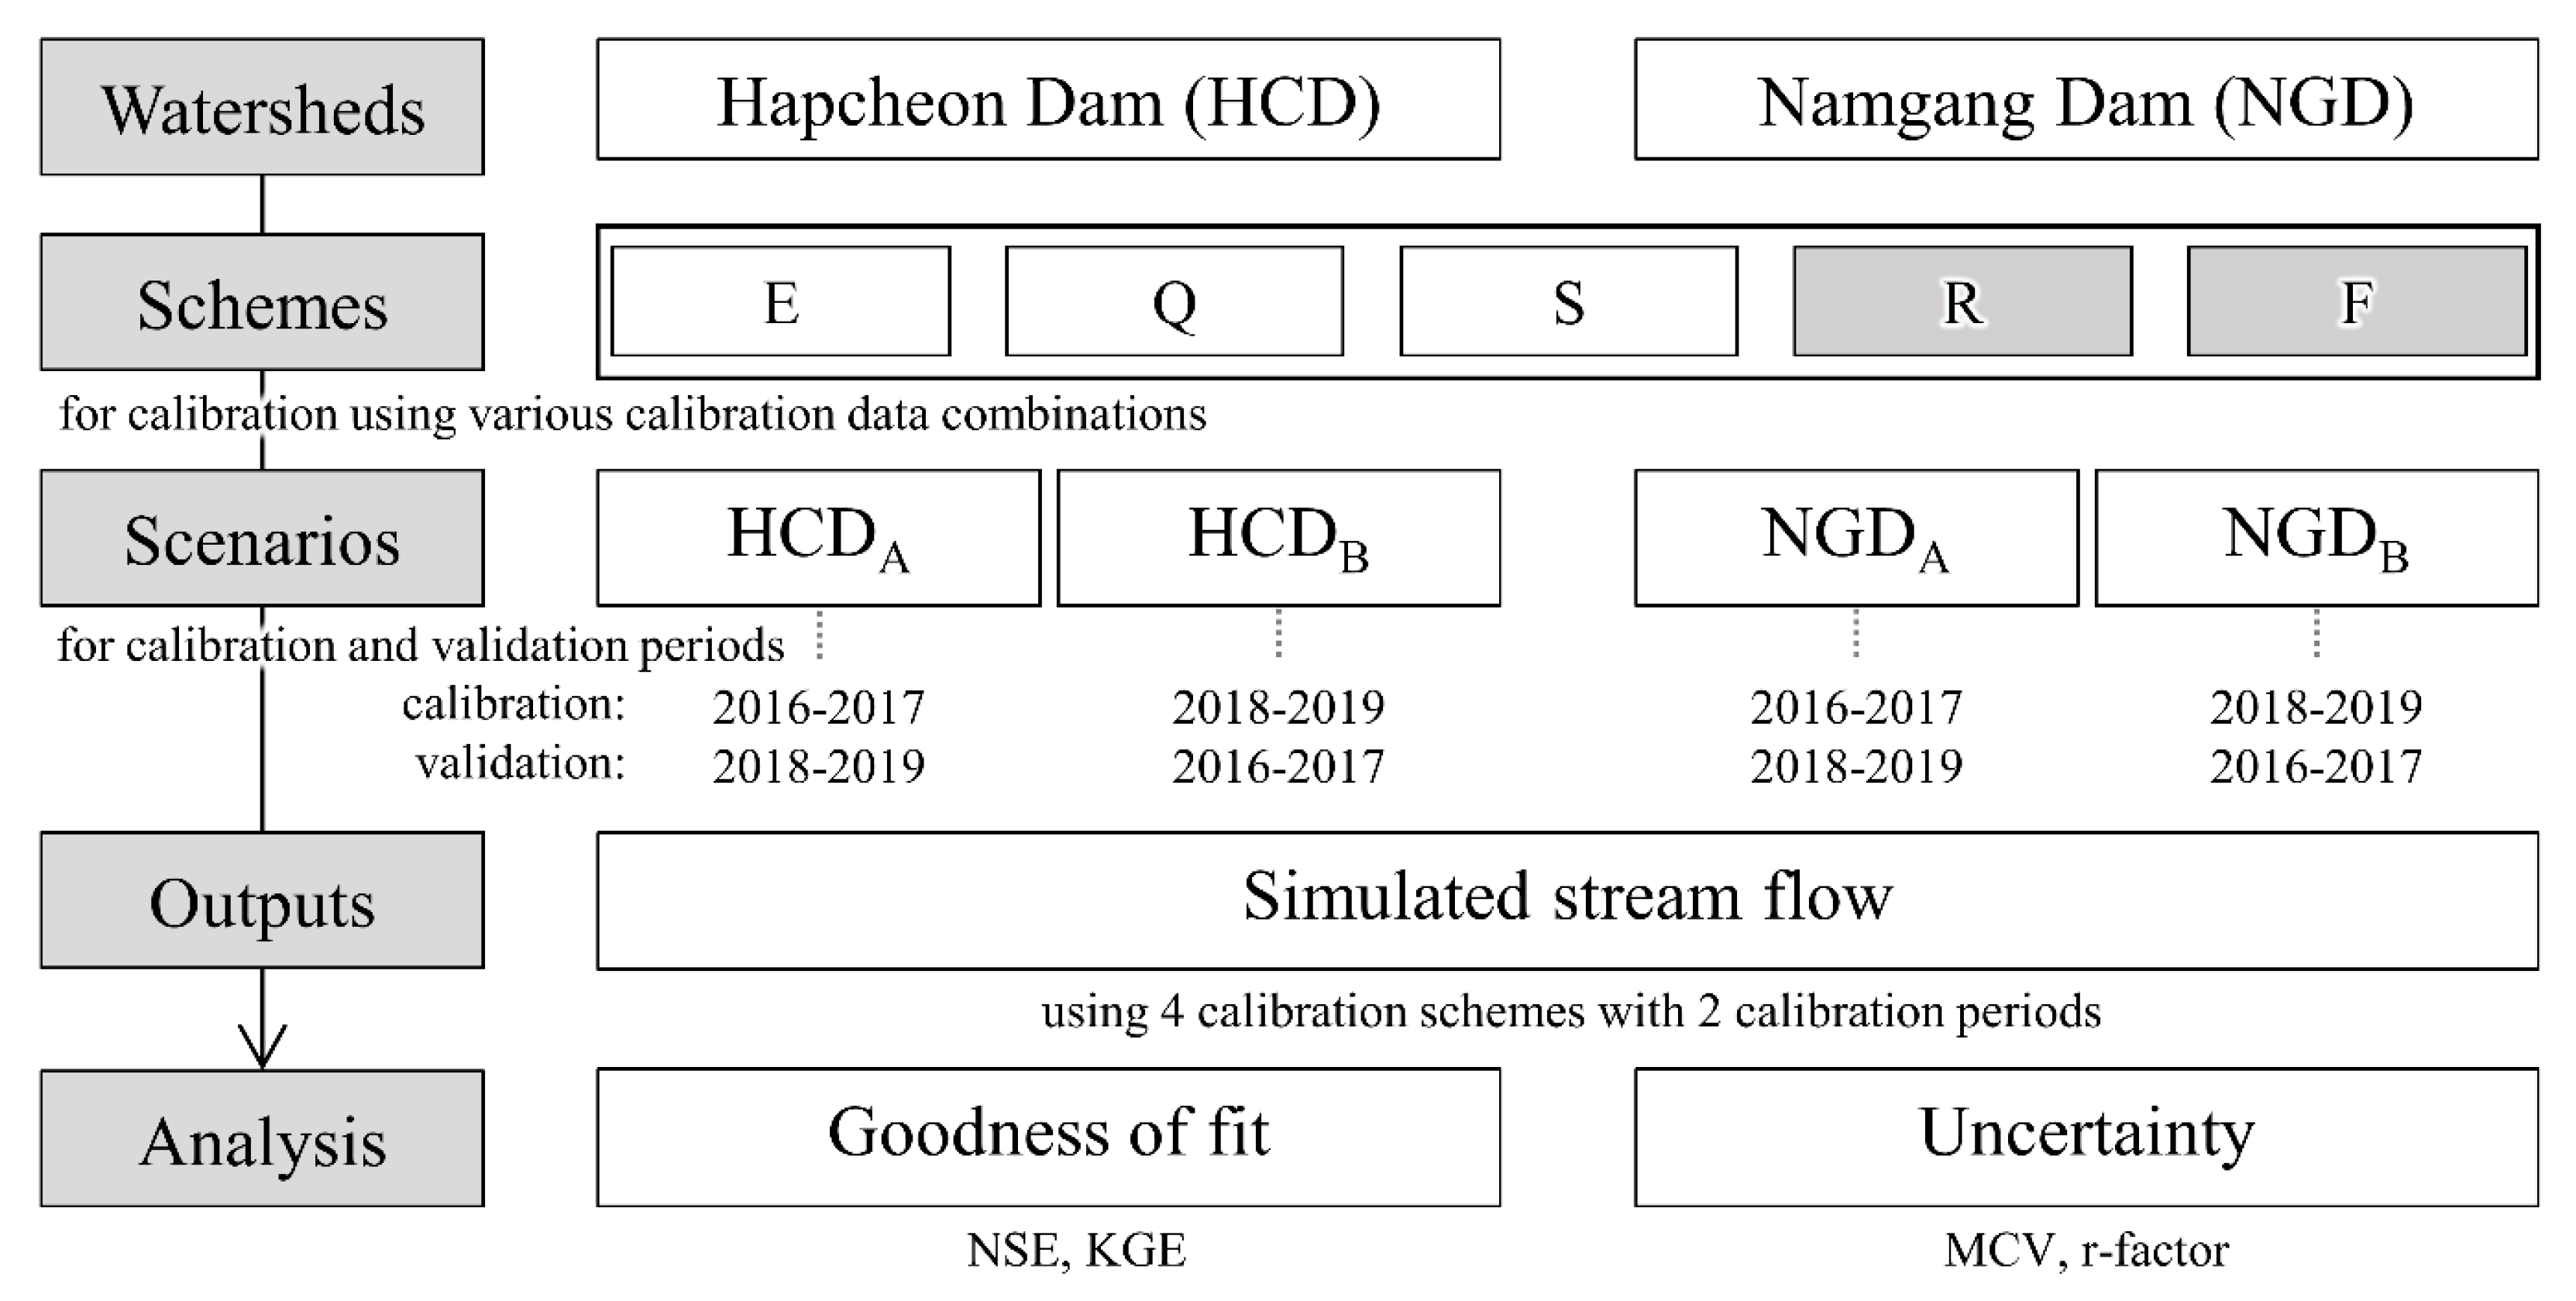
In summary, a total of five calibration schemes are applied for each watershed. For each calibration scheme, calibration and validation are performed by crossing over the two periods. Figure 2 shows the flow chart of this study.
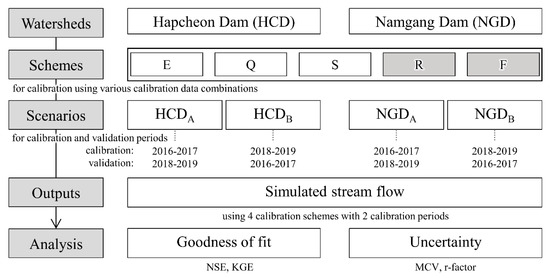
Figure 2.
Schematic flow chart for this study.
4.2. Performance and Uncertainty Metrics
Nash-Sutcliffe model efficiency coefficient (NSE) and Kling–Gupta efficiency (KGE) were used to analyze the accuracy of simulated stream flow [116,117]. The closer both NSE and KGE are to 1, the more accurate the model is. NSE and KGE are calculated as follows, respectively:
where is the total number of daily streamflow data, represents the simulated stream flow (mm), represents the observed stream flow (mm), and is the average of the observed stream flow (mm). The is the linear correlation coefficient between observed and simulated data, is the ratio of the standard deviation of observed and simulated data, and represents the ratio of the averages of observed and simulated data. The NSE threshold, which indicated satisfactory model performance, is between 0.5 and 0.65 [118]. According to [119], KGE of 0.6 or higher can be considered satisfactory simulation results.
Uncertainty was analyzed from two points of view. The first is the uncertainty of estimated parameters. The uncertainty of parameters was quantified as the standard deviations of each parameter’s ensemble, which is sampled by MCMC. The second is the uncertainty of simulated stream flows. The uncertainty of simulated stream flow can be numerically assessed with the mean coefficient of variation (MCV) and r-factor. To reflect the degree of separation of stream flow ensembles simulated by MCMC, MCV is calculated as:
where, is the standard deviation of the ensembles corresponding to the -th observations, and is the model estimate (i.e., the ensemble average) corresponding to the -th observations. The r-factor is the average width of the 95 percent prediction uncertainty (PPU) band of ensembles divided by the standard deviation of observation, and its value varies from 0 to 1 [120,121].
5. Results
5.1. Estimated Parameters
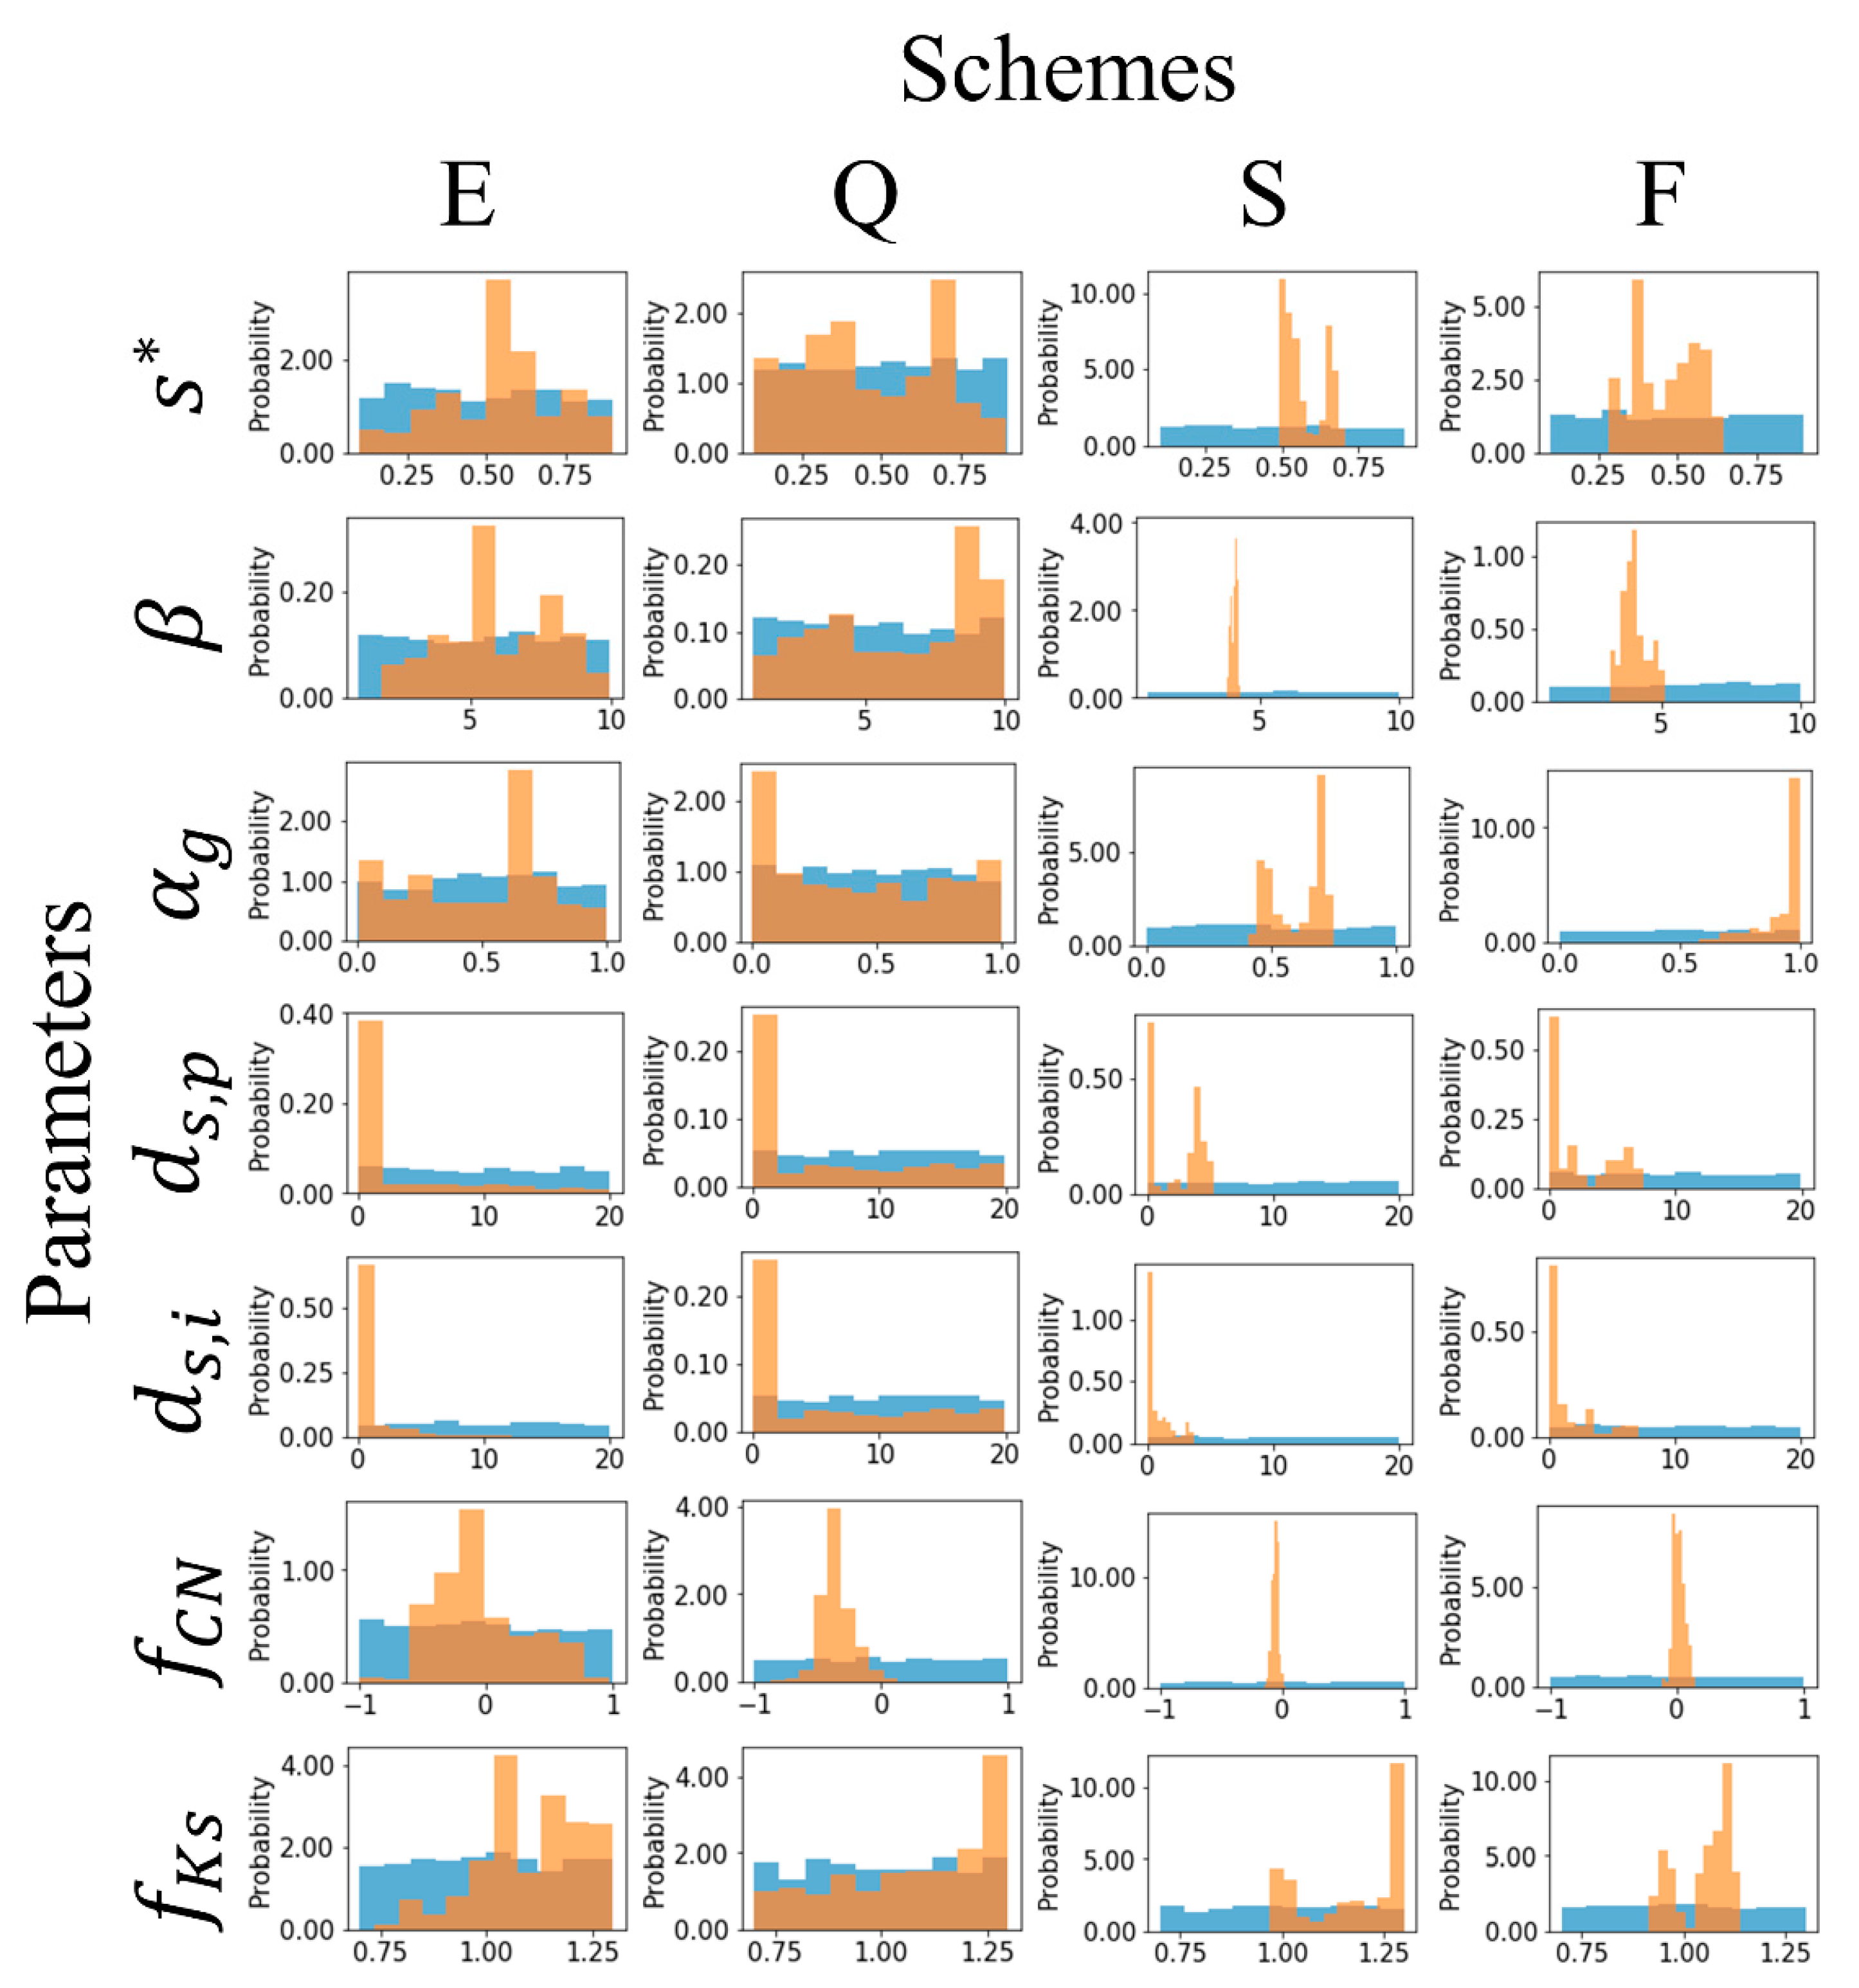
The four calibration schemes, excluding the regionalization approach (scheme R), were applied in each scenario using the MCMC method. From this, we can acquire posterior distributions of the model parameters. Figure 3 shows the prior distributions (blue bars) and the posterior distributions (orange bars) of seven model parameters for calibration scenario using period A’s data for the HCD watershed. The scheme R was excluded from Figure 3 since it applies the posterior distributions of parameters sampled from the nearby gauged watershed. The ensemble averages of parameters sampled from posterior distributions were considered as optimized parameters, and stream flows for calibration and validation period were calculated using these parameters. In addition, the standard deviations of parameter ensembles were calculated from the posterior distribution of each parameter to quantify the uncertainty of parameters.
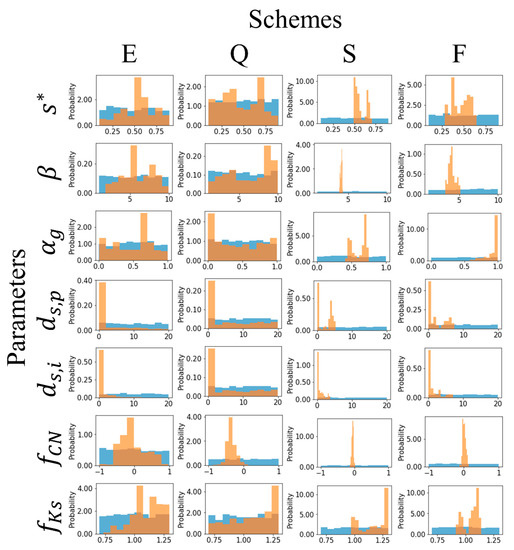
Figure 3.
Estimated prior distribution (blue colour) and posterior distribution (orange colour) of parameters by each calibration scheme for Hapcheon dam watershed calibrated using 2016–2017 data (HCDA).
5.2. Goodness of Fit and Uncertainty
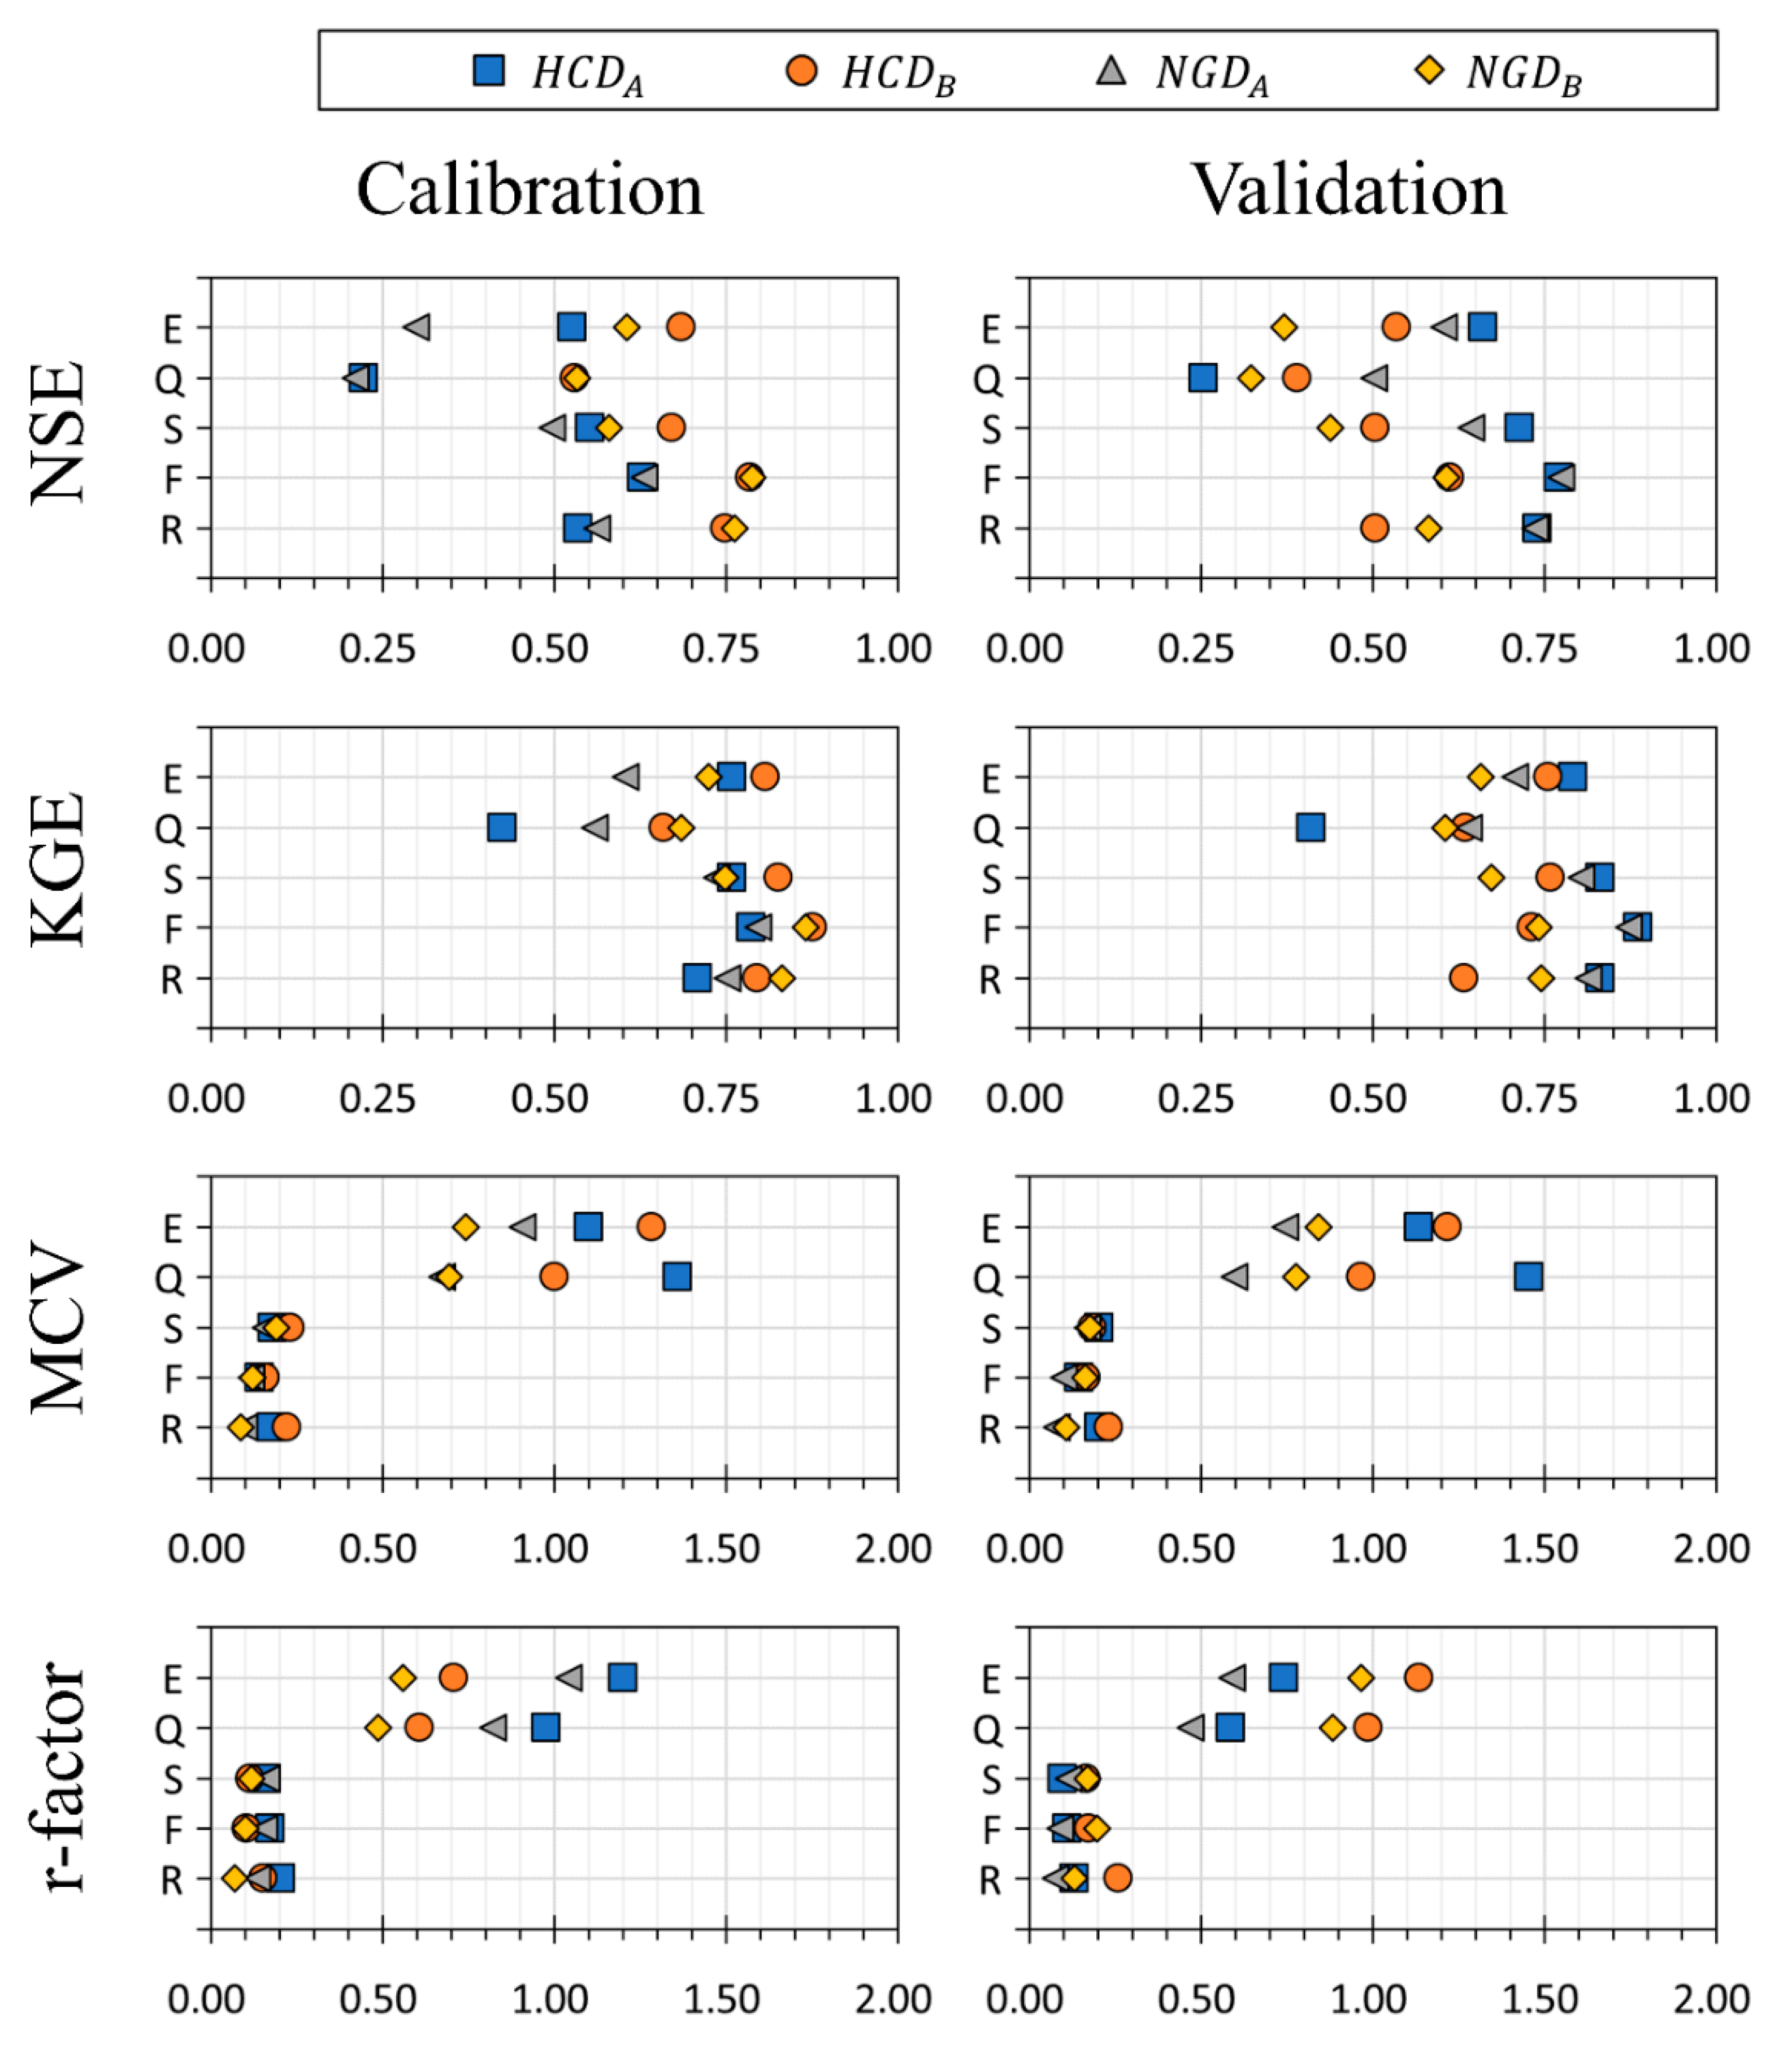
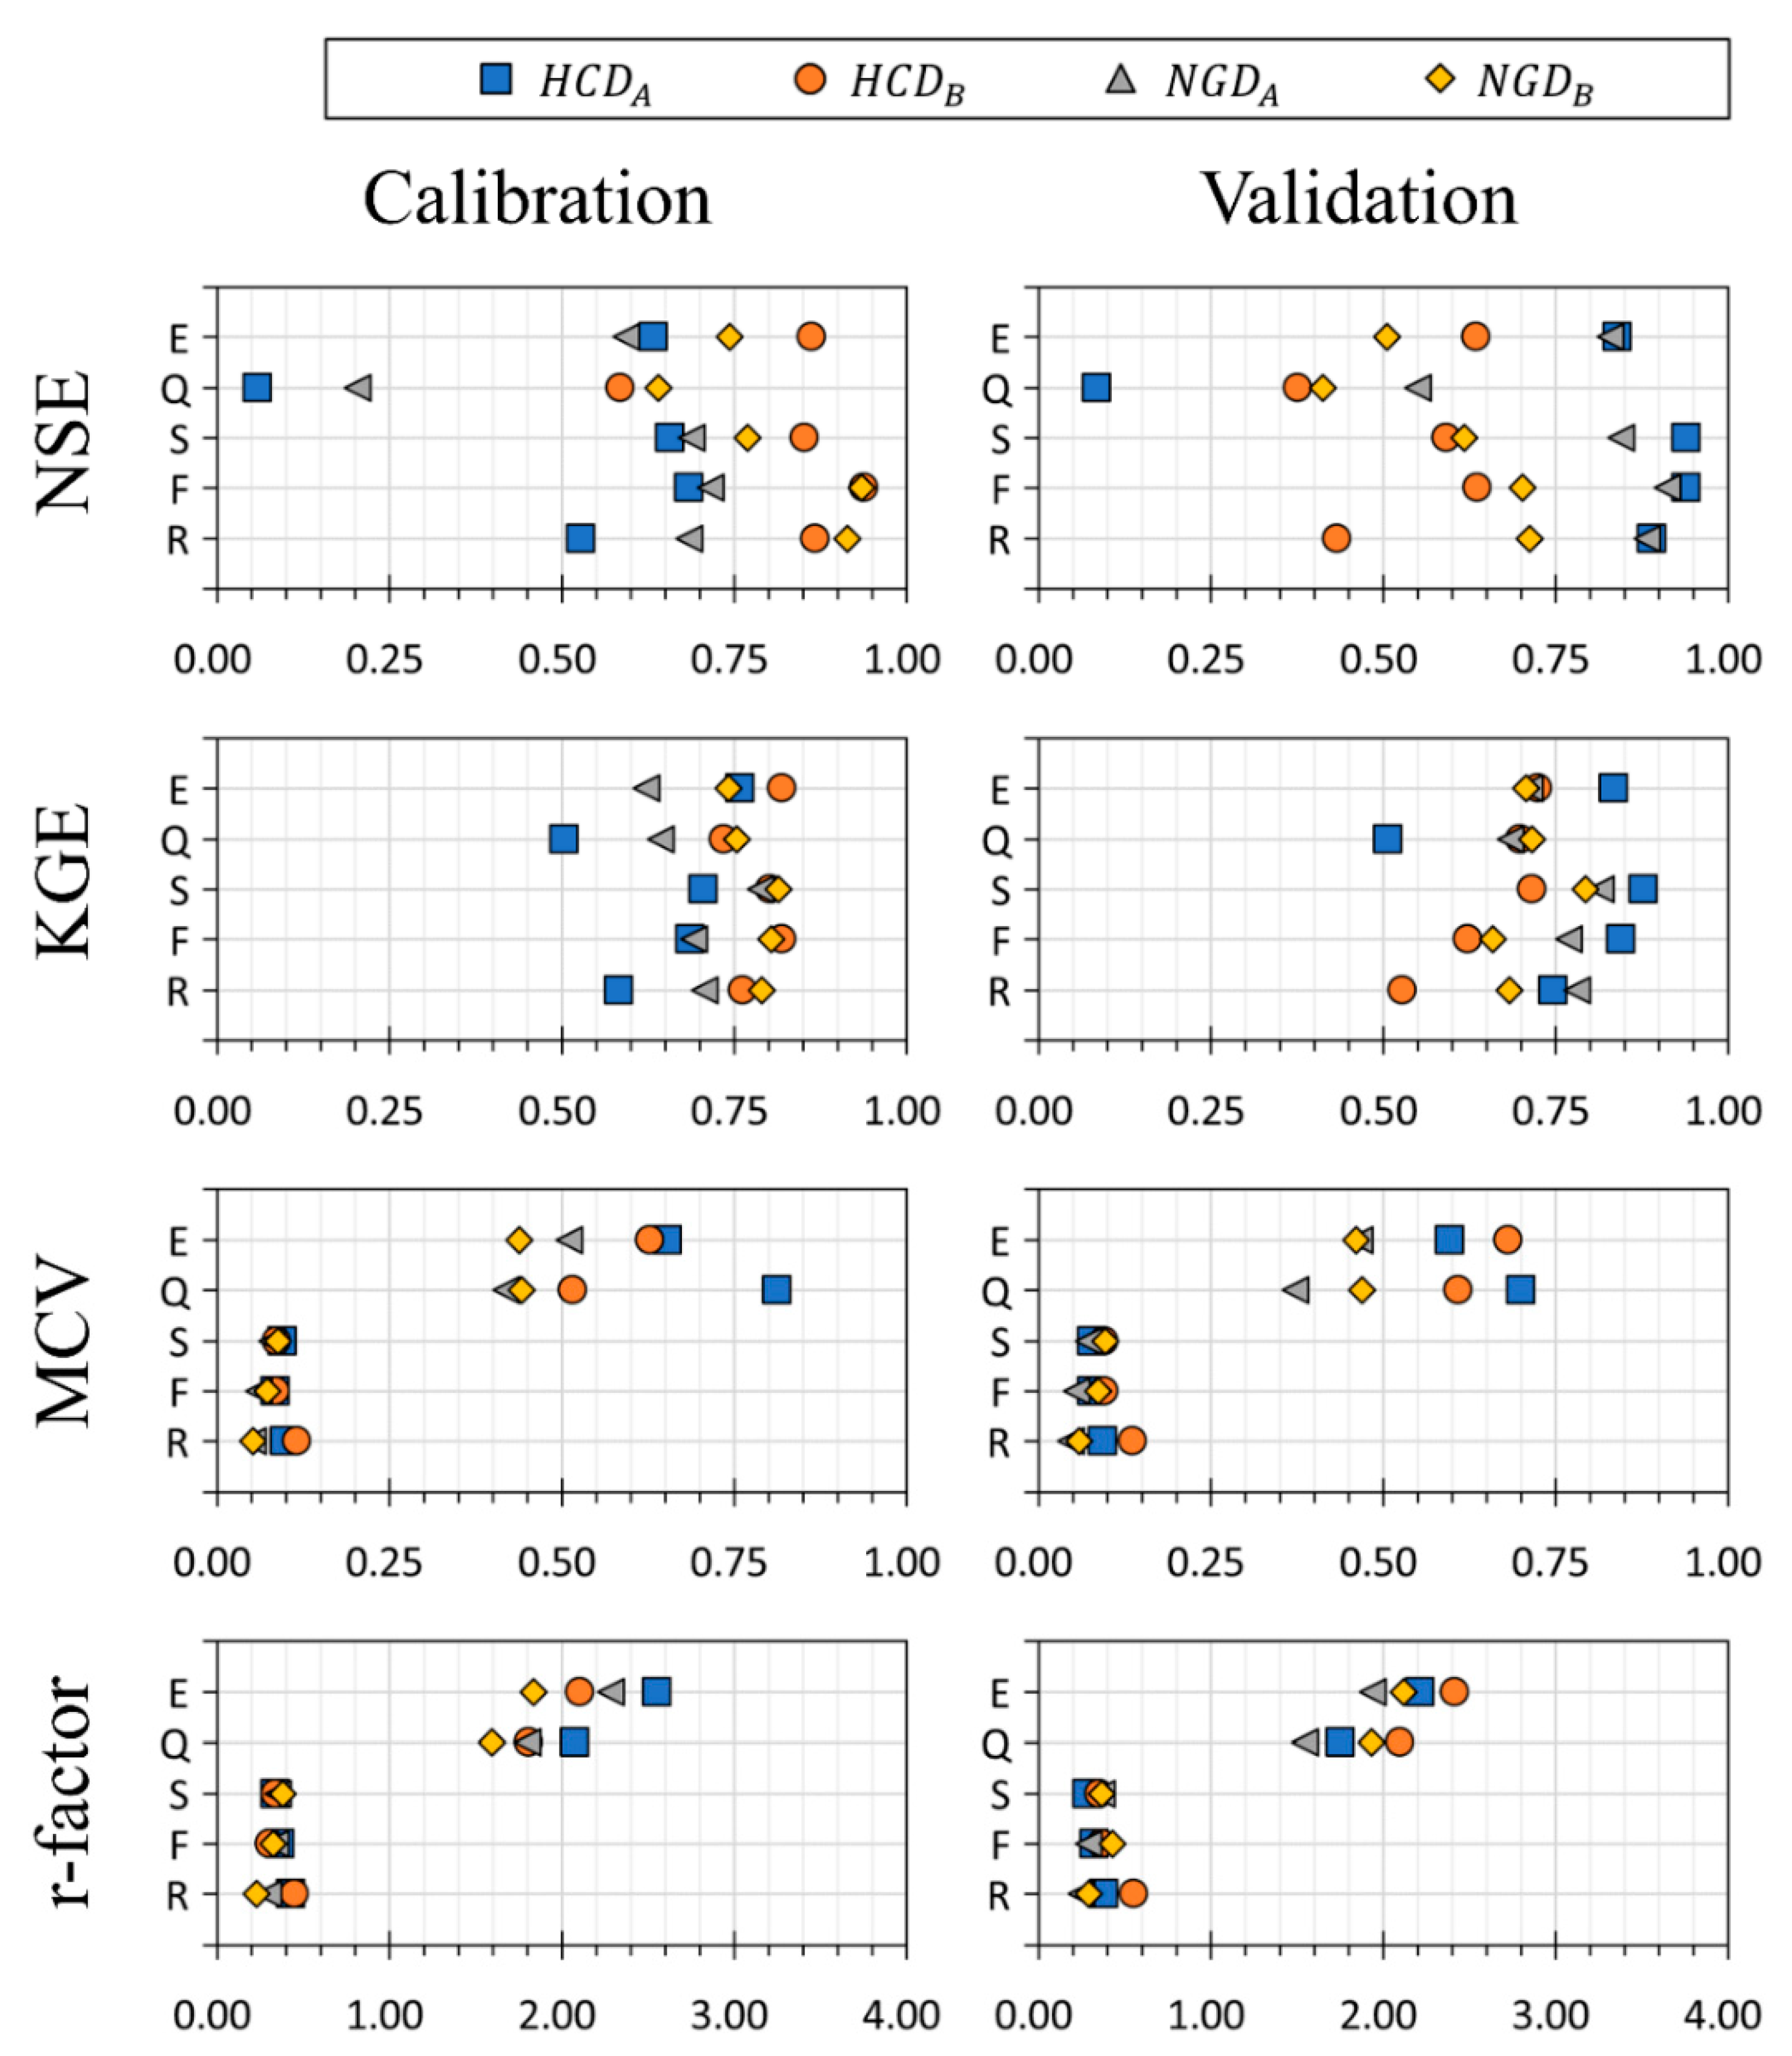
Figure 4 and Figure 5 summarize the performance and uncertainty of five calibration schemes in simulating daily and monthly stream flow for the four scenarios. The monthly stream flow simulated by each scheme is calculated from the simulated daily stream flow. The annual stream flow has not been analyzed because of the relatively short data records.
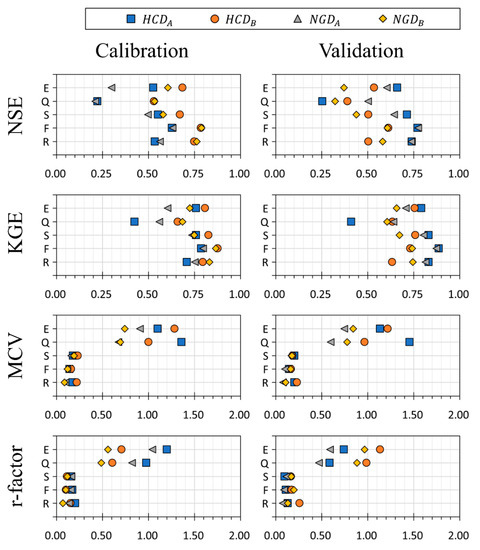
Figure 4.
Performance metrics (NSE and KGE) and uncertainty metrics (MCV and r-factor) between observed and simulated daily stream flow for calibration period and validation period.
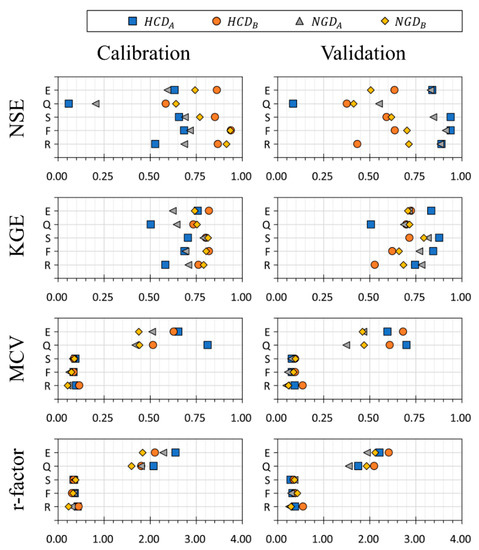
Figure 5.
Performance metrics (NSE and KGE) and uncertainty metrics (MCV and r-factor) between observed and simulated monthly stream flow for calibration period and validation period.
5.2.1. Calibration Schemes E, Q, and S
At the daily scale, the scheme Q produced a value that exceeded the threshold of either NSE of KGE in some applications (in this study, the considered thresholds of NSE and KGE are 0.5 and 0.6 respectively), but most applications revealed lower model performance. In contrast, except for some applications, schemes E and S mostly showed higher performance (see Figure 4). At the daily scale, the mean NSE of schemes E and S for the calibration period were 0.5272 and 0.5342, respectively, and the mean KGE of schemes E and S were calculated as 0.7215 and 0.7652, respectively. Furthermore, calibration schemes E and S for the validation period represented the mean NSE of 0.5407 and 0.5727, and the mean KGE of 0.7262 and 0.7647, respectively. These results show the applicability of GCR-based AET or GRZSM data for ungauged watersheds. Similar patterns are found at the monthly scale (see Figure 5).
The uncertainties of parameters estimated by the calibration schemes are propagated to the outputs of the model (i.e., simulated stream flow). Figure S5 in Supplementary Material shows the standard deviations of the parameters estimated by each scheme. Regardless of the type of parameter, the uncertainty of parameters estimated by scheme Q is found to be greater than that estimated by other calibration schemes. It is revealed that the parameters estimated by scheme E also have significant uncertainty. In contrast, it is found that the parameters estimated by scheme S have relatively better reliability. The uncertainties of simulated stream flows can be seen from MCV and r-factor in Figure 4 and Figure 5. The parameter uncertainties identified in Figure S5 are reflected in the stream flows, so the uncertainty of the stream flow simulated by scheme S is significantly lower than those of schemes E and Q. It is inferred that the relatively low temporal resolution of monthly actual evapotranspiration or monthly surface flow used for calibration caused high uncertainty in the simulated daily stream flow. Conversely, the use of GRZSM data, which could be obtained as daily scale data, would be a useful way to ensure the reliability of the model’s output. In summary, of the three calibration schemes analyzed in this section, schemes E and S have exceeded the specified thresholds of performance metrics at daily or monthly scales. However, given the total uncertainty, it can be said that scheme S, which represents relatively low uncertainty, is one of the best calibration strategies to predict stream flows in ungauged watersheds.
5.2.2. Calibration Scheme S versus Traditional Schemes
In this section, scheme S, which showed the best performance and uncertainty above, is compared with the traditional regionalization scheme R. It is also compared to Scheme F, which provides the best calibration results. Table 4 shows the mean values and the differences between maximum and minimum values of the metrics for applications based on schemes S, R, and F.

Table 4.
Performance and uncertainty of simulated daily and monthly stream flow by each calibration scheme for calibration and validation periods.
The mean NSE of daily stream flow simulated by scheme S is smaller than the mean NSE of scheme R, but the mean KGEs are similar to each other (see Figure 4). On the other hand, in simulation at the monthly scale, the mean NSE of scheme S is similar to that of scheme R, and the mean KGE of scheme S is greater than that of scheme R (see Figure 5). Based on the indicators, the mean monthly KGE of scheme S is better than that of Scheme F. KGE focuses on overall model performance, and NSE focuses on relatively high flows [122]. That is, from the point of view of daily stream flow prediction, scheme S has relatively poor simulated performance for high flows as compared to Scheme R, but the overall simulated performance is similar between both the schemes. From this result, it is possible to infer that scheme S’s simulation performance for low flows would be better. This inference can also be reaffirmed by the result that scheme S performs better than scheme R in monthly stream flow prediction.
The mean MCV of the daily or monthly stream flow simulated by scheme S represents a higher value than the corresponding ones of scheme R. On the other hand, the mean r-factor shows the opposite result. In other words, the evaluation of which of the two schemes has less uncertainty depends on which metric is used. However, the difference between these two schemes is evident in the difference between the maximum and maximum metrics values. The scheme S has a small difference between the maximum metric value and the minimum metric value, while the corresponding one for Scheme R is relatively large. In other words, the uncertainty of stream flow simulated by the traditional regionalization approach is likely to expose a large deviation in some cases. On the contrary, if the GRZSM data are used to calibrate, it can be expected that relatively more robust results are achieved.
In summary, the most important point to note in this section is that the traditional calibration strategy, scheme R, is still a useful calibration method, and scheme S can achieve similar results. However, while scheme S shows more robust uncertainty independent of applications, scheme R has the potential to represent considerable uncertainties in some applications. This means that the regionalization approach, which applies optimized parameters for a neighboring gauged watershed as they are, is more likely to encounter the equifinality problem (‘right for the wrong reasons’). When the GRZSM data are used for calibration, we can expect a relatively more robust predictive reliability. Indeed, since it is difficult to directly quantify the uncertainty of the output in an ungauged basin, this instability of the regionalization approach makes it difficult to trust the model output derived from it. Therefore, these results indicate why an approach using the GRZSM data should be applied instead of a traditional regionalization approach to calibrating an ungauged watershed.
6. Discussion
6.1. Selection of Calibration Period Depending on Hydroclimatic Conditions
Observed data play the most important role for calibration of hydrological models or for evaluating uncertainty. Key factors in observed data are the length of the data and the hydrological climatic conditions to which it belongs [26]. In particular, since the conceptual hydrological model concisely expresses the hydrological process, structural defects in the model are bound to exist, which may be evident under certain hydroclimatic conditions [123]. Parameter estimations may partially complement these defects through calibration, but the estimated parameter values are expected to depend on hydro-meteorological conditions in calibration periods. Many hydrologists have been evaluating the performance of various hydrologic models and the applicability of parameters under changing hydro-meteorological conditions [124,125,126,127,128].
In this section, we additionally investigated the effect of the hydro-climatic conditions of the calibration period on the performance and uncertainty of the model from the results derived in Section 5. To this end, schemes S and F were considered. Table 5 shows the mean dryness index (MDI) calculated from the used meteorological data (precipitation and reference evapotranspiration). Higher MDI implies that the period is under drier hydroclimatic conditions. Both the HCD and NGD watersheds indicated that period A (2016–2017) was under relatively drier hydroclimatic conditions than period B (2018–2019).

Table 5.
Hydroclimatic conditions for calibration periods.
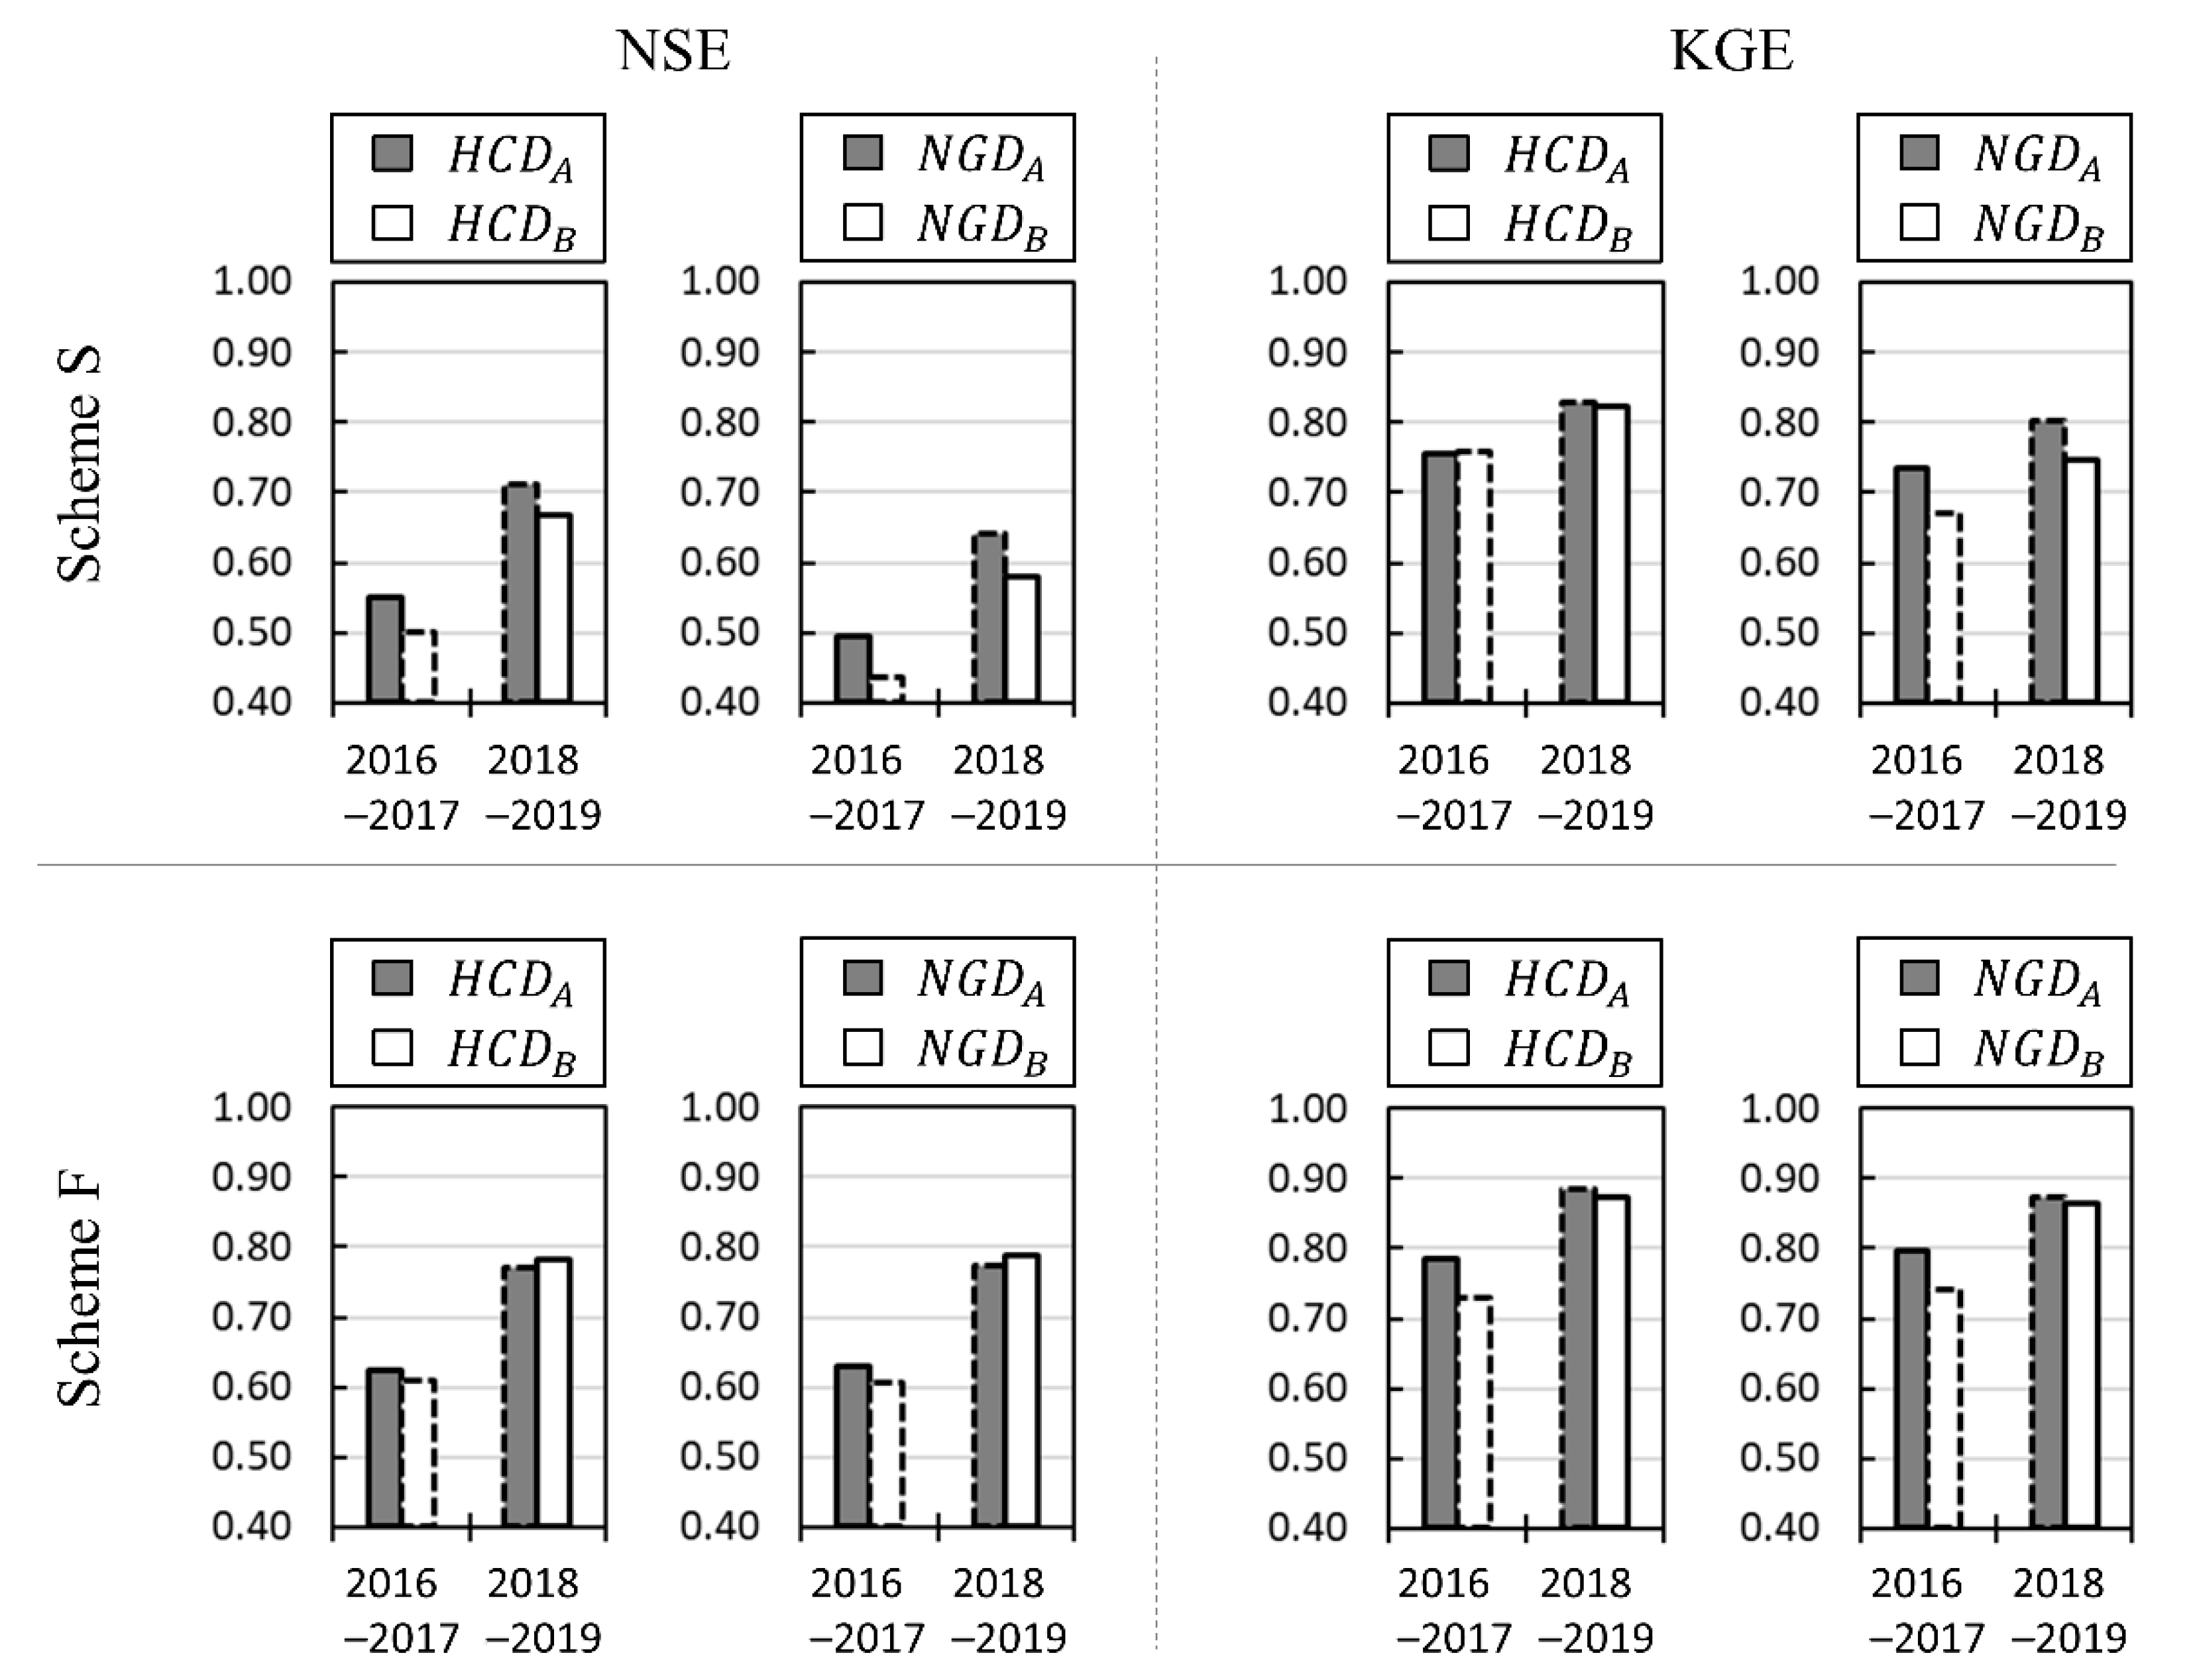
Figure 6 shows the performance evaluation metrics of schemes S and F, rearranged for the hydroclimatic conditions. For example, in Figure 6 represents the values of NSE and KGE for daily stream flow that ware calibrated for the HCD watershed using data for period A (2016–2017; relatively dry hydroclimatic condition) and validated for period B (2018–2019; relatively wet hydroclimatic condition). In both schemes S and F, it can be found that performing calibration under relatively wet hydroclimatic conditions is advantageous for obtaining better goodness-of-fit performance metrics. However, goodness-of-fit performance metrics obtained at the validation phase indicate that this fact cannot be agreed upon. It is revealed that the models calibrated under wet hydroclimatic conditions ( and ) have difficulty in predicting stream flow under dry hydroclimatic conditions. Conversely, the models set under dry conditions ( and ) provide a good prediction of stream flows under wet conditions. In other words, the model maintained good validation performance under those hydroclimatic conditions, which was relatively wetter than the hydroclimatic condition under which the calibration was performed, but the model outputs simulated under the drier period than the calibration period could not exhibit the performance expected in the calibration. These results make it possible to infer that the calibration performed under wet hydroclimatic conditions is insufficient to tune the evapotranspiration process. In particular, the dependence of goodness-of-fit performance on hydroclimatic conditions in the calibration periods was more apparent in NSE than in KGE. This is in line with a comment of [122] that NSE gives relatively greater weight to high flows’ fitness. The high NSE found under wet hydroclimatic conditions is because the quality of fit for low stream flow is relatively less important, resulting in increased uncertainty about the predictive performance of stream flow under dry hydroclimatic conditions.
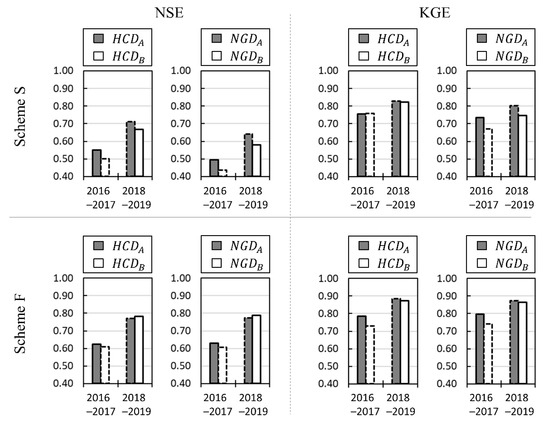
Figure 6.
NSE and KGE between observed daily stream flow and simulated daily stream flow by calibration schemes S and F for 2016–2017 and 2018–2019. The solid line bars indicate results for calibration periods, and the dotted line bars indicate ones for validation periods.
Meanwhile, it is worth paying attention to the fact that the validation scores of the models ( and ) calibrated using the data of dry years by scheme S are higher than the calibration scores of the models ( and ) calibrated using the data of wet years. On the one hand, the calibration of and may be regarded as incorrectly performed, but we would like to interpret this fact from a slightly different perspective. The watersheds covered in this study are characterized by very strong seasonality. This can be confirmed indirectly through Figure S4 in the Supplementary Material. Precipitation is concentrated in the summer (July–October), and the evapotranspiration process plays an important role in the hydrological cycle in the seasons other than the summer, even in wet years. Soil moisture information alone has limitations in correctly estimating the parameters that implement the summer runoff process, where the direct runoff occurring on the surface is dominated. This may be one of the biggest reasons why scheme S performance is inevitably lower than scheme F performance. The parameters governing the evapotranspiration process can be better estimated in dry periods where evapotranspiration is primarily involved in the hydrological cycle [129]. In other words, it is possible that soil moisture information in the wet period may interfere with the correct estimation of parameters related to the evapotranspiration process. On the other hand, the parameters estimated using data from dry years can appropriately implement the evapotranspiration process in the period excluding the summer season in wet years. Hence, it is possible that the fitness of the calibration using soil moisture data for wet years would be lower than the generally expected value. However, Figure 6 is not only the result of calibration and validation using two-year data, but also the distinction between dry and wet years is not clear. When estimating the parameters of ungauged basins using GRZSM, the issue of hydroclimatic conditions needs to be further investigated using longer-term data and a wider variety of watershed.
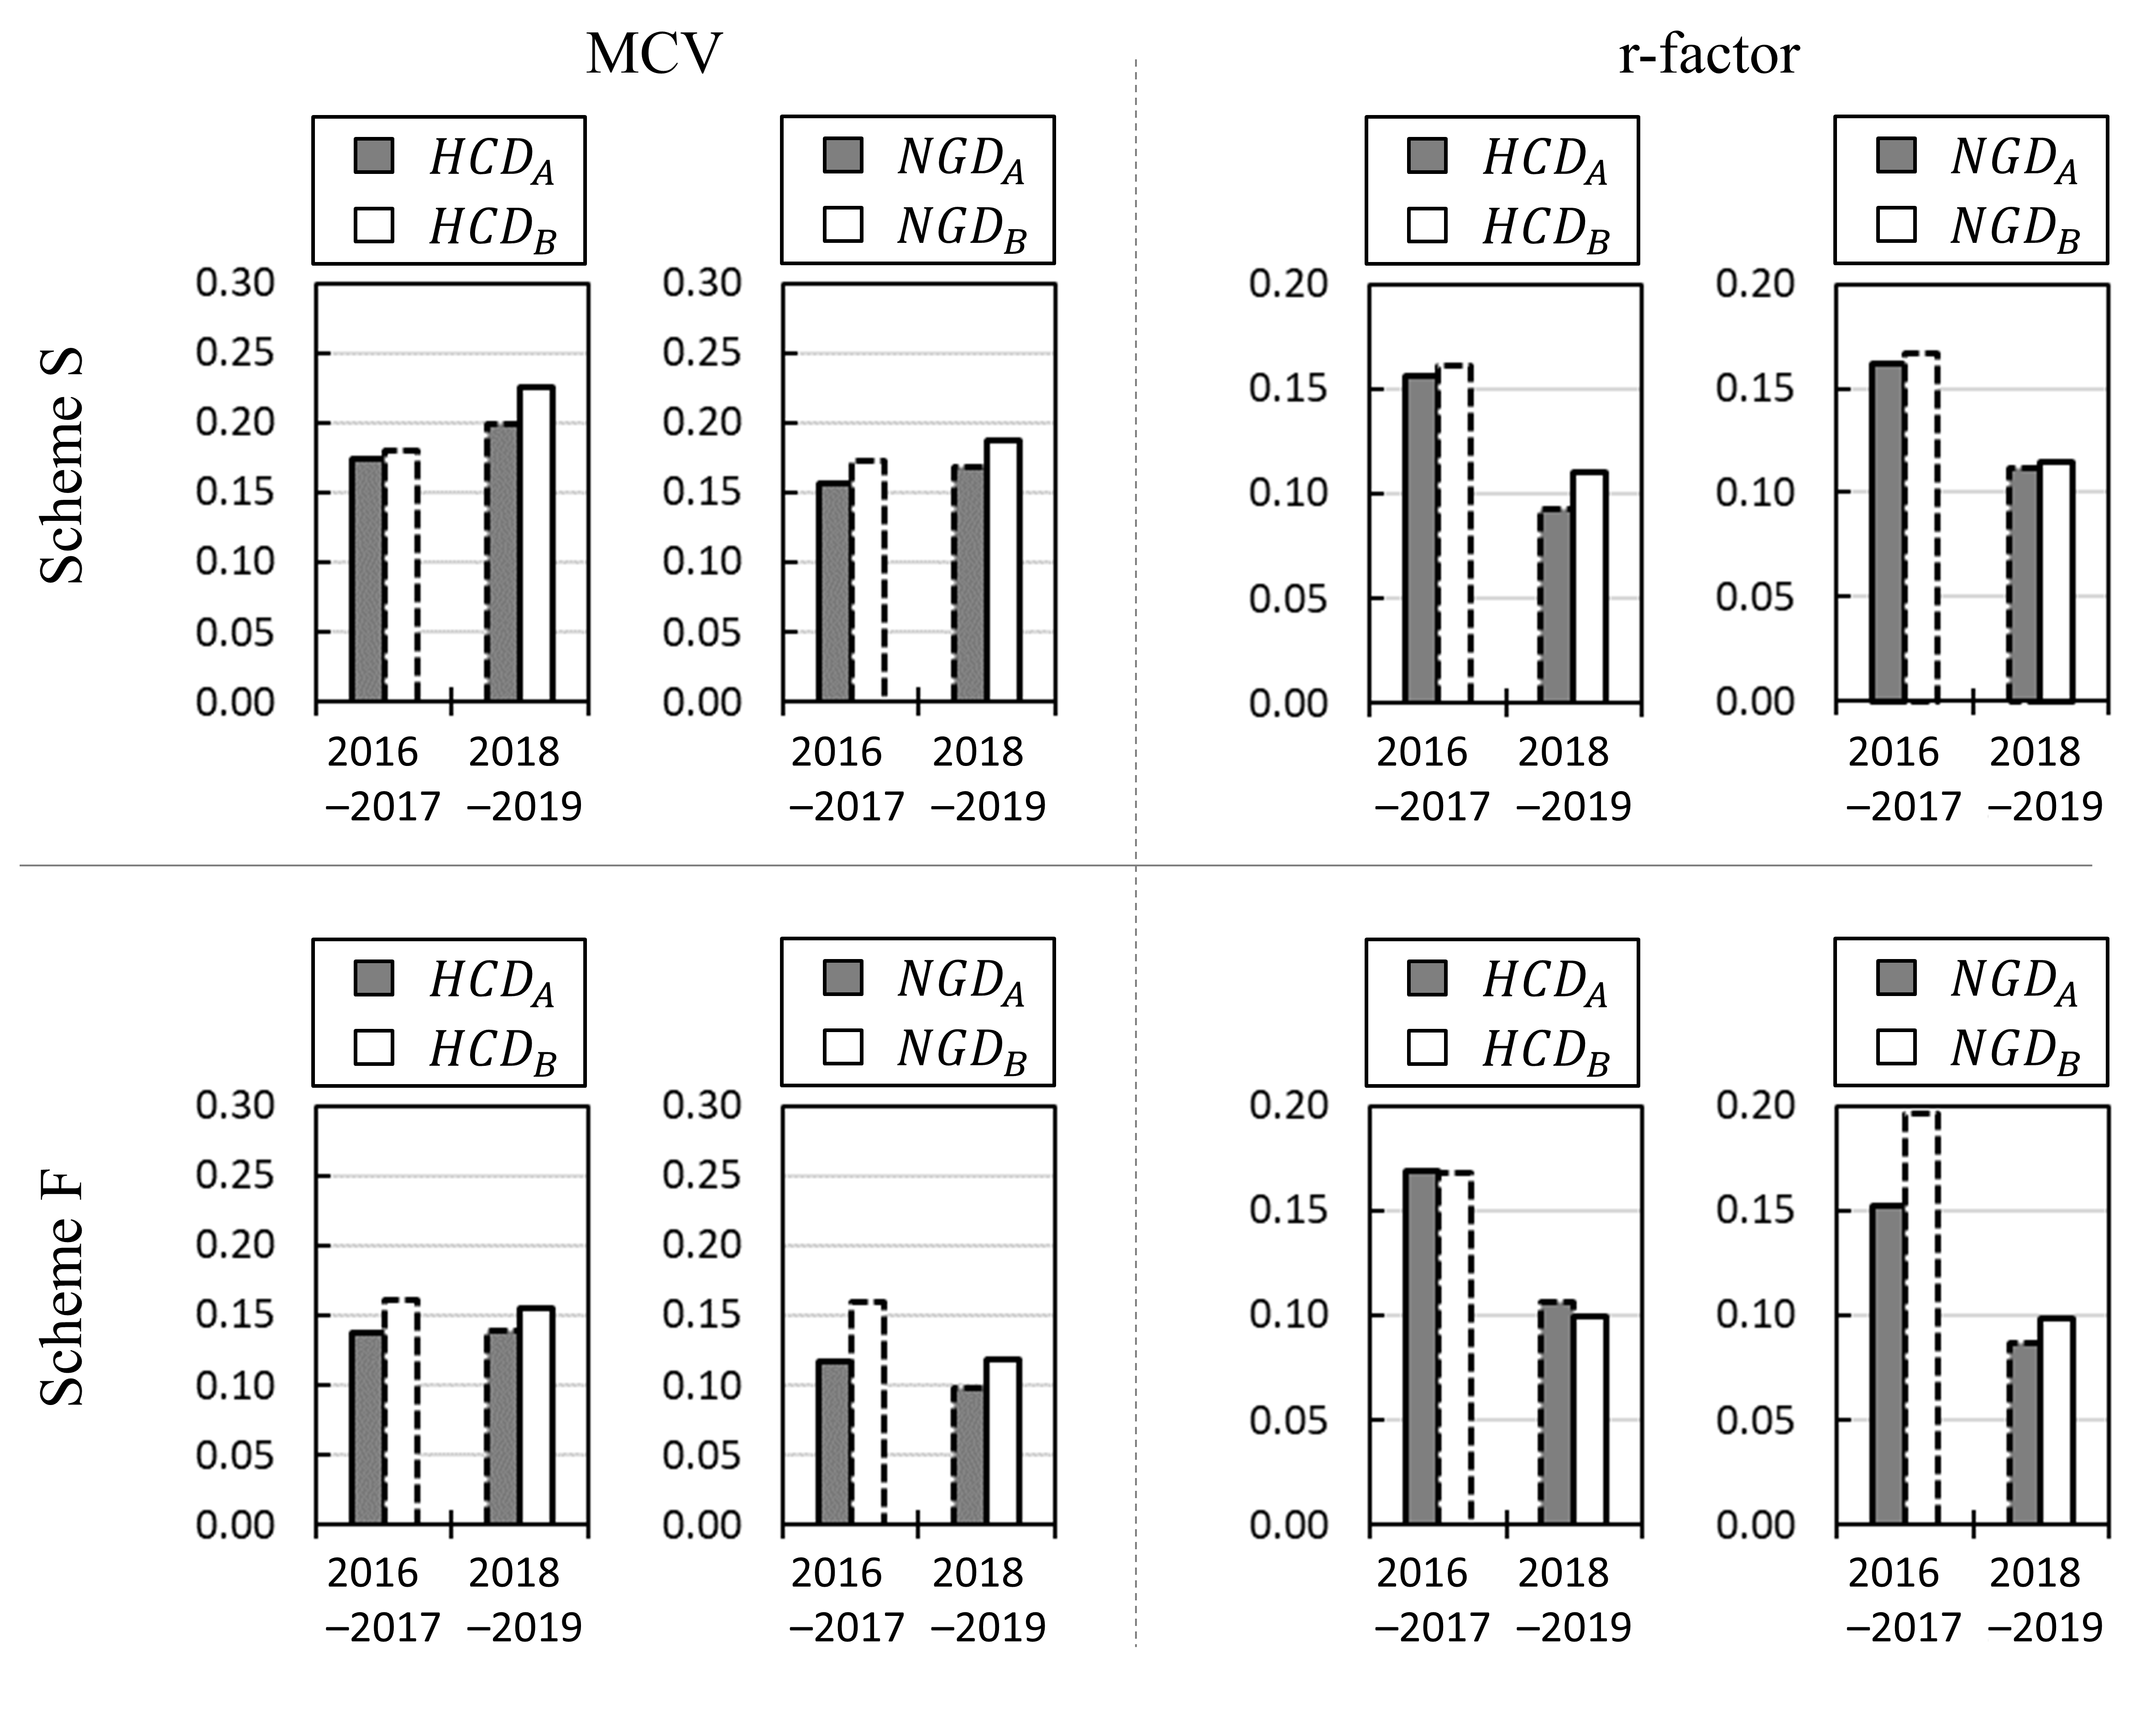
Figure 7 shows the effect of hydroclimatic conditions in calibration periods on the prediction uncertainty of stream flow. Uncertainty performance is better for models calibrated under wet conditions than those calibrated under dry conditions except for MCV in scheme S. However, these results are due to the structure of the equations in the performance metrics. The denominator of MCV is the average of the stream flow ensembles simulated on a particular day, and the denominator of r-factor is the standard deviation of the observed stream flow. The denominators of both performance metrics have higher values for high flow. Uncertainty performance metrics in wet hydroclimatic conditions are bound to be more likely to have smaller values than their counterparts in dry hydroclimatic conditions. Therefore, in order to evaluate which hydroclimatic conditions help to obtain better uncertainty performance, we compared the results for the same period. It is found that the uncertainty performance of models calibrated under dry conditions is better in all comparison groups except the r-factor in the HCD watershed. In fact, the r-factor of the HCD watershed also shows little difference in performance metrics for the two periods. These results indicate that the stream flow predicted by a model calibrated under dry conditions is more reliable.
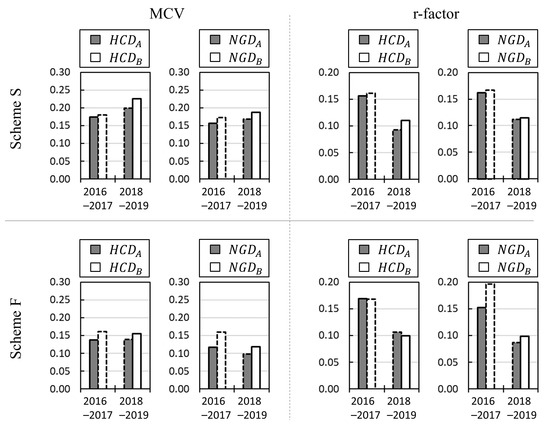
Figure 7.
MCV and r-factor between observed daily stream flow and simulated daily stream flow by calibration schemes S and F for 2016–2017 and 2018–2019. The solid line bars indicate results for calibration periods, and the dotted line bars indicate ones for validation periods.
The above analysis suggests that the existing claim that the calibration period’s hydroclimatic conditions play an important role in the calibration using stream flow data [26,129,130,131,132,133] is equally applicable to the calibration based on the GRZSM data. When calibrating the hydrological model for the watersheds applied in this study using the GRZSM data, selecting the period corresponding to the dry hydroclimatic conditions, if possible, would be the way to obtain relatively better model outputs.
However, this study’s application is limited since data for a sufficiently long period are not available for calibration. Since the length of the data is an essential factor in calibration [134,135], it should be noted that the data from insufficiently long periods influenced the results of this study. Therefore, securing soil moisture data for a sufficiently long period would be the first prerequisite for verification of this study. As global remote sensing continues, the period of the GRZSM data would be gradually secured, and it is expected that further in-depth analysis of hydroclimatic conditions can be carried out in the future.
6.2. Extension of Calibration Data Period
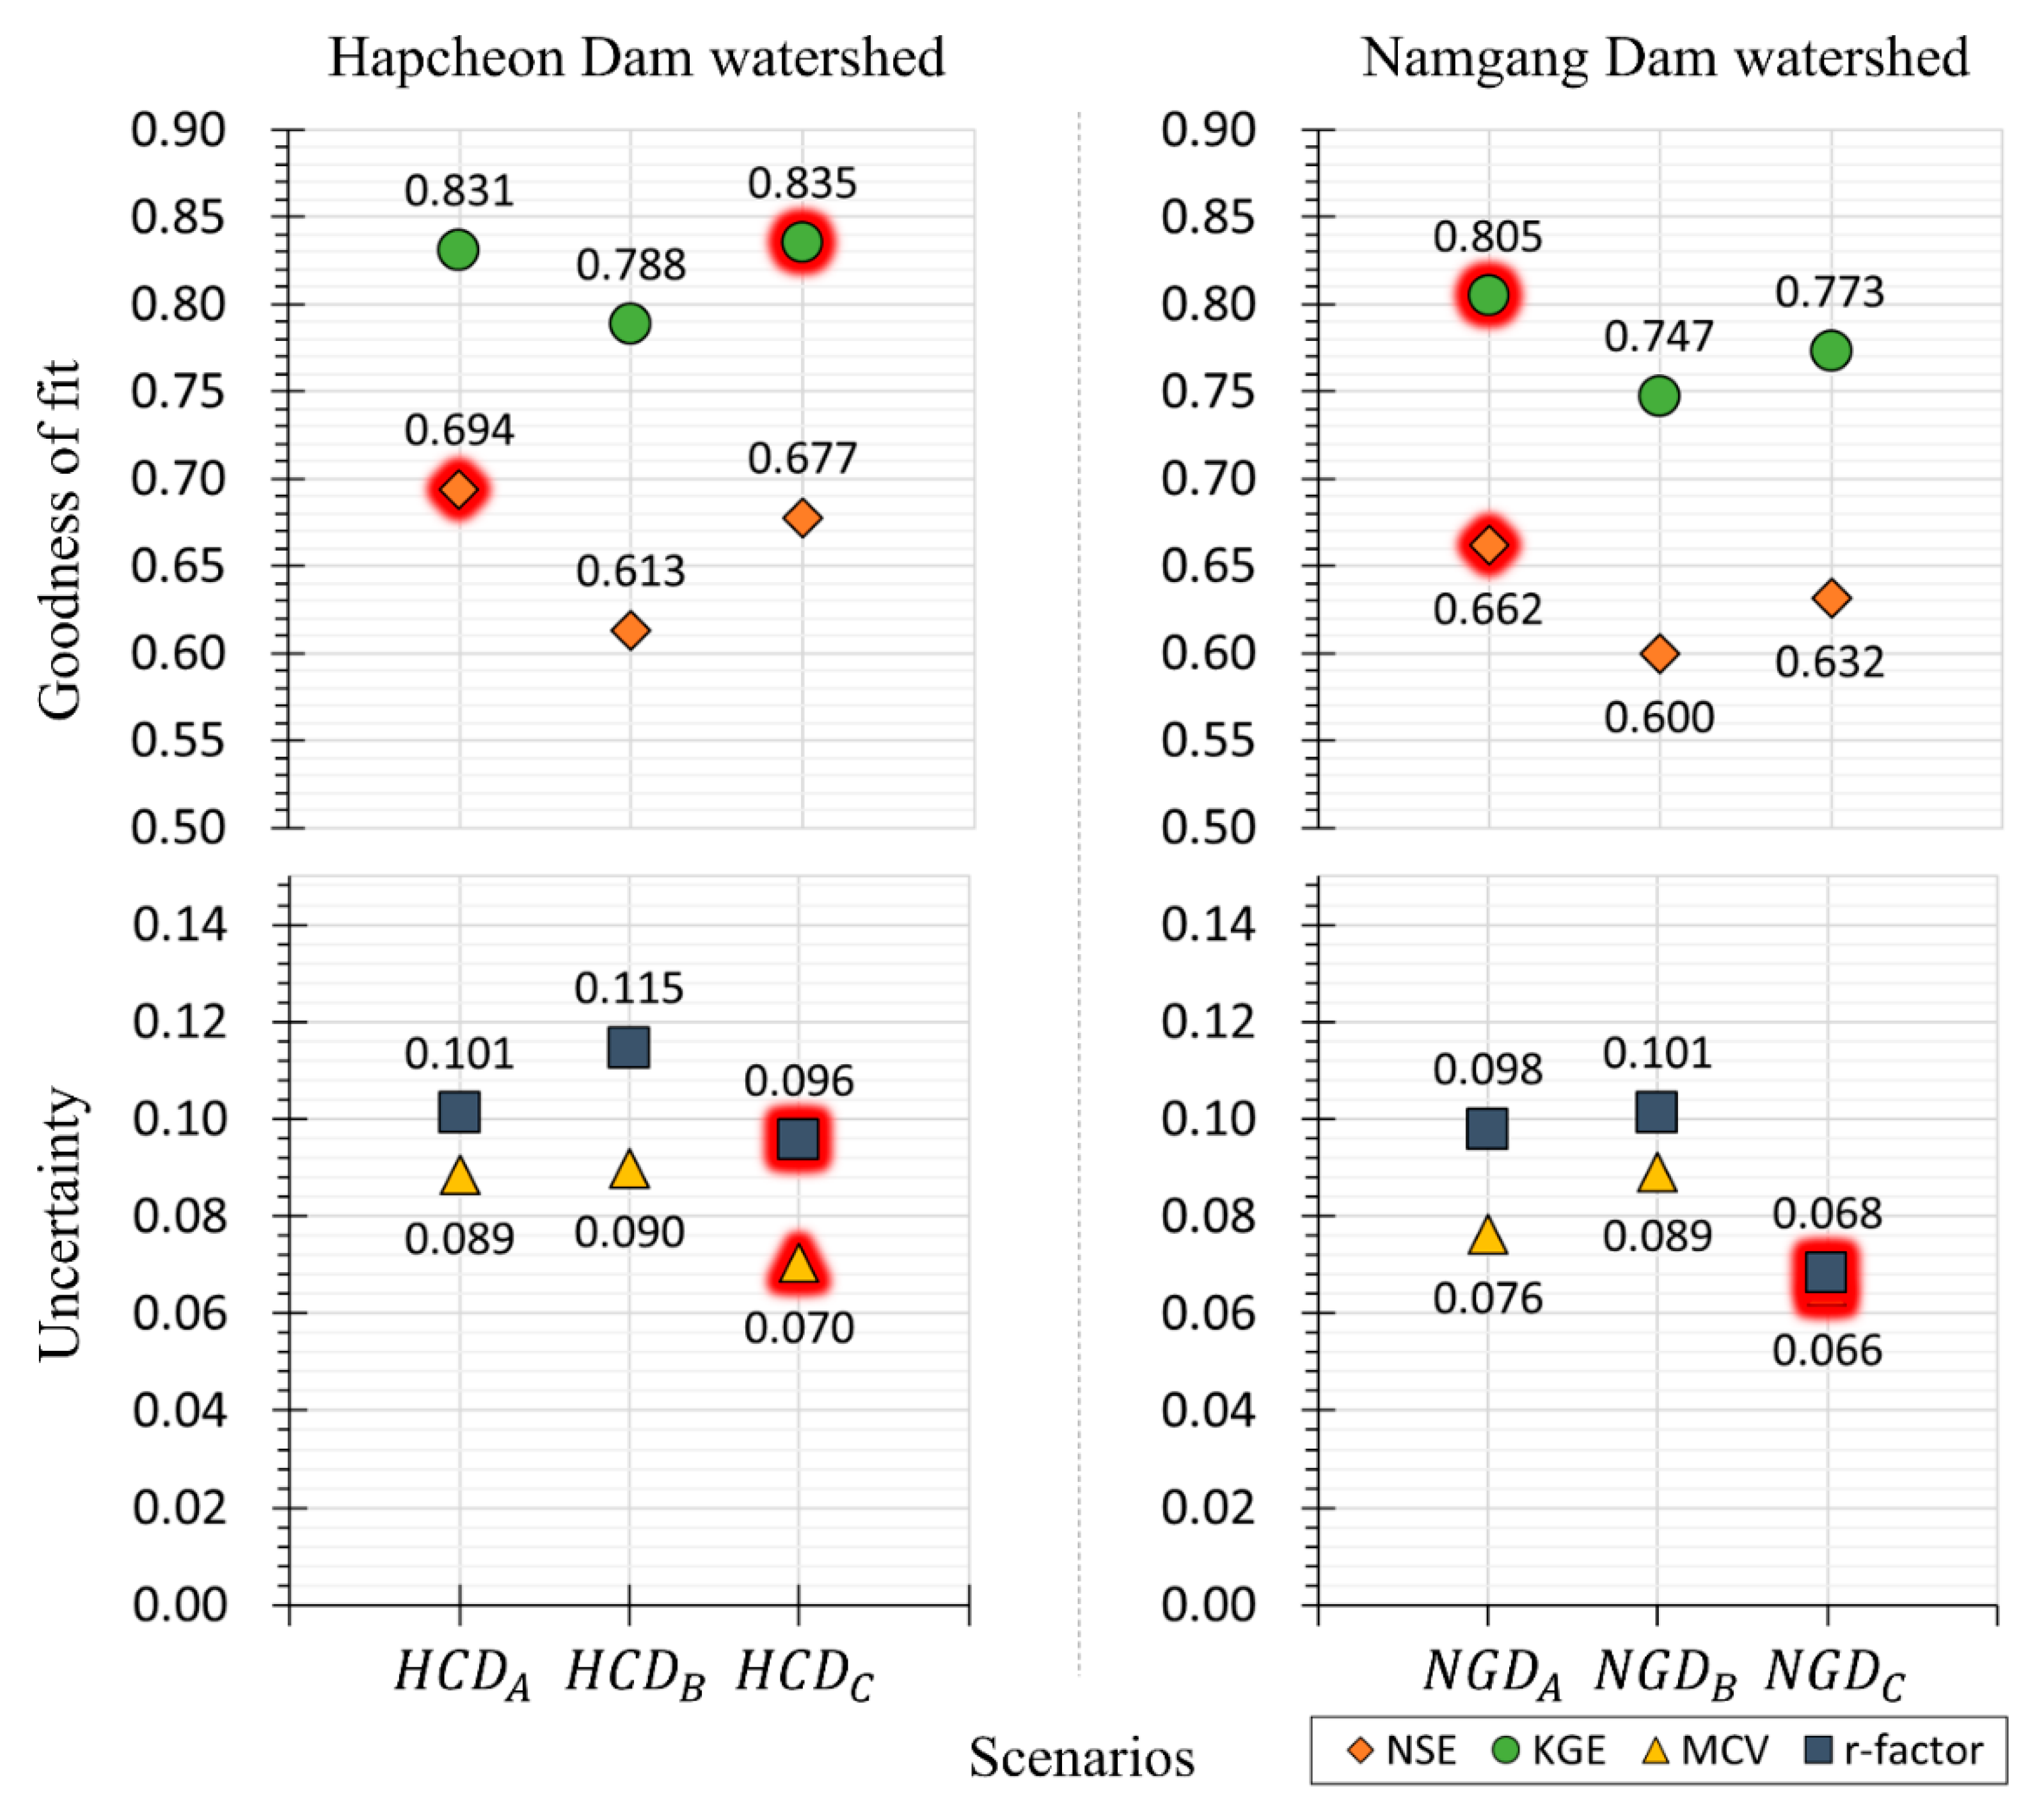
The period of data used to calibrate models is a key factor in estimating parameters that reflect the various watershed characteristics and reducing uncertainty. Therefore, it is necessary to investigate whether the extension of the GRZSM data will improve model performance. In this section, further calibrations (scenario C) were carried out using all available soil moisture records (2016–2019; period C). The scenario C calibrated using the HCD and NGD watersheds’ data for period C were named and , respectively. The scenario C is compared for each watershed with scenario A ( and ) calibrated for period A (2016–2017) and scenario B ( and ) calibrated for period B (2018–2019). The goodness-of-fit and uncertainty performance metrics of stream flow simulated using the parameter set estimated for each scenario were calculated for the same validation period (2012–2015) (see Figure 8).
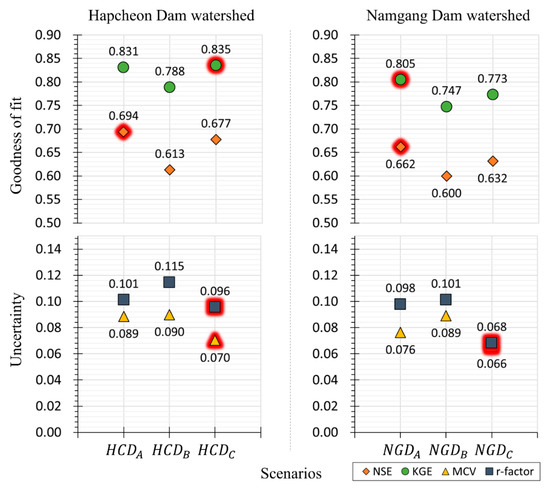
Figure 8.
Goodness-of-fit (NSE and KGE) and uncertainty (MCV and r-factor) of daily stream flow simulated by each calibration scenarios for validation period (2012–2015). A highlighted symbol indicates the scenario that show best performance for each metric.
Scenario C’s goodness-of-fit performance metrics for the validation period show approximately 3–11% improvement compared to scenario B. However, the metrics in scenario C are about 2–5% lower than those in scenario A except for KGE in . In fact, KGE of has almost the same value as KGE of . These results indicate that the calibration period’s hydroclimatic conditions are more important in terms of the model’s goodness-of-fit performance than the data periods applied for calibration. The scenario C consists of mixed hydroclimatic conditions, with both soil moisture data in dry and wet years. Compared to scenario A, scenario C increased the data period used for calibration to 4 years, but scenario C did not show better fitting performance than scenario A based on 2 years of data (dry hydroclimatic conditions). This fact suggests that the reason scenario C exhibits better fitting performance than scenario B is not simply because the data period applied to the calibration has increased. A more appropriate inference should be sought from the fact that as the data period increased, drier hydroclimatic conditions were included in the calibration period.
On the other hand, it can be found that as the data period increases, the uncertainty of the model output improves. Compared to scenarios A and B, MCV and r-factor in scenario C show the smallest values. Scenario C represents an improvement of MCV by about 14–26% and an improvement of r-factor by about 6–36% over other scenarios. These results mean that if soil moisture data are available for a sufficient period, it is more likely to improve the model output’s reliability.
The effects of the data period for calibration on the calibration and validation of hydrological models have been studied by numerous hydrologists but have not been converged with generalized results [8,10,135,136]. However, it is reported that the increase in the calibration data period does not necessarily lead to better model performance [137]. On the other hand, Zeng et al. [138] confirmed that an increase in the calibration data period could lead to less uncertainty in model outputs. Motavita et al. [26] suggested that hydroclimatic conditions tend to affect the model’s fitness more than the data period used for calibration. In addition, they pointed out that the use of calibration data for a relatively long period reduced the variance of the predicted values, resulting in low uncertainty, but could also result in biased errors. The results in this section show that calibrations based on the GRZSM data have a similar tendency to previous studies. However, since this study only used soil moisture data for a maximum of 4 years for two watersheds, it is also true that there is a limit to the degree to which these results can be generalized. It is necessary that various applications on watersheds with more diverse scales, hydroclimatic conditions, and characteristics are carried out using longer soil moisture data, to derive a generalized conclusion about calibration based on soil moisture data.
6.3. Flow Duration Curves
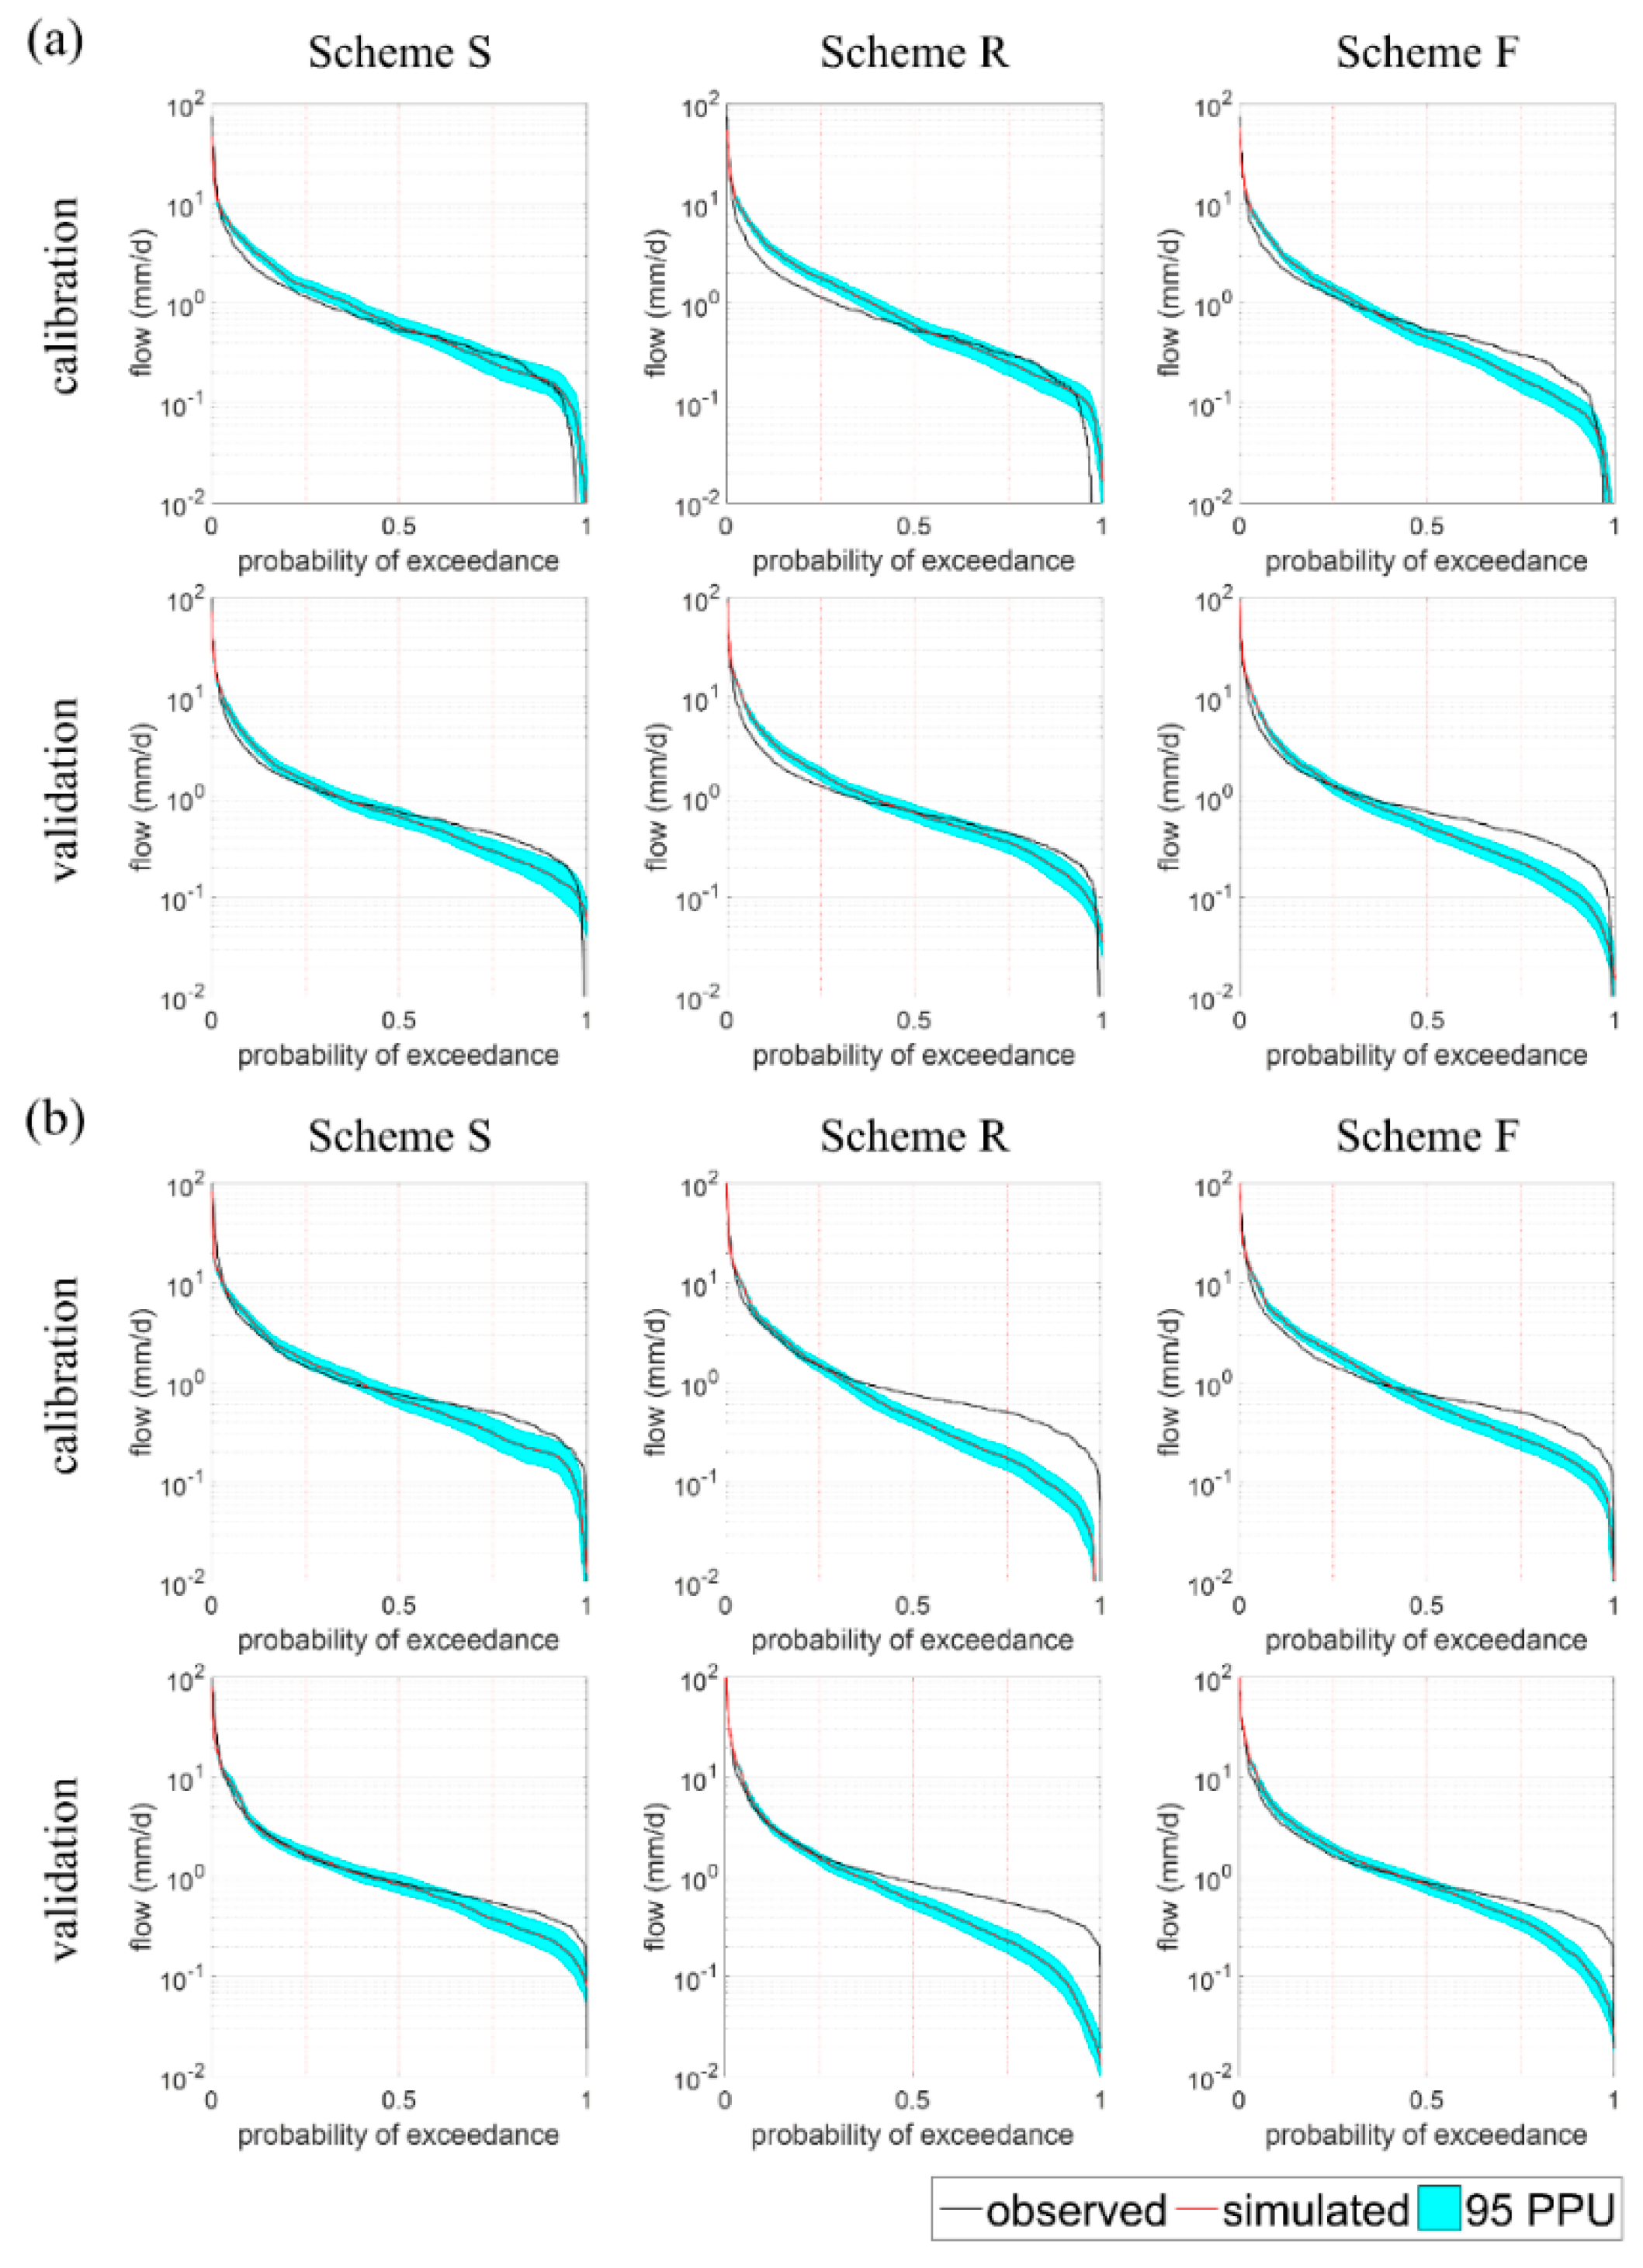
The flow duration curve (FDC) is one of the important indicators of the functioning of hydrological cycle processes in a watershed. Therefore, we strengthened our analysis by FDC. Figure 9 shows FDCs derived from daily stream flow simulated by schemes S, R, and F.
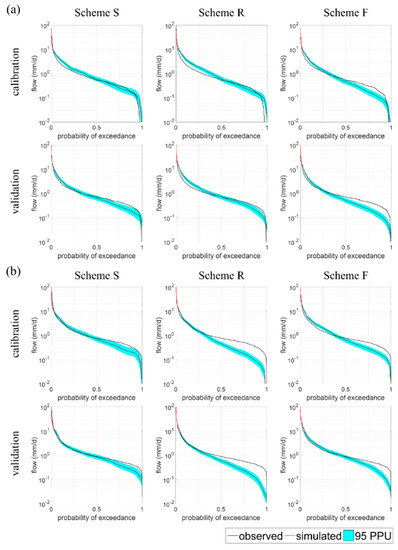
Figure 9.
Flow duration curves during the calibration period (2016–2019) and validation period (2012–2015) for (a) Hapcheon Dam watershed and (b) Namgang Dam watershed.
Although the FDCs simulated by schemes are different from the observed FDC, the comparison between the FDC for each scheme pointed out the superiority of scheme S. The high flow part of FDC by Scheme F for the calibration period is relatively close to the observed FDC, but the low flow part is not. These differences are more pronounced in the FDCs for the validation period. The primary cause of discrepancies in the low flow part is that scheme F gives greater weight to high flows’ goodness-of-fit, but the fundamental limitations of the relatively simple lumped model are also one of the important causes. The scheme R uses the parameters estimated by scheme F in the nearby gauged watershed, so it shows FDCs similar to the characteristics of scheme F. The good reproducibility of the FDC in the HCD watershed does not appear in the NGD watershed. It means that the robustness of the traditional regionalization approach is not excellent. The advantage of scheme S is that it performs better in low flows rather than in high flows. The FDC for the validation period using scheme S also shows relatively better results in the low flow part compared to other schemes.
These results explain why KGE of scheme S is the best at the monthly scale where errors in low flow parts are accumulated, although the daily NSE of scheme S is relatively low (see Figure 4 and Figure 5). The low flow predictive performance of hydrological models is critical for establishing water resource plans to maintain a healthy ecosystem of watersheds [139]. In general, hydrological models can reasonably well simulate middle and high flows, but accurate prediction of low flow remains a significant challenge [140]. Our results show the relative advantages of the calibration scheme using the GRZSM data, and say that there is great potential as a method for improving the low flow predictive performance of the model.
6.4. Limitations and Further Research Directions
We investigated the simulation performance of stream flow in ungauged basins using the calibration scheme using the reproduced global soil moisture data based on observations by satellite. In this study, the watersheds’ spatially averaged parameters were applied since a lumped model was used. The application of a lumped model cannot utilize information on spatial heterogeneity held by pixel-based global soil moisture data (L4_SM). A watershed has a wide variety of characteristics spatially. Thus, the advantages of L4_SM data could be more clearly investigated in applying a distribution model.
Furthermore, the bias-correction of satellite data is still a challenge. In this study, the bias of SMAP L4_SM data for the ungauged watershed was corrected using the soil moisture information derived from the model calibrated by the observed stream flow in the nearby gauged watershed. Comparisons between schemes S and R showed the relative advantages of soil moisture data; however, the bias-correction will inevitably include many errors if a gauged watershed adjacent to a study basin does not exist or the gauged basin’s hydrological characteristics are significantly different. That is, it can be said that the regionalization of soil moisture data (i.e., scheme S via bias correction) has the same limitations as the traditional parameter regionalization based on scheme F. Since this study investigates only the two adjacent watersheds with the most similar physical and climatic characteristics, there is a need to extend the application to more diverse watersheds. Additionally, in order to solve the limitations of the bias correction method, it is necessary to devise additional bias correction methods through connection with other hydrometeorological data that can be used in ungauged basins.
The SMAP L4_SM product provides not only the root zone soil moisture data used in this study, but also surface layer soil moisture data. In addition, one can obtain soil moisture data sets observed (or calculated) for various soil depths from various satellites. Therefore, it will be a good research topic to analyze the sensitivity to the type of soil moisture product group or the depth of soil at which soil moisture is observed using a model suitable for the use of these data in the future.
As mentioned in Section 6.1, in watersheds where evapotranspiration process dominates, the correct estimation of evapotranspiration-related parameters greatly influences the performance of models. Soil moisture is a hydrological component closely related to the evapotranspiration process, and its usefulness was confirmed in this study. This means that direct use of information on actual evapotranspiration can be useful for calibration of hydrological models. Although the calibration scheme E using the actual evapotranspiration data estimated by GCR from meteorological data exposed high uncertainty, the fitness performance for the monthly scale stream flow was not so bad (see Figure 6). The relatively low temporal resolution of the actual evapotranspiration time series used for calibration made high uncertainty in the predicted stream flow, but it is encouraging that it still showed relatively good predictive performance. These results suggest that the acquisition and application of actual evapotranspiration data with more detailed temporal and spatial resolution will lead to significant improvement in the calibration of hydrological models at ungauged basins. This is also the reason why the use of actual evapotranspiration data remotely sensed by satellites is strongly recommended for calibration of hydrological models. Recently, Zhang et al. [32] and Huang et al. [122] have confirmed the possibility of calibrating hydrological models solely using satellite-based evapotranspiration data. In addition, several studies have confirmed that hydrologic model calibration using various types of satellite-based data helps improve the performance of hydrologic models [36,81,89,94,141,142]. Hence, the technique of calibrating a hydrological model in a watershed where stream flow is not measured by using various hydrological variables including the actual evapotranspiration based on satellites will be a very promising research topic in the future.
7. Conclusions
In this study, the goodness-of-fit and uncertainty of model outputs, calibrated by applying various schemes, were assessed to confirm the applicability of the global root zone soil moisture data based on satellite observation as calibrating a hydrologic model in ungauged basins. The goodness-of-fit and uncertainty performance of stream flow simulated by the calibration scheme using soil moisture data was much better than those by the calibration schemes using surface flow data or actual evapotranspiration data, which could be obtained indirectly from the ungauged basins. In addition, when compared to the traditional regionalization scheme using a parameter set of adjacent gauged watersheds, the calibration scheme using soil moisture, conservatively speaking, could achieve similar performance. The calibration scheme using soil moisture was significantly superior in predicting low flows. From the fact that the reliability of stream flows simulated from the model calibrated using soil moisture is higher than that of the model simulated by the traditional regionalization approach, it could be recognized that the calibration scheme using soil moisture data has great potential. These results will be direct evidence showing that the use of global soil moisture data to predict stream flow in ungauged basins is promising.
Furthermore, the calibration scheme using soil moisture was more sensitive to the hydroclimatic conditions of the data used for calibration than to the period of data used for calibration. The results of this study showed that it was more desirable to perform the calibration of the hydrological model using soil moisture data in the years with dry hydroclimatic conditions. However, considering the fact that the available period of the soil moisture data used in this study are not sufficient, various complementary studies will be needed to argue the certainty of these results.
Supplementary Materials
The following are available online at https://www.mdpi.com/2072-4292/13/4/756/s1, Figure S1: Schematic diagram of lumped hydrological model. is precipitation; is reference evapotranspiration; is evaporation at impervious area; is evapotranspiration at pervious area; is evapotranspiration in soil layer; and is surface flow at impervious area and at pervious area respectively; is wetting (or infiltration) from surface layer to soil layer; is percolation from soil layer to aquifer layer; and is subsurface flow, Figure S2: Results of bias-correction for global root zone soil moisture (GRZSM) based on remotely sensed data. In Figure S2a, and is spatially averaged GRZSM time series for Hapcheon dam and Namgang dam watersheds, respectively, and is soil moisture time series simulated by the model calibrated using observed stream flow data. In Figure S2b, and is the cumulative probability distribution of GRZSM time series in Hapcheon dam and Namgang dam watershed, respectively, and is the cumulative probability distribution of soil moisture time series simulated by the model using observed stream flow data. Figure S2c shows the probability distribution of raw GRZSM data (f) and the probability distribution of bias-corrected GRZSM data (f) for Hapcheon dam watershed, Figure S3: Monthly surface flow estimated by using NRCS-CN method and observed monthly stream flow at Hapchen Dam watershed (red color) and at Namgang Dam watershed (blue color), Figure S4: Monthly and annual actual evapotranspiration estimated by using GCR (blue color) and observed (black color) at Hapchen Dam watershed and at Namgang Dam watershed, Figure S5: Standard deviations of parameter ensemble for calibration schemes at the application of (a) , (b) , (c) , and (d) , Table S1: Percent of impervious area for land use, Table S2: Saturated hydraulic conductivity () for hydrologic soil group by NRCS, Table S3: 5-day antecedent rainfall depth for antecedent soil moisture condition (AMC) adjustment.
Author Contributions
Conceptualization, J.C. and S.K.; formal analysis, J.C., J.W. and O.L.; investigation, J.C., J.W. and O.L.; methodology, J.C. and S.K.; project administration, S.K.; software, J.C.; supervision, S.K.; validation, J.C., J.W. and O.L.; visualization, J.C., J.W. and O.L.; writing—original draft preparation, J.C.; writing—review and editing, S.K. All authors have read and agreed to the published version of the manuscript.
Funding
This research was funded by the National Research Foundation of Korea grant number NRF-2019R1A2C1003114 and NRF-2020R1A6A3A13073504.
Data Availability Statement
Data available on request.
Acknowledgments
This work was supported by the National Research Foundation of Korea (NRF) grants funded by the Korea government (MSIT) (No. NRF-2019R1A2C1003114 and NRF-2020R1A6A3A13073504).
Conflicts of Interest
The authors declare that they have no known competing financial interests or personal relationships that could have appeared to influence the work reported in this paper.
References
- Lee, A.; Cho, S.; Park, M.J.; Kim, S. Determination of standard target water quality in the Nakdong River basin for the total maximum daily load management system in Korea. KSCE J. Civ. Eng. 2013, 17, 309–319. [Google Scholar] [CrossRef]
- Kannan, N.; White, S.; Worrall, F.; Whelan, M. Sensitivity analysis and identification of the best evapotranspiration and runoff options for hydrological modelling in SWAT-2000. J. Hydrol. 2007, 332, 456–466. [Google Scholar] [CrossRef]
- Lee, A.; Cho, S.; Kang, D.K.; Kim, S. Analysis of the effect of climate change on the Nakdong river stream flow using indicators of hydrological alteration. J. Hydro-Environ. Res. 2014, 8, 234–247. [Google Scholar] [CrossRef]
- Emerton, R.E.; Stephens, E.M.; Pappenberger, F.; Pagano, T.C.; Weerts, A.H.; Wood, A.W.; Salamon, P.; Brown, J.D.; Hjerdt, N.; Donnelly, C.; et al. Continental and global scale flood forecasting systems. Wiley Interdiscip. Rev. Water 2016, 3, 391–418. [Google Scholar] [CrossRef]
- Pagano, T.C.; Pappenberger, F.; Wood, A.W.; Ramos, M.-H.; Persson, A.; Anderson, B. Automation and human expertise in operational river forecasting. Wiley Interdiscip. Rev. Water 2016, 3, 692–705. [Google Scholar] [CrossRef]
- Sorooshian, S.; Gupta, V.K.; Fulton, J.L. Evaluation of Maximum Likelihood Parameter estimation techniques for conceptual rainfall-runoff models: Influence of calibration data variability and length on model credibility. Water Resour. Res. 1983, 19, 251–259. [Google Scholar] [CrossRef]
- Harlin, J. Development of a Process Oriented Calibration Scheme for the HBV Hydrological Model. Hydrol. Res. 1991, 22, 15–36. [Google Scholar] [CrossRef]
- Yapo, P.O.; Gupta, H.V.; Sorooshian, S. Automatic calibration of conceptual rainfall-runoff models: Sensitivity to calibration data. J. Hydrol. 1996, 181, 23–48. [Google Scholar] [CrossRef]
- Brath, A.; Montanari, A.; Toth, E. Analysis of the effects of different scenarios of historical data availability on the calibration of a spatially-distributed hydrological model. J. Hydrol. 2004, 291, 232–253. [Google Scholar] [CrossRef]
- Anctil, F.; Perrin, C.; Andréassian, V. Impact of the length of observed records on the performance of ANN and of conceptual parsimonious rainfall-runoff forecasting models. Environ. Model. Softw. 2004, 19, 357–368. [Google Scholar] [CrossRef]
- Vrugt, J.A.; Gupta, H.V.; Dekker, S.C.; Sorooshian, S.; Wagener, T.; Bouten, W. Application of stochastic parameter optimization to the Sacramento Soil Moisture Accounting model. J. Hydrol. 2006, 325, 288–307. [Google Scholar] [CrossRef]
- Lee, J.; Kim, U.; Kim, L.-H.; Kim, E.S.; Kim, S. Management of organic matter in watersheds with insufficient observation data: The Nakdong River basin. Desalination Water Treat. 2019, 152, 44–57. [Google Scholar] [CrossRef]
- Seibert, J.; McDonnell, J.J. On the dialog between experimentalist and modeler in catchment hydrology: Use of soft data for multicriteria model calibration. Water Resour. Res. 2002, 38, 23. [Google Scholar] [CrossRef]
- Feyen, L.; Kalas, M.; Vrugt, J.A. Semi-distributed parameter optimization and uncertainty assessment for large-scale streamflow simulation using global optimization/Optimisation de paramètres semi-distribués et évaluation de l’incertitude pour la simulation de débits à grande échelle par l’utilisation d’une optimisation globale. Hydrol. Sci. J. 2008, 53, 293–308. [Google Scholar] [CrossRef]
- Merz, R.; Parajka, J.; Blöschl, G. Scale effects in conceptual hydrological modeling. Water Resour. Res. 2009, 45, 09405. [Google Scholar] [CrossRef]
- Smith, M.B.; Koren, V.; Reed, S.; Zhang, Z.; Zhang, Y.; Moreda, F.; Cui, Z.; Mizukami, N.; Anderson, E.A.; Cosgrove, B.A. The distributed model intercomparison project—Phase 2: Motivation and design of the Oklahoma experiments. J. Hydrol. 2012, 2012, 3–16. [Google Scholar] [CrossRef]
- Liang, S.; Jia, H.; Xu, C.; Xu, T.; Melching, C.S. A Bayesian approach for evaluation of the effect of water quality model parameter uncertainty on TMDLs: A case study of Miyun Reservoir. Sci. Total. Environ. 2016, 44–54. [Google Scholar] [CrossRef] [PubMed]
- Jia, H.; Xu, T.; Liang, S.; Zhao, P.; Xu, C. Bayesian framework of parameter sensitivity, uncertainty, and identifiability analysis in complex water quality models. Environ. Model. Softw. 2018, 104, 13–26. [Google Scholar] [CrossRef]
- Michaud, J.; Sorooshian, S. Comparison of simple versus complex distributed runoff models on a midsized semiarid watershed. Water Resour. Res. 1994, 30, 593–605. [Google Scholar] [CrossRef]
- Reed, S.; Koren, V.; Smith, M.; Zhang, Z.; Moreda, F.; Seo, D.-J.; Participants, A.D. Overall distributed model intercomparison project results. J. Hydrol. 2004, 298, 27–60. [Google Scholar] [CrossRef]
- Stisen, S.; McCabe, M.F.; Refsgaard, J.C.; Lerer, S.; Butts, M.B. Model parameter analysis using remotely sensed pattern information in a multi-constraint framework. J. Hydrol. 2011, 409, 337–349. [Google Scholar] [CrossRef]
- Conradt, T.; Wechsung, F.; Bronstert, A. Three perceptions of the evapotranspiration landscape: Comparing spatial patterns from a distributed hydrological model, remotely sensed surface temperatures, and sub-basin water balances. Hydrol. Earth Syst. Sci. 2013, 17, 2947–2966. [Google Scholar] [CrossRef]
- Smith, M.; Koren, V.; Zhang, Z.; Moreda, F.; Cui, Z.; Cosgrove, B.; Mizukami, N.; Kitzmiller, D.; Ding, F.; Reed, S.; et al. The distributed model intercomparison project—Phase 2: Experiment design and summary results of the western basin experiments. J. Hydrol. 2013, 507, 300–329. [Google Scholar] [CrossRef]
- Koch, J.; Cornelissen, T.; Fang, Z.; Bogena, H.; Diekkrüger, B.; Kollet, S.; Stisen, S. Inter-comparison of three distributed hydrological models with respect to seasonal variability of soil moisture patterns at a small forested catchment. J. Hydrol. 2016, 533, 234–249. [Google Scholar] [CrossRef]
- Wi, S.; Yang, Y.C.E.; Steinschneider, S.; Khalil, A.; Brown, C.M. Calibration approaches for distributed hydrologic models in poorly gaged basins: Implication for streamflow projections under climate change. Hydrol. Earth Syst. Sci. 2015, 19, 857–876. [Google Scholar] [CrossRef]
- Motavita, D.; Chow, R.; Guthke, A.; Nowak, W. The comprehensive differential split-sample test: A stress-test for hydrological model robustness under climate variability. J. Hydrol. 2019, 573, 501–515. [Google Scholar] [CrossRef]
- Sivapalan, M.; Takeuchi, K.; Franks, S.W.; Gupta, V.K.; Karambiri, H.; Lakshmi, V.; Liang, X.; McDonnell, J.J.; Mendiondo, E.M.; O’Connell, P.E.; et al. IAHS Decade on Predictions in Ungauged Basins (PUB), 2003–2012: Shaping an exciting future for the hydrological sciences. Hydrol. Sci. J. 2003, 48, 857–880. [Google Scholar] [CrossRef]
- Seibert, J.; Beven, K.J. Gauging the ungauged basin: How many discharge measurements are needed? Hydrol. Earth Syst. Sci. 2009, 13, 883–892. [Google Scholar] [CrossRef]
- Li, Y.; Grimaldi, S.; Pauwels, V.R.N.; Walker, J.P. Hydrologic model calibration using remotely sensed soil moisture and discharge measurements: The impact on predictions at gauged and ungauged locations. J. Hydrol. 2018, 557, 897–909. [Google Scholar] [CrossRef]
- Hrachowitz, M.; Savenije, H.H.G.; Blöschl, G.; McDonnell, J.J.; Sivapalan, M.; Pomeroy, J.W.; Arheimer, B.; Blume, T.; Clark, M.P.; Ehret, U.; et al. A decade of Predictions in Ungauged Basins (PUB)—A review. Hydrol. Sci. J. 2013, 58, 1198–1255. [Google Scholar] [CrossRef]
- Lee, O.; Choi, J.; Sim, I.; Won, J.; Kim, S. Stochastic Parsimonious Hydrologic Partitioning Model under East Asia Monsoon Climate and Its Application to Climate Change. Water 2019, 12, 25. [Google Scholar] [CrossRef]
- Zhang, Y.; Chiew, F.H.S.; Liu, C.; Tang, Q.; Xia, J.; Tian, J.; Kong, D.; Li, C. Can Remotely Sensed Actual Evapotranspiration Facilitate Hydrological Prediction in Ungauged Regions Without Runoff Calibration? Water Resour. Res. 2020, 56. [Google Scholar] [CrossRef]
- Li, H.; Zhang, Y. Regionalising rainfall-runoff modelling for predicting daily runoff: Comparing gridded spatial proximity and gridded integrated similarity approaches against their lumped counterparts. J. Hydrol. 2017, 550, 279–293. [Google Scholar] [CrossRef]
- Yang, Y.; Shang, S.; Jiang, L. Remote sensing temporal and spatial patterns of evapotranspiration and the responses to water management in a large irrigation district of North China. Agric. Meteorol. 2012, 164, 112–122. [Google Scholar] [CrossRef]
- Grimaldi, S.; Li, Y.; Pauwels, V.R.N.; Walker, J.P. Remote Sensing-Derived Water Extent and Level to Constrain Hydraulic Flood Forecasting Models: Opportunities and Challenges. Surv. Geophys. 2016, 37, 977–1034. [Google Scholar] [CrossRef]
- Li, Y.; Grimaldi, S.; Walker, J.P.; Pauwels, V.R.N. Application of Remote Sensing Data to Constrain Operational Rainfall-Driven Flood Forecasting: A Review. Remote Sens. 2016, 8, 456. [Google Scholar] [CrossRef]
- Joyce, R.J.; Janowiak, J.E.; Arkin, P.A.; Xie, P. CMORPH: A method that produces global precipitation estimates from passive microwave and infrared data at high spatial and temporal resolution. J. Hydrometeorol. 2004, 5, 487–503. [Google Scholar] [CrossRef]
- Huffman, G.J.; Bolvin, D.T.; Nelkin, E.J.; Wolff, D.B.; Adler, R.F.; Gu, G.; Hong, Y.; Bowman, K.P.; Stocker, E.F. The TRMM Multisatellite Precipitation Analysis (TMPA): Quasi-Global, Multiyear, Combined-Sensor Precipitation Estimates at Fine Scales. J. Hydrometeorol. 2007, 8, 38–55. [Google Scholar] [CrossRef]
- Njoku, E.; Jackson, T.J.; Lakshmi, V.; Chan, T.; Nghiem, S. Soil moisture retrieval from AMSR-E. IEEE Trans. Geosci. Remote Sens. 2003, 41, 215–229. [Google Scholar] [CrossRef]
- Dorigo, W.A.; Gruber, A.; De Jeu, R.A.M.; Wagner, W.; Stacke, T.; Loew, A.; Albergel, C.; Brocca, L.; Chung, D.; Parinussa, R.M.; et al. Evaluation of the ESA CCI soil moisture product using ground-based observations. Remote Sens. Environ. 2015, 162, 380–395. [Google Scholar] [CrossRef]
- Tapley, B.D.; Bettadpur, S.; Watkins, M.; Reigber, C. The gravity recovery and climate experiment: Mission overview and early results. Geophys. Res. Lett. 2004, 31. [Google Scholar] [CrossRef]
- Bastiaanssen, W.; Menenti, M.; Feddes, R.; Holtslag, A. A remote sensing surface energy balance algorithm for land (SEBAL). 1. Formulation. J. Hydrol. 1998, 212, 198–212. [Google Scholar] [CrossRef]
- Miralles, D.G.; Holmes, T.R.H.; De Jeu, R.A.M.; Gash, J.H.; Meesters, A.G.C.A.; Dolman, A.J. Global land-surface evaporation estimated from satellite-based observations. Hydrol. Earth Syst. Sci. 2011, 15, 453–469. [Google Scholar] [CrossRef]
- Campo, L.; Caparrini, F.; Castelli, F. Use of multi-platform, multi-temporal remote-sensing data for calibration of a distributed hydrological model: An application in the Arno basin, Italy. Hydrol. Process. 2006, 20, 2693–2712. [Google Scholar] [CrossRef]
- Immerzeel, W.; Droogers, P. Calibration of a distributed hydrological model based on satellite evapotranspiration. J. Hydrol. 2008, 349, 411–424. [Google Scholar] [CrossRef]
- Winsemius, H.H.C.; Schaefli, B.; Montanari, A.; Savenije, H.H.G. On the calibration of hydrological models in ungauged basins: A framework for integrating hard and soft hydrological information. Water Resour. Res. 2009, 45. [Google Scholar] [CrossRef]
- Lo, M.-H.; Famiglietti, J.S.; Yeh, P.J.-F.; Syed, T.H. Improving parameter estimation and water table depth simulation in a land surface model using GRACE water storage and estimated base flow data. Water Resour. Res. 2010, 46, 05517. [Google Scholar] [CrossRef]
- Khan, S.I.; Hong, Y.; Wang, J.; Yilmaz, K.K.; Yong, B.; Adler, R.F.; Brakenridge, G.R.; Policelli, F.; Habib, S.; Irwin, D. Satellite Remote Sensing and Hydrologic Modeling for Flood Inundation Mapping in Lake Victoria Basin: Implications for Hydrologic Prediction in Ungauged Basins. IEEE Trans. Geosci. Remote Sens. 2011, 49, 85–95. [Google Scholar] [CrossRef]
- Khan, S.I.; Hong, Y.; Vergara, H.J.; Gourley, J.J.; Brakenridge, G.R.; De Groeve, T.; Flamig, Z.L.; Policelli, F.; Yong, B. Microwave Satellite Data for Hydrologic Modeling in Ungauged Basins. IEEE Geosci. Remote Sens. Lett. 2012, 9, 663–667. [Google Scholar] [CrossRef]
- Sun, W.; Ishidaira, H.; Bastola, S. Calibration of hydrological models in ungauged basins based on satellite radar altimetry observations of river water level. Hydrol. Process. 2012, 26, 3524–3537. [Google Scholar] [CrossRef]
- Sun, W.; Ishidaira, H.; Bastola, S.; Yu, J. Estimating daily time series of streamflow using hydrological model calibrated based on satellite observations of river water surface width: Toward real world applications. Environ. Res. 2015, 139, 36–45. [Google Scholar] [CrossRef] [PubMed]
- Gao, Z.; Long, D.; Tang, G.; Zeng, C.; Huang, J.; Hong, Y. Assessing the potential of satellite-based precipitation estimates for flood frequency analysis in ungauged or poorly gauged tributaries of China’s Yangtze River basin. J. Hydrol. 2017, 550, 478–496. [Google Scholar] [CrossRef]
- Skinner, C.J.; Bellerby, T.J.; Greatrex, H.; Grimes, D.I.; Skinner, C.J.; Bellerby, J.T.; Grimes, I.D. Hydrological modelling using ensemble satellite rainfall estimates in a sparsely gauged river basin: The need for whole-ensemble calibration. J. Hydrol. 2015, 522, 110–122. [Google Scholar] [CrossRef]
- Ashouri, H.; Nguyen, P.; Thorstensen, A.; Hsu, K.-L.; Sorooshian, S.; Braithwaite, D. Assessing the Efficacy of High-Resolution Satellite-Based PERSIANN-CDR Precipitation Product in Simulating Streamflow. J. Hydrometeorol. 2016, 17, 2061–2076. [Google Scholar] [CrossRef]
- Zubieta, R.; Getirana, A.; Espinoza, J.C.; Lavado-Casimiro, W.; Aragon, L. Hydrological modeling of the Peruvian–Ecuadorian Amazon Basin using GPM-IMERG satellite-based precipitation dataset. Hydrol. Earth Syst. Sci. 2017, 21, 3543–3555. [Google Scholar] [CrossRef]
- Falck, A.S.; Maggioni, V.; Tomasella, J.; Diniz, F.L.R.; Mei, Y.; Beneti, C.; Herdies, D.L.; Neundorf, R.; Caram, R.; Rodriguez, D. Improving the use of ground-based radar rainfall data for monitoring and predicting floods in the Iguaçu river basin. J. Hydrol. 2018, 567, 626–636. [Google Scholar] [CrossRef]
- Deng, P.; Zhang, M.; Bing, J.; Jia, J.; Zhang, D. Evaluation of the GSMaP_Gauge products using rain gauge observations and SWAT model in the Upper Hanjiang River Basin. Atmos. Res. 2019, 219, 153–165. [Google Scholar] [CrossRef]
- Su, J.; Lü, H.; Zhu, Y.; Cui, Y.; Wang, X. Evaluating the hydrological utility of latest IMERG products over the Upper Huaihe River Basin, China. Atmos. Res. 2019, 225, 17–29. [Google Scholar] [CrossRef]
- Winsemius, H.C.; Savenije, H.H.G.; Bastiaanssen, W.G.M. Constraining model parameters on remotely sensed evaporation: Justification for distribution in ungauged basins? Hydrol. Earth Syst. Sci. 2008, 12, 1403–1413. [Google Scholar] [CrossRef]
- Zhang, Y.; Chiew, F.H.S. Relative merits of different methods for runoff predictions in ungauged catchments. Water Resour. Res. 2009, 45. [Google Scholar] [CrossRef]
- Zhang, Y.; Viney, N.; Chiew, F.; Van Dijk, A.; Liu, Y. Improving hydrological and vegetation modelling using regional model calibration schemes together with remote sensing data. In Proceedings of the 19th International Congress on Modelling and Simulation MODISM2011, Perth, Australia, 12–16 December 2011. [Google Scholar]
- Brocca, L.; Moramarco, T.; Dorigo, W.A.; Wagner, W. Assimilation of satellite soil moisture data into rainfall-runoff modelling for several catchments worldwide. In Proceedings of the 2013 IEEE International Geoscience and Remote Sensing Symposium—IGARSS, Melbourne, Australia, 21–26 July 2013; pp. 2281–2284. [Google Scholar]
- Rientjes, T.H.M.; Muthuwatta, L.P.; Bos, M.G.; Booij, M.J.; Bhatti, H. Multi-variable calibration of a semi-distributed hydrological model using streamflow data and satellite-based evapotranspiration. J. Hydrol. 2013, 505, 276–290. [Google Scholar] [CrossRef]
- Massari, C.; Brocca, L.; Tarpanelli, A.; Moramarco, T. Data Assimilation of Satellite Soil Moisture into Rainfall-Runoff Modelling: A Complex Recipe? Remote Sens. 2015, 7, 11403–11433. [Google Scholar] [CrossRef]
- Montero, R.A.; Schwanenberg, D.; Krahe, P.; Lisniak, D.; Sensoy, A.; Sorman, A.A.; Akkol, B. Moving horizon estimation for assimilating H-SAF remote sensing data into the HBV hydrological model. Adv. Water Resour. 2016, 92, 248–257. [Google Scholar] [CrossRef]
- Zou, L.; Zhan, C.; Xia, J.; Wang, T.; Gippel, C.J. Implementation of evapotranspiration data assimilation with catchment scale distributed hydrological model via an ensemble Kalman Filter. J. Hydrol. 2017, 549, 685–702. [Google Scholar] [CrossRef]
- Herman, M.R.; Nejadhashemi, A.P.; Abouali, M.; Hernandez-Suarez, J.S.; Daneshvar, F.; Zhang, Z.; Anderson, M.C.; Sadeghi, A.M.; Hain, C.R.; Sharifi, A. Evaluating the role of evapotranspiration remote sensing data in improving hydrological modeling predictability. J. Hydrol. 2018, 556, 39–49. [Google Scholar] [CrossRef]
- Leach, J.M.; Kornelsen, K.C.; Coulibaly, P. Assimilation of near-real time data products into models of an urban basin. J. Hydrol. 2018, 563, 51–64. [Google Scholar] [CrossRef]
- De Michele, C.; Salvadori, G. On the derived flood frequency distribution: Analytical formulation and the influence of antecedent soil moisture condition. J. Hydrol. 2002, 262, 245–258. [Google Scholar] [CrossRef]
- LeGates, D.R.; Mahmood, R.; Levia, D.F.; DeLiberty, T.L.; Quiring, S.M.; Houser, C.; Nelson, F.E. Soil moisture: A central and unifying theme in physical geography. Prog. Phys. Geogr. Earth Environ. 2010, 35, 65–86. [Google Scholar] [CrossRef]
- Kim, S.; Han, S.; Kim, E. Stochastic modelling of soil water and plant water stress using cumulant expansion theory. Ecohydrol. 2011, 4, 94–105. [Google Scholar] [CrossRef]
- Li, Y.; Ryu, D.; Western, A.W.; Wang, Q.J.; Robertson, D.E.; Crow, W.T. An integrated error parameter estimation and lag-aware data assimilation scheme for real-time flood forecasting. J. Hydrol. 2014, 519, 2722–2736. [Google Scholar] [CrossRef]
- Lee, O.; Kim, H.S.; Kim, S. Hydrological simple water balance modeling for increasing geographically isolated doline wetland functions and its application to climate change. Ecol. Eng. 2020, 149, 105812. [Google Scholar] [CrossRef]
- Colliander, A.; Jackson, T.J.; Bindlish, R.; Chan, S.; Das, N.; Kim, S.B.; Cosh, M.H.; Dunbar, R.S.; Dang, L.; Pashaian, L.; et al. Validation of SMAP surface soil moisture products with core validation sites. Remote Sens. Environ. 2017, 191, 215–231. [Google Scholar] [CrossRef]
- Jackson, T.J.; Cosh, M.H.; Bindlish, R.; Starks, P.J.; Bosch, D.D.; Seyfried, M.; Goodrich, D.C.; Moran, M.S.; Du, J. Validation of Advanced Microwave Scanning Radiometer Soil Moisture Products. IEEE Trans. Geosci. Remote Sens. 2010, 48, 4256–4272. [Google Scholar] [CrossRef]
- Zeng, J.; Li, Z.; Chen, Q.; Bi, H.; Qiu, J.; Zou, P. Evaluation of remotely sensed and reanalysis soil moisture products over the Tibetan Plateau using in-situ observations. Remote Sens. Environ. 2015, 163, 91–110. [Google Scholar] [CrossRef]
- Liu, Y.; Weerts, A.H.; Clark, M.P.; Franssen, H.-J.H.; Kumar, S.V.; Moradkhani, H.; Seo, D.-J.; Schwanenberg, D.; Smith, P.; Van Dijk, A.I.J.M.; et al. Advancing data assimilation in operational hydrologic forecasting: Progresses, challenges, and emerging opportunities. Hydrol. Earth Syst. Sci. 2012, 16, 3863–3887. [Google Scholar] [CrossRef]
- Reichle, R.H.; De Lannoy, G.J.M.; Liu, Q.; Ardizzone, J.V.; Colliander, A.; Conaty, A.; Crow, W.; Jackson, T.J.; Jones, L.A.; Kimball, J.S.; et al. Assessment of the SMAP Level-4 Surface and Root-Zone Soil Moisture Product Using In Situ Measurements. J. Hydrometeorol. 2017, 18, 2621–2645. [Google Scholar] [CrossRef]
- Parajka, J.; Naeimi, V.; Blöschl, G.; Wagner, W.; Merz, R.; Scipal, K. Assimilating scatterometer soil moisture data into conceptual hydrologic models at the regional scale. Hydrol. Earth Syst. Sci. 2006, 10, 353–368. [Google Scholar] [CrossRef]
- Parajka, J.; Naeimi, V.; Blöschl, G.; Komma, J. Matching ERS scatterometer based soil moisture patterns with simulations of a conceptual dual layer hydrologic model over Austria. Hydrol. Earth Syst. Sci. 2009, 13, 259–271. [Google Scholar] [CrossRef]
- Wanders, N.; Bierkens, M.F.P.; De Jong, S.M.; De Roo, A.; Karssenberg, D. The benefits of using remotely sensed soil moisture in parameter identification of large-scale hydrological models. Water Resour. Res. 2014, 50, 6874–6891. [Google Scholar] [CrossRef]
- Cenci, L.; Laiolo, P.; Gabellani, S.; Campo, L.; Silvestro, F.; Delogu, F.; Boni, G.; Rudari, R. Assimilation of H-SAF Soil Moisture Products for Flash Flood Early Warning Systems. Case Study: Mediterranean Catchments. IEEE J. Sel. Top. Appl. Earth Obs. Remote Sens. 2016, 9, 5634–5646. [Google Scholar] [CrossRef]
- Yan, H.; Moradkhani, H. Combined assimilation of streamflow and satellite soil moisture with the particle filter and geostatistical modeling. Adv. Water Resour. 2016, 94, 364–378. [Google Scholar] [CrossRef]
- Sawada, Y.; Koike, T. Simultaneous estimation of both hydrological and ecological parameters in an ecohydrological model by assimilating microwave signal. J. Geophys. Res. Atmos. 2014, 119, 8839–8857. [Google Scholar] [CrossRef]
- Sawada, Y.; Koike, T.; Walker, J.P. A land data assimilation system for simultaneous simulation of soil moisture and vegetation dynamics. J. Geophys. Res. Atmos. 2015, 120, 5910–5930. [Google Scholar] [CrossRef]
- Toride, K.; Sawada, Y.; Aida, K.; Koike, T. Aida Toward High-Resolution Soil Moisture Monitoring by Combining Active-Passive Microwave and Optical Vegetation Remote Sensing Products with Land Surface Model. Sensors 2019, 19, 3924. [Google Scholar] [CrossRef]
- Kunnath-Poovakka, A.; Ryu, D.; Renzullo, L.; George, B. The efficacy of calibrating hydrologic model using remotely sensed evapotranspiration and soil moisture for streamflow prediction. J. Hydrol. 2016, 535, 509–524. [Google Scholar] [CrossRef]
- Rajib, M.A.; Merwade, V.; Yu, Z. Multi-objective calibration of a hydrologic model using spatially distributed remotely sensed/in-situ soil moisture. J. Hydrol. 2016, 536, 192–207. [Google Scholar] [CrossRef]
- Kundu, D.; Vervoort, R.W.; Van Ogtrop, F.F. The value of remotely sensed surface soil moisture for model calibration using SWAT. Hydrol. Process. 2017, 31, 2764–2780. [Google Scholar] [CrossRef]
- López, P.L.; Sutanudjaja, E.H.; Schellekens, J.; Sterk, G.; Bierkens, M.F.P. Calibration of a large-scale hydrological model using satellite-based soil moisture and evapotranspiration products. Hydrol. Earth Syst. Sci. 2017, 21, 3125–3144. [Google Scholar] [CrossRef]
- Gutmann, E.D.; Small, E.E. A method for the determination of the hydraulic properties of soil from MODIS surface temperature for use in land-surface models. Water Resour. Res. 2010, 46, 06520. [Google Scholar] [CrossRef]
- Ruiz-Pérez, G.; Koch, J.; Manfreda, S.; Caylor, K.; Francés, F. Calibration of a parsimonious distributed ecohydrological daily model in a data-scarce basin by exclusively using the spatio-temporal variation of NDVI. Hydrol. Earth Syst. Sci. 2017, 21, 6235–6251. [Google Scholar] [CrossRef]
- Velpuri, N.M.; Senay, G.B. Assessing the potential hydrological impact of the Gibe III Dam on Lake Turkana water level using multi-source satellite data. Hydrol. Earth Syst. Sci. 2012, 16, 3561–3578. [Google Scholar] [CrossRef]
- Sutanudjaja, E.H.; Van Beek, L.P.H.; De Jong, S.M.; Van Geer, F.C.; Bierkens, M.F.P. Calibrating a large-extent high-resolution coupled groundwater-land surface model using soil moisture and discharge data. Water Resour. Res. 2014, 50, 687–705. [Google Scholar] [CrossRef]
- Silvestro, F.; Gabellani, S.; Rudari, R.; Delogu, F.; Laiolo, P.; Boni, G. Uncertainty reduction and parameter estimation of a distributed hydrological model with ground and remote-sensing data. Hydrol. Earth Syst. Sci. 2015, 19, 1727–1751. [Google Scholar] [CrossRef]
- Komma, J.; Blöschl, G.; Reszler, C. Soil moisture updating by Ensemble Kalman Filtering in real-time flood forecasting. J. Hydrol. 2008, 357, 228–242. [Google Scholar] [CrossRef]
- Franssen, H.J.H.; Kaiser, H.P.; Kuhlmann, U.; Bauser, G.; Stauffer, F.; Muller, R.; Kinzelbach, W. Operational real-time modeling with ensemble Kalman filter of variably saturated subsurface flow including stream-aquifer interaction and parameter updating. Water Resour. Res. 2011, 47. [Google Scholar] [CrossRef]
- Choi, J.; Jang, S.; Kim, S. Parameter and modeling uncertainty analysis of semi-distributed hydrological model using markov-chain monte carlo technique. J. Korean Soc. Water Environ. 2020, 36, 373–384. [Google Scholar]
- Sugawara, M. Automatic calibration of the tank model/L’étalonnage automatique d’un modèle à cisterne. Hydrol. Sci. Bull. 1979, 24, 375–388. [Google Scholar] [CrossRef]
- United States Environmental Protection Agency (US EPA). Hydrology. In Storm Water Management Model Reference Manual; U.S. Environmental Protection Agency: Washington, DC, USA, 2016; Volume 1. [Google Scholar]
- Hooghoudt, S. Bijdrage tot de kennis van enige natuurkundige grootheden van de grond. Versl. Landbouwkd. Onderz. 1940, 46, 515–707. [Google Scholar]
- Smedema, L.; Rycroft, D. Land Drainage: Planning and Design of Agricultural Drainage Systems; Cornell University Press: Ithica, NY, USA, 1983. [Google Scholar]
- Rahman, M.M.; Thompson, J.R.; Flower, R.J. An enhanced SWAT wetland module to quantify hydraulic interactions between riparian depressional wetlands, rivers and aquifers. Environ. Model. Softw. 2016, 84, 263–289. [Google Scholar] [CrossRef]
- Wang, G.; Jager, H.I.; Baskaran, L.M.; Baker, T.F.; Brandt, C.C. SWAT Modeling of Water Quantity and Quality in the Tennessee River Basin: Spatiotemporal Calibration and Validation. Hydrol. Earth Syst. Sci. Discuss. 2016, 1–33. [Google Scholar] [CrossRef]
- Korean Soil Information System (KSIS). Available online: http://soil.rda.go.kr (accessed on 30 September 2020).
- Environmental Geography Information System (EGIS). Available online: http://egis.me.go.kr (accessed on 30 September 2020).
- National Institute of Environmental Research (NIER). A Research on Control Targets and Strategies for Impervious Surface Management; R&D Final Report; NIER: Hwaseong, Korea, 2014. [Google Scholar]
- United States Environmental Protection Agency (US EPA). Storm Water Management Model User’s Manual Version 5.1; U.S. Environmental Protection Agency: Washington, DC, USA, 2015.
- Distrivuted Active Archive Center (DAAC). Available online: http://nsidc.org/data/smap/smap-data.html (accessed on 30 September 2020).
- Szilagyi, J. A calibration-free, robust estimation of monthly land surface evapotranspiration rates for continental-scale hydrology. Hydrol. Res. 2017, 49, 648–657. [Google Scholar] [CrossRef]
- Bouchet, R.J. Evapotranspiration reelle, evapotranspiration potentielle, et production agricole. Ann. Agron. 1963, 14, 743–824. [Google Scholar]
- Szilagyi, J.; Crago, R.; Qualls, R. A calibration-free formulation of the complementary relationship of evaporation for continental-scale hydrology. J. Geophys. Res. Atmos. 2017, 122, 264–278. [Google Scholar] [CrossRef]
- Kim, D.; Rhee, J. A drought index based on actual evapotranspiration from the Bouchet hypothesis. Geophys. Res. Lett. 2016, 43, 10277–10285. [Google Scholar] [CrossRef]
- Kim, D.; Lee, W.; Kim, S.T.; Chun, J.A. Historical Drought Assessment Over the Contiguous United States Using the Generalized Complementary Principle of Evapotranspiration. Water Resour. Res. 2019, 55, 6244–6267. [Google Scholar] [CrossRef]
- Kyatengerwa, C.; Kim, D.; Choi, M.; Baruga, C.K. A national-scale drought assessment in Uganda based on evapotranspiration deficits from the Bouchet hypothesis. J. Hydrol. 2020, 580, 124348. [Google Scholar] [CrossRef]
- Nash, J.E.; Sutcliffe, J.V. River flow forecasting through conceptual models part I—A discussion of principles. J. Hydrol. 1970, 10, 282–290. [Google Scholar] [CrossRef]
- Gupta, H.V.; Kling, H.; Yilmaz, K.K.; Martinez, G.F. Decomposition of the mean squared error and NSE performance criteria: Implications for improving hydrological modelling. J. Hydrol. 2009, 377, 80–91. [Google Scholar] [CrossRef]
- Ritter, A.; Muñoz-Carpena, R. Performance evaluation of hydrological models: Statistical significance for reducing subjectivity in goodness-of-fit assessments. J. Hydrol. 2013, 480, 33–45. [Google Scholar] [CrossRef]
- Patil, S.D.; Stieglitz, M. Comparing spatial and temporal transferability of hydrological model parameters. J. Hydrol. 2015, 525, 409–417. [Google Scholar] [CrossRef]
- Abbaspour, K.C.; Yang, J.; Maximov, I.; Siber, R.; Bogner, K.; Mieleitner, J.; Zobrist, J.; Srinivasan, R. Modelling hydrology and water quality in the pre-alpine/alpine Thur watershed using SWAT. J. Hydrol. 2007, 333, 413–430. [Google Scholar] [CrossRef]
- Yang, J.; Reichert, P.; Abbaspour, K.C.; Xia, J.; Yang, H. Comparing uncertainty analysis techniques for a SWAT application to the Chaohe Basin in China. J. Hydrol. 2008, 358, 1–23. [Google Scholar] [CrossRef]
- Huang, Q.; Qin, G.; Zhang, Y.; Tang, Q.; Liu, C.; Xia, J.; Chiew, F.H.S.; Post, D. Using Remote Sensing Data-based Hydrological Model Calibrations for Predicting Runoff in Ungauged or Poorly Gauged Catchments. Water Resour. Res. 2020, 56. [Google Scholar] [CrossRef]
- Wagener, T.; McIntyre, N.; Lees, M.J.; Wheater, H.S.; Gupta, H.V. Towards reduced uncertainty in conceptual rainfall-runoff modelling: Dynamic identifiability analysis. Hydrol. Process. 2003, 17, 455–476. [Google Scholar] [CrossRef]
- Refsgaard, J.C.; Knudsen, J. Operational Validation and Intercomparison of Different Types of Hydrological Models. Water Resour. Res. 1996, 32, 2189–2202. [Google Scholar] [CrossRef]
- Hartmann, G.; Bárdossy, A. Investigation of the transferability of hydrological models and a method to improve model calibration. Adv. Geosci. 2005, 5, 83–87. [Google Scholar] [CrossRef]
- Seibert, J.; Rodhe, A.; Bishop, K. Simulating interactions between saturated and unsaturated storage in a conceptual runoff model. Hydrol. Process. 2003, 17, 379–390. [Google Scholar] [CrossRef]
- Fowler, K.J.A.; Peel, M.C.; Western, A.W.; Zhang, L.; Peterson, T.J. Simulating runoff under changing climatic conditions: Revisiting an apparent deficiency of conceptual rainfall-runoff models. Water Resour. Res. 2016, 52, 1820–1846. [Google Scholar] [CrossRef]
- Dakhlaoui, H.; Ruelland, D.; Tramblay, Y.; Bargaoui, Z. Evaluating the robustness of conceptual rainfall-runoff models under climate variability in northern Tunisia. J. Hydrol. 2017, 550, 201–217. [Google Scholar] [CrossRef]
- Wu, K.; Johnston, C.A. Hydrologic response to climatic variability in a Great Lakes Watershed: A case study with the SWAT model. J. Hydrol. 2007, 337, 187–199. [Google Scholar] [CrossRef]
- Abebe, N.A.; Ogden, F.L.; Pradhan, N.R. Sensitivity and uncertainty analysis of the conceptual HBV rainfall–runoff model: Implications for parameter estimation. J. Hydrol. 2010, 389, 301–310. [Google Scholar] [CrossRef]
- Vaze, J.; Post, D.; Chiew, F.; Perraud, J.-M.; Viney, N.; Teng, J. Climate non-stationarity—Validity of calibrated rainfall–runoff models for use in climate change studies. J. Hydrol. 2010, 394, 447–457. [Google Scholar] [CrossRef]
- Seiller, G.; Anctil, F.; Perrin, C. Multimodel evaluation of twenty lumped hydrological models under contrasted climate conditions. Hydrol. Earth Syst. Sci. 2012, 16, 1171–1189. [Google Scholar] [CrossRef]
- Troin, M.; Arsenault, R.; Martel, J.-L.; Brissette, F. Uncertainty of Hydrological Model Components in Climate Change Studies over Two Nordic Quebec Catchments. J. Hydrometeorol. 2018, 19, 27–46. [Google Scholar] [CrossRef]
- Xia, Y.; Yang, Z.; Jackson, C.; Stoffa, P.L.; Sen, M.K. Impacts of data length on optimal parameter and uncertainty estimation of a land surface model. J. Geophys. Res. Space Phys. 2004, 109, 1–13. [Google Scholar] [CrossRef]
- Perrin, C.; Oudin, L.; Andreassian, V.; Rojas-Serna, C.; Michel, C.; Mathevet, T. Impact of limited streamflow data on the efficiency and the parameters of rainfall—runoff models. Hydrol. Sci. J. 2007, 52, 131–151. [Google Scholar] [CrossRef]
- Boughton, W. Effect of data length on rainfall–runoff modelling. Environ. Model. Softw. 2007, 22, 406–413. [Google Scholar] [CrossRef][Green Version]
- Li, C.; Wang, H.; Liu, J.; Yan, D.; Yu, F.; Zhang, L. Effect of calibration data series length on performance and optimal parameters of hydrological model. Water Sci. Eng. 2010, 3, 378–393. [Google Scholar] [CrossRef]
- Zeng, Q.; Chen, H.; Xu, C.-Y.; Jie, M.-X.; Hou, Y.-K. Feasibility and uncertainty of using conceptual rainfall-runoff models in design flood estimation. Hydrol. Res. 2015, 47, 701–717. [Google Scholar] [CrossRef]
- Aryal, S.K.; Zhang, Y.; Chiew, F. Enhanced low flow prediction for water and environmental management. J. Hydrol. 2020, 584, 124658. [Google Scholar] [CrossRef]
- Nicolle, P.; Pushpalatha, R.; Perrin, C.; Francois, D.; Thiery, D.; Mathevet, T.; Le Lay, M.; Besson, F.; Soubeyroux, J.-M.; Viel, C.; et al. Benchmarking hydrological models for low-flow simulation and forecasting on French catchments. Hydrol. Earth Syst. Sci. 2014, 18, 2829–2857. [Google Scholar] [CrossRef]
- Poméon, T.; Diekkrüger, B.; Springer, A.; Kusche, J.; Eicker, A. Multi-Objective Validation of SWAT for Sparsely-Gauged West African River Basins—A Remote Sensing Approach. Water 2018, 10, 451. [Google Scholar] [CrossRef]
- Yassin, F.; Razavi, S.; Wheater, H.; Sapriza-Azuri, G.; Davison, B.; Pietroniro, A. Enhanced identification of a hydrologic model using streamflow and satellite water storage data: A multicriteria sensitivity analysis and optimization approach. Hydrol. Process. 2017, 31, 3320–3333. [Google Scholar] [CrossRef]
Publisher’s Note: MDPI stays neutral with regard to jurisdictional claims in published maps and institutional affiliations. |
© 2021 by the authors. Licensee MDPI, Basel, Switzerland. This article is an open access article distributed under the terms and conditions of the Creative Commons Attribution (CC BY) license (http://creativecommons.org/licenses/by/4.0/).

