1. Introduction
Ground penetrating radar (GPR, georadar) is a geophysical method of near-surface sounding based on the propagation of high-frequency electromagnetic (EM) waves in the range from 10 MHz to 2 GHz. Since the signal propagation is mainly influenced by electromagnetic properties of the soil, GPR can be used to study the subsurface structure. GPR is widely used in geophysical research in geology, glaciology, archeology, mineral exploration, civil engineering, etc. [
1]. This method has a higher versatility, resolution and data collection speed compared to many other geophysical methods.
Most GPR measurements are performed by systems in which antennas are placed directly on the ground surface and moved manually or by using vehicles. However, for large-scale studies of hard-to-reach areas covered with dense vegetation, as well as for surveys of dangerous places (landslides, avalanches, mudflows), the use of ground-based GPR becomes problematic. In these conditions, airborne GPR surveys can be preferable, being less susceptible to the influence of the terrain, granting the possibility to work even in dangerous places, and to be used for a quick survey of large areas. Despite these advantages of airborne georadar surveys, at present onboard georadars are not as widespread and developed as conventional ground-based georadar systems [
2,
3,
4].
Traditionally, most airborne GPR surveys are carried out using helicopters from a possible set of other carriers [
5], which allows covering large areas in a fairly short time and with minimum logistics costs. Helicopter systems with georadar are used in Russia and abroad to study glaciers and snow cover (determination of the ice and snow thickness, localization of cracks and cavities) in Antarctica, Greenland, Alaska, etc. GPR has been developed and actively used at the Institute of Geography of the Russian Academy of Sciences VIRL for sounding the glaciers of the Caucasus, Spitsbergen, etc. both in the ground-based version and as a suspension to a helicopter [
3,
6]. Various systems for gathering GPR information from helicopters that have recently been tested on glaciers in the Swiss Alps have included towed systems (HERA-G and BGR-P30) or hard-wired standard commercial ground-based GPR (GSSI and PulsEkko) operating in frequency ranges from 30 to 70 MHz [
7,
8,
9,
10].
Airborne GPR surveys for scientific research are often used in glaciology. There are reports of other applications, for example, in geology when studying a stone glacier [
11]. GPR sounding at a frequency of 60 MHz was carried out from a height of 15–20 m in a remote mountainous region. The results of a study of sandy and gravel landfills in Germany at frequencies of 30 MHz are presented in [
12]. In all cases, the medium under study had a low attenuation coefficient of the EM signal (0.06 dB/m) due to a large percentage of ice or dry sand, and a low coefficient of reflection from the air-medium interface. Similar sounding conditions (frozen ground, low attenuation) facilitate the use of aerial complexes in permafrost studies [
13], including structures of polygonal-veined ice. Airborne georadar is a very promising tool for mapping soil surface properties at frequencies below 300 MHz [
14,
15], both for studying soil thawing processes and monitoring soil moisture in large areas. In these measurements, the shape of the reflected pulse from the upper layers of the geological section was analyzed. In [
16], on the basis of a large amount of experimental data, the conditions of successful georadar application in geoarcheology were determined. It turns out that to study archaeological objects with high resolution at depths of 1–2 m it is enough to use a drone with a GPR [
17]. In recent years, in connection with the development of unmanned avionics, research on the use of quadcopters for detailed scanning of the upper soil layer from a low-flying unmanned aerial vehicle (UAV) has become widespread [
18,
19,
20]. In these works, deep penetration of the probing signal is not required, and the emphasis is done on spatial resolution and visualization of low-contrast objects. Combining unmanned platform-based GPR with a terrestrial positioning system will provide a useful tool for surveying rural areas and urban underground infrastructure [
21,
22].
At present, aeroglaciological studies are most popular, since the low electrical conductivity of frozen soil, snow and ice contributes to the achievement of a great depth of sounding, which is impossible for most geological materials. The depth of penetration of the probe signal is limited by several factors, such as: spreading losses due to wavefront expansion, signal attenuation in the medium, signal scattering and partial reflections. For airborne surveys, raising the antenna above the ground leads not only to spreading losses due to the expansion of the wavefront, but also, which is very important, to a significant weakening of the sounding signal due to reflection from the earth’s surface due to significant contrast of the electromagnetic parameters of the air and the surface. This contrast is much less if the ground is frozen or the surface is covered with snow and ice, which is opposite to the case of wet clays, loams or moist sedimentary rocks.
In this article, we will focus on georadar surveys from helicopters in the conditions typical for central Russia and Europe, with not such a smooth surface and significantly more “hard” electromagnetic parameters of the subsurface medium than ice and permafrost. These studies are important, because they will significantly expand the areas of application of onboard GPR both for monitoring potentially hazardous areas and for solving problems of exploration geology, researching arid regions and permafrost zones, requiring improvement of the equipment, development of techniques and software. To this end, we performed refinement of the equipment, computer modeling and fulfilled experimental work on the equipment testing at a polygon site and the first full-scale flights with the developed GPR model, using our previous design of a high-power GPR with resistively loaded antennas [
2,
23,
24].
In the first part of the article, we discuss the design and technical characteristics of the resistive-loaded antenna system. The following describes a ground-based experiment with a georadar raised above the ground. The experimental results are interpreted using numerical simulation. The results of test flights on a Mi-2 helicopter with a prototype of a GPR air suspension are presented.
2. Wide-Band Resistively-Loaded Dipole Antenna
The experimental equipment consists of two resistively-loaded antennas with the transmitting and receiving blocks mounted on the corresponding antennas suspended under the aircraft—
Figure 1, and a control-and-processing unit, located in the helicopter cockpit, with the help of which the operation of the entire measuring complex is synchronized via the WiFi connection. The antenna set is a key part of the airborne georadar device.
The dipole antenna with a distributed resistive load proposed by T.T. Wu and R.W.P. King [
25] has a remarkable feature that, with a correctly selected law of resistivity increase along the antenna arm, a traveling current wave is formed, attenuating to the ends of the dipole in the entire range of operating frequencies, while in a classical dipole antenna the current waveform has the character of a standing wave. Radargrams obtained using an aperiodic probing signal have significantly better quality in terms of spatial and temporal resolution than those when using oscillating excitation.
When designing the antenna system for an airborne GPR, we decided to develop the concept of resistively loaded antennas used in ground-based GPR [
2,
23]. Such antennas consist of metalized plates interconnected with load resistors providing resistivity gradually increasing to the ends of the antenna strip. The length of the antenna arm of our “aerial” GPR is 3 m, the width of the antenna strip is 30 cm, and the GPR operates in the 10–50 MHz spectral band, which is most favorable for providing a sounding depth of about 20–30 m in the soils of central Russia. When working from an airborne carrier in the frequency range of 10–50 MHz, it is extremely important to take into account such factors as the size of the antenna set, mutual positions of the antennas in space, and their position relative to the helicopter, as well as the aerodynamics of the entire measuring complex. The analysis and development of the antenna system were carried out using MMANA-GAL—a software package for antenna analysis [
26].
Computer simulation of GPR antennas made it possible to do the following: to select the resistive load distribution along the dipole to obtain the desired current distribution in the antenna arms; calculate antenna radiation patterns at fixed frequencies; analyze the effectiveness of using proper conductor diameter in the antenna circuit; calculate the mutual influence of the receiving and transmitting antennas with the helicopter body. In our computer simulation, the helicopter was approximated by a conducting cylinder with a radius of one meter, and the antenna arm—as a chain of ten conductors connected by resistors with the resistance increasing to the ends of the dipole according to a hyperbolic law. The mutual positions of the receiving and transmitting antennas have a strong influence on the radiation pattern (RP) of the GPR complex and may lead to significant changes. An example of numerical simulation for different mutual orientations of the antennas is presented in
Figure 2a,b. Calculated current distribution Itx along the transmitter antenna, as well as the induced currents in the receiving antenna Irx (in-line design) and the aircraft hull Ih are depicted schematically in
Figure 2c. Experimental GPR signals for different separation between the antennas are shown in
Figure 2d.
The comparison between calculated radiation patterns 2a,b shows that the in-line scheme provides less mutual influence of Tx and Rx antennas. However, the parallel design may have some operational advantages.
The resistively-loaded dipole developed and manufactured at IZMIRAN has a uniform distribution of the standing wave ratio (SWR) of 2.5–3.0 over the entire frequency spectrum of the signal, which limits the gain variation to the interval (−24, −13) dB. When analyzing the currents in the transmitter antenna with changing the parameters of the distributed load, it turned out to be possible to avoid resonance phenomena in the antenna, see
Figure 2c. By increasing the distance between the antennas to the values greater than
, we could reduce to an acceptable minimum the low-frequency component of the radiated signal determining the “blind” zone of the radar—see A-scan (2) in
Figure 2d.
3. Measuring Complex Tests. Numerical Simulation
To test the efficiency of our “aerial” radar and to assess the possibility of its practical application, the first experiments were carried out at an urban building site, using a tower crane with a height and jib lengths of 40 m.
Figure 3a displays the experimental setup with numbered EM wave paths. The in-line antenna system was hung seven meters apart from the 3 m high reinforced concrete frame of a building under construction. In the subsurface medium there is a loam whose upper layer was partially removed to a depth of 2 m for the installation of the building basement, then backfilled with the soil. In this experiment, the antenna was smoothly lowered from a height of 20 m (GPR trace 100) to the ground (trace 800).
To analyze the sounding data and confirm the interpretation of the received signals, 2D numerical simulation was carried out using gprMax software [
27], which is widely used for modeling electromagnetic signals of GPR probing. The soil structure was modeled by a flat-layered subsurface medium with two interfaces at a depth of 2.5 m—line (3) and 4 m—line (4) in
Figure 3. The first derivative of the Gaussian function was chosen as a probing pulse waveform:
with a central frequency
MHz. The results of the B-scan simulation, not taking into account the influence of the building, are shown in
Figure 4a, and, taking the building into account, in
Figure 4b.
Judging from the simulation results, the reflected waves with the maximum amplitude come from external objects. Reflected waves from the ground (2) and building (5), (8) surfaces exceed the subsurface reflection level—by 16 dB from the interface at a depth of 2.5 m (3) and by 49 dB from the 4 m deep boundary (4). With the antennas more than 10 m above the ground, the amplitude of the reflected waves from the underlying medium features becomes too small against the reflected waves from the external objects for their reliable recording.
This two-dimensional model is relatively simple but, when comparing the numerical results
Figure 4a,b with the radar return signals of the real GPR scan
Figure 3b, it can be noted that the simulation results in general well correspond to the experimental data. Since the presented simulation considered only a two-dimensional model in a section plane perpendicular to the earth’s surface, all signals from the objects lying outside this plane were not reflected in this model. In reality, a significant contribution to the radargram is made by the reflections from the bound lines between the cross walls of the building and the ground, located at a distance of 6, 11 and 17 m from the projection of the antenna on the ground—these reflected waves (8) are highlighted in
Figure 3b by the black dashed line. The level of these reflected waves (8) is by 12–15 dB lower than that of the reflected waves from the earth’s surface (2), but 23 dB higher than the level of diffracted wave from the outer corner of the building (5) in
Figure 3a,b. Reflected waves from the crane jib (6) seen in
Figure 3a,b, according to the measurement results, are by 12 dB below the level of the reflections from the earth’s surface (2), with the antenna height and its distance to the jib both equal to 20 m.
To identify signals from underground structures and to select signals from the parts of the building, we used the all-around view data obtained when the antennas made a 360° turn, see
Figure 5a. Here, the vertical dotted line marks the position of the antennas directed perpendicular to the wall of the house and parallel to the crane boom. Numbers (1) and (2) mark the direct wave and the reflected wave from the earth’s surface, respectively. Waves (6) reflected from the crane boom have the maximum amplitude when the antennas are oriented parallel to the crane boom, while the strongest reflections (7) from the vertical crane tower come when the antenna is perpendicular to the boom.
To interpret the all-round view of
Figure 5a it is worth noting that, when the antennas are rotated by 360°, reflections from compact objects located in the horizontal plane of the antennas, as well as vertically elongated objects, will have discontinuous character. On the other hand, in the case of a stratified subsurface medium, reflections from sub-horizontal contrast boundaries (earth’s surface and interfaces between ground layers) should have relatively stable amplitude during rotation of the antennas. In
Figure 5b, the solid line displays the averaged values of the A-scans over the full antenna turn by 360°, and the dotted line shows standard deviation from the mean values. Signals (3) and (4) (delay times 110 ns and 137 ns, respectively), having a maximum amplitude and minimum deviation from the mean time value, are pointed on the plot. In the circular radargram shown in
Figure 5a, continuous lines at these delay times are formed with the antennas’ all-round turn by 360°. Assuming average EM wave propagation velocity in soils characteristic of the Moscow region, these signals correspond to the layer depths of 2.5 m and 4 m. The observed rather a high level of the reflected waves from these underground layers confirm the suitability of our onboard radar prototype for carrying out realistic field experiments on airborne GPR subsurface sounding.
4. Field Test Results
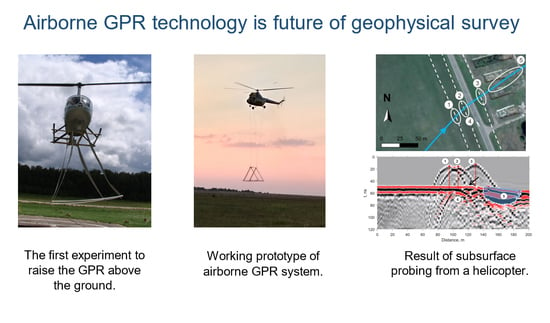
The first field tests of our airborne GPR and its antenna set in real conditions were carried out in the vicinity of Bolshoye Gryzlovo airfield, Kaluga region using a Mi-2 helicopter. The aircraft was kindly provided by the aerodrome management. A fiberglass frame was developed and manufactured for the antennas, of a special shape, taking into account the aerodynamics of the air flows formed by the helicopter propeller and the oncoming wind. A parallel set of antennas with a center frequency of 25 MHz was mounted in a plastic frame firmly stabilizing them in a horizontal position. The suspension was hung on nylon cables under the helicopter at a distance of 12 m; see
Figure 1.
The ultra-wideband probing signal was generated by a powerful 10 kV pulse transmitter of the Loza GPR [
2,
23,
24] with a high-voltage gas spark gap operating in an asynchronous mode; pulse width about 7 ns, repetition rate 1 kHz. A direct conversion receiver with a bandwidth of 20–350 MHz, and a 12-bit analog-to-digital converter provided discretization of the input signal with a step 1 ns (1 GSPS sample rate); the receiver was synchronized using the first coming aerial direct wave of the transmitter. The period of one measurement cycle was 100 ms. The measuring complex contains a GNSS module referencing the data to the geographic coordinates. Recording and transmission of GPR data, remote control of the measurement process were carried out by the operator via WiFi network from a computer placed in the cockpit. The operation height in these first experiments was chosen as a trade-off between penetration depth estimates, measurement accuracy and safety of the helicopter flight near the settlement, taking into account the weather conditions. The first promising outcome of these field experiments was the proof of the ability of our Tx-Rx set to operate up from the heights up to several decades of meters.
The soils in the aerodrome area are represented by loams with weak stratification without sharp radar-contrast boundaries, with a dielectric permittivity ε ~ 9, and a specific conductivity ρ = 0.01–0.1 S/m. The flights took place at an altitude of 10 to 70 m (relative to the antenna suspension) above the earth’s surface. The ability to determine the position of objects directly depends on the flight height, so at a 10-m height of the antenna suspension, the airborne georadar ensures the horizontal resolution of two close objects of about 2.5 m. Several trails were laid over the nearby fields, buried ravines and a pond on the Bredeisky Otvershek stream.
An example of GPR probing data obtained from a Mi-2 helicopter is shown in
Figure 6a. The span route passed over a field, a road and abandoned silo pits (54°47′42.31″ N, 37°38′9.74″ E); it is shown in the satellite image in
Figure 6b. The flight height was 45 m with flight velocity ~ 10 m/sec. Three high-voltage power lines run along the road at a distance of 28, 13 and 14 m from the axis of the paved road, the suspension height of the wires is 6 m. When flying over them, three hyperbolas (1–3) of the scattered wave from these power lines appear on the radargram. By the mode of the scattered wave amplitude attenuation from the top of the hyperbola towards its wings, it is possible not only to identify the point (more precisely, linear) nature of the scatterer, but also to confirm the radiation pattern of the antennas predicted by numerical simulation (a wide main lobe without a clear maximum towards the ground).
Silage pits of 50 m long were located along the road at a distance of 30 m. The radar image of the silage pit (5) is well traced on the radargram—
Figure 6a. The bottom of the pit filled with soil is clearly drawn out at a depth of about 2 m (estimate for ε = 9) with a slope away from the road. The road on the radargram is poorly traced due to the large measurement step (about 2.5 m); however, the hyperboles from the roadside clearly position its location. On the left side of the road, between two power lines, a local object is seen at a depth of 70 cm, which is presumably a cable, judging by the nature of the signal and the hyperbolic shape of the trace.
One of the flight paths was laid through Yes’kino pond located near the airfield (54°48′18.47″ N, 37°39′25.43″ E),
Figure 7a. Ground GPR survey of this pond by Loza GPR was carried out earlier, in the winter, from the ice cover; track A in
Figure 7a. Antennas with a central frequency of 50 MHz, a 5 kV transmitter, a measurement step of 0.2 m were used; the length of the route was 200 m. On the B-scan shown in
Figure 7b, the structure of the bottom (1) with a maximum depth of 9.4 m is clearly seen. In the lower part of the lake, a weakening of the wave reflected from the bottom is observed—apparently, due to accumulation of the silt. Return waves in the form of straight oblique lines (2) observed on both sides of the pond image are due to the lateral wave back reflection from the right and left banks along the water surface. They are significantly weaker than the reflected waves from the lake bottom.
In the summer, a survey of this lake was carried out from helicopter route B in
Figure 7a, (parallel antennas with a central frequency of 50 MHz, hung on a suspension 12 m long, flight altitude of 62–70 m, flight velocity ~ 5 m/sec). The results of sounding with a minimum post processing are shown in
Figure 7c. Compared with ground measurements, the level of interfering waves (2), (6) from the electric transmission line and the coast line, along which the power line runs, is significantly increased. This is due to the radiation pattern of the antenna system. The influence of the helicopter has a significant effect on the measurement results, namely, the reflection of the air wave from the aircraft body and rotor (5). It should be noted that the signal level from the lake bottom (3) in
Figure 7c is much lower than when measured from the water surface; curve (1) in
Figure 7b. The decrease in the signal level is caused by the deterioration of the antenna directivity towards the sensing surface, weakening of the useful signal due to higher GPR position and reflection from the interface.
It can be seen from the above data that the main local subsurface objects along the flight path were obtained by our airborne radar prototype, their radio images presented on the radargrams. Sub-horizontal contrast boundaries in the underlying surface in the field at depths of 5–10 m were not recorded due to their absence, which was confirmed by ground-based GPR measurements.
5. Conclusions
The experiments carried out and the presented results of sounding clearly revealed characteristic objects in the upper subsurface environment, which proves the possibility of using airborne GPR surveys for detecting underground objects even in the clay soils of the Moscow region (ε = 9, ρ = 0.01–0.1 S/m) to be difficult to survey. The use of the developed broadband resistively loaded antennas and a high-power onboard ground penetrating radar provides reliable detection of subsurface objects at depths of about 5 m. The use of model radargrams helps us to verify the interpretation of the subsurface environment structure from the GPR data and to reveal the presence of hidden radio-contrast objects.
In this work, our main goal was to develop and test a powerful air-based GPR and a set of antennas capable to overcome probing pulse attenuation due to radiation divergence in the air and strong reflection from the earth surface. The airborne georadar was created to survey the subsurface environment in areas difficult to access and dangerous for human research. An obvious operation mode is randomly oriented GPR sections for engineering and geological exploration, construction and repair works, environmental research and pollution control, archaeological surveys, etc. Accurate referencing of measurement results using a GPS system and digital models of the investigated surface relief will make it possible to perform accurate topographic correction of radargrams necessary for a reliable assessment of the depth and geometric dimensions of buried objects as well as the internal structure of the subsurface environment.
Our future work will focus on, first, the development and implementation of a topographic survey system and digital data for adjusting the GPR profile to the route relief and providing visual information at the stage of GPR data interpretation; second, improving the antenna system to ensure a greater depth of sounding and improving the signal-to-noise ratio; and third, testing the developed system in different geological conditions for solving various problems.


