Article

Quantitative Assessment of the Influences of Snow Drought on Forest and Grass Growth in Mid-High Latitude Regions by Using Remote Sensing

1
Beijing Key Laboratory of Urban Hydrological Cycle and Sponge City Technology, College of Water Sciences, Beijing Normal University, Beijing 100875, China
2
Beijing Weather Modification Office, Beijing 100089, China
3
School of Geography and Environmental Science, Guizhou Normal University, Guiyang 550001, China
4
Ministry of Ecology and Environment Center for Satellite Application on Ecology and Environment, Beijing 100094, China
5
Beijing Key Laboratory for Remote Sensing of Environment and Digital Cities, State Key Laboratory of Remote Sensing Science, Faculty of Geographical Science, Beijing Normal University, Beijing 100875, China
*
Author to whom correspondence should be addressed.
Remote Sens. 2021, 13(4), 668; https://doi.org/10.3390/rs13040668
Submission received: 4 January 2021 / Revised: 3 February 2021 / Accepted: 8 February 2021 / Published: 12 February 2021
(This article belongs to the Section AI Remote Sensing)

Abstract

:
Global climate change, especially the snow drought events, is causing extreme weather events influencing regional vegetation growth and terrestrial ecosystem stability in a long-term and persistent way. In this study, the Sanjiang Plain was selected, as this area has been experiencing snow drought in the past two decades. Logistic models, combined with multisource remote sensing and unmanned aerial vehicle (UAV) data, as well as the meteorological data over the past 20 years, were used to calculate sixteen phenological periods and biomass. The results show that (1) over the past two decades, snow drought has been based on the snow accumulation and has been occurring more frequently, wider-ranging and more severely; (2) snow drought has advanced the forest start of season (SOS)/end of season (EOS) by 6/5 days, respectively; (3) if the snowfall is greater than 80% of a normal year, the SOS/EOS of grass is postponed by 8/6 days; conversely, if it is less than 80%, the SOS/EOS are advanced by 7/5 days; and (4) biomass decreased approximately 0.61%, compared with an abundant snowfall year. Overall, this study is the first to explore how snow drought impacts the phenological period in a mid-high latitude area, and more attention should be paid to these unknown risks to the ecosystem.

Graphical Abstract

1. Introduction

In mid-high latitude areas, snow provides much of the water for agriculture, human consumption, and ecosystem maintenance [1,2]. Winter snow is a special land type that influences the energy balance and water cycle of the earth because it has high reflectivity, low thermal conductivity, and hydrological effects. Moreover, winter snow acts as a reservoir of water, which delays the release of soil moisture and mitigates drought in areas with modest summer precipitation [3]. Snow also provides reflected light, which enhances solar radiation in mid-high latitude areas where sunlight is scarce in mid-winter [4]. In contrast to rainwater, snowmelt can effectively infiltrate down to the root zone and often provides a large amount of groundwater recharge [5].
The winter drought condition in the northern regions will reduce the soil water, vegetation water and snow cover [6]. Drought winter with less snow would expose soil to cold air to cut down the availability of deeper and shallow soil water in the following growing season and thereby affect the plant input water [7]. In mid-high or high latitude regions, drought winter with less precipitation also means less snowfall. Increasing research has provided evidence that snow accumulation in mid-high latitude areas has decreased as a result of increasing temperatures in the context of global climate change [2,8,9]. In addition, the climate is typically the first‐order control in the snow flow region [10]. This situation will cause snow drought, i.e., a lack of snow accumulation in winter [11], which brings severe socioeconomic consequences to humans and negative influences on the ecosystem. According to different climatic causes, snow drought is divided into dry snow drought and warm snow drought. Dry snow drought is caused by winter precipitation deficits, while warm snow drought is induced by above-normal winter temperatures [1]. Warm snow drought reduces the annual flood peak [12] and increases flood risks due to rain sticking together with snowfall [13,14]. Annual runoff also decreases because of the snow drought and its negative impact on water quantity and quality [15,16]. Even worse, insufficient snow accumulation brings earlier snow disappearance, which is tied to increased wildfire activity [17] and tree mortality [18], as well as greater stress for mountain ecosystems [19].
Previous studies have paid more attention to distinguishing warm snow drought and the variation of winter, spring and annual hydrological processes caused by insufficient snow accumulation. Mote et al. [20] showed that exceptionally warm winter conditions induced snow drought in California, Oregon, and Washington during the record-low snow season in 2015. Harpold et al. [14] labeled the 2015 year in the Pacific Northwest as a warm snow drought. Hatchett and McEvoy [21] showed that snow droughts often induce midwinter flood events in Sierra Nevada watersheds. Moreover, snow drought and the associated lower snow fractions are leading to a decreased annual runoff because there has been a change in the seasonal timing and precipitation amount as well as a shift in water supply away from summer and toward winter [22,23]. However, whether snow drought influences the forest and grass growth process and phenology were overlooked in these studies.
Vegetation phenology, which is easily influenced by soil water and temperature, has been studied by monitoring plant growth processes and indirectly measuring their growing conditions since the 1980s [24,25]. As a key sensitive indicator of climate change, vegetation phenology is also the response of terrestrial ecosystems to climate change [26]. The changing global climate also leads to fluctuations in vegetation phenology in different regions, and many researchers have discussed the relationship between forest and grass phenology and precipitation and temperature [27,28]. In the meteorological factor influencing the process, the precipitation and snow are expected to accelerate the onset of forest growing season; the forest leaves absorb nutrients and carbohydrates from both twigs and roots. Melted water from snowfall was the main source of soil water, and the grassland grows more reliant on the soil water to provide nutrients. Vitasse et al. [29] aimed to investigate phenological sensitivities to temperature in two valleys of the Pyrénées Mountains in southern France and found an obvious correlation between phenological period and temperature factor and similar sensitivity patterns in two places. Jenerette et al. [30] used remote sensing data to explore the precipitation and phenological relationships in spatial and temporal scales in the northern Sonoran Desert. Monitoring the phenological period in large-scale remote sensing has been increasingly applied due to its good spatial and temporal resolution [31,32]. Vegetation indices obtained by various satellites have been developed to calculate vegetation phenological periods, such as normalized difference vegetation index (NDVI) and enhanced vegetation index (EVI) [33]. Ma et al. [34] investigated the relationship in spatial and temporal variability for rainfall, phenology and vegetation with EVI data in the North Australian Tropical Transect. Xiao et al. [35] used time-series data from EVI production to analyze tropical evergreen forest leaf phenology over a long-term time scale in South America. Thus, previous research also has used the EVI data due to the higher sensitivity to green vegetation density than NDVI by plant phenology products [36].
To answer the question of whether snow drought influences the forest and grass growth process and phenology, remote sensing and meteorological data were collected, and the objectives were as follows: (1) to detect the snow drought period by using 20 years of meteorological data from the mid-high latitude area of Northeast Asia; (2) to calculate the phenological period and biomass of forest and grass in the snow drought stage by using multisource remote sensing data and logistic modeling; and (3) to evaluate the influences of snow drought on the phenology and forest and grass growth process through 16 phenological periods of snow drought periods.

2. Materials and Methods

2.1. Study Area

The Sanjiang Plain (43°49′55″–48°27′40″ N, 129°11′20″–135°05′26″E) (Figure 1), a very important producer of commodity grain bases in China, is a typical mid-high latitude area located in Northeast Asia. It has a total area of 108,900 km², and the annual precipitation ranges from 500 to 600 mm. The average annual temperature is approximately 1.9 °C, and the climate is a humid and mid-humid continental type. Arable land, forest land, and wetland are the three leading land-use types, representing 51.17%, 31.63% and 8.81%, respectively, of the area [37]. The Sanjiang Plain was covered with broad wetland and forest before its establishment in the 1950s; since then, it has been affected by widespread land reclamation [38]. This area also boasts the most fertile black soil in China and has large-scale agricultural production, where mainly rice, corn and soybeans are harvested [39]. Soil nutrients supply the vegetation growth to maintain the regional ecological balance, thereby promoting agricultural development and exports.
Thus, the climate is relatively important for agriculture production, and the extreme weather may cause serious vegetation growth change and yield fluctuations in this area. According to Fu et al. [40], the climate in the Sanjiang Plain has slowly been changing, which reveals a warming trend in temperature and certain trend characteristics in rainfall over the past 50 years. Climate change has become a hot topic in this region in recent years. Snowfall is a significant weather characteristic in this area, and snow accumulation is a key water source for the forest land, cultivated land, and groundwater. Meltwater is the main supplemental water at the Sanijiang Plain, which provides enough water resources for plant growth in spring. In this area, there are six national meteorological stations, namely, Fujin, Jiamusi, Baoqing, Hulin, Yilan, and Jixi. Snowfall and temperature data can be obtained from these stations.

2.2. The Research Framework

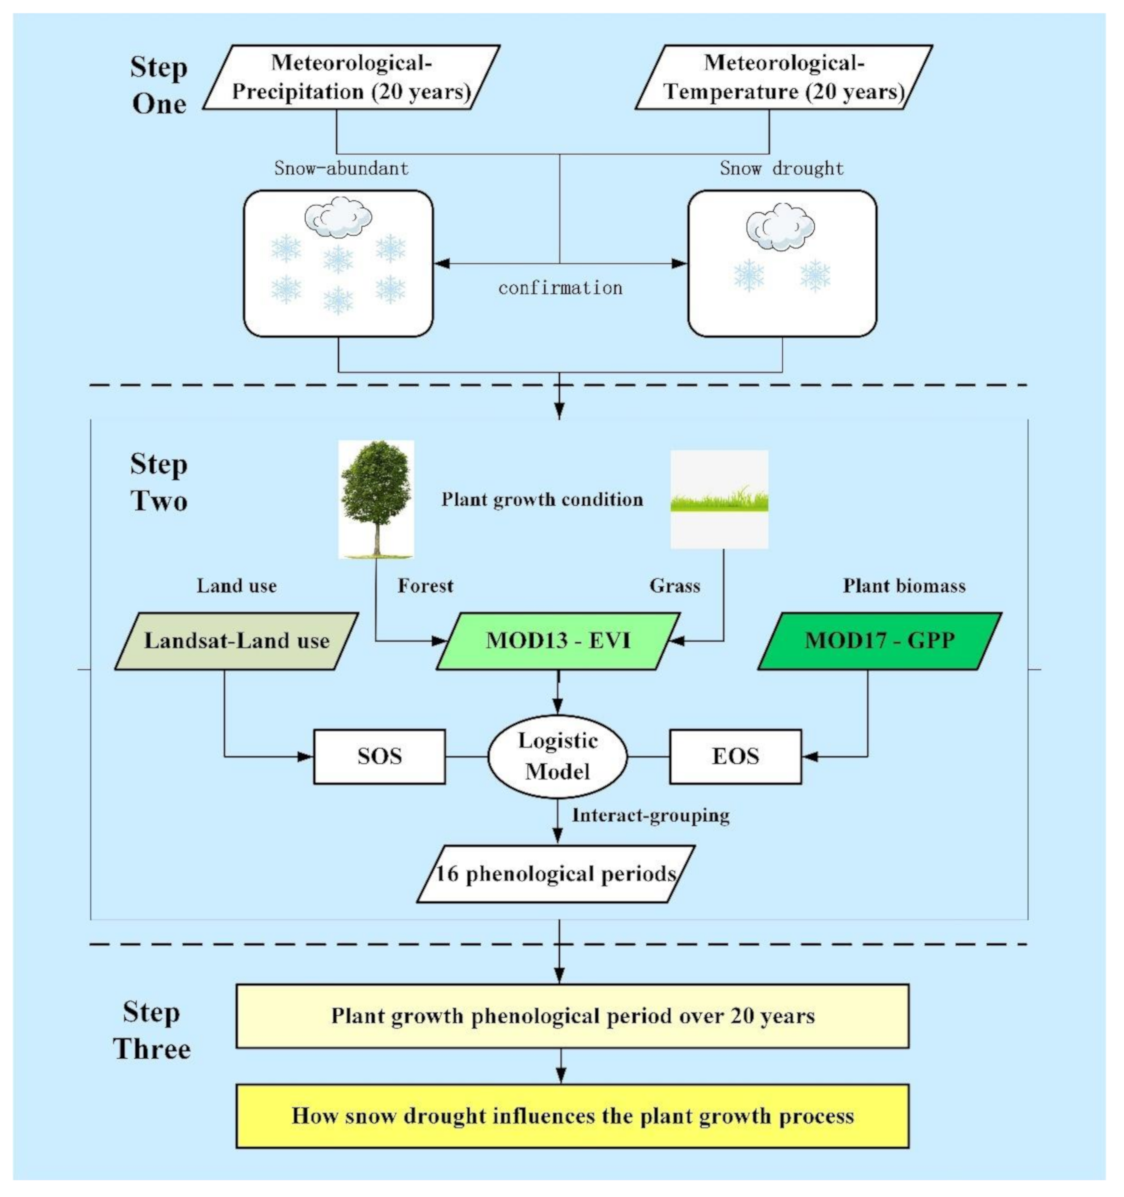
The three main steps of the method used in this research are illustrated in Figure 2. First, snow drought years and snow-abundant periods in the nearly last 20 years were detected and selected by using the precipitation and temperature data from the national meteorological stations. Snow-abundant years were also determined to compare the forest and grass growth conditions to the snow drought year. Second, the forest and grass phenological period was calculated, including the start of the season (SOS) and the end of the season (EOS), by using remote sensing data EVI (enhanced vegetation index) and the logistic model method. Landsat data were selected to obtain the land use and land cover data, and gross primary productivity (GPP) data production from moderate resolution imaging spectroradiometer (MODIS) present the forest and grass growth process and biomass in the growing season in one year. We used logistic modeling to calculate the SOS and EOS in forests and grassland. Under the intersect-grouping method, the selected years (snow drought and snow-abundant years) were divided into 16 phenological periods, which were placed with the rule of “snow-drought year–snow-abundant year” (e.g., 2019–2016) to be further analyzed. In addition, the relationship between phenological period and meteorological data were analyzed combined with the temperature and precipitation data in this paper (16 phenological periods: 2003–2005, 2003–2010, 2003–2015, 2003–2016, 2012–2005, 2012–2010, 2012–2015, 2012–2016, 2014–2005, 2014–2010, 2014–2015, 2014–2016, 2019–2005, 2019–2010, 2019–2015, and 2019–2016). Third, by using the above data, the influences on the forest and grass growth process and the phenological period from snow drought in the mid-high latitude area were quantitatively evaluated. Spatial statistical and overlay methods were also used to analyze the last two steps of the spatial variation in this area.

2.3. Data Processing

2.3.1. Multisource Remote Sensing Data and Their Processing

Four types of remote sensing data from three satellite platforms and DSM/DOM data from unmanned aerial vehicles (UAV) were used in this study (Table 1). MOD13A2, MOD17A2, MOD10A2 data from the MODIS satellite provide plant information, which includes EVI, GPP and snowfall, and their spatial resolution is 500 m, and the temporal resolution is 8 days (GPP, snow) and 16 days (EVI). There were two scenes of MODIS data in the Sanjiang Plain, and their track numbers are named h26v04 and h27v04. The raw nadir bidirectional reflectance distribution function adjusted reflectance (MODIS NBAR) data from NASA (https://ladsweb.modaps.eosdis.nasa.gov/search/ (accessed on 8 January 2021)) were processed by using the MODIS reprojection tool (MRT) software to adjust the coordinate and projection system. We used the WGS-1984 as the coordinate system, and the projection system was Albers equal area, which unified the data format for more convenient data processing. Then, the data were clipped in bulk by using the interactive data language (IDL), the scale factor of the raw data from the hierarchical data format (HDF) files, which should be focused on when extracting the correct data, and filling values were assigned a value of zero. The MODIS data were applied to calculate forest and grass phenological periods in the snow drought and snow-abundant periods. Landsat data (https://earthexplorer.usgs.gov/ (accessed on 8 January 2021)) with 30 m resolution were also used to obtain information about the main vegetation types (forest, grass) in the study area by using the visual interpretation method. The DOM from the UAV was applied to check and assess the land use data interpreted by the Landsat data. The DSM obtained by the UAV was used to calculate vegetation volume data, and then, the relationship was set between the vegetation volume and biomass by matching the UAV and GPP data [41]. This relationship was employed to evaluate and to improve the quality of the GPP data.

2.3.2. Meteorological Data and Snow Drought Detection

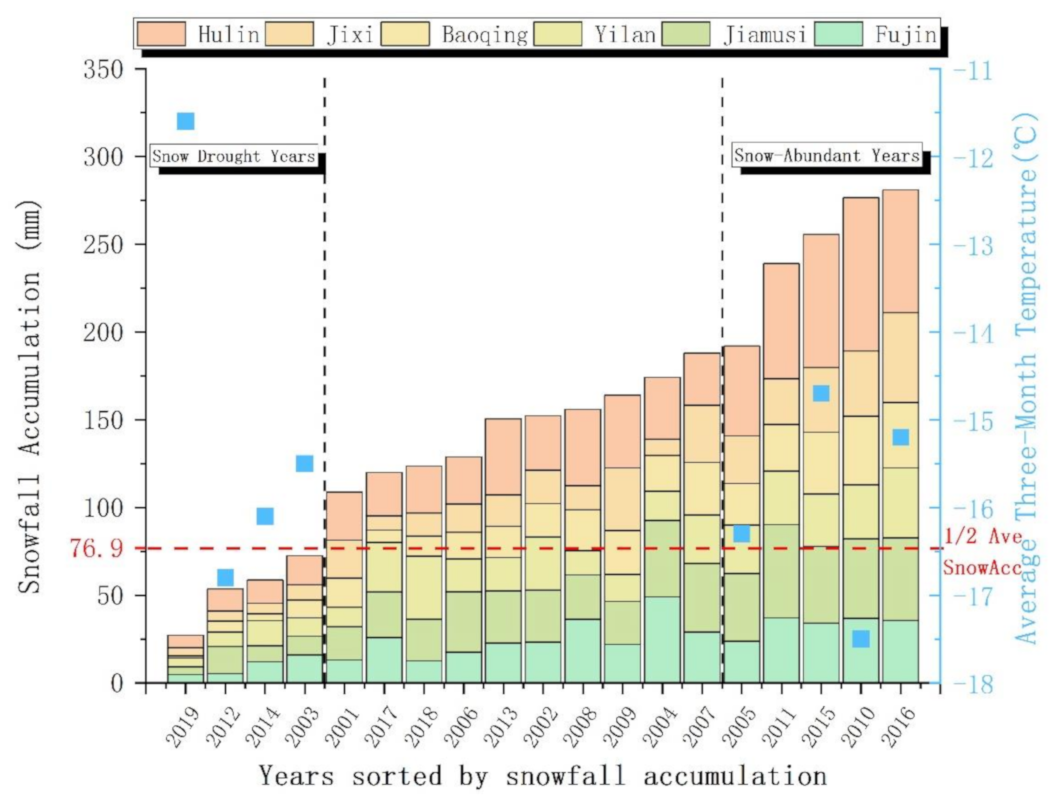
Meteorological data, including the precipitation and temperature from 2000–2019, were downloaded from the public data platform (http://data.cma.cn/ (accessed on 8 January 2021)) and processed for measuring the climate change condition in the Sanjiang Plain. We used to average and sum data to evaluate the whole study area by the six stations (Figure 1). For temperature data, we calculated each year’s data from six stations’ average values from the last year’s December to this year’s February (e.g., 2019 means the time scale is from 2018/12 to 2019/02, and this form is used in the following text). At the same time, each year, accumulated precipitation data from the six stations were also processed for the same three months to represent the snowfall accumulation. Then, the data were sorted by precipitation from small to large to define the snow drought and snow-abundant years, respectively. To determine the snow drought and snow-abundant years, we detected the year’s snowfall accumulation in less than half of the average snowfalls (76.9 mm) in the past two decades as the drought year (red line in Figure 3), and we found the year near the snow drought years and its snowfall accumulation far greater than average snowfall year as the abundant year.
In the nearly twenty years of the study period, there were four snow drought years in the Sanjiang Plain; compared with that in the average snowfall year, snowfall accumulation in the drought year was less than 50% and compared to that in the abundant year, it was approximately 37%. The average temperature was higher in the snow drought years than the abundant years from 2000 to 2019 in the same period (Figure 3). From the survey of local people, the snow drought year in 2019 was very serious, and this situation had not previously happened in the last 60 years. In this study, we analyzed and compared the snowfall and temperature data from 2000 to 2019, labeling 2003, 2012, 2014, and 2019 as the snow drought years and 2005, 2010, 2015, and 2016 as the snow-abundant years (Figure 3). Through the meteorological data and previous research, climate change does impact the region by decreasing snowfall and increasing temperature.
Furthermore, to compare how snowfall influenced the phenological period of the forest and grass in the snow drought and snow-abundant years, we selected four snow drought years and used the nearest snowy year as the corresponding snow-abundant year. To obtain more information, we used the interact-grouping method to analyze the forest and grassland phenological period changes. First, we, according to the winter snowfall accumulation in the study area to define the snow drought years. Then, the four drought years were separately intersected with the four snow-abundant years, which better contrasted the snow drought and snow-abundant year phenological period change trend. Finally, the matched pair of years were divided into 16 phenological periods within the interact-grouping method. (16 phenological periods: 2003–2005, 2003–2010, 2003–2015, 2003–2016, 2012–2005, 2012–2010, 2012–2015, 2012–2016, 2014–2005, 2014–2010, 2014–2015, 2014–2016, 2019–2005, 2019–2010, 2019–2015, and 2019–2016).

2.3.3. In Situ Phenology Data for Validating the Performance of MODIS Data

To verify the accuracy and the reliability of the calculated phenological period data, we used the in situ-collected data from National Science and Technology Infrastructure (http://rs.cern.ac.cn/index.jsp (accessed on 8 January 2021)). The Sanjiang Observation Station was in our study area, which could provide monitoring and reference data to compare with the calculated data by remote sensing. The in situ data covered the grass phenological period (SOS/EOS) in the years 2005/2010/2012/2014/2015 by auxiliary or integrated observation field in the Sanjiang Plain (Table 2) [42]. Among the collection in situ data, the average SOS/EOS of grass was 115 and 280 day of year (DOY), and the earliest SOS (112) was in the year 2014, whereas for EOS (274), it was in the year 2015.

2.4. Methods

2.4.1. Enhanced Vegetation Index Calculation in Annual Time Series

The EVI was selected to quantify vegetation growth activity. Compared to the normalized difference vegetation index (NDVI), the EVI reduced sensitivity to soil and atmospheric effects and remained sensitive to the variation in canopy density, where the NDVI becomes saturated [8,36]. The EVI in each pixel was calculated by using the following formula [36]:
EVI = G ρ N I R ρ r e d ρ N I R + C 1 ρ r e d C 2 ρ b l u e + L
where ρ N I R , ρ r e d , and ρ b l u e are NBAR values in the MODIS near-infrared, red, and blue bands; L is the canopy background adjustment, with a value of 1; C 1 = 6 and C 2 = 7.5 are aerosol resistance coefficients, and G = 2.5 is a gain factor.

2.4.2. Plant Phenological and Transition Data Calculation Methods

Here, the logistic model of vegetation growth was used to fit the annual variation of EVI. The logistic model used the following expression:
EVI t = C 1 + e a + b t + d
where t is time, meaning the day a and b are empirical coefficients associated with the rate of change in EVI, C is the maximum EVI value for a given vegetation type, and d is the EVI background value. These four parameters are determined by using the L-M algorithm [43].
The dates of the phenological transition from the EVI trajectory were calculated using the curvature-change rate [7], and the function is given by the following equation:
C c r = b 3 c z 3 z 1 z 1 + z 3 2 1 + z 3 + b 2 c 2 z 1 + z 4 + b c z 2 5 / 2 1 + z 2 1 + 2 z 5 z 2 1 + z 4 + b c z 2 3 / 2
where z = e a   +   b t , which are the transition dates related to the times at which the rate of change in curvature of the EVI exhibits local minima or maximums. We used this method to detect the onset of plant green-up.

3. Results

3.1. Spatial Distribution of Snowfall in the Sanjiang Plain in the Last Two Decades

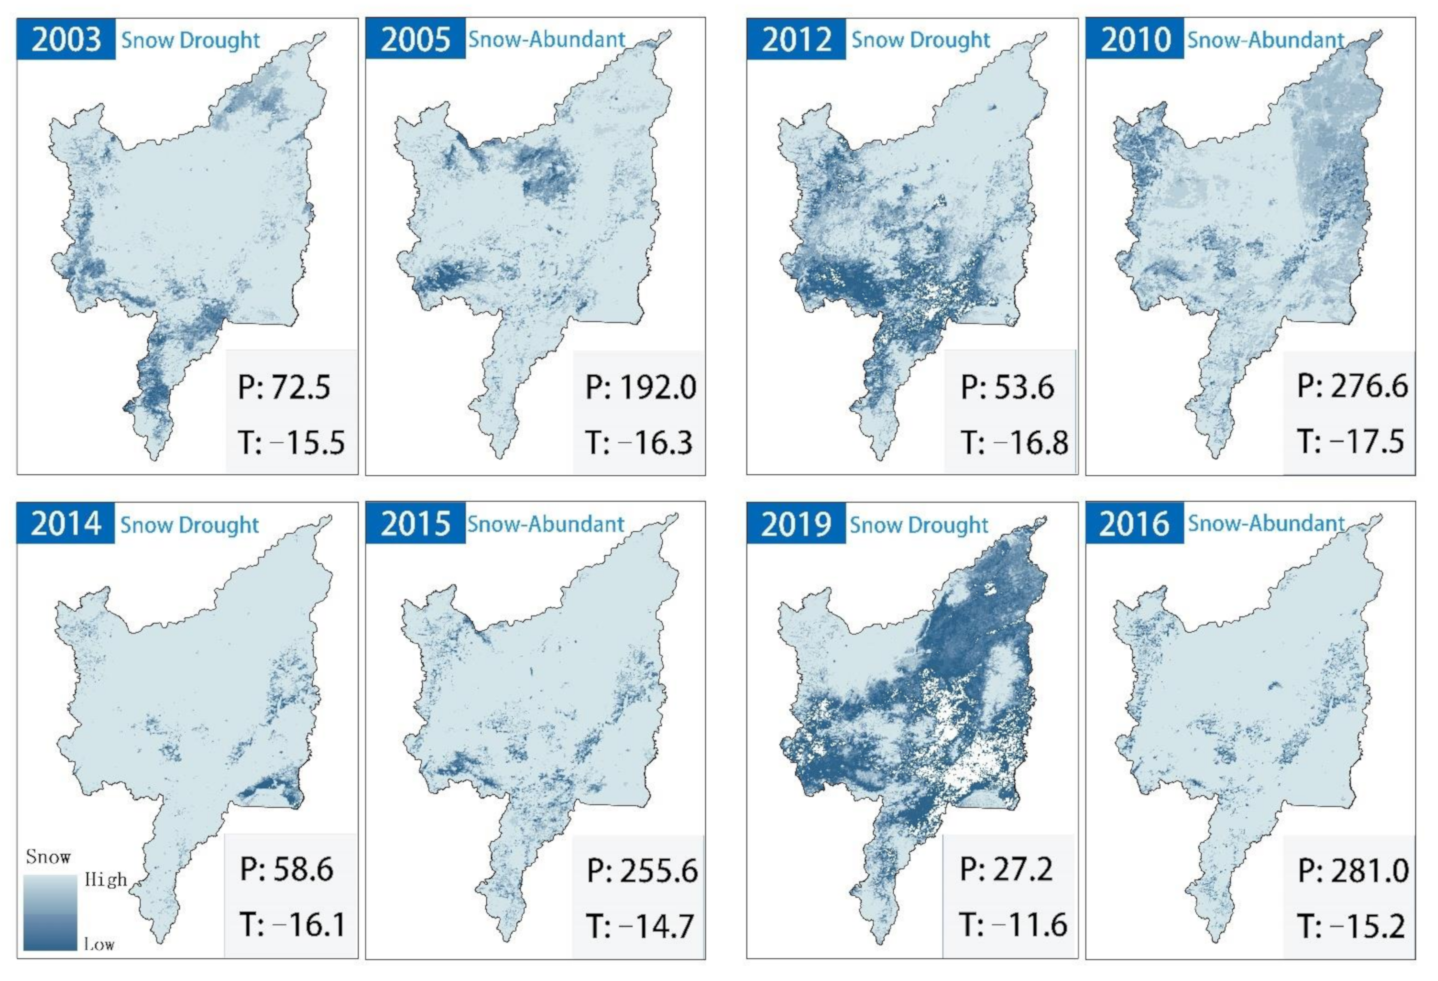
Through the remote sensing data (MOD10A2), the snowfall accumulation of four phenological periods (2003–2005, 2012–2010, 2014–2015, and 2019–2016) in snow drought and snow-abundant years in the Sanjiang Plain is displayed separately (Figure 4). In addition, this result divided the eight years into four phenological periods and could reveal the snow drought year adjacent snow-abundant year conditions more clearly and directly. From the spatial distribution of snow cover data, 2019 was the year of least snowfall accumulation in the past 20 years, which reached just 27.2 mm, and the temperature was the highest for the whole period.
Among the four phenological periods, there are two parts: the temperature increased with the decreased snowfall (2003–2005, 2012–2010, and 2019–2016), and the temperature decreased as the snowfall decreased (2014–2015). In the first part, the snowfall in the snow drought year was lower than a snow-abundant year at 119.5 mm, 223.0 mm, and 253.8 mm, and the decreasing rate in the snow drought year was 62.2%, 80.6%, and 90.3%, respectively. From the perspective of spatial distribution, the snow drought region spread from the local southern area to almost the whole area. These two features indicated that preseason drought conditions possess less snow accumulation, a wider decrease in snowfall and a larger gap between the snow drought and abundant year from 2000 to the 2019 year in the Sanjiang Plain. Furthermore, the 2019–2016 period had the strongest snowfall in contrast to the other three phenological periods. In the second part, the snow accumulation was decreased 197.0 mm, and the decrease ratio was 77.1%. Indeed, the phenological period 2014–2015 was the only period where its temperature (−16.1 °C) was lower in the snow drought year; compared to the others, this was abnormal and would produce dissimilar vegetation growth regulation.

3.2. Phenology Includes SOS and EOS of the Forest over the Past 20 Years

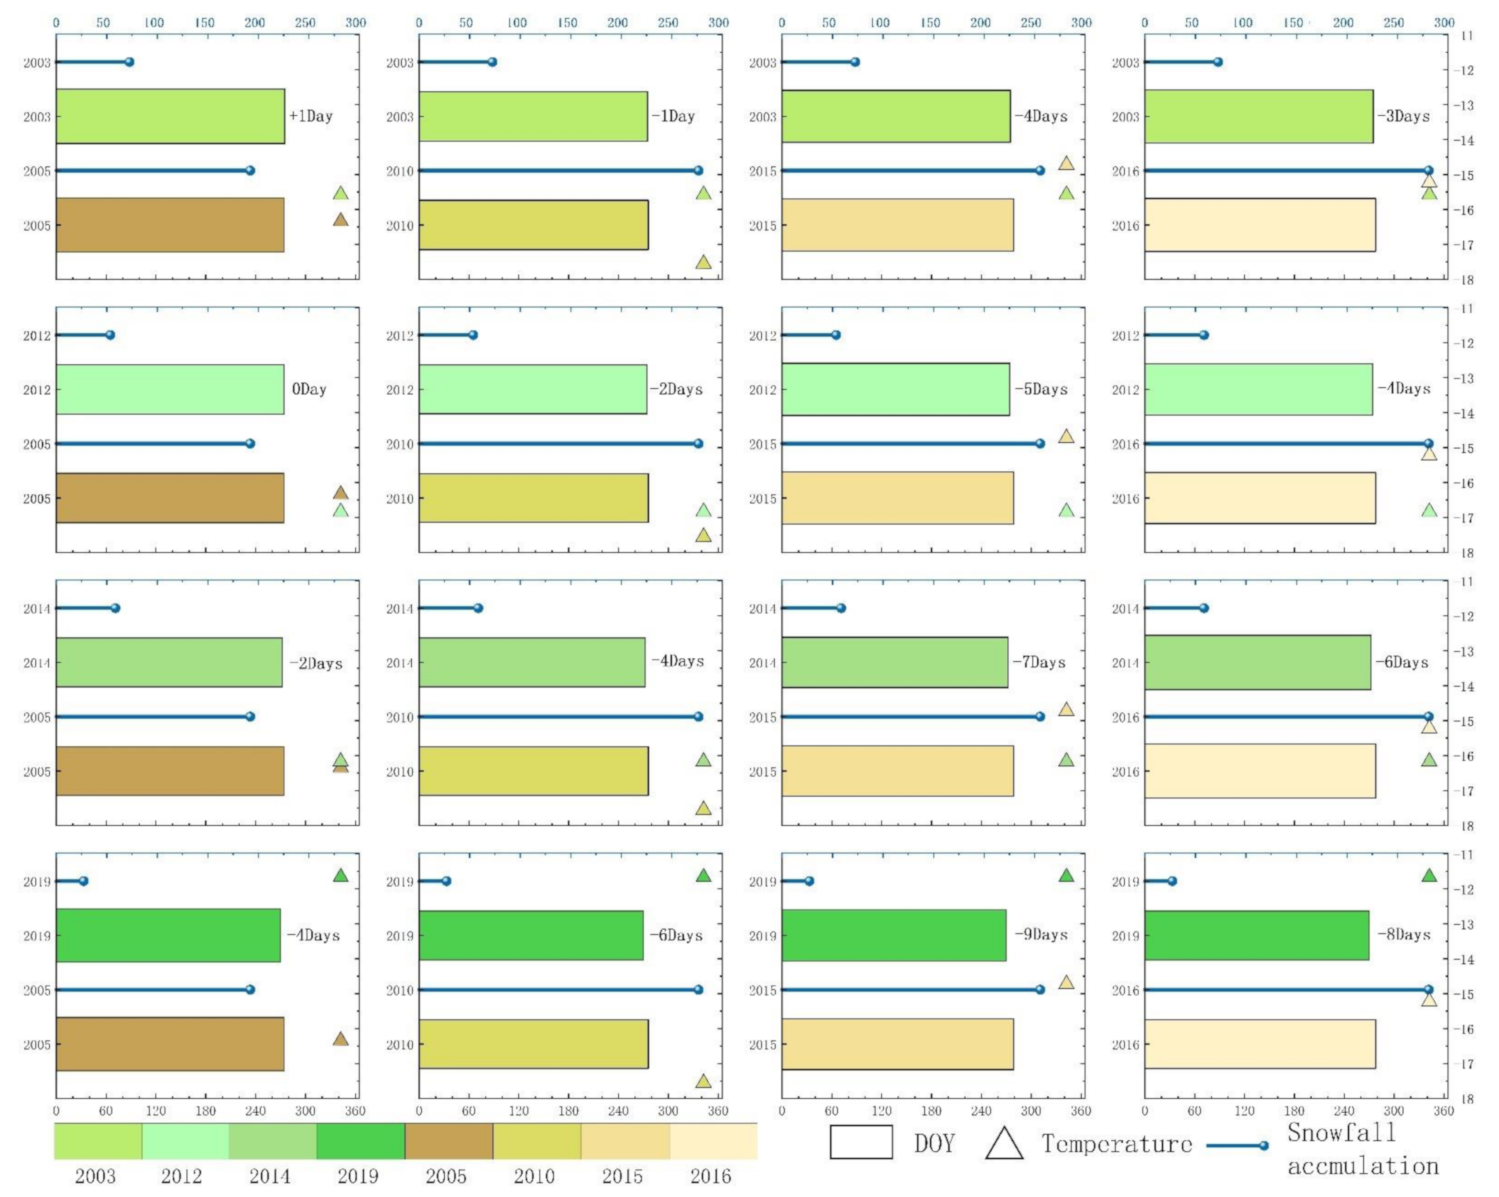
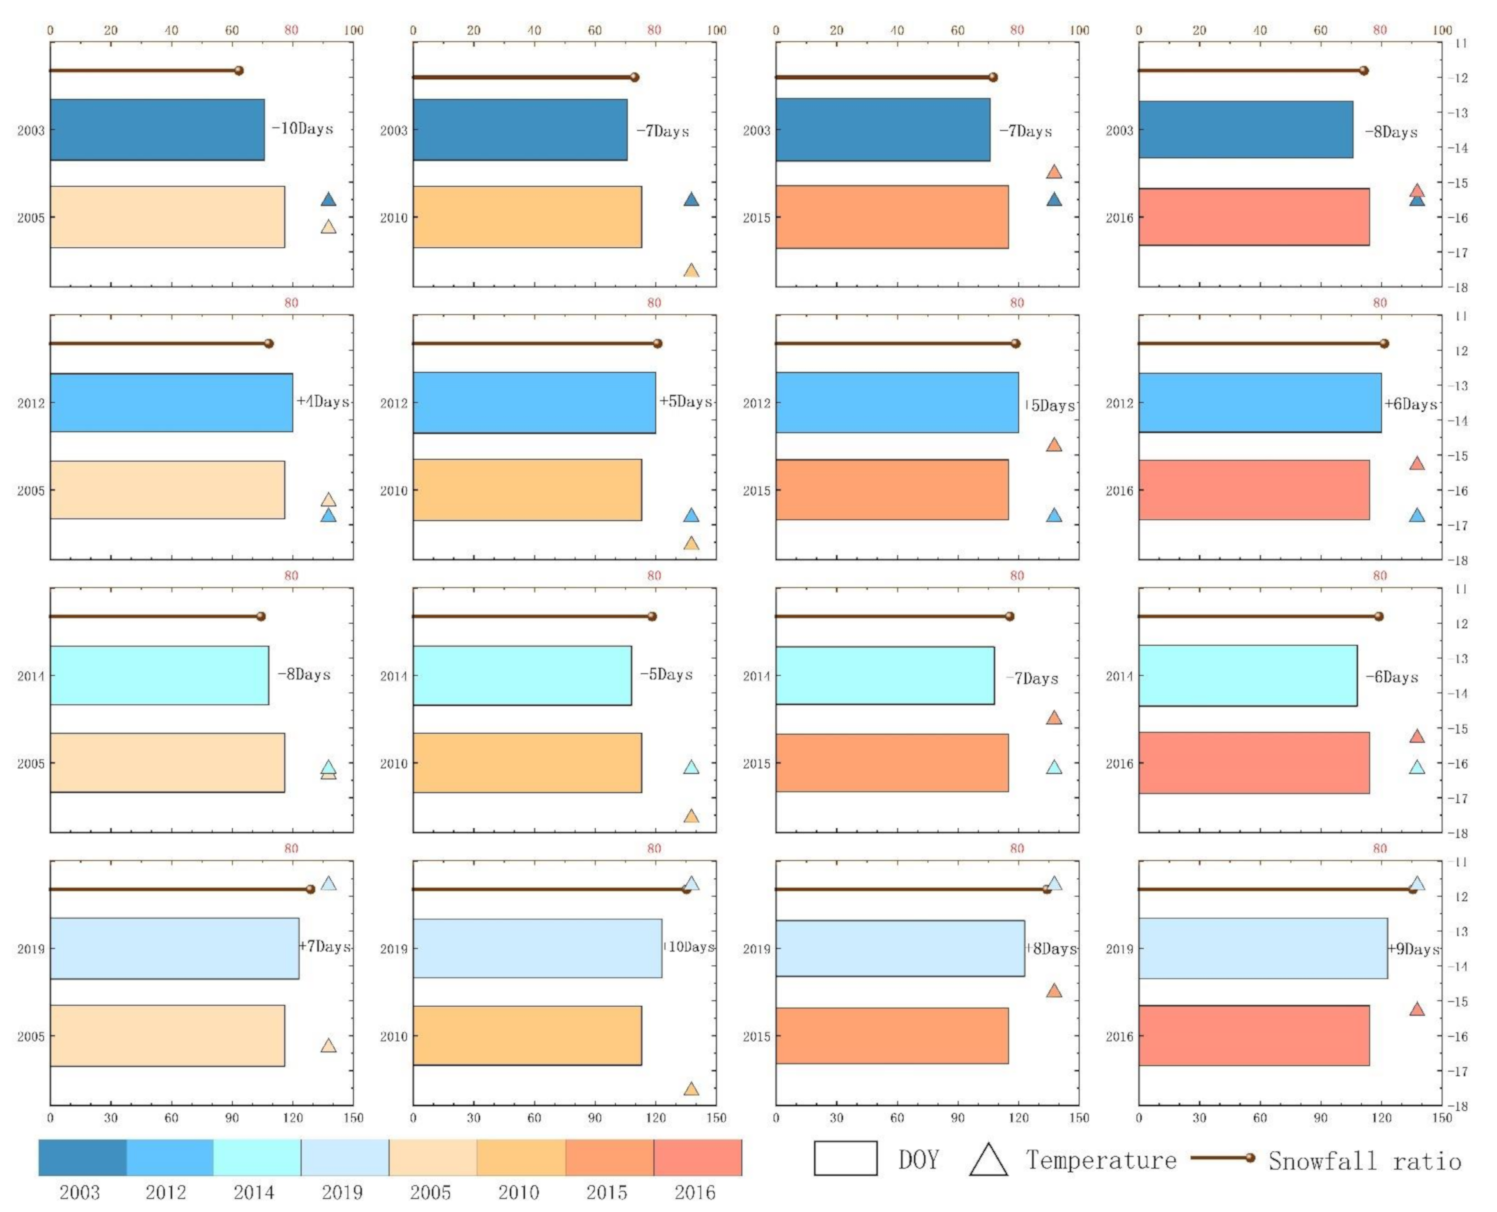
The main type of forest land in Sanjiang Plain contains coniferous forest, coniferous broadleaved mixed forest and deciduous broad-leaved mixed forest. The dominant species include pine trees, Quercus mongolica forest, Populus davidiana, white birch, etc. The forest growth period start of the season (SOS) was calculated for each year and compared among the 16 phenological periods with meteorological data (Figure 5). As expected, 12 of the 16 phenological periods (2003–2005, 2003–2010, 2003–2015, 2003–2016, 2012–2005, 2014–2005, 2014–2010, 2014–2015, 2014–2016, 2019–2005, 2019–2010, and 2019–2016) had data that showed a trend of SOS ahead of the forest in snow drought years, with an average advance of 6 days and an advanced rate of 8.3%. Three of the 16phenological periods (2012–2010, 2012–2015, and 2012–2016) had prolonged SOS in the snow drought year, with an average postponement of 6 days and a rate of 5.8%, and only one period (2019–2015) remained with unchanged SOS.
The twelve advanced phenological periods represented 75% of the data, and in seven of them, the temperature was higher in the snow drought year. Thus, the temperature factor was not strongly affecting the forest SOS. The most advanced period was 2014–2005 with a 16 day early, maximum-advanced rate of 22.9%, and its snowfall differed 133.4 mm. One-day ahead was the most frequent date, and it occurred four times (2003–2015, 2012–2005, 2019–2010, and 2019–2016). The abnormal trend in the SOS of the forest included periods 2012–2010, 2012–2015, and 2012–2016, where the temperature in 2012 was the second-lowest in all selected years. It is shown that the postponed SOS in the forest may have been because of the temperature.
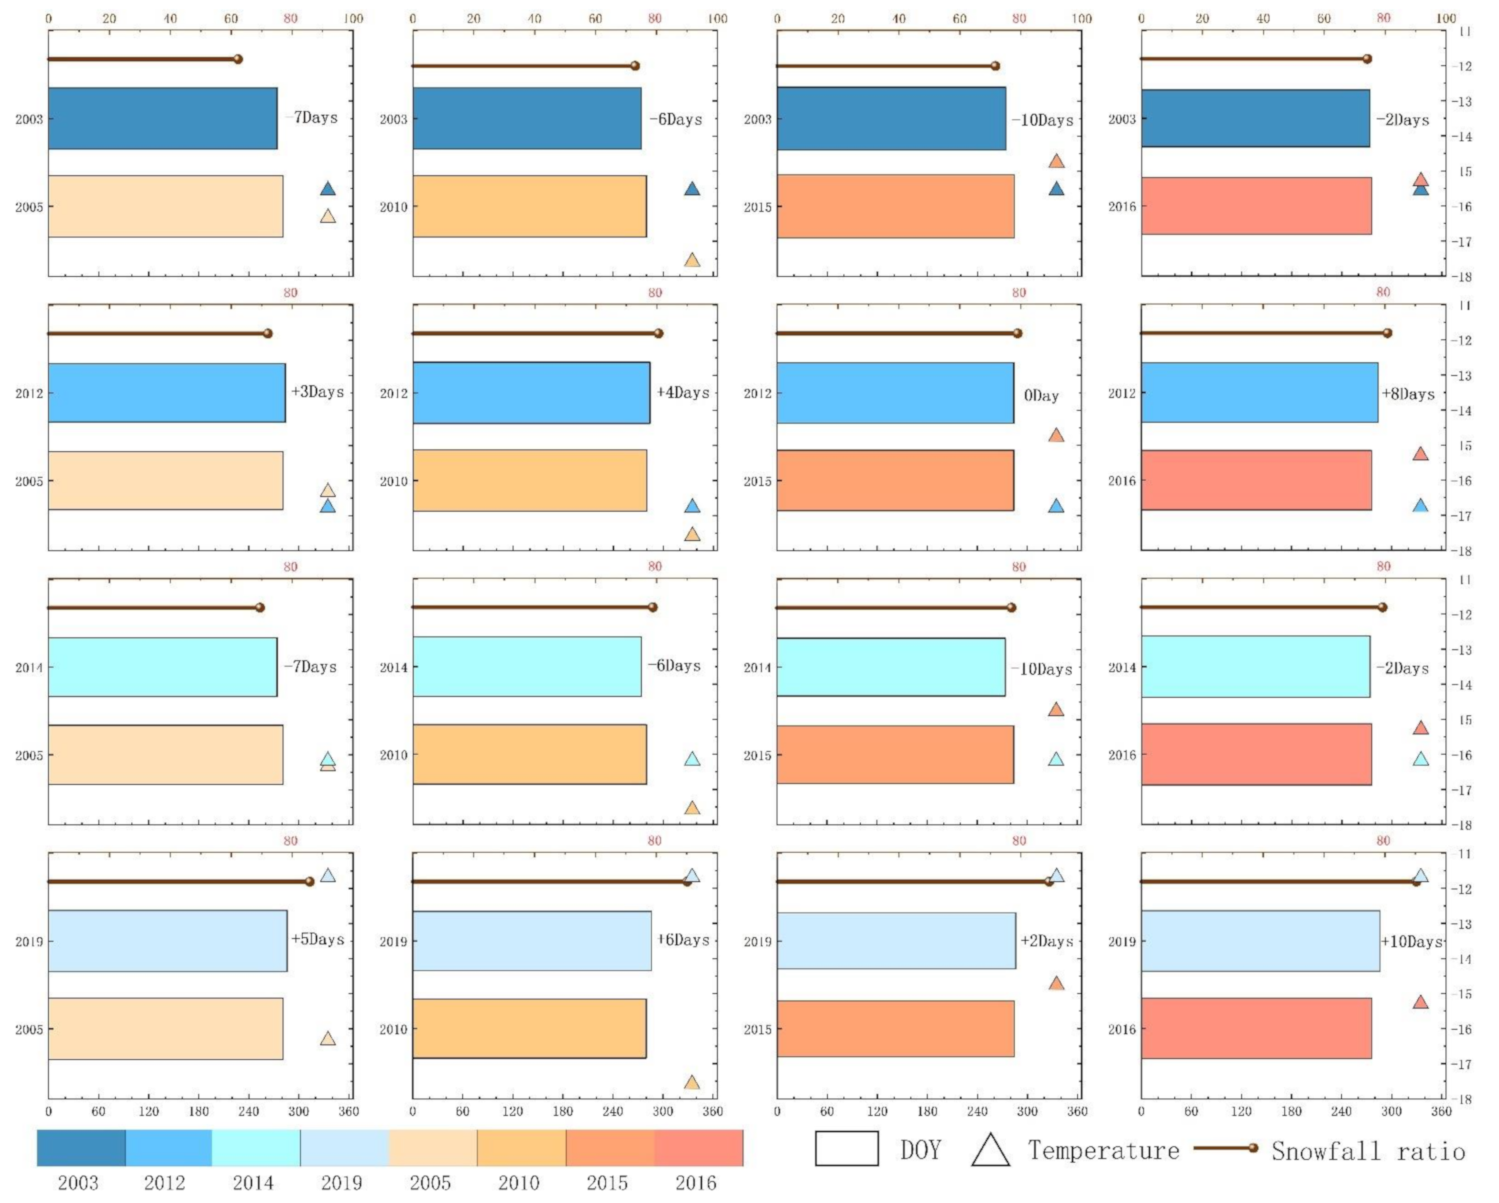
The vegetation growth phenology indicators included the start of the season (SOS) and end of the season (EOS). We also analyzed the EOS of the forest in major years and interacted each one with two climate factors (Figure 6). Most of the results (14 phenological periods: 2003–2010, 2003–2015, 2003–2016, 2012–2010, 2012–2015, 2012–2016, 2014–2005, 2014–2010, 2014–2015, 2014–2016, 2019–2005, 2019–2010, 2019–2015, and 2019–2016) showed a trend of advance in the EOS of the forest in snow drought years, with an average advance of 5 days and 7.1% in the ahead rate. The advanced date of EOS was one day shorter than the SOS for the forest. In one period (2012–2005), the end of the season remained unchanged, and in another period (2003–2005), EOS was postponed for just one day. In the 2019–2015 period, the EOS in 2019 was nine days earlier than 2015, which is the maximum advanced trend. The date of forest EOS was around the beginning of October. The EOS showed a similar advanced pattern to SOS for the forest, which reflected that the beginning of plant growth determines the end of the season.

3.3. Phenology Including the SOS and EOS of the Grass in the Past 20 Years

The in situ data from the grass phenological period obtained at the Sanjiang Observation Station by the National Science and Technology Infrastructure (Table 2) were used to validate the accuracy and quality of our data. For the SOS of the grass, our calculated date deviated 2 days on average from the in situ data, and the greatest difference was 4 days later/earlier in the year 2014/2012. For the EOS of the grass, compared with the measured data, the average number of deviation days was 6 days, and the greatest difference was 10 days later/earlier in the year 2014/2015. In all 10 of the validation data, 8 of the periods were within a 4-day error range, which proved the phenological period data from our results were dependable.
Grass type in Sanjiang Plain including shrubs, aquatic herbs, wetland meadow and weed meadow and the dominant species such as Carex pseudocuraica, Deyeuxia angustifolia, etc. We used EVI data to calculate the SOS of grass in the eight key years (Figure 7). We found a threshold that influences the phenological periods of grass in this area. This threshold was the ratio in snowfall amount from the snow drought year and the normal year, whose value was 80%. Above this threshold, the phenological periods will present a postponed trend, whereas, below it, the phenological periods of grass in a snow drought year will be advanced. In the 16 phenological periods, there were 14 phenological periods (2003–2005, 2003–2010, 2003–2015, 2003–2016, 2012–2010, 2012–2016, 2014–2005, 2014–2010, 2014–2015, 2014–2016, 2019–2005, 2019–2010, 2019–2015, and 2019–2016) that fit the threshold pattern, and only the 2012–2005 and 2012–2015 periods were exceptions.
The average advanced and proposed days were 7 and 8, and the relevant ratio was 12.5% and 16.7%, respectively. The periods including 2003 and 2014, showed an advanced tendency in their SOS pattern in the grass, while in the periods including 2012 or 2019, the snow drought years for the SOS of grass remained delayed. In the 2003–2005 period, the snowfall ratio was the minimum (64.24%), and the SOS was the most advanced (10-days), whereas the maximum snowfall ratio in the sixteen phenological periods was 90.32% (2019–2010) and 90.17% (2019–2016), respectively, and their SOS for the grass was prolonged 9-days/10-days. This pattern confirmed that less snowfall promoted grass germination, and more snowfall restrained the grass from early maturation. The date range of grass SOS was around April to May, which was half a month later than the forest. This result proved that the forest started earlier than the grass in the spring growth time. Last, the two exceptional periods may have been affected by the low temperature in the year 2012, which was not beneficial for grass sprouting and growth.
Eight major years of grass EOS were revealed with temperature and snowfall in the Sanjiang Plain (Figure 8). Similar to that for the SOS, a threshold also existed for the process of grass EOS. In the grass EOS, 13 phenological periods (2003–2005, 2003–2010, 2003–2015, 2003–2016, 2012–2010, 2014–2005, 2014–2010, 2014–2015, 2014–2016, 2019–2005, 2019–2010, 2019–2015, and 2019–2016) maintained the threshold pattern; one period (2012–2015) was unchanged; and two periods (2012–2005, 2012–2016) did not fit the relationship. The average advanced and proposed days were 5 and 6, and the ratios were 20.0% and 12.5%, respectively, which were shorter than the SOS of grass. The four periods in 2012 that did not have a very strong relationship might have been influenced by the low temperature. Additionally, the EOS date of grass was about the first half of October. Compared with those of the forest, the grass SOS and EOS were both later. On average, the SOS of the forest and grass was 98 (DOY) and 114 (DOY), respectively, and the EOS was 275 (DOY) and 280 (DOY). Thus, the SOS and EOS in the grass were later than the forest at 17 days and 5 days, respectively. This phenomenon illustrated that grass growth is much slower than forest growth in the Sanjiang Plain.

3.4. Plant Biomass and Its Spatial Distribution in Snow Drought Years

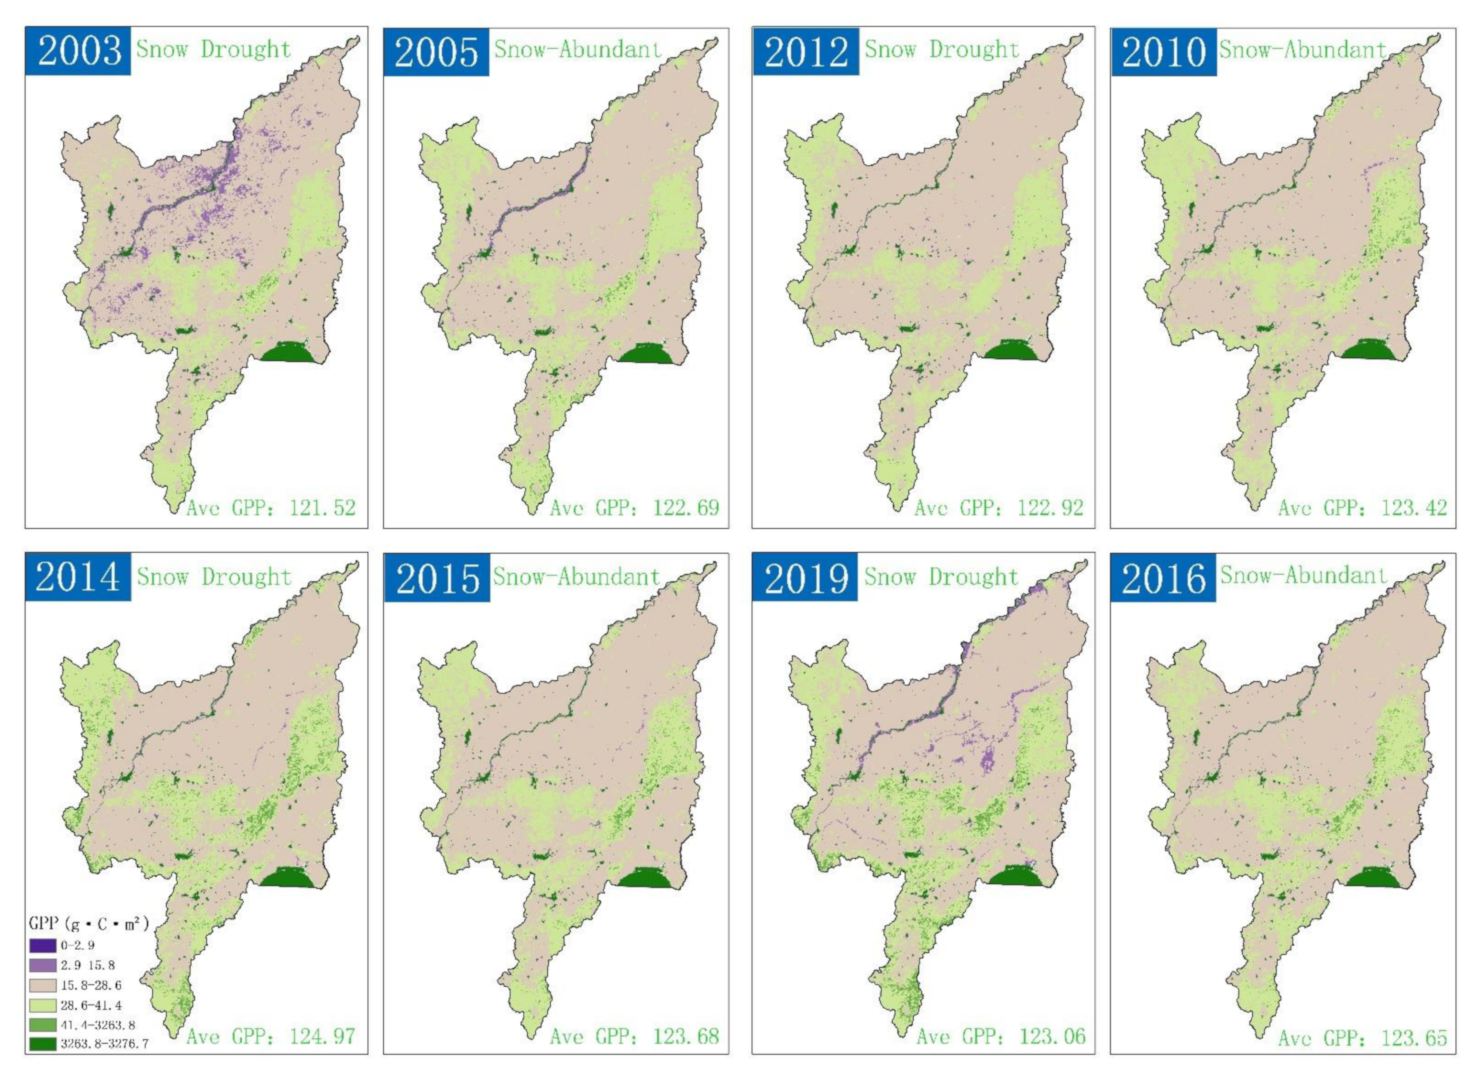
GPP was selected to detect the variation of plant biomass in the snow drought and snow-abundant years. Based on the MOD17A2 data, we obtained the average GPP values in the Sanjiang Plain from March to October in each year (Figure 9) because of the length of the growing season. In the entire period, compared to the snow-abundant years, on average, the GPP value in the snow drought years was less than 0.61%. The spatial distribution of GPP was higher in the middle and south parts of the area, lower in the north, and decreasing from southwest to northeast. The GPP variation trend from snow-abundant year to drought year was different among the four selected periods.
One part (including phenological periods 2003–2005, 2012–2010, and 2019–2016) showed a decreased GPP trend in the drought year. The GPP value declined 0.96%, 0.41%, and 0.48%, and the snowfall decreased 119.5 mm, 223.0 mm, and 253.8 mm, respectively, with the corresponding periods. In the 2003–2005 period, the GPP value in 2003 showed less in the west and middle of the region in cultivated land, while in the 2019–2016 period, the forest performed at a higher value in the drought year 2019. The other part (period: 2014–2015) had an increased GPP value in the drought year, and it added 1.0% more than that in the snow-abundant year. This result may be due to the temperature increase of 1.4 °C from 2014 to 2015. Additionally, the year 2014 had the maximum GPP value of 124.97 kg·C·m2 over the past two decades. Higher temperature promoted plant biomass accumulation and active vegetation growth in mid-high latitude areas.

4. Discussion

4.1. How Did Snow Drought Influence the Phenological Period of Forest and Grass Directly and Indirectly?

Increasingly more researchers have found that snow accumulation is decreasing, and the temperature is increasing in mid-high latitude areas because of the abnormal weather conditions caused by climate change [9,40,44]. In fact, snow drought events represent the extreme climate change within snow accumulation and air temperature. Our results indicated that low snowpack influenced SOS and EOS more for forest and grass phenological periods than snowy conditions. In addition, the forest and grass hold different changing phenological periods in the mid-high latitude area. For the forest, the phenological periods advanced with the reduction of snowfall in winter. Less snowfall means less deeply frozen snow, which needs to be thawed in the spring, giving rise to the warm temperature in the spring. For the grassland, the threshold divided the snowfall into two types: more than 80% represents less snowfall, and less than this amount means that relatively more snowfall remains. The changes in melted snowfall in the snow drought year bring plant germination ahead and early maturation [45]. The soil moisture reservoir is the pathway by which snowfall reaches upland ecosystems. Water stored by snowfall in winter could provide essential nutrients and water resources for spring vegetation growth [46]. Moreover, less snowpack appears to affect root growth and soil microorganism activities strongly and then influence the soil respiration rate [47]. This change in soil microbial physiological processes drives the variation in plant growing season.
In fact, not only the snow accumulation decreased, but also the temperature was high in the snow drought period. Temperature is a key factor that affects the forest and grass phenological period while making them terminate the dormancy period earlier and begin spring-up time. The increasing temperature exerts rises in both air and soil temperature, and higher temperature accelerates the root and shoots growth. In addition, elevated temperature benefits plant root system nutrient acquisition from several soil layers, thereby increasing the vegetation growth rate [48]. Furthermore, with a warming climate, the leaf area allocation and plant nitrogen productivity are improved in a complex manner to affect terrestrial ecosystems [49].
Moreover, the forest production precedes grass production for nearly 15 days, which is due to the diverse vegetation characteristics. The reason owes to the fact that the forest obtains nutrients from both root systems and twigs, which hold richer sources of nutrition than the grassland [50]. In addition, a forest with dense branches and leaves absorbs more light energy than grass. Compared with that in the grassland, the snow on branches disappears due to wind and sunlight, whereas the snow on the ground prefers to remain longer and delays the germination time [51]. Thus, the forest land phenological periods are ahead of those of grassland.
Semenchuk et al. [52] found that the onset of the green-up was 4–9 days earlier on average in the warmer urban areas in the mid-high latitude and indicated well-defined plant growing patterns dependent on latitude. Zhang et al. [8] found that winter warming influenced the growth and abundance of flowers, and aboveground flower species affect buds in various degrees in the High Arctic area. Dunne et al. [53] investigated climate change and flowering phenology by experiment, and the conclusion was that there was advanced timing of flowering with the earlier snowmelt date and higher soil temperature in Gunnison County, Colorado. In the future, these climate change external environmental conditions will deeply affect natural and agricultural ecosystems.

4.2. Insight from This Research on the Relationship between Future Climate Change and Vegetation Growth

Variation in plant phenological periods is influenced by the low snowfall, and the warm temperature was a major challenge for the region’s ecosystem in the mid-high latitude area. To predict the response of future climate fluctuations in this region, it is imperative to understand more fully how temperature and precipitation sensitivity affect plant phenology [54,55]. In our site, GPP was one of the major drivers of ecosystem function, which was slightly decreased in the snow drought years [56]. Thus, the insufficient snowfall could reduce the plant growth or even the crop yield. Chen et al. [57] used a model that found that in a dry season period, the GPP of plants will show a sharp decrease in tropical regions. This dry season condition is similar to the snow drought in our research. Under the snow drought condition, the forest and grassland both adjust their growing processes, which leads to the degradation of productivity, thereby destroying the stability of the local ecosystem. Decreased water will also challenge agricultural production, and more surface water and groundwater resources will be consumed for higher crop production in the future; water risk may not only be in arid regions but may also occur in mid-high latitude areas.
Global temperature and the frequency of extreme weather have risen over the past several decades [58]. Indeed, global climate change is a potential challenge to the natural ecosystem and agroecosystem. In other regions of the world, the climate has also been rapidly changing. Menzel et al. [59] investigated more than 125,000 observational series in 21 European countries (1971–2000) and found that 78% of plant phenology will be ahead, on average, by a spring/summer advance date of 2.5 days each decade. In the western US and in Europe, it appears that there is a challenge of declining winter snowpack in mountain ecosystems and holding constant the temperature effect in soil carbon cycling [60]. In the Cascade Mountains and northern California, as well as in western North America, the snow resources have already declined as the earth’s climate has warmed, which transfers less water from winter to dry summer [61]. With a warmer environment in the Central Alps in Austria, the treeline ecotone impacted by severe weather conditions, such as soil drought in summer, should be considered, as climate change puts pressure on vegetation [62]. Faced with the climate challenge, the world ecosystem was explored to alter the critical climate factors and to provide awareness of the future development trend.

5. Conclusions

For exploring the influences on forest and grass from the snow drought in the mid-high latitude area, logistic modeling and multisource remote sensing data were used to calculate the vegetation phenological periods in forest and grass over the past 20 years in the Sanjiang Plain. The results showed that snow drought events had happened more frequently and seriously in the mid-high latitude area in the last two decades; in the snow drought year, the SOS of the forest has been advanced ahead by six days and the EOS by five days; the threshold divided snowfall into two parts: above the 80% threshold, the SOS/EOS is prolonged by 8/6 days, and below the 80% threshold, the SOS/EOS comes early by 7/5 days. At the same time, the plant biomass GPP in the snow drought year was less 0.61% than that in the abundant year. These findings suggest the snow drought could influence the phenology and growth conditions in the mid-high latitude area.
Snowfall is an essential water resource for plant growth and gives a contribution to the large water cycle. Especially in the mid-high latitude, snowfall will replace rainfall in the winter for a long time and makes an effect on the following growing season. This research first explored the threshold in the grass phenology to evaluate the snowfall and plant growth relationship; meanwhile, this study analyzed extreme snowfall in the mid-high latitude and gave help for assessing the continuing climate change evolutions. In the future, deeply understanding the regional vegetation growth features of climate event response will guide forestry and prataculture production and protect local vegetation ecosystems, where rapid climate change is projected to occur.

Author Contributions

Conceptualization, H.L. and M.C.; methodology, H.L. and M.C.; software, X.W.; validation, X.R., and X.W.; formal analysis, H.L.; investigation, X.W.; resources, H.L. and M.C.; data curation, H.L. and X.R.; writing—original draft preparation, H.L. and X.W.; writing—review and editing, X.R., P.W. and Y.G.; visualization, P.W. and Y.G.; supervision, S.Y. and M.C.; project administration, S.Y.; funding acquisition, H.L. All authors have read and agreed to the published version of the manuscript.

Funding

The authors would also like to thank the administrators at the Bawujiu Farm, and this research was funded by the National Natural Science Foundation of China (Grant Nos. U1812401, 41801334, U1603241, and 41875044), the National Key Project for R&D (Grant No. 2018YFC0407900), the Fundamental Research Funds for the Central Universities (Grant No. 2017NT11), and the Opening Fund of State Key Laboratory of Geohazard Prevention and Geoenvironment Protection(Chengdu University of Technology) (Grant No. SKLGP2020K005).

Data Availability Statement

Publicly available datasets were analyzed in this study. See the Materials and Methods section for details.

Conflicts of Interest

We declare that we do not have any commercial or associative interest that represents a conflict of interest in connection with the work submitted.

References

  1. Dierauer, J.R.; Allen, D.M.; Whitfield, P.H. Snow Drought Risk and Susceptibility in the Western United States and Southwestern Canada. Water Resour. Res. 2019, 55, 3076–3091. [Google Scholar] [CrossRef]
  2. Lian, X.; Piao, S.; Li, L.Z.X.; Li, Y.; Huntingford, C.; Ciais, P.; Cescatti, A.; Janssens, I.A.; Peñuelas, J.; Buermann, W.; et al. Summer soil drying exacerbated by earlier spring greening of northern vegetation. Sci. Adv. 2020, 6, eaax0255. [Google Scholar] [CrossRef] [Green Version]
  3. Kumar, M.; Wang, R.; Link, T.E. Effects of more extreme precipitation regimes on maximum seasonal snow water equivalent. Geophys. Res. Lett. 2012, 39. [Google Scholar] [CrossRef] [Green Version]
  4. Räisänen, J. Twenty-first century changes in snowfall climate in Northern Europe in ENSEMBLES regional climate models. Clim. Dyn. 2016, 46, 339. [Google Scholar] [CrossRef] [Green Version]
  5. Ajami, H.; Meixner, T.; Dominguez, F.; Hogan, J.; Maddock Iii, T. Seasonalizing Mountain System Recharge in Semi-Arid Basins-Climate Change Impacts. Groundwater 2012, 50, 585–597. [Google Scholar] [CrossRef] [PubMed]
  6. Yang, X.; Henry, H.A.L.; Zhong, S.; Meng, B.; Wang, C.; Gao, Y.; Sun, W. Towards a mechanistic understanding of soil nitrogen availability responses to summer vs. winter drought in a semiarid grassland. Sci. Total Environ. 2020, 741, 140272. [Google Scholar] [CrossRef] [PubMed]
  7. Schwinning, S.; Starr, B.I.; Ehleringer, J.R. Summer and winter drought in a cold desert ecosystem (Colorado Plateau) part I: Effects on soil water and plant water uptake. J. Arid Environ. 2005, 60, 547–566. [Google Scholar] [CrossRef]
  8. Zhang, X.; Friedl, M.A.; Schaaf, C.B.; Strahler, A.H. Climate controls on vegetation phenological patterns in northern mid- and high latitudes inferred from MODIS data. Glob. Chang. Biol. 2004, 10, 1133–1145. [Google Scholar] [CrossRef]
  9. Ouyang, W.; Gao, X.; Hao, Z.; Liu, H.; Shi, Y.; Hao, F. Farmland shift due to climate warming and impacts on temporal-spatial distributions of water resources in a middle-high latitude agricultural watershed. J. Hydrol. 2017, 547, 156–167. [Google Scholar] [CrossRef]
  10. Devito, K.J.; Creed, I.F.; Fraser, C.J.D. Controls on runoff from a partially harvested aspen-forested headwater catchment, Boreal Plain, Canada. Hydrol. Process. 2005, 19, 3–25. [Google Scholar] [CrossRef]
  11. Wiesnet, D. Winter snow drought. Eos. Trans. Am. Geophys. Union 1981, 62, 137. [Google Scholar] [CrossRef]
  12. Rood, S.B.; Foster, S.G.; Hillman, E.J.; Luek, A.; Zanewich, K.P. Flood moderation: Declining peak flows along some Rocky Mountain rivers and the underlying mechanism. J. Hydrol. 2016, 536, 174–182. [Google Scholar] [CrossRef]
  13. Allamano, P.; Claps, P.; Laio, F. Global warming increases flood risk in mountainous areas. Geophys. Res. Lett. 2009, 36. [Google Scholar] [CrossRef] [Green Version]
  14. Harpold, A.; Dettinger, M.; Rajagopal, S. Defining Snow Drought and Why It Matters. Eos Trans. Am. Geophys. Union 2017. [Google Scholar] [CrossRef]
  15. Alexander, M.; Scott, J.; Swales, D.; Hughes, M.; Mahoney, K.; Smith, C. Moisture Pathways into the US Intermountain West Associated with Heavy Winter Precipitation Events. J. Hydrometeorol. 2015, 16, 1184–1206. [Google Scholar] [CrossRef] [Green Version]
  16. Sproles, E.A.; Roth, T.R.; Nolin, A.W. Future snow? A spatial-probabilistic assessment of the extraordinarily low snowpacks of 2014 and 2015 in theOregonCascades. Cryosphere 2017, 11, 331–341. [Google Scholar] [CrossRef] [Green Version]
  17. Westerling, A.L.; Hidalgo, H.G.; Cayan, D.R.; Swetnam, T.W. Warming and earlier spring increase Western U.S. forest wildfire activity. Science 2006, 313, 940–943. [Google Scholar] [CrossRef] [Green Version]
  18. Bales, R.C.; Goulden, M.L.; Hunsaker, C.T.; Conklin, M.H.; Hartsough, P.C.; O’Geen, A.T.; Hopmans, J.W.; Safeeq, M. Mechanisms controlling the impact of multi-year drought on mountain hydrology. Sci. Rep. 2018, 8, 690. [Google Scholar] [CrossRef] [PubMed] [Green Version]
  19. Harpold, A. Diverging Sensitivity of Soil Water Stress To Changing Snowmelt Timing in the Western U.S. Adv. Water Resour. 2016, 92, 116–129. [Google Scholar] [CrossRef] [Green Version]
  20. Mote, P.W.; Rupp, D.E.; Li, S.; Sharp, D.J.; Otto, F.; Uhe, P.F.; Xiao, M.; Lettenmaier, D.P.; Cullen, H.; Allen, M.R. Perspectives on the causes of exceptionally low 2015 snowpack in the western United States. Geophys. Res. Lett. 2016, 43, 10980–10988. [Google Scholar] [CrossRef]
  21. Hatchett, B.J.; McEvoy, D.J. Exploring the Origins of Snow Drought in the Northern Sierra Nevada, California. Earth Interact. 2018, 22, 1–13. [Google Scholar] [CrossRef]
  22. Berghuijs, W.R.; Woods, R.A.; Hrachowitz, M. A precipitation shift from snow towards rain leads to a decrease in streamflow. Nat. Clim. Chang. 2014, 4, 583–586. [Google Scholar] [CrossRef] [Green Version]
  23. Adam, J.C.; Hamlet, A.F.; Lettenmaier, D.P. Implications of global climate change for snowmelt hydrology in the twenty-first century. Hydrol. Process. 2009, 23, 962–972. [Google Scholar] [CrossRef]
  24. Badhwar, G.D. Use of LANDSAT-derived profile features for spring small-grains classification. Int. J. Remote Sens. 1984, 5, 783–797. [Google Scholar] [CrossRef]
  25. Zeng, L.; Wardlow, B.D.; Xiang, D.; Hu, S.; Li, D. A review of vegetation phenological metrics extraction using time-series, multispectral satellite data. Remote Sens. Environ. 2020, 237, 111511. [Google Scholar] [CrossRef]
  26. Piao, S.; Fang, J.; Zhou, L.; Ciais, P.; Zhu, B. Variations in satellite-derived phenology in China’s temperate vegetation. Glob. Chang. Biol. 2006, 12, 672–685. [Google Scholar] [CrossRef]
  27. Tateishi, R.; Ebata, M. Analysis of phenological change patterns using 1982–2000 Advanced Very High Resolution Radiometer (AVHRR) data. Int. J. Remote Sens. 2004, 25, 2287–2300. [Google Scholar] [CrossRef]
  28. Shen, M.; Tang, Y.; Chen, J.; Zhu, X.; Zheng, Y. Influences of temperature and precipitation before the growing season on spring phenology in grasslands of the central and eastern Qinghai-Tibetan Plateau. Agric. For. Meteorol. 2011, 151, 1711–1722. [Google Scholar] [CrossRef]
  29. Vitasse, Y.; Delzon, S.; Dufrêne, E.; Pontailler, J.-Y.; Louvet, J.-M.; Kremer, A.; Michalet, R. Leaf phenology sensitivity to temperature in European trees: Do within-species populations exhibit similar responses? Agric. For. Meteorol. 2009, 149, 735–744. [Google Scholar] [CrossRef]
  30. Jenerette, G.D.; Scott, R.L.; Huete, A.R. Functional differences between summer and winter season rain assessed with MODIS-derived phenology in a semi-arid region. J. Veg. Sci. 2010, 21, 16–30. [Google Scholar] [CrossRef]
  31. Wardlow, B.D.; Egbert, S.L. Large-area crop mapping using time-series MODIS 250m NDVI data: An assessment for the U.S. Central Great Plains. Remote Sens. Environ. 2008, 112, 1096–1116. [Google Scholar] [CrossRef]
  32. Tan, B.; Morisette, J.T.; Wolfe, R.E.; Gao, F.; Ederer, G.A.; Nightingale, J.; Pedelty, J.A. An enhanced TIMESAT algorithm for estimating vegetation phenology metrics from MODIS data. IEEE J. Sel. Top. Appl. Earth Obs. Remote Sens. 2011, 4, 361–371. [Google Scholar] [CrossRef]
  33. Peng, D.; Wu, C.; Li, C.; Zhang, X.; Liu, Z.; Ye, H.; Luo, S.; Liu, X.; Hu, Y.; Fang, B. Spring green-up phenology products derived from MODIS NDVI and EVI: Intercomparison, interpretation and validation using National Phenology Network and AmeriFlux observations. Ecol. Indic. 2017, 77, 323–336. [Google Scholar] [CrossRef]
  34. Ma, X.; Huete, A.; Yu, Q.; Coupe, N.R.; Davies, K.; Broich, M.; Ratana, P.; Beringer, J.; Hutley, L.B.; Cleverly, J.; et al. Spatial patterns and temporal dynamics in savanna vegetation phenology across the North Australian Tropical Transect. Remote Sens. Environ. 2013, 139, 97–115. [Google Scholar] [CrossRef]
  35. Xiao, X.; Hagen, S.; Zhang, Q.; Keller, M.; Moore, B. Detecting leaf phenology of seasonally moist tropical forests in South America with multi-temporal MODIS images. Remote Sens. Environ. 2006, 103, 465–473. [Google Scholar] [CrossRef]
  36. Huete, A.; Didan, K.; Miura, T.; Rodriguez, E.P.; Gao, X.; Ferreira, L.G. Overview of the radiometric and biophysical performance of the MODIS vegetation indices. Remote Sens. Environ. 2002, 83, 195–213. [Google Scholar] [CrossRef]
  37. Lou, H.; Yang, S.; Zhao, C.; Shi, L.; Wu, L.; Wang, Y.; Wang, Z. Detecting and analyzing soil phosphorus loss associated with critical source areas using a remote sensing approach. Sci. Total Environ. 2016, 573, 397–408. [Google Scholar] [CrossRef] [PubMed]
  38. Xu, X.; Tian, H. Methane exchange between marshland and the atmosphere over China during 1949-2008. Glob. Biogeochem. Cycles 2012, 26. [Google Scholar] [CrossRef]
  39. Ouyang, W.; Xu, Y.; Hao, F.; Wang, X.; Siyang, C.; Lin, C. Effect of long-term agricultural cultivation and land use conversion on soil nutrient contents in the Sanjiang Plain. Catena 2013, 104, 243–250. [Google Scholar] [CrossRef]
  40. Fu, Q.; Li, T.; Li, T.; Li, H. Temporal-spatial evolution patterns of the annual precipitation considering the climate change conditions in the Sanjiang Plain. J. Water Clim. Chang. 2016, 7, 198–211. [Google Scholar] [CrossRef]
  41. Yang, S.; Bai, J.; Zhao, C.; Lou, H.; Zhang, C.; Guan, Y.; Zhang, Y.; Wang, Z.; Yu, X. The assessment of the changes of biomass and riparian buffer width in the terminal reservoir under the impact of the South-to-North Water Diversion Project in China. Ecol. Indic. 2018, 85, 932–943. [Google Scholar] [CrossRef]
  42. China Ecosystem Research Network. Plant Phenology Observation Data Set of CERN from 2003 to 2015; Science Data Bank: Beijing, China, 2017. [Google Scholar] [CrossRef]
  43. Press, W.H.; Teukolsky, S.A.; Vetterling, W.T.; Flannery, B.P. Numerical Recipes in C–The Art of Scientific Computing, 2nd ed.; Cambridge University Press: Cambridge, UK, 1997; pp. 656–688. [Google Scholar]
  44. Fontrodona Bach, A.; van der Schrier, G.; Melsen, L.A.; Klein Tank, A.M.G.; Teuling, A.J. Widespread and Accelerated Decrease of Observed Mean and Extreme Snow Depth Over Europe. Geophys. Res. Lett. 2018, 45, 12312–12319. [Google Scholar] [CrossRef] [Green Version]
  45. Meier, G.A.; Brown, J.F.; Evelsizer, R.J.; Vogelmann, J.E. Phenology and climate relationships in aspen (Populus tremuloides Michx.) forest and woodland communities of southwestern Colorado. Ecol. Indic. 2015, 48, 189–197. [Google Scholar] [CrossRef]
  46. Smith, T.J.; McNamara, J.P.; Flores, A.N.; Gribb, M.M.; Aishlin, P.S.; Benner, S.G. Small soil storage capacity limits benefit of winter snowpack to upland vegetation. Hydrol. Process. 2011, 25, 3858–3865. [Google Scholar] [CrossRef]
  47. Concilio, A.; Chen, J.; Ma, S.; North, M. Precipitation drives interannual variation in summer soil respiration in a Mediterranean-climate, mixed-conifer forest. Clim. Chang. 2009, 92, 109–122. [Google Scholar] [CrossRef]
  48. Karlsson, P.S.; Weih, M. Soil temperatures near the distribution limit of the mountain birch (Betula pubescens ssp. czerepanovii): Implications for seedling nitrogen economy and survival. Arct. Antarct. Alp. Res. 2001, 33, 88–92. [Google Scholar] [CrossRef]
  49. Weih, M.; Karlsson, P.S. Growth response of Mountain birch to air and soil temperature: Is increasing leaf-nitrogen content an acclimation to lower air temperature? New Phytol. 2001, 150, 147–155. [Google Scholar] [CrossRef]
  50. Landhäusser, S.M.; Lieffers, V.J. Seasonal changes in carbohydrate reserves in mature northern Populus tremuloides clones. Trees 2003, 17, 471–476. [Google Scholar] [CrossRef]
  51. Jönsson, A.M.; Eklundh, L.; Hellström, M.; Bärring, L.; Jönsson, P. Annual changes in MODIS vegetation indices of Swedish coniferous forests in relation to snow dynamics and tree phenology. Remote Sens. Environ. 2010, 114, 2719–2730. [Google Scholar] [CrossRef]
  52. Semenchuk, P.R.; Elberling, B.; Cooper, E.J. Snow cover and extreme winter warming events control flower abundance of some, but not all species in high arctic Svalbard. Ecol Evol. 2013, 3, 2586–2599. [Google Scholar] [CrossRef] [Green Version]
  53. Dunne, J.A.; Harte, J.; Taylor, K.J. Subalpine meadow flowering phenology responses to climate change: Integrating experimental and gradient methods. Ecol. Monogr. 2003, 73, 69–86. [Google Scholar] [CrossRef]
  54. Wolkovich, E.M.; Cook, B.I.; Allen, J.M.; Crimminfs, T.M.; Betancourt, J.L.; Travers, S.E.; Pau, S.; Regetz, J.; Davies, T.J.; Kraft, N.J.B.; et al. Warming experiments underpredict plant phenological responses to climate change. Nature 2012, 485, 494–497. [Google Scholar] [CrossRef] [PubMed]
  55. Keenan, T.F.; Gray, J.; Friedl, M.A.; Toomey, M.; Bohrer, G.; Hollinger, D.Y.; Munger, J.W.; O’Keefe, J.; Schmid, H.P.; Wing, I.S.; et al. Net carbon uptake has increased through warming-induced changes in temperate forest phenology. Nat. Clim. Chang. 2014, 4, 598–604. [Google Scholar] [CrossRef]
  56. Chen, S.; Huang, Y.; Gao, S.; Wang, G. Impact of physiological and phenological change on carbon uptake on the Tibetan Plateau revealed through GPP estimation based on spaceborne solar-induced fluorescence. Sci. Total Environ. 2019, 663, 45–59. [Google Scholar] [CrossRef] [PubMed]
  57. Chen, X.; Maignan, F.; Viovy, N.; Bastos, A.; Goll, D.; Wu, J.; Liu, L.; Yue, C.; Peng, S.; Yuan, W.; et al. Novel Representation of Leaf Phenology Improves Simulation of Amazonian Evergreen Forest Photosynthesis in a Land Surface Model. J. Adv. Model. Earth Syst. 2020, 12. [Google Scholar] [CrossRef] [Green Version]
  58. Alexander, L.; Allen, S.; Bindoff, N.; Breon, F.-M.; Church, J.; Cubasch, U.; Emori, S.; Forster, P.; Friedlingstein, P.; Gillett, N.; et al. IPCC. Climate Change 2013: The Physical Science Basis; IPCC: Geneva, Switzerland, 2013. [Google Scholar]
  59. Menzel, A.; Sparks, T.H.; Estrella, N.; Koch, E.; Aasa, A.; Ahas, R.; Alm-KÜBler, K.; Bissolli, P.; BraslavskÁ, O.G.; Briede, A.; et al. European phenological response to climate change matches the warming pattern. Glob. Chang. Biol. 2006, 12, 1969–1976. [Google Scholar] [CrossRef]
  60. Monson, R.K.; Lipson, D.L.; Burns, S.P.; Turnipseed, A.A.; Delany, A.C.; Williams, M.W.; Schmidt, S.K. Winter forest soil respiration controlled by climate and microbial community composition. Nature 2006, 439, 711–714. [Google Scholar] [CrossRef]
  61. Mote, P.W.; Hamlet, A.F.; Clark, M.P.; Lettenmaier, D.P. Declining Mountain Snowpack in Western North America. Bull. Am. Meteorol. Soc. 2005, 86, 39. [Google Scholar] [CrossRef]
  62. Wieser, G.; Oberhuber, W.; Gruber, A. Effects of Climate Change at Treeline: Lessons from Space-for-Time Studies, Manipulative Experiments, and Long-Term Observational Records in the Central Austrian Alps. Forests 2019, 10, 508. [Google Scholar] [CrossRef] [Green Version]
Figure 1. The Sanjiang Plain is located in the mid-high latitude area in China.
Remotesensing 13 00668 g001
Figure 2. The flow chart of key research steps and multisource data.
Remotesensing 13 00668 g002
Figure 3. Applied meteorology and detection of snow drought in this study.
Remotesensing 13 00668 g003
Figure 4. The spatial distribution of snowfall in the Sanjiang Plain. Each picture is the average snowfall cover from last year’s December to this year’s February. P: snow accumulation (mm); T: average temperature (°C).
Remotesensing 13 00668 g004
Figure 5. The forest land start of the season (SOS) date by year in the Sanjiang Plain. The left axis is the year, the right axis is the temperature (°C), the upper axis is the snowfall accumulation (mm), and the lower axis is the DOY of each year’s SOS. Rectangles represent the DOY of SOS, triangles represent the temperature, and lines represent the snowfall accumulation.
Remotesensing 13 00668 g005
Figure 6. The forest land end of the season (EOS) dates by year in the Sanjiang Plain. The left axis is the year, the right axis is the temperature (°C), the upper axis is the snowfall accumulation (mm), and the lower axis is the DOY of each year’s SOS. Rectangles represent the DOY of EOS, triangles represent the temperature, and lines represent the snowfall accumulation.
Remotesensing 13 00668 g006
Figure 7. The grassland SOS by year of date in the Sanjiang Plain. The left axis is the year, the right axis is the temperature (°C), the upper axis is the snowfall ratio, and the lower axis is the DOY of each year’s SOS. Rectangles represent the DOY of SOS, triangles represent the temperature, and lines represent the snowfall ratio.
Remotesensing 13 00668 g007
Figure 8. The grassland EOS by year of date in the Sanjiang Plain. The left axis is the year, the right axis is the temperature (°C), the upper axis is the snowfall ratio, and the lower axis is the DOY of each year’s EOS. Rectangles represent the DOY of SOS, triangles represent the temperature, and lines represent the snowfall ratio.
Remotesensing 13 00668 g008
Figure 9. The spatial distribution of the gross primary productivity (GPP) in the Sanjiang Plain. Each picture is the average GPP value from each year’s March to October. Ave GPP: average GPP value (kg·C·m2) in each year.
Remotesensing 13 00668 g009
Table 1. Remote sensing data used in this research.
No.Data NameSensorSR 1TR 2Date RangeNumberRole
1MOD13A2-EVIMODIS500 m16 d10/12/14/15/16/19 May 2003224Phenological period
2MOD17A2-GPPMODIS500 m8 d10/12/14/15/16/19 May 2003432Vegetation growth
3MOD10A2-SnowMODIS500 m8 d10/12/14/15/16/19 May 2013432Snowfall
4LandsatTM 3/OLI 430 m16 d10/12/14/15/16/19 May 201372Land use
5DOM/DSMUAV5 cm1 d2019272Land use/vegetation volume
1 SR: spatial resolution; 2 TR: temporal resolution. 3 TM: thematic mapper; 4 OLI: operational land imager.
Table 2. In situ phenological period data set from the Sanjiang Observation Station.
Plant SpeciesYearLand UseSOS (DOY)EOS (DOY)Plot Type
Deyeuxia angustifolia2005Grass115278AOF 1
Carex lasiocarpa2010Grass113277IOF 2
Carex lasiocarpa2012Grass116286IOF
Carex pseudocuraica2014Grass112284IOF
Glyceria spiculosa2015Grass117274AOF
1 AOF: auxiliary observation field (Latin name); 2 IOF: integrated observation field (Latin name); DOY: day of year.
Publisher’s Note: MDPI stays neutral with regard to jurisdictional claims in published maps and institutional affiliations.