
Rural–Urban Migration and Conservation Drive the Ecosystem Services Improvement in China Karst: A Case Study of HuanJiang County, Guangxi

 , , , ,
Abstract
1. Introduction
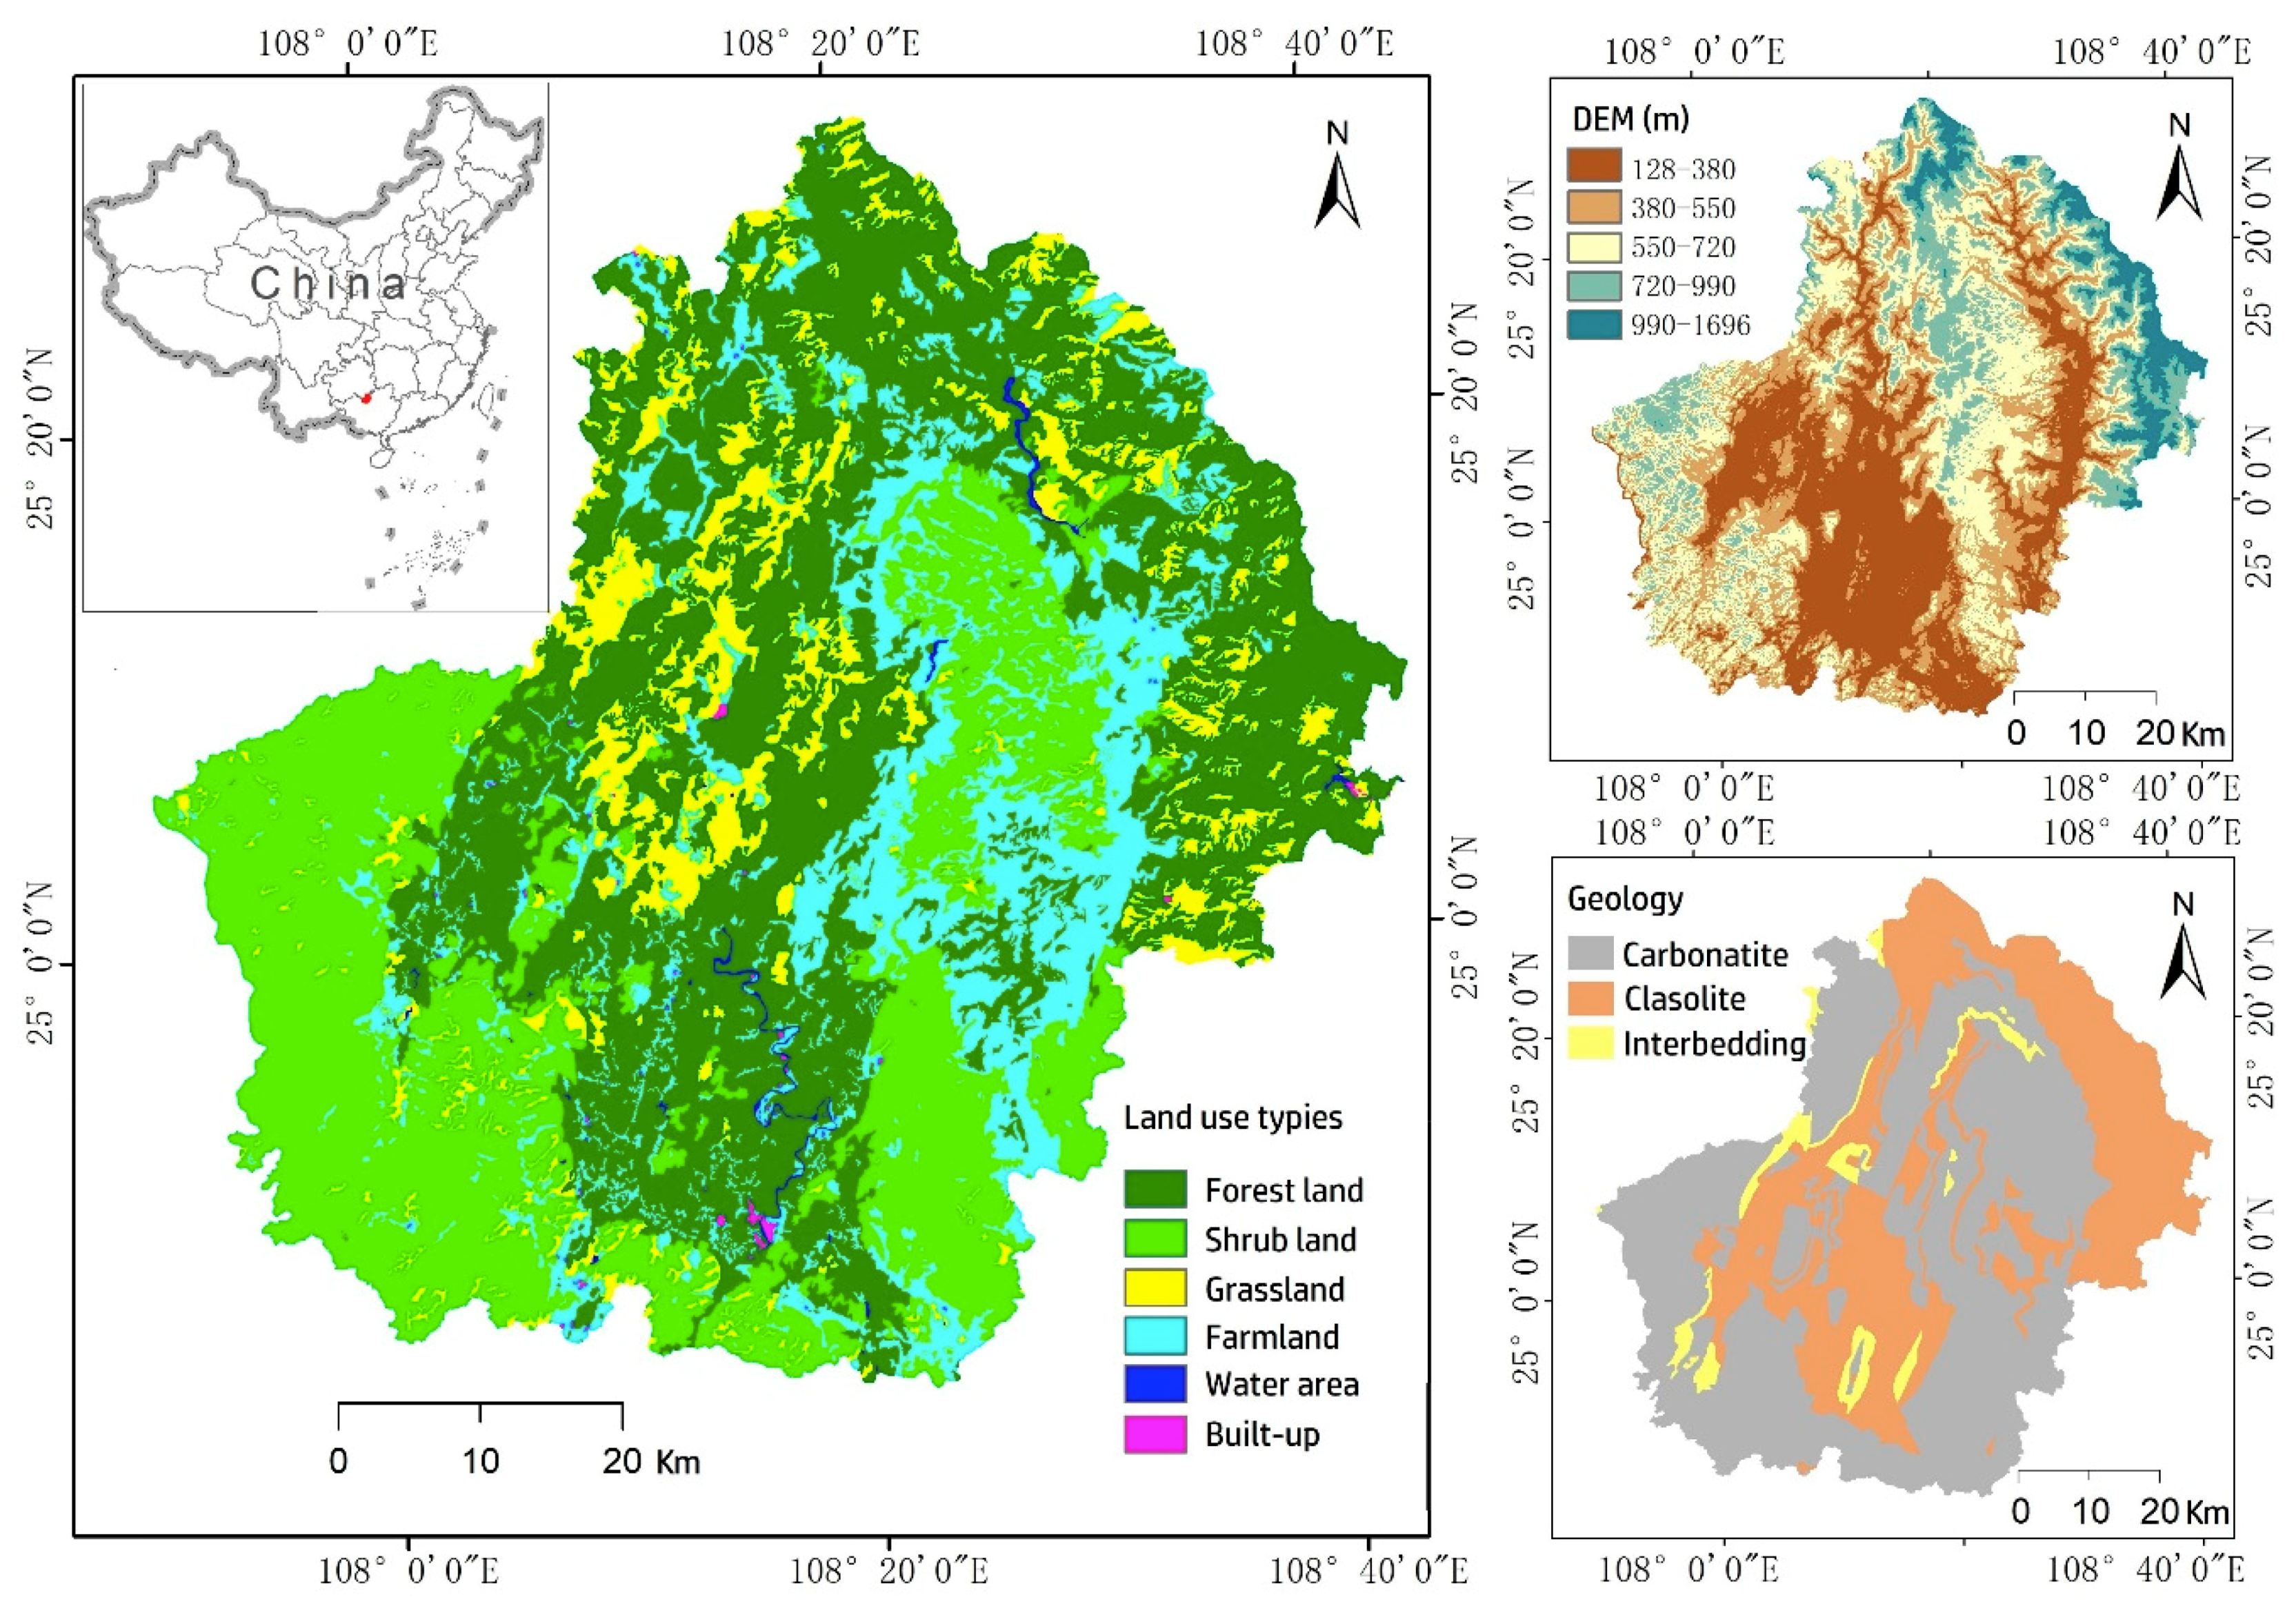
2. Study Area
3. Materials and Methods
3.1. Research Data
3.2. NEP Calculation
3.3. Soil Conservation
3.4. Water Yield Modeling
3.5. Ecosystem Health Assessment
3.6. Potential Vegetation Restoration Prediction
4. Results
4.1. Ecosystem Services Evaluation
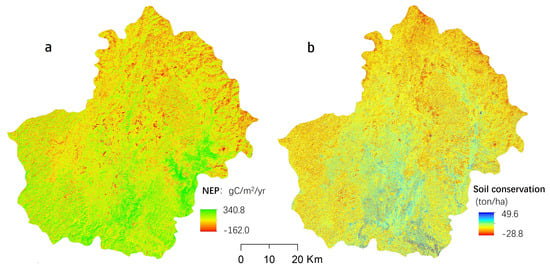
4.1.1. NEP and Its Change
4.1.2. Soil Conservation and Its Change
4.1.3. Water Yield and Its Change
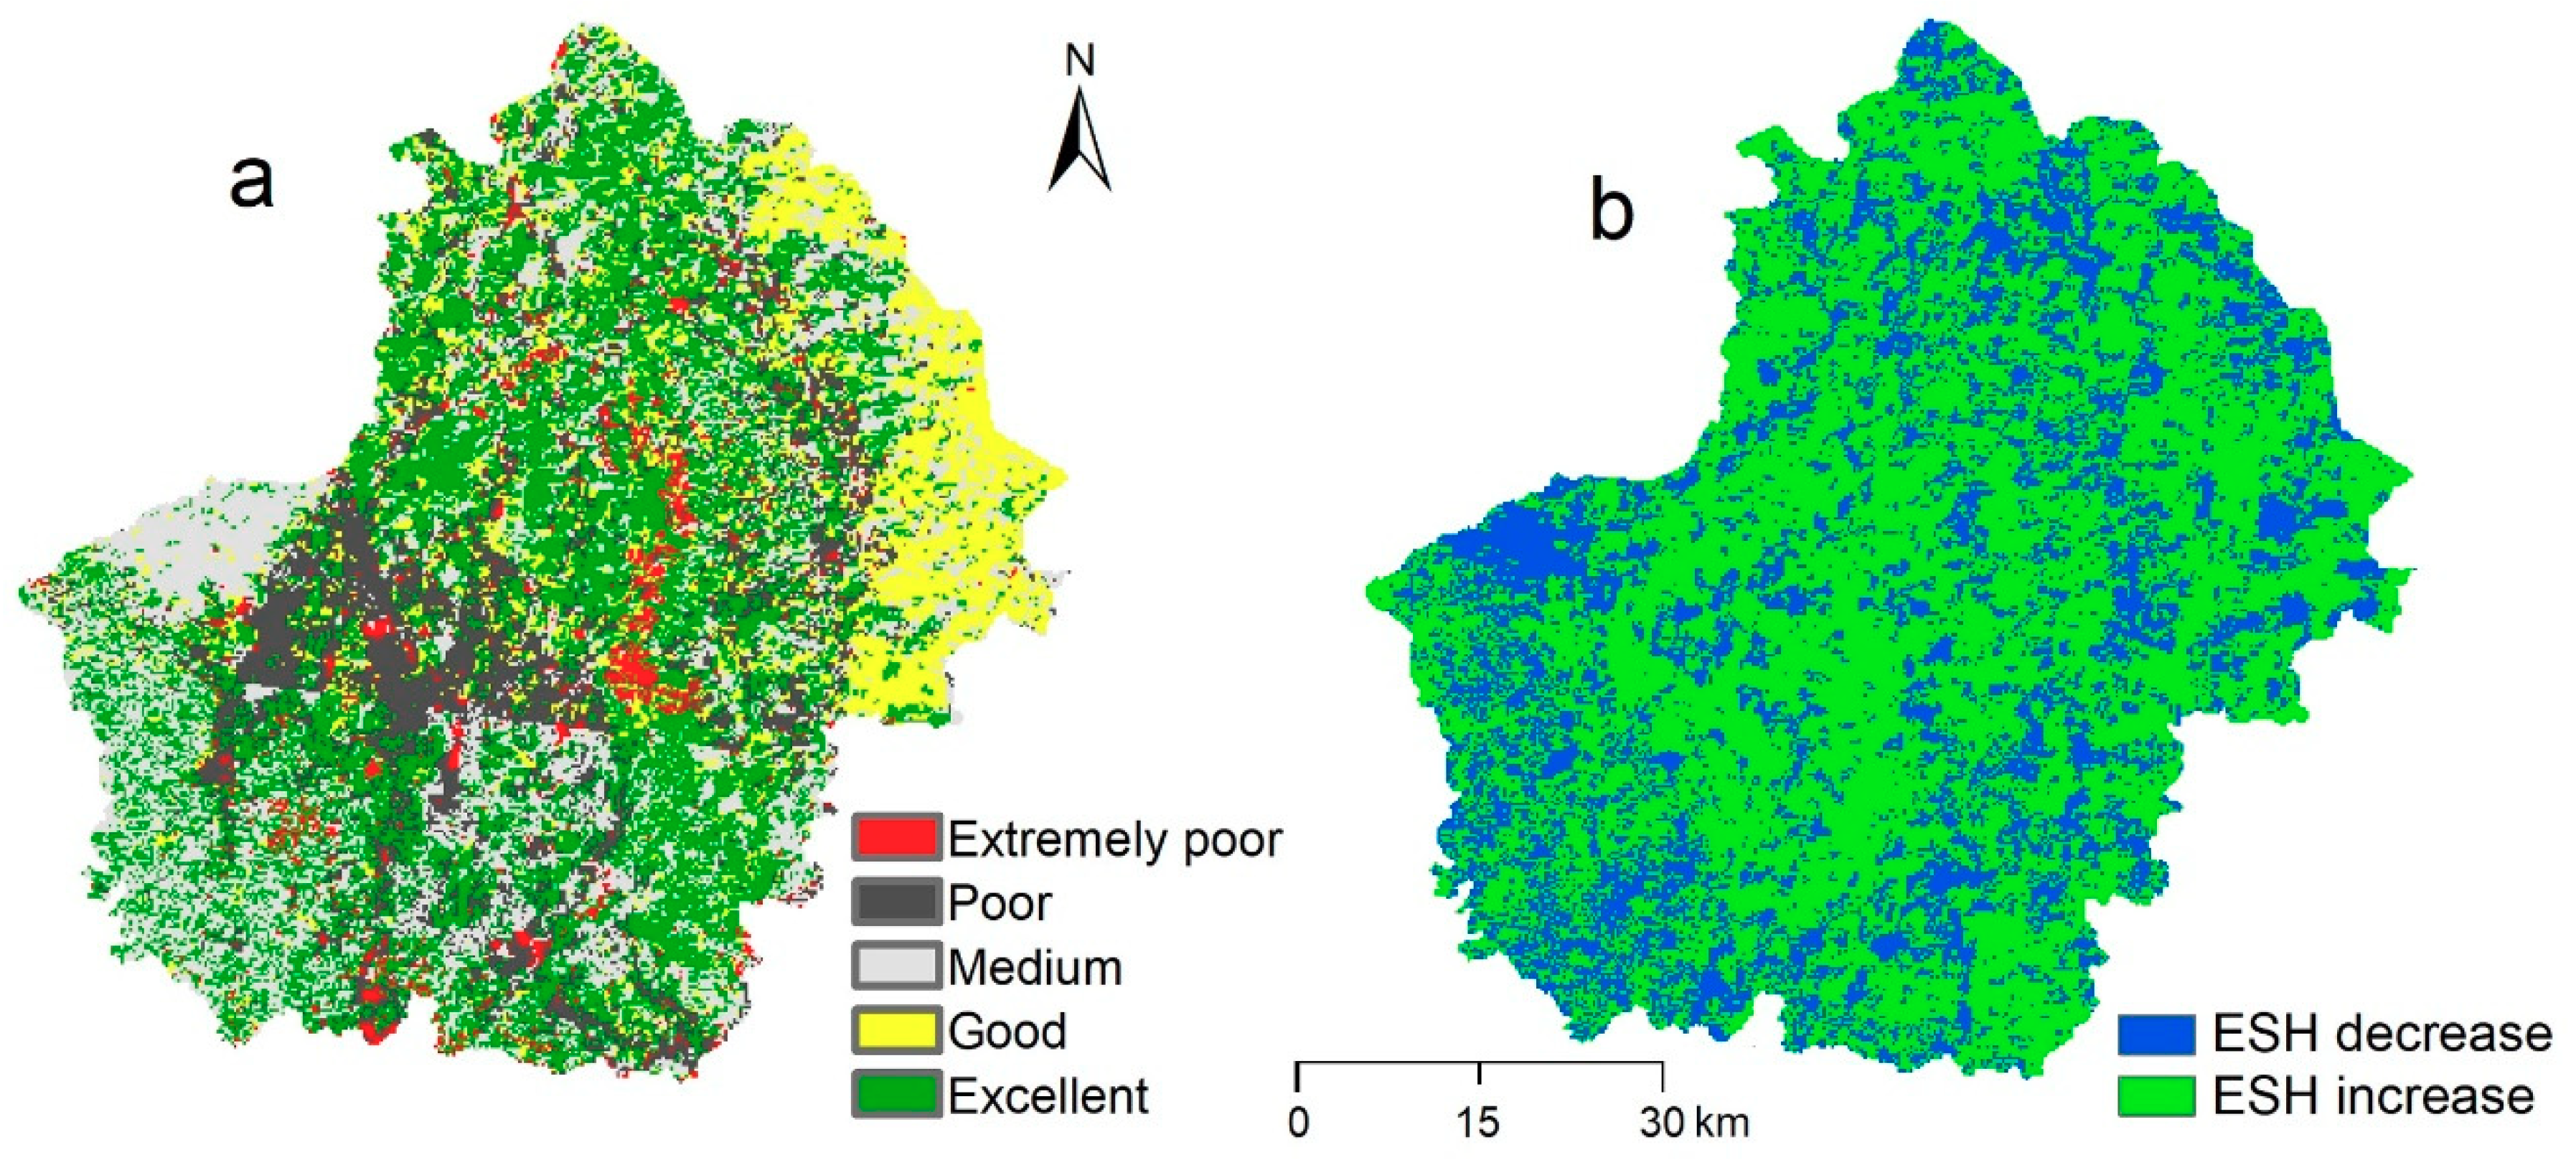
4.2. Ecosystem Health in Huanjiang County
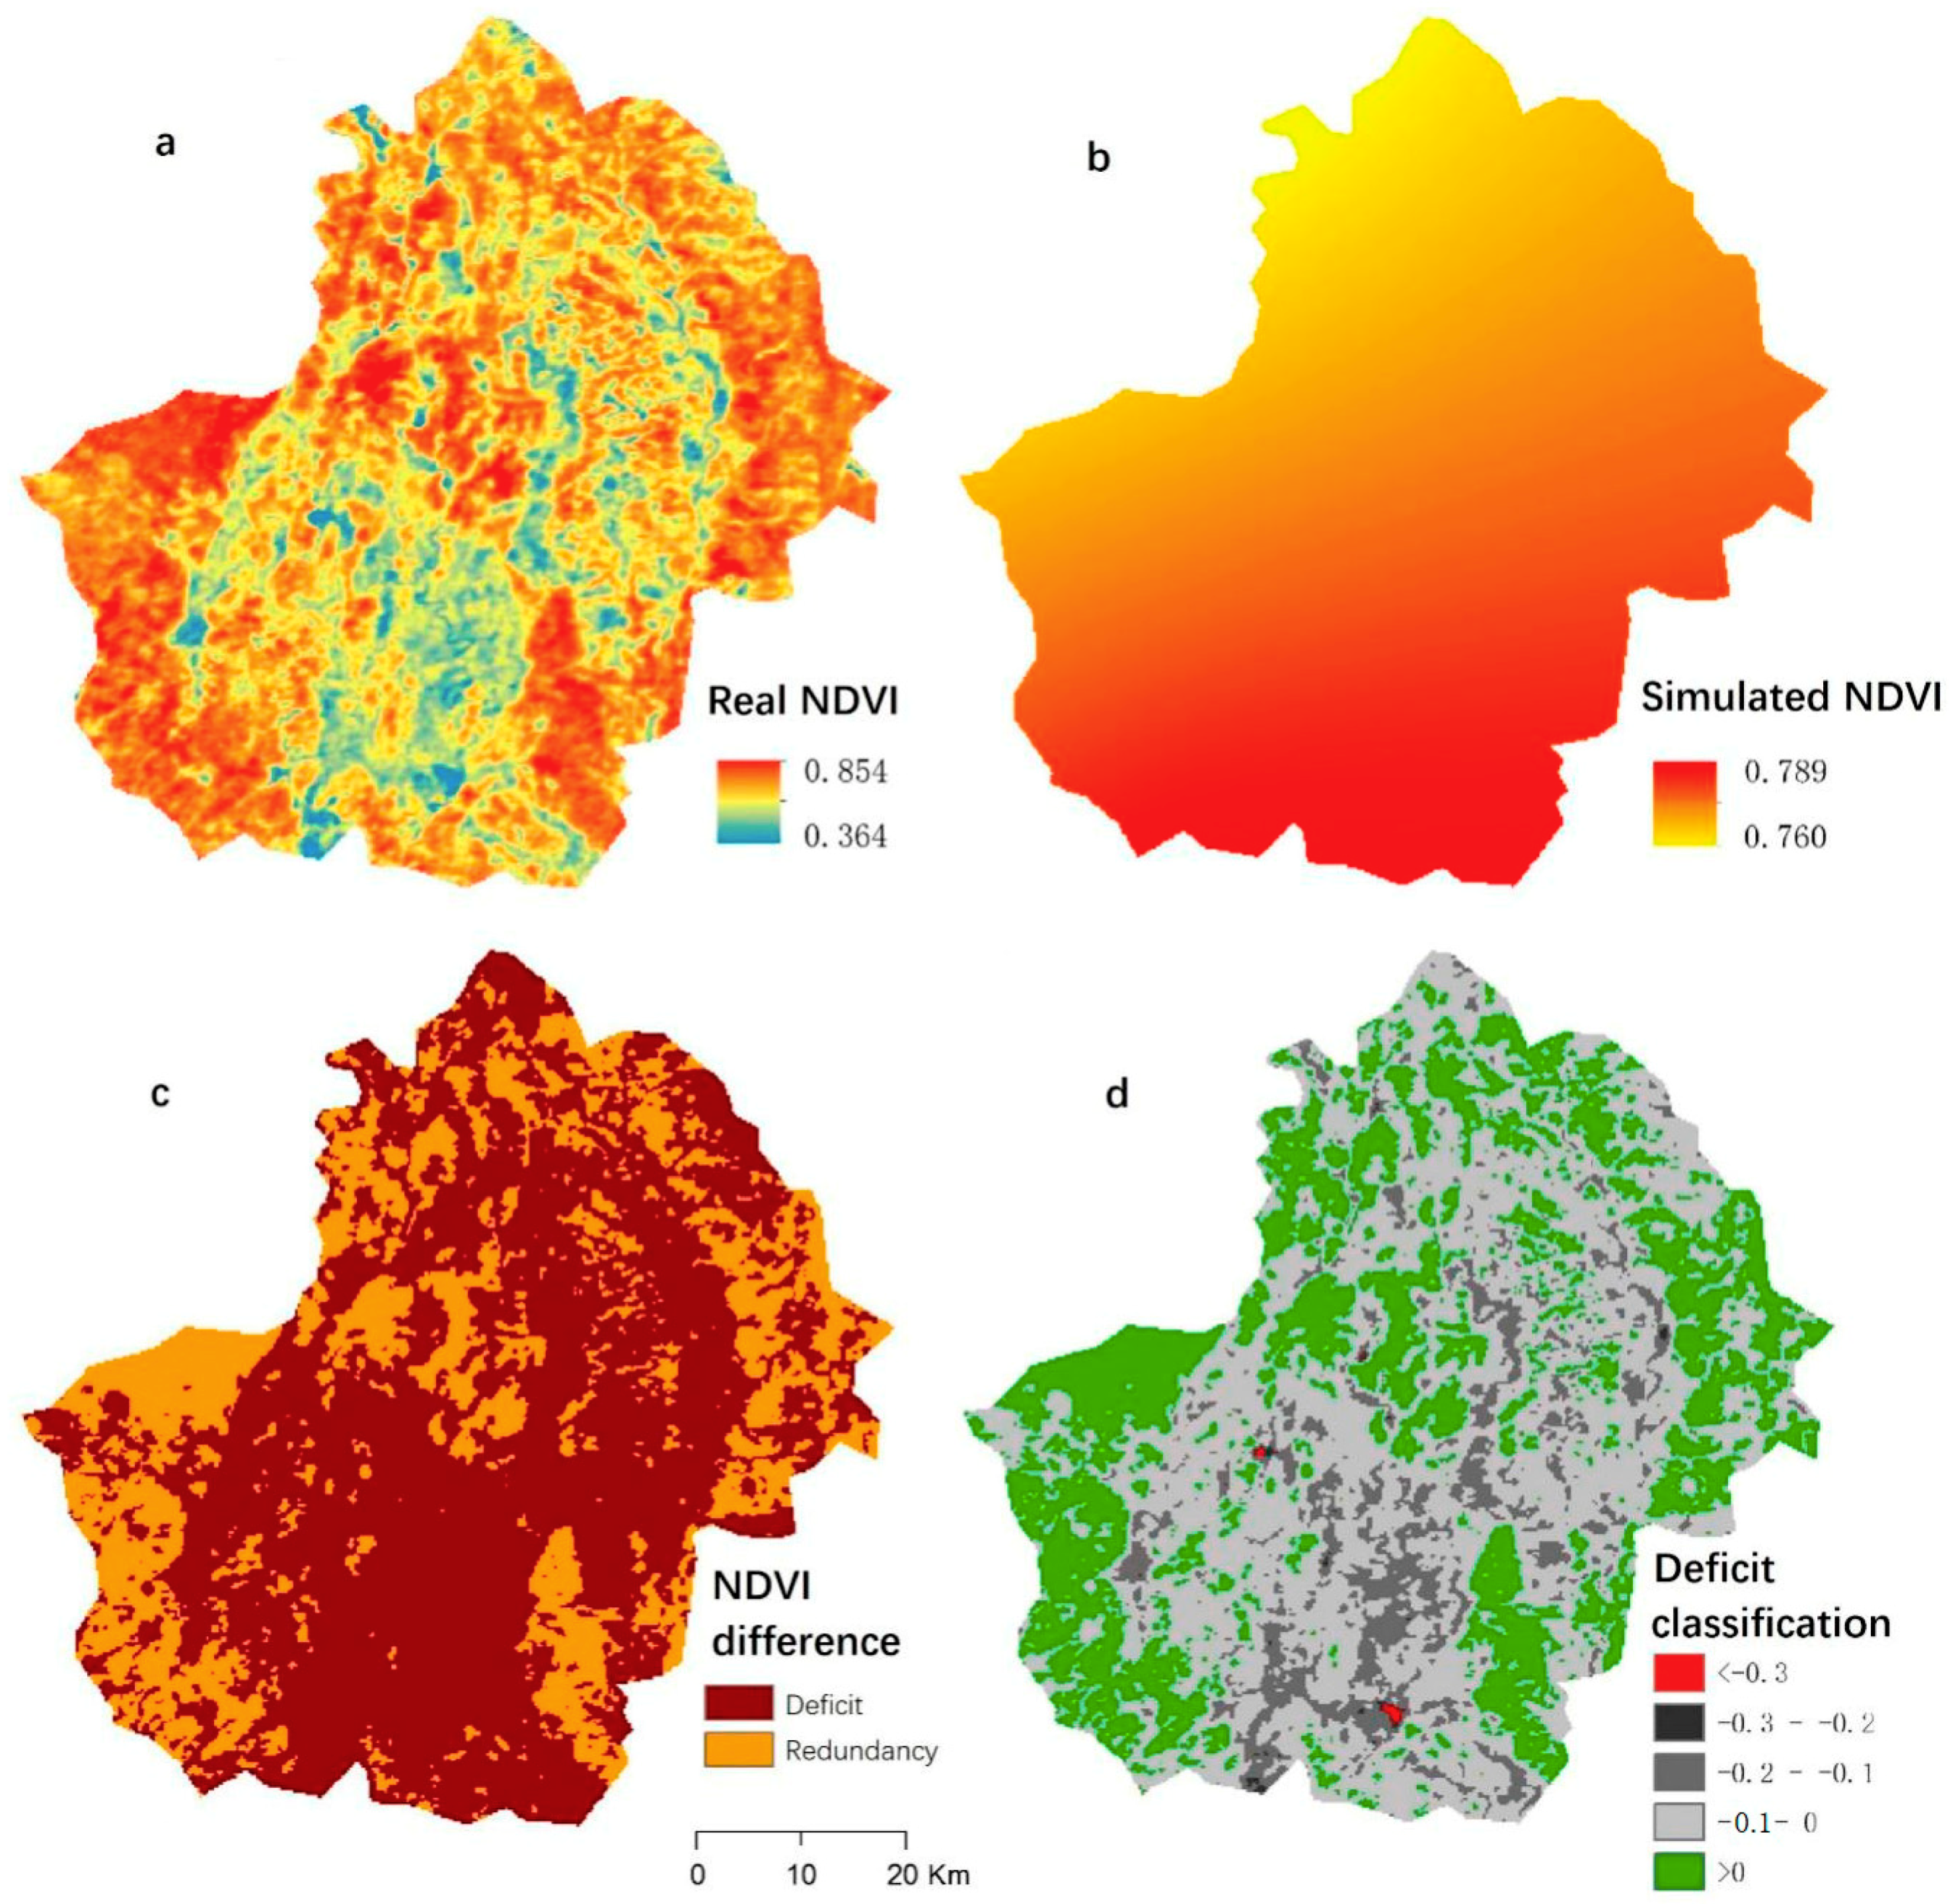
4.3. Potential for Vegetation Recovery
5. Discussion
5.1. Increased Ecosystem Services via Ecological Restoration Programs
5.2. Ongoing Outmigration Reduced Ecosystem Disturbance
5.3. Ecosystem Services Improvement through Vegetation Recovery
6. Conclusions
Author Contributions
Funding
Institutional Review Board Statement
Informed Consent Statement
Data Availability Statement
Acknowledgments
Conflicts of Interest
References
- Cord, A.F.; Seppelt, R.; Turner, W. Sustainable development goals:monitor ecosystem services from space. Nature 2015, 33, 525–533. [Google Scholar]
- Joppa, L.N.; Boyd, J.W.; Duke, C.S.; Hampton, S.; Jackson, S.T.; Jacobs, K.L.; Kassam, K.A.S.; Mooney, H.A.; Ogden, L.A.; Ruckelshaus, M.; et al. Government: Plan for ecosystem services. Science 2016, 351, 1037. [Google Scholar] [CrossRef]
- Tian, Y.C.; Wang, S.J.; Bai, X.Y.; Luo, G.J.; Xu, Y. Trade-offs among ecosystem services in a typical karst watershed, SW China. Sci. Total Environ. 2016, 566–567, 1297–1308. [Google Scholar] [CrossRef] [PubMed]
- Zhang, M.Y.; Wang, K.L.; Liu, H.Y.; Zhang, C.H.; Yue, Y.M.; Qi, X.K. Effect of ecological engineering projects on ecosystem services in a karst region: A case study of northwest guangxi, china. J. Clean Prod. 2018, 183, 831–842. [Google Scholar] [CrossRef]
- Jiang, Z.C.; Lian, Y.Q.; Qin, X.Q. Rocky desertification in Southwest China: Impacts, causes, and restoration. Earth-Sci. Rev. 2014, 132, 1–12. [Google Scholar] [CrossRef]
- Yue, Y.M.; Wang, K.L.; Zhang, B.; Jiao, Q.J.; Liu, B.; Zhang, M.Y. Remote sensing of fractional cover of vegetation and exposed bedrock for karst rocky desertification assessment. Proc. Environ. Sci. 2012, 13, 847–853. [Google Scholar] [CrossRef]
- Zhang, C.H.; Qi, X.K.; Wang, K.L.; Zhang, M.Y.; Yue, Y.M. The application of geospatial techniques in monitoring karst vegetation recovery in southwest China: A review. Prog. Phys. Geogr. 2017, 41, 450–477. [Google Scholar] [CrossRef]
- Wang, K.L.; Zhang, C.H.; Chen, H.S.; Yue, Y.M.; Zhang, W.; Zhang, M.Y.; Qi, X.K.; Fu, Z.Y. Karst landscapes of China: Patterns, ecosystem processes and services. Landsc. Ecol. 2019, 34, 2743–2763. [Google Scholar] [CrossRef]
- Ouyang, Z.Y.; Zheng, H.; Xiao, Y.; Polasky, S.; Liu, J.G.; Xu, W.H.; Wang, Q.; Zhang, L.; Xiao, Y.; Rao, E.M.; et al. Improvements in ecosystem services from investments in natural capital. Science 2016, 352, 1455–1459. [Google Scholar] [CrossRef]
- Sterling, S.M.; Ducharne, A.; Polcher, J. The impact of global land-cover change on the terrestrial water cycle. Nat. Clim. Chang. 2012, 3, 35–390. [Google Scholar] [CrossRef]
- Wen, L.; Song, T.; Du, H.; Wang, K.; Peng, W.; Zeng, F.; Zeng, Z.; He, T. The succession charactersitcs and its driving mechanism of plant community in karst region, southwest China. Acta Ecol. Sin. 2015, 35, 5822–5833, (In Chinese with English abstract). [Google Scholar]
- Tong, X.W.; Brandt, M.; Yue, Y.M.; Horion, S.; Wang, K.L.; Wanda, D.K.; Tian, F.; Schurgers, G.; Xiao, X.M.; Luo, Y.Q.; et al. Increased vegetation growth and carbon stock in China karst via ecological engineering. Nat. Sustain. 2018, 1, 44–50. [Google Scholar] [CrossRef]
- Marc, M.F. Satellite images show China going green. Nature 2018, 553, 411–413. [Google Scholar]
- Wang, J.; Wang, K.; Zhang, M.; Zhang, C. Impacts of climate change and human activities on vegetation cover in hilly southern China. Ecol. Eng. 2015, 81, 451–461. [Google Scholar] [CrossRef]
- Qi, X.K.; Wang, K.L.; Zhang, C.H. Comparing Remote Sensing Methods for Monitoring Karst Rocky Desertification at Sub-pixel Scales in a Highly Heterogeneous Karst Region. Sci. Rep. 2019, 9, 1–12. [Google Scholar] [CrossRef] [PubMed]
- Gao, J.; Jiang, Y.; Wang, H.; Zuo, L. Identification of Dominant Factors Affecting Soil Erosion and Water Yield within Ecological Red Line Areas. Remote Sens. 2020, 12, 399. [Google Scholar] [CrossRef]
- Shi, D.; Shi, Y.; Wu, Q.; Fang, R. Multidimensional Assessment of Food Provisioning Ecosystem Services Using Remote Sensing and Agricultural Statistics. Remote Sens. 2020, 12, 3955. [Google Scholar] [CrossRef]
- Sharps, K.; Masante, D.; Thomas, A.R.C.; Jackson, B.M.; Cosby, B.J.; Emmet, B.A.; Jones, L. Comparing strengths and weaknesses of three ecosystem services modelling tools in a diverse UK river catchment. Sci. Total Environ. 2017, 584, 118–130. [Google Scholar] [CrossRef]
- Wang, W.J.; Wu, T.; Li, Y.Z.; Xie, S.L.; Han, B.L.; Zheng, H.; Ouyang, Z.Y. Urbanization impacts on natural habitat and ecosystem services in the guangdong-hong kong-macao “megacity”. Sustainability 2020, 12, 6675. [Google Scholar] [CrossRef]
- Costanza, R.; d’Arge, R.; deGroot, R.; Farber, S.; Grasso, M.; Hannon, B.; Limburg, K.; Naeem, S.; O’Neil, R.V.; Paruelo, J. The value of the world’s ecosystem services and natural capital. Nature 1997, 387, 253–260. [Google Scholar] [CrossRef]
- Zhang, M.Y.; Wang, K.L.; Liu, H.Y.; Wang, J.; Zhang, C.H.; Yue, Y.M.; Qi, X.K. Spatio-Temporal variation and impact factors for vegetation carbon sequestration and oxygen production based on rocky desertifification control in the karst region of Southwest China. Remote Sens. 2016, 8, 102. [Google Scholar] [CrossRef]
- Imhoff, M.L.; Bounoua, L.; Ricketts, T.; Loucks, C.; Harriss, R.; Lawrence, W.T. Global patterns in human consumption of net primary production. Nature 2004, 249, 870–873. [Google Scholar] [CrossRef]
- Potter, C.S.; Randerson, J.T.; Field, C.B.; Matson, P.A.; Vitousek, P.M.; Mooney, H.A.; Klooster, S.A. Terrestrial ecosystem production: A process model based on global satellite and surface data. Glob. Biogeochem. Cycle 1993, 7, 811–841. [Google Scholar] [CrossRef]
- Xu, X.L.; Liu, W.; Scanlon, B.R.; Zhang, L.; Pan, M. Local and global factors controlling water-energy balances within the Budyko framework. Geophys. Res. Lett. 2013, 40, 6123–6129. [Google Scholar] [CrossRef]
- Feng, X.M.; Fu, B.J.; Lu, N.; Zeng, Y.; Wu, B.F. How ecological restoration alters ecosystem services:an analysis of carbon sequestration in China’s Loess Plateau. Sci. Rep. 2013, 3, 2846. [Google Scholar] [CrossRef] [PubMed]
- Chen, H.S.; Hu, K.; Nie, Y.P.; Wang, K.L. Analysis of soil water movement inside a footslope and a depression in a karst catchment, Southwest China. Sci. Rep. 2017, 7, 2544. [Google Scholar] [CrossRef] [PubMed]
- Lawler, J.J.; Lewis, D.J.; Nelson, E.; Plantinga, A.J.; Polasky, S.; Withey, J.C.; Helmers, D.P.; Martinuzzi, S.; Pennington, D.; Radeloff, V.R. Projected land-use change impacts on ecosystem services in the United States. Proc. Natl. Acad. Sci. USA 2014, 111, 7492–7497. [Google Scholar] [CrossRef]
- Du, H.; Hu, F.; Zeng, F.P.; Wang, K.L.; Peng, W.X.; Zhang, H.; Zeng, Z.X.; Zhang, F.; Song, T.Q. Spatial distribution of tree species in evergreen-deciduous broadleaf karst forests in southwest china. Sci. Rep. 2017, 7, 15664. [Google Scholar] [CrossRef]
- Hu, P.L.; Liu, S.J.; Ye, Y.Y.; Zhang, W.; Wang, K.L.; Su, Y.R. Effects of environmental factors on soil organic carbon under natural or managed vegetation restoration. Land Degrad. Dev. 2018, 29, 387–397. [Google Scholar] [CrossRef]
- Liao, C.J.; Yue, Y.M.; Wang, K.L.; Fensholt, R.; Tong, W.X.; Brandt, M. Ecological restoration enhances ecosystem health in the karst regions of southwest china. Ecol. Indic. 2018, 90, 416–425. [Google Scholar] [CrossRef]
- Tong, X.W.; Brandt, M.; Yue, Y.M.; Ciais, P.; Fensholt, R. Forest management in southern China generates short term extensive carbon sequestration. Nat. Commun. 2020, 11, 129. [Google Scholar] [CrossRef] [PubMed]
- Qi, X.K.; Wang, K.L.; Zhang, C.H. Effectiveness of ecological restoration projects in a karst region of southwest china assessed using vegetation succession mapping. Ecol. Eng. 2013, 54, 245–253. [Google Scholar] [CrossRef]
- Tang, J.; Jiang, Y.; Li, Z.Y.; Zhang, N.; Hu, M. Estimation of vegetation net primary productivity and carbon sink in western Jilin province based on CASA model. J. Arid Land Resour. Environ. 2013, 27, 1–7, (In Chinese with English Abstract). [Google Scholar]
- Wischmeier, W.H. Predicting rainfall erosion losses-a guide to conservation planning. In Agriculture Handbook; US Government Printing Office: Washington, DC, USA, 1978; p. 537. [Google Scholar]
- Xu, Y.M.; Peng, J.; Shao, X.M. Assessment of soil erosion using rusle and gis: A case study of the maotiao river watershed, guizhou province, hina. Environ. Geol. 2009, 72, 2217–2217. [Google Scholar]
- Hamel, P.; Guswa, A.J. Uncertainty analysis of a spatially explicit annual water-balance model: Case study of the Cape Fear basin, North Carolina. Hydrol. Earth Syst. Sci. 2015, 19, 839–853. [Google Scholar] [CrossRef]
- Walz, R. Development of environmental indicator systems:experiences from Germany. Environ. Manag. 2000, 25, 613–623. [Google Scholar] [CrossRef]
- Neri, A.C.; Dupin, P.; Sánchez, L.E. A pressure-state-response approach to cumulative impact assessment. J. Clean Prod. 2016, 126, 288–298. [Google Scholar] [CrossRef]
- Sun, T.T.; Lin, W.P.; Chen, G.S.; Guo, P.P.; Zeng, Y. Wetland ecosystem health assessment through integrating remote sensing and inventory data with an assessment model for the Hangzhou Bay, China. Sci. Total Environ. 2016, 566, 627–640. [Google Scholar] [CrossRef] [PubMed]
- Costanza, R.; de Groot, R.; Braat, L.; Kubiszewski, L.; Fioramonti, L.; Sutton, P.; Farber, S.; Grasso, M. Twenty years of ecosystem services: How far have we come and how far do we still need to go? Ecosyst. Serv. 2017, 28, 1–16. [Google Scholar] [CrossRef]
- Su, C.H.; Fu, B.J.; He, C.S.; Lü, Y.H. Variation of ecosystem services and human activities: A case study in the Yanhe watershed of China. Acta Oecol. 2012, 44, 46–57. [Google Scholar] [CrossRef]
- Zhang, M.Y.; Wang, K.L.; Liu, H.Y.; Zhang, C.H.; Wang, K.L.; Yue, Y.M.; Qi, X.K. How ecological restoration alters ecosystem services: An analysis of vegetation carbon sequestration in the karst area of northwest Guangxi, China. Environ. Earth Sci. 2015, 74, 5307–5317. [Google Scholar] [CrossRef]
- Nie, Y.P.; Chen, H.S.; Wang, K.L.; Yang, J. Water source utilization by woody plants growing on dolomite outcrops and nearby soils during dry seasons in karst region of Southwest China. J. Hydrol. 2012, 420, 264–274. [Google Scholar] [CrossRef]
- Cai, H.; Yang, X.; Wang, K.; Xiao, L. Is forest restoration in the southwest china karst promoted mainly by climate change or human-induced factors? Remote Sens. 2014, 6, 9895–9910. [Google Scholar] [CrossRef]
- Li, Y.; Piao, S.L.; Li, L.Z.X.; Chen, A.P.; Wang, X.H.; Ciais, P.; Huang, L.; Lian, X.; Peng, S.S.; Zeng, Z.Z.; et al. Divergent hydrological response to large-scale afforestation and vegetation greening in China. Sci. Adv. 2018, 4, eaar4182. [Google Scholar] [CrossRef] [PubMed]
- Tong, X.W.; Wang, K.L.; Yue, Y.M.; Brandt, M.; Liu, B.; Zhang, C.H.; Liao, C.J.; Fensholt, R. Quantifying the effectiveness of ecological restoration projects on long-term vegetation dynamics in the karst regions of Southwest China. Int. J. Appl. Earth Obs. Geoinf. 2017, 54, 105–113. [Google Scholar] [CrossRef]
- Zhao, X.; Wei, H.; Liang, S.L.; Zhou, T.; He, B.; Tang, B.J.; Wu, D.H. Responses of natural vegetation to different stages of extreme drought during 2009–2010 in southwestern China. Remote Sens. 2015, 7, 14039–14054. [Google Scholar] [CrossRef]
- Liu, X.; Zhang, W.; Wu, M.; Ye, Y.; Wang, K.; Li, D. Changes in soil nitrogen stocks following vegetation restoration in a typical karst catchment. Land Degrad. Dev. 2019, 30, 60–72. [Google Scholar] [CrossRef]


| Primary Classes | Subclasses | Codes |
|---|---|---|
| Forest land | Natural forests, Artificial forest | Class1 |
| Shrub land | Shrubs, Sparse forestland | Class2 |
| Grassland | Grass, Brush grass, Meadow | Class3 |
| Farmland | Dry farmland, Paddy field | Class4 |
| Water area | Rivers, Reservoirs | Class5 |
| Built-up | Residential area, Other construction land | Class6 |
| 2005 | 2015 | 2005–2015 | ||||
|---|---|---|---|---|---|---|
| Area (km2) | Percentage (%) | Area (km2) | Percentage (%) | Area (km2) | Percentage (%) | |
| Forest land | 1036.52 | 22.94 | 1384.29 | 30.64 | 347.77 | 33.55 |
| Shrub land | 2227.6 | 49.30 | 2245.14 | 49.69 | 17.54 | 0.79 |
| Grassland | 522.83 | 11.57 | 320.53 | 7.09 | −202.30 | −38.69 |
| Farmland | 714.87 | 15.82 | 549.15 | 12.15 | −165.72 | −23.18 |
| Water area | 7.91 | 0.18 | 8.4 | 0.19 | 0.49 | 6.20 |
| Built-up | 8.28 | 0.18 | 10.5 | 0.23 | 2.22 | 26.78 |
Publisher’s Note: MDPI stays neutral with regard to jurisdictional claims in published maps and institutional affiliations. |
© 2021 by the authors. Licensee MDPI, Basel, Switzerland. This article is an open access article distributed under the terms and conditions of the Creative Commons Attribution (CC BY) license (http://creativecommons.org/licenses/by/4.0/).
Share and Cite
Qi, X.; Li, Q.; Yue, Y.; Liao, C.; Zhai, L.; Zhang, X.; Wang, K.; Zhang, C.; Zhang, M.; Xiong, Y. Rural–Urban Migration and Conservation Drive the Ecosystem Services Improvement in China Karst: A Case Study of HuanJiang County, Guangxi. Remote Sens. 2021, 13, 566. https://doi.org/10.3390/rs13040566
Qi X, Li Q, Yue Y, Liao C, Zhai L, Zhang X, Wang K, Zhang C, Zhang M, Xiong Y. Rural–Urban Migration and Conservation Drive the Ecosystem Services Improvement in China Karst: A Case Study of HuanJiang County, Guangxi. Remote Sensing. 2021; 13(4):566. https://doi.org/10.3390/rs13040566
Chicago/Turabian StyleQi, Xiangkun, Qian Li, Yuemin Yue, Chujie Liao, Lu Zhai, Xuemei Zhang, Kelin Wang, Chunhua Zhang, Mingyang Zhang, and Ying Xiong. 2021. "Rural–Urban Migration and Conservation Drive the Ecosystem Services Improvement in China Karst: A Case Study of HuanJiang County, Guangxi" Remote Sensing 13, no. 4: 566. https://doi.org/10.3390/rs13040566
APA StyleQi, X., Li, Q., Yue, Y., Liao, C., Zhai, L., Zhang, X., Wang, K., Zhang, C., Zhang, M., & Xiong, Y. (2021). Rural–Urban Migration and Conservation Drive the Ecosystem Services Improvement in China Karst: A Case Study of HuanJiang County, Guangxi. Remote Sensing, 13(4), 566. https://doi.org/10.3390/rs13040566