Article

Application of Ecosystem Service Bundles and Tour Experience in Land Use Management: A Case Study of Xiaohuangshan Mountain (China)

1
Jiangsu Provincial Key Laboratory of Geographic Information Science and Technology, Key Laboratory for Land Satellite Remote Sensing Applications of Ministry of Natural Resources, School of Geography and Ocean Science, Nanjing University, Nanjing 210023, China
2
Collaborative Innovation Center of South China Sea Studies, Nanjing 210023, China
3
Institute of Earth Environment, Chinese Academy of Science, Xi’an 710061, China
4
University of Chinese Academy of Sciences, Beijing 100049, China
*
Author to whom correspondence should be addressed.
Remote Sens. 2021, 13(2), 242; https://doi.org/10.3390/rs13020242
Submission received: 9 December 2020 / Revised: 3 January 2021 / Accepted: 8 January 2021 / Published: 12 January 2021

Abstract

:
With the deterioration of human-terrestrial relations and the intensification of global warming, development in all countries is facing difficulties. Whether in highly urbanized countries or in rapidly urbanizing developing countries such as China, the research on ecosystem services (ES) and land use management has attracted increasing attention. The general management of land use unilaterally pursues economic benefits and neglects ecological benefits, which aggravates the disparity between ecological development and the economic benefits of land resources. How to strike up a balance between ecologic protection and economic development remains a difficult problem during urbanization. It may be a better choice to formulate regional development strategies by combining natural conditions with humanistic and social tendencies. Identifying regional cultural ecosystem services (CES) and other important ES while performing zoning planning for regional land use can be a viable approach in land use management. Here, our study quantitatively evaluates the tourism experience of Xiaohuangshan Mountain (XHSM) and various ES, including recreation, biodiversity, history, aesthetics, soil conservation, surface water regulation, and soil nutrition. All ES were classified into four bundles for XHSM. Different ES bundles generated are suitable for different land use management methods and development forms according to their outstanding ES. The results show that quantifying and mapping regional ES bundles can provide the necessary information to support a win-win solution and provide decision support for land and spatial planning in areas with different social and ecological characteristics.

Graphical Abstract

1. Introduction

Land use activities provide people with material products and other services but also bring a series of profound changes in the surface environment, which is an important component and one of the main causes of global environmental change [1,2]. Intensive human activities have led to profound and complex changes in land use and landscape pattern, among which intensive agricultural production and urbanization have greatly changed the ecological environment. The intensity and nature of the supply and demand of ecosystem services (ES) are correspondingly transformed [3,4,5].
Benefits people obtain from ecosystems as ES are considered the contribution of natural capital to human well-being [6]. The Millennium Ecosystem Assessment identified ES classification as: regulating, provisioning, supporting, and cultural services [7,8,9]. Cultural ES (CES) are intangible services provided by the ecosystem, including the intangible services that people obtain through experiences such as scenery appreciation, physical and mental rest, and entertainment [8]. The prospect of ES assessment provides a theoretical basis directly connecting the natural background with societal development [10]. Recognizing and quantifying these services provided by ecosystems can help eliminate their “economic invisibility” in policy and decision-making. Meanwhile, the application of the ES principle can enhance rational national spatial planning [11,12,13].
Research on the value of ES and land use management has attracted increasing attention, especially in developing countries like China, which are undergoing rapid urbanization [14,15,16,17]. The general management of land use unilaterally pursues economic benefits and ignores ecological benefits, which aggravates the contradiction between ecological developments and economic benefits [18,19,20]. Therefore, how to strike up a balance between protecting the natural environment and promoting economic development, identifying regional cultural services, and other important ES, while carrying out zoning planning for regional land use, is a research area that cannot be ignored in land use management. Among them, cultural service hotpots are important tourism foundations in land utilization development [21,22]. Visual sensitivity, as an important indicator of CES, indicates the sensory intensity of an area, as visitors are usually attracted by the aesthetics and other services provided in the area [23]. It also has a significant impact on the quality of entertainment experiences [24]. To maintain a high-quality entertainment experience and minimize regional ecological damage, it is necessary to carefully evaluate and design land use policies to prioritize regional landscapes with high visual sensitivity and ecological importance [25,26].
ES bundles are a research method proposed in recent years to help improve multifunctional landscape management [27,28]. In 2007, the concept of “ecosystem service bundles” was proposed, and it was considered that nature could be regarded as a diverse set of ES [29]. The bundles are defined as the spatial or temporal aggregation of multiple ES. Yang et al. used the ES bundles to classify counties and identified the low-value and high-value areas of various services in China’s National Area [30]. Taking Inner Mongolia as a study area, the spatial synergies and trade-offs among 12 ES in 88 counties were systematically analyzed under the framework of ES bundles by Dou et al [31]. Chen et al. analyzed the trade-offs and synergies of ES in areas of high intensity human activity and the driving mechanism of their bundles [5]. Raudsepp-Hearne et al. found that the spatial distribution of the six types of ES bundles formed had potential links with various “social-ecological” subsystems [32]. At present, this method is mainly used to determine the relationships among ES and quantitatively analyze the spatial agglomeration characteristics of multiple ES [33,34,35]. The result of this feature identification can be used as the dominant function identification of land use. The introduction of the concept and method of ES bundles and quantitative assessment of land use function classification will be advantageous to examining and improving existing land use planning. Figure 1 shows the research framework of this study.
Xiaohuangshan Mountain (XHSM) is located in Changzhou City, Jiangsu Province. This area is one of the fastest growing economic and urbanization areas in China [36]. Economic development has powered the rapid urban expansion of the region [37]. XHSM has become a key area for future development, which needs sustainable development decision-making in government planning. This study selected a variety of ES in XHSM, combined the visual sensitivity and the ES bundles method to divide land use functions in the study area, and provided new research ideas for establishing a land use policy suitable for composite ecological space management.

2. Materials and Methods

2.1. Study Area

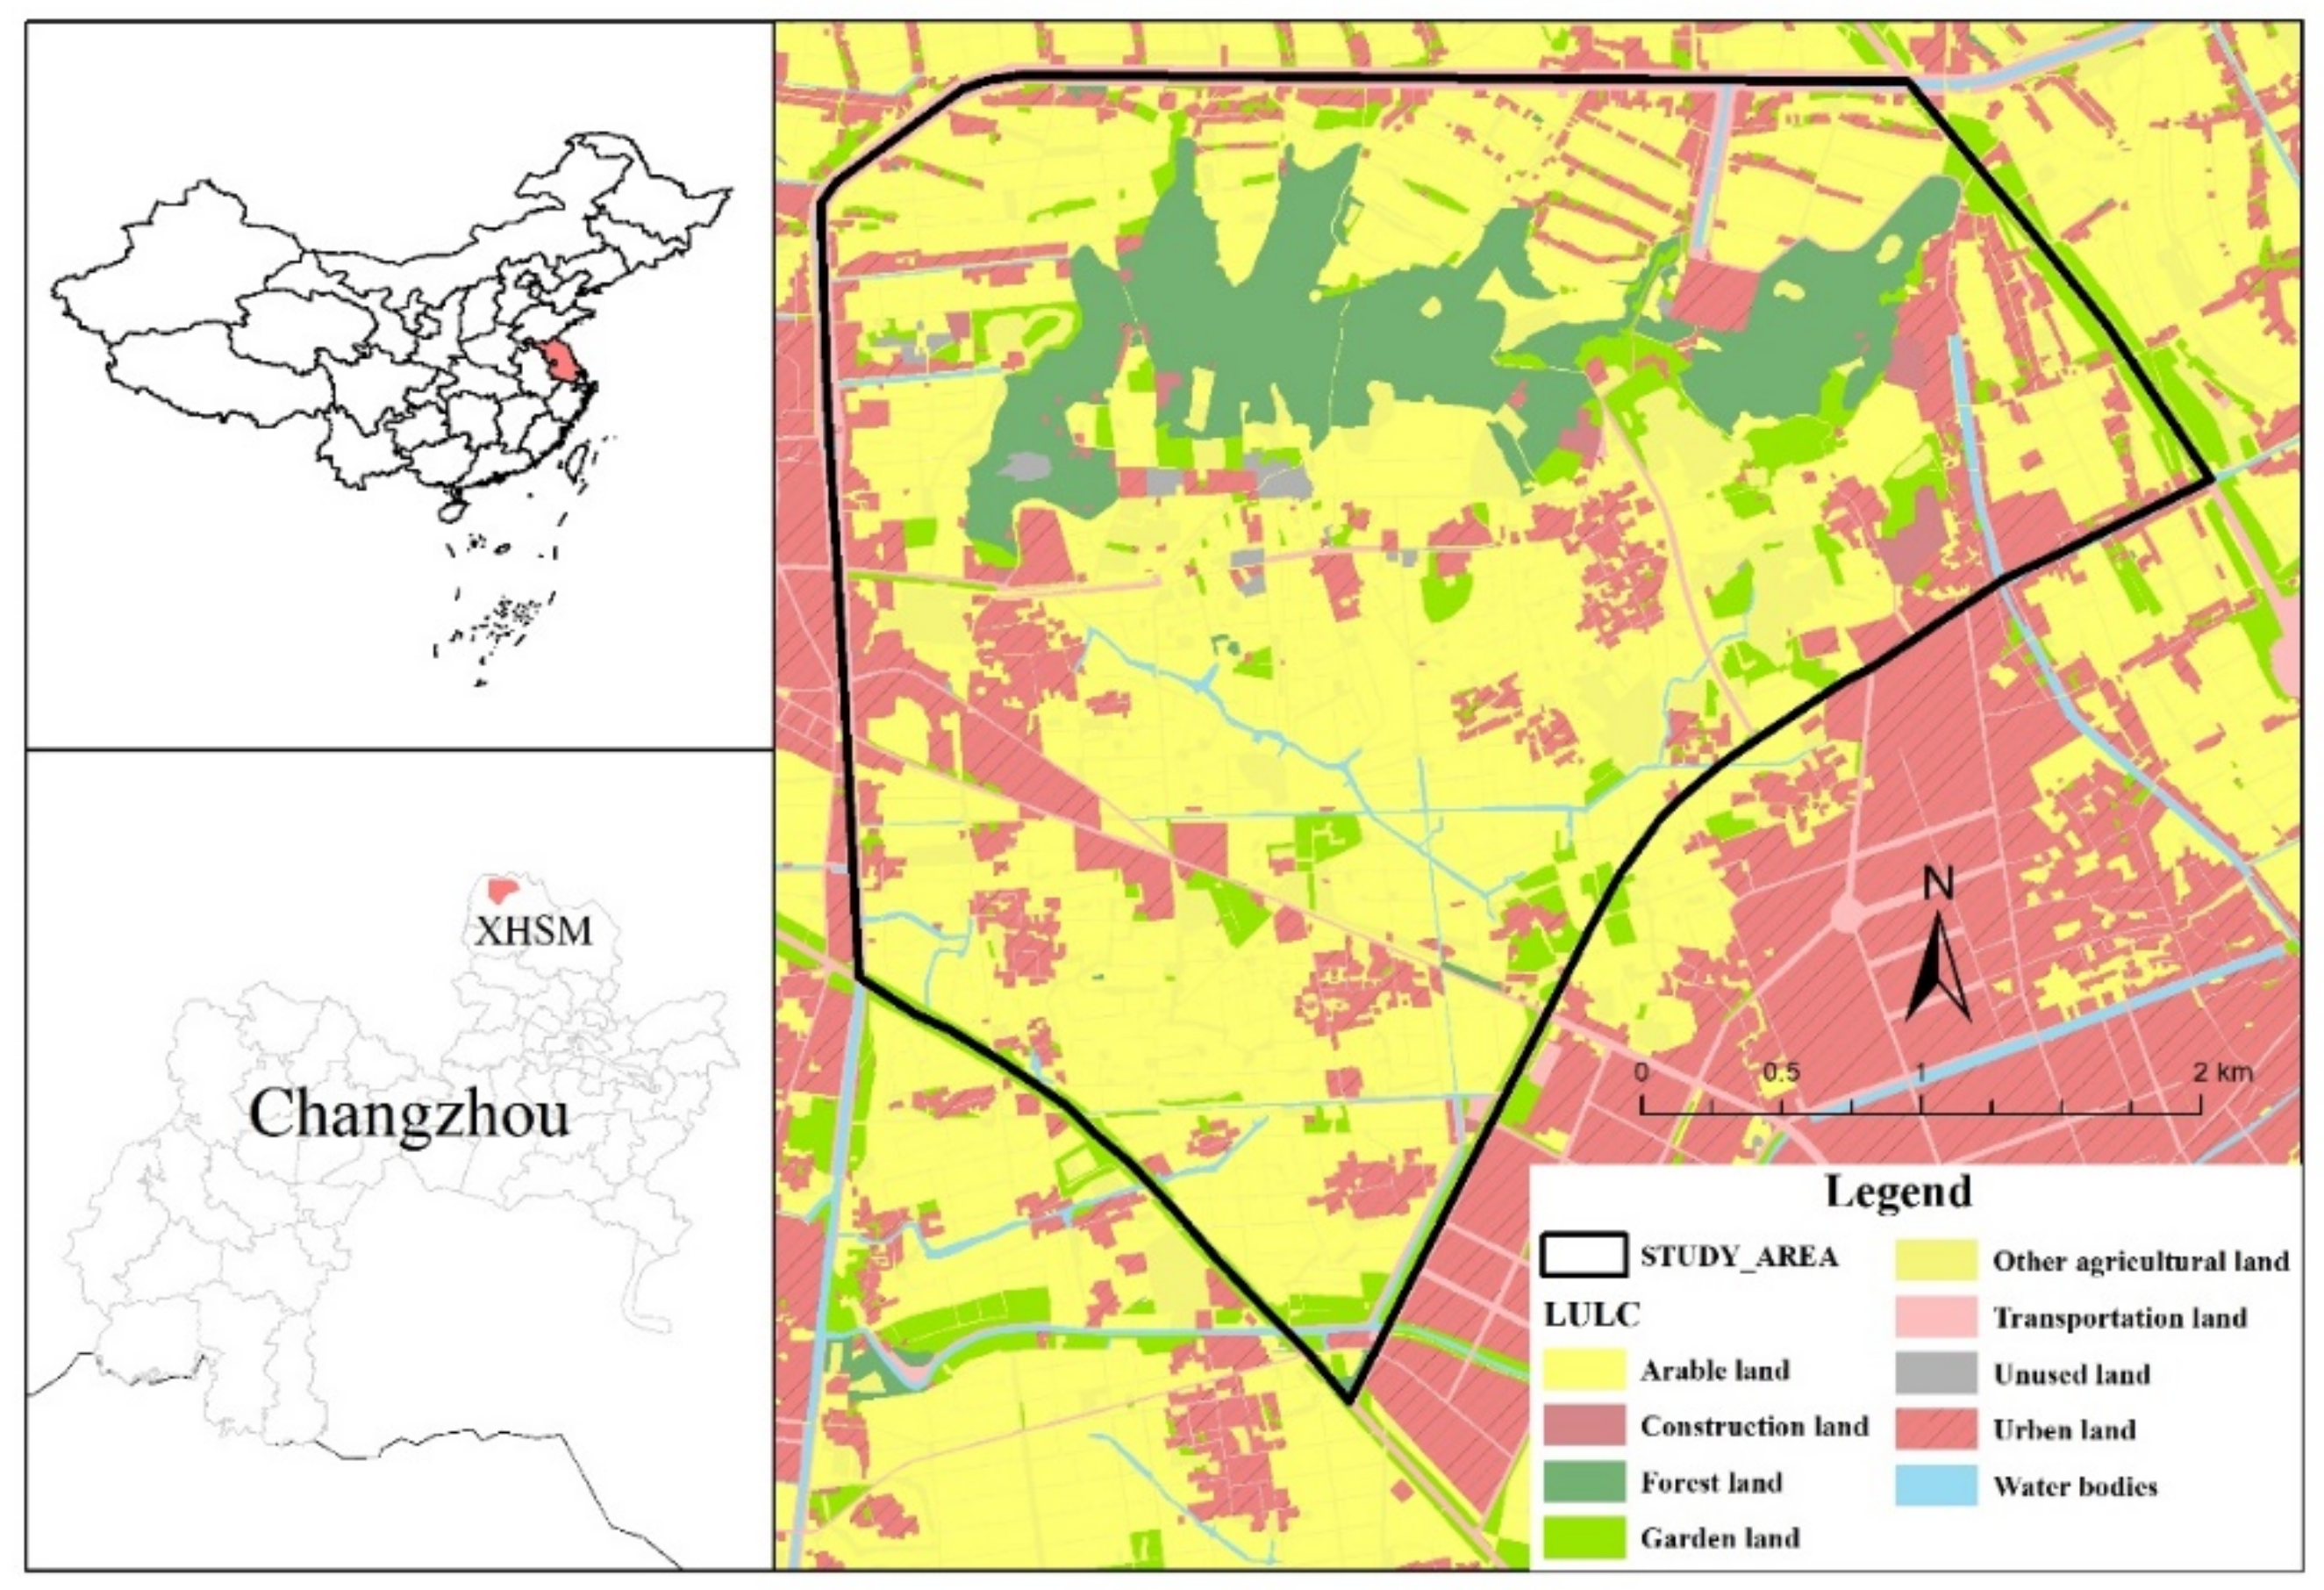
XHSM is located in Menghe Town, Changzhou City, Jiangsu Province, as shown in Figure 2. Menghe Town is an area of famous Chinese towns and villages with historical cultural value and is the hometown of Chinese folk culture and art. In 2018, Menghe Town was selected as one of the top 50 most beautiful small towns in China. The total area of XHSM is 1415 ha. Because of its location on the plains, the mountain resource of XHSM seems even more valuable. With the forest resources and unique cultural atmosphere, the study area attracts many visitors. Historically, XHSM had an adverse impact on the ecological environment due to mining and other reasons. However, later, it had a good ecological environment through the effects of ecological restoration with dense vegetation and good water quality. According to the construction of China’s ecological civilization, tourism development needs to be the future direction. Therefore, CES evaluation and tour experience (TE) of the study area requires serious consideration for inclusion in the land use management strategy. XHSM is a typical area with frequent “social ecology” activities, and it has an exemplary role in ecological management and future construction.

2.2. Data Sources

We conducted a questionnaire survey in XHSM in November 2019. A total of 300 random sampling survey questionnaires were distributed to respondents in the study area. There were 242 valid questionnaires, and the effective rate of the questionnaire was 80.67%. Table 1 provides information about the respondents.
The content of the questionnaire was divided into five parts. Part one included information about the social background of the respondents. Part two included information that affected the validity of the questionnaire, including whether the respondent was familiar with the area and whether any types of CES were obtained. Part three included attitude and preference information. Part four included value index (VI) information, which involves the respondents’ ratings of CES. Part five included sampling point data. In addition to social survey data, research data also need regional environmental data. Table 2 lists the detailed data sources.

2.3. Modeling Tour Experience

In this study, we used visual sensitivity to characterize the TE. The mountain’s tour TE is mainly determined by the terrain, the presence of elements that hinder visual appreciation, and the provision of cultural services accessible to potential visitors [23,25,38]. The study applied three influencing factors, namely distance (distance from the observation point to the visible area, VSd), slope (the slope of the visible area obtained from the observation point, VSa), and visibility (visibility can measure the speed of visitors along the road, and represents the intensity of travel and leisure, VSt) [39,40].
V S d   = 1   ,   d D m i n D / d   , D m i n d D m a x 0   , d D m a x
In Formula (1), Dmin represents the minimum visible radius in the densely vegetated mountains, Dmax represents the maximum visible radius, and d is the actual distance between the observation points and the viewshed of XHSM. When Dmin is set to 300 m, it corresponds to the farthest distance at which the observer can clearly distinguish different scenery. When Dmax is set to 600 m, the distant scenery attracts observers poorly; therefore, visual sensitivity is considered to be 0 [26,41].
V S a = s i n a   0 ° a 90 °
In Formula (2), a is the angle between the XHSM surface and the ground plane, and VSa is the total area of the field of view [26]. When a = 90°, VSa is the largest visible area. In this case, the maximum visual sensitivity is set to 1.
The theoretical basis of VSt is a phenomenon that occurs when objects or infrastructure are observed from multiple observation points [42]. VSt adopts a grid terrain and is composed of multiple observation points as sources of view fields. The height of observers is set to 162 cm, which is the average height of visitors in China. The road length of XHSM is 114 km. We set observation points at 30 m intervals and obtained a total of 3491 observation points. This distance ensures the accuracy of the VSt model and that it is beneficial for repeated verification work.
Finally, the overall TE was constructed, which selected the average value to show these three factors and obtained the final composite map (0–1).
TE = average (VSa, VSd, VSt)

2.4. Quantifying and Mapping ES

The study selected seven important ES in XHSM, including recreation, biodiversity, historical, aesthetic, soil retention, surface water regulation, and soil nutrition. Table 3 shows the classification and meaning of each ES.

2.4.1. Quantifying and Mapping CES

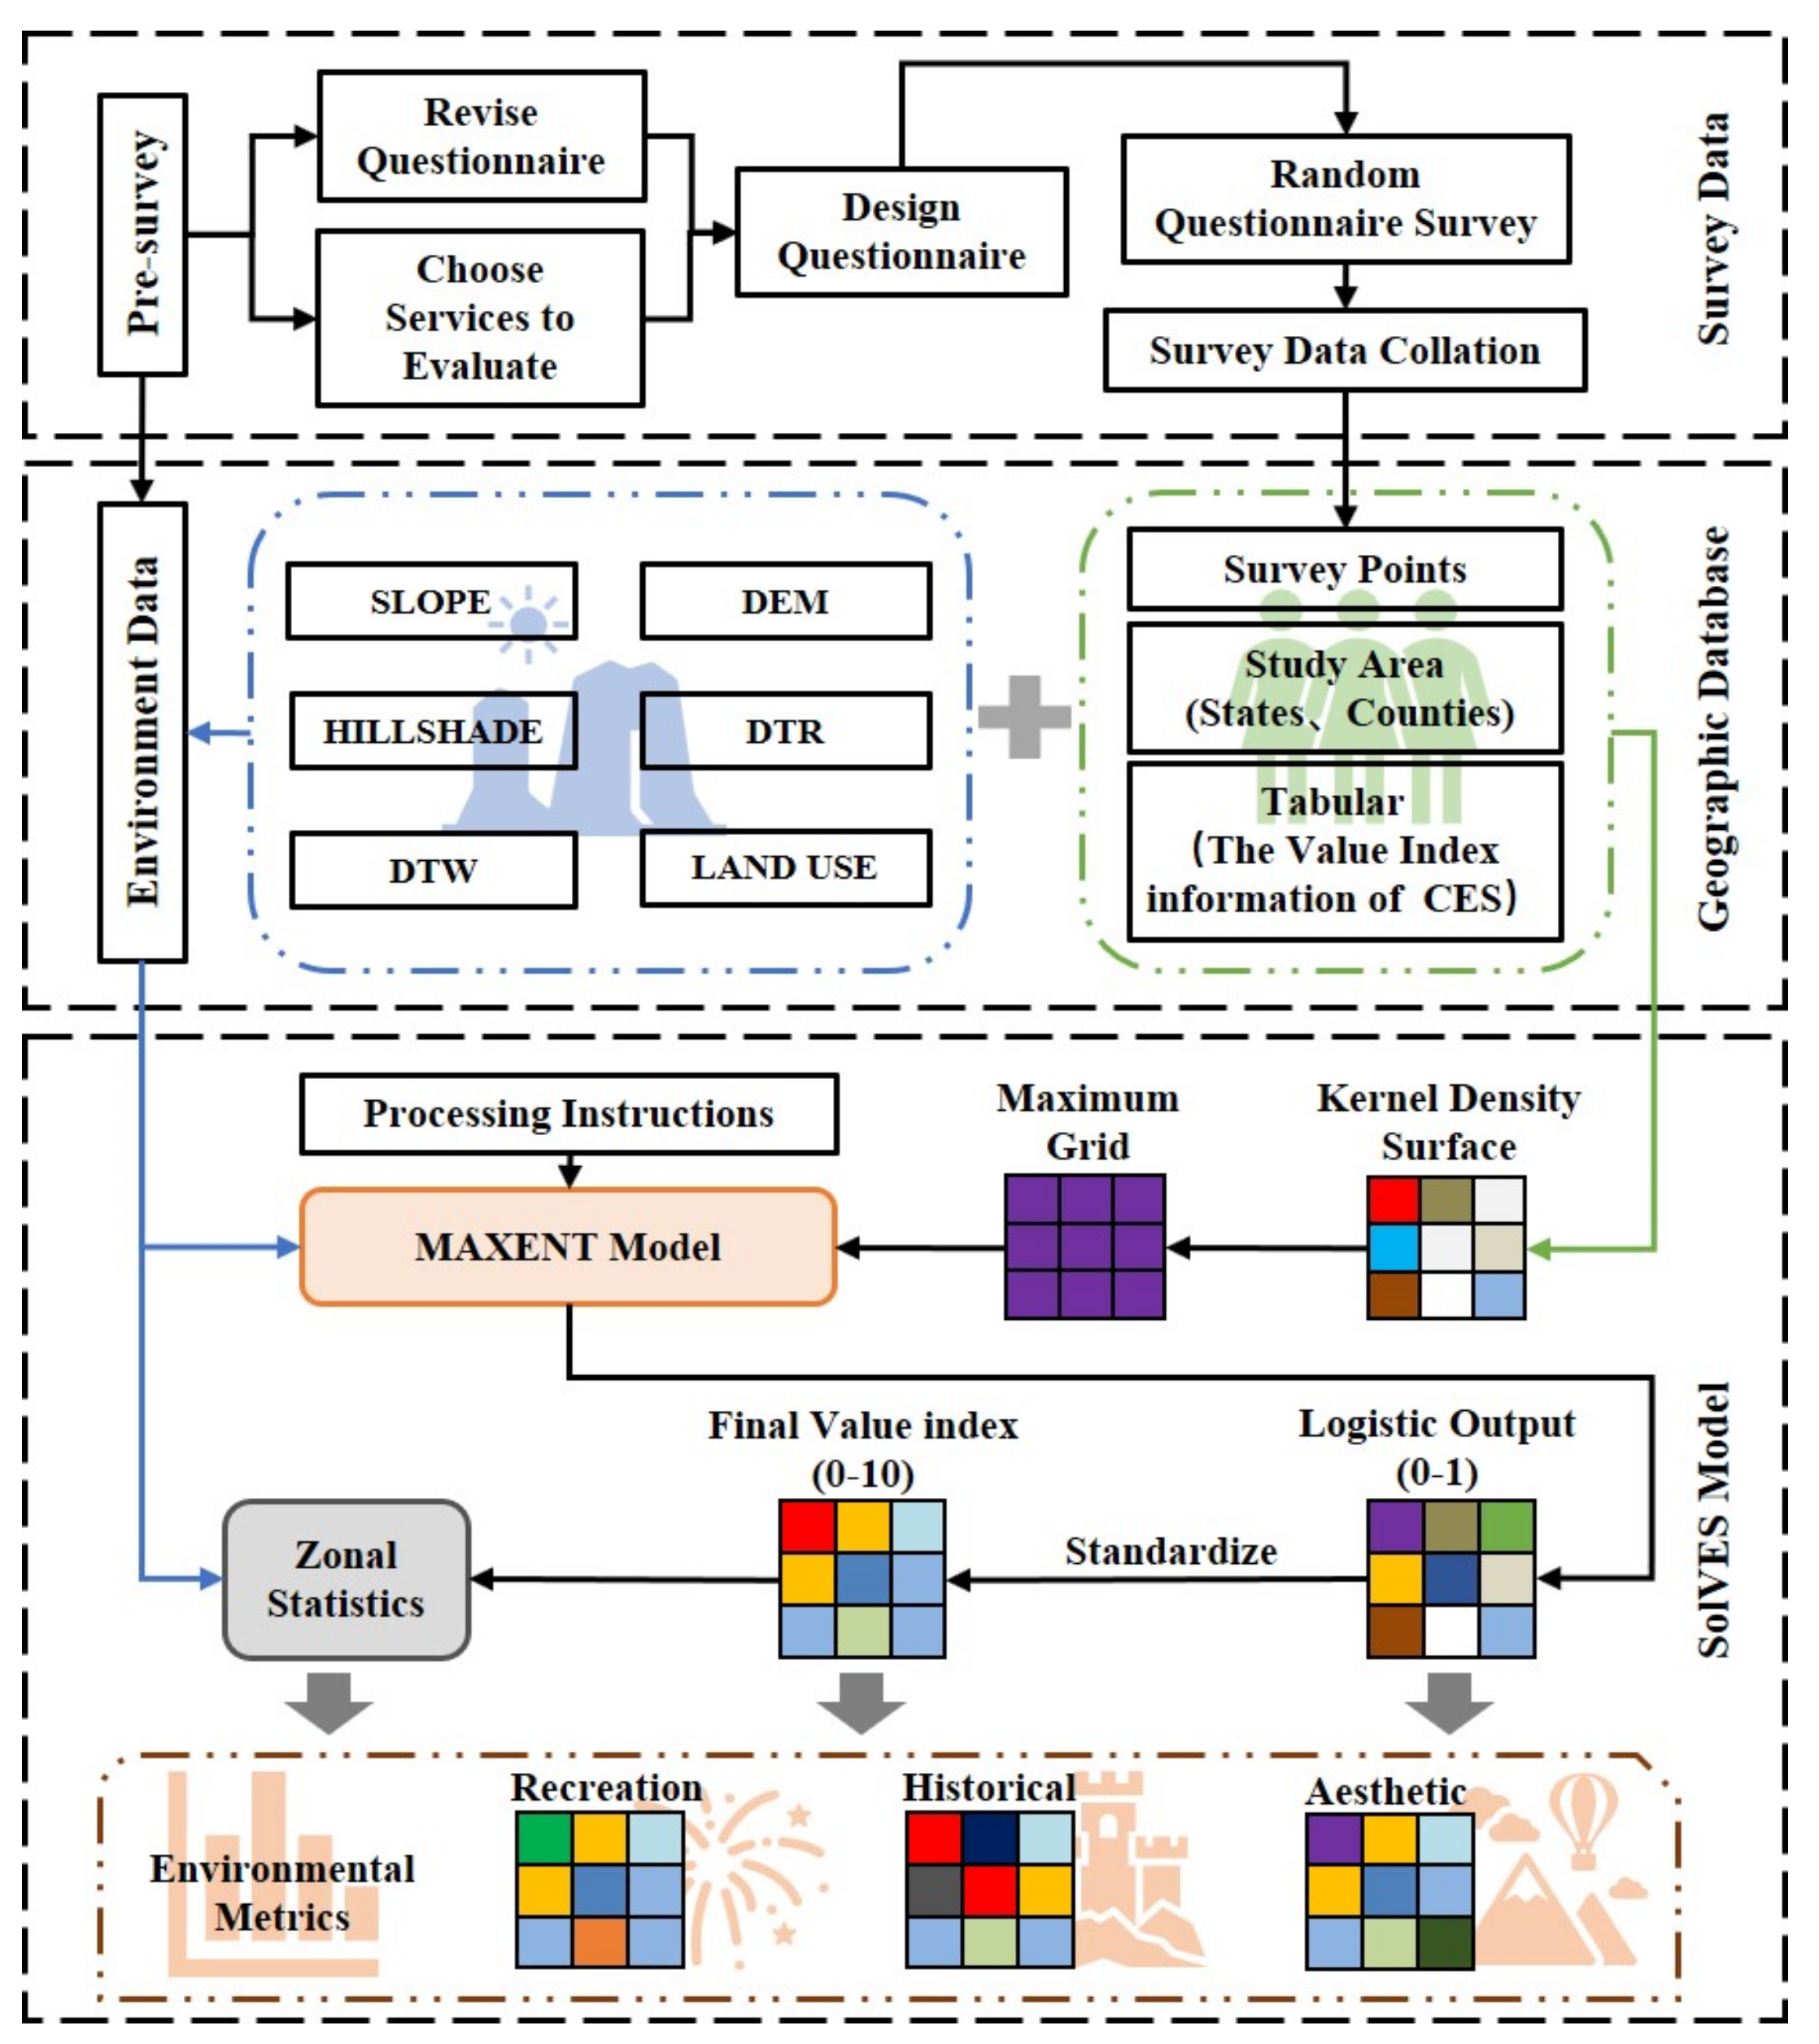
The SolVES model was jointly developed by the USGS Geosciences and Environmental Change Science Center (GECSC) to comprehensively evaluate, quantify, and map various CES. SolVES uses social survey data and natural environment data to achieve multi-dimensional evaluation. The research results are based on comprehensive natural and social considerations, not just a single consideration. SolVES uses social value mapping research to quantify and map these social values through value index (VI), thus realizing the method of incorporating social factors into CES evaluation. The Maxent module in SolVES can display the evaluation results in a complete map display [43,44]. In this study, we used SolVES (version 3.0) to assess CES in XHSM. The key steps to generate the VI are shown in Figure 3.
CES are services that need be obtained through personal experience, and TE has a great impact on the assessment of CES. Meanwhile, to better integrate TE into the ES bundles framework, the calculation result of CES depends on the multiplication of TE and VI maps.

2.4.2. Quantifying and Mapping Other ES Factors

Soil retention: In this study, the calculation of soil retention is through the revised universal soil loss equation (RUSLE) [45]. We need to calculate the soil erosion on bare land RKLS = R × K × L × S, and the soil erosion with management measures and vegetation cover USLE = R × K × L × S × C × P, to obtain the soil retention RUSLE = RKLS − USLE, where R is the rainfall erosivity factor, K is the soil erodibility factor, L and S are terrain factors, C is the vegetation factor, and P is soil conservation measures factor.
R = i = 1 12 1.5527 + 0.1792 j i ,
where i is the month and ji is the monthly precipitation.
K reflects the soil’s corrosion resistance. Based on the specific conditions of the region, K values of different texture soils can be determined. The larger the K value, the worse the soil corrosion resistance, and vice versa.
S = 10.8 s i n θ + 0.036 ,   θ < 5 ° 16.8 s i n θ 0.5 , 5 ° θ < 10 ° 21.9 s i n θ 0.96 ,   θ 10 ° ,
L = λ / 22.13 m ,
m = β / 1 + β ,
β = s i n θ / 0.0896 / [ 3 ( s i n θ ) 0.8 + 0.56 ] ,
where θ represents the slope of the ground, λ is the horizontal projected length of the grid cell, m is the slope length index, and β is the ratio of pit erosion.
C = 1 ,     f = 0 0.6508 0.3436 0 ,     f > 78.3 % l g f ,   0 < f 78.3 %   ,
F = (NDVINDVImin)/(NDVImaxNDVImin),
where NDVI is the normalized vegetation index, and NDVImax and NDVImin are the maximum and minimum values of NDVI for the entire growing season of the vegetation.
P reflects the difference in soil erosion caused by vegetation management measures, which is mainly determined by LULC and ranges from 0 to 1.
Surface water regulation: In this study, the annual average runoff was used as the measurement index, which was obtained through the ArcGIS 10.3 hydrological analysis module. The data set were from a Digital elevation model (DEM) with a spatial resolution of 5 m.
Soil nutrition: In this study, the sensitivity of land degradation was used to characterize this indicator.
D = I × W × K × C 4 ,
where D is the sensitivity index of land desertification in the evaluation area, and I, W, K, and C are the evaluation area dryness index, the number of days of wind from the sand, the soil erodibility factor, and the vegetation factor.
I =   0.16 × TEMP / PRCP   ,
where TEMP is accumulated temperature, which refers to the sum of the daily average temperature ≥10 ℃ throughout the year, and PRCP refers to the total amount of precipitation during the year when the temperature is ≥10 ℃.

2.5. Statistical Analyses

All ES layers are normalized to a value of 0–100. To retain the data information to the greatest extent, this study unifies all data layers into a 10m × 10m grid. We synthesized the above layers and performed a K-means cluster analysis through R3.6.2 to identify each characteristic ES bundle [46].

3. Results

3.1. Survey Responses

In the questionnaire survey, we collected the respondents’ opinions on the suitable season to visit XHSM. Some respondents believed that one season was suitable for touring, while others believed that multiple seasons were suitable. Respondents could choose multiple seasons. The results are shown in Table 4.
In Table 4, Single choice, double choice, three choice, and full choice indicate that the respondent chose one, two, three, or all seasons, respectively, spring, summer, autumn, and winter, were considered good times to visit XHSM by 176, 89, 115, and 26 respondents, respectively. Spring was considered a more suitable season for visiting XHSM by 43% of people based on the survey results, while 22%, 28%, and 7% of people assume that summer, autumn, and winter, respectively, are more suitable seasons for visiting XHSM. The results show that spring and autumn were considered most suitable seasons for visiting XHSM.

3.2. Tour Experience

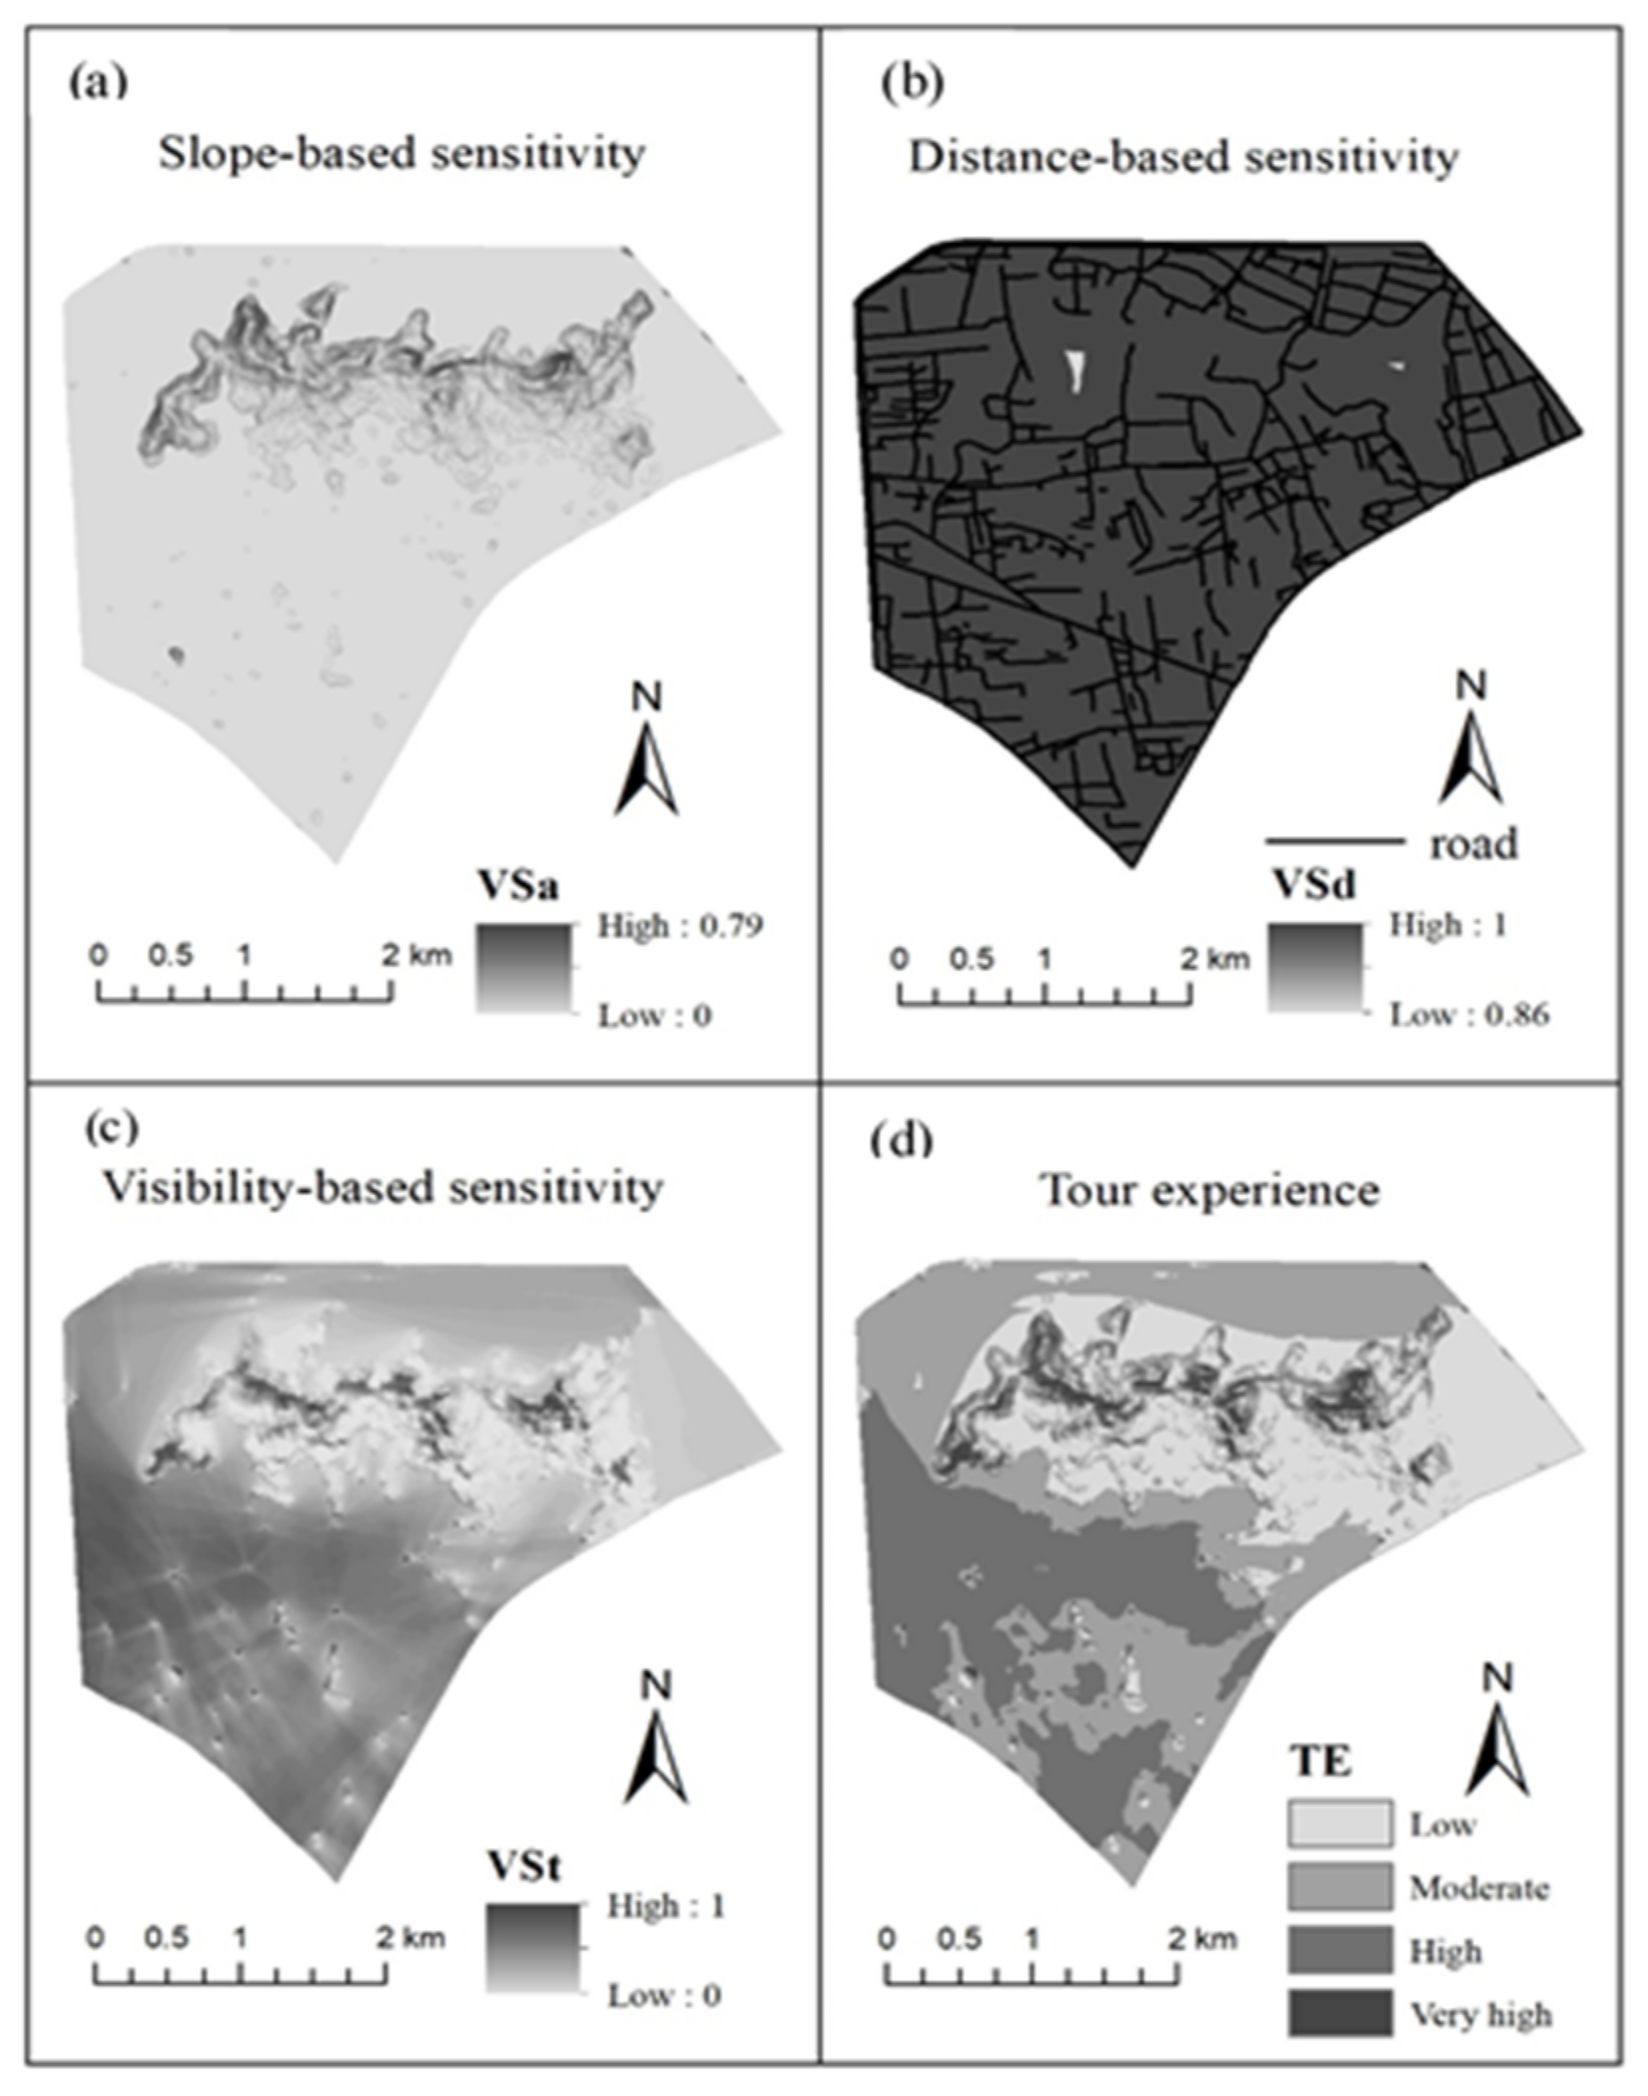
The TE based on the elements of slope, distance, and visibility was generated and is shown in Figure 4. Table 5 represents a statistical summary of TE in XHSM. We classified TE as very high, high, moderate and low.
A portion of the study area was identified as having very high and high TE (32.40%). These areas may be visited more frequently; therefore, close attention and careful planning of the landscape is required. The TE of most of the study areas was classified as moderate (40.22%), covering the main portion of the study area. These are the areas where people spend substantial time on activities, and corresponding development activities seem to be necessary. Approximately 27.39% of the study area is rarely seen. The potential visual impact of vegetation in these areas is low, and the low TE can ensure proper protection and natural regeneration of XHSM.

3.3. ES Distribution Status

The distribution characteristics of different types in XHSM are shown in Figure 5.
Areas with higher recreation value are formed in the area surrounding the road. Hot spots can form near water bodies and green areas. High biodiversity value areas are formed in the mountain area of XHSM with higher altitude, and high-value areas cannot be formed near roads. Areas with higher historical value overlap with urban areas at lower elevations. However, mountainous areas have mostly low historical value areas. High-value areas with aesthetic value are concentrated in the mountainous part of XHSM, and obvious higher value areas can be formed near the water body. Soil retention is mainly concentrated on the mountainous area where there is more vegetation coverage and less human activity. Surface water regulation is greatly affected by terrain, and high-value areas will be formed where the terrain is steep. Soil nutrition has high value areas where the terrain is flat.

3.4. Identification of ES Bundles

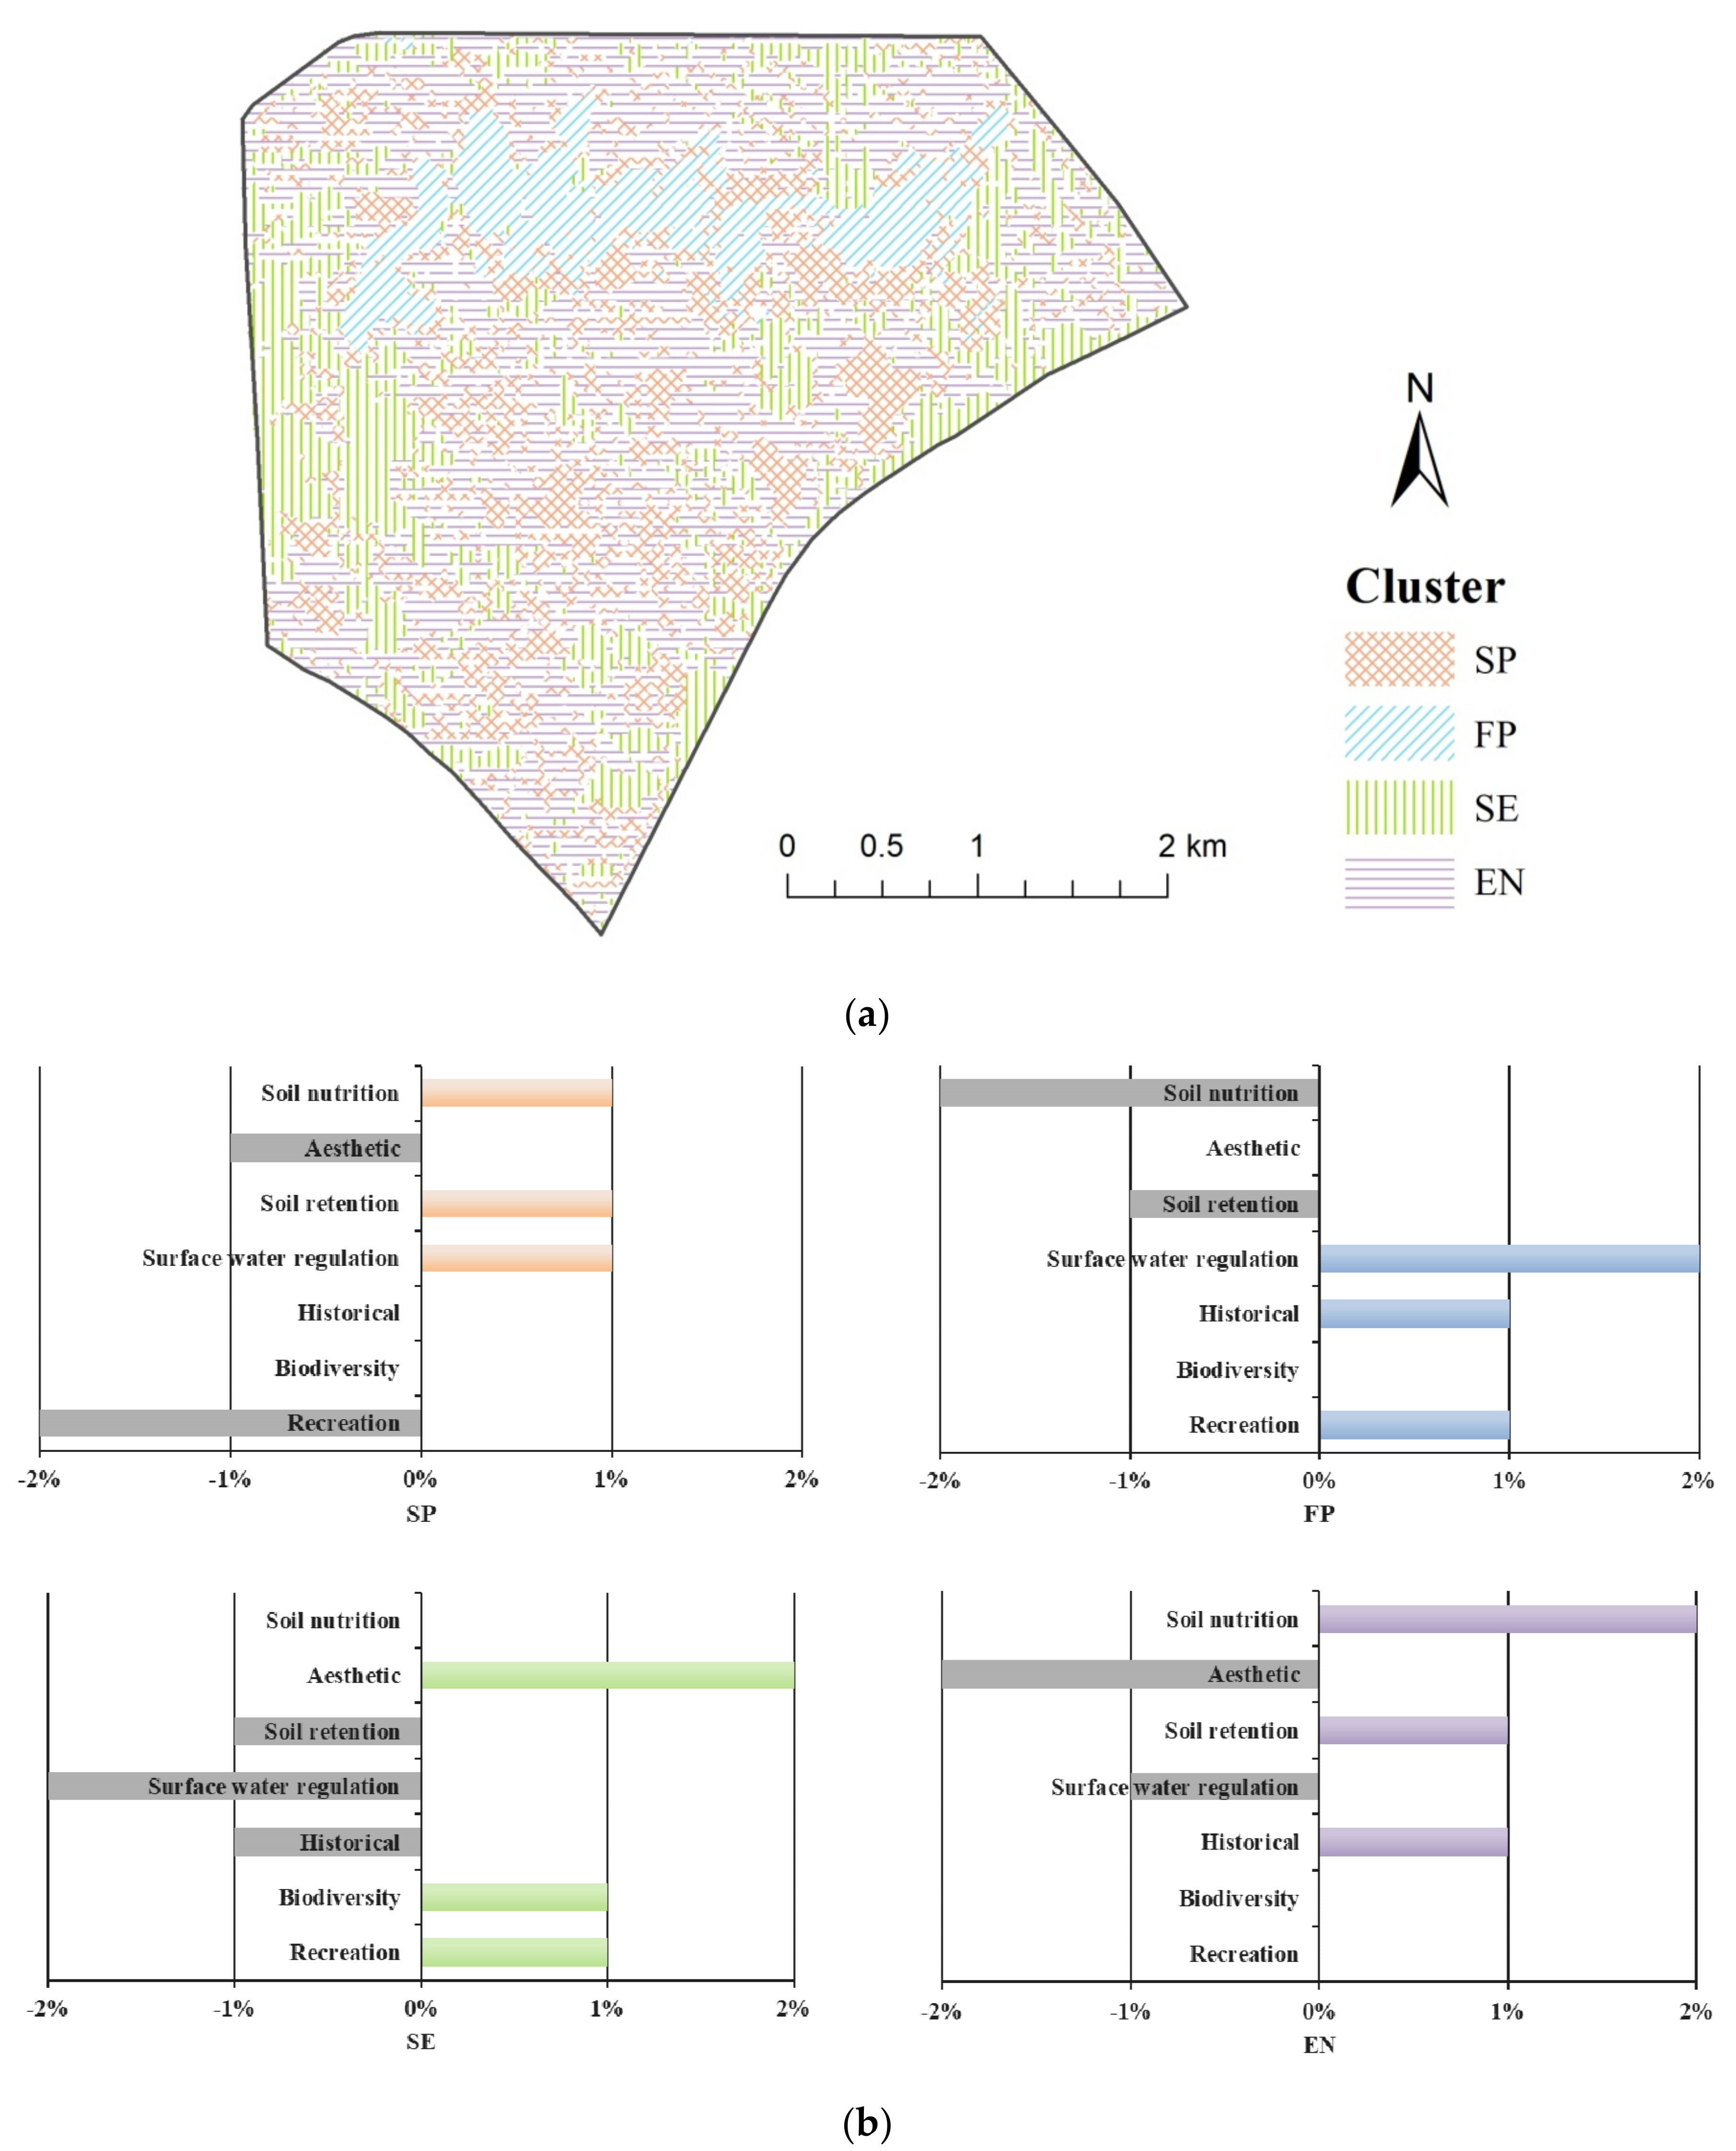
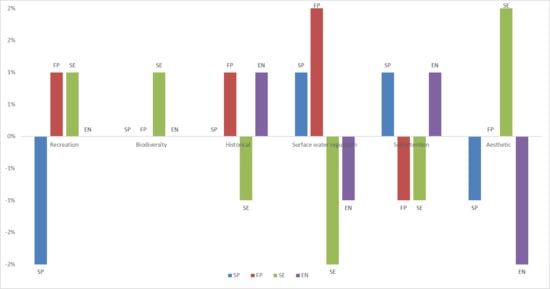
In this study, the K-means method was used to perform cluster analysis of seven ES in the study area. According to the ES characteristics provided by XHSM, all pixels were divided into four types (bundles) of similar ES (Figure 6). The four bundles were distinguished according to their dominant function and direction of administration: soil protection (SP), forest park (FP), sightseeing entertainment (SE), and ecological conservation (EN).
Table 6 shows the percentage contribution of each ES to the classification in XHSM and the area of each ES bundle. SP accounts for 24% of the study area. The three ES of soil retention, surface water regulation, and soil nutrition were significant, while the other services were below average and mainly distributed in flat tillage areas. FP accounts for 10% of the study area. The surface water regulation ability is significant, and it also has high historical and recreation value. It is mainly distributed among the mountain and forest resource concentration area of XHSM. SE accounts for 22% of the study area. The three CES of aesthetic, recreation, and biodiversity have higher value. This bundle is mainly distributed over areas with more visiting opportunities. EN accounts for 44% of the study area. The soil nutrition ability is significant, and it also has high historical and soil retention. This bundle is mainly distributed in most flat areas of XHSM.
Each bundle has a prominent capacity of certain services that other packages do not provide. Among them, SE has outstanding ability to provide CES. SP provides more natural regulating services. FP has both cultural and regulating services. For EN, the ability to regulating services is higher than CES.

4. Discussion

4.1. Seasonality

Most people assume that spring and autumn are more suitable seasons for visiting XHSM based on the survey results (Table 4). This may be due to the influence of local climate conditions, as the temperature is suitable in spring and autumn, and the locals have the custom of spring outings, so spring is considered to be the most suitable season. Phenological changes (flowering and leaf stage) may attract repeated visits in different seasons. The perception of CES may also change seasonally [47,48]. Managers need to consider how to cope with the needs of different seasons. In addition, from a seasonal perspective, meteorological conditions, such as the length of daylight and PM2.5 may improve the accuracy of the TE model.

4.2. Tour Experience Analysis

A TE model that combines slope, distance, and observation points can help us better identify hotspots for cultural services, and also help identify places that are important for conservation and management, thereby improving stakeholder understanding [49]. In recent years, the government has wanted to develop XHSM as a tourist resort to drive regional economic development. Areas of high-value TE and those that are more easily visited by people are considered to have better tourism development potential. This information can help land use managers identify areas with development potential. Additionally, policy makers and planners can use the model for area management development with similar requirements.
In areas with high TE, tourists may be subjected to strong visual impact, and managers must notice and carefully perform the necessary landscape planning. The quality of landscape in these areas will have an impact on tourists’ psychological and behavioral experience [50]. Appropriate landscape design and management of the area will greatly improve the travel experience. Therefore, how to enhance the attractiveness of the landscape is crucial for these areas [51]. Meanwhile, providing necessary entertainment facilities can even attract more tourists to the scene to enjoy the scenery, which will be beneficial for the development of entertainment and tourism. Intermediate-level TE areas cover almost half of the study area. These areas are places where tourists stay longer, and the corresponding infrastructure construction should be strengthened. The areas with low TE are less observed and more attention can be devoted to ecological conservation.

4.3. Implications for Land Use Management

The spatial heterogeneity of ES determines the ES bundles provided by a region. The clustering method can effectively classify similar ES regions, which are determined by similar social ecological factors. This enables better recommendations of specific sustainable development in different regions [52].
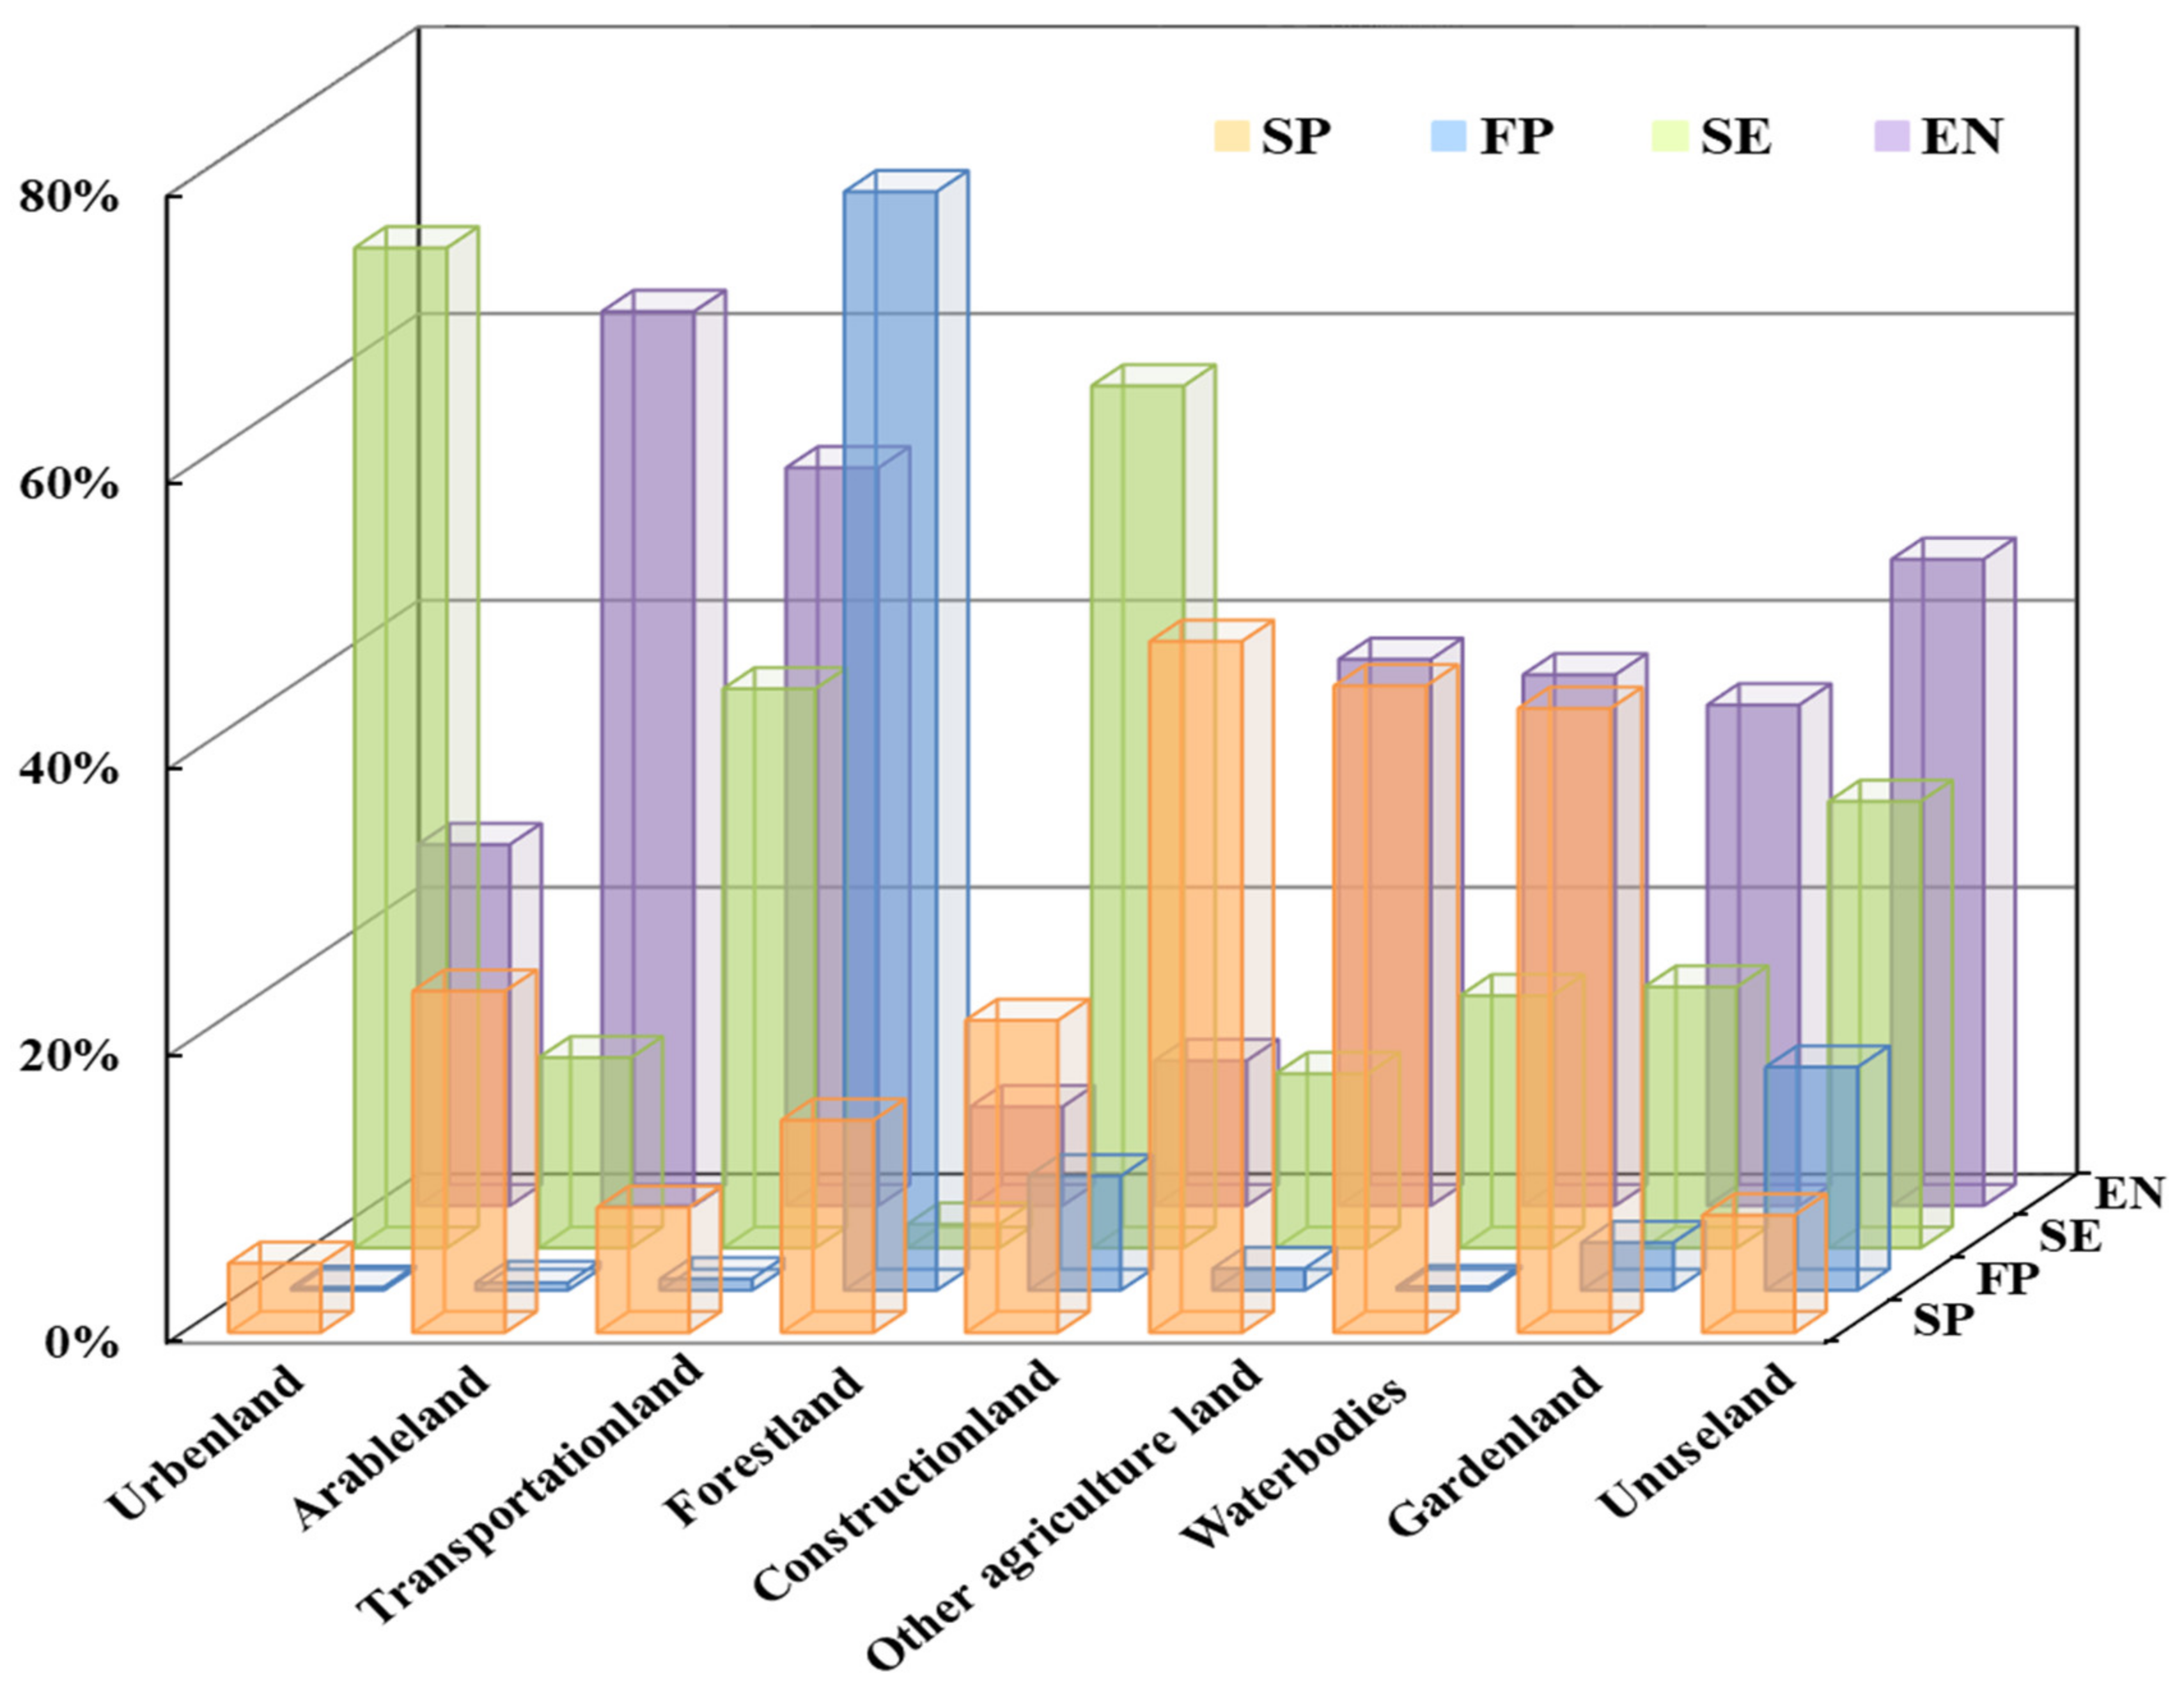
To further explore the relationship between land use and ES bundles, we calculated the distribution ratio of ES bundles corresponding to each type of land use in the study area by land category statistics. This analysis can comprehensively cover the ES of all land use in the study area, supply the relative strength between typical ES bundles, and distinguish the dominant ES of different land use areas to provide support for land use planning. The statistical results are shown in Figure 7.
It can be seen from Figure 7 that most of the land use types of SP are other agricultural land, water bodies, garden land, and arable land. Because of these land use types, SP itself has more natural regulating functions and provides less CES. In future planning, we can focus on ecological protection, reduce unnecessary construction and development, and preserve the local ES. Forest land and unuseland cover most of the FP area. Because of the existence of mountains in FP, it will have great significance for surface water regulation and CES. Due to some construction land left by the mining industry in the past, and some infrastructure and entertainment facilities built for tourism development, construction land also accounts for a significant part of FP. The corresponding ecological damage caused by development should be avoided, and protective development should be carried out.
Urban land, transportation land, and construction land are more distributed in SE. This may be due to the greater ability of urban land itself to provide CES, because of its historical heritage and greater entertainment opportunities. Convenient transportation will also facilitate tourists’ visit. The SE can determine future development plans based on its own characteristics, such as the transformation of urban features and the strengthening of tourism infrastructure. It is also an important part of the entire XHSM development. Most of the land use types of EN are arable land. In EN, regulating services are more provided, and the area is vast. From the perspective of arable land protection, the area should prioritize protection.

4.4. Discussion with Current Planning Policies

China has proposed national land and spatial planning since 2019. In preparing national land and spatial planning, local governments need to respond positively to the strict controls proposed by the state, such as the Ecological Red Line (ERL). In the past few years, the ERL has played a pivotal role in curbing the disorderly expansion of built-up areas, while preserving ecological integrity. It has been declared that the demarcation of the border and calibration of the “red line” regions with important ecological functions would be completed in the near future. Therefore, a detailed land use zoning method proposed is needed subsequently to facilitate meeting the national regulatory requirements for protecting the ecological environment and developing the local economy.
Economic activities should be performed in areas with prominent cultural service function and poor other service functions. In areas where cultural services are not prominent but other service functions are prominent, ecological protection should be emphasized. Such zoning management may be better aligned with various demands. Protective development is necessary for managers who conduct actual development in research areas. A favorable environment is an essential condition to attract tourists, and the corresponding construction activities should be based on the premise of not damaging the regional environment and ecological functions.

5. Conclusions

To achieve the balance between ecological protection and economic development, the development strategy of regional planning is formulated in combination with natural conditions and societal development trends. Solving a series of ecological problems accompanying urbanization through the above ideas may be the development direction of future urban planning. This study obtained social survey data, remote sensing data, natural environment data, and socioeconomic data to calculate the important local ES of XHSM. Finally, we calculated the seven ES of XHSM, including recreation, biodiversity, history, aesthetics, soil retention, surface water regulation, and soil nutrition. These ES simultaneously represented the views of regional natural systems and humanistic society. They were clustered into four ES bundles for XHSM using a K-means method. SP and EN bundle areas were considered important for protection, and further construction activities in these areas should be avoided. The FP bundle area needs to be developed without destroying ecological functions. The SE bundle area is the core areas for providing CES, and for future construction and development. The results obtained in this work show that quantifying and mapping regional representative ES bundles can provide the necessary information to support a win-win solution to land use management in areas with different social and ecological characteristics. It is of great significance to the sustainable development of the city.

Author Contributions

Conceptualization, Q.Z., Y.C. (Yanming Chen), and M.L.; Data curation, Q.Z., W.L. and S.W.; Funding acquisition, Y.C. (Yanming Chen) and M.L.; Investigation, Q.Z. and Y.C. (Yanming Chen); Methodology, Q.Z. and Y.C. (Yuda Cuan); Project administration, Y.C. (Yanming Chen) and M.L.; Software, H.Z., M.L. and Y.C. (Yanming Chen); Writing—original draft, Q.Z. and Y.C. (Yuda Cuan); Writing—review & editing, Y.C. (Yanming Chen), M.L. and H.Z. All authors have read and agreed to the published version of the manuscript.

Funding

This work was supported by the National Key R&D Program of China (2017YFB0504205), the National Natural Science Foundation of China (42071440), and the Natural Science Foundation of Jiangsu Province of China (BK20201257).

Institutional Review Board Statement

Not applicable.

Informed Consent Statement

Not applicable.

Data Availability Statement

Data sharing is not applicable to this article.

Acknowledgments

We are very grateful to Yanying Yang and Zhiyun Ouyang for offering advice on the clustering analysis performed in this study. We would like to thank the anonymous reviewers and the editor for their helpful suggestions and comments.

Conflicts of Interest

The authors declare no conflict of interest.

References

  1. Jin, G.; Deng, X.; Chu, X.; Li, Z.; Wang, Y. Optimization of land-use management for ecosystem service improvement: A review. Phys. Chem. Earth Parts A B C 2017, 101, 70–77. [Google Scholar] [CrossRef]
  2. Deng, X.; Zhao, C.; Lin, Y.; Zhang, T.; Qu, Y.; Zhang, F.; Wang, Z.; Wu, F. Downscaling the Impacts of Large-Scale LUCC on Surface Temperature along with IPCC RCPs: A Global Perspective. Energies 2014, 7, 2720–2739. [Google Scholar] [CrossRef] [Green Version]
  3. Bryan, B.A.; Nolan, M.; McKellar, L.; Connor, J.D.; Newth, D.; Harwood, T.; King, D.; Navarro, J.; Cai, Y.; Gao, L.; et al. Land-use and sustainability under intersecting global change and domestic policy scenarios: Trajectories for Australia to 2050. Glob. Environ. Chang. 2016, 38, 130–152. [Google Scholar] [CrossRef] [Green Version]
  4. Cumming, G.S.; Buerkert, A.; Hoffmann, E.M.; Schlecht, E.; Von Cramon-Taubadel, S.; Tscharntke, T. Implications of agricultural transitions and urbanization for ecosystem services. Nat. Cell Biol. 2014, 515, 50–57. [Google Scholar] [CrossRef] [PubMed]
  5. Chen, T.; Feng, Z.; Zhao, H.; Wu, K. Identification of ecosystem service bundles and driving factors in Beijing and its surrounding areas. Sci. Total. Environ. 2020, 711, 134687. [Google Scholar] [CrossRef]
  6. Carpenter, S.R.; Mooney, H.A.; Agard, J.; Capistrano, D.; DeFries, R.S.; Díaz, S.; Dietz, T.; Duraiappah, A.K.; Oteng-Yeboah, A.; Pereira, H.M.; et al. Science for managing ecosystem services: Beyond the Millennium Ecosystem Assessment. Proc. Natl. Acad. Sci. USA 2009, 106, 1305–1312. [Google Scholar] [CrossRef] [Green Version]
  7. Costanza, R.; d’Arge, R.; De Groot, R.; Farber, S.; Grasso, M.; Hannon, B.; Limburg, K.; Naeem, S.; O’neill, R.V.; Paruelo, J.; et al. The value of the world’s ecosystem services and natural capital. Nature 1997, 387, 253–260. [Google Scholar] [CrossRef]
  8. Finlayson, M.; Cruz, R.D.; Davidson, N.; Alder, J.; Cork, S.; Groot, R.S.D.; Lévêque, C.; Milton, G.R.; Peterson, G.; Pritchard, D. Millennium Ecosystem Assessment: Ecosystems and Human Well-Being: Wetlands and Water Synthesis; Island Press: Washington, DC, USA, 2005; Volume 656, pp. 87–98. [Google Scholar]
  9. Costanza, R.; Liu, S. Ecosystem Services and Environmental Governance: Comparing China and the U.S. Asia Pac. Policy Stud. 2014, 1, 160–170. [Google Scholar] [CrossRef]
  10. Robinson, B.E.; Zheng, H.; Peng, W. Disaggregating livelihood dependence on ecosystem services to inform land management. Ecosyst. Serv. 2019, 36, 100902. [Google Scholar] [CrossRef]
  11. Bouwma, I.; Schleyer, C.; Primmer, E.; Winkler, K.J.; Berry, P.; Young, J.; Carmen, E.; Špulerová, J.; Bezák, P.; Preda, E.; et al. Adoption of the ecosystem services concept in EU policies. Ecosyst. Serv. 2018, 29, 213–222. [Google Scholar] [CrossRef]
  12. Schaefer, M.; Goldman, E.; Bartuska, A.M.; Sutton-Grier, A.E.; Lubchenco, J. Nature as capital: Advancing and incorporating ecosystem services in United States federal policies and programs. Proc. Natl. Acad. Sci. USA 2015, 112, 7383–7389. [Google Scholar] [CrossRef] [PubMed] [Green Version]
  13. Hansen, R.; Frantzeskaki, N.; McPhearson, T.; Rall, E.L.; Kabisch, N.; Kaczorowska, A.; Kain, J.-H.; Artmann, M.; Pauleit, S. The uptake of the ecosystem services concept in planning discourses of European and American cities. Ecosyst. Serv. 2015, 12, 228–246. [Google Scholar] [CrossRef] [Green Version]
  14. Rao, Y.; Zhou, M.; Ou, G.; Dai, D.; Zhang, L.; Zhang, Z.; Nie, X.; Yang, C. Integrating ecosystem services value for sustainable land-use management in semi-arid region. J. Clean. Prod. 2018, 186, 662–672. [Google Scholar] [CrossRef]
  15. Connor, J.D.; Bryan, B.A.; Nolan, M.; Stock, F.; Gao, L.; Dunstall, S.; Graham, P.; Ernst, A.; Newth, D.; Grundy, M.; et al. Modelling Australian land use competition and ecosystem services with food price feedbacks at high spatial resolution. Environ. Model. Softw. 2015, 69, 141–154. [Google Scholar] [CrossRef]
  16. Song, W.; Deng, X.; Yuan, Y.; Wang, Z.; Li, Z. Impacts of land-use change on valued ecosystem service in rapidly urbanized North China Plain. Ecol. Model. 2015, 318, 245–253. [Google Scholar] [CrossRef]
  17. Wu, M.; Ren, X.; Che, Y.; Yang, K. A Coupled SD and CLUE-S Model for Exploring the Impact of Land Use Change on Ecosystem Service Value: A Case Study in Baoshan District, Shanghai, China. Environ. Manag. 2015, 56, 402–419. [Google Scholar] [CrossRef]
  18. Camacho-Valdez, V.; Ruiz-Luna, A.; Ghermandi, A.; Berlanga-Robles, C.A.; Nunes, P.A.L.D. Effects of Land Use Changes on the Ecosystem Service Values of Coastal Wetlands. Environ. Manag. 2014, 54, 852–864. [Google Scholar] [CrossRef]
  19. Sawut, M.; Eziz, M.; Tiyip, T. The effects of land-use change on ecosystem service value of desert oasis: A case study in Ugan-Kuqa River Delta Oasis, China. Can. J. Soil Sci. 2013, 93, 99–108. [Google Scholar] [CrossRef]
  20. Vallet, A.; Locatelli, B.; Levrel, H.; Wunder, S.; Seppelt, R.; Scholes, R.; Oszwald, J. Relationships Between Ecosystem Services: Comparing Methods for Assessing Tradeoffs and Synergies. Ecol. Econ. 2018, 150, 96–106. [Google Scholar] [CrossRef]
  21. Guo, Z.; Lin, Z.; Yiming, L.; Natasha, R.T. Increased Dependence of Humans on Ecosystem Services and Biodiversity. PLoS ONE 2010, 5, e13113. [Google Scholar] [CrossRef]
  22. Brown, G.; Schebella, M.F.; Weber, D. Using participatory GIS to measure physical activity and urban park benefits. Landsc. Urban Plan. 2014, 121, 34–44. [Google Scholar] [CrossRef]
  23. Haara, A.; Store, R.; Leskinen, P. Analyzing uncertainties and estimating priorities of landscape sensitivity based on expert opinions. Landsc. Urban Plan. 2017, 163, 56–66. [Google Scholar] [CrossRef]
  24. Tatum, K.; Porter, N.; Hale, J. A feeling for what’s best: Landscape aesthetics and notions of appropriate residential architecture in Dartmoor National Park, England. J. Rural. Stud. 2017, 56, 167–179. [Google Scholar] [CrossRef]
  25. Zheng, Y.; Lan, S.; Chen, W.Y.; Chen, X.; Xu, X.; Chen, Y.; Dong, J.W. Visual sensitivity versus ecological sensitivity: An application of GIS in urban forest park planning. Urban For. Urban Green. 2019, 41, 139–149. [Google Scholar] [CrossRef]
  26. Scarfò, F.; Mercurio, R.; Del Peso, C. Assessing visual impacts of forest operations on a landscape in the Serre Regional Park of southern Italy. Landsc. Ecol. Eng. 2011, 9, 1–10. [Google Scholar] [CrossRef]
  27. Wu, J.; Zhong, X.; Peng, J.; Qin, W. Function classification of ecological land in a small area based on ecosystem service bundles: A case study in Liangjiang New Area, China. Acta Ecol. Sin. 2015, 35, 323–331. [Google Scholar]
  28. Zhao, M.; Peng, J.; Liu, Y.; Li, T.; Wang, Y. Mapping Watershed-Level Ecosystem Service Bundles in the Pearl River Delta, China. Ecol. Econ. 2018, 152, 106–117. [Google Scholar] [CrossRef]
  29. Kareiva, P.; Watts, S.; McDonald, R.; Boucher, T. Domesticated nature: Shaping landscapes and ecosystems for human welfare. Science 2007, 316, 1866–1869. [Google Scholar] [CrossRef] [Green Version]
  30. Yang, Y.; Zheng, H.; Kong, L.; Huang, B.; Xu, W.; Ouyang, Z. Mapping ecosystem services bundles to detect high- and low-value ecosystem services areas for land use management. J. Clean. Prod. 2019, 225, 11–17. [Google Scholar] [CrossRef]
  31. Dou, H.; Li, X.; Li, S.; Dang, D.; Li, X.; Lyu, X.; Li, M.; Liu, S. Mapping ecosystem services bundles for analyzing spatial trade-offs in inner Mongolia, China. J. Clean. Prod. 2020, 256, 120444. [Google Scholar] [CrossRef]
  32. Raudsepp-Hearne, C.; Peterson, G.D.; Bennett, E.M. Ecosystem service bundles for analyzing tradeoffs in diverse landscapes. Proc. Natl. Acad. Sci. USA 2010, 107, 5242–5247. [Google Scholar] [CrossRef] [Green Version]
  33. Li, T.; Lü, Y.; Fu, B.; Hu, W.; Comber, A. Bundling ecosystem services for detecting their interactions driven by large-scale vegetation restoration: Enhanced services while depressed synergies. Ecol. Indic. 2019, 99, 332–342. [Google Scholar] [CrossRef] [Green Version]
  34. Spake, R.; Lasseur, R.; Crouzat, E.; Bullock, J.M.; Lavorel, S.; Parks, K.E.; Schaafsma, M.; Bennett, E.M.; Maes, J.; Mulligan, M.; et al. Unpacking ecosystem service bundles: Towards predictive mapping of synergies and trade-offs between ecosystem services. Glob. Environ. Chang. 2017, 47, 37–50. [Google Scholar] [CrossRef] [Green Version]
  35. Clements, H.S.; Cumming, G.S. Manager strategies and user demands: Determinants of cultural ecosystem service bundles on private protected areas. Ecosyst. Serv. 2017, 28, 228–237. [Google Scholar] [CrossRef]
  36. Shi, X.; Fang, R.; Wu, J.; Xu, H.; Sun, Y.; Yu, J. Sustainable development and utilization of groundwater resources considering land subsidence in Suzhou, China. Eng. Geol. 2012, 124, 77–89. [Google Scholar] [CrossRef]
  37. Xu, L.; Huang, Q.; Ding, D.; Mei, M.; Qin, H. Modelling urban expansion guided by land ecological suitability: A case study of Changzhou City, China. Habitat Int. 2018, 75, 12–24. [Google Scholar] [CrossRef]
  38. Store, R.; Karjalainen, E.; Haara, A.; Leskinen, P.; Nivala, V. Producing a sensitivity assessment method for visual forest landscapes. Landsc. Urban Plan. 2015, 144, 128–141. [Google Scholar] [CrossRef]
  39. Zhao, Q.; Li, J.; Liu, J.; Cuan, Y.; Zhang, C. Integrating supply and demand in cultural ecosystem services assessment: A case study of Cuihua Mountain (China). Environ. Sci. Pollut. Res. 2019, 26, 6065–6076. [Google Scholar] [CrossRef]
  40. Vigl, L.E.; DePellegrin, D.; Pereira, P.; De Groot, R.; Tappeiner, U. Mapping the ecosystem service delivery chain: Capacity, flow, and demand pertaining to aesthetic experiences in mountain landscapes. Sci. Total. Environ. 2017, 574, 422–436. [Google Scholar] [CrossRef]
  41. Xinfeng, C.; Yan, W. An analytic study on forest beauty-mosty on form beauty of forest plants. Sci. Silvae Sin. 2001, 37, 122–130. [Google Scholar]
  42. Wheatley, D. Cumulative viewshed analysis: A GIS-based method for investigating intervisibility, and its archaeological application. In Archaeology and Geographical Information Systems: A European Perspective; Lock, G., Stancic, Z., Eds.; Taylor & Francis: London, UK, 1995; pp. 171–185. [Google Scholar] [CrossRef]
  43. Zhao, Q.; Li, J.; Cuan, Y.; Zhou, Z. The Evolution Response of Ecosystem Cultural Services under Different Scenarios Based on System Dynamics. Remote. Sens. 2020, 12, 418. [Google Scholar] [CrossRef] [Green Version]
  44. Van Riper, C.J.; Kyle, G.T.; Sutton, S.G.; Barnes, M.; Sherrouse, B.C. Mapping outdoor recreationists’ perceived social values for ecosystem services at Hinchinbrook Island National Park, Australia. Appl. Geogr. 2012, 35, 164–173. [Google Scholar] [CrossRef]
  45. A Millward, A.; E Mersey, J. Adapting the RUSLE to model soil erosion potential in a mountainous tropical watershed. Catena 1999, 38, 109–129. [Google Scholar] [CrossRef]
  46. Available online: https://elksslff327ce5f1ffe12c8f91f10ab09954d2elksslscience.casb.nju.edu.cn:4443/ (accessed on 5 December 2020).
  47. Tenerelli, P.; Demšar, U.; Luque, S. Crowdsourcing indicators for cultural ecosystem services: A geographically weighted approach for mountain landscapes. Ecol. Indic. 2016, 64, 237–248. [Google Scholar] [CrossRef] [Green Version]
  48. Wolff, S.; Schulp, C.; Verburg, P.H. Mapping ecosystem services demand: A review of current research and future perspectives. Ecol. Indic. 2015, 55, 159–171. [Google Scholar] [CrossRef]
  49. Yoshimura, N.; Hiura, T. Demand and supply of cultural ecosystem services: Use of geotagged photos to map the aesthetic value of landscapes in Hokkaido. Ecosyst. Serv. 2017, 24, 68–78. [Google Scholar] [CrossRef]
  50. Wang, R.; Zhao, J.; Liu, Z. Consensus in visual preferences: The effects of aesthetic quality and landscape types. Urban For. Urban Green. 2016, 20, 210–217. [Google Scholar] [CrossRef]
  51. Carvalho-Ribeiro, S.M.; Lovett, A. Is an attractive forest also considered well managed? Public preferences for forest cover and stand structure across a rural/urban gradient in northern Portugal. For. Policy Econ. 2011, 13, 46–54. [Google Scholar] [CrossRef]
  52. Hamann, M.; Biggs, R.; Reyers, B. Mapping social–ecological systems: Identifying ‘green-loop’ and ‘red-loop’ dynamics based on characteristic bundles of ecosystem service use. Glob. Environ. Chang. 2015, 34, 218–226. [Google Scholar] [CrossRef]
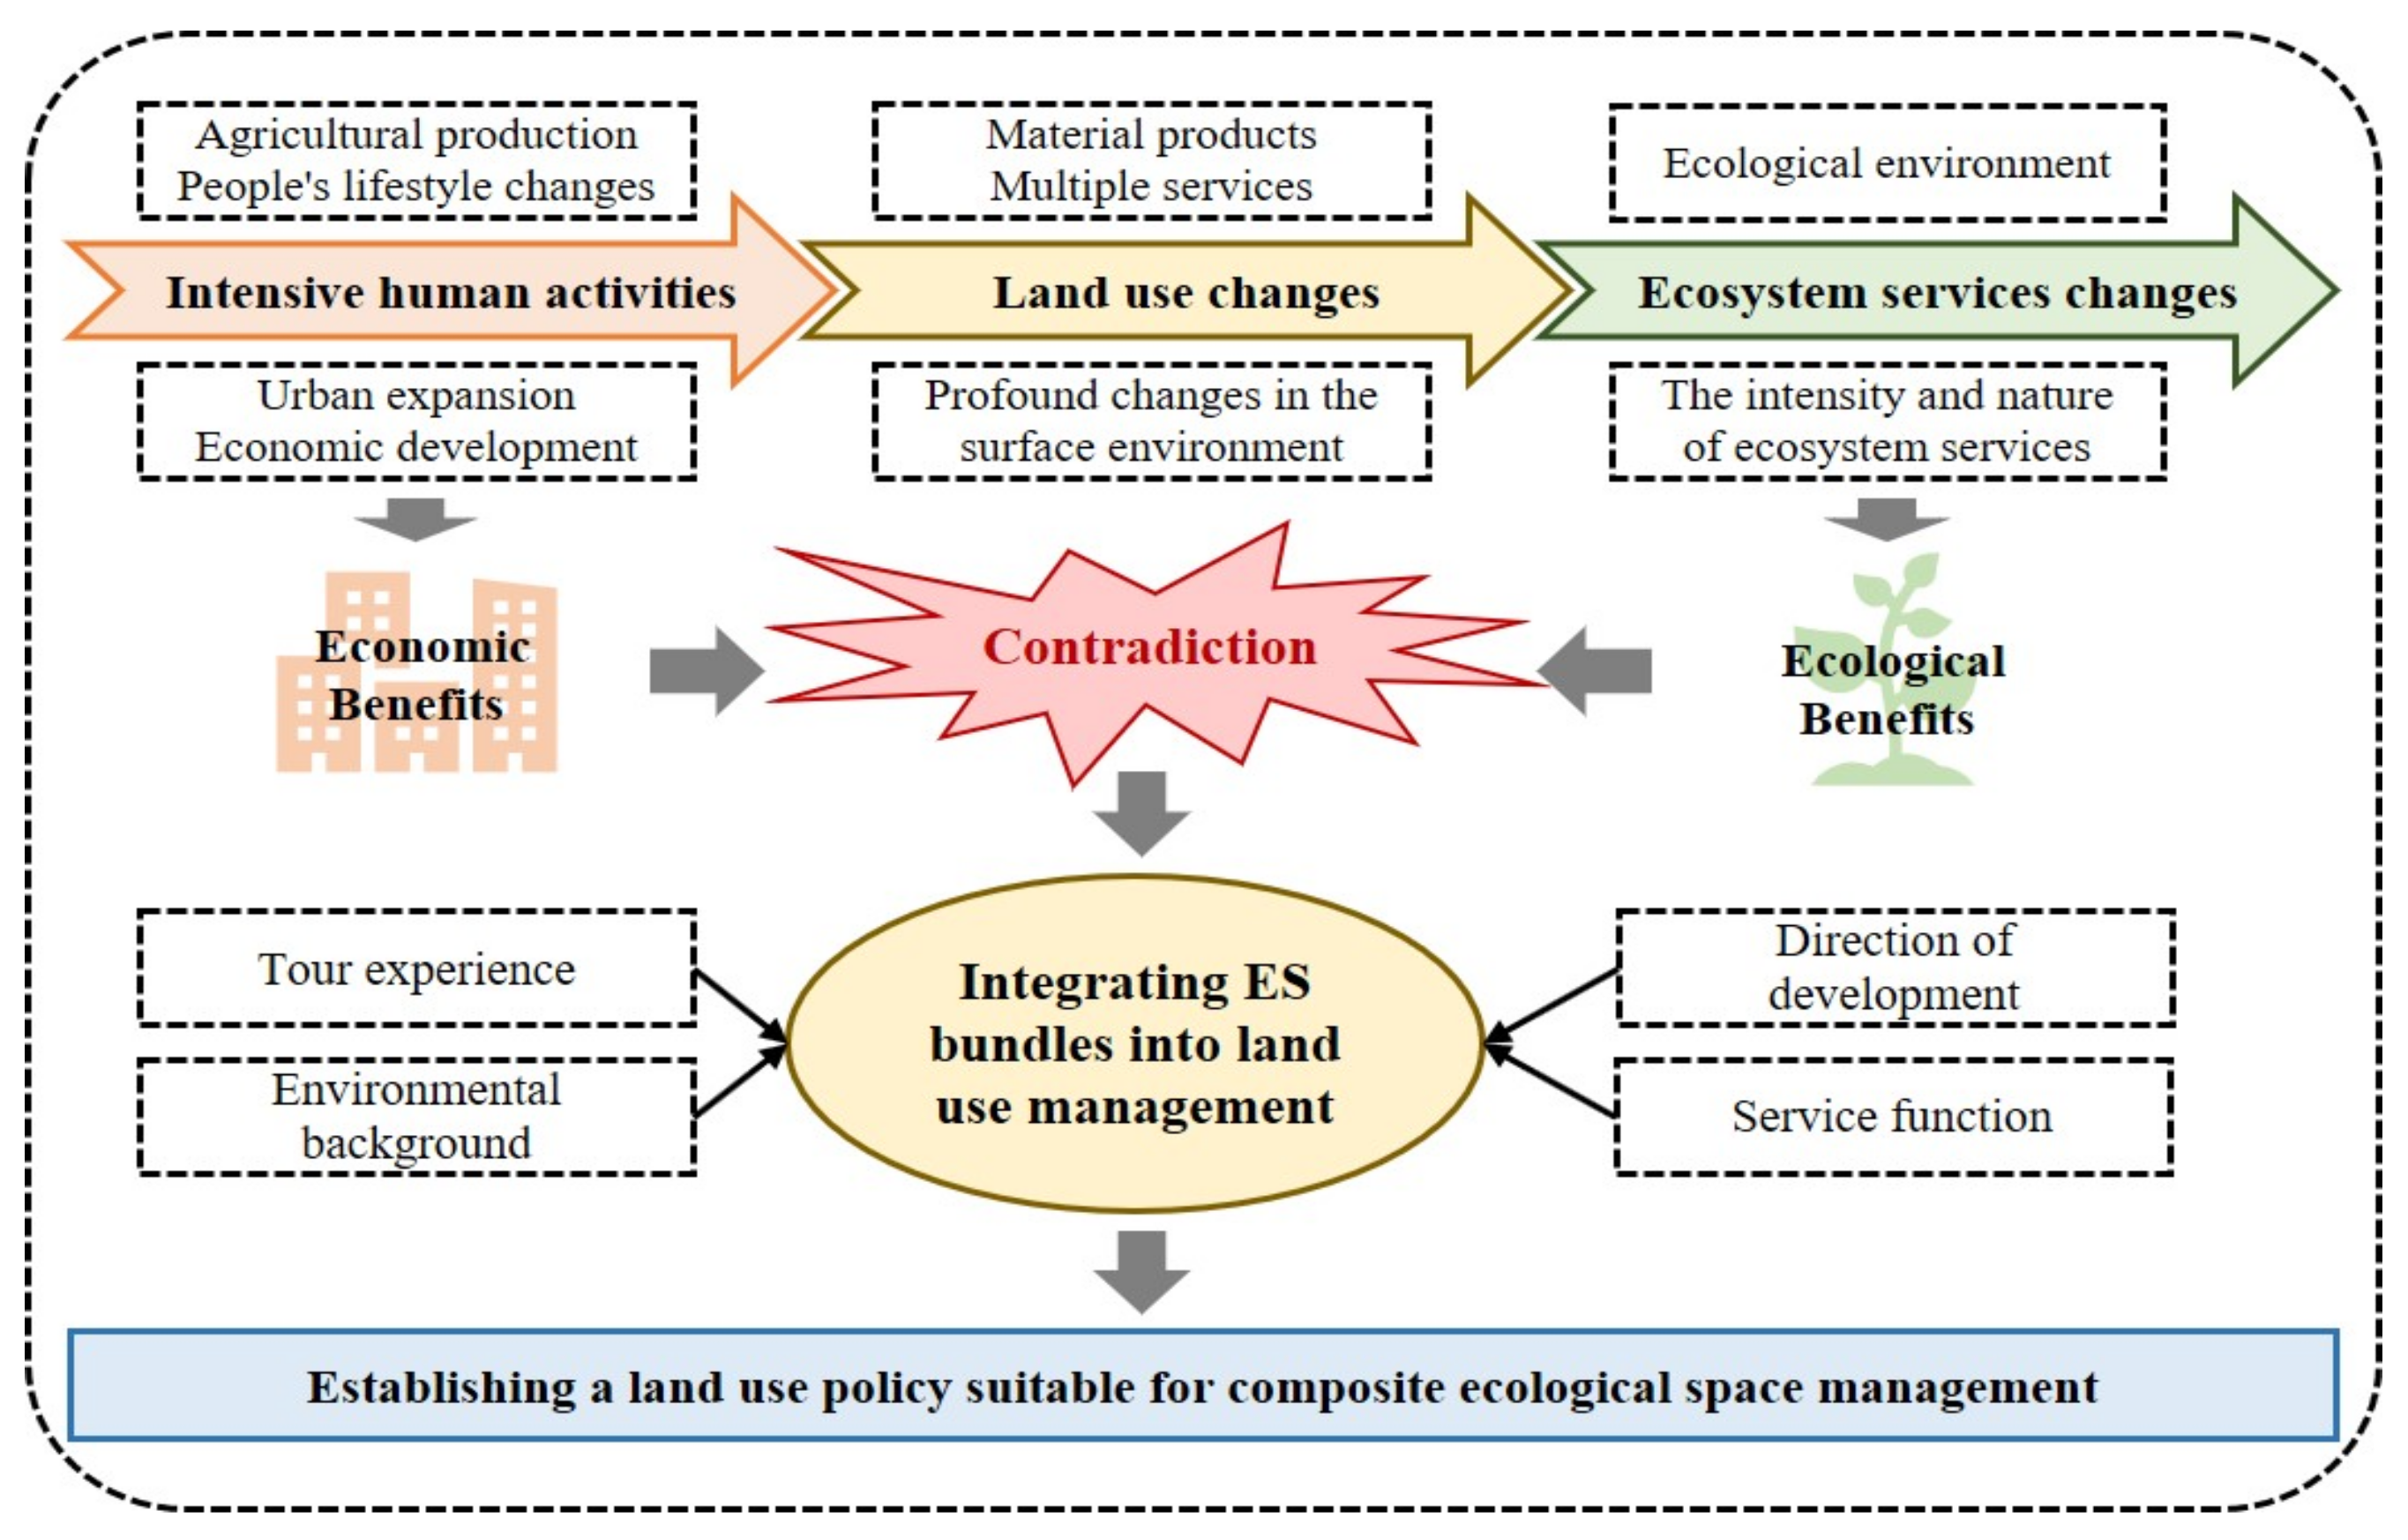
Figure 1. Research framework.
Remotesensing 13 00242 g001
Figure 2. Location of study area.
Remotesensing 13 00242 g002
Figure 3. SolVES model flow chart.
Remotesensing 13 00242 g003
Figure 4. Tour experience (TE) in Xiaohuangshan Mountain (XHSM). (a) Slope-based sensitivity. (b) Distance-based sensitivity. (c) Visibility-based sensitivity. (d) Tour experience
Remotesensing 13 00242 g004
Figure 5. Spatial distribution of ES in XHSM.
Remotesensing 13 00242 g005
Figure 6. ES bundles identified by K-means clustering in XHSM. (a) The deviation from average of each ES is used to better represent the ES of each bundle. (b) SP: Soil protection bundle; FP: Forest park bundle; SE: Sightseeing entertainment bundle; EN: Ecological conservation bundle.
Remotesensing 13 00242 g006
Figure 7. Statistical graph of the relationship between land use types and ES bundles.
Remotesensing 13 00242 g007
Table 1. Respondent’s information.
CharacteristicCategoryTotalCharacteristicCategoryTotal
Age<18 years
18–30 years
31–40 years
41–50 years
51–60years
>60 years
14
43
62
56
31
36
SexMale103
Female139
EducationJunior high school137
Senior high school68
University37
LocalYes179
No63
Table 2. Data sources.
DataSourceSpatial Resolution
Digital elevation model (DEM)RIVERMAP.CN Maps Downloader (http://www.rivermap.cn/)5 m
SlopeSpatial analysis of DEM5 m
HillshadeSpatial analysis of DEM5 m
Distance from roadSpatial analysis of road5 m
Distance from waterSpatial analysis of water bodies5 m
Land use and land cover (LULC)Changzhou City Natural Resources and Planning Bureau5 m
GF-1 dataChina Center for Resources Satellite Data and Application10 m
Social survey dataSurvey questionnaires/
Meteorological dataNational meteorological data centerVector
Soil mapChangzhou City Natural Resources and Planning BureauVector
Road, water, and boundary dataChangzhou City Natural Resources and Planning BureauVector
Table 3. Descriptions of ecosystem services (ES) types.
ES Types ES Description
RecreationThis area provides a place for outdoor leisure activities that I like.
BiodiversityThis area provides abundant animal and plant resources.
HistoricalThe area has recorded important historical events or historical traditions.
AestheticThis area provides beautiful scenery, pleasant sounds, etc.
Soil retentionSoil erosion will reduce land productivity and cause natural disasters such as landslides.
Surface water regulationSurface runoff can regulate water quality and purify pollution.
Soil nutritionThis study indicates the cost of protective development. The higher the soil nutrition, the lower the cost of protective development.
Table 4. Statistical results for suitable seasons.
Multiple ChoiceSpringSummerAutumnWinter
Single choice8423301
Double choice5127444
Three choice2220222
Full choice19191919
Total1768911526
Table 5. Statistical summary of TE.
Tour ExperienceValueArea (ha)Percentage (%)
Very high0.52–0.7436.772.60
High0.45–0.52421.6729.80
Moderate0.39–0.45569.1640.22
Low0.30–0.39387.5827.39
Table 6. Contribution percentage of each ES to classification in XHSM.
ES BundleArea (%)Recreation
(%)
Biodiversity
(%)
Historical
(%)
Aesthetic
(%)
Soil Retention
(%)
Surface Water Regulation
(%)
Soil Nutrition
(%)
Soil protection (SP)2423151318101210
Forest park (FP)10271514198138
Sightseeing entertainment (SE)2226161221898
Ecological conservation (EN)4425151417101010
Publisher’s Note: MDPI stays neutral with regard to jurisdictional claims in published maps and institutional affiliations.