Article

Corn Nitrogen Status Diagnosis with an Innovative Multi-Parameter Crop Circle Phenom Sensing System

Precision Agriculture Center, Department of Soil, Water and Climate, University of Minnesota, Saint Paul, MN 55108, USA
*
Author to whom correspondence should be addressed.
Remote Sens. 2021, 13(3), 401; https://doi.org/10.3390/rs13030401
Submission received: 31 December 2020 / Accepted: 19 January 2021 / Published: 24 January 2021
(This article belongs to the Special Issue Remote Sensing for Precision Nitrogen Management)

Abstract

:
Accurate and non-destructive in-season crop nitrogen (N) status diagnosis is important for the success of precision N management (PNM). Several active canopy sensors (ACS) with two or three spectral wavebands have been used for this purpose. The Crop Circle Phenom sensor is a new integrated multi-parameter proximal ACS system for in-field plant phenomics with the capability to measure reflectance, structural, and climatic attributes. The objective of this study was to evaluate this multi-parameter Crop Circle Phenom sensing system for in-season diagnosis of corn (Zea mays L.) N status across different soil drainage and tillage systems under variable N supply conditions. The four plant metrics used to approximate in-season N status consist of aboveground biomass (AGB), plant N concentration (PNC), plant N uptake (PNU), and N nutrition index (NNI). A field experiment was conducted in Wells, Minnesota during the 2018 and the 2019 growing seasons with a split-split plot design replicated four times with soil drainage (drained and undrained) as main block, tillage (conventional, no-till, and strip-till) as split plot, and pre-plant N (PPN) rate (0 to 225 in 45 kg ha−1 increment) as the split-split plot. Crop Circle Phenom measurements alongside destructive whole plant samples were collected at V8 +/−1 growth stage. Proximal sensor metrics were used to construct regression models to estimate N status indicators using simple regression (SR) and eXtreme Gradient Boosting (XGB) models. The sensor derived indices tested included normalized difference vegetation index (NDVI), normalized difference red edge (NDRE), estimated canopy chlorophyll content (eCCC), estimated leaf area index (eLAI), ratio vegetation index (RVI), canopy chlorophyll content index (CCCI), fractional photosynthetically active radiation (fPAR), and canopy and air temperature difference (ΔTemp). Management practices such as drainage, tillage, and PPN rate were also included to determine the potential improvement in corn N status diagnosis. Three of the four replicated drained and undrained blocks were randomly selected as training data, and the remaining drained and undrained blocks were used as testing data. The results indicated that SR modeling using NDVI would be sufficient for estimating AGB compared to more complex machine learning methods. Conversely, PNC, PNU, and NNI all benefitted from XGB modeling based on multiple inputs. Among different approaches of XGB modeling, combining management information and Crop Circle Phenom measurements together increased model performance for predicting each of the four plant N metrics compared with solely using sensing data. The PPN rate was the most important management metric for all models compared to drainage and tillage information. Combining Crop Circle Phenom sensor parameters and management information is a promising strategy for in-season diagnosis of corn N status. More studies are needed to further evaluate this new integrated sensing system under diverse on-farm conditions and to test other machine learning models.

1. Introduction

Agricultural nutrient management has been historically guided using grower knowledge of cultivated land and soil supply of essential nutrients such as nitrogen (N), phosphorous, and potassium. Over the past forty years, the development of precision agriculture has offered an alternative method of guiding nutrient management leveraged on using proximal and remote sensing, data analysis, and smart machinery to optimize fertilizer application timing and rate to match nutrient supply with crop demand [1]. Within commercial crop production, N is frequently the primary limiting nutrient for plant growth [2]. Limiting conditions are often attributable to N mobility within the soil horizon and susceptibility for losses through leaching, denitrification, and volatilization processes [3,4]. Improving N management is critical to protection of water resources and reduction of atmospheric greenhouse gas levels [5]. Centered on matching N supply with crop N demand in both space and time, precision N management (PNM) has the potential to increase N use efficiency by reducing N losses while maintaining crop yields [6,7].
For corn (Zea mays L.) production, N fertilizer timing and rate are critical aspects to mitigating N loss [8]. Physiologically, corn plant N concentration (PNC) is highest earlier in its vegetative growth and decreases until plant senescence; however, plant N demand is greatest midway through the growing season when the plant is rapidly increasing in biomass. Historically, N fertilizer is applied in full around the time of planting with the expectation that sufficient N will persist throughout the season to facilitate optimal plant growth. This practice is viable for growing seasons with low early season N loss and ideal weather conditions. However, it is not conductive for field seasons with high N loss potential from heavy or frequent rain events. For this reason, optimal in-season N management must develop tools which determine plant N status accurately and non-destructively [9]. Corn plants predominantly exhibit N deficiency symptoms of stunting due to decreased cell division and leaf chlorosis of older leaves [10]. Plénet and Lemaire [11] established an empirical allometric critical N dilution curve, which calculates the minimum PNC needed to optimally grow as “critical” N concentration (Nc) depending on aboveground biomass (AGB). Corn N status can be determined by calculating N nutrition index (NNI), which is defined as the ratio of actual PNC to Nc. Since the development of corn NNI, subsequent studies have evaluated its efficacy and utilized it as a tool to improve corn N status diagnosis and to guide side-dress N application [12,13,14,15].
To apply NNI in commercial agriculture, there are several methods to determine corn AGB and PNC. Traditional destructive sampling and analysis is not only time consuming and expensive but also cannot adequately capture spatial or temporal variability because it is a snapshot of crop health at a specific location and day of year [16,17]. As a result, proximal and remote sensing technologies have been developed for real-time non-destructive N status estimation. Canopy sensors are more efficient than destructive sampling because they can be quickly collected and return instantaneous estimations of plant health. Additionally, active instruments are superior and more repeatable compared to passive sensors because their measurements are independent of environmental light conditions.
Three of the most frequently utilized active canopy sensors (ACS) for corn N management are the two-band GreenSeeker (Trimble Inc., Sunnyvale, CA, USA), the three-band Crop Circle ACS-430 (Holland Scientific, Lincoln, NE, USA), and the three-band RapidScan CS-45 (Holland Scientific, Lincoln, NE, USA). Researchers have developed empirical techniques to estimate in-season N status through correlating multispectral band reflectance measurements or calculated vegetative indices (VIs) with crop N status indicators. Xia et al. [13] used a GreenSeeker sensor to predict corn NNI and found the sensor derived VIs could moderately predict NNI directly (R2 between 0.56–0.65) at V7–V10 growth stage when used with N-rich plots as reference to calculate response index. However, the GreenSeeker sensor did not perform well when solely using VIs to predict NNI (R2 between 0.33–0.55) without using N rich plots. Paiao et al. [18] evaluated GreenSeeker and RapidSCAN sensors for corn plant N status estimation from V4 to R1 in Minnesota. The study found that optimum N rates did not correlate well with proximal sensor measurements prior to V12 stage, which could limit their values for determining side-dress N needs around V8–V9 stages.
The Crop Circle Phenom is a new integrated multi-parameter ACS, which measures spectral reflectance of red, red-edge, and near-infrared wavelengths to calculate normalized difference vegetation index (NDVI) [19] and the normalized difference red edge (NDRE) [20] as well as to provide several other variables, including estimated canopy chlorophyll content (eCCC), estimated leaf area index (eLAI), atmospheric pressure, relative humidity, reflected and incoming photosynthetically active radiation (PAR), and canopy and air temperatures. These additional metrics can be used to calculate physiological metrics such as fractional PAR (fPAR) and canopy-air temperature difference (ΔTemp). Previous research indicated that PAR [21] and canopy temperature [22] could be used to estimate biomass and crop N stress. Therefore, through measuring spectral, estimated structural characteristics, and climatic variables, the Crop Circle Phenom sensor system is hypothesized to be able to improve corn N status estimation and diagnosis compared to only using vegetation indices such as NDVI and NDRE. To date, no study has been reported for the evaluation of this new integrated sensor system for in-season corn N status estimation. Therefore, the objective of this research was to evaluate the potential of the Crop Circle Phenom sensor system for in-season diagnosis of corn N status across different drainage and tillage systems under variable N supply conditions.

2. Materials and Methods

2.1. Study Site

The study was conducted in southcentral Minnesota near Wells, MN (43°51′15.7″ N 93°43′47.2″ W) in the 2018 and the 2019 growing seasons. The predominant soil types at the site are Marna silty clay loam (fine, smectitic, mesic Vertic Endoaquolls) and Nicollet silty-clay loam (fine-loamy, mixed, superactive, mesic Aquic Hapludolls). The experiment was conducted in a randomized complete-block design with a split-splitplot arrangement and four replications in a corn-soybean (Glycine max L.) rotation where both crops are present every year. The main plot was set up in 2011 with subsurface tile drainage where half of the blocks are fully closed (undrained) and the other half are fully open (drained). For more details, see Fernández et al. [23]. The sub-plot includes three tillage treatments established in 2017: no-tillage (NT), strip-tillage (ST), and conventional-tillage (CT). The sub-sub-plot is six pre-plant N (PPN) rate treatments (0, 45, 90, 135, 180, 225 kg-N ha−1) initiated in 2017 (Figure 1). The trials are part of a larger experiment with N timing also being evaluated at various early growth stages, but only the PPN treatments were used for this project. Each treatment plot was composed of four planted rows approximately nine meters in length with 76 cm row spacing and approximately 83,000 plants ha−1 density. Nitrogen was applied as urea+Agrotain (46-0-0) (urea with N-(n-butyl) thiophosphoric triamide (NBPT)) (Koch Fertilizer LLC, Wichita, KS, USA) in mid-May within a week of planting the crop. The Pioneer hybrid P9929AMXT was used in this study.

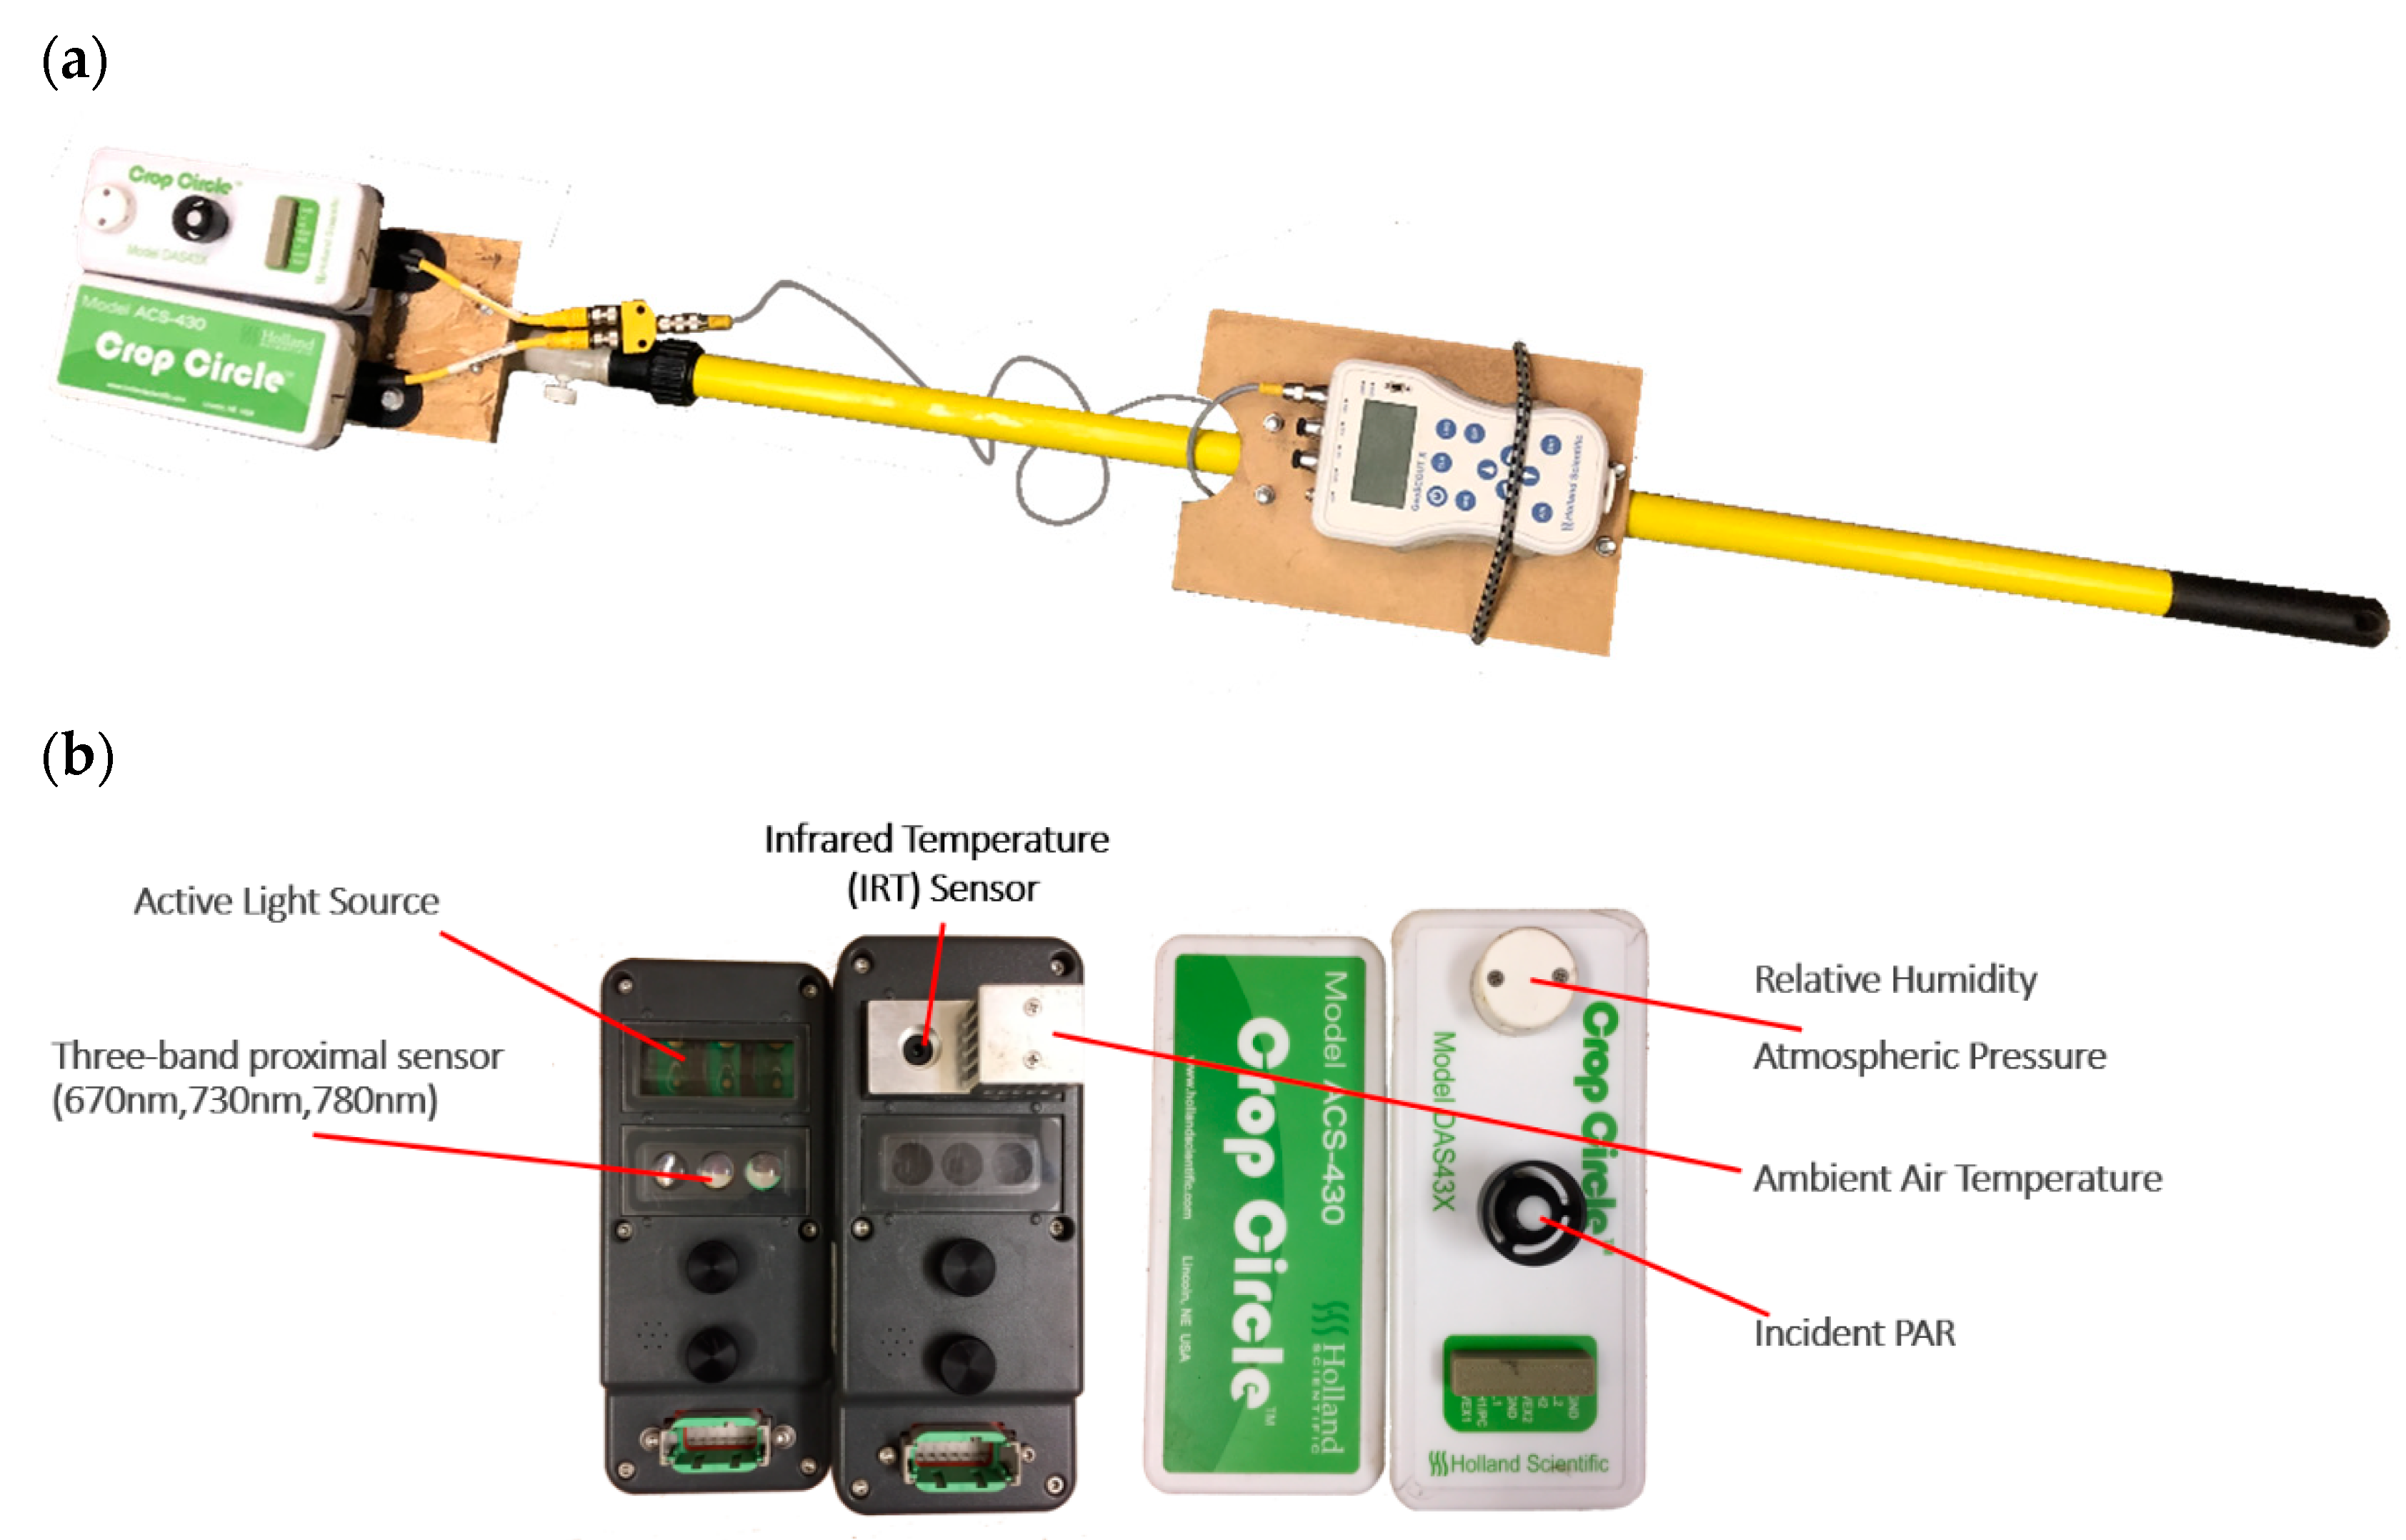
2.2. Proximal Sensor Collection

Proximal sensing data were collected around V8 growth stages in the 2018 and the 2019 growing seasons using a Crop Circle Phenom canopy sensor (Holland Scientific, Lincoln, NE, USA). This sensor fuses the instrument capabilities of a Crop Circle ACS-430 and a Crop Circle DAS43X sensor using a GeoScout X controller, which simultaneously geotags and timestamps each unique measurement (Figure 2). Analogous to prior studies which have utilized the Crop Circle ACS-430, the Phenom sensor collects reflectance data in red (670 nm), red-edge (RE, 730 nm), and near-infrared (NIR, 780 nm) wavelengths as well as automatically calculated NDVI and NDRE. Furthermore, the Crop Circle Phenom sensor system also calculates eLAI and eCCC using empirical relationships with spectral bands. In addition to spectral data, this sensor system collects environmental information from a DAS43X sensor that measures atmospheric pressure, relative humidity, incoming and reflected PAR, canopy temperature, and air temperature. Supplemental vegetation indices were selected based on their previously published ability to approximate plant N metrics, including canopy chlorophyll content index (CCCI) and ratio vegetation index (RVI). Canopy and air temperature difference ( Δ Temp) and fPAR were also calculated (Table 1).
The Crop Circle Phenom system was fitted to a custom mount and handle to enable the user to hold the sensor level at nadir approximately 30 cm above the canopy and approximately a meter ahead of the operator to avoid casting a shadow on the area of interest. Two measurements were collected in each plot from the center two treatment rows, and the readings were averaged to represent each plot. The sensor metadata provide estimated distance between sensor and canopy derived from the spectral band observations and the inverse square law. The estimated distance to canopy occasionally varied within plot, and rapidly changing sensor readings (>50 cm) were removed.

2.3. Plant Sampling and Analysis

Following sensor measurements, six whole plant samples were collected at V8 growth stage, oven-dried at 60 °C to a constant weight, weighed for AGB determination, ground, and analyzed for total N by combustion [29]. Stand count measurements were collected from each plot around V8 growth stage from 12.2 m of crop rows from the two center rows. Total dried AGB was calculated using plot stand counts and average dried biomass weight per plant for each plot. Furthermore, PNU (kg ha−1) was calculated using AGB and PNC. Plant N status was evaluated by calculating Nc and NNI using the critical N dilution curve developed by Plénet and Lemaire [11] (Equations (1) and (2)). The allometric function estimates Nc at different dried AGB weight (W). The authors observed the relationship was best utilized between 1 Mg ha−1 and 22 Mg ha−1 but recommend a constant Nc of 3.4% be applied under 1 Mg ha−1 dried AGB.
N c = 3.4     W 0.37
N N I =   P N C N c

2.4. Data Analysis

The dataset consisted of 275 unique plot observations representing the 2018 and the 2019 growing seasons across drainage, tillage, and PPN treatment variables. A handful of plots (n = 13) were accidentally not collected or were removed due to irregular sensor readings, which reduced the measurement count from the overall 288 unique plots. Training and testing datasets were produced by randomly selecting three of the four drained and undrained experimental blocks as a training dataset (n = 208) and using the remaining block data as a testing dataset (n = 67). This methodology was selected to maintain an approximately equal distribution of drainage, tillage, and PPN treatments in both the training and the testing datasets. Using Crop Circle Phenom derived spectral and climatic parameters and destructively sampled corn N indicators, simple regression (SR) and eXtreme Gradient Boosting (XGB) machine learning-based approaches were investigated to predict AGB, PNC, PNU, and NNI. The training dataset was used to fit each of the SR and the XGR regression models, while the testing dataset was solely utilized to validate the final performance of each of the models.
Each of the selected Crop Circle Phenom measured parameters was individually evaluated for predicting AGB, PNC, PNU, and NNI using the SciPy curve_fit Python function [30]. In addition to fitting linear models, exponential, power, and quadratic models were also evaluated and compared to create best fit for each sensor metric. The model with the lowest training mean absolute error (MAE) and root mean square error (RMSE) calculated using scikit-learn package [31] was selected as the optimal model.
To evaluate the benefit of fusing multiple sensor parameters alongside management data, XGB regression models were constructed and compared to SR. Drainage and tillage treatments were hypothesized to influence in-season N status, yet neither could be easily included in SR modeling. The XGB machine learning package was examined to allow categorical variables to be evaluated in conjunction with the quantitative proximal sensor data. Three distinct levels of input variables were investigated for XGB modeling, which consisted of (1) default vegetation indices of NDVI and NDRE automatically calculated by the Crop Circle Phenom sensor system, (2) NDVI and NDRE plus additional Crop Circle Phenom collected variables, and (3) Crop Circle Phenom sensor data plus management information (drainage, tillage, and PPN).
The XGB regression model was adopted as a machine learning strategy to improve plant N status prediction due to its ease of use and ability to be tuned towards small datasets to avoid overfitting through altering the hyperparameter inputs [32]. This valuable characteristic is primarily due to its ability to be tuned for learning rate and size of decision trees.
Machine learning models to predict N status variables were constructed using the Python package XGBoost Regressor [32]. Tuning the machine learning hyperparameters was performed using the XGBoost built-in cross-validation function, which was only utilized within the training dataset. To perform cross-validation for each plant growth parameter, a Python function was constructed, which utilized three k-folds within the training dataset to test various max depth, minimum child weights, and learning rates. Hyperparameter tuning is critical to machine learning model performance because they together govern the performance of the model through minimizing overall loss versus risk of model overfitting [33]. Since a tree based XGBoost model is used, max depth and minimum child weight decide depth of tree and number of samples per node, respectively, whereas learning rate controls how successive trees weigh input features (Figure 3). To avoid overfitting training data during tuning, an early stopping parameter was used to halt subsequent boosting rounds after five iterations where MAE did not improve. The parameter set that returned the lowest MAE was used as the starting parameters for the XGB regression model.
The model performance was evaluated using mean absolute error (MAE) and root mean squared error (RMSE) (Equations (3) and (4)) alongside coefficient of determination (R2). Both error metrics calculate the average difference between predicted and observed variables where n is the number of measurements, y i is the i-th observed measurement, and y ^ i is the corresponding predicted measurement.
M A E   =   1 n i = 1 n | y i y ^ i |
R M S E =   1 n i = 1 n ( y i y ^ i ) 2

2.5. Corn N Status Diagnosis

The NNI values were used to diagnose corn N status using the following threshold values: NNI < 0.95, 0.95 ≤ NNI ≤ 1.05, NNI > 1.05 for deficient, optimum, and surplus N status, respectively [13,34]. Using measured and predicted NNI values by SR and XGB models from the test dataset, the accuracy of corn N status diagnosis was evaluated using areal agreement and kappa statistics [13,35]. The areal agreement is the percentage of predicted and measured diagnostic results sharing a common classification, while kappa statistics is a more robust indicator of the agreement of the two diagnostic results that is adjusted for random chance classification [36]. The kappa statistics values < 0.4, 0.4–0.6, and > 0.6 indicate weak, moderate, and strong agreement [37].

3. Results

3.1. Corn N Status Indicator Variability

Across the experiment treatments and two site years, PNU demonstrated the greatest amount of variability (coefficient of variation (CV) around 40%) with a range of 3.95 to 101.68 kg ha−1 (Table 2). NNI fluctuated comparably less between 0.34 and 1.40 with a CV around 30%. The PNC and the AGB statistics show similar variability, with CV of 26–27%. Random selection of three of the four drainage replicates into training data and one drainage replicate block into testing data resulted in comparable statistics to construct and validate N status models. The large variabilities in N status indicators (CV = 25.96–40.11%) indicated the suitability of the datasets for evaluating the Crop Circle Phenom sensor system.

3.2. Crop Circle Phenom Sensor Inter-Parameter Correlation

Several of the Crop Circle Phenom sensor parameter combinations were strongly related (Figure 4). One such example of a strongly correlated parameter paring was eCCC and eLAI with a nearly linear relationship (R2 = 1) (Figure 4). Overall correlations between spectral sensor metrics were moderate to strong (R2 = 0.70–0.98), whereas environmental temperature and PAR metrics were less correlated (R2 = 0.12–0.46).

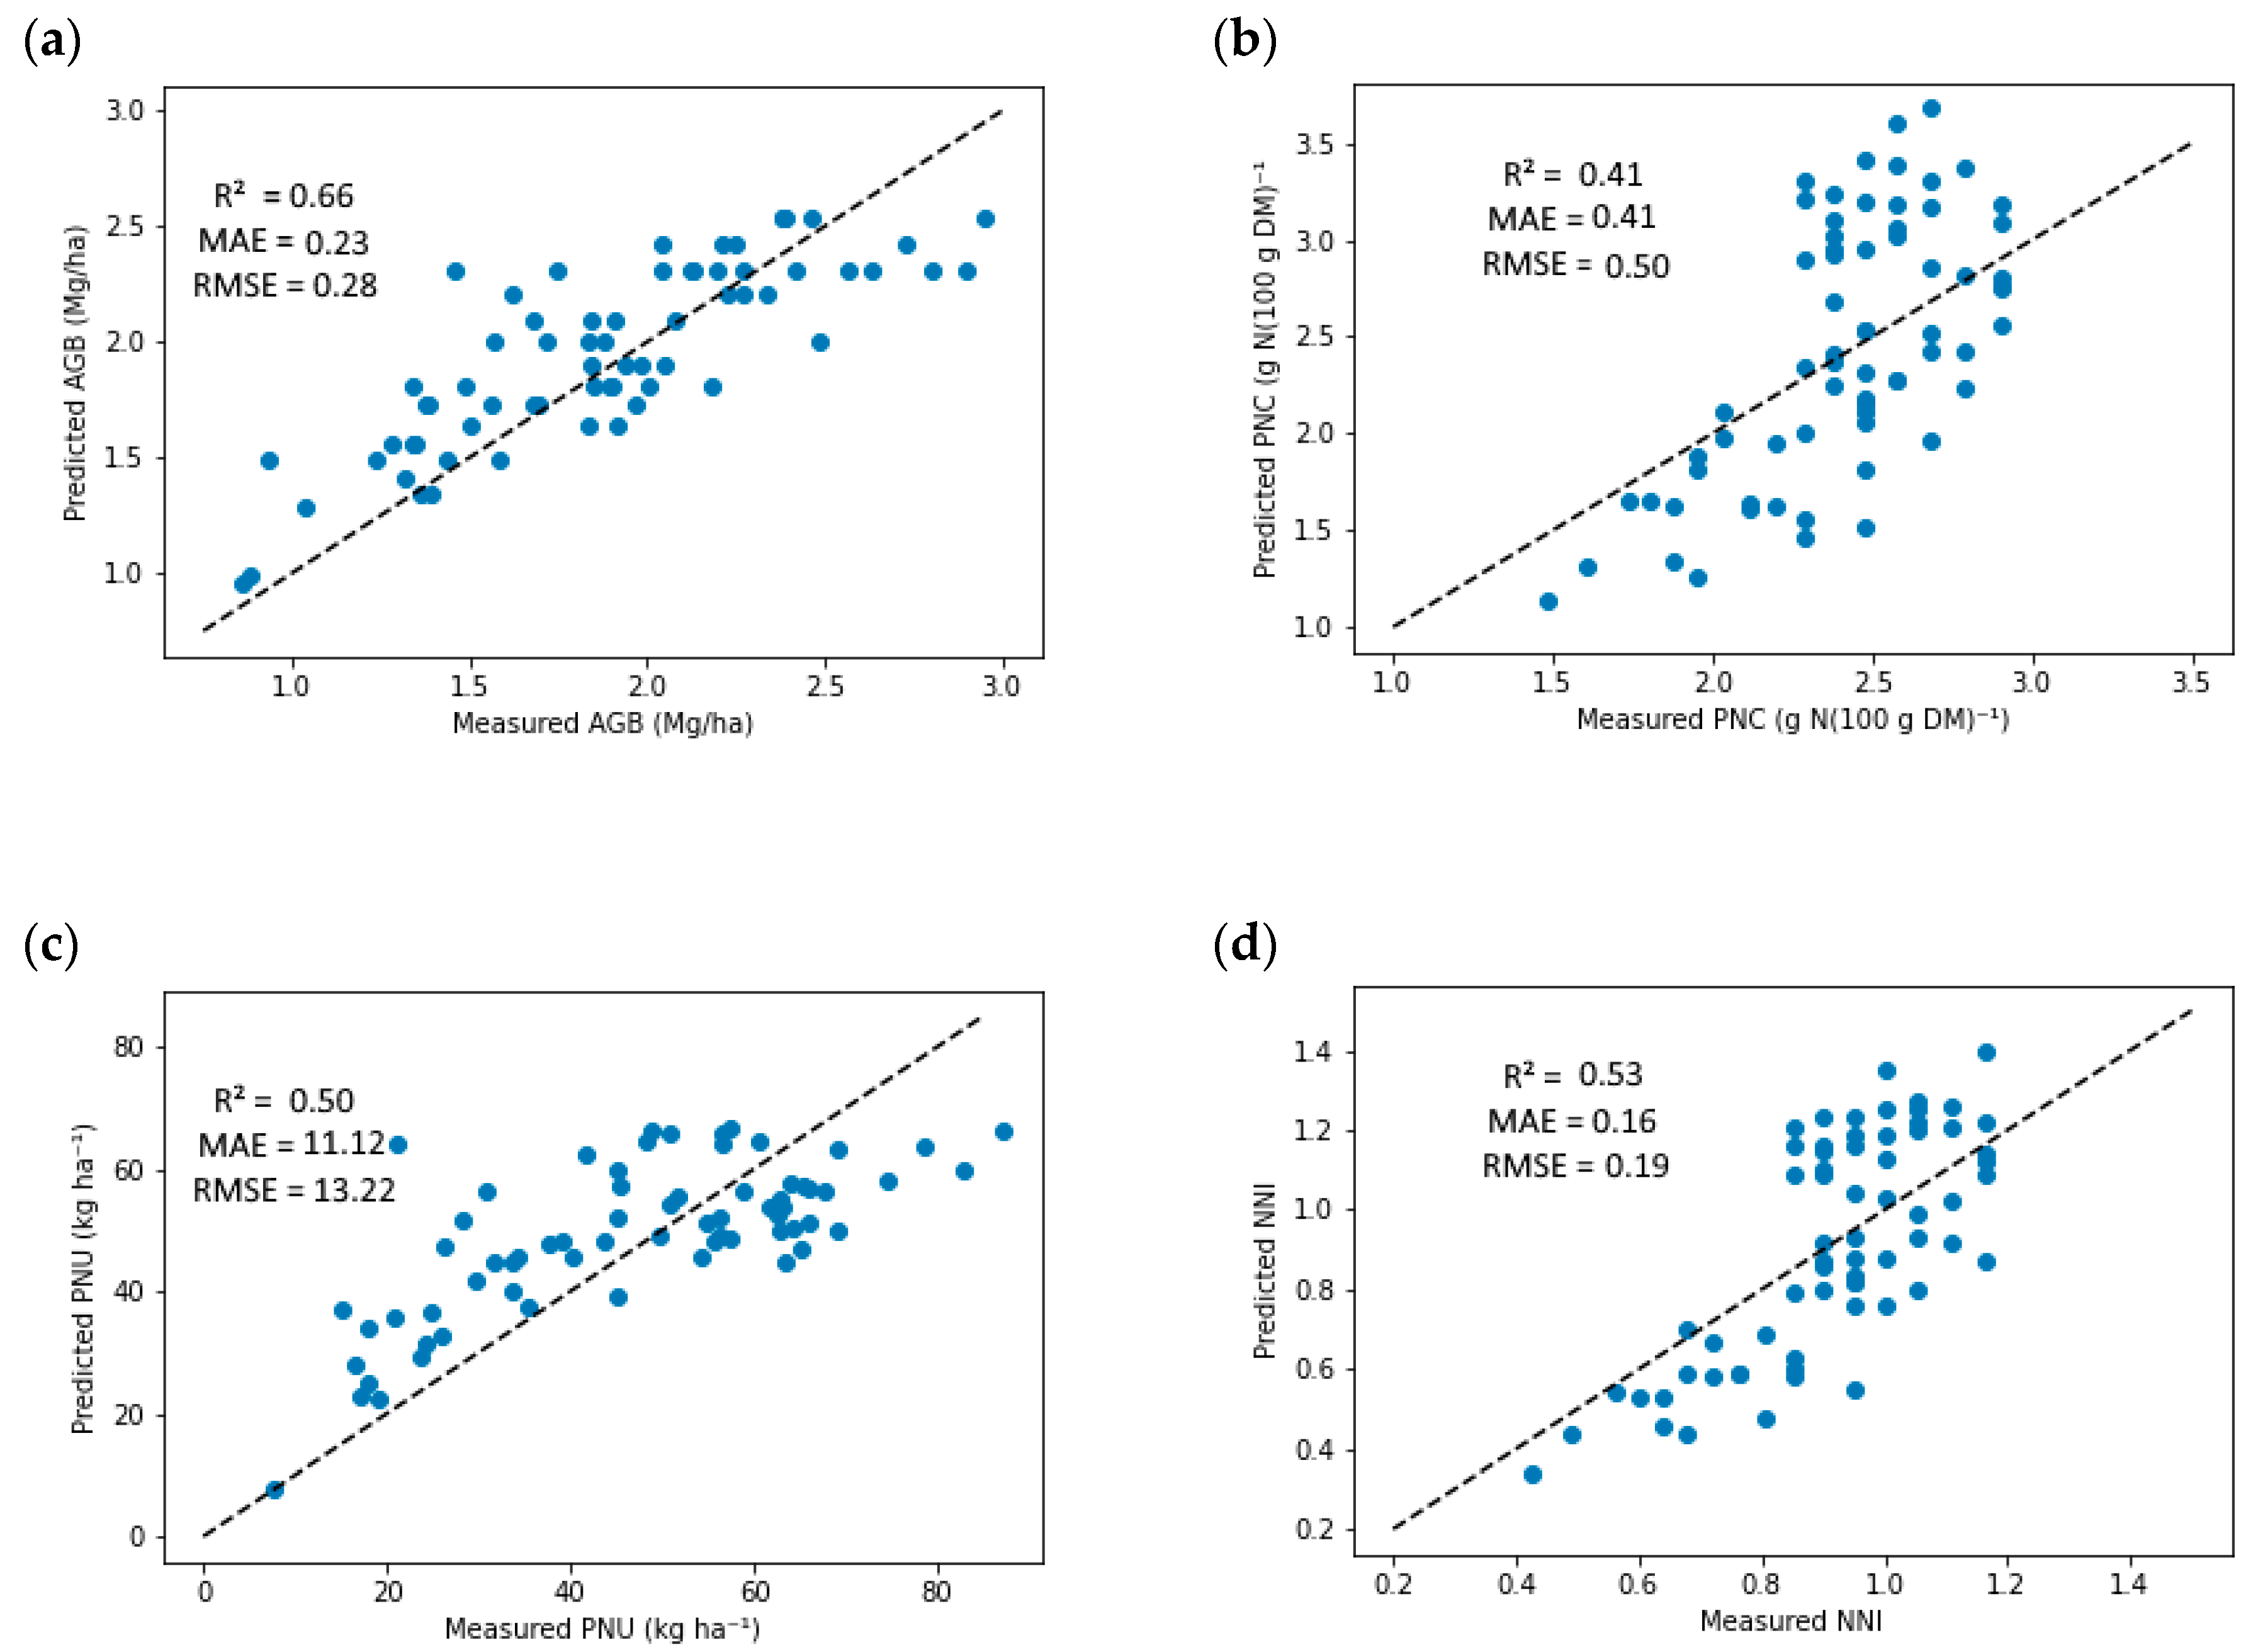
3.3. Simple Regression Analysis

Simple regression models showed significant variation in prediction ability between the Crop Circle Phenom parameters and the four plant N status indicators (Table 3). Across the sensor parameters, NDVI (MAE = 0.23 Mg ha−1), NDRE (MAE = 0.24 Mg ha−1), and RVI (MAE = 0.24 Mg ha−1) performed the best for predicting AGB. Conversely, CCCI outperformed the other sensor metrics for predicting PNC (MAE = 0.41 g N 100g DM−1) and NNI (MAE = 0.16 g N 100g DM−1). The eCCC parameter was the best performing sensor parameter for predicting PNU (MAE = 11.12 kg ha−1). PNU was overall the most difficult N status indicator for the sensor parameters to predict (MAE range 11.21 to 14.24 kg ha−1). Compared to spectral parameters, fPAR and ΔTemp both performed poorly for all N status indicators. In several instances, a suitable model could not be fit for all sensor metrics, and, therefore, SR results were not reported.
The best performing metric for each testing SR model was plotted in Figure 5. Training models suggested that AGB, PNU, and NNI were best fit using a non-linear model because their MAE and RMSE decreased compared to linear models.

3.4. Machine Learning Modeling Using eXtreme Gradient Boosted (XGB) Regression

The XGB regression models with NDVI and NDRE performed relatively well. Although adding additional sensor variables as inputs improved the model performance with training dataset for all the four N status indicators, the testing results were not improved (Table 4). The XGB models with all Crop Circle Phenom metrics combined with management information performed the best with both training and testing datasets, except AGB for training.
Validation models using testing dataset observations resulted in N status indicator estimation with model accuracy of R2 > 0.6 and RMSE < 0.40 for all AGB, PNC, and PNU, but lower model accuracy was present for PNU (Figure 6). Model performance for the training and the testing datasets suggested a considerable difference between including traditional vegetation indices compared to using all sensor and management information. Comparing the performance of models using NDVI and NDRE verses models which utilized all Crop Circle Phenom parameters, the NDVI and the NDRE-based models matched or outperformed the full parameter models for all four N status indicators when validated using the testing dataset (Table 4).
Since the Crop Circle Phenom is a new sensor system, only two site years of data are available. This limitation was mitigated through hyperparameter tuning of max depth, minimum child weight, and learning rate. No overall patterns of greater max depth, min child weight, or learning rate were observed by adding additional sensor or management parameters (Table 5). Cross-validation models using three k-folds were also employed to tune the hyperparameters using the training dataset. In the case of PNU, manual tuning was instead performed because the cross-validation model did not converge on suitable parameters.

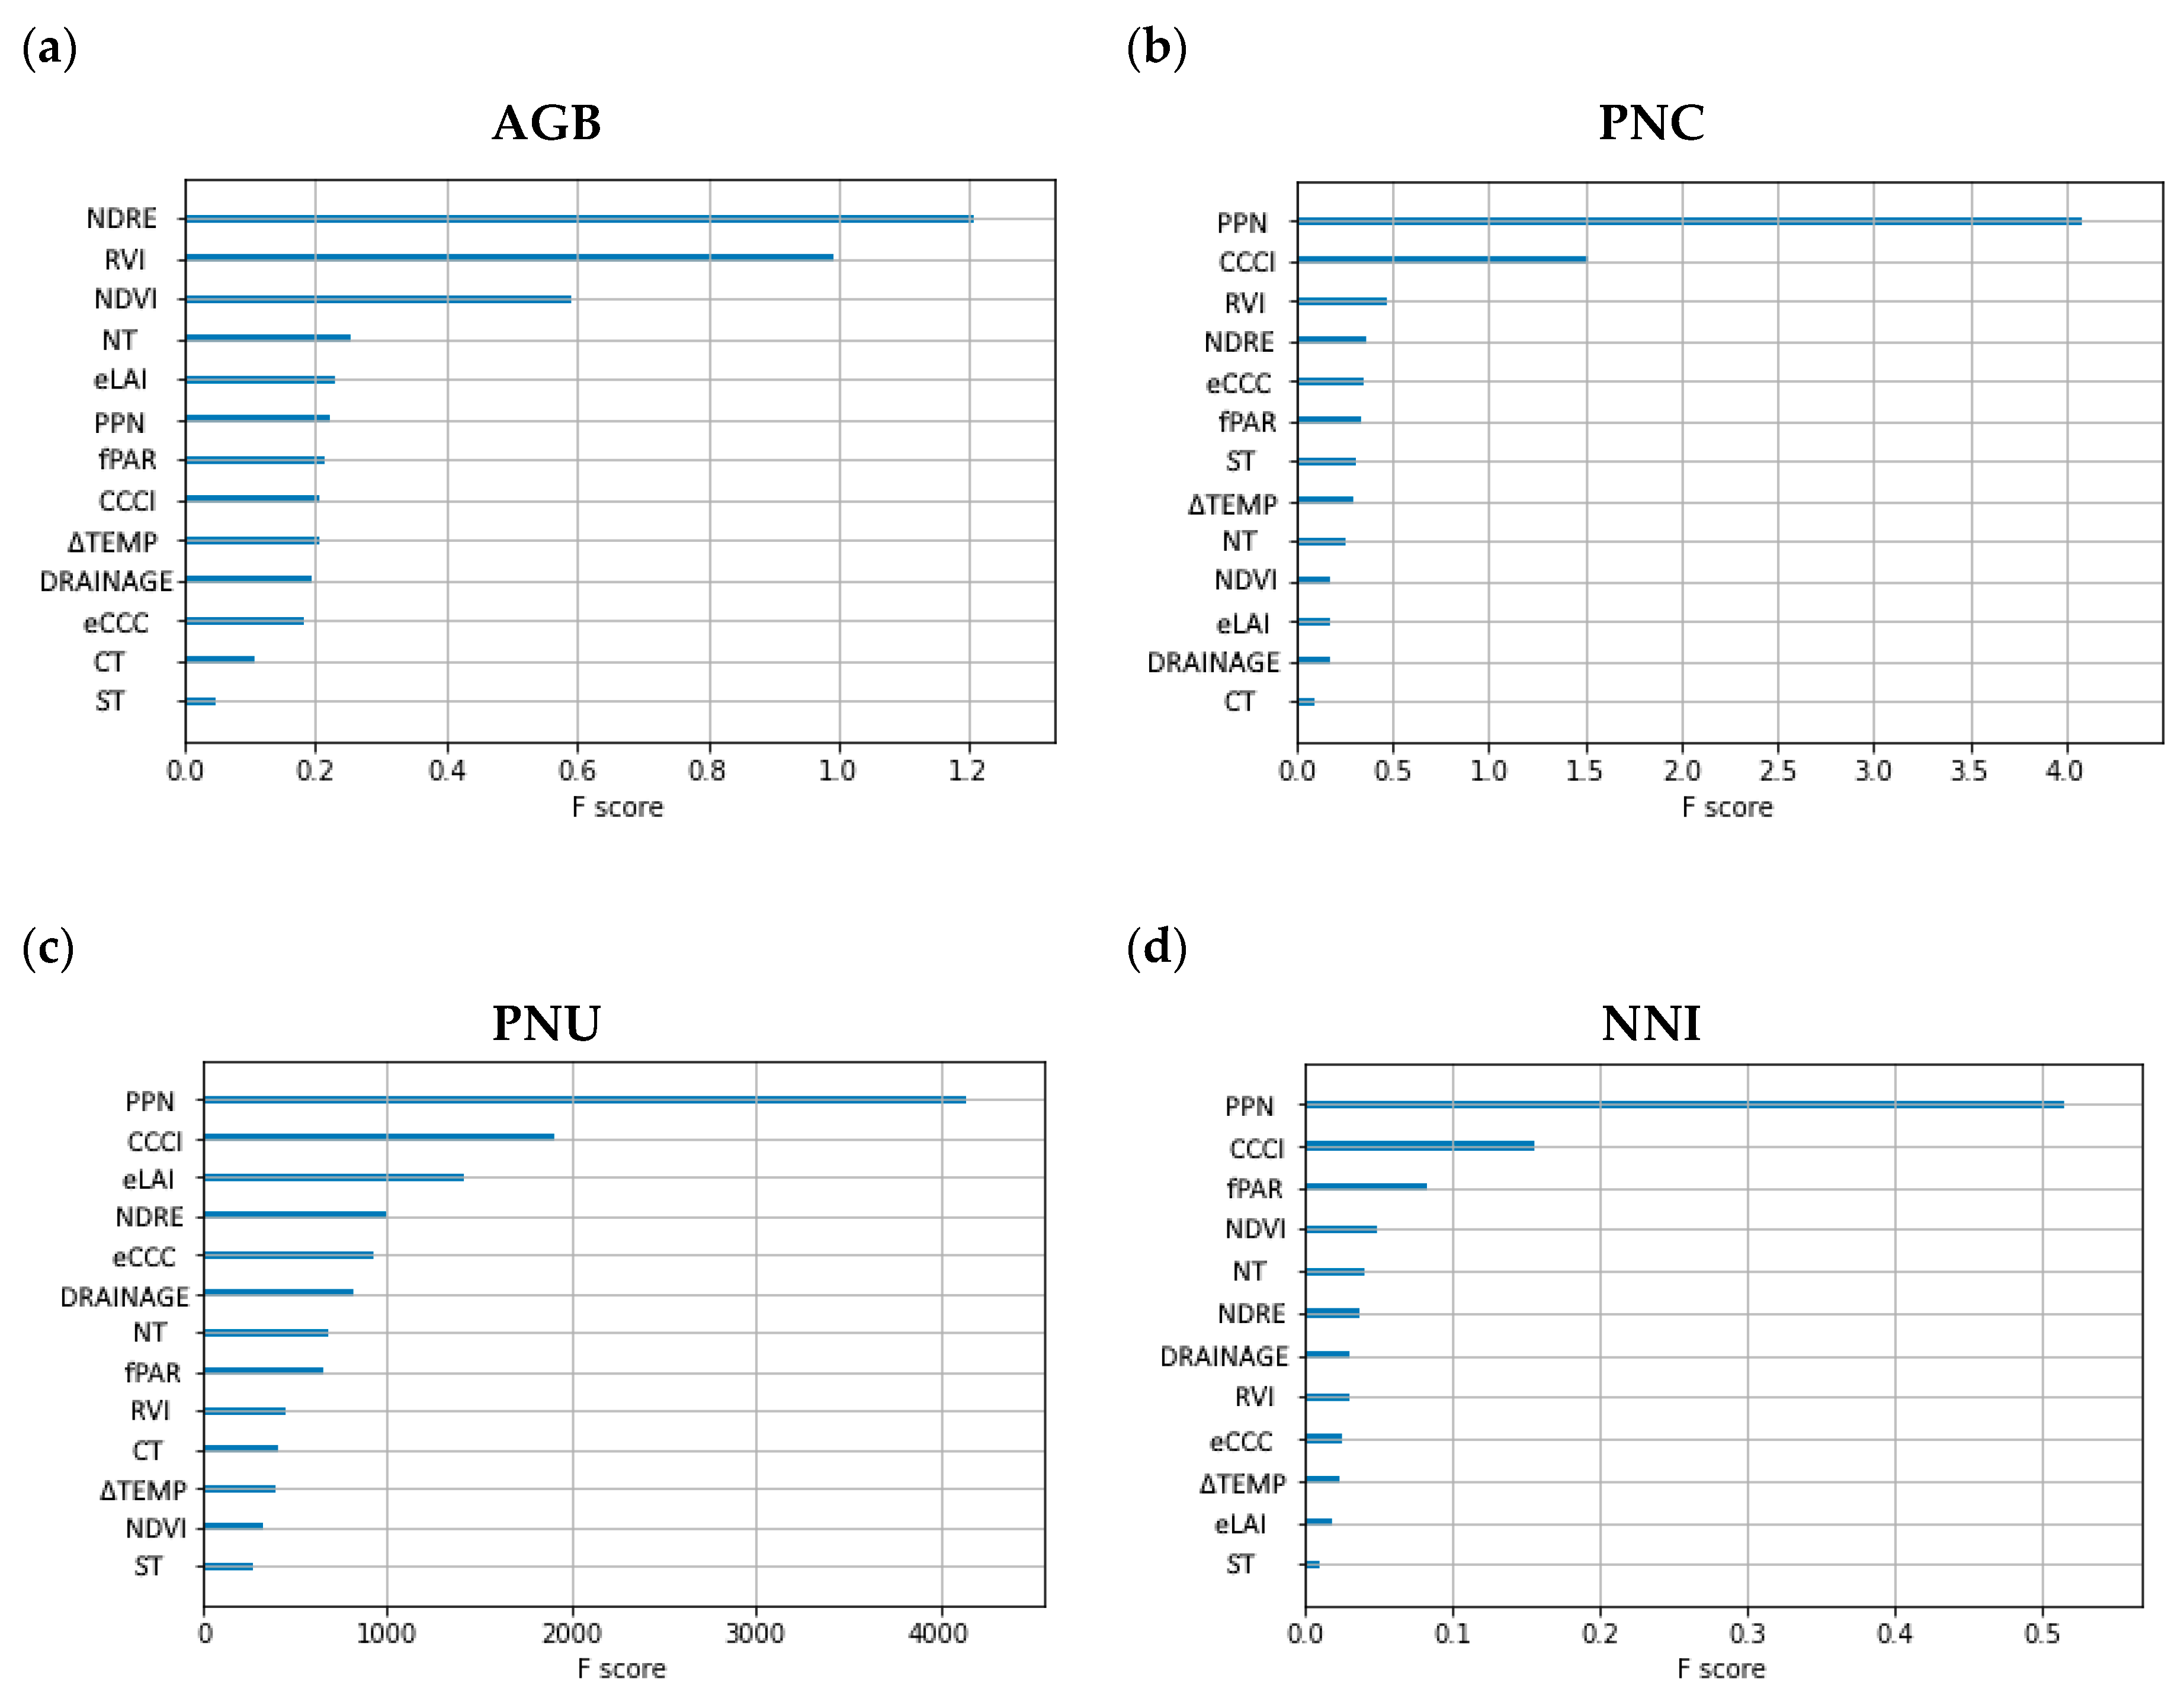
3.5. Relative Importance of Input Variables

The importance values were calculated for each N status prediction model to indicate relative worth of sensing and management parameters using the XGB plot_importance tool. Average gain value per model split was selected as the parameter used to measure a feature’s F score. This metric computed the average split value that each Crop Circle Phenom or management parameter was selected in and averaged their value for each N status indicator. The resulting model suggests PPN was the most important input variable for predicting PNC, PNU, and NNI (Figure 7b–d). However, sensing parameters NDRE, RVI, and NDVI were the most important parameters for predicting AGB (Figure 7a). CCCI was the most important sensor parameter to be included for estimating PNC, PNU or NNI, however, it was one of the lower importance sensor metrics for AGB prediction.
Tillage and drainage variables were not rated highly for predicting PNC, PNU, or NNI. An exception was that no-till (NT) was the fourth highest ranked metric for predicting AGB, although its F score was significantly lower compared to the top sensor metrics (Figure 7a). Drainage was predicted to have a high importance for predicting plant N status indicators due to its correlation with N loss processes, however, it consistently had a lower feature importance compared to sensing parameters and PPN.

3.6. Diagnosis of In-Season N Status Using NNI

The areal agreement and the kappa coefficient statistics for evaluating the efficacy of each sensor modeling technique to diagnose corn N status (NNI < 0.95 = deficient, 0.95 < NNI < 1.05 = optimum, NNI > 1.05 surplus) are given in Table 6. Among the 67 measurements, 37 plots were deficient, 4 were optimum, and 26 were surplus. Using the best performing NDRE and CCCI single sensor parameters to estimate corn N status demonstrated acceptable diagnostic accuracy for deficient conditions based on testing data (62–70%), however, both parameters performed poorly when diagnosing surplus corn N condition (<42%). Comparing XGB modeling techniques, only the model combining Crop Circle Phenom sensor parameters with management data achieved kappa statistics of over 0.4, with the overall areal agreement of 72%. Although the XGB models using NDVI and NDRE or all Crop Circle Phenom sensor data both improved overall corn N status diagnostic accuracy compared with SR models using NDRE or CCCI, neither of them achieved moderate agreement based on kappa statistics (0.4–0.6).

4. Discussion

4.1. Crop Circle Phenom Comparison to Similar Proximal Active Canopy Sensors

This research was conducted to evaluate the potential of the new multi-parameter Crop Circle Phenom sensor system, which has traditional spectral band reflectance and vegetation indices as well as climatic and physiological metrics. Compared with the commonly used three-band Crop Circle ACS 430 or RapidSCAN CS-45 sensors that calculate NDVI and NDRE, the Crop Circle Phenom system also provides eLAI and eCCC. These additional estimated parameters proved beneficial for estimating PNC and PNU in SR models, as both outperformed NDVI and NDRE. Regarding AGB estimation, eLAI and eCCC performed similarly to NDVI and NDRE. This is not a surprise, as NDVI has been extensively used for AGB estimation [38,39]. Similarly, the commonly used three band active canopy sensors and the Crop Circle Phenom sensor system would have comparable performance estimating NNI or PNU, since NNI was best predicted using CCCI, and PNU was estimated similarly well using eCCC, eLAI, NDRE, or CCCI, which can all be calculated by all these sensors.
Aside from the estimated LAI and CCC metrics, the key potential advantage of the Crop Circle Phenom sensor system is the derivation of Δ Temp and fPAR. The Δ Temp parameter has been commonly used to identify crop water stress [40,41], however, limited research has been conducted to investigate how crop N status influences canopy temperature. Yan et al. [42] found that rice canopy temperature responded to N rate, with N stress causing higher temperatures. Similarly, Alzaben, Fraser, and Swanton [22] used thermal imagery to investigate the relation between canopy temperature and N status. The study observed that both corn leaf and whirl temperatures statistically responded to N treatment, with optimal N corresponding to lower canopy temperature. For this study, Δ Temp calculated from the sensor’s air and canopy temperature readings showed a poor relationship with all four plant N metrics using SR. This result contrasts with previous research but could be explained by the inability of the proximal sensor to separate soil and plant signals. Alzaben, Fraser, and Swanton [22] were able to separate plants from soil background using a segmentation algorithm, which they indicated considerably changed their measured plot temperatures.
As with Δ Temp, fPAR has not been thoroughly studied in crop nutrient management. Although PAR information can be used as a component to estimate crop biomass, yield, and primary productivity [21], no published article has used it as a metric to estimate plant N status. For this reason, fPAR was investigated in this study and compared with traditional vegetative indices. The results of this study indicated that fPAR was marginally related to other sensor metrics (R = 0.17–0.28) and was not as important as vegetation indices for predicting corn N status based on SR analysis, including AGB.
Although fPAR did not perform well using SR, it showed more potential when used in XGB regression models as it was ranked as one of the most important variables for predicting NNI. This result indicated that fPAR was not an important predictor of N status individually but could provide important information complementary to spectral vegetation indices. However, Δ Temp did not rank highly in any of the N indicator models. The Δ Temp information may be beneficial to help differentiate different stress factors since it has already been shown to detect water stress, as demonstrated by Jensen et al. [43] and DeJonge et al. [41].

4.2. Modelling Strategies for In-Season Corn N Status Prediction and Diagnosis

The SR modeling was evaluated as a simplistic approach to model N nutrition metrics; however, limitations were discovered when including categorical field management variables. Additionally, determining the correct model fit for each sensor metric is difficult since most relationships are non-linear. Therefore, machine learning methods that can include categorical variables may be a better approach to model non-linear relationships.
The XGB regression was investigated as a machine learning method to predict in-season N metrics using three distinct levels: NDVI and NDRE, all selected Crop Circle Phenom sensor parameters, and all sensor parameters as well as drainage, tillage, and PPN management information. The results indicated that corn N status indicators were best predicted when sensor data and management information were utilized together. The PPN rate information was highly important for predicting PNC, PNU, and NNI, however, it was not as important for predicting AGB. Compared to PPN, drainage and tillage information did not contribute as strongly to the prediction of any of the plant N metrics since their F scores were significantly lower than most sensor metrics. This low feature importance was unexpected since both drainage and tillage were found to be significant factors for grain yield (data not shown).
Models using all Crop Circle parameters overall performed better than models only using NDVI and NDRE using the training dataset, although this did not translate into improved performance of the testing dataset that was at best comparable to using only NDVI and NDRE. Comparing the importance of each sensor metric, CCCI was the most informative sensor index for PNC, PNU, and NNI. This supports previous studies [44,45,46]. It should be noted that the CCCI used in this study is a simplified index calculated as NDRE/NDVI, while the original CCCI was based on the theory of two-dimensional planar domain involving both NDRE and NDVI [47,48]. More studies are needed to further evaluate the simplified and the original CCCI for applications in crop N status prediction and diagnosis.
The N status diagnosis results also indicated that XGB models using two or more variables outperformed SR models using one variable. The XGB models using NDVI and NDRE or all selected Crop Circle Phenom sensor derived variables performed similarly, with the same areal agreement (57%) and slight difference in kappa statistics (0.32 vs. 0.36). Adding management information further improved the N status diagnostic accuracy, with areal agreement of 72% and kappa statistics of 0.54. This result highlighted the importance of combining management information with crop sensor data.
Few previous studies have attempted to combine sensor data with soil and climate data to improve in-season N recommendations [49,50,51], however, limited studies have been reported to combine management practice information with crop sensor data for in-season N status prediction and diagnosis. Countless machine learning models have been used for predicting crop N status indicators [52,53,54,55], however, XGB regression was selected for this project because it includes self-contained cross validation modules to perform hyperparameter tuning and the ability to define an early stopping parameter to mitigate overfitting. Specifically, the ability to tune for learning rate was important within our limited dataset because it further mitigated the risk of overfitting our training models. Nevertheless, the results in this study indicated that overfitting was still a problem. More studies are needed to broaden the dataset and evaluate different machine learning methods [51,54].

4.3. Implications for On-Farm Applications

Proximal sensing systems are beneficial for on-farm use because they require minimal training to collect data and fewer processing resources than aerial or satellite imagery. The Crop Circle Phenom sensor system is designed to be mounted on a vehicle or tractor, which makes it more difficult to be carried by hand for small plot research. To deploy it in small plot experiments, a custom pole was constructed to mount the two sensors and the GeoScout data logger. Another difference compared to similar proximal sensors is the Phenom requires an external 12 volt battery to power its active sensor light for calculating reflectance. Although the Crop Circle Phenom requires modifications for small plot research, adapting the sensor system for commercial field applications would be much easier because the mounting hardware and the electrical wiring were designed for use on a field implement. This ease of use for commercial applications is also due to its GPS connectivity and ability to quickly swap out the sensor across a range of field implements from sprayers to fertilizer spreaders, which enables whole field resolution readings to be collected throughout the growing season.
Another way in which the Crop Circle Phenom can set itself apart as a proximal sensing system is through its multi-parameter spectral, environmental, and physiological metrics. Utilizing biophysical relationships between spectral features and temperature, the Crop Circle Phenom can be used to estimate ∆Temp and fPAR. Although utilized in this study to investigate N status, these metrics have the potential to differentiate various stress factors such as water status and pathological issues. However, both these management considerations were outside the scope of this research and should be investigated in the future.
The PPN information was an important factor to use with crop sensor data for in-season N status prediction and diagnosis. Such data can be easily obtained from as-applied maps and should be included in in-season N status diagnosis, especially when variable rate PPN is applied.

5. Conclusions

The Crop Circle Phenom sensing system possesses multi-parameter indices that can be used to measure crop canopy reflectance, eLAI, eCCC, and calculate ∆Temp and fPAR. The eLAI and eCCC indices performed slightly better than NDVI and NDRE for predicting PNC and PNU using SR models. As a result, these indices warrant inclusion in future sensor-based diagnosis methods alongside traditional vegetation indices. In contrast, SR models using ΔTemp or fPAR did not perform well for predicting plant N status indicators. This poorer model performance could be due to inability to segment soil from plant reflectance, as is possible with imagery or potted plant experiments. Nonetheless, both ΔTemp and fPAR parameters were useful for N status prediction when used alongside reflectance parameters with machine learning models, such as XGB regression. The CCCI parameter was found to be an important vegetation index for predicting PNC, PNU, and NNI in both SR and XGB modeling. This improvement over NDVI and NDRE indicates CCCI should be included in future sensor guided management research.
The Crop Circle Phenom sensor system shows promise as a tool for in-season corn N status prediction and diagnosis across different drainage, tillage, N supply, and site year conditions. Combining management information, especially PPN, with Crop Circle Phenom sensor data using machine learning can improve corn N status prediction and diagnosis compared to only using sensor data. Additional studies are needed to further evaluate this new multi-parameter Crop Circle Phenom sensing system with more site year data using additional tree based supervised models.

Author Contributions

Y.M. conceived the study. F.G.F. designed and implemented the field experiment. C.C., G.D.P., S.K. collected plant and sensor data. C.C. performed data analysis, wrote the original paper, S.K. assisted with data analysis, Y.M., F.G.F. and G.D.P. reviewed and revised the manuscript, Y.M. and F.G.F. secured funding. All authors have read and agreed to the published version of the manuscript.

Funding

This research was funded by the Minnesota Department of Agriculture/Agricultural Fertilizer Research and Education Council (MDA/AFREC R2018-25, R2019-20 and R2020-32), the Minnesota Soybean Research and Promotion Council (project 00071830), the USDA National Institute of Food and Agriculture (State project 1016571), and the Startup Fund.

Institutional Review Board Statement

Not applicable.

Informed Consent Statement

Not applicable.

Data Availability Statement

The data presented in this study are available on request from the corresponding author. The data are not yet publicly available.

Acknowledgments

We would like to thank the Field Crew at the Department of Soil, Water and Climate, Hui Shao for their assistance with field and sensor data collection, and Seth Naeve for drainage design and long-term management of the study site.

Conflicts of Interest

The authors declare no conflict of interest.

References

  1. Gebbers, R.; Adamchuk, V. Precision Agriculture and Food Security. Science 2010, 327, 828–831. [Google Scholar] [CrossRef] [PubMed]
  2. Subedi, K.D.; Ma, B.L. Assessment of Some Major Yield-Limiting Factors on Maize Production in a Humid Temperate Environment. Field Crops Res. 2009, 110, 21–26. [Google Scholar] [CrossRef]
  3. Andraski, T.W.; Bundy, L.G.; Brye, K.R. Crop Management and Corn Nitrogen Rate Effects on Nitrate Leaching. J. Environ. Qual. 2000, 29, 1095–1103. [Google Scholar] [CrossRef]
  4. Ma, B.L.; Wu, T.Y.; Tremblay, N.; Deen, W.; McLaughlin, N.B.; Morrison, M.J.; Stewart, G. On-Farm Assessment of the Amount and Timing of Nitrogen Fertilizer on Ammonia Volatilization. Agron. J. 2010, 102, 134–144. [Google Scholar] [CrossRef]
  5. Balafoutis, A.; Beck, B.; Fountas, S.; Vangeyte, J.; van der Wal, T.; Soto, I.; Gómez-Barbero, M.; Barnes, A.; Eory, V. Precision Agriculture Technologies Positively Contributing to Ghg Emissions Mitigation, Farm Productivity and Economics. Sustainability 2017, 9, 1339. [Google Scholar] [CrossRef] [Green Version]
  6. Diacono, M.; Rubino, P.; Montemurro, F. Precision Nitrogen Management of Wheat. A Review. Agron. Sustain. Dev. 2013, 33, 219–241. [Google Scholar] [CrossRef]
  7. Cao, Q.; Miao, Y.; Feng, G.; Gao, X.; Liu, B.; Liu, Y.; Li, F.; Khosla, R.; Mulla, D.J.; Zhang, F. Improving Nitrogen Use Efficiency with Minimal Environmental Risks Using an Active Canopy Sensor in a Wheat-Maize Cropping System. Field Crops Res. 2017, 214, 365–372. [Google Scholar] [CrossRef]
  8. Cassman, K.; Dobermann, A.; Walters, D. Agroecosystems, Nitrogen-Use Efficiency, and Nitrogen Management. Biogeochemistry 2006, 79, 132–140. [Google Scholar] [CrossRef]
  9. Mistele, B.; Schmidhalter, U. Estimating the Nitrogen Nutrition Index Using Spectral Canopy Reflectance Measurements. Eur. J. Agron. 2008, 29, 184–190. [Google Scholar] [CrossRef]
  10. Silva, J.; Uchida, R. Essential Nutrients for Plant Growth. In Plant Nutrient Management in Hawaii’s Soils: Approaches for Tropical and Subtropical Agriculture; Silva, J.A., Uchida, R., Eds.; College of Tropical Agriculture and Human Resources, University of Hawaii at Manoa: Manaoa, HI, USA, 2000; pp. 31–55. [Google Scholar]
  11. Plénet, D.; Lemaire, G. Relationships between Dynamics of Nitrogen Uptake and Dry Matter Accumulation in Maize Crops. Determination of Critical N Concentration. Plant Soil 1999, 216, 65–82. [Google Scholar] [CrossRef]
  12. Cilia, C.; Panigada, C.; Rossini, M.; Meroni, M.; Busetto, L.; Amaducci, S.; Boschetti, M.; Picchi, V.; Colombo, R. Nitrogen Status Assessment for Variable Rate Fertilization in Maize through Hyperspectral Imagery. Remote Sens. 2014, 6, 6549–6565. [Google Scholar] [CrossRef] [Green Version]
  13. Xia, T.; Miao, Y.; Wu, D.; Shao, H.; Khosla, R.; Mi, G. Active Optical Sensing of Spring Maize for In-Season Diagnosis of Nitrogen Status Based on Nitrogen Nutrition Index. Remote Sens. 2016, 8, 605. [Google Scholar] [CrossRef] [Green Version]
  14. Ziadi, N.; Brassard, M.; Bélanger, G.; Claessens, A.; Tremblay, N.; Cambouris, A.N.; Nolin, M.C.; Parent, L.É. Chlorophyll Measurements and Nitrogen Nutrition Index for the Evaluation of Corn Nitrogen Status. Agron. J. 2008, 100, 1264–1273. [Google Scholar] [CrossRef]
  15. Zhao, B.; Duan, A.; Ata-Ul-Karim, S.T.; Liu, Z.; Chen, Z.; Gong, Z.; Zhang, J.; Xiao, J.; Liu, Z.; Qin, A.; et al. Exploring New Spectral Bands and Vegetation Indices for Estimating Nitrogen Nutrition Index of Summer Maize. Eur. J. Agron. 2018, 93, 113–125. [Google Scholar] [CrossRef]
  16. Basso, B.; Cammarano, D.; Grace, P.R.; Cafiero, G.; Sartori, L.; Pisante, M.; Landi, G.; de Franchi, S.; Basso, F. Criteria for Selecting Optimal Nitrogen Fertilizer Rates for Precision Agriculture. Ital. J. Agron. 2009, 4, 147–158. [Google Scholar] [CrossRef]
  17. Miao, Y.; Mulla, D.J.; Randall, G.W.; Vetsch, J.A.; Vintila, R. Combining Chlorophyll Meter Readings and High Spatial Resolution Remote Sensing Images for In-Season Site-Specific Nitrogen Management of Corn. Precis. Agric. 2009. [Google Scholar] [CrossRef]
  18. Paiao, G.D.; Fernández, F.F.; Spackman, J.A.; Kaiser, D.E.; Weisberg, S. Ground-Based Optical Canopy Sensing Technologies for Corn–Nitrogen Management in the Upper Midwest. Agron. J. 2020, 112, 2998–3011. [Google Scholar] [CrossRef]
  19. Rouse, J.W.; Haas, R.H.; Schell, J.A.; Deering, D.W. Monitoring Vegetation Systems in the Great Plains with ERTS. In Proceedings of the Third Earth Resources Technology Satellite—1 Symposium; Held by Goddard Space Flight Center at Washington, DC on 10–14 December 1973: Prepared at Goddard Space Flight Center; Scientific and Technical Information Office, National Aeronautics and Space Administration: Washington, DC, USA, 1974; Volume 351, pp. 309–317. [Google Scholar]
  20. Barnes, E.M.; Clarke, T.R.; Richards, S.E. Coincident Detection of Crop Water Stress, Nitrogen Status and Canopy Density Using Ground Based Multispectral Data. In Proceedings of the Fifth International Conference on Precision Agriculture, Madison, WI, USA, 16–19 July 2000; Robert, P.C., Rust, R.H., Larson, W.E., Eds.; American Society of Agronomy (CD-ROM): Madison, WI, USA, 2000. [Google Scholar]
  21. Serrano, L.; Filella, I.; Peñuelas, J. Remote Sensing of Biomass and Yield of Winter Wheat under Different Nitrogen Supplies. Crop Sci. 2000, 40, 723–731. [Google Scholar] [CrossRef] [Green Version]
  22. Alzaben, H.; Fraser, R.; Swanton, C. An Inverse Correlation between Corn Temperature and Nitrogen Stress: A Field Case Study. Agron. J. 2019, 111, 3207–3219. [Google Scholar] [CrossRef]
  23. Fernández, F.G.; Fabrizzi, K.P.; Naeve, S.L. Corn and Soybean’s Season-Long in-Situ Nitrogen Mineralization in Drained and Undrained Soils. Nutr. Cycl. Agroecosyst. 2017, 107, 33–47. [Google Scholar] [CrossRef]
  24. Holland, K.H.; Schepers, J.S. Active Proximal Sensing: Review of Waveband Selection, Vegetation Indices, Scientific Trump Cards, Etc. In Proceedings of the ASA CSSA SSSA 2011 International Annual Meetings, San Antonio, TX, USA, 16–19 October 2011. [Google Scholar]
  25. Jones, H.G.; Vaughan, R.A. Remote Sensing of Vegetation: Principles, Techniques, and Applications; Oxford University Press: New York, NY, USA, 2010; ISBN 9780199207794. [Google Scholar]
  26. Jordan, C.F. Derivation of Leaf-Area Index from Quality of Light on the Forest Floor. Ecology 1969, 50, 663–666. [Google Scholar] [CrossRef]
  27. Long, D.S.; Eitel, J.U.H.; Huggins, D.R. Assessing Nitrogen Status of Dryland Wheat Using the Canopy Chlorophyll Content Index. Crop Manag. 2009, 8, 1–8. [Google Scholar] [CrossRef]
  28. Holland Scientific. Crop Circle Phenom User’s Guide; Holland Scientific: Lincoln, NE, USA, 2016. [Google Scholar]
  29. Horneck, D.A.; Miller, R.O. Determination of total nitrogen in plant tissue. In Handbook of Reference Methods for Plant Analysis; CRC Press: Boca Raton, FL, USA, 1998; pp. 75–84. [Google Scholar]
  30. Virtanen, P.; Gommers, R.; Oliphant, T.E.; Haberland, M.; Reddy, T.; Cournapeau, D.; Burovski, E.; Peterson, P.; Weckesser, W.; Bright, J.; et al. SciPy 1.0: Fundamental Algorithms for Scientific Computing in Python. Nat. Methods 2020, 17, 261–272. [Google Scholar] [CrossRef] [PubMed] [Green Version]
  31. Pedregosa, F.; Varoquaux, G.; Gramfort, A.; Michel, V.; Thirion, B.; Grisel, O.; Blondel, M.; Prettenhofer, P.; Weiss, R.; Dubourg, V.; et al. Scikit-Learn: Machine Learning in Python. J. Mach. Learn. Res. 2011, 12, 2825–2830. [Google Scholar]
  32. Chen, T.; Guestrin, C. XGBoost: A Scalable Tree Boosting System Tianqi. In Proceedings of the 22nd ACM SIGKDD International Conference on Knowledge Discovery and Data Mining, San Francisco, CA, USA, 13–17 August 2016; pp. 785–794. [Google Scholar]
  33. Schratz, P.; Muenchow, J.; Iturritxa, E.; Richter, J.; Brenning, A. Hyperparameter Tuning and Performance Assessment of Statistical and Machine-Learning Algorithms Using Spatial Data. Ecol. Model. 2019, 406, 109–120. [Google Scholar] [CrossRef] [Green Version]
  34. Huang, S.; Miao, Y.; Zhao, G.; Yuan, F.; Ma, X.; Tan, C.; Yu, W.; Gnyp, M.L.; Lenz-Wiedemann, V.I.S.; Rascher, U.; et al. Satellite Remote Sensing-Based in-Season Diagnosis of Rice Nitrogen Status in Northeast China. Remote Sens. 2015, 7, 10646–10667. [Google Scholar] [CrossRef] [Green Version]
  35. Lu, J.; Miao, Y.; Shi, W.; Li, J.; Yuan, F. Evaluating Different Approaches to Non-Destructive Nitrogen Status Diagnosis of Rice Using Portable RapidSCAN Active Canopy Sensor. Sci. Rep. 2017. [Google Scholar] [CrossRef]
  36. Cohen, J. A Coefficient of Agreement for Nominal Scales. Educ. Psychol. Meas. 1960, 20, 37–46. [Google Scholar] [CrossRef]
  37. Landis, J.R.; Koch, G.G. The Measurement of Observer Agreement for Categorical Data. Biometrics 1977, 33, 159. [Google Scholar] [CrossRef] [Green Version]
  38. Freeman, K.W.; Girma, K.; Arnall, D.B.; Mullen, R.W.; Martin, K.L.; Teal, R.K.; Raun, W.R. By-Plant Prediction of Corn Forage Biomass and Nitrogen Uptake at Various Growth Stages Using Remote Sensing and Plant Height. Agron. J. 2007, 99, 530–536. [Google Scholar] [CrossRef] [Green Version]
  39. Wang, X.; Miao, Y.; Guan, Y.; Xia, T.; Lu, J.; Mulla, D.J. An evaluation of two active sensor systems for non-destructive estimation of spring maize biomass. In Proceedings of the Fifth International Conference on Agro-Geoinformatics (Agro-Geoinformatics 2016), Tianjin, China, 18–20 July 2016; pp. 1–6. [Google Scholar] [CrossRef]
  40. Jackson, R.D.; Idso, S.B.; Reginato, R.J.; Pinter, P.J. Canopy Temperature as a Crop Water Stress Indicator. Water Resour. Res. 1981, 17, 1133–1138. [Google Scholar] [CrossRef]
  41. DeJonge, K.C.; Taghvaeian, S.; Trout, T.J.; Comas, L.H. Comparison of Canopy Temperature-Based Water Stress Indices for Maize. Agric. Water Manag. 2015, 156, 51–62. [Google Scholar] [CrossRef]
  42. Yan, C.; Ding, Y.; Wang, Q.; Liu, Z.; Li, G.; Muhammad, I.; Wang, S. The Impact of Relative Humidity, Genotypes and Fertilizer Application Rates on Panicle, Leaf Temperature, Fertility and Seed Setting of Rice. J. Agric. Sci. 2010, 148, 329–339. [Google Scholar] [CrossRef]
  43. Jensen, H.E.; Svendsen, H.; Jensen, S.E.; Mogensen, V.O. Canopy-Air Temperature of Crops Grown under Different Irrigation Regimes in a Temperate Humid Climate. Irrig. Sci. 1990, 11, 181–188. [Google Scholar] [CrossRef]
  44. Cammarano, D.; Fitzgerald, G.; Basso, B.; O’Leary, G.; Chen, D.; Grace, P.; Fiorentino, C. Use of the Canopy Chlorophyl Content Index (CCCI) for Remote Estimation of Wheat Nitrogen Content in Rainfed Environments. Agron. J. 2011, 103, 1597–1603. [Google Scholar] [CrossRef]
  45. Perry, E.M.; Fitzgerald, G.J.; Nuttall, J.G.; O’Leary, G.J.; Schulthess, U.; Whitlock, A. Rapid Estimation of Canopy Nitrogen of Cereal Crops at Paddock Scale Using a Canopy Chlorophyll Content Index. Field Crops Res. 2012, 134, 158–164. [Google Scholar] [CrossRef]
  46. Li, F.; Miao, Y.; Feng, G.; Yuan, F.; Yue, S.; Gao, X.; Liu, Y.; Liu, B.; Ustin, S.L.; Chen, X. Improving Estimation of Summer Maize Nitrogen Status with Red Edge-Based Spectral Vegetation Indices. Field Crops Res. 2014, 157, 111–123. [Google Scholar] [CrossRef]
  47. Clarke, T.R.; Moran, M.S.; Barnes, E.M.; Pinter, P.J.; Qi, J. Planar Domain Indices: A Method for Measuring a Quality of a Single Component in Two-Component Pixels. Int. Geosci. Remote Sens. Symp. 2001, 3, 1279–1281. [Google Scholar] [CrossRef]
  48. Fitzgerald, G.; Rodriguez, D.; O’Leary, G. Measuring and Predicting Canopy Nitrogen Nutrition in Wheat Using a Spectral Index-The Canopy Chlorophyll Content Index (CCCI). Field Crops Res. 2010, 116, 318–324. [Google Scholar] [CrossRef]
  49. Bushong, J.T.; Mullock, J.L.; Miller, E.C.; Raun, W.R.; Brian Arnall, D. Evaluation of Mid-Season Sensor Based Nitrogen Fertilizer Recommendations for Winter Wheat Using Different Estimates of Yield Potential. Precis. Agric. 2016, 17, 470–487. [Google Scholar] [CrossRef]
  50. Bean, G.M.; Kitchen, N.R.; Camberato, J.J.; Ferguson, R.B.; Fernandez, F.G.; Franzen, D.W.; Laboski, C.A.M.; Nafziger, E.D.; Sawyer, J.E.; Scharf, P.C.; et al. Improving an Active-Optical Reflectance Sensor Algorithm Using Soil and Weather Information. Agron. J. 2018, 110, 2541–2551. [Google Scholar] [CrossRef] [Green Version]
  51. Ransom, C.J.; Camberato, J.J.; Carter, P.R.; Ferguson, R.B. Statistical and Machine Learning Methods Evaluated for Incorporating Soil and Weather into Corn Nitrogen Recommendations. Comput. Electron. Agric. 2019, 164, 104872. [Google Scholar] [CrossRef] [Green Version]
  52. Yao, X.; Huang, Y.; Shang, G.; Zhou, C.; Cheng, T.; Tian, Y.; Cao, W.; Zhu, Y. Evaluation of Six Algorithms to Monitor Wheat Leaf Nitrogen Concentration. Remote Sens. 2015, 7, 14939–14966. [Google Scholar] [CrossRef] [Green Version]
  53. Chlingaryan, A.; Sukkarieh, S.; Whelan, B. Machine Learning Approaches for Crop Yield Prediction and Nitrogen Status Estimation in Precision Agriculture: A Review. Comput. Electron. Agric. 2018, 151, 61–69. [Google Scholar] [CrossRef]
  54. Zheng, H.; Li, W.; Jiang, J.; Liu, Y.; Cheng, T.; Tian, Y.; Zhu, Y.; Cao, W.; Zhang, Y.; Yao, X. A Comparative Assessment of Different Modeling Algorithms for Estimating Leaf Nitrogen Content in Winter Wheat Using Multispectral Images from an Unmanned Aerial Vehicle. Remote Sens. 2018, 10, 2026. [Google Scholar] [CrossRef] [Green Version]
  55. Zha, H.; Miao, Y.; Wang, T.; Li, Y.; Zhang, J.; Sun, W. Sensing-Based Rice Nitrogen Nutrition Index Prediction with Machine Learning. Remote Sens. 2020, 12, 215. [Google Scholar] [CrossRef] [Green Version]
Figure 1. Wells research site experimental design with four replicates of block resolution drainage treatments and sub-plot tillage and sub-sub plot pre-plant N treatments. Green plots signify pre-plant N treatments while purple plots are timing treatments outside the realm of this study. NT, ST, and CT stand for no-till, strip-tillage, and conventional-tillage, respectively. The numbers for the pre-plant N treatment plots indicate the N rates (kg ha−1).
Remotesensing 13 00401 g001
Figure 2. Crop Circle Phenom sensor (a) custom assembly with extendable pole and (b) close up view of ACS-430 and DAS43X sensor components.
Remotesensing 13 00401 g002
Figure 3. Example eXtreme Gradient Boosting (XGB) XGBoost regression tree composed of a series of conditional statements that test each observation with successive branches and leaf nodes deciding the predicted split value of a target variable.
Remotesensing 13 00401 g003
Figure 4. Correlation pairs between the Crop Circle Phenom metrics. Upper panel displays the relationship between sensor metrics and lower corner panel shows coefficient of determination (R2).
Remotesensing 13 00401 g004
Figure 5. Measured versus predicted (a) aboveground biomass (AGB) using SR NDVI, (b) plant N concentration (PNC) using SR CCCI, (c) plant N uptake (PNU) using SR eCCC, and (d) N nutrition index (NNI) using SR CCCI.
Remotesensing 13 00401 g005
Figure 6. Measured versus predicted (a) aboveground biomass (AGB), (b) plant N concentration (PNC), (c) plant nitrogen uptake (PNU), and (d) nitrogen nutrition index (NNI) by XGB regression models using testing dataset and all phenom metrics and management data.
Remotesensing 13 00401 g006
Figure 7. Relative importance of sensor metrics and management variables for predicting (a) AGB, (b) PNC, (c) PNU, and (d) NNI as represented by the F score values from XGB regression.
Remotesensing 13 00401 g007
Table 1. List of sensor parameters calculated using the Crop Circle Phenom.
Vegetation IndexAbbreviationFormulaReference
Normalized Difference Vegetation IndexNDVI ( NIR RED ) ( N I R + R E D ) [19]
Normalized Difference Red EdgeNDRE ( NIR RE ) ( N I R + R E ) [20]
Estimated Canopy Chlorophyll ContenteCCC ( a NIR b RE ) ( c R E d R )
where a, b, c, d are scaling constants
[24]
Estimated Leaf Area IndexeLAI k ln ( 1 NDVI )
where k is a scaling constant
[25]
Ratio Vegetation IndexRVI N I R R [26]
Canopy Chlorophyll Content IndexCCCI ( NDRE ) ( N D V I ) [27]
Delta Temperature Δ Temp Canopy Temp (C)—Air Temp (C)[28]
Fractional Photosynthetically Active RadiationfPAR R e f l e c t e d   P A R I n c o m i n g   P A R [28]
Table 2. Descriptive statistics of aboveground biomass (AGB), plant N concentration (PNC), plant N uptake (PNU), and N nutrition index (NNI) at V7–V8 growth stage for training and testing datasets across drainage, tillage, N treatments, and site years.
Training Set (n = 208)Testing Set (n = 67)
MaxMinMeanCV(%)MaxMinMeanCV(%)
AGB (Mg ha−1)3.270.592.0326.892.950.851.8825.96
PNC (g kg−1)3.860.952.4826.543.681.142.4527.04
PNU (kg ha−1)101.683.9551.7939.2786.987.7946.8240.11
NNI1.380.280.9529.341.400.340.9130.22
Table 3. The performance of simple regression (SR) models using Crop Circle Phenom sensor parameters for predicting corn N status indicators across years and treatments. NDVI: normalized difference vegetation index; NDRE: normalized difference red edge; eCCC: estimated canopy chlorophyll content; eLAI: estimated leaf area index; RVI: ratio vegetation index; CCCI: canopy chlorophyll content index; fPAR: fractional photosynthetically active radiation; MAE: mean absolute error; RMSE: root mean squared error.
ParameterRegression ModelTrainingTesting
R2MAERMSER2MAERMSE
Aboveground Biomass (AGB)
NDVI y = 20.56 x 2     24.76 x + 8.29 0.460.310.400.660.230.28
NDRE y = 0.35 e 4.43 x 0.450.300.400.600.240.31
eLAI y = 0.44 x + 0.76 0.450.300.400.580.250.32
eCCC y = 0.39 x + 0.72 0.450.300.400.580.250.31
RVI y = 0.13 x + 0.44 0.450.310.400.650.240.29
CCCI y = 24.07 x 2 12.40 x + 2.53 0.340.330.440.360.310.39
fPAR y = 8.09 x + 0.42 0.150.400.500.160.340.44
Δ Temp y = 0.18 x + 1.96 0.250.370.470.260.320.42
Plant Nitrogen Concentration (PNC)
NDRE y = 5.88 x + 0.16 0.160.490.600.230.480.58
eLAI y = 0.25 x 2 + 1.64 x   0.05 0.210.480.580.270.470.56
eCCC y = 0.18 x 2 + 1.40 x   0.01 0.230.470.580.290.470.55
CCCI y = 9.58 x 2.00 0.270.450.560.410.410.50
Plant Nitrogen Uptake (PNU)
NDVI y = 106.79 x 4.21 0.2614.4217.460.2613.8516.09
NDRE y = 276.23 x 56.97 0.3812.4815.950.4811.5113.48
eLAI y = 4.07 x 2 + 37.35 x 19.11 0.3812.4415.990.4911.2113.29
eCCC y = 2.68 x 2 + 30.05 x 16.11 0.3912.3615.910.5011.1213.22
RVI y = 3.52 x   + 8.33 0.2414.6917.680.2314.2416.35
CCCI y = 353.23 x 2 + 34.6 x 42.08 0.3812.3016.010.4611.2513.76
Nitrogen Nutrition Index (NNI)
NDVI y = 0.13 e 2.34 x 0.120.220.260.100.220.26
NDRE y = 3.32 x 0.36 0.300.190.230.410.180.21
eLAI y = 0.17 x + 0.46 0.250.200.240.340.190.22
eCCC y = 0.16 x + 0.43 0.270.200.240.370.190.22
RVI y = 0.03 x + 0.57 0.100.230.260.080.230.26
CCCI y = 6.16 x 2.48 0.380.180.220.530.160.19
fPAR y = 3.36 x + 0.28 0.100.220.260.080.230.26
Table 4. eXtreme gradient boosted (XGB) model performance using different levels of Crop Circle Phenom sensor and management variables for predicting aboveground biomass, plant N concentration, plant N uptake, and N nutrition index.
Plant VariablesInput VariablesTrainingTesting
R2MAERMSER2MAERMSE
Aboveground Biomass(Mg ha−1)NDRE + NDVI0.610.260.340.540.260.33
All Phenom Sensor Metrics0.830.170.230.500.280.34
Phenom Metrics + Management0.700.230.300.600.240.30
Plant N ConcentrationNDRE + NDVI0.640.320.400.590.330.42
All Phenom Sensor Metrics0.820.210.280.500.380.46
Phenom Metrics + Management0.880.180.230.660.270.38
Plant N UptakeNDRE + NDVI0.5111.1314.180.4311.8014.10
All Phenom Sensor Metrics0.619.7612.590.3512.1815.01
Phenom Metrics + Management0.807.089.050.4410.8314.00
N Nutrition IndexNDRE + NDVI0.650.130.160.550.150.18
All Phenom Sensor Metrics0.850.080.110.520.150.19
Phenom Metrics + Management0.960.040.060.650.130.16
Note: Management data included drainage, tillage, and pre-plant N rate.
Table 5. XGB cross-validation hyperparameters. Mean absolute error was minimized for ABG, PNC, and NNI using built-in function and was manually tuned for PNU.
Plant VariablesInput VariablesHyperparameter Parameters
Max DepthMin Child WeightLearning Rate
Aboveground BiomassNDRE + NDVI250.10
Phenom Sensor Metrics450.05
Sensor Metrics + Management420.05
Plant N ConcentrationNDRE + NDVI310.10
All Phenom Sensor Metrics240.15
All Sensor Metrics + Management330.05
Plant N UptakeNDRE + NDVI230.05
All Phenom Sensor Metrics230.05
All Sensor Metrics + Management230.10
N Nutrition IndexNDRE + NDVI410.05
All Phenom Sensor Metrics450.05
All Sensor Metrics + Management330.15
Table 6. Corn N status diagnosis accuracy based on NNI prediction using SR and XGB regression results. Model precision was assessed using areal agreement (%) and kappa statistics (NNI < 0.95 = deficient, 0.95 < NNI < 1.05 = optimum, NNI > 1.05 surplus).
Areal Agreement (%)Kappa Statistics
Deficient
(n = 37)
Optimum
(n = 4)
Surplus
(n = 26)
Overall
(n = 67)
NDRE702523490.22
CCCI625042540.26
XGB NDVI+NDRE70050580.31
XGB All Phenom Metrics682546570.29
XGB Phenom + Management685081720.54
Publisher’s Note: MDPI stays neutral with regard to jurisdictional claims in published maps and institutional affiliations.

