Abstract
The correlations between air temperatures, relative and absolute humidity, wind, cloudiness, precipitation and number of influenza cases have been extensively studied in the past. Because, initially, COVID-19 cases were similar to influenza cases, researchers were prompted to look for similar relationships. The aim of the study is to identify the effects of changes in air temperature on the number of COVID-19 infections in Poland. The hypothesis under consideration concerns an increase in the number of COVID-19 cases as temperature decreases. The spatial heterogeneity of the relationship under study during the first year and a half of the COVID-19 pandemic in Polish counties is thus revealed.
1. Introduction
The impact of local meteorological factors on influenza morbidity has been observed in different geographical places in moderate northern latitudes. Correlations between air temperature, relative and absolute humidity, wind, cloudiness, and precipitation and the number of influenza cases have been extensively studied in various regions of the world [1,2,3]. Initially, the similarity between COVID-19 and influenza cases prompted researchers to look for similar relationships. Mainly because some viral infections that occur during the cold seasons of the year are commonly called “colds”, which emphasizes their association with low temperature [4,5]. On the other hand, the risk of infection can paradoxically be reduced when the temperature drops to very low values [5,6,7]. Worldwide epidemiological analyses have shown a significant negative (weak to moderate) correlation (R) between temperature and the number of cases (incidence), mortality, recovered cases, and active cases of the COVID-19, with statistical significance (p = 0.0001–0.0030 for a 2-tailed test) and association strengths ranging from weak to moderate (R ranging from −0.205 to −0.332) [8].
Nevertheless, numerous other studies have found either positive or negative associations of air temperature, humidity, and UV radiation with reported COVID-19 case numbers [9,10,11,12,13,14,15]. Many of these studies were limited by short observation periods, either taking into account varying reporting biases, or failure related to the time lag between observed weather conditions and the acquired data reports concerning cases of infections and death. The reported observations were confirmed by laboratory evidence on the stability of SARS-CoV-2 as a function of temperature and humidity, proving that the virus’s half-life in human nasal mucus and sputum is shorter under higher temperature conditions and relative humidity than under conditions of lower temperature and relative humidity [9]. Moreover, during winter people spend more time indoors, which may make the virus act unpredictably (either as isolation or growing factor, which reduces or raises the number of infections). Some reports demonstrated that air temperature and relative humidity had a linear statistical relationship with the number of COVID-19 infections in different geographical regions in India [16]. On the other hand, a review of numerous published studies suggested that temperature is a driver of COVID-19 transmission intensification, but not necessarily the only one [17,18]. Some scientists anticipated that a warmer climate would not have any protective impact on current susceptibility to the virus, for example, in sub-Saharan Africa population centers [19]. There are also scientific papers, in which the results presented a correlation between the spread of droplets, and temperature because respiratory viruses survive better from cold to dry weather [20]. The seasonality similarity of COVID-19 to other human coronaviruses and influenza let to assume hypothesis with a peak during winter months because of lower temperature, lower absolute humidity, and lower indoor relative humidity [18]. However, mixed evidence is available regarding the effect of changes in temperature on the number of cases of SARS-CoV-2 infections [21]. Several papers reported an association between an increase in temperature and a decrease in newly infected COVID-19 cases [10,12,18,22,23,24,25,26]. The opposite relation has also been reported [26,27], as well as there being no relations at all [28,29,30,31]. Steiger [21] showed that weather, especially temperature (which has a reducing effect on case numbers) and rainfall (which increases case numbers) affects the reported number of SARS-CoV-2 infections.
This study aimed to investigate the spatial patterns of COVID-19 cases (SARS-CoV-2 infected, fatal, and recovered) and the effects of climate and bioclimate on observed changes in infected cases at the state and county levels in Poland. We hypothesized that with the increasing values of (1) air temperature, (2) dew point temperature, (3) ultraviolet radiation, (4) mean radiant temperature, and (5) Universal Thermal Climate Index, the COVID-19 growth rates decrease. This also prompts a hypothesis for pandemic seasonality and the recurrence of pandemic waves.
2. Materials and Methods
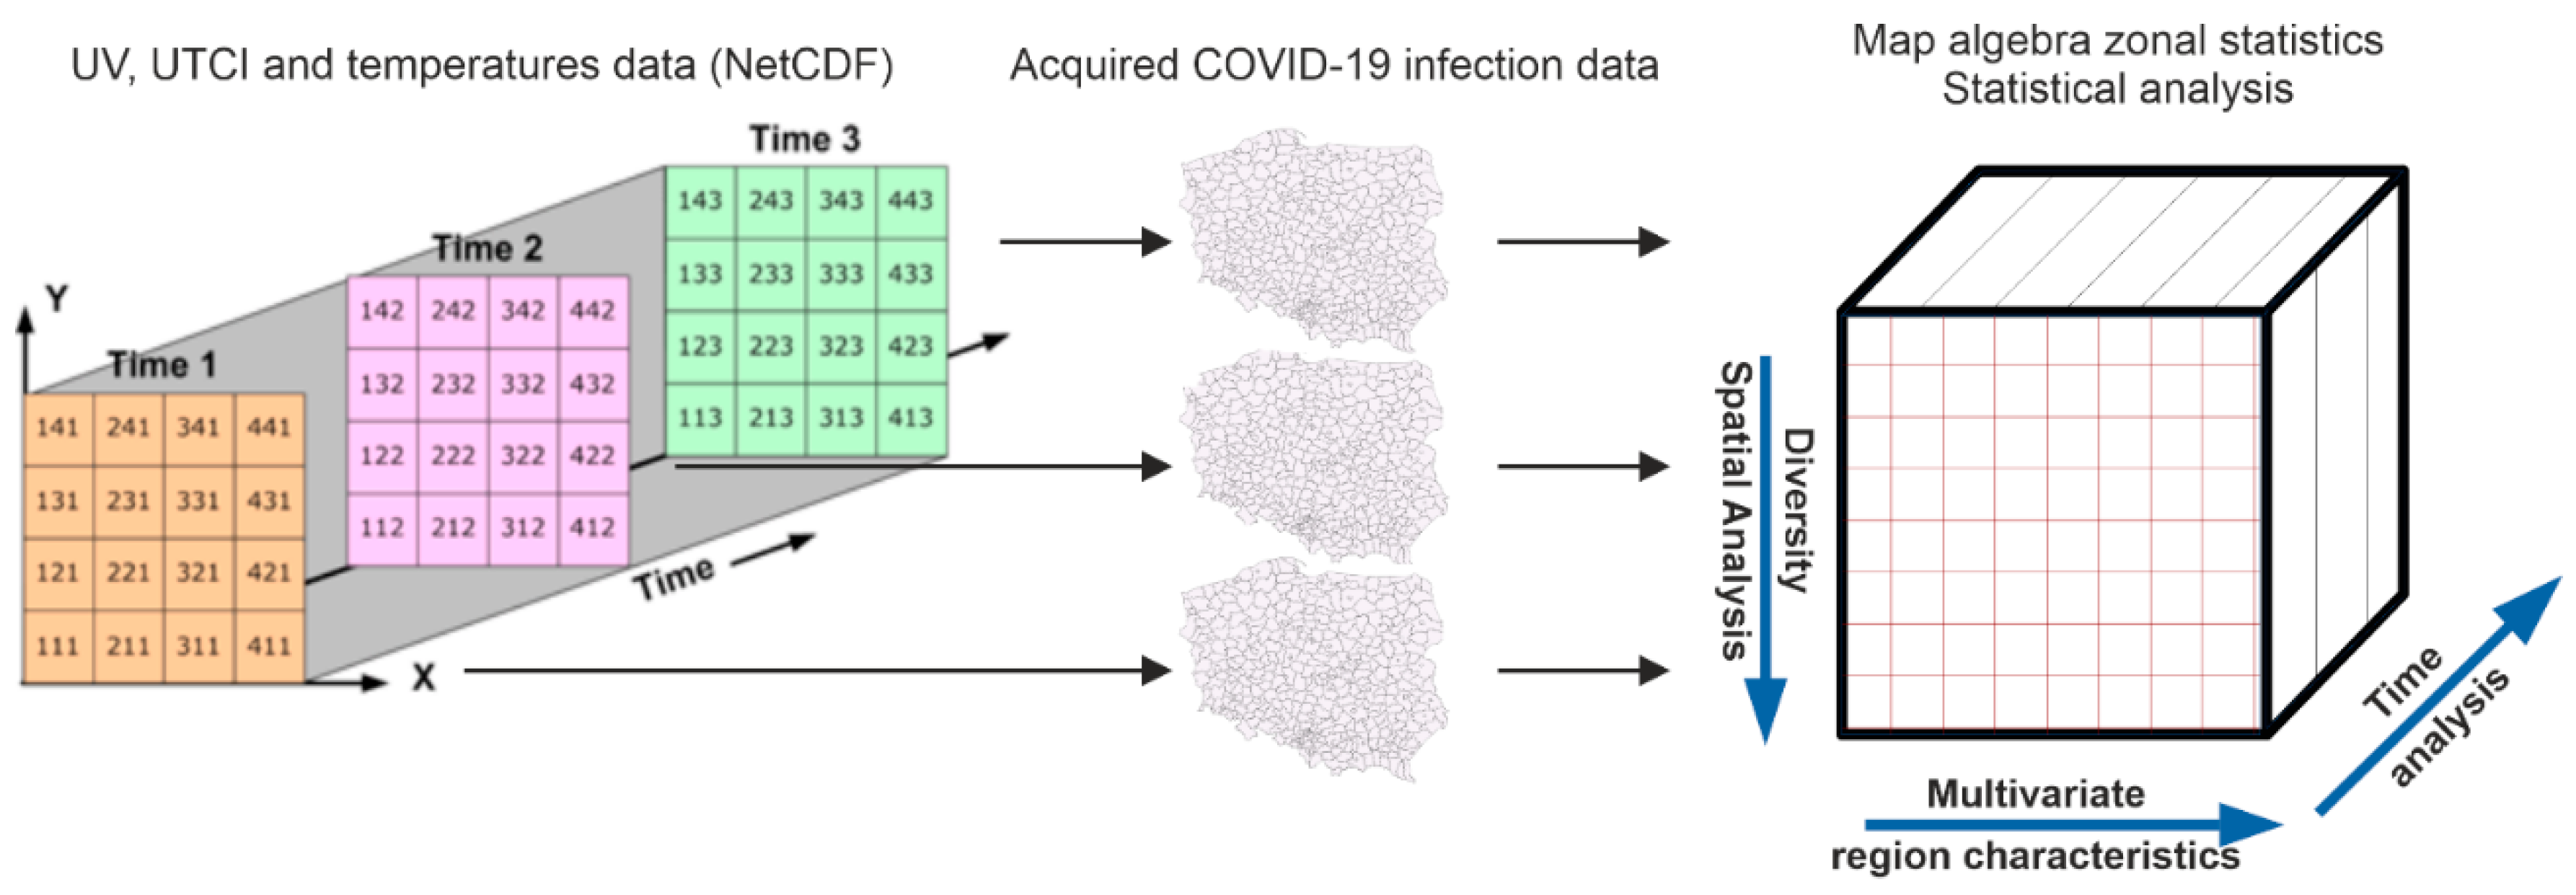
The spatial units used in the study were the set of 380 Polish counties (powiat, the second-level unit of local government and administration, and NUTS-4 in the EU’s Nomenclature of Territorial Units for Statistics). This is the most detailed level for regular daily reports on COVID-19 cases officially published in Poland. All the daily COVID-19 cases (infected, fatal, and recovered) were aggregated into the weekly totals, retaining their spatial division. The observation period covered the 65 weeks from March 2020 till July 2021. There is a data gap only from the end of November to mid-December 2020 (weeks 42–47) when counties lacked reported data. The main approach to spatial and time study is shown in Figure 1.

Figure 1.
The study approach to the weekly relationships between COVID-19 cases and certain meteorological parameters (March 2020–July 2021).
The progress of the COVID-19 pandemic in Poland is described in Section 3. Two enormous waves of COVID-19 pandemic are revealed; the first: from October 2020 to December 2020, and the second: from March 2021 to April 2021. Data at the national level were additionally acquired using the CovsirPhy Python library and a dedicated application (Python script). The application used downloaded data from the COVID-19 Data Hub [32,33,34]. A cross-check of the data was validated using officially published data from the Polish Ministry of Health [35]. All daily reported data concerning the number of COVID-19 cases—SARS-CoV-2 infections cases, failed cases (deaths), and recovered—were aggregated into weeks.
The meteorological and biometeorological parameters were obtained from the ECMWF ERA5 and ERA5-HEAT reanalyzes [36,37]. The reanalyzes are hosted at the Climate Data Store (CDS: https://cds.climate.copernicus.eu/, access: 20 July 2021), implemented by the European Centre for Medium-Range Weather Forecasts (ECMWF) as part of the Copernicus Climate Change Service (C3S). The data are currently available from 1979 (but will be pushed back to 1950) to the present with a frequency of up to 1 h and a spatial resolution of 0.25° × 0.25° (approximately 28 km × 28 km). The data are stored in GRIB (GRIdded Binary) format, a World Meteorological Organization (WMO) standard for the storage and distribution of gridded data.
The variables used in the study were 2 m air temperature (Ta), 2 m dew point temperature (Td), downward UV radiation at the surface (UV), mean radiant temperature (MRT), and Universal Thermal Climate Index (UTCI) were used. The MRT is defined as the “uniform temperature of a fictive black-body radiation enclosure (emission coefficient ε = 1) which would result in the same net radiation energy exchange with the subject as the actual, more complex radiation environment” [38] for an individual placed in a given environment in a given position and clothing. It is converted into a temperature using the Stefan–Boltzmann Law.
where: Tmrt [°C], Sstr—absorbed flux density, δ—the Stefan-Boltzmann constant, and εp—emissivity of the clothed human body [38]. MRT is widely applied in various disciplines, from engineering, urban studies, and climate change to physiology and public health [39]. In biometeorology, it is an input variable for thermal comfort and stress indices, parallel to UTCI, which is also used in this study. The UTCI is defined as the reference condition’s air temperature (Ta) that causes the same model response as actual conditions. The deviation of UTCI from the air temperature depends on the actual values of the air temperature, MRT, wind speed and humidity [40]. Weekly means of all variables were calculated using the ISO 8601 calendar (from the tenth week of 2020 to the thirtieth week of 2021).
The steps taken in preparing the data involved the recalculation of input data (divided into weeks) to convert all the temperature data layers for Poland, expressed in Kelvin, into Celsius degrees. Next, using the zonal statistics function in GIS software, all raster weekly temperature data (in degrees Celsius) were aggregated into the attribute tables using a template for a vector map of Polish counties, cutting off the data outside the state’s boundaries. The general approach to the data analysis involved comparing of the number of infected people, aggregated by weeks and by county in Poland (from week 10 of 2020 to week 30 of 2021), with the maximum, mean, and minimum temperatures and volumes of radiation observed (see Section 4). Additionally, the studied relationships were evaluated spatially over the observed time period, calculating values for the Pearson’s correlation coefficient separately for each county over time (see Section 5).
The main approach to the spatial and temporal study is presented in Figure 1. In the first stage, the general approach involved the general analysis of the summarized and mean values figures for the whole of Poland, and, later, grouped into weeks and counties, aimed to identify the most correlated independent meteorological variable suspected of having an impact on the rise in the number of infections. The second, detailed stage of the analysis a concerned the spatial and temporal analysis of the selected relationships. Pearson’s correlation coefficients (R) and significance, checked using 2-tailed p-values over time, were computed using SPSS (Statistical Package for the Social Sciences). The GeoDa package was used for spatial analyses.
The steps in the study involved the following: (i) an analysis of the general statistics for the whole of Poland concerning COVID-19 and meteorological factors (aimed at identifying any significant effects of meteorological conditions on COVID-19 cases); and (ii) a detailed spatial and temporal statistical analysis of the selected meteorological factors, including the map algebra zonal statistics tools, which enabled these data to be linked with COVID-19 infections in the form of data cube attributes grouped into weeks and counties, and cartographical presentations over time. Map algebra is an appellation for a collection of tools introduced at the end of the twentieth century [41] for raster processing on several collections of images. Map algebra tools processing can be used for physical [42] and social-economical [43] studies for various spatial sizes in order to create local, focal, neighborhood, zonal, or global statistics [44].
Next, the spatial diversity of the relationship between the number of infections and the mean radiant temperatures were examined as a Bivariate Local Moran I (Index) by selecting particular, certain weeks when the number of infections rose globally in Poland, i.e., the peaks of COVID-19 pandemic waves. These analyses aimed to distinguish four types of regions (counties) in which spatial lags between mean radiant temperatures and infections occurred in certain weeks (High-High, Low-Low, High-Low, Low-High) and their spatial heterogeneity.
The set of computer tools and computer applications used in the study involved GIS (ArcGIS, QGIS, and GeoDa), Python scripts (aimed transformation of meteorological data), and statistical software (SPSS).
3. The COVID-19 Pandemic in Poland
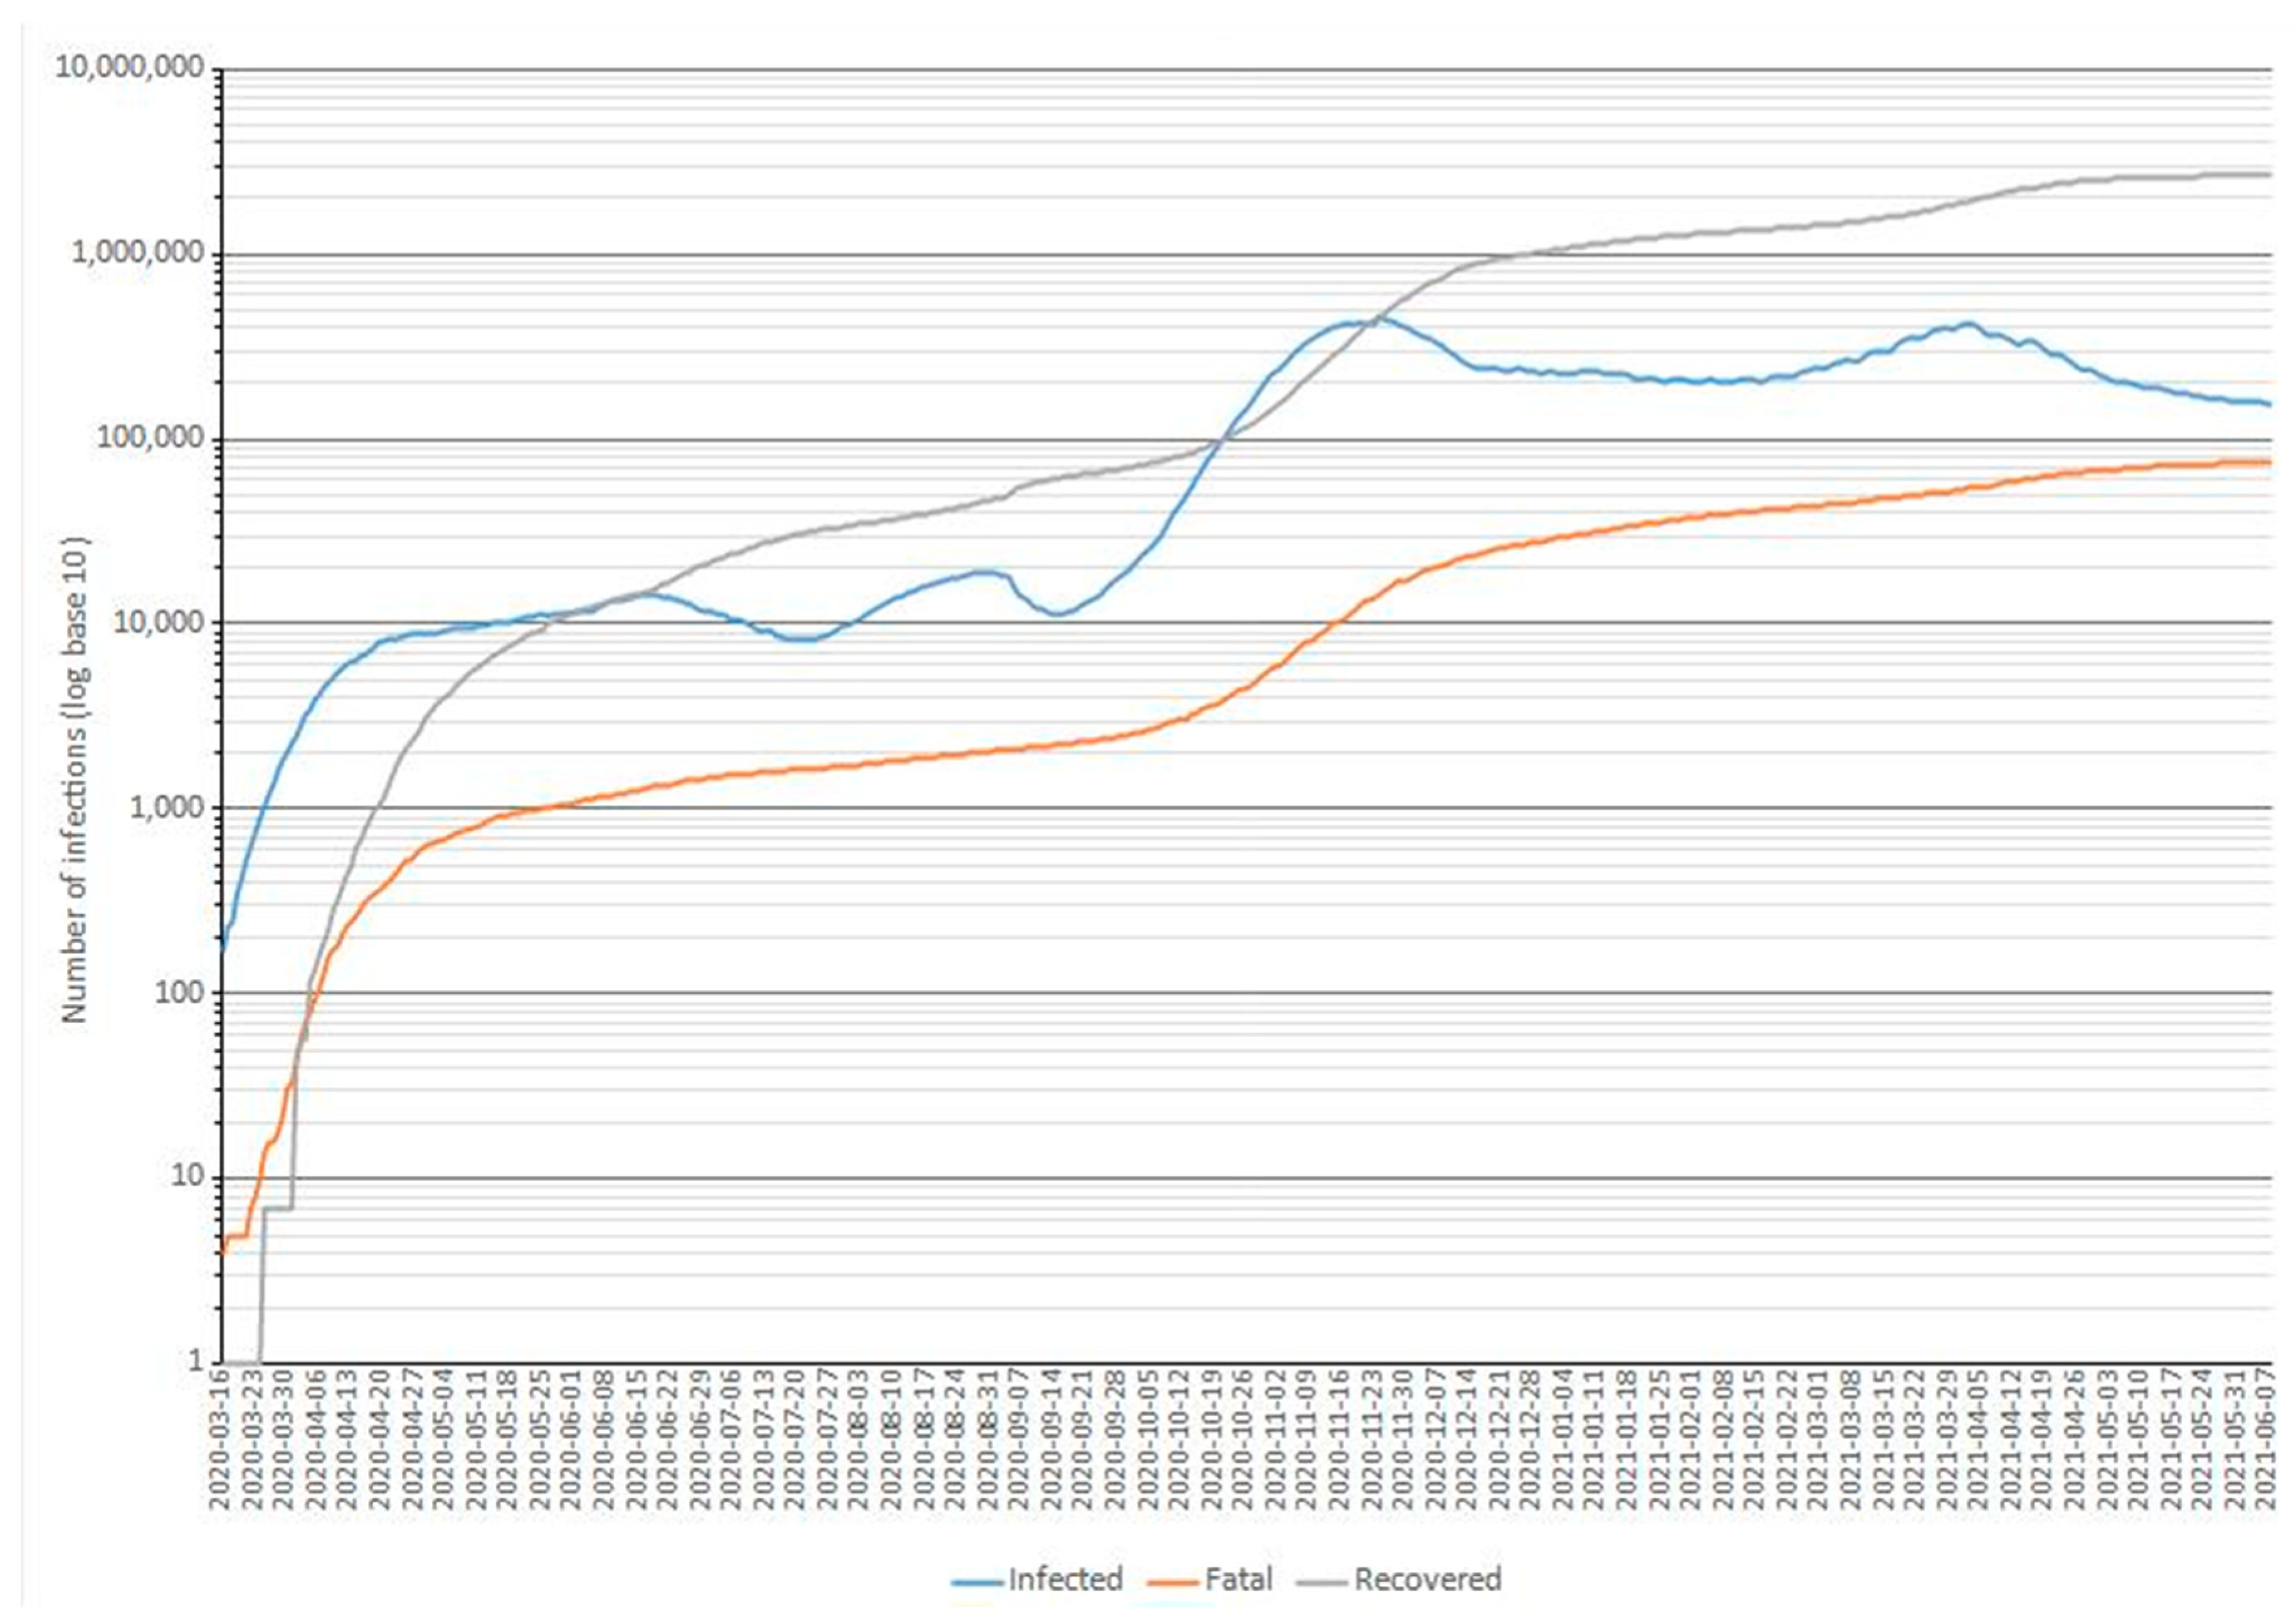
The first infection was reported on 4 March 2020. Two early moderate waves (at the beginning of 2020 when compared to later ones) were reported, followed by two main significant waves of infections, one in autumn 2020 and the other in spring 2021 (Figure 1 and Figure 2); this despite the efforts of national healthcare services, including regional and national lockdowns, organizing both a stationary and field hospital network, and starting the vaccination of the population from January 2021. The progress of the COVID-19 pandemic in Poland is presented in Figure 2 and Figure 3.
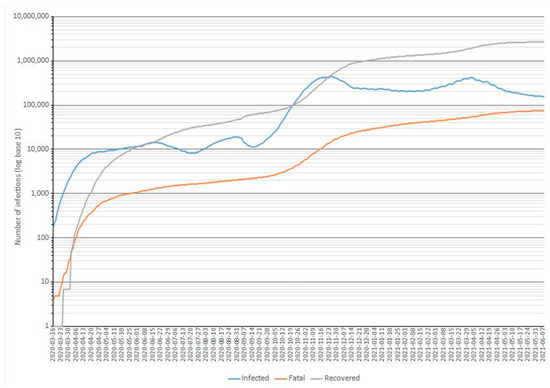
Figure 2.
Poland, COVID-19 cases over time with monotonic increasing complemented recovered data (as of 4 June 2021, results: CovsirPhy Python Application).

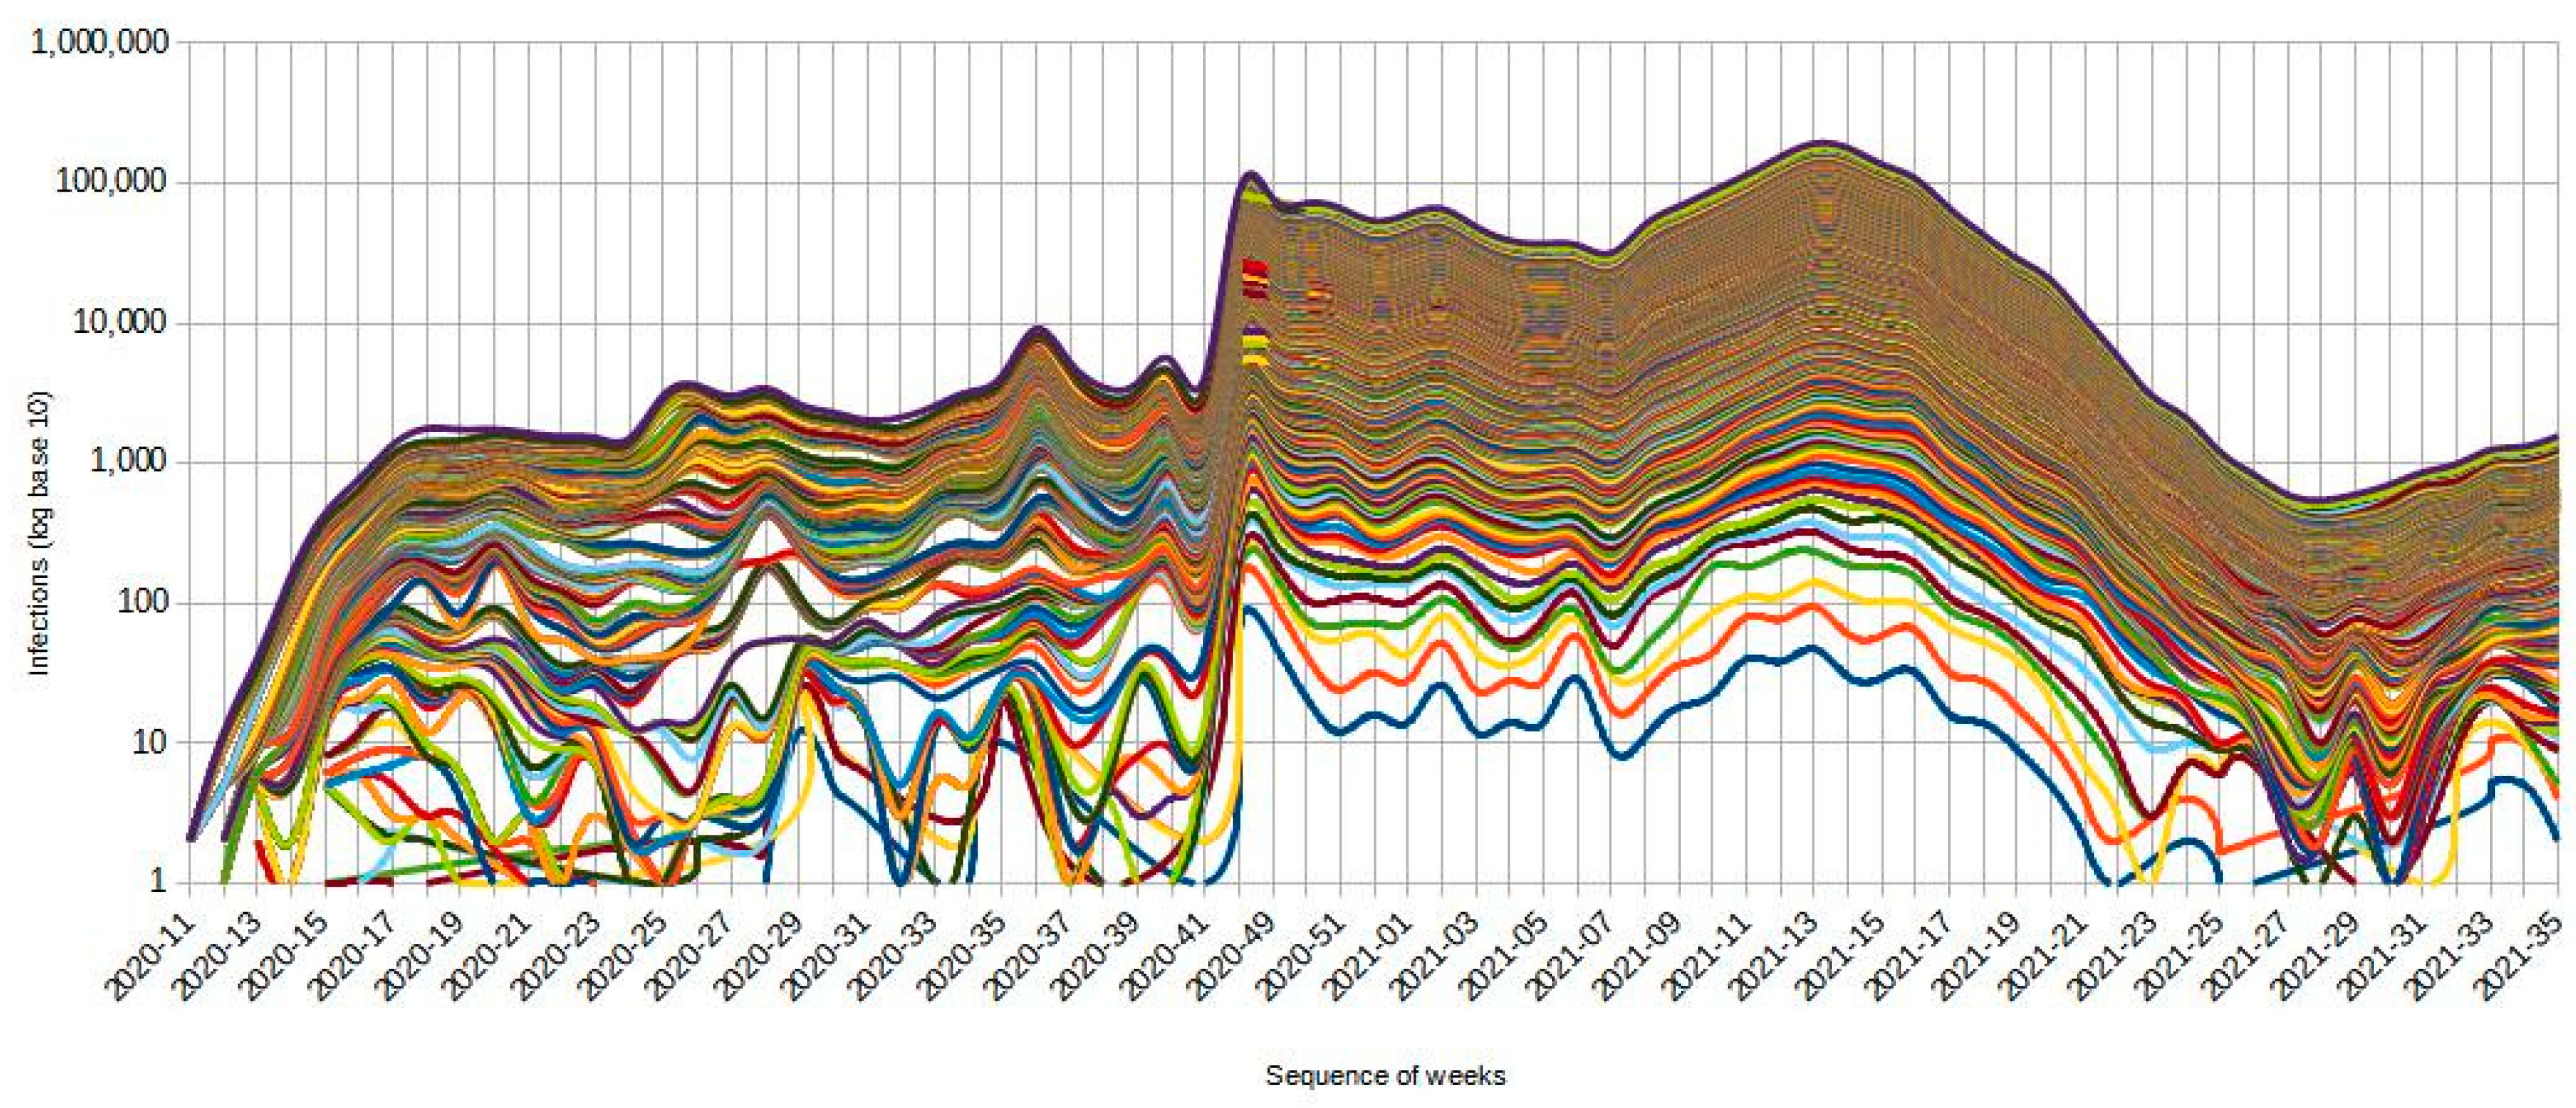
Figure 3.
Stacked, cumulative number of infections by county in Poland per week (from March 2020 to July 2021); data source: Ministry of Health, Poland (counties identified by statistical numbers, four-digit TERYT string [35]).
4. Climatic and Bioclimatic Conditions in Poland
According to the Köppen–Geiger climate classification, almost the whole territory of Poland is classified as having a humid continental climate with warm summers (Dfb) [45]. Only a small area in the high mountains (on the southern and southwestern borders) is classified as having a subarctic climate (Dfc).
4.1. Temperatures
According to the 2020 annual report by the Institute of Meteorology and Water Management—National Research Institute thermal conditions for all months (except May and July 2020) may be classified as at least slightly warm across all physiogeographic regions of Poland. February and August were extremely warm months almost everywhere, May was extremely cool, and July was thermally normal in comparison to the empirical distribution of average temperatures for particular months, seasons, and years since from 1981 to 2010 (Table 1).

Table 1.
Global average monthly air temperatures anomalies (1981–2010), and classification of thermal conditions in Poland by month in 2020 (source: Institute of Meteorology and Water Management, National Research Institute, 2021) [46].
Detailed monthly temperatures over the observed time were obtained by estimating mean temperatures based on values of (weekly) raster layers acquired from the Climate Date Store (NetCDF format), estimating the spatial extent of Poland’s state boundaries with wider margins (west longitude = 13°00′E; north latitude = 55°54′5″N; east longitude = 25°00′E south latitude = 48°05′5″N).
The meteorological (temperature) variables taken into account in the study hereafter are the near surface air temperature (nsat) and the dew point temperature (dpt). The biometeorological parameter taken as the variable is the mean radiant temperature (MRT).
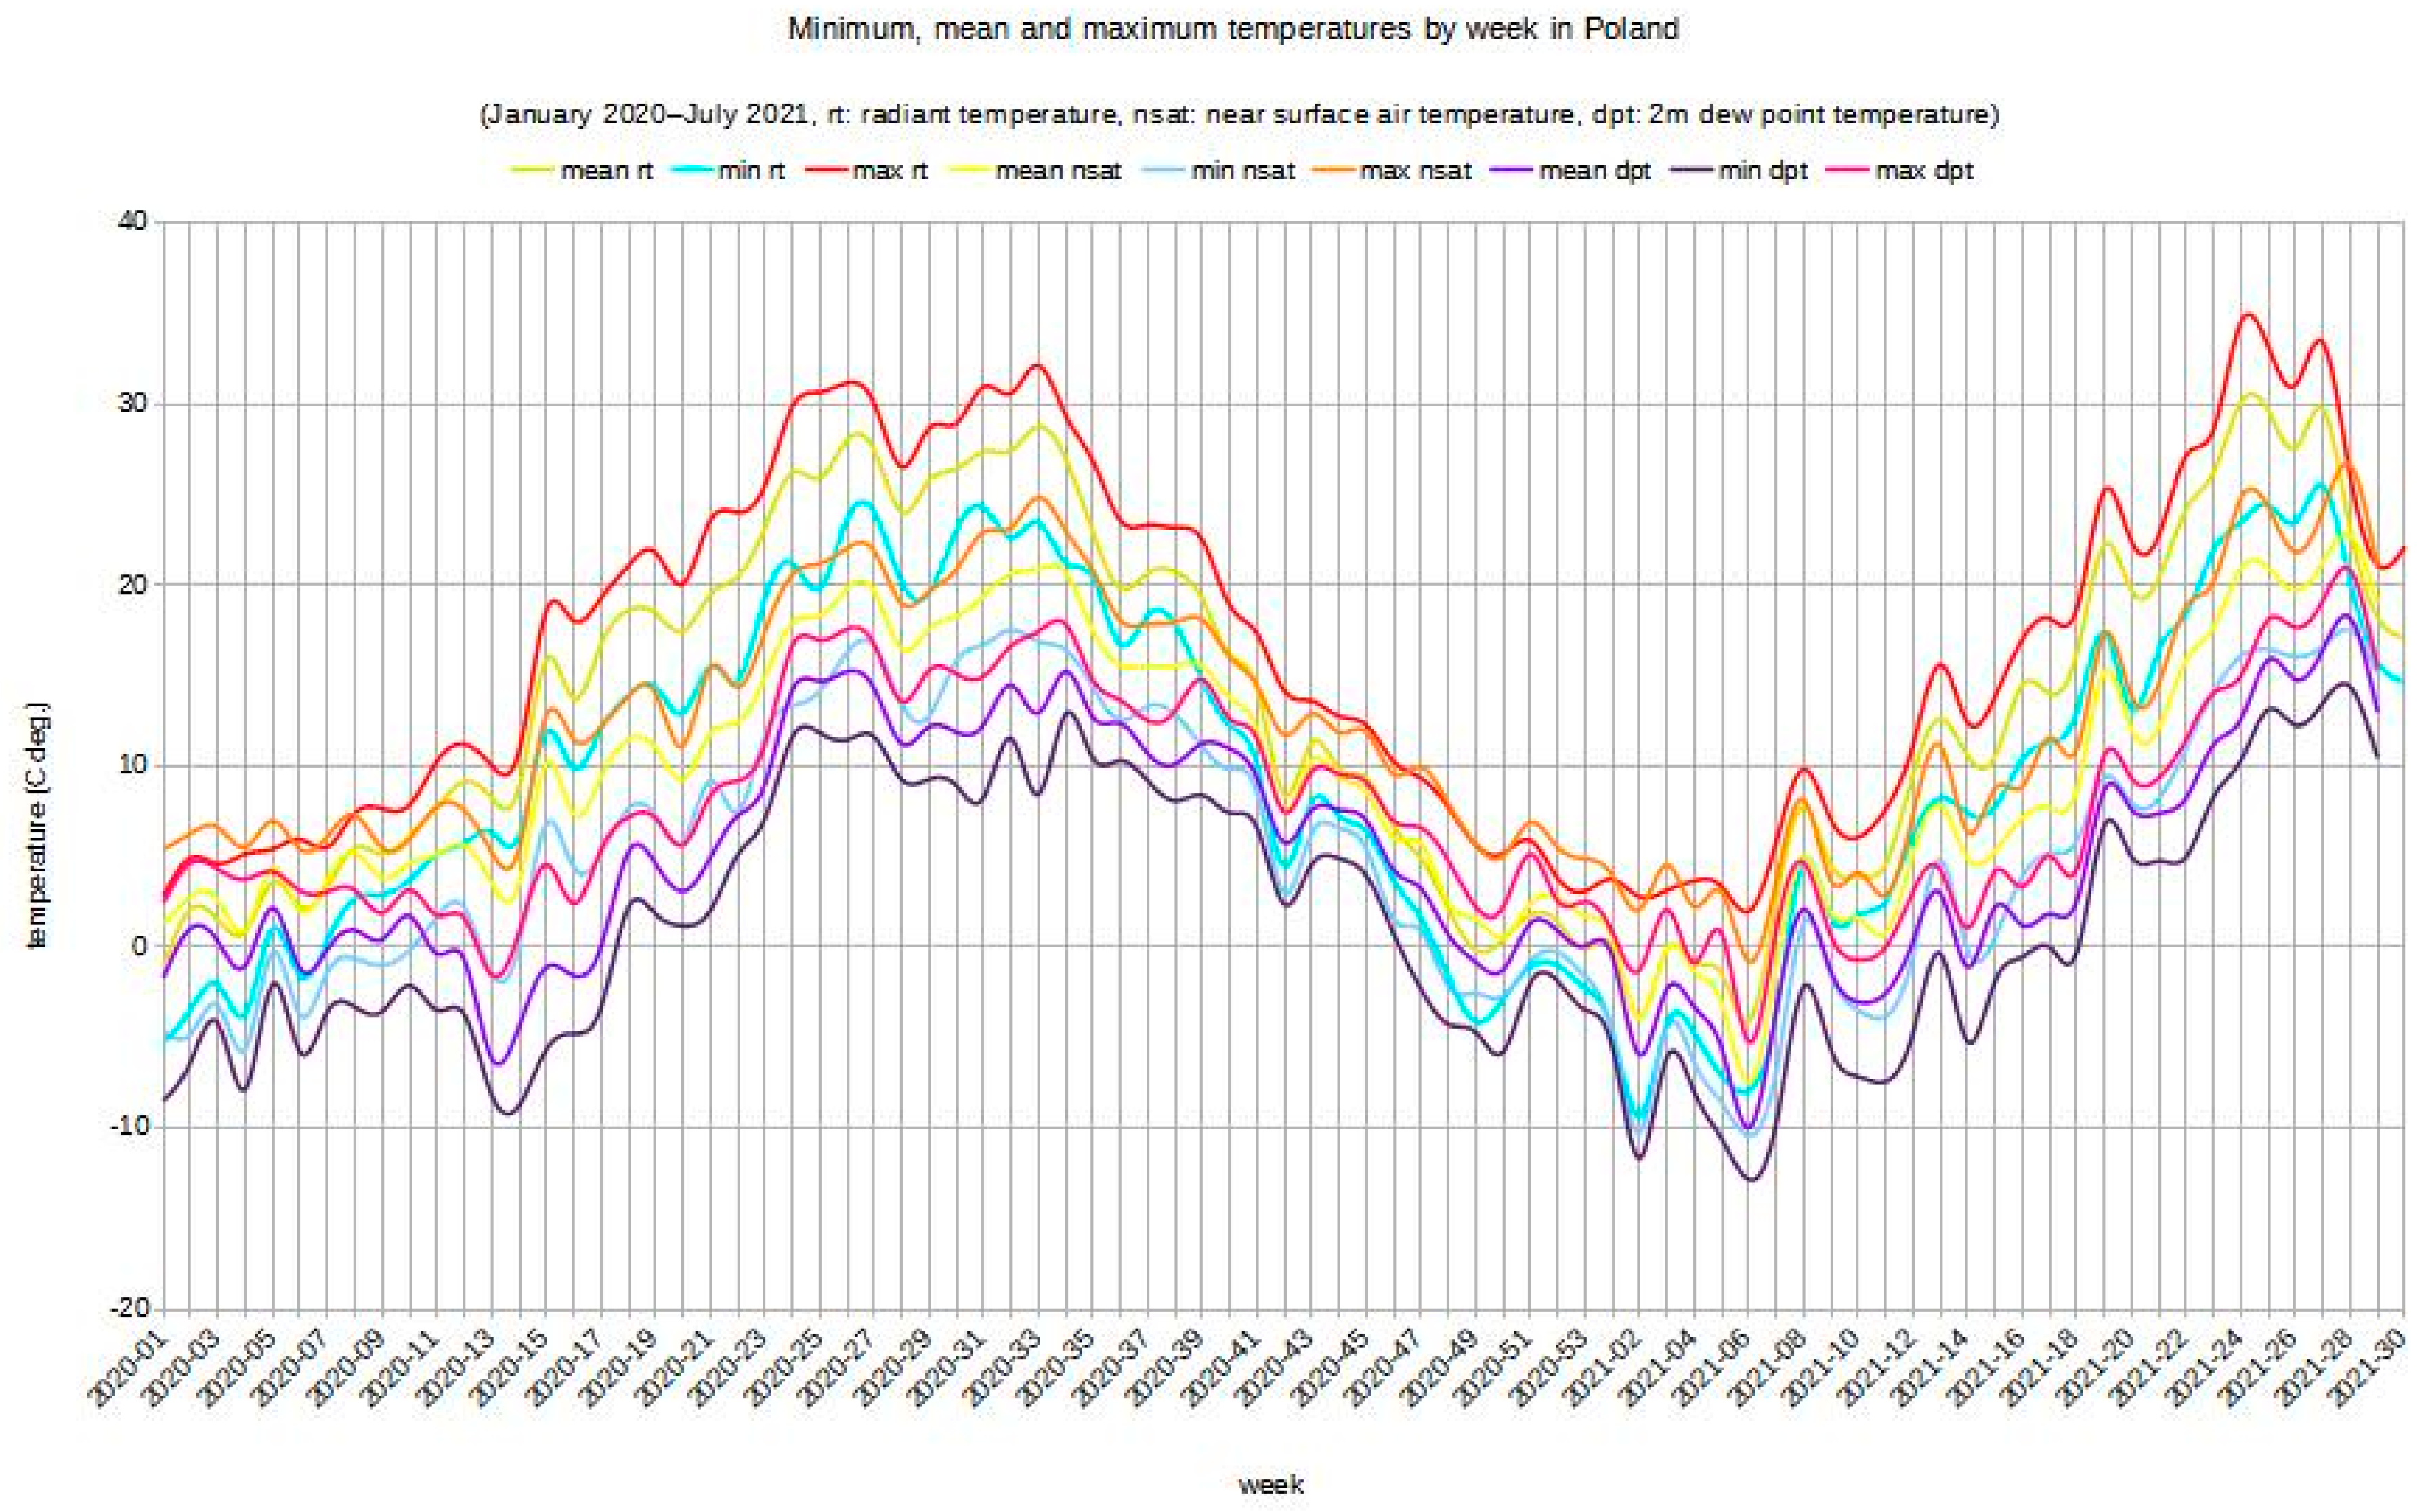
The range of the weekly minimum, mean, and maximum values for 2 m air temperature (nsat), 2 m dew point temperature (dpt), and mean radiant temperature (rt) over the observed time, globally in Poland, are presented in Figure 4. The weekly minimum, mean and maximum values reflected typical seasonality for temperate latitudes.
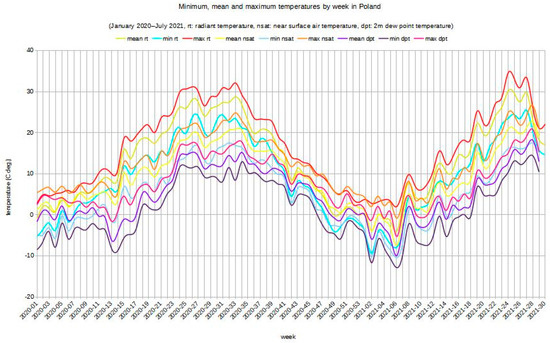
Figure 4.
Weekly minimum, mean, and maximum temperatures in Poland (January 2020–July 2021) [°C]; descriptions: rt–radiant temperatures (MRT); nsat–2 m near surface air temperatures; dpt–2 m dew point temperatures.
These data have been recurrently and iteratively grouped by county using the (GIS) zonal statistics tool with a zone (template) map of Polish counties. The results were a set of mean temperatures by county and by week over the observed period. These data were confronted with the number of SARS-CoV-2 infected cases grouped by county and by week.
4.2. UV Radiation at the Surface
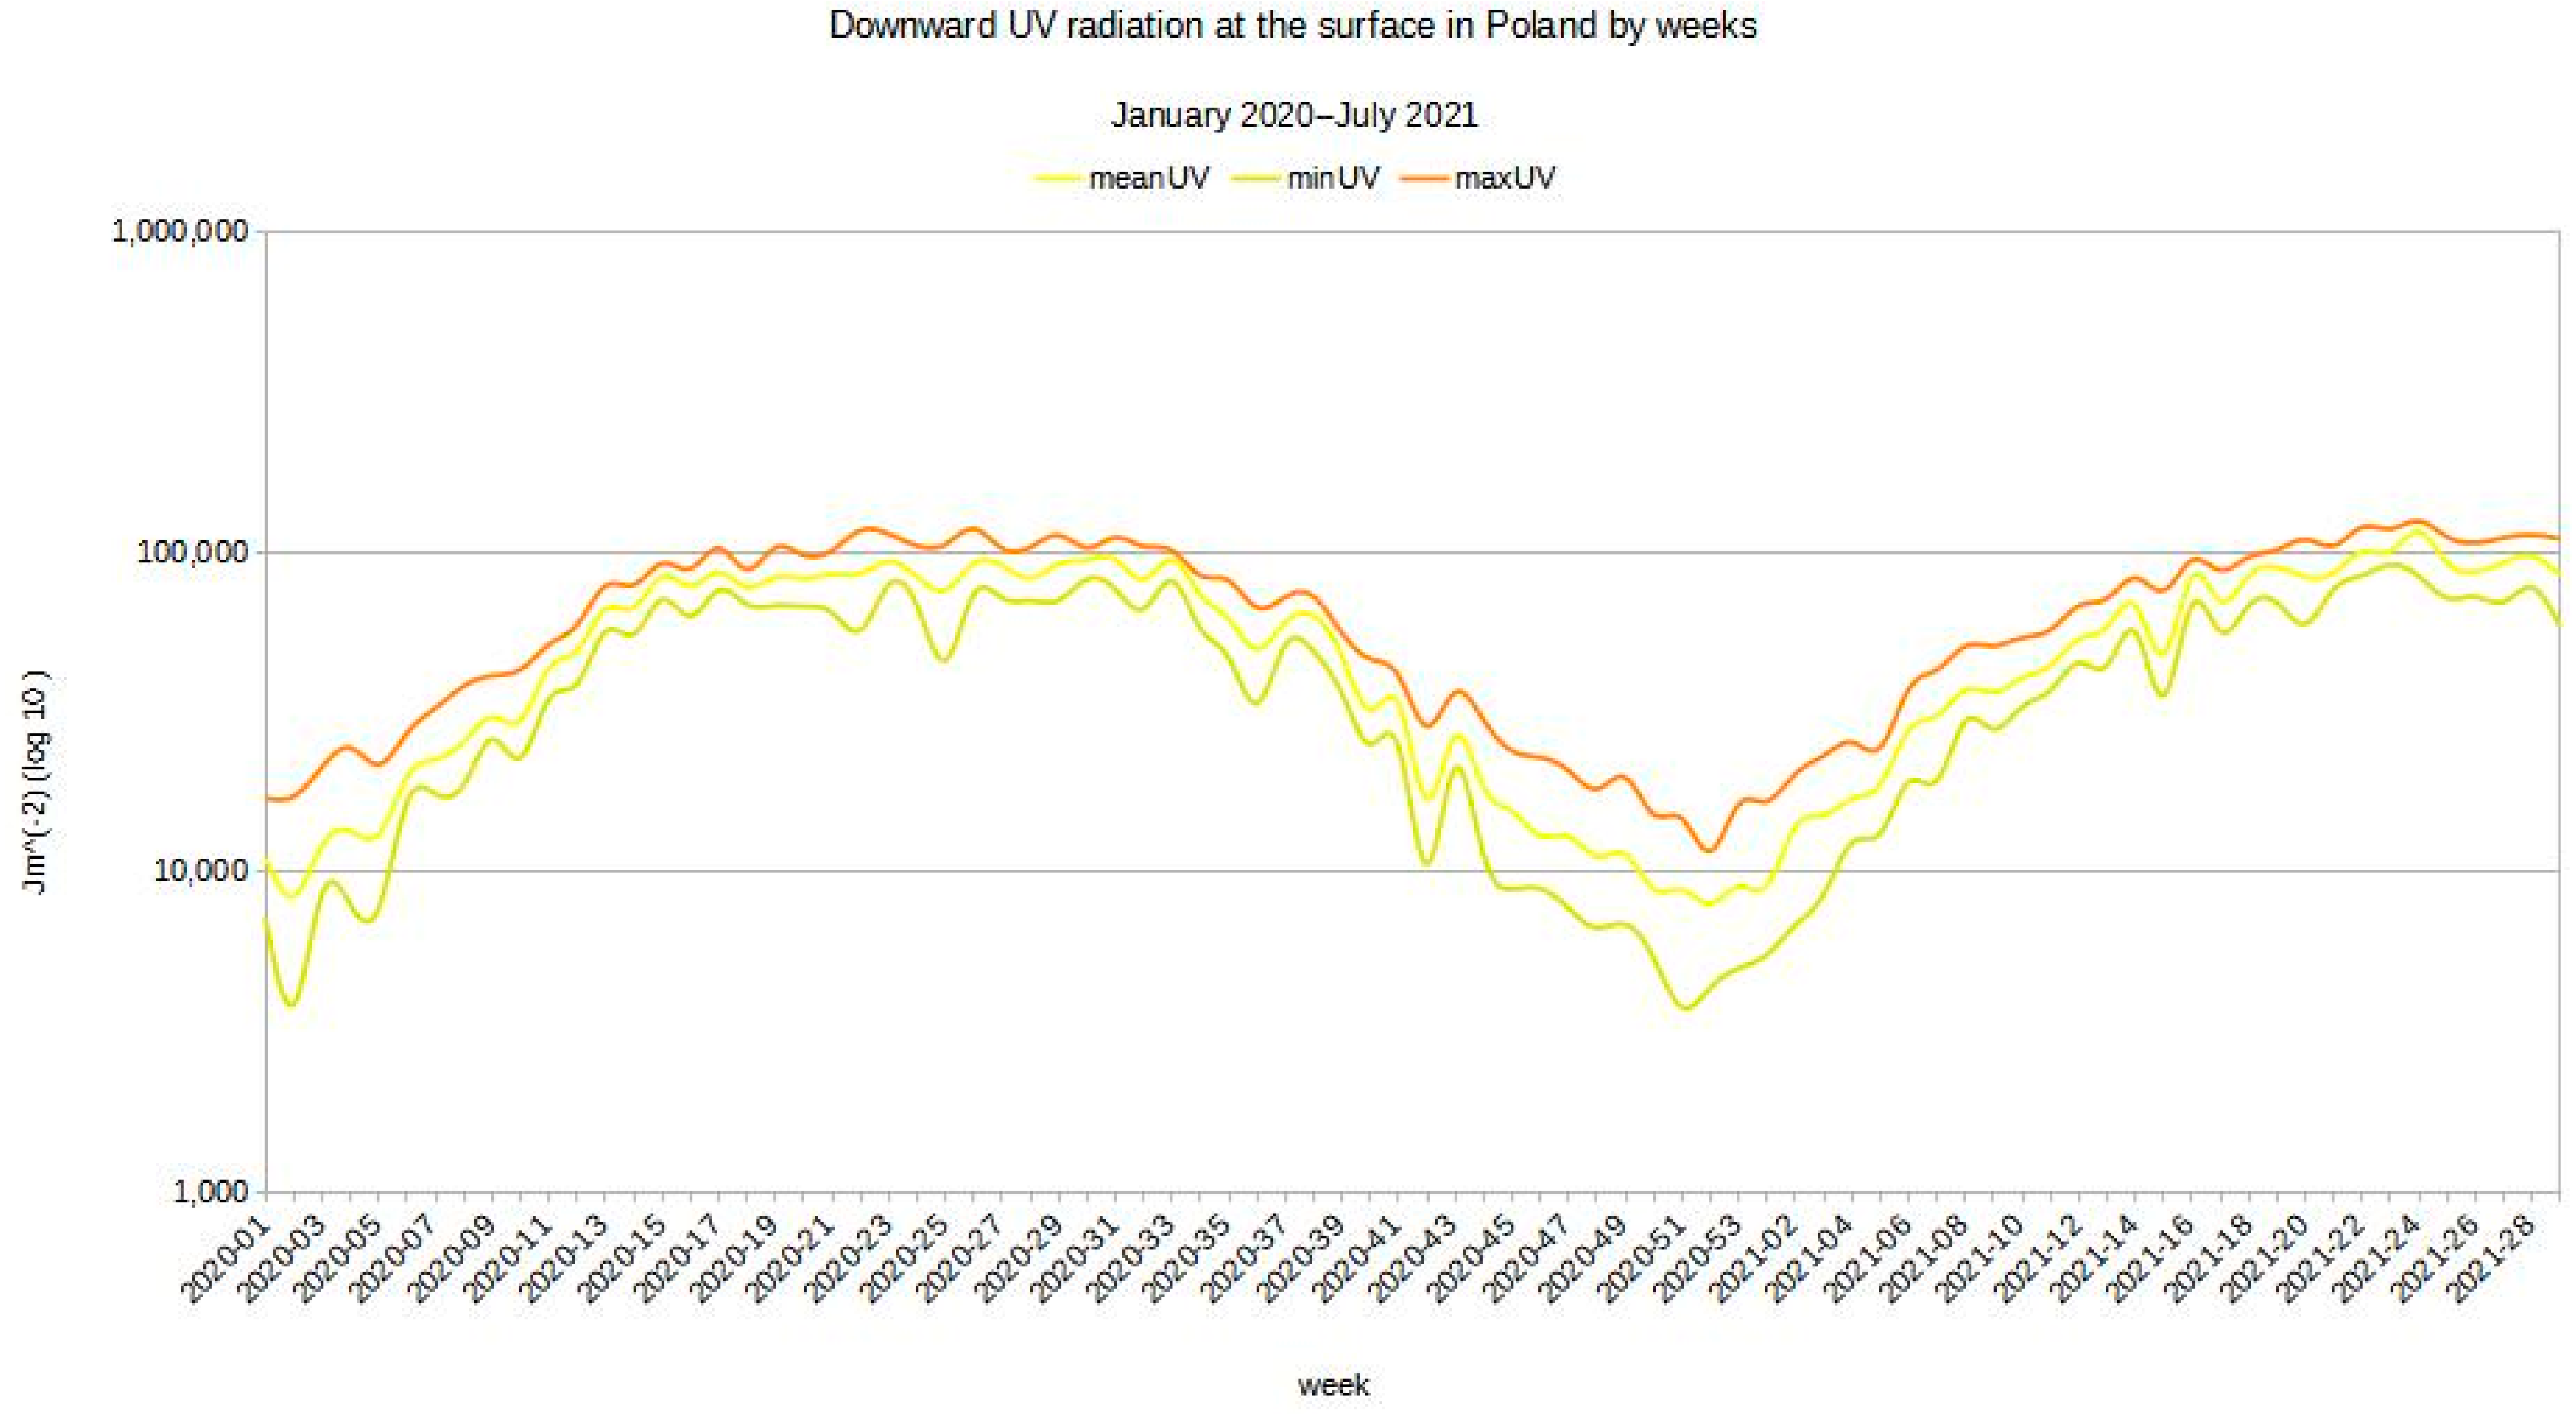
The range of the weekly minimum, mean, and maximum values for the volume of ultraviolet radiation (J per sq. m) over the observed time, globally in Poland, are presented in Figure 5. UV radiation was taken into account in the study due to its above-indicated importance in the literature and its potential impact on diminishing the spread of coronavirus SARS-CoV-2. UV minimum, mean, and maximum values gradually increase from winter to summer with the inverse occurring from summer to winter.
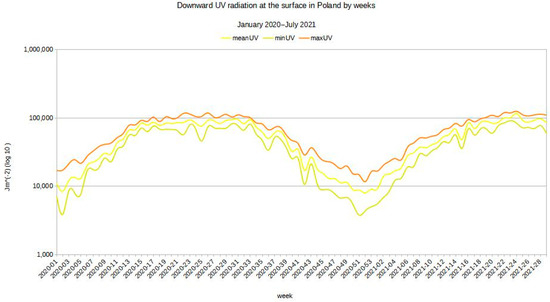
Figure 5.
Downward ultraviolet radiation at the surface (UV) [J/m−2]: weekly minimum (min), mean, and maximum (max) values in Poland (January 2020–July 2021).
4.3. Universal Thermal Climate Index
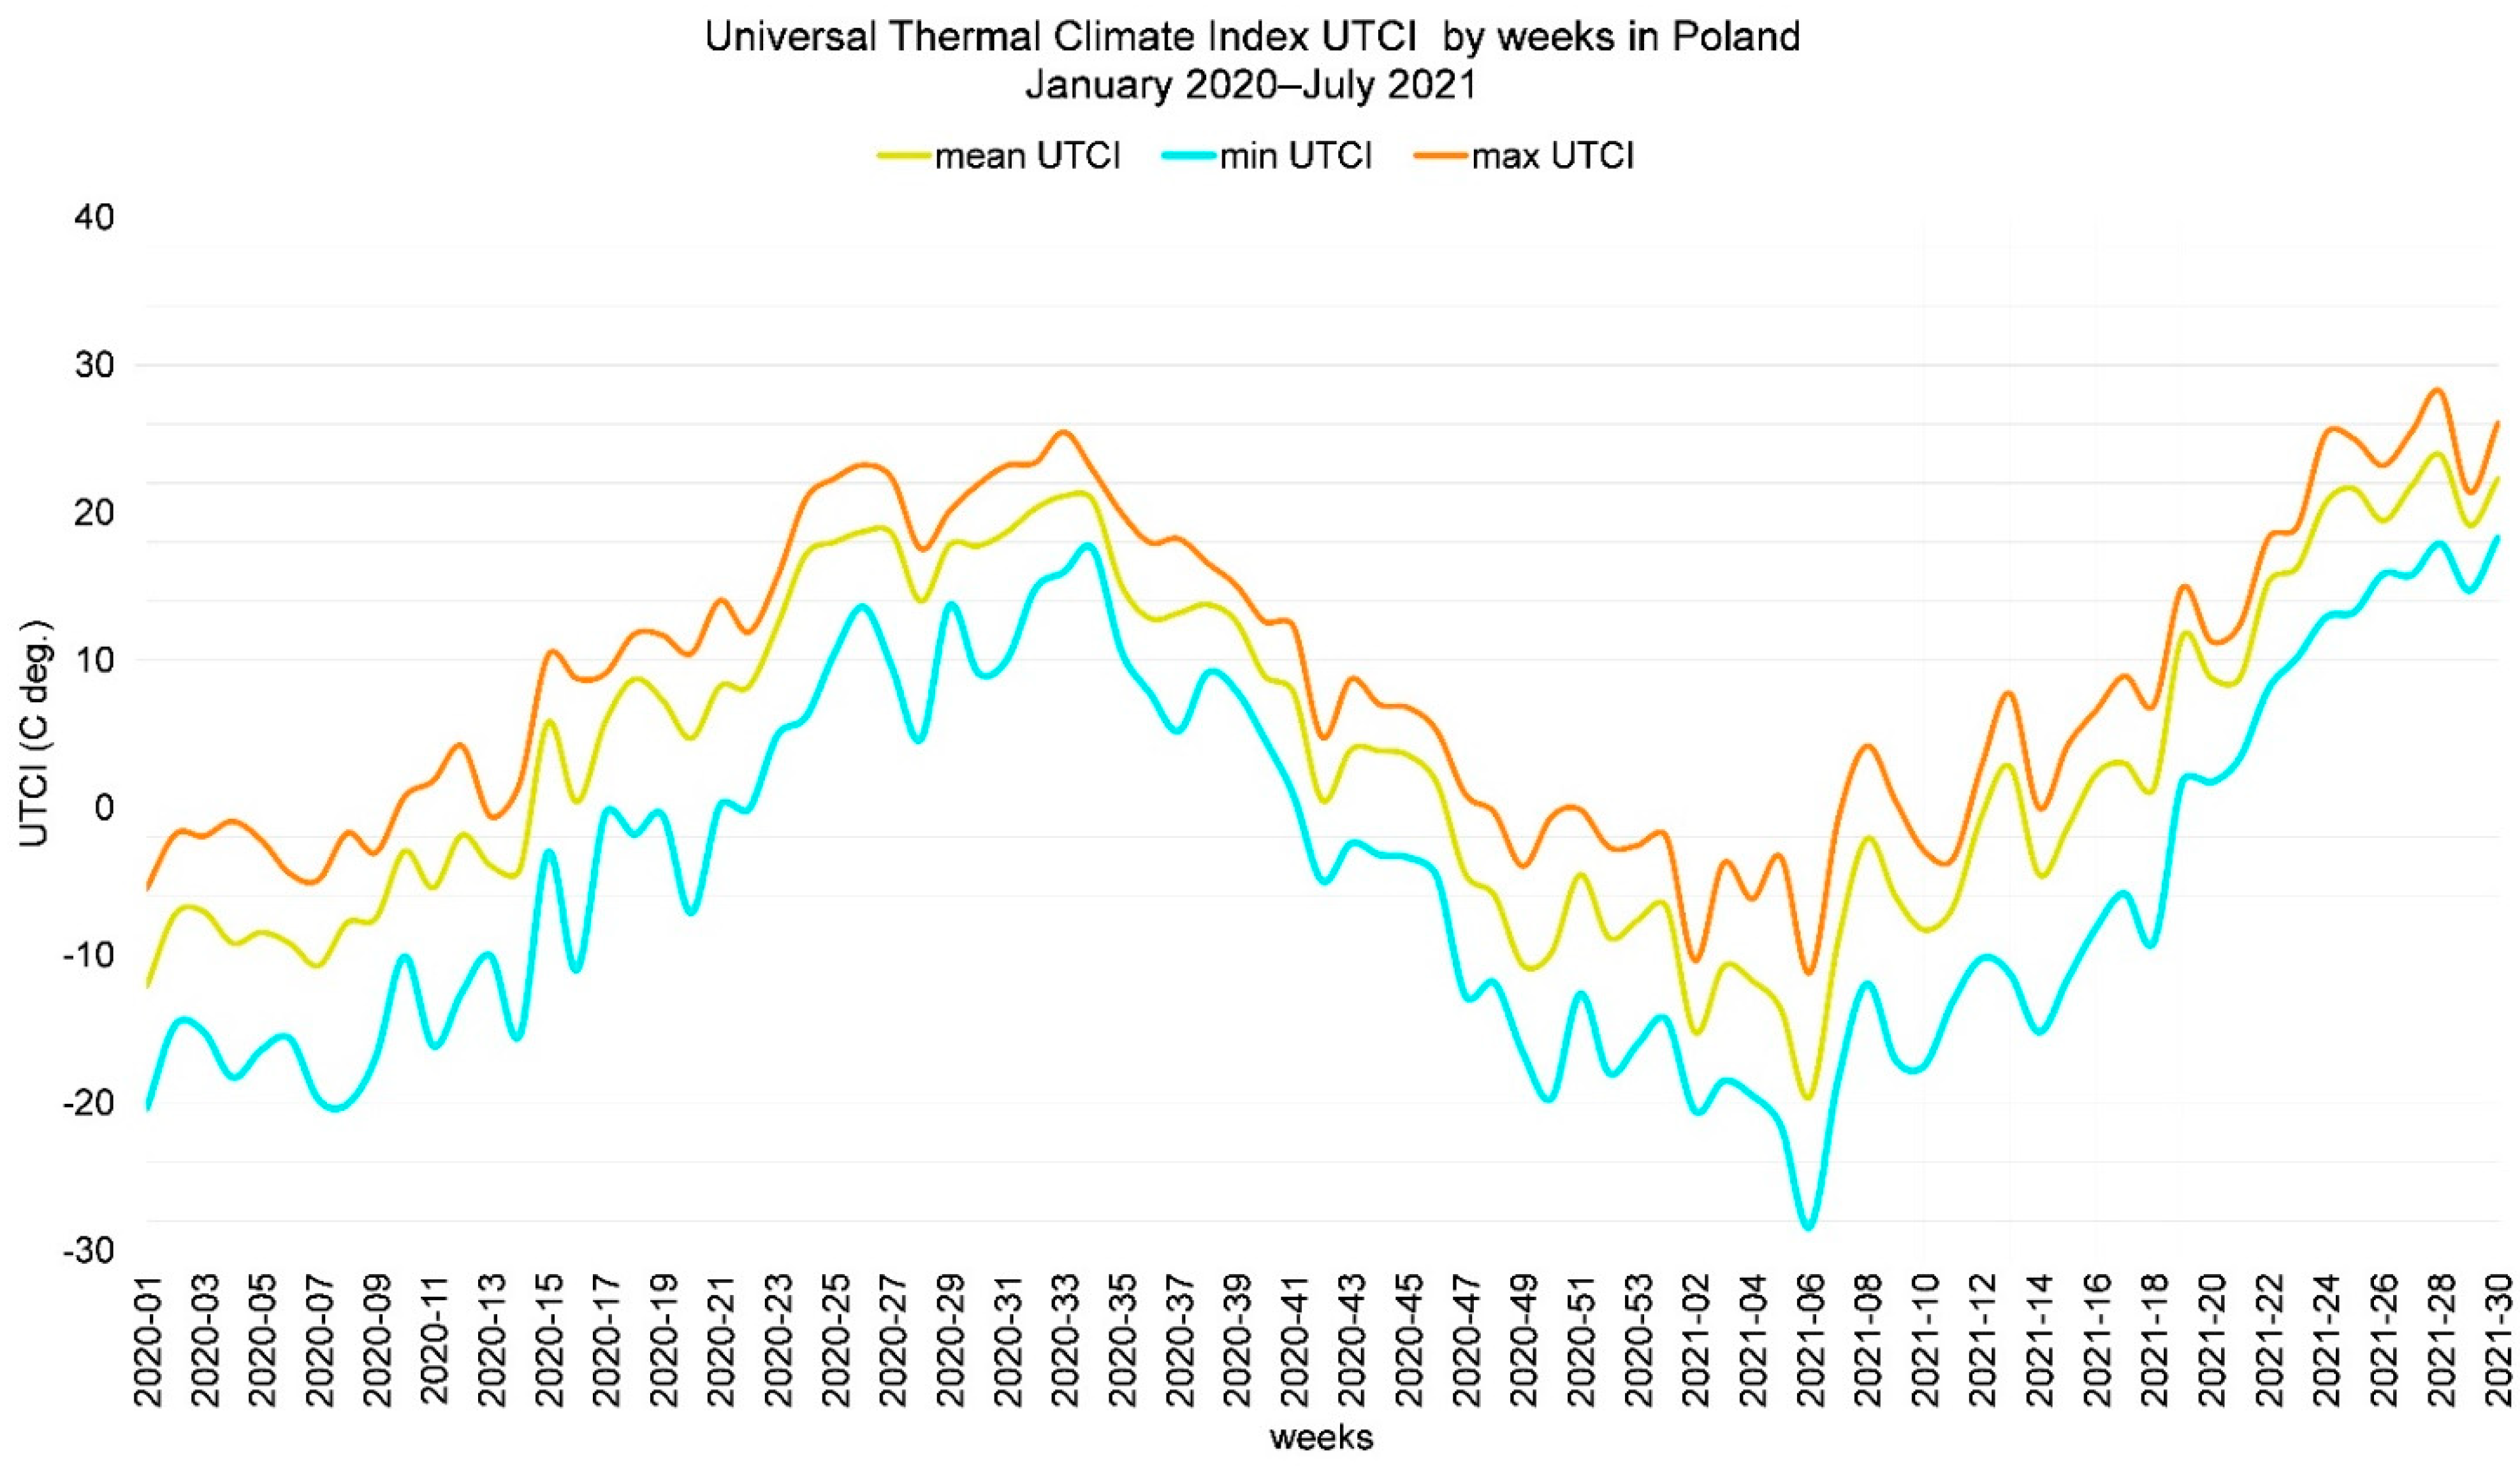
The only composite measure—UTCI—was also examined because it is one of the primary bioclimatological indicators. Due to the possibility of not being able to determine if a single meteorological factor influences the spread of coronavirus SARS-CoV-2, this complex measure also should be studied. The range of the weekly, minimum, mean, and maximum values for UTCI over the observed time, globally in Poland, are presented in Figure 6.

Figure 6.
Universal Thermal Climate Index (UTCI) [°C]: weekly minimum (min), mean, and maximum (max) values in Poland (January 2020–July 2021).
5. General Approach
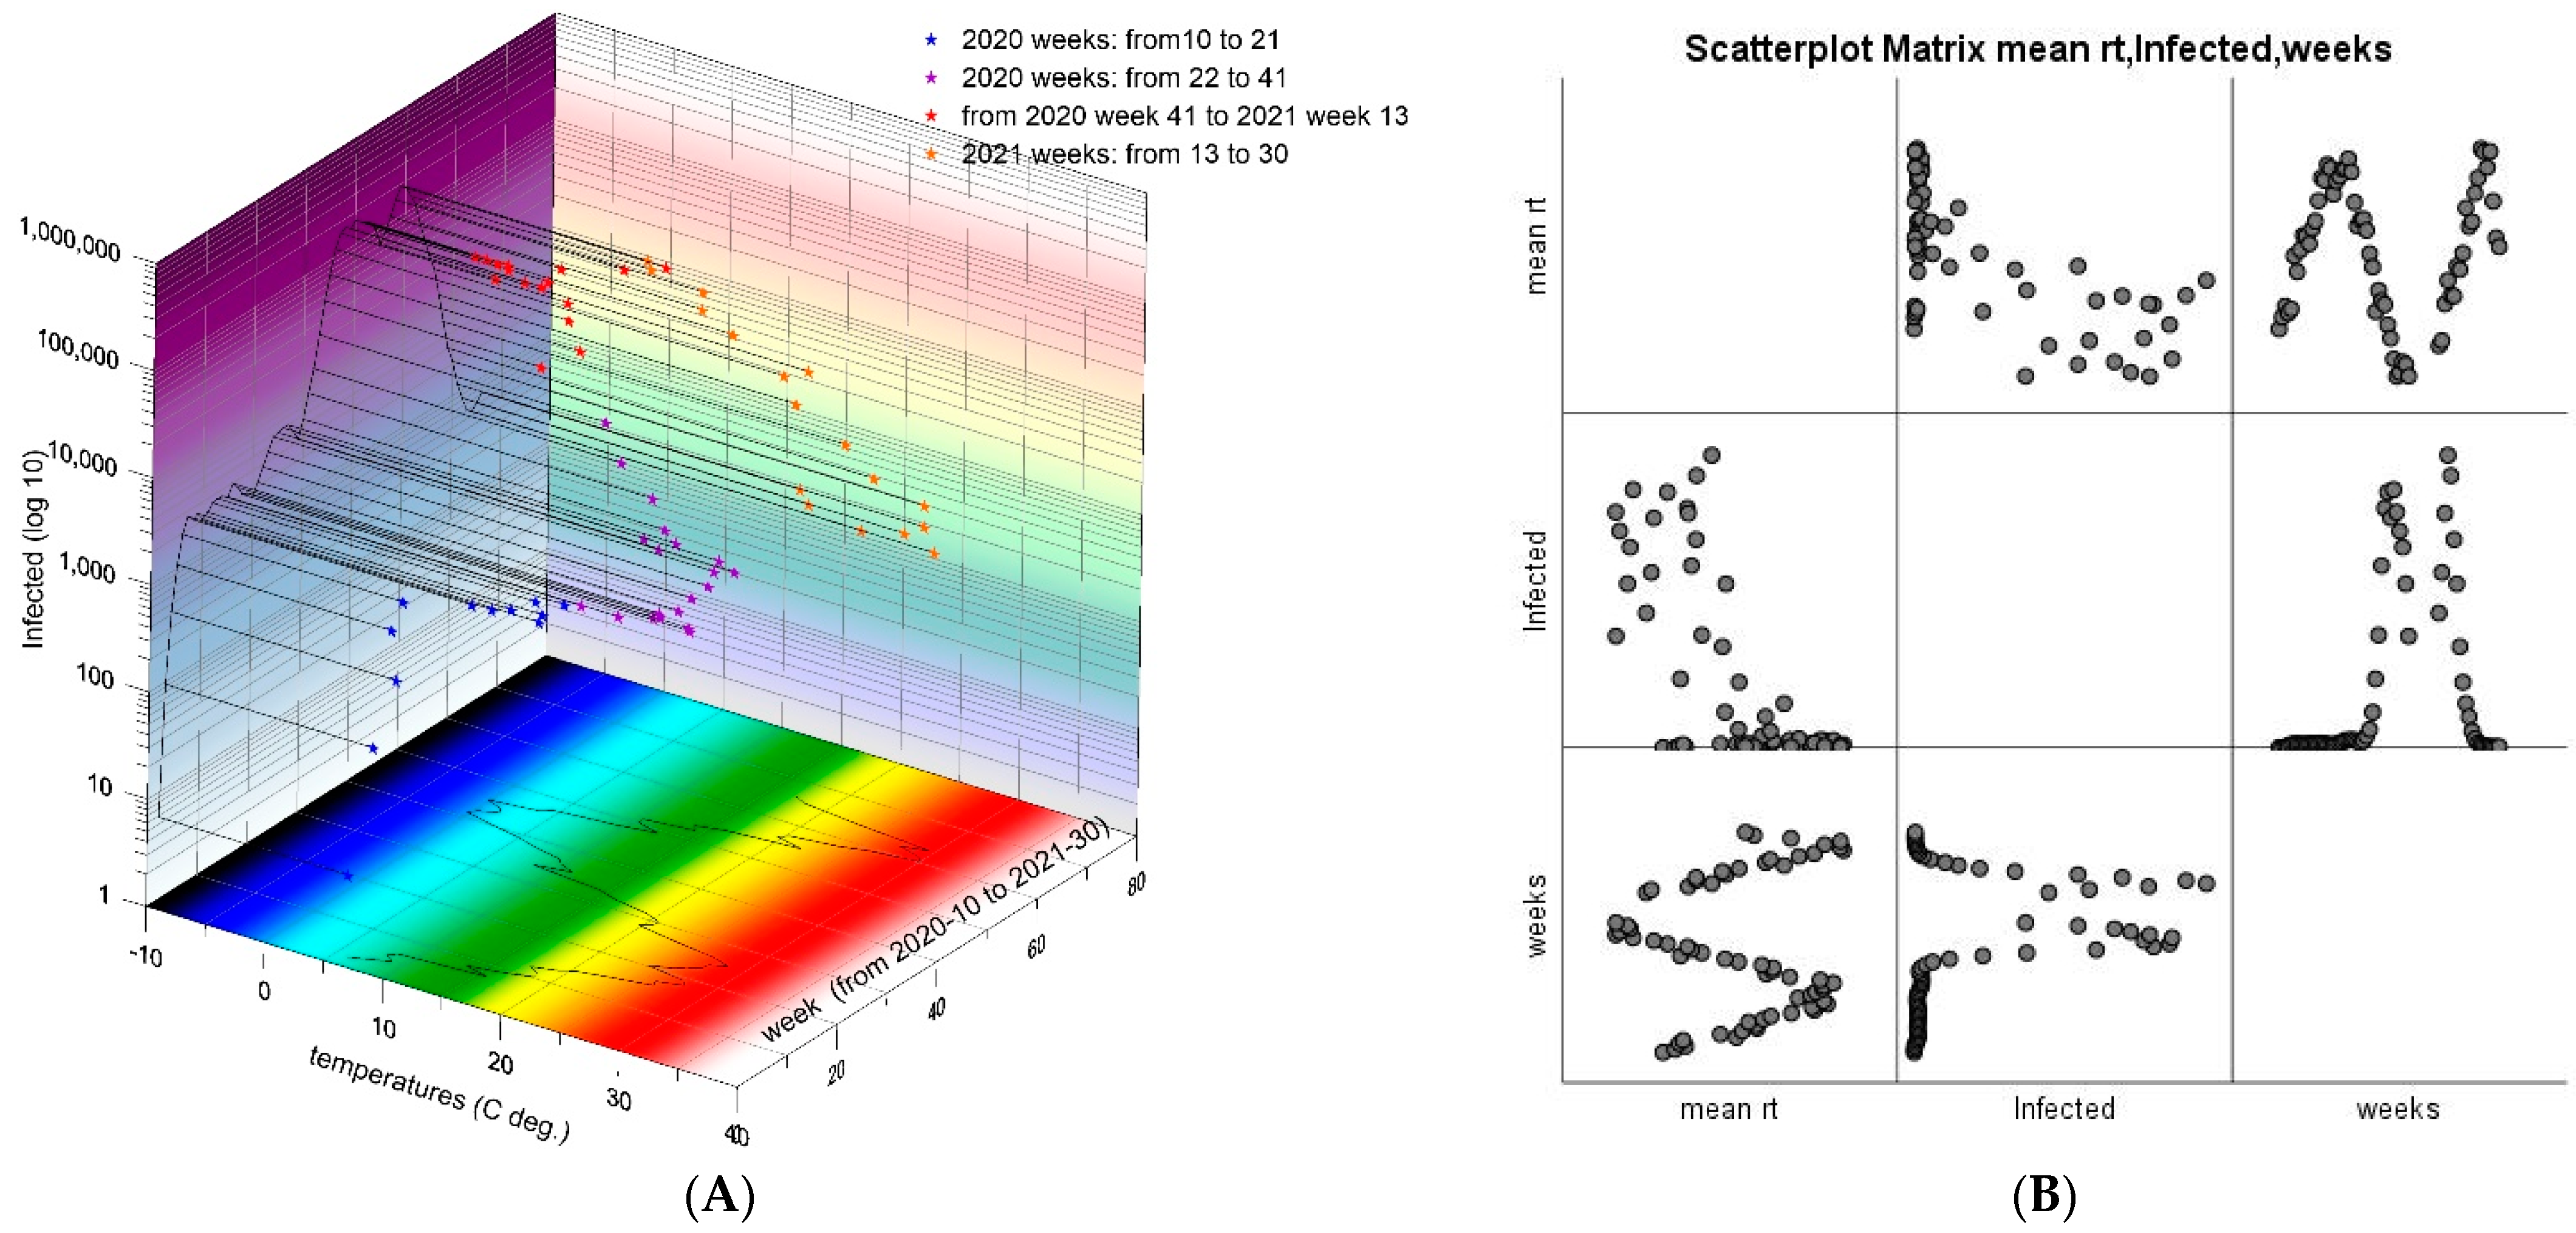
The general approach to the study involved estimating the Pearson correlation coefficients for pairs of variables: between each of the chosen meteorological and biometeorological factors (variables) described above, and the number of SARS-CoV-2 infections by week and by county over the examined time. These procedures were aimed at identifying relationships and showing the global relationship within Poland. The general results confirmed the primary hypothesis that the number of infections decreases as the temperatures, UTCI, and UV radiation grow (Table 2, Figure 7A,B).
Table 2.
Pearson’s correlation coefficients for temperatures, UV radiation, UTCI, and total number of SARS-CoV-2 infections and failed cases (deaths) in Poland over time in weeks (March 2020–July 2021).

Figure 7.
(A). The general relationships between mean radiant temperatures and number of SARS-CoV-2 infections, aggregated in weeks in Poland—3D scatterplot (March 2020–July 2021); (B). Scatterplot matrix: the relationships between mean radiant temperature (MRT) and number of SARS-CoV-2 infections aggregated in weeks over time.
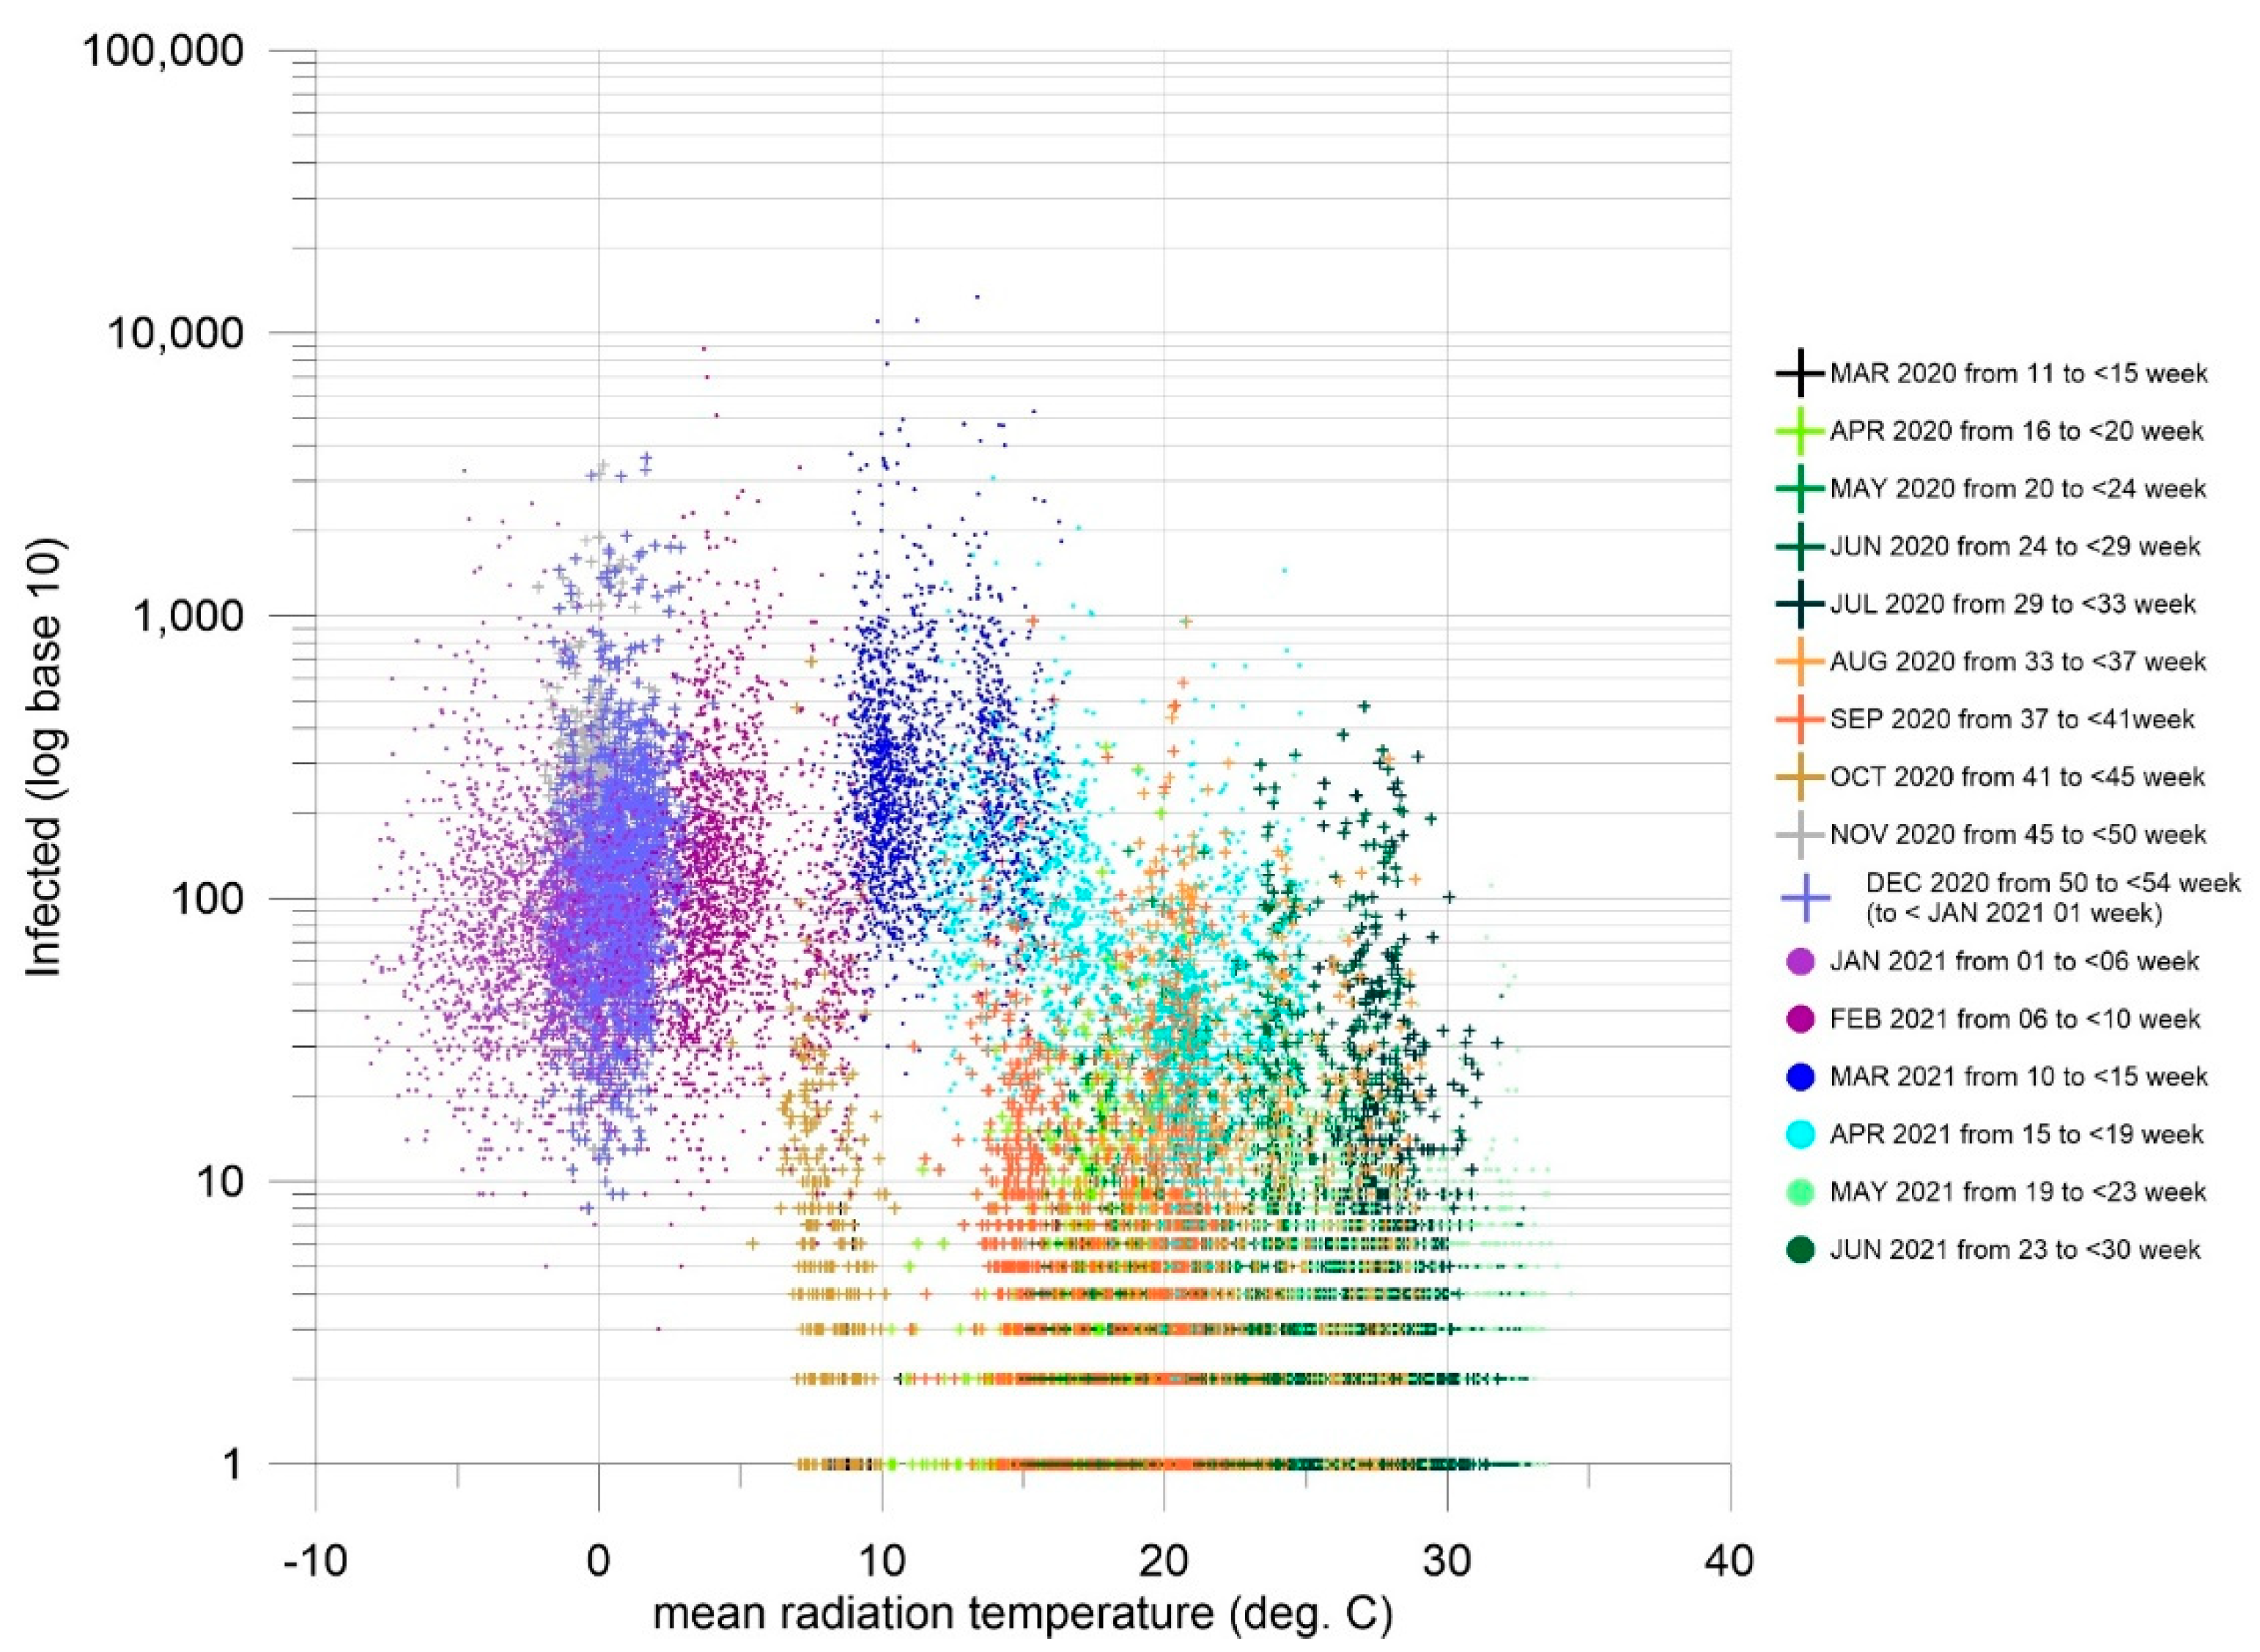
The complex chart (Figure 8) presents the number of COVID-19 cases related to average week mean radiant temperatures (MRT) for each county, for each week during the observed period. There is a data gap only from the end of November to mid-December 2020 (weeks 42–47) when the counties lacked reported data. The chart reveals evident seasonality with peaks in winter and early spring (not including March 2020, the starting time of pandemic diffusion).
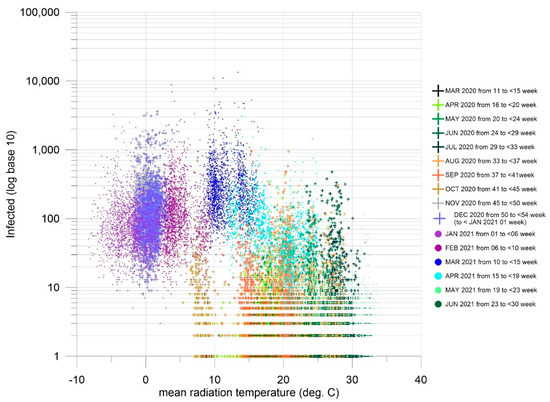
Figure 8.
Poland. COVID−19 infections for weeks and by counties vs weekly mean radiant temperatures (from March 2020, week 11 to July 2021, week 30).
The spatial heterogeneity of the relationships between COVID-19 cases and the weekly mean radiant temperature during the whole observed time is revealed on the map presenting the set of estimated Pearson’s coefficients for correlations grouped by county (Figure 9A). The separate correlation coefficients (R), as well as determination coefficients (R2), were calculated for each county over the observed time. They are also presented on the map (Figure 9B).
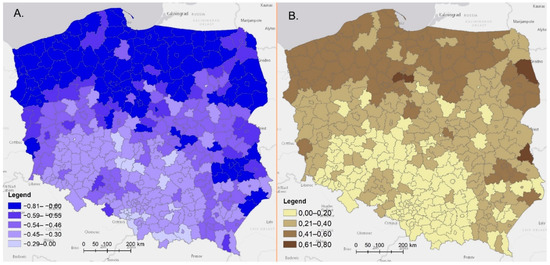
Figure 9.
Poland. (A) The Pearson’s correlation coefficients for weekly mean radiant temperature and total number of COVID-19 infections grouped by county over time. (B) (R2) coefficients of determination for weekly mean radiant temperature and total number of COVID-19 infections grouped by county over time (March 2020–July 2021).
6. Results
It is important to note that the observed period begins at week 10 of 2020 and ends at week 30 of 2021 (March 2020 to June 2021).
Results of Detailed Spatial Analyses
Correlation coefficients between the weekly mean radiant temperature and number of COVID-19 weekly cases by county, reveal some northern, eastern, and western regions are where MRT seemed to matter (Figure 9). Analysis of the map of coefficients of determination (squares of correlation coefficients, Figure 9B) by county, and analysis of spatial autocorrelation, confirms the observed relation over time, grouped by county (Univariate Global Moran I = 0.588). However, there are no lower or upper outliers.
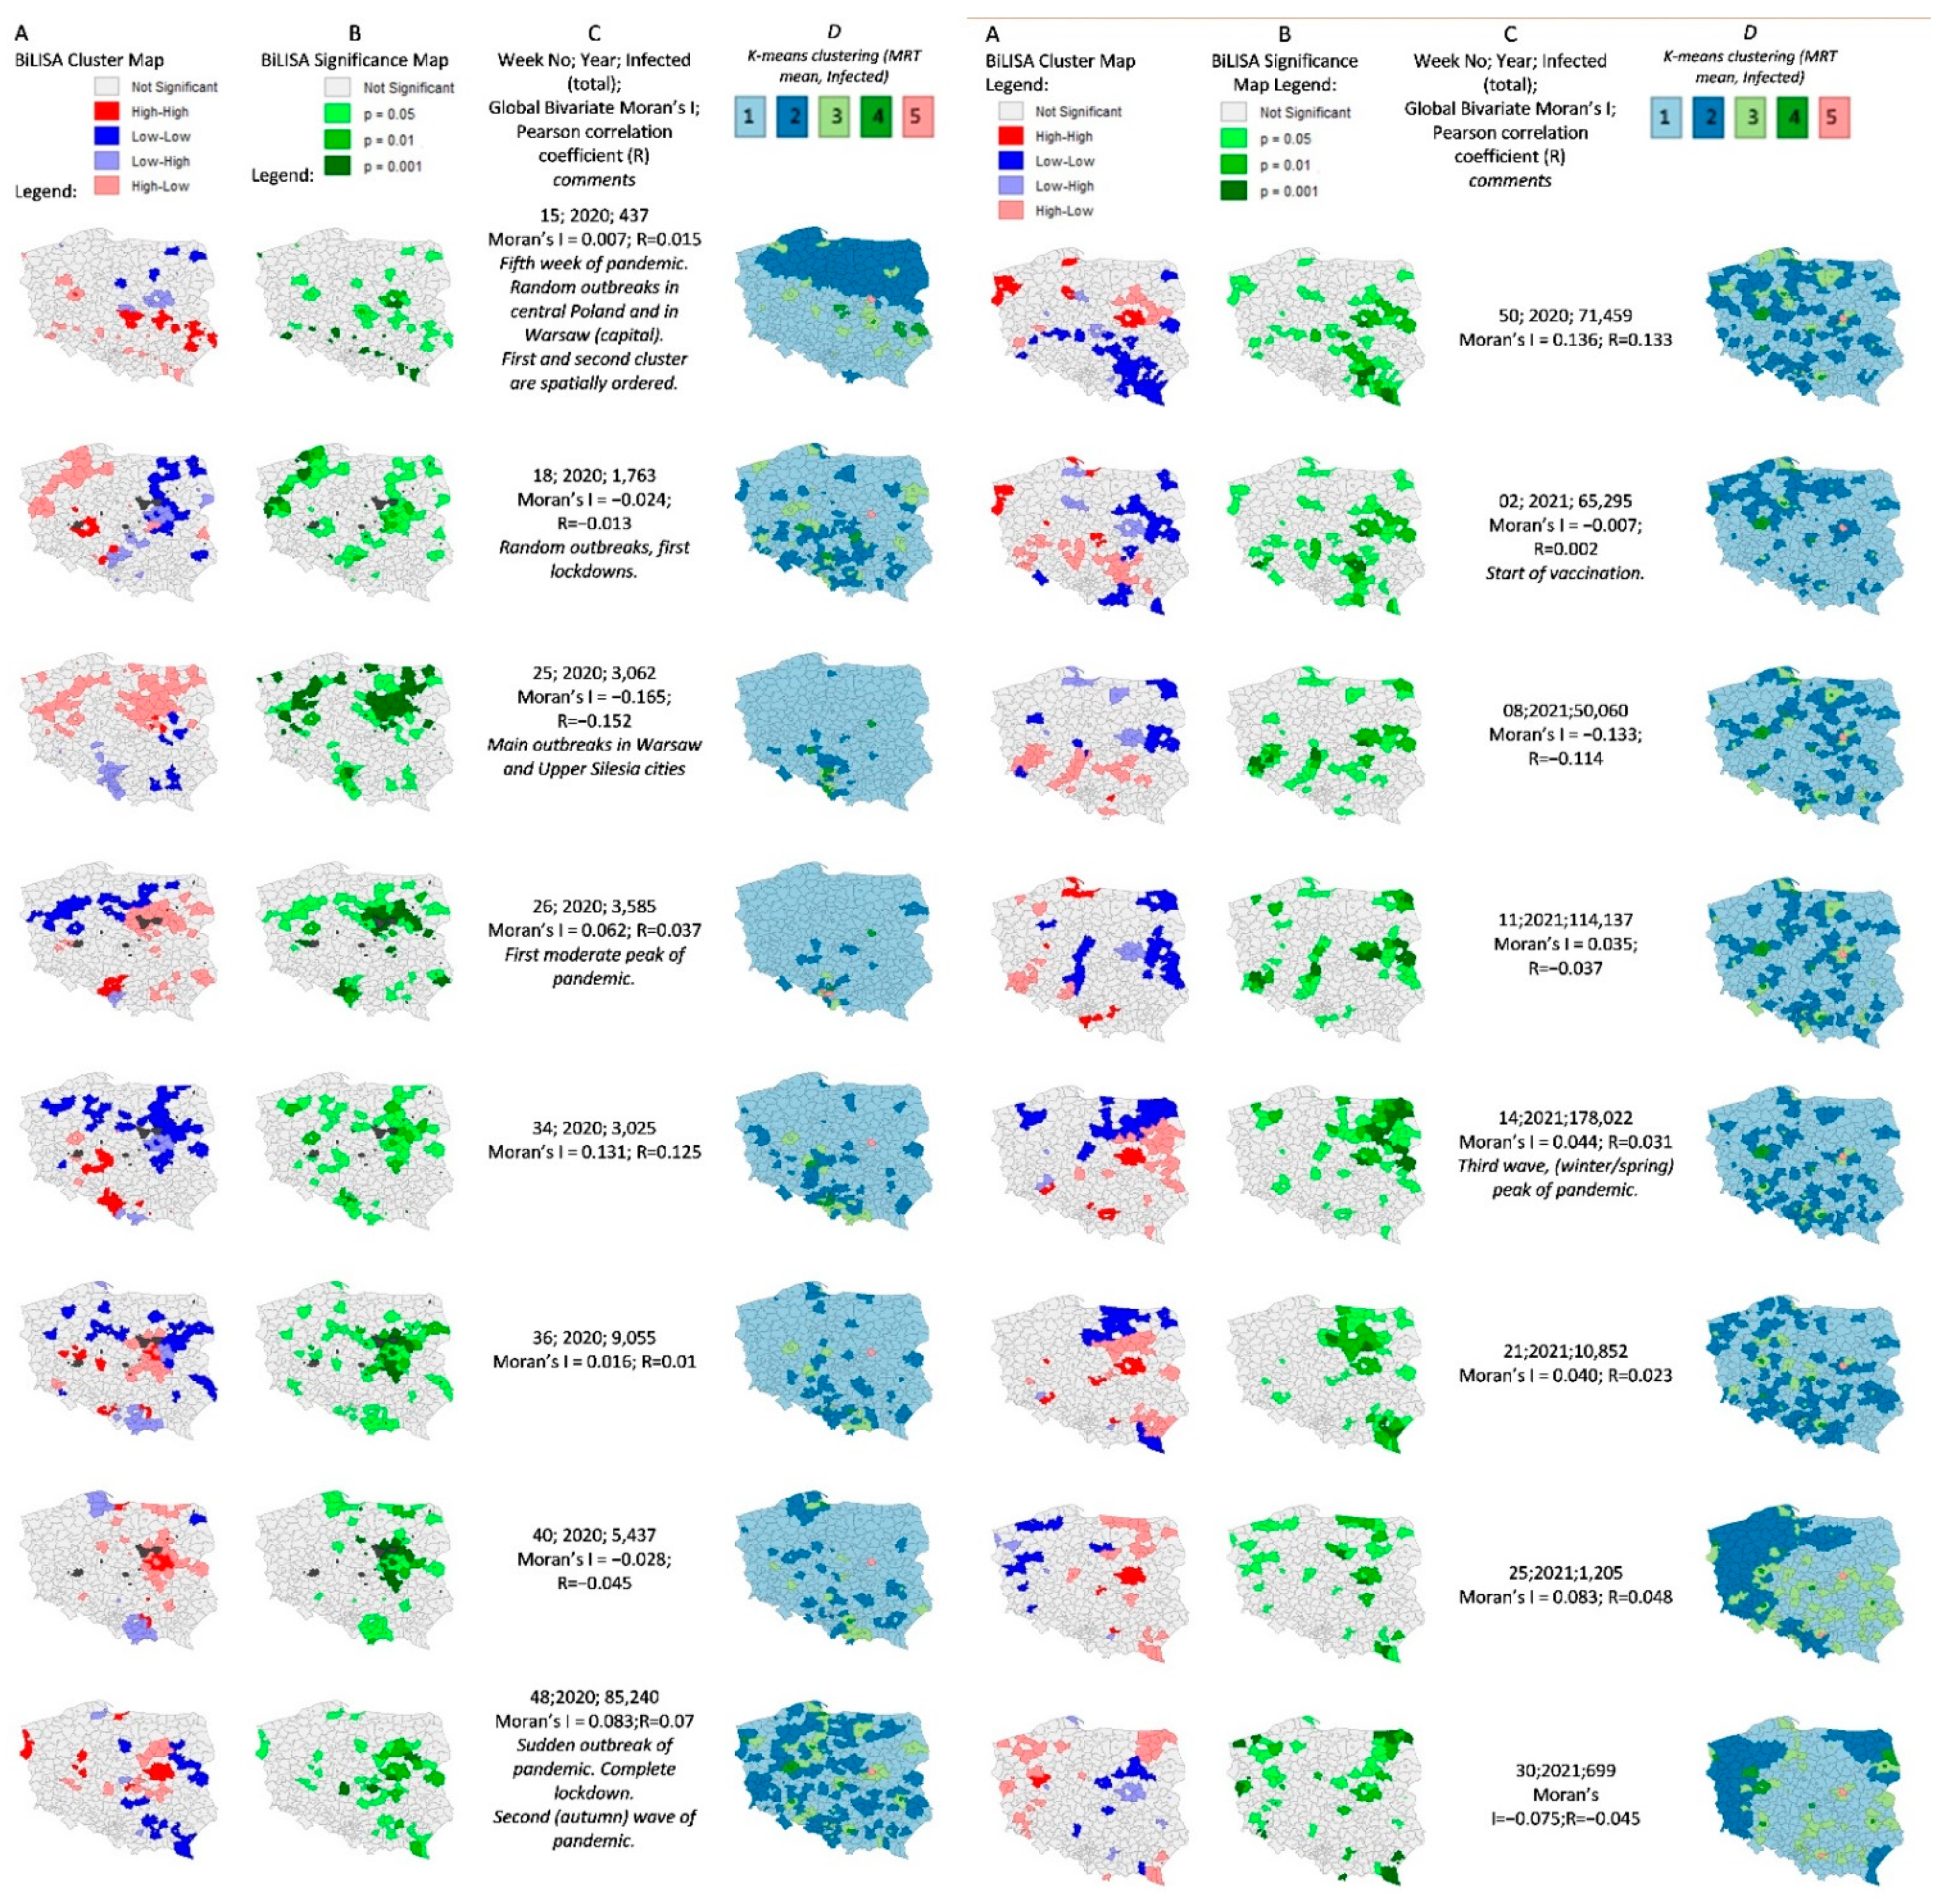
Examination of spatial autocorrelation and statistical significance, using local bivariate Moran’s I (BiLISA) coefficients, assumed the mean radiant temperature to be the independent variable, and the number of infections (summed by weeks) to be the dependent variable (Figure 10). Finally, K-means clustering shows the spatial grouping of counties assuming categorization into five unique groups of counties based on the relationship of both observed variables: weekly mean radiant temperature and the sum of weekly number of infected (COVID-19 cases, Figure 10).

Figure 10.
Relationship between weekly mean radiation temperature and COVID-19 cases (SARS-CoV-2 infections) by county, over selected weeks in Poland. (A). Bivariate Local Moran’s I (BiLISA) cluster maps by selected weeks. (B). Bivariate Local Moran’s I (BiLISA) significance maps by county over selected weeks. (C). Additional statistical information. (D). K-means clusters (mean radiant temperature, number of COVID-19 cases) over selected weeks.
7. Discussion and Conclusions
The nexus of factors influencing the spread of the SARS-CoV-2 pandemic is so complex that the identification of (some) determining factors of COVID-19 spatial diffusion is significantly hampered. It has been shown that COVID-19 characterizes of specific dynamics and is far more transmissible [47]. The mobility of people and their number, as well as the density of the population and, after all, the intensity of direct social contact, in turn, results in an increase in spatial interactions and the number of infections [37]. Spatial natural conditions (inter alia temperatures) are also recognized as primary factors in environmental risk. Early in 2020, researchers found that all cities experiencing significant outbreaks of COVID-19 had very similar winter climates, with an average temperatures of 5 to 11 degrees Celsius, an average humidity levels of 47 to 79 percent, and a narrow east-west distribution along the same 30–50 N latitude [48]. Most of studies suggested that climate may only modulate the transmission of severe acute respiratory syndrome coronavirus 2 (SARS-CoV-2) and it remains unclear whether seasonal and geographic variations in climate can substantially alter the pandemic’s trajectory [49].
The general approach to the statistical analysis of the relationship between mean radiant temperature and number of SARS-CoV-2 infections over time in Poland allows us to infer the need for further research regarding the hypothesis of seasonality of the COVID-19 pandemic.
The research showed a strong correlation between mean radiant temperature and the number of infections over time in Poland. All the examined meteorological and bioclimatic factors, especially temperature, were inversely correlated to the total number of infections in Poland over time (for a sequence of 65 weeks, from March 2020 to June 2021). The Pearson’s correlation coefficient value (R = −0.7) indicates a decrease in infections as mean radiant temperatures rise over time, which is the meteorological factor most strongly, inversely correlated to infections. Detailed statistical analysis for particular counties, i.e., the estimation the analogous relationships over time (dependent variable—infections over selected examined weeks), allows us to conclude that the northern regions of Poland, as well as some eastern counties, showed similar strong inverse correlation values, but that they are more scarcely populated than central and southern Poland. However, one should emphasize that the obtained results require interpretation within the context of the climatic, demographic, and topographic conditions characteristic for the territory of Poland and the analyzed period. Making inferences about the periodicity of the COVID-19 pandemic requires continued and more extensive research, both in terms of time (long-term) and area (a continent-wide region).
The observed relationship between MRT and infections revealed in the general approach, and for the northern and eastern counties of Poland over time, was unconfirmed during the study of bivariate detailed spatial diversity by county for particular weeks. The spatial diversity of MRT in Poland is uncorrelated with infections within the set of counties for any selected week. There had to be other factors controlling the outbreaks of pandemic during short periods of time (week) [47]. However, observations of the spatial arrangement of the first two clusters at the beginning of pandemic and the last weeks of examined time (reversal of pandemic) are interesting, and showed a strict regionalization and spatial consistency. This can be explained numerically: the number of infected people was relatively small in the prevalent number of counties, but only a few pandemic outbreaks were revealed and mostly in or around urban areas and cities, as well near state border crossings.
It has to be remembered that the vaccination program against COVID-19 started in Poland on 27 December 2020 (week 52). However, the effectiveness of these vaccines at preventing infection with new virus variants, which have emerged in the last year, is not fully defined. Moreover, data are scarce on the risk of Delta variant transmission by vaccinated individuals with mild infections. This shows that the factors influencing the spread of the COVID-19 pandemic may be more complex. Also, there is information that vaccination does not protect completely against infection, but is mostly effective at preventing severe disease and deaths from COVID-19. Vaccination is the best way to control the pandemic. There are now 99 vaccines in clinical trials, 25 have reached phase III efficacy studies and 18 have received some form of approval for use (as of July 2021) [50]. Despite authorization having been granted for multiple vaccines, as the ongoing global outbreaks demonstrate, the pandemic is far from over. SARS-CoV-2 continues to evolve under immune selective pressure, and while transmission levels remain high, there is the increased likelihood of vaccine escape variants evolving [50]. Coronavirus SARS-CoV-2 has proven to be much more prone to mutations than researchers first thought, and more variants are emerging all the time. Six months is not much time to collect data on how durable vaccine responses will be. Recent research has shown that susceptibility to infection with Delta, a highly transmissible variant, increases with time, as early as 2–3 months after vaccination, which is consistent with observed waning protective immunity [51]. This indicates that the earliest groups to be vaccinated are more likely to have less robust immune responses to infection. Key clinical trials for currently authorized vaccines have determined whether the inoculations could safely avert symptomatic disease in individuals [52]. Studies have suggested that although vaccination reduces the risk of Delta variant infection and accelerates viral clearance, fully vaccinated individuals who become SARS-CoV-2-positive have peak viral loads similar to unvaccinated cases and can efficiently transmit infection [51]. Recent studies have also shown that there are no significant differences in cycle threshold values between vaccinated and unvaccinated, or asymptomatic and symptomatic groups infected with the SARS-CoV-2 Delta variant [53,54].
The epidemiological trends observed worldwide suggest a seasonal effect for the disease that is not directly controlled by the genomic makeup of the virus [8]. Some researchers suggest that air drying capacity (ADC) and ultraviolet radiation (UV) are probable environmental determinants in shaping the transmission of COVID-19 at a seasonal time scale [55]. Recent global studies have revealed consistent negative effects for both temperature and absolute humidity at large spatial scales for COVID-19 cases, but at finer spatial resolutions, these connections have been substantiated during the seasonal rise and fall of COVID-19 [56]. COVID-19 seasonality is more pronounced at higher latitudes, where larger seasonal amplitudes of environmental indicators are observed [57]. The general approach of our study strongly suggests this hypothesis (see Table 2) in some, more prone regions in northern and eastern regions of Poland over the observed time (Figure 9). Detailed analyses by week and by county (Figure 10) showed insignificant spatial relations over shorter intervals. The main social and demographic drivers of outbreaks in Poland during the first year of the COVID-19 pandemic were confirmed and described in a separate paper [47]. Secondly, “Weather may marginally affect COVID-19 dynamics (…) Future scientific work on this politically-fraught topic needs a more careful approach.” [58].
This research has shown that one of the independent variables influencing the returning seasonal waves of the pandemic in Poland is the bioclimatic condition variable, particularly temperature (MRT). One should stress that the obtained results (Figure 9) indicate a strong correlation between biometeorological and meteorological parameters, and the number of COVID-19 cases in Poland. Simultaneously, they point to the spatial differentiation of this phenomenon: this correlation is much stronger in the north of Poland, where the coefficient of determination reaches values as high as 80%. Thus, climate-related independent variables can account for a significant portion of the dependent variable. A time series analysis for the southern part of the country, characterized by a higher level of occupational mobility of inhabitants, should also consider, for example, data on mobility. Developing such a holistic multi-variable regression model will be the subject of further research.
Author Contributions
Conceptualization, P.A.W., O.S.; data curation: P.A.W., O.S., M.P.; formal analysis, P.A.W., O.S., M.P.; methodology: P.A.W.; software: P.A.W., O.S., M.P.; writing–original draft, P.A.W., O.S., M.P., U.S.-B.; visualization: P.A.W., M.P.; validation, P.A.W., O.S., M.P., U.S.-B., R.O., M.K.-B.; writing–review & editing, P.A.W., O.S., M.P., U.S.-B., R.O., M.K.-B.; supervision, P.A.W., R.O.; funding acquisition, R.O. All authors have read and agreed to the published version of the manuscript.
Funding
IDUB against COVID-19 project granted by Warsaw University of Technology under the program Excellence Initiative: Research University (IDUB). Oleh Skrynyk was supported by National Science Centre, Poland (ref. no. 2020/37/N/ST10/03090).
Institutional Review Board Statement
Not applicable.
Informed Consent Statement
Not applicable.
Data Availability Statement
https://www.gov.pl/web/coronavirus; https://covid19datahub.io/ (accessed 20 July 2021).
Acknowledgments
The research was partially funded by IDUB against COVID-19 project granted by Warsaw University of Technology under the program Excellence Initiative: Research University (IDUB). Oleh Skrynyk was supported by National Science Centre, Poland (ref. no. 2020/37/N/ST10/03090).
Conflicts of Interest
The authors declare no conflict of interest.
References
- Tamerius, J.; Nelson, M.I.; Zhou, S.Z.; Viboud, C.; Miller, M.A.; Alonso, W.J. Global Influenza Seasonality: Reconciling Patterns across Temperate and Tropical Regions. Environ. Health Perspect. 2011, 119, 439–445. [Google Scholar] [CrossRef] [PubMed] [Green Version]
- Fdez-Arroyabe, P. Influenza epidemics and Spanish climatic domains. Health 2012, 4, 941–945. [Google Scholar] [CrossRef] [Green Version]
- Price, R.H.M.; Graham, C.; Ramalingam, S. Association between viral seasonality and meteorological factors. Sci. Rep. 2019, 9, 929. [Google Scholar] [CrossRef] [PubMed]
- du Prel, J.; Puppe, W.; Gröndahl, B.; Knuf, M.; Weigl, J.A.I.; Schaaff, F.; Schmitt, H. Are Meteorological Parameters Associated with Acute Respiratory Tract Infections? Clin. Infect. Dis. 2009, 49, 861–868. [Google Scholar] [CrossRef] [Green Version]
- Lindner-Cendrowska, K. Wpływ warunków meteorologicznych na zachorowalność na grypę w wybranych polskich miastach = Impact of meteorological conditions on influenza morbidity in the selected Polish cities. Prz. Geogr. 2021, 93, 103–122. [Google Scholar] [CrossRef]
- The KIAS-Study Group; Jaakkola, K.; Saukkoriipi, A.; Jokelainen, J.; Juvonen, R.; Kauppila, J.; Vainio, O.; Ziegler, T.; Rönkkö, E.; Jaakkola, J.J.; et al. Decline in temperature and humidity increases the occurrence of influenza in cold climate. Environ. Health 2014, 13, 22. [Google Scholar] [CrossRef] [PubMed] [Green Version]
- Lindner-Cendrowska, K.; Bröde, P. Impact of biometeorological conditions and air pollution on influenza-like illnesses incidence in Warsaw. Int. J. Biometeorol. 2021, 65, 929–944. [Google Scholar] [CrossRef]
- Burra, P.; Soto-Díaz, K.; Chalen, I.; Gonzalez-Ricon, R.J.; Istanto, D.; Caetano-Anollés, G. Temperature and Latitude Correlate with SARS-CoV-2 Epidemiological Variables but not with Genomic Change Worldwide. Evol. Bioinform. 2021, 17, 117693432198969. [Google Scholar] [CrossRef]
- Ma, Y.; Pei, S.; Shaman, J.; Dubrow, R.; Chen, K. Role of meteorological factors in the transmission of SARS-CoV-2 in the United States. Nat. Commun. 2021, 12, 3602. [Google Scholar] [CrossRef]
- Shi, P.; Dong, Y.; Yan, H.; Zhao, C.; Li, X.; Liu, W.; He, M.; Tang, S.; Xi, S. Impact of temperature on the dynamics of the COVID-19 outbreak in China. Sci. Total Environ. 2020, 728, 138890. [Google Scholar] [CrossRef] [PubMed]
- Prata, D.N.; Rodrigues, W.; Bermejo, P.H. Temperature significantly changes COVID-19 transmission in (sub)tropical cities of Brazil. Sci. Total Environ. 2020, 729, 138862. [Google Scholar] [CrossRef]
- Liu, Y.; Ning, Z.; Chen, Y.; Guo, M.; Liu, Y.; Gali, N.K.; Sun, L.; Duan, Y.; Cai, J.; Westerdahl, D.; et al. Aerodynamic analysis of SARS-CoV-2 in two Wuhan hospitals. Nature 2020, 582, 557–560. [Google Scholar] [CrossRef] [PubMed]
- Zhu, Y.; Xie, J.; Huang, F.; Cao, L. Association between short-term exposure to air pollution and COVID-19 infection: Evidence from China. Sci. Total Environ. 2020, 727, 138704. [Google Scholar] [CrossRef]
- Pani, S.K.; Lin, N.-H.; Ravindra Babu, S. Association of COVID-19 pandemic with meteorological parameters over Singapore. Sci. Total Environ. 2020, 740, 140112. [Google Scholar] [CrossRef] [PubMed]
- Isaia, G.; Diémoz, H.; Maluta, F.; Fountoulakis, I.; Ceccon, D.; di Sarra, A.; Facta, S.; Fedele, F.; Lorenzetto, G.; Siani, A.M. Does solar ultraviolet radiation play a role in COVID-19 infection and deaths? An environmental ecological study in Italy. Sci. Total Environ. 2021, 757, 143757. [Google Scholar] [CrossRef] [PubMed]
- Samanta, P.; Dey, S.; Ghosh, A.R. Are population size and diverse climatic conditions the driving factors for next COVID-19 pandemic epicenter in India? Results Phys. 2021, 26, 104454. [Google Scholar] [CrossRef]
- Wang, C.; Pan, R.; Wan, X.; Tan, Y.; Xu, L.; McIntyre, R.S.; Choo, F.N.; Tran, B.; Ho, R.; Sharma, V.K.; et al. A longitudinal study on the mental health of general population during the COVID-19 epidemic in China. Brain Behav. Immun. 2020, 87, 40–48. [Google Scholar] [CrossRef] [PubMed]
- Bannister-Tyrrell, M.; Meyer, A.; Faverjon, C.; Cameron, A. Preliminary evidence that higher temperatures are associated with lower incidence of COVID-19, for cases reported globally up to 29th February 2020. medRxiv 2020. [Google Scholar] [CrossRef]
- Rice, B.L.; Annapragada, A.; Baker, R.E.; Bruijning, M.; Dotse-Gborgbortsi, W.; Mensah, K.; Miller, I.F.; Motaze, N.V.; Raherinandrasana, A.; Rajeev, M.; et al. Variation in SARS-CoV-2 outbreaks across sub-Saharan Africa. Nat. Med. 2021, 27, 447–453. [Google Scholar] [CrossRef]
- Suvvari, T.K.; Kutikuppala, L.V.S.; Jonna, S.; Kashif, M.S. Impact of environmental factors on COVID-19 pandemic: A narrative review. MGM J. Med Sci. 2021, 8, 151. [Google Scholar] [CrossRef]
- Steiger, E.; Mussgnug, T.; Kroll, L.E. Causal graph analysis of COVID-19 observational data in German districts reveals effects of determining factors on reported case numbers. PLoS ONE 2021, 16, e0237277. [Google Scholar] [CrossRef] [PubMed]
- Demongeot, J.; Flet-Berliac, Y.; Seligmann, H. Temperature Decreases Spread Parameters of the New COVID-19 Case Dynamics. Biology 2020, 9, 94. [Google Scholar] [CrossRef] [PubMed]
- Qi, H.; Xiao, S.; Shi, R.; Ward, M.P.; Chen, Y.; Tu, W.; Su, Q.; Wang, W.; Wang, X.; Zhang, Z. COVID-19 transmission in Mainland China is associated with temperature and humidity: A time-series analysis. Sci. Total Environ. 2020, 728, 138778. [Google Scholar] [CrossRef]
- Sobral, M.F.F.; Duarte, G.B.; da Penha Sobral, A.I.G.; Marinho, M.L.M.; de Souza Melo, A. Association between climate variables and global transmission oF SARS-CoV-2. Sci. Total Environ. 2020, 729, 138997. [Google Scholar] [CrossRef] [PubMed]
- Tosepu, R.; Gunawan, J.; Effendy, D.S.; Lestari, H.; Bahar, H.; Asfian, P. Correlation between weather and COVID-19 pandemic in Jakarta, Indonesia. Sci. Total Environ. 2020, 725, 138436. [Google Scholar] [CrossRef] [PubMed]
- Wu, Y.; Jing, W.; Liu, J.; Ma, Q.; Yuan, J.; Wang, Y.; Du, M.; Liu, M. Effects of temperature and humidity on the daily new cases and new deaths of COVID-19 in 166 countries. Sci. Total Environ. 2020, 729, 139051. [Google Scholar] [CrossRef]
- Auler, A.; Cássaro, F.; Da Silva, V.; Pires, L. Evidence that high temperatures and intermediate relative humidity might favor the spread of COVID-19 in tropical climate: A case study for the most affected Brazilian cities. Sci. Total Environ. 2020, 729, 139090. [Google Scholar] [CrossRef]
- Jüni, P.; Rothenbühler, M.; Bobos, P.; Thorpe, K.E.; da Costa, B.R.; Fisman, D.N.; Slutsky, A.S.; Gesink, D. Impact of climate and public health interventions on the COVID-19 pandemic: A prospective cohort study. CMAJ 2020, 192, E566–E573. [Google Scholar] [CrossRef] [PubMed]
- Briz-Redón, Á.; Serrano-Aroca, Á. A spatio-temporal analysis for exploring the effect of temperature on COVID-19 early evolution in Spain. Sci. Total Environ. 2020, 728, 138811. [Google Scholar] [CrossRef]
- Shahzad, F.; Shahzad, U.; Fareed, Z.; Iqbal, N.; Hashmi, S.H.; Ahmad, F. Asymmetric nexus between temperature and COVID-19 in the top ten affected provinces of China: A current application of quantile-on-quantile approach. Sci. Total Environ. 2020, 736, 139115. [Google Scholar] [CrossRef] [PubMed]
- Jahangiri, M.; Jahangiri, M.; Najafgholipour, M. The sensitivity and specificity analyses of ambient temperature and population size on the transmission rate of the novel coronavirus (COVID-19) in different provinces of Iran. Sci. Total Environ. 2020, 728, 138872. [Google Scholar] [CrossRef] [PubMed]
- CovsirPhy Development Team CovsirPhy, Python Package for COVID-19 Analysis with SIR-Derived ODE Models. Available online: https://github.com/lisphilar/covid19-sir (accessed on 4 February 2021).
- Hirokazu, T. CovsirPhy Version [2.15.0] COVID-19 Data with SIR Model (Software). 2021. Available online: https://www.kaggle.com/lisphilar/covid-19-data-with-sir-model (accessed on 5 February 2021).
- Guidotti, E.; Ardia, D. COVID-19 Data Hub. J. Open Source Softw. 2020, 5, 2376. [Google Scholar] [CrossRef]
- Raport Zakażeń Koronawirusem (SARS-CoV-2)—Koronawirus: Informacje i Zalecenia—Portal Gov.pl. Available online: https://www.gov.pl/web/koronawirus/wykaz-zarazen-koronawirusem-sars-cov-2 (accessed on 7 February 2021).
- Hersbach, H.; Bell, B.; Berrisford, P.; Hirahara, S.; Horányi, A.; Muñoz-Sabater, J.; Nicolas, J.; Peubey, C.; Radu, R.; Schepers, D. The ERA5 global reanalysis. Q. J. R. Meteorol. Soc. 2020, 146, 1999–2049. [Google Scholar] [CrossRef]
- Di Napoli, C.; Barnard, C.; Prudhomme, C.; Cloke, H.L.; Pappenberger, F. ERA5-HEAT: A global gridded historical dataset of human thermal comfort indices from climate reanalysis. Geosci. Data J. 2021, 8, 2–10. [Google Scholar] [CrossRef]
- Kántor, N.; Unger, J. The most problematic variable in the course of human-biometeorological comfort assessment—The mean radiant temperature. Cent. Eur. J. Geosci. 2011, 3, 90–100. [Google Scholar] [CrossRef] [Green Version]
- Thorsson, S.; Rocklöv, J.; Konarska, J.; Lindberg, F.; Holmer, B.; Dousset, B.; Rayner, D. Mean radiant temperature—A predictor of heat related mortality. Urban Clim. 2014, 10, 332–345. [Google Scholar] [CrossRef]
- Błażejczyk, K.; Jendritzky, G.; Bröde, P.; Fiala, D.; Havenith, G.; Epstein, Y.; Psikuta, A.; Kampmann, B. An introduction to the universal thermal climate index (UTCI). Geogr. Pol. 2013, 86, 5–10. [Google Scholar] [CrossRef] [Green Version]
- Dana Tomlin, C. Map Algebra. In International Encyclopedia of Geography: People, the Earth, Environment and Technology; Richardson, D., Castree, N., Goodchild, M.F., Kobayashi, A., Liu, W., Marston, R.A., Eds.; John Wiley & Sons, Ltd.: Oxford, UK, 2017; pp. 1–17. ISBN 978-0-470-65963-2. [Google Scholar]
- Ozesmi, S.L.; Bauer, M.E. Satellite remote sensing of wetlands. Wetl. Ecol. Manag. 2002, 10, 381–402. [Google Scholar] [CrossRef]
- Sherrouse, B.C.; Clement, J.M.; Semmens, D. A GIS application for assessing, mapping, and quantifying the social values of ecosystem services. Appl. Geogr. 2011, 31, 748–760. [Google Scholar] [CrossRef]
- De Smith, M.J.; Goodchild, M.F.; Longley, P.A. Geospatial Analysis: A Comprehensive Guide to Principles, Techniques and Software Tools, 6th ed.; Drumlin Security: London, UK, 2018; ISBN 978-1-912556-05-2. [Google Scholar]
- Beck, H.E.; Zimmermann, N.E.; McVicar, T.R.; Vergopolan, N.; Berg, A.; Wood, E.F. Present and future Köppen-Geiger climate classification maps at 1-km resolution. Sci. Data 2018, 5, 180214. [Google Scholar] [CrossRef] [PubMed] [Green Version]
- IMGW-PIB. Climate of Poland 2020; Institute of Meteorology and Water Management—National Research Institute: Warsaw, Poland, 2021; p. 24. Available online: https://www.imgw.pl/sites/default/files/2021-04/imgw-pib-klimat-polski-2020-opracowanie-final-eng-rozkladowki-min.pdf (accessed on 1 September 2021).
- Werner, P.A. Tracing and Modeling of the COVID-19 Pandemic Infections in Poland Using Spatial Interactions Models. In Computational Science and Its Applications—ICCSA 2021; Gervasi, O., Murgante, B., Misra, S., Garau, C., Blečić, I., Taniar, D., Apduhan, B.O., Rocha, A.M.A.C., Tarantino, E., Torre, C.M., Eds.; Lecture Notes in Computer Science; Springer International Publishing: Cham, Switzerland, 2021; Volume 12954, pp. 641–657. ISBN 978-3-030-86978-6. [Google Scholar]
- Sajadi, M.M.; Habibzadeh, P.; Vintzileos, A.; Shokouhi, S.; Miralles-Wilhelm, F.; Amoroso, A. Temperature, Humidity and Latitude Analysis to Predict Potential Spread and Seasonality for COVID-19; Social Science Research Network: Rochester, NY, USA, 2020; Available online: https://www.clinicadelviaggiatore.com/wp-content/uploads/2020/04/Temperature-humidity-and-latitude-analysis-to-predict-potential-spread-and-seasonality-for-COVID-19.pdf (accessed on 1 September 2021).
- Baker, R.E.; Yang, W.; Vecchi, G.A.; Metcalf, C.J.E.; Grenfell, B.T. Susceptible supply limits the role of climate in the early SARS-CoV-2 pandemic. Science 2020, 369, 315–319. [Google Scholar] [CrossRef]
- Tregoning, J.S.; Flight, K.E.; Higham, S.L.; Wang, Z.; Pierce, B.F. Progress of the COVID-19 vaccine effort: Viruses, vaccines and variants versus efficacy, effectiveness and escape. Nat. Rev. Immunol. 2021, 21, 626–636. [Google Scholar] [CrossRef] [PubMed]
- Singanayagam, A.; Hakki, S.; Dunning, J.; Madon, K.J.; Crone, M.A.; Koycheva, A.; Derqui-Fernandez, N.; Barnett, J.L.; Whitfield, M.G.; Varro, R.; et al. Community Transmission and Viral Load Kinetics of the SARS-CoV-2 Delta (B.1.617.2) Variant in Vaccinated and Unvaccinated Individuals in the UK: A Prospective, Longitudinal, Cohort Study. Lancet Infect. Dis. 2021, S1473309921006484. [Google Scholar] [CrossRef]
- Ledford, H. Six Months of COVID Vaccines: What 1.7 Billion Doses Have Taught Scientists. Nature 2021, 594, 164–167. [Google Scholar] [CrossRef] [PubMed]
- Acharya, C.B.; Schrom, J.; Mitchell, A.M.; Coil, D.A.; Marquez, C.; Rojas, S.; Wang, C.Y.; Liu, J.; Pilarowski, G.; Solis, L.; et al. No Significant Difference in Viral Load Between Vaccinated and Unvaccinated, Asymptomatic and Symptomatic Groups When Infected with SARS-CoV-2 Delta Variant. MedRxiv 2021. [Google Scholar] [CrossRef]
- Brown, C.M.; Vostok, J.; Johnson, H.; Burns, M.; Gharpure, R.; Sami, S.; Sabo, R.T.; Hall, N.; Foreman, A.; Schubert, P.L.; et al. Outbreak of SARS-CoV-2 Infections, Including COVID-19 Vaccine Breakthrough Infections, Associated with Large Public Gatherings—Barnstable County, Massachusetts, July 2021. MMWR Morb. Mortal. Wkly. Rep. 2021, 70, 1059–1062. [Google Scholar] [CrossRef] [PubMed]
- Choi, Y.; Tuel, A.; Eltahir, E.A.B. On the Environmental Determinants of COVID-19 Seasonality. Geohealth 2021, 5, e2021GH000413. [Google Scholar] [CrossRef]
- Fontal, A.; Bouma, M.J.; San-José, A.; López, L.; Pascual, M.; Rodó, X. Climatic signatures in the different COVID-19 pandemic waves across both hemispheres. Nat. Comput. Sci. 2021, 1, 655–665. [Google Scholar] [CrossRef]
- Liu, X.; Huang, J.; Li, C.; Zhao, Y.; Wang, D.; Huang, Z.; Yang, K. The role of seasonality in the spread of COVID-19 pandemic. Environ. Res. 2021, 195, 110874. [Google Scholar] [CrossRef] [PubMed]
- Carlson, C.J.; Gomez, A.C.R.; Bansal, S.; Ryan, S.J. Misconceptions about weather and seasonality must not misguide COVID-19 response. Nat. Commun. 2020, 11, 4312. [Google Scholar] [CrossRef]

Publisher’s Note: MDPI stays neutral with regard to jurisdictional claims in published maps and institutional affiliations. |
© 2021 by the authors. Licensee MDPI, Basel, Switzerland. This article is an open access article distributed under the terms and conditions of the Creative Commons Attribution (CC BY) license (https://creativecommons.org/licenses/by/4.0/).