Article

Understanding Human Activities in Response to Typhoon Hato from Multi-Source Geospatial Big Data: A Case Study in Guangdong, China

1
State Key Laboratory of Resources and Environmental Information System, Institute of Geographical Sciences and Natural Resources Research, Chinese Academy of Sciences, Beijing 100101, China
2
College of Resources and Environment, University of Chinese Academy of Sciences, Beijing 100049, China
*
Author to whom correspondence should be addressed.
Remote Sens. 2022, 14(5), 1269; https://doi.org/10.3390/rs14051269
Submission received: 22 January 2022 / Revised: 21 February 2022 / Accepted: 2 March 2022 / Published: 5 March 2022
(This article belongs to the Special Issue Advances to GIS for Sensing of Earth and Human Interaction)

Abstract

:
Every year typhoons severely disrupt the normal rhythms of human activities and pose serious threats to China’s coast. Previous studies have shown that the impact extent and degree of a typhoon can be inferred from various geolocation datasets. However, it remains a challenge to unravel how dwellers respond to a typhoon disaster and what they concern most in the places with significant human activity changes. In this study, we integrated the geotagged microblogs with the Tencent’s location request data to advance our understanding of dweller’s collective response to typhoon Hato and the changes in their concerns over the typhoon process. Our results show that Hato induces both negative and positive anomalies in humans’ location request activities and such anomalies could be utilized to characterize the impacts of wind and rainfall brought by Hato to our study area, respectively. Topic analysis of Hato-related geotagged microblogs reveals that the negative location request anomalies are closely related to damage-related topics, whereas the positive anomalies to traffic-related topics. The negative anomalies are significantly correlated with economic loss and population affected at city level as suggested by an over 0.7 adjusted R2. The changes in the anomalies can be used to portray the response and recovery processes of the cities impacted.

Graphical Abstract

1. Introduction

Tropical storms are one of the most destructive natural disasters. Statistics show that during the period from 1998 to 2017, tropical cyclones and typhoons affected around 726 million people and caused 233,000 deaths and USD 1.33 trillion of economic loss worldwide [1]. Furthermore, growing evidence has shown that typhoons occur less frequently but tend to be more intense in response to the global climate change [2,3,4,5]. Over the past 37 years, typhoons that hit East and Southeast Asia have intensified by 12–15% and the proportion of category 4 and 5 storms has doubled or even tripled [6].
China is one of the countries frequently affected by typhoons and has been impacted by eight storms per year from 2010 to 2018. Typhoons have caused over an average of 60 billion RMB Yuan direct economic loss, mainly in the coastal provinces [7]. Typhoon Hato is the most devastating typhoon that hit China in recent years, costing 32 deaths and a 29 billion RMB Yuan economic loss [7]. More studies are needed to help us better understand how dwellers respond to a natural hazard such as a typhoon and how the areas impacted recover after that.
Many data sources have been used to study how human activities change in response to a typhoon disaster. Among them, satellite images have been widely used to monitor and assess typhoon disasters [8], though it is not possible to monitor real-time human activities from remotely sensed data. Over recent years, the use of mobile phones and social media platforms has provided new insights on disaster management. The social sensing data [9], such as mobile phone records and social media posts, can record public behaviors in the physical and cyber space at high spatial and temporal resolutions and have been widely used in typhoon-related studies, in particularly in disaster-related information extraction [10,11,12,13,14,15], situation awareness [16,17,18,19,20], resilience assessment [21,22,23,24,25,26], and rapid damage assessment [27,28,29,30,31,32].
Previous typhoon studies on the use of social sensing data can be roughly grouped into two categories regarding the data utilized in previous studies. One is crowd positioning data represented by mobile phone signaling records. For example, Hong et al. [33] used two-month positioning data from more than 800,000 anonymized mobile phones in Houston, Texas. They analyzed the mobility patterns of a crowd before, during, and after Hurricane Harvey and found clear socioeconomic and racial disparities in resilience capacity and evacuation patterns of the local communities. The phone records document the users’ spatiotemporal attributes, from which the individual or collective human activities across a large geographic scale could be inferred. However, it is not possible to identify the specific types of human activities from phone records. For example, the phone record could not tell what a user is doing when she or he is making a phone call.
Social media data is another type of social sensing data that are widely used to study how dwellers respond to a natural hazard. For example, Huang et al. [17] first split the Twitter updates posted at different stages of a typhoon based on the topics. They then investigated the spatiotemporal patterns of human behaviors and reactions to the typhoon. Their research results provide detailed information about the disaster evolution and are helpful to the decision makers to track the ongoing development of a disaster. From the social media contents, human reactions to an event and spatial cognition of individuals affected could be inferred [9]. The social media data could also be used to track and monitor disaster situations, improve emergency response promptness, and act as a gauge of public interest or concerns [34,35]. Many studies have integrated social media data and remote sensing imagery to monitor disasters and assess disaster-induced damages [29,31,34]. These studies showed that social media data are valuable in providing disaster-related information that cannot be acquired by other sensors [36,37].
More recently, location request data have been used to estimate the collective human activities [38,39,40]. Dwellers’ daily activities usually change dramatically during a natural hazard and such changes are recorded in the location request data in a near real-time manner across a large geographic scale. Previous studies have shown that a natural hazard such as a typhoon could significantly impact human activities, and such impacts could be inferred from the changes in the number of location requests (NLR) [41,42]. However, it remains unclear how dwellers respond to typhoon disasters and what the public concern most in the places with significant human activity changes. More studies are needed to integrate multi-source data to help us better understand the changes in human activities in response to typhoon disasters.
In this study, we utilized location request data and geotagged microblogs, to examine how dwellers respond to typhoon Hato. We first introduced our study area, the typhoon, and datasets in Section 1 and Section 2. We then displayed our methods and our findings in Section 3 and Section 4. Finally, the discussions and conclusions are presented in Section 5 and Section 6.

2. Materials

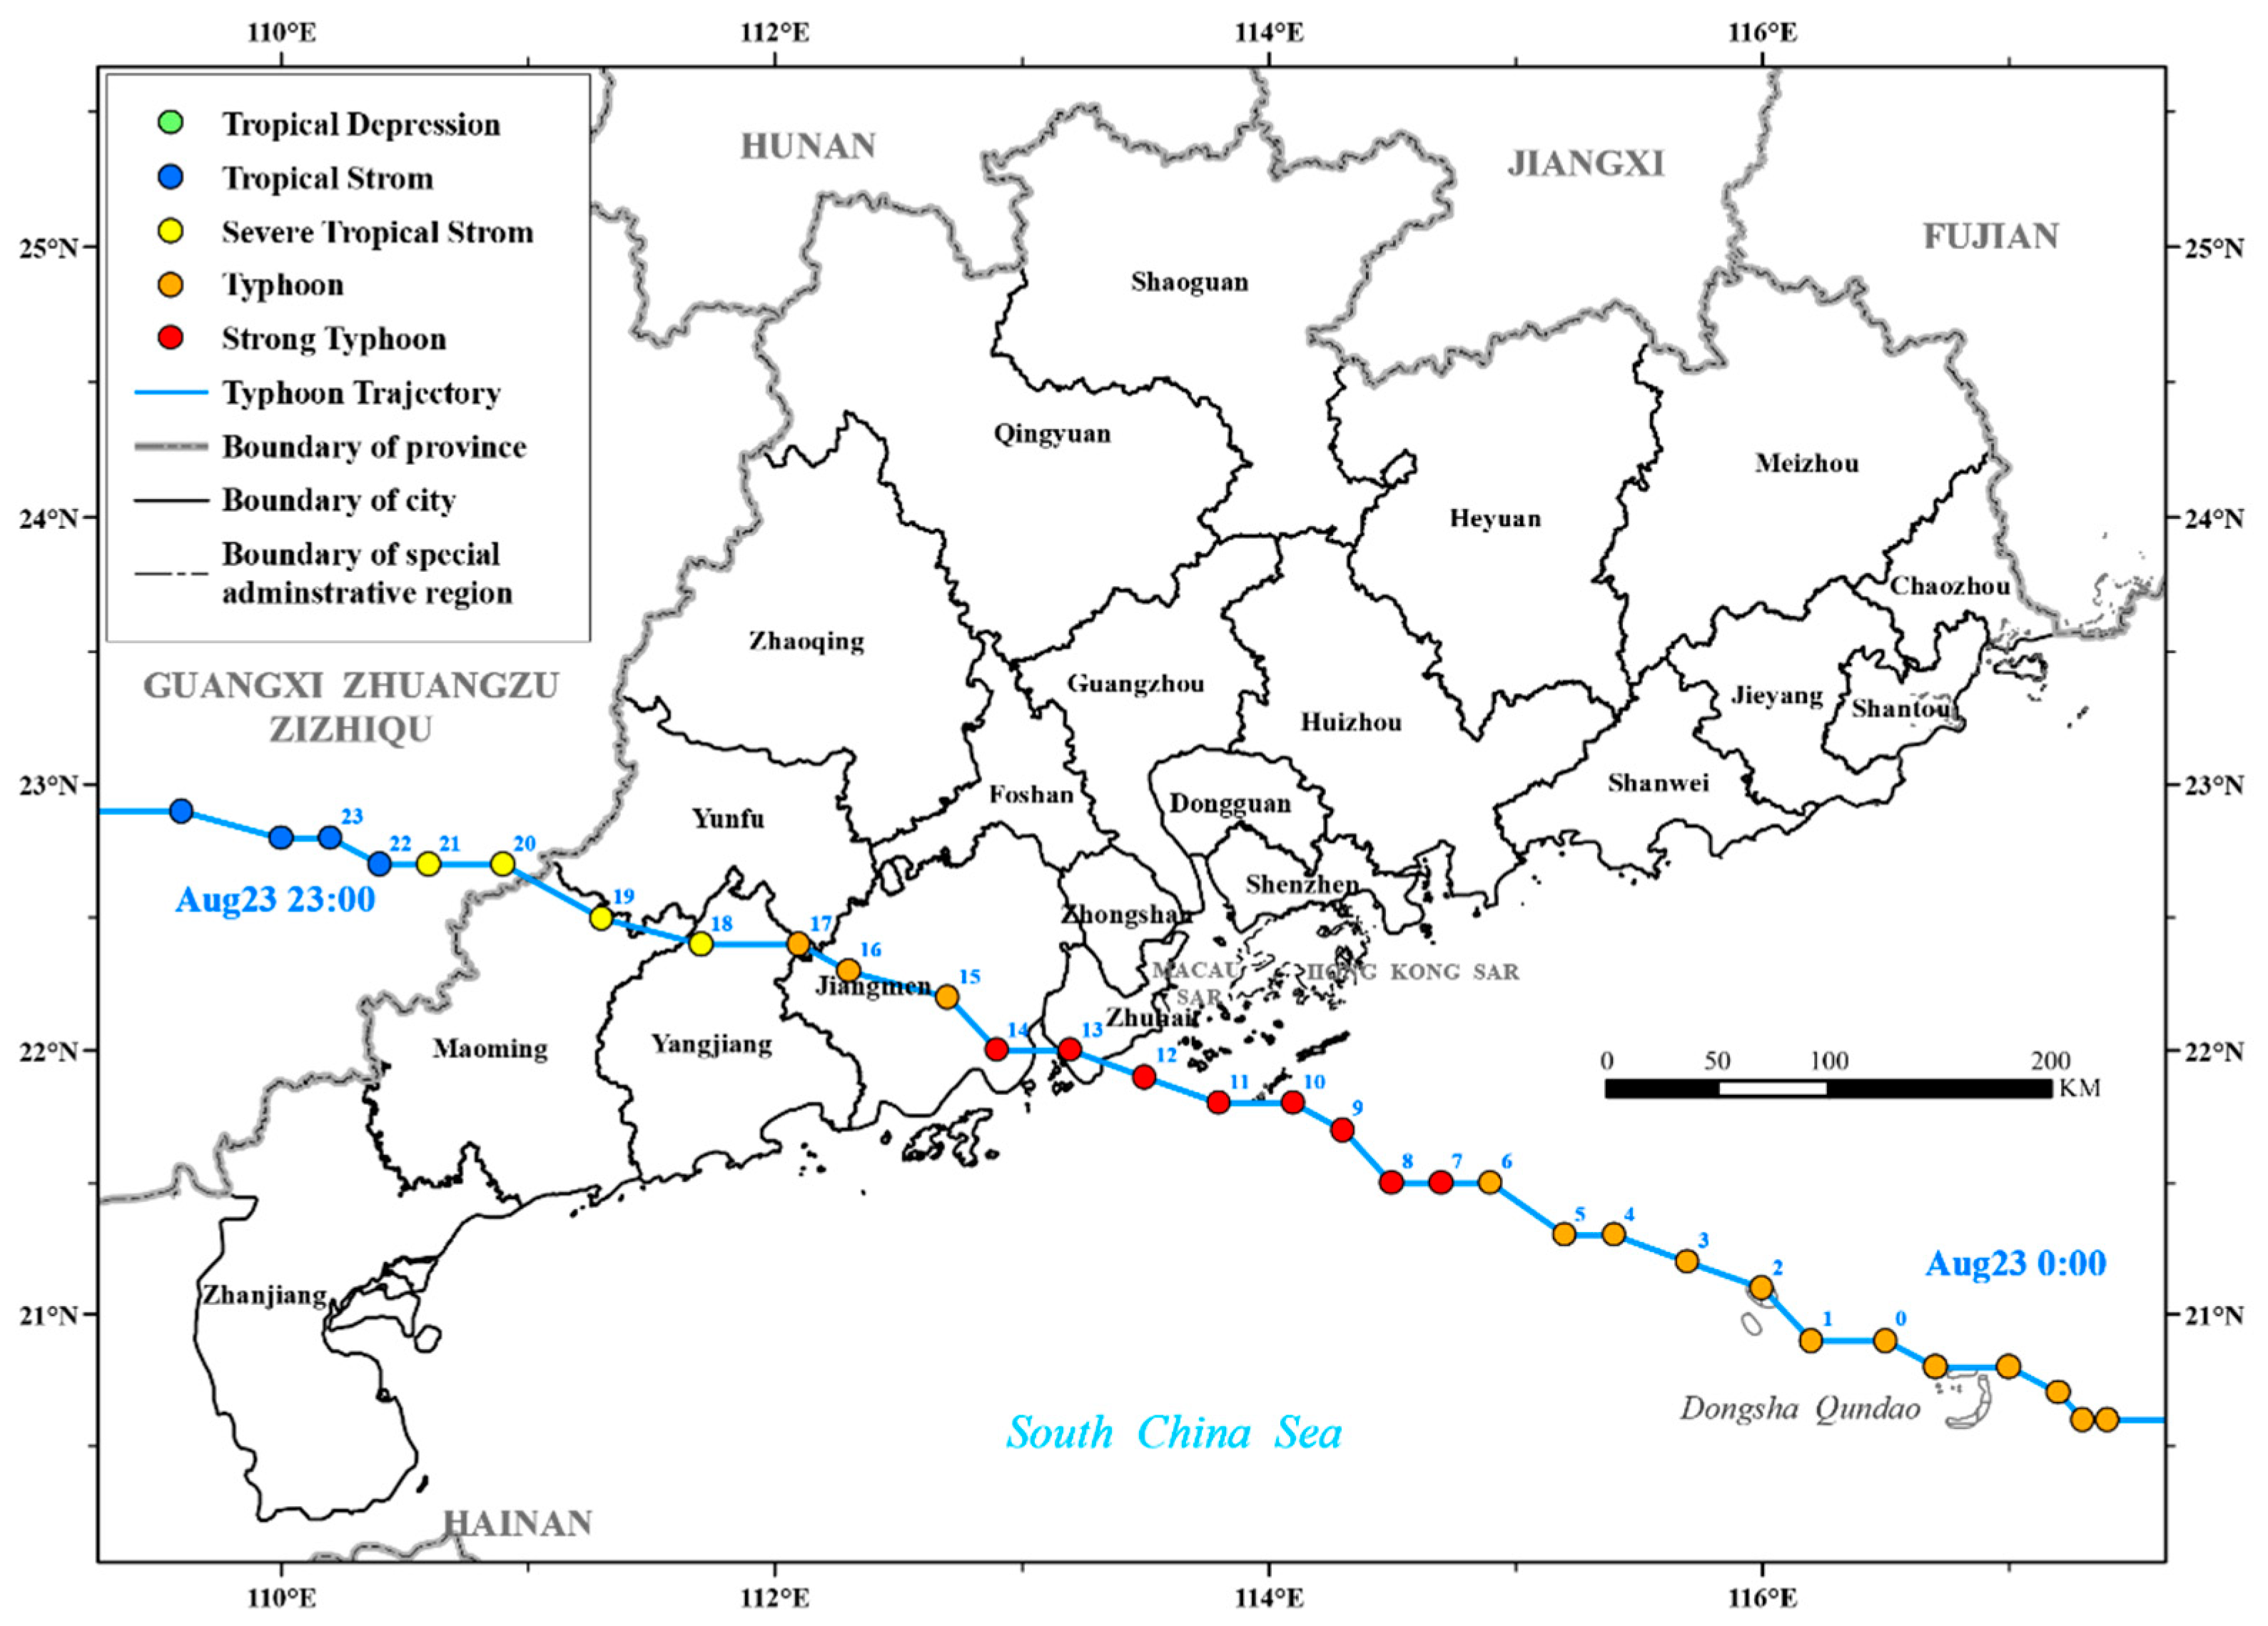
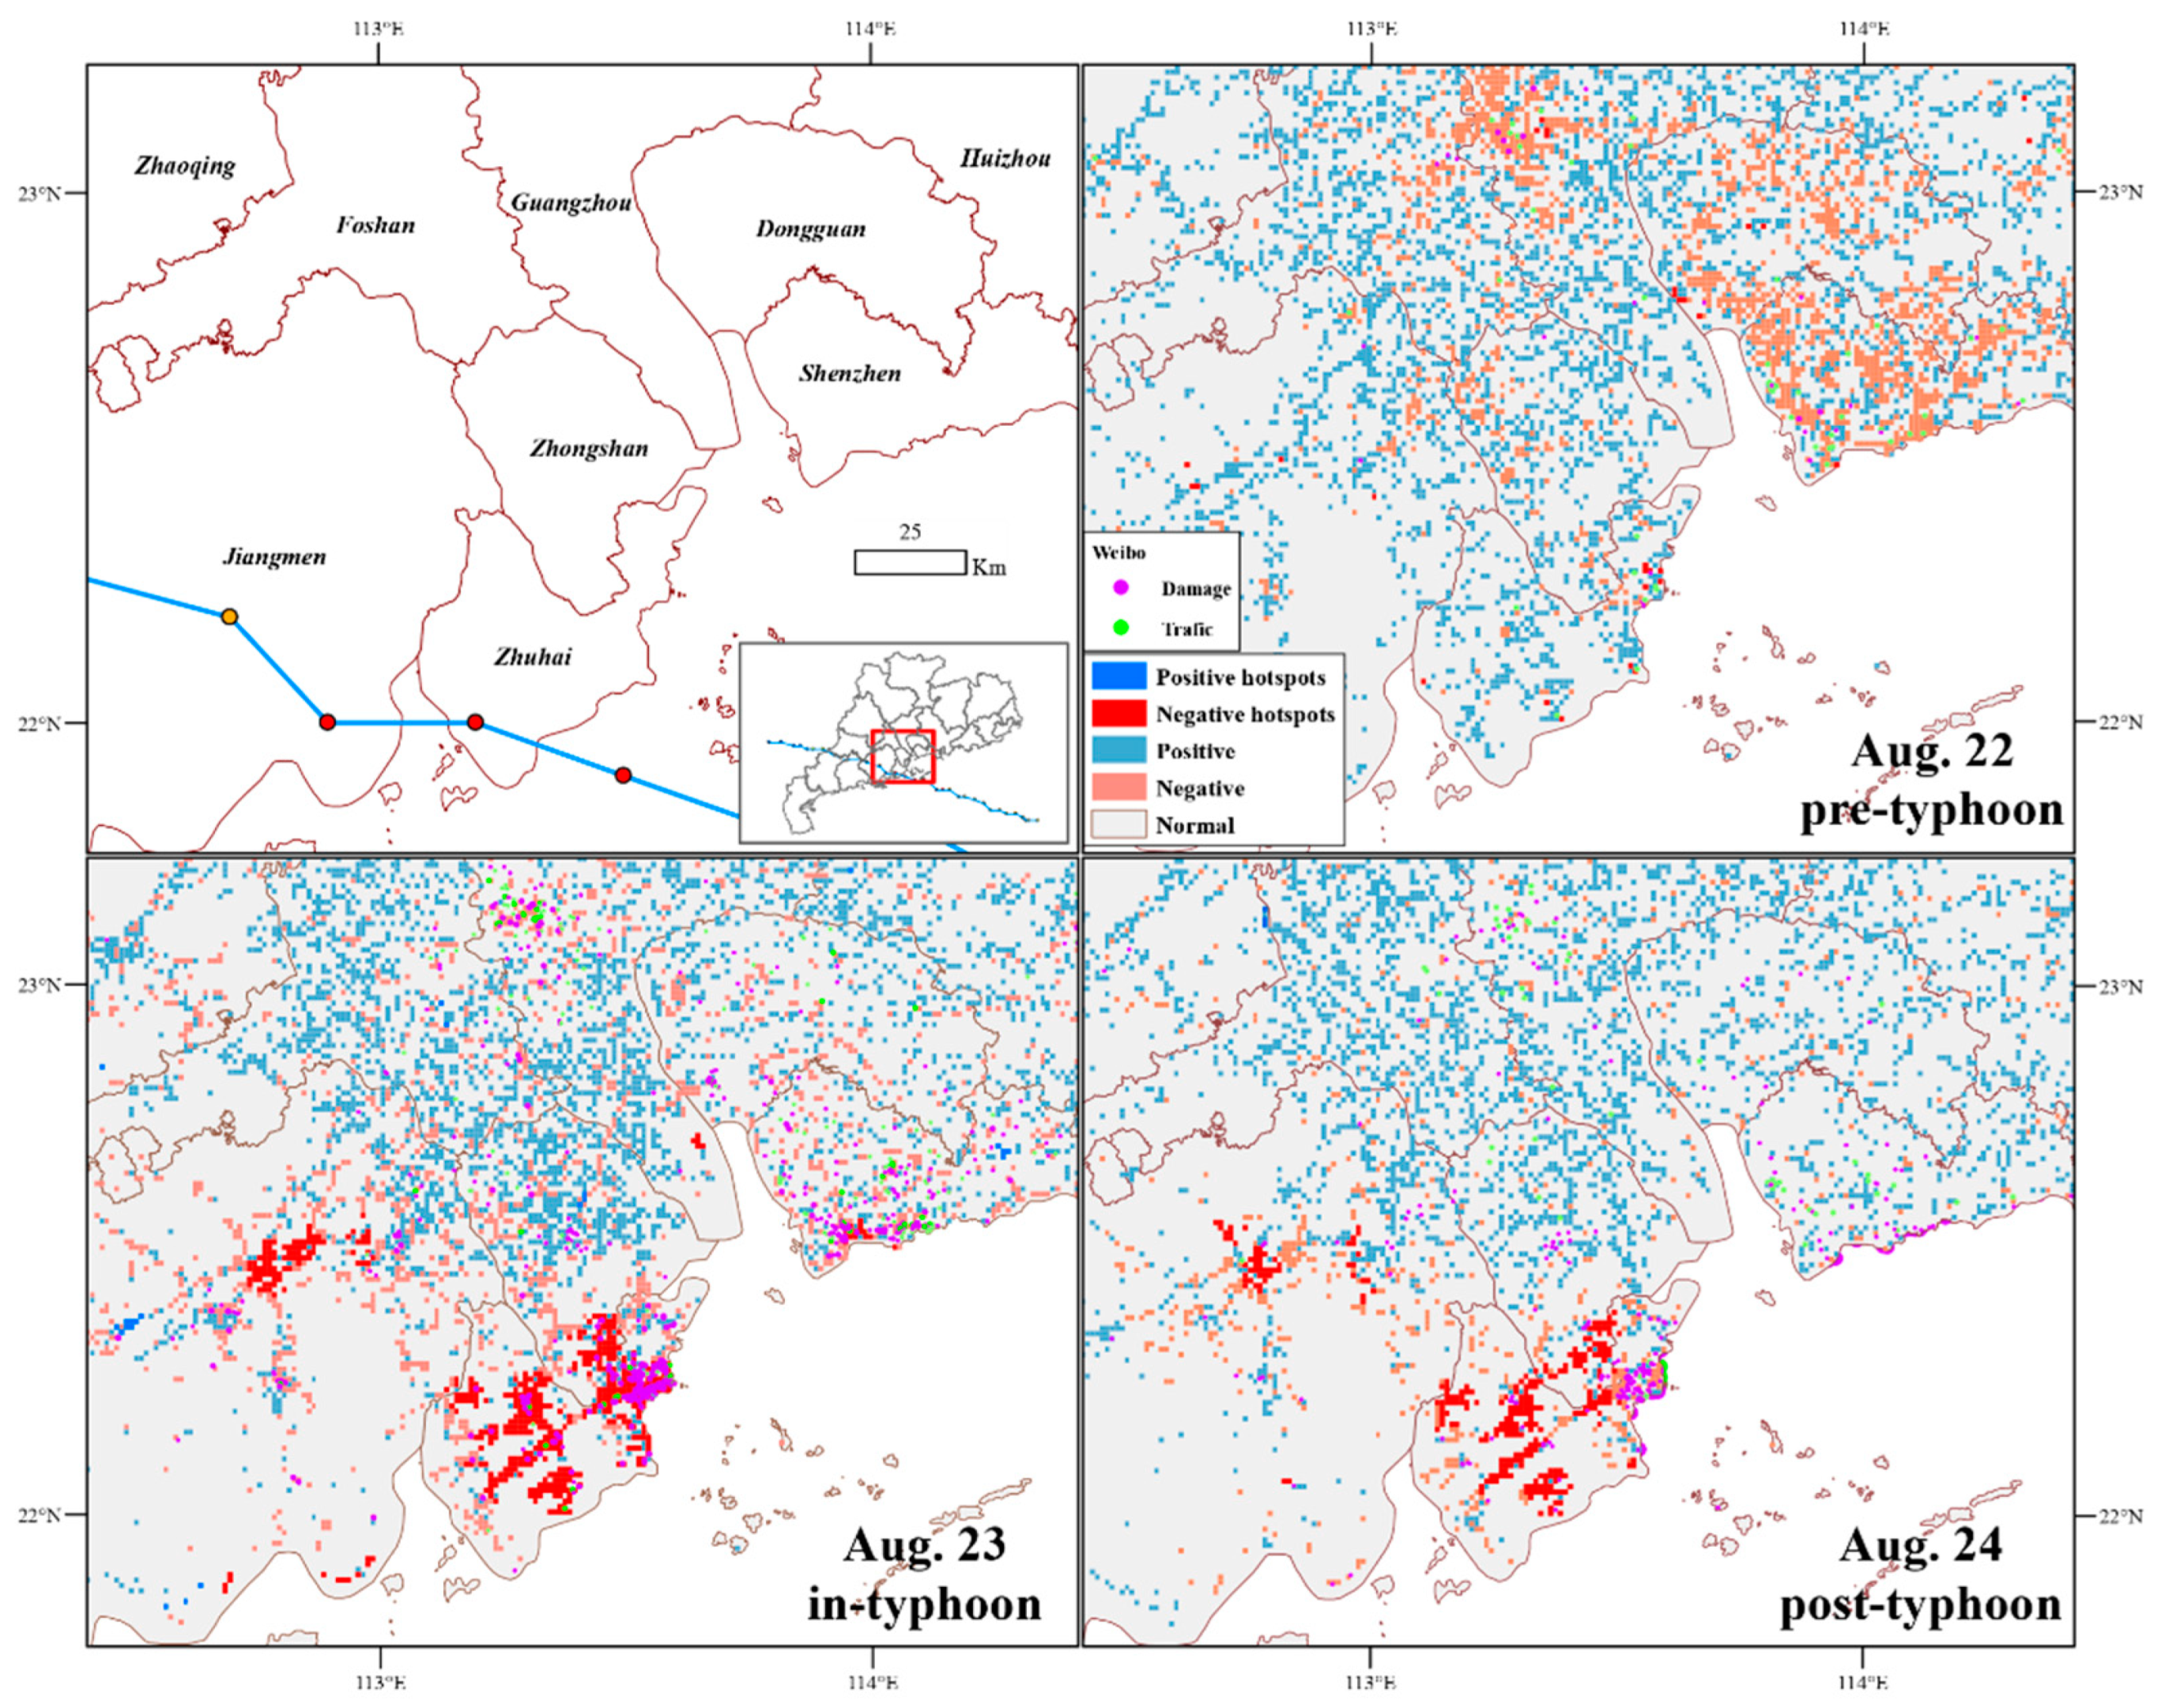
2.1. Study Area and Typhoon Hato

Typhoon Hato is a strong tropical cyclone that struck Guangdong in August 2017. It caused 32 deaths and USD 4.34 billion in economic loss. Hato is the worst storm that has hit China in recent years. It is also one of the strongest typhoons that hit Macao over the past 50 years [43]. Hato started as a tropical depression over the northwest Pacific Ocean at 14:00 on 20 August and grew as a tropical storm the next day. On 23 August, it intensified as a strong typhoon and made landfall near Jinwan, Zhuhai at 12:50 p.m. It then quickly weakened to a tropical storm and swept through Guangdong (Figure 1).
Guangdong is located in the southeast coast of China. It has a total population of 126.01 million and is the most populous province in China. As of 2020, over 74% of Guangdong’s population live in urban areas. Over the years, Guangdong was also the province in China that was affected by typhoons most frequently [44].

2.2. Data

Tencent’s location big data portal [46] provides gridded numbers of location requests with a spatial resolution of 0.01 × 0.01 decimal degree. A user may generate a location request when she/he uses various mobile applications, including the most popular social media platform WeChat, and the world’s largest travel service platform Didi, and one of China’s most popular e-commerce platforms Jindong, etc. We collected the hourly NLR dataset from 1 August to 31 August 2017 from Tencent’s location big data portal for this study.
The NLR dataset has been widely applied to estimate population dynamics [47,48,49] and previous studies have found that over 60% of the changes in the daily NLR could be explained by the variations in the daily number of tourists in tourist attractions [42], suggesting that the NLR dataset could be used as a proxy measure of the short-term collective human activities. It is worth noting that the non-geotagged human activities are not collected and thus are not included in the NLR dataset.
Geotagged microblogs were obtained from the Sina Weibo platform [50], which is one of the China’s most popular social media sites and has 165 million daily active users. We collected over 1.5 million geotagged microblogs posted in Guangdong in August 2017. The microblog dataset includes the message texts and a range of additional information including message identifiers, user identifiers, follower counts, retweet statuses, self-reported location, and time stamps.
We also obtained the statistics of Hato-induced damage and loss by city from local governments. The statistics dataset includes the number of people who were impacted and direct economic loss. We also obtained hourly wind speed and rainfall data from the 21 meteorological stations in Guangdong in August 2017 from China Meteorological Data Service Centre [51].

3. Methods

Figure 2 shows our data processing and analysis processes. We first used the Seasonal Hybrid Extreme Studentized Deviate (S-H-ESD) method [52] to detect the anomalies in wind, rainfall time series, and NLR time series. Based on the typhoon process, we then defined the anomaly indicators to evaluate typhoon-triggered human activity changes at city scale. The Biterm topic model (BTM) [53] was utilized to categorize and analyze the topics in typhoon-related microblogs. We then analyzed how city dwellers respond to the Hato and assess cities’ responses and recovery process. Finally, we analyzed the spatiotemporal variations in microblogs and investigated the microblog topics within areas with NLR anomalies by spatial overlaying of the abnormal area with microblogs.
In this study, we used the NLR as a proxy of the collective human activities. Accordingly, significantly increased or decreased NLR would reflect human activity anomalies across space and over time. We extracted public opinions from typhoon-related microblogs as microblogs can reflect users’ perceptions of an event.

3.1. Time Series Anomaly Detection

We used the S-H-ESD method to detect anomalies in the NLR time series. The S-H-ESD has six major steps (Equations (1)–(5)). We first decomposed a time series ( X ) into seasonal ( S X ), trend ( T X ), and residual (R) components. We then found the most extreme value in the series R and calculated the corresponding statistic R j (Equations (2) and (3)). The R j was then compared with a critical value using Equation (4) to determine whether the extreme value was an outlier. If it was, we used Equation (4) to calculate its intensity ( I j ) and then removed the extreme value from the time series. If not, its I j   was set to 0. The process was repeated for k   times and an anomaly time series I corresponding to X was constructed.
R = X S X T X
M A D = median ( | R i median ( R ) | )
R j = m a x i | R i median R | MAD ,   1 j k
λ j = ( n j ) t α / 2 N ,   N 2 N ( N 2 + t α / 2 N , N 2 2 ) 1 j k ,   N = n j + 1
I j = i f ( R j λ j 0 , R j λ j , 0 )
where,   k is the maximum number of assumed outliers, n is the sample number of the current time series, t α / 2 N ,   N 2 is the critical value of the t distribution at the significance level α / ( 2 N )   and with a degree of freedom N 2 .

3.2. Human Activity Anomaly Indicators

Table 1 lists the indicators that we used to describe typhoon and human activity at multiple scales. In this study, we described a typhoon process as the time series of its rainfall and maximum wind speed anomaly ( I p   ) and ( I w ), which are the two major characteristics of a typhoon. In this study, the NLR anomalies were used to characterize abnormal human activities. A positive and a negative NLR anomaly implies significant increased and decreased location requests, respectively. A user may generate a location request when she/he is using the applications for navigation, car hailing, food and merchandise delivery, and social media check-ins, etc. As a result, the NLR anomalies may reflect multifaced human activity changes. We first calculated the positive and negative anomaly time series of each grid, respectively (denoted by I n l r ( g r i d ,   p o s ) and I n l r ( g r i d ,   n e g ) ), based on the method described in Section 3.1. We then obtained the time series of the number of positive and negative grids by city through summarizing the number of abnormal grids within a city’s administration boundary. In the end, we calculated the time series of NLR positive and negative anomalies at city scale ( I n l r ( p o s ) and I n l r (   n e g ) ) using the same method in Section 3.1. In our study, the NLR anomaly by grid shows the influence of the typhoon on that grid whereas the NLR anomaly by city illustrates the spatial extent impacted by the typhoon within the city. In fact, the NLR positive and negative anomalies can be observed during both the periods with and without a typhoon. The city-level anomalies as calculated using the above approaches can eliminate the anomalies during the non-typhoon periods and can better reveal how a typhoon could impact human activities as we will discuss in Section 4.1.

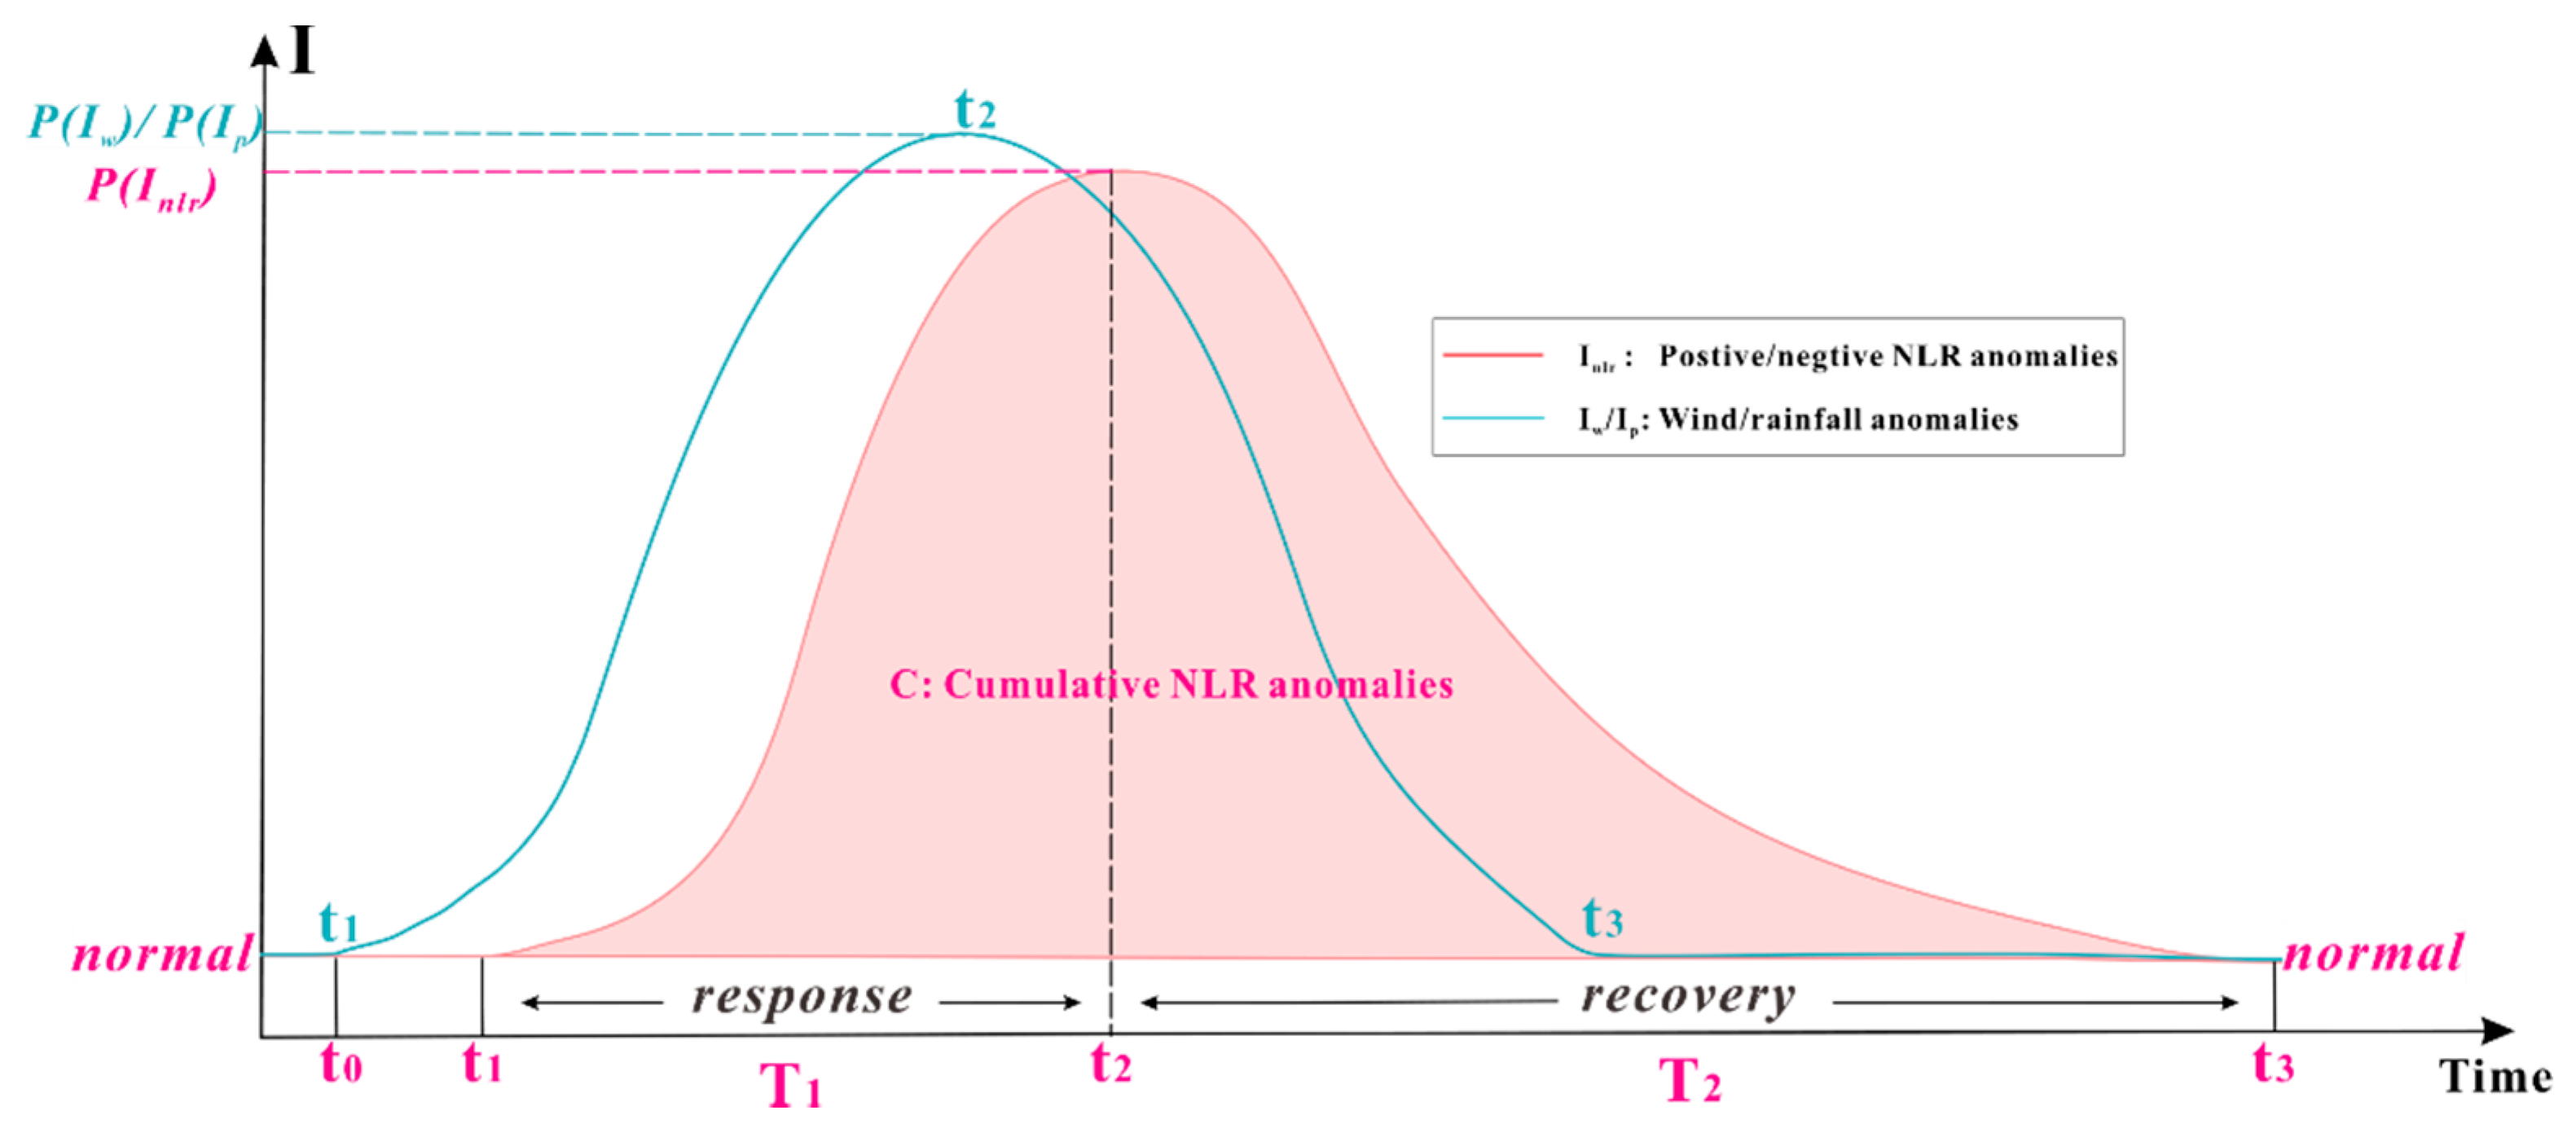
3.3. Response to Typhoon and Recovery

We defined seven indicators to evaluate human activities under typhoon (Figure 3 and Table 2). Empirically, a typhoon process normally consists of pre-disaster, ongoing response, recovery, and post-disaster recovery stages [54,55]. Variations in the NLR can be used to describe the human activities at the response and recovery stages. As illustrated in Figure 3, human activity anomalies increased significantly when an area was impacted by a typhoon, then gradually returned to normal after the typhoon weakened.
The recovery stage refers to the process over which human activities gradually bounce back normal and it is widely used to study a city’s resilience [26,33,54]. In this study, we calculated the recovery time to evaluate how fast a city returns to normal after the typhoon. We then used the maximum and cumulative NLR anomalies to evaluate the impacts of a typhoon on a city. We also identified the linear relationship between the typhoon-induced damages and the maximum and cumulative NLR anomalies, respectively.

3.4. Typhoon-Related Microblogs and Topic Analysis

We obtained 12,167 typhoon-Hato-related geotagged microblogs by examining the hashtags and extracting messages containing ‘typhoon’ or ‘Hato’. We then cleaned the microblogs and removed all non-Chinese characters such as the punctuations, emojis, links, and other characters. Next, we manually removed the microblogs that were irrelevant to the typhoon disaster, such as those for advertising promotion. Finally, the sentences with a text length from 10 to 128 characters in the cleaned microblogs were then segmented and clustered into groups based on their topics.
We used the BTM to extract topics in microblogs. This model has been widely used in disaster-related microblog topic extraction [56,57,58,59], as it outperforms the conventional topic models such as LDA [60]. The BTM model learns the topics through modeling the word co-occurrence patterns in the whole corpus and cluster microblogs based on the frequency and distribution of the bi-terms in the sentences. However, it is an unsupervised model, and the users need to set the number of categories manually and interpret the meanings of the clustering results. In practice, the BTM first specifies the number of classification categories and then performs a series artificial selection and merging to obtain the best category number and topics. We followed the framework in [56] and fed the BTM with our cleaned microblogs. We started with 20 topics and with an increment of five topics in each experiment until we obtained 40 topics. In the end, we selected the experiment with 30 topics as the results show the most recognizable keyword groups. We then labeled the topics based on the subcategories of disaster-related topics [61] and grouped the topics into nine major categories based on their parent categories. Finally, as shown in Table 3, we manually labeled samples that were randomly selected from the cleaned microblogs dataset and evaluated the accuracy of the results by using precision, recall, and accuracy (Equations (6)–(8)). The accuracy is 70.3%, which is similar to a previous study [59].
Precision = TP ( C i ) TP ( C i ) + FP ( C i )
Recall = TP ( C i ) TP ( C i ) + FN ( C i )
Overall   Accuracy = i = 1 k C i S
where, k is the total number of classes. C i refers to a specific topic, TP is the number of the correctly classified microblogs, FP is the number of microblogs that are incorrectly classified in C i , FN is the number of microblogs that should be classified into topic C i but are classified into other topics. S is the total number of samples, in this case 600.

4. Results

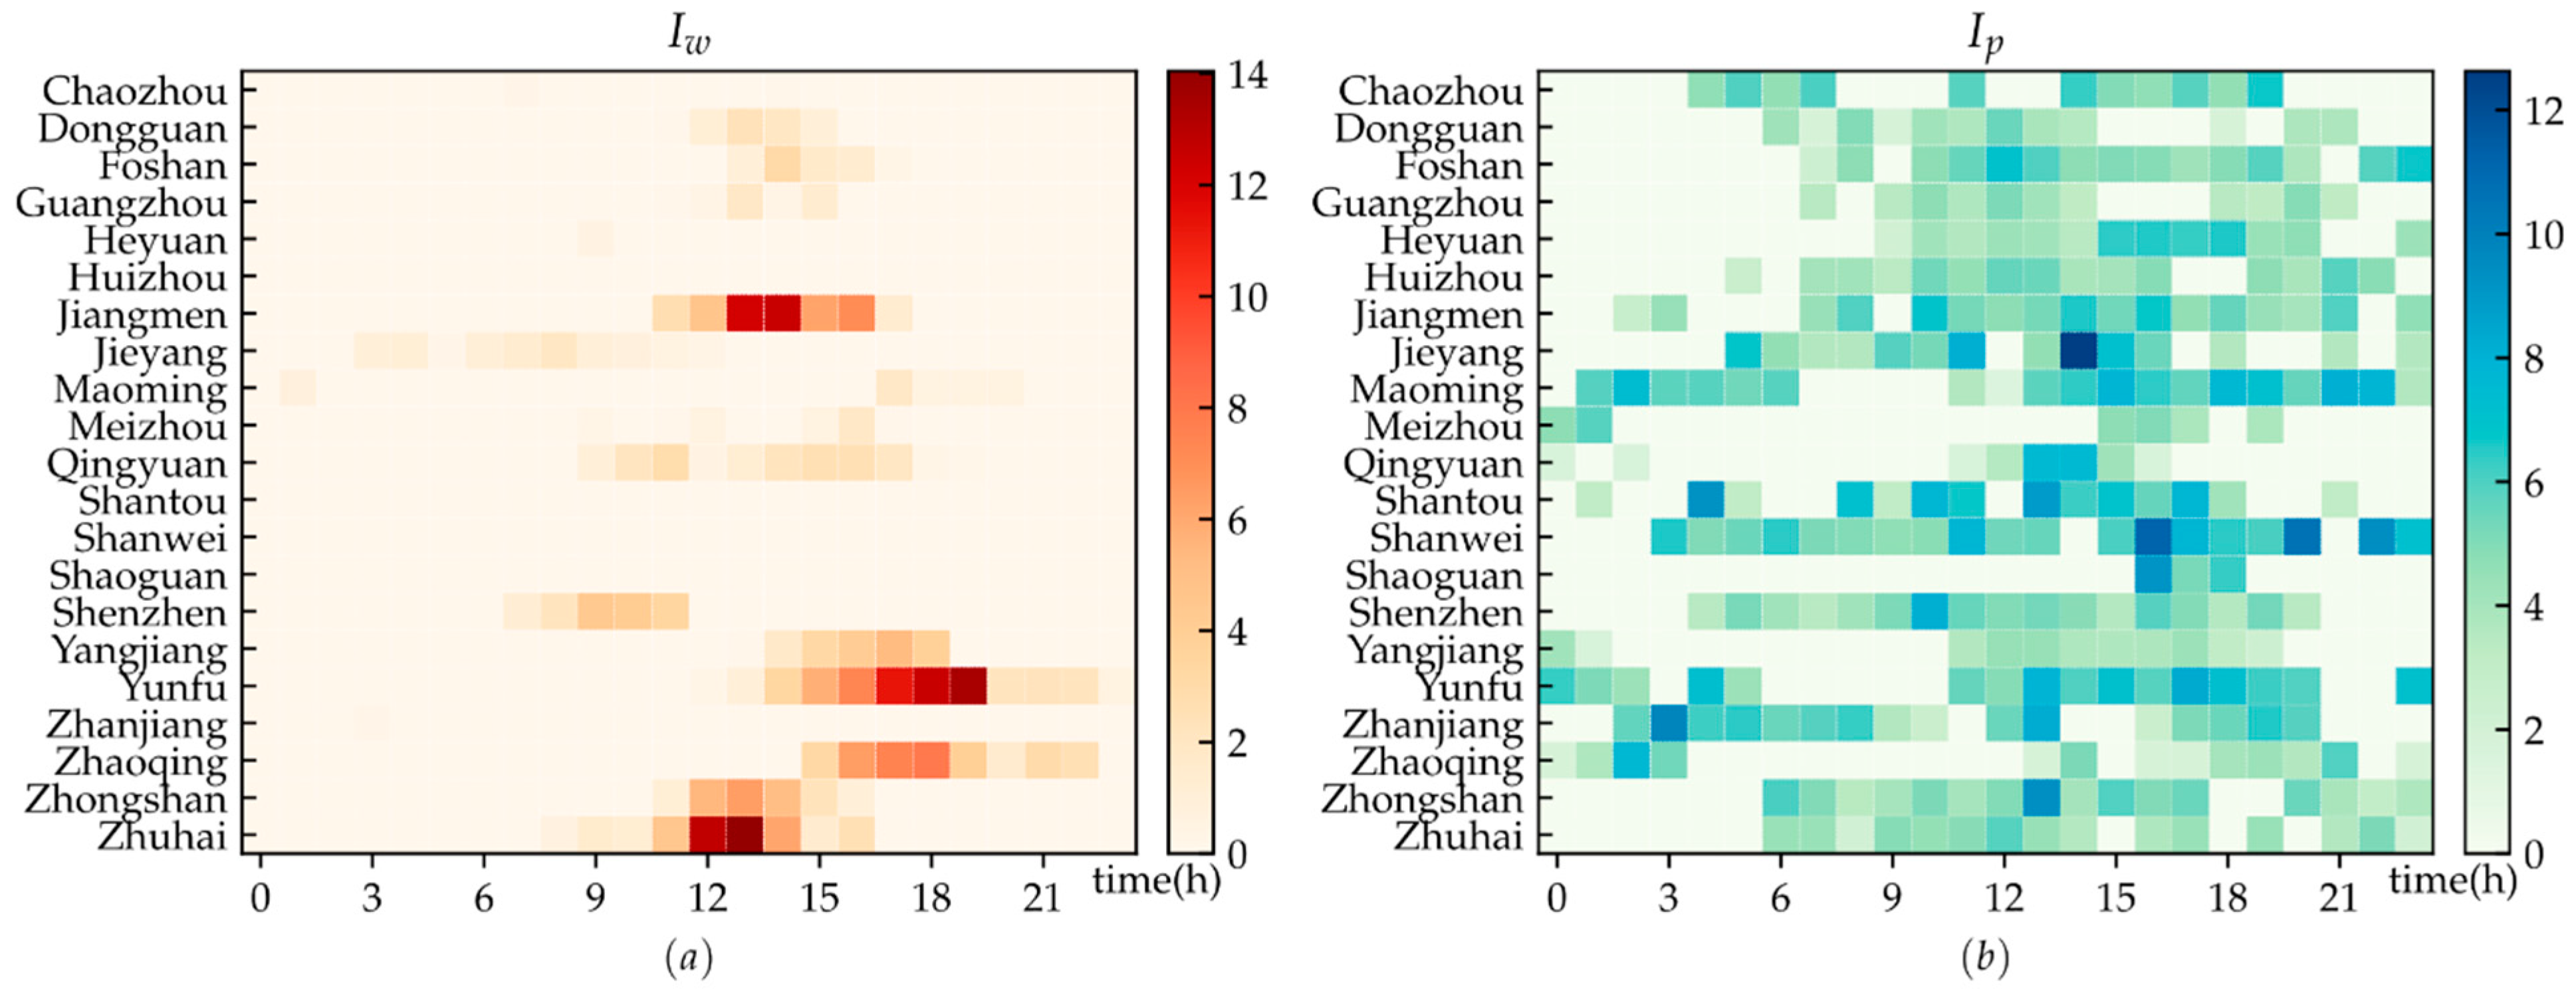
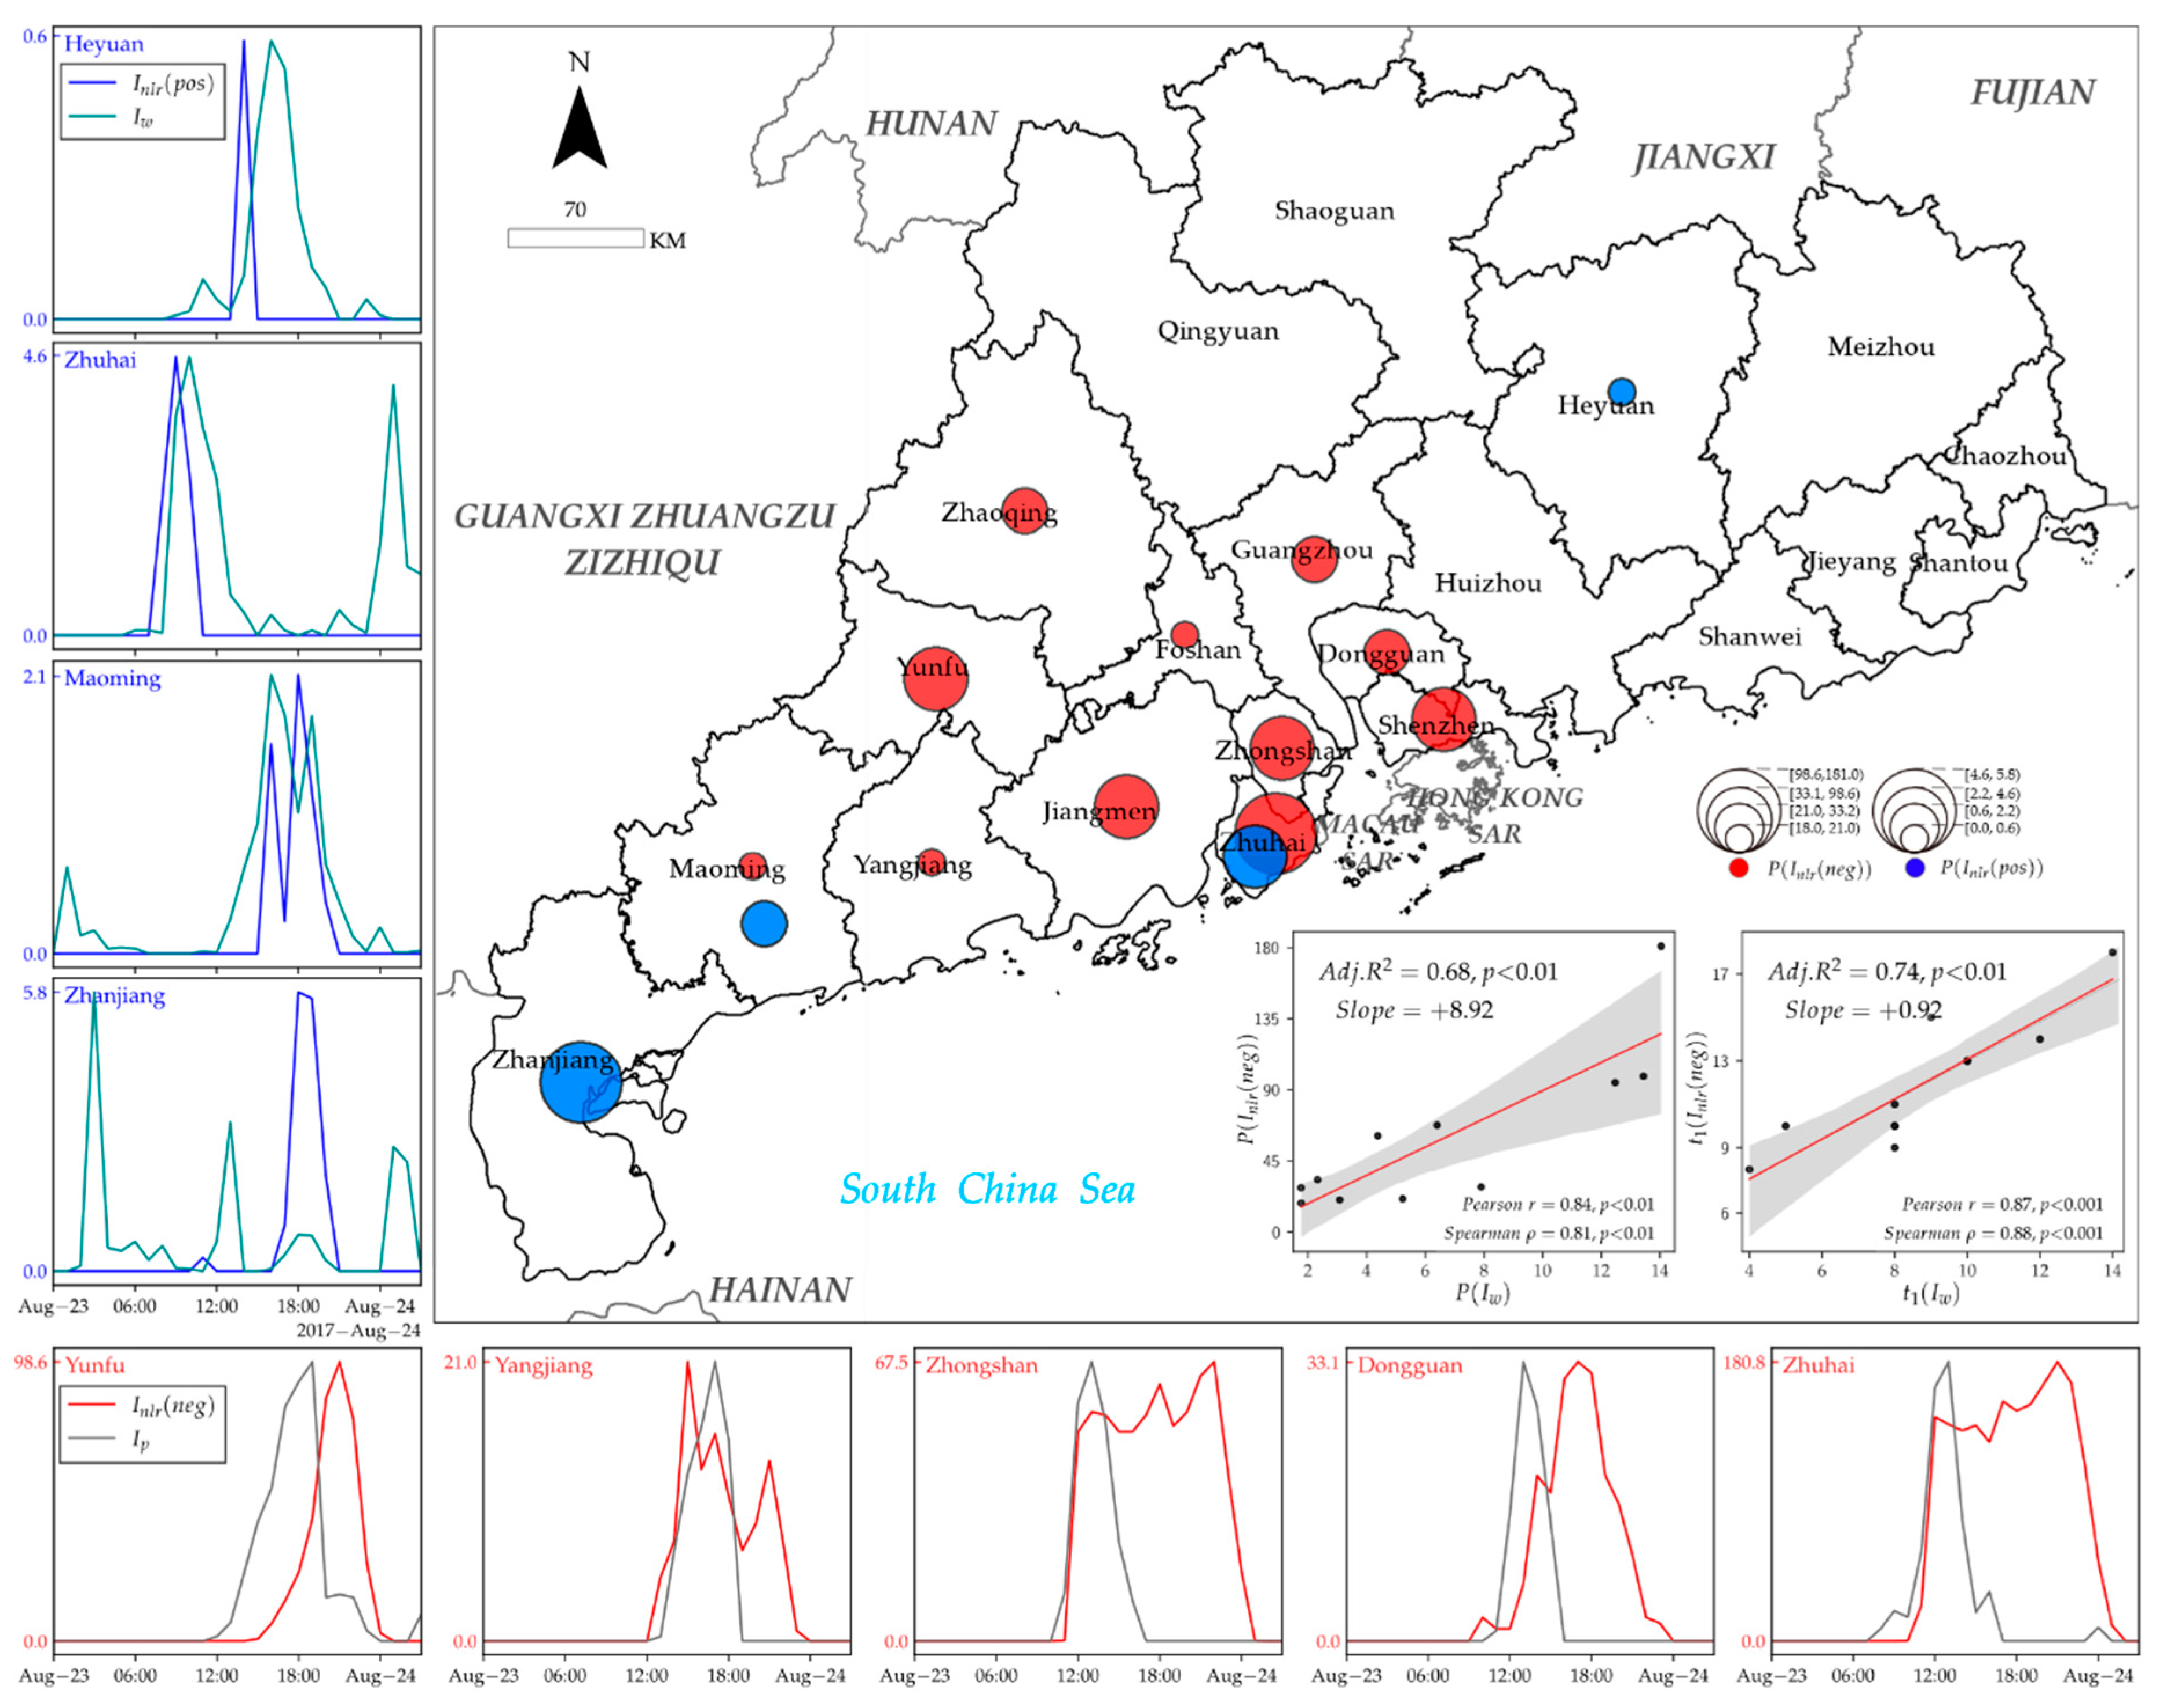
4.1. City-Level Human Activities in Response to Hato

Variations in wind speed and rainfall intensities show Hato’s dynamic evolution and its physical impacts on our study area. Figure 4 shows the hourly changes in the wind speed and rainfall anomalies in each city on 23 August, the day when Typhoon Hato landed and swept through Guangdong. Hato began to gradually strengthen from about 7:00 a.m. and landed in Zhuhai city at 12:50 p.m. with a wind speed of nearly 45 m/s. Subsequently, it gradually weakened and departed Guangdong province at about 22:00 pm when the wind speed dropped to 23 m/s. Hato impacted Zhuhai the most, as well as Jiangmen and Yangjiang. Hato also dumped up to 20 mm/h of rainfall to many cities in Guangdong, particularly Jieyang, Shanwei, and Maoming.
The negative NLR anomalies are correlated with wind speed whereas the positive NLR anomalies are associated with typhoon-induced rainfall (Figure 5). When impacted by Hato, human activities in 11 cities showed significantly negative NLR anomalies. Furthermore, the I w and I n l r ( n e g ) curves of these 11 cities show a similar variation trend regarding the maximum ( P ), start time ( t 1 ), and recovery time ( T 2 ) , particularly in Yunfu, Yangjiang, and Dongguan.
The association between the NLR anomalies and the wind speed was further validated by statistical analyses (Figure 5). The Pearson r and Spearman rho between P ( I n l r ( n e g ) )   and P ( I w ) are 0.84 and 0.81, respectively, and between the t 1 ( I n l r ( n e g ) ) and t 1 ( I w ) are 0.87 and 0.88, respectively. The correlations are all statistically significant with p < 0.01.
However, four cities show positive NLR anomalies (Figure 5), including Heyuan, Zhuhai, Maoming, and Zhanjiang, though Hato dumped significantly heavy rainfall to many cities (Figure 4b). We also found a positive relationship between the positive NLR anomalies and Hato-induced rainfall in these cities except Zhanjiang. Meanwhile, the durations of positive NLR anomaly processes in all these four cities were much shorter than those showing negative NLR anomalies, suggesting human activities were mainly affected by wind speed during typhoon Hato. It is not a surprise that heavy rainfall tends to change dwellers’ normal activities significantly and trigger more location requests. For example, car hailing and food delivery demand, therefore location requests, may increase significantly due to the short and heavy rainfall. This finding is consistent with previous research [62].

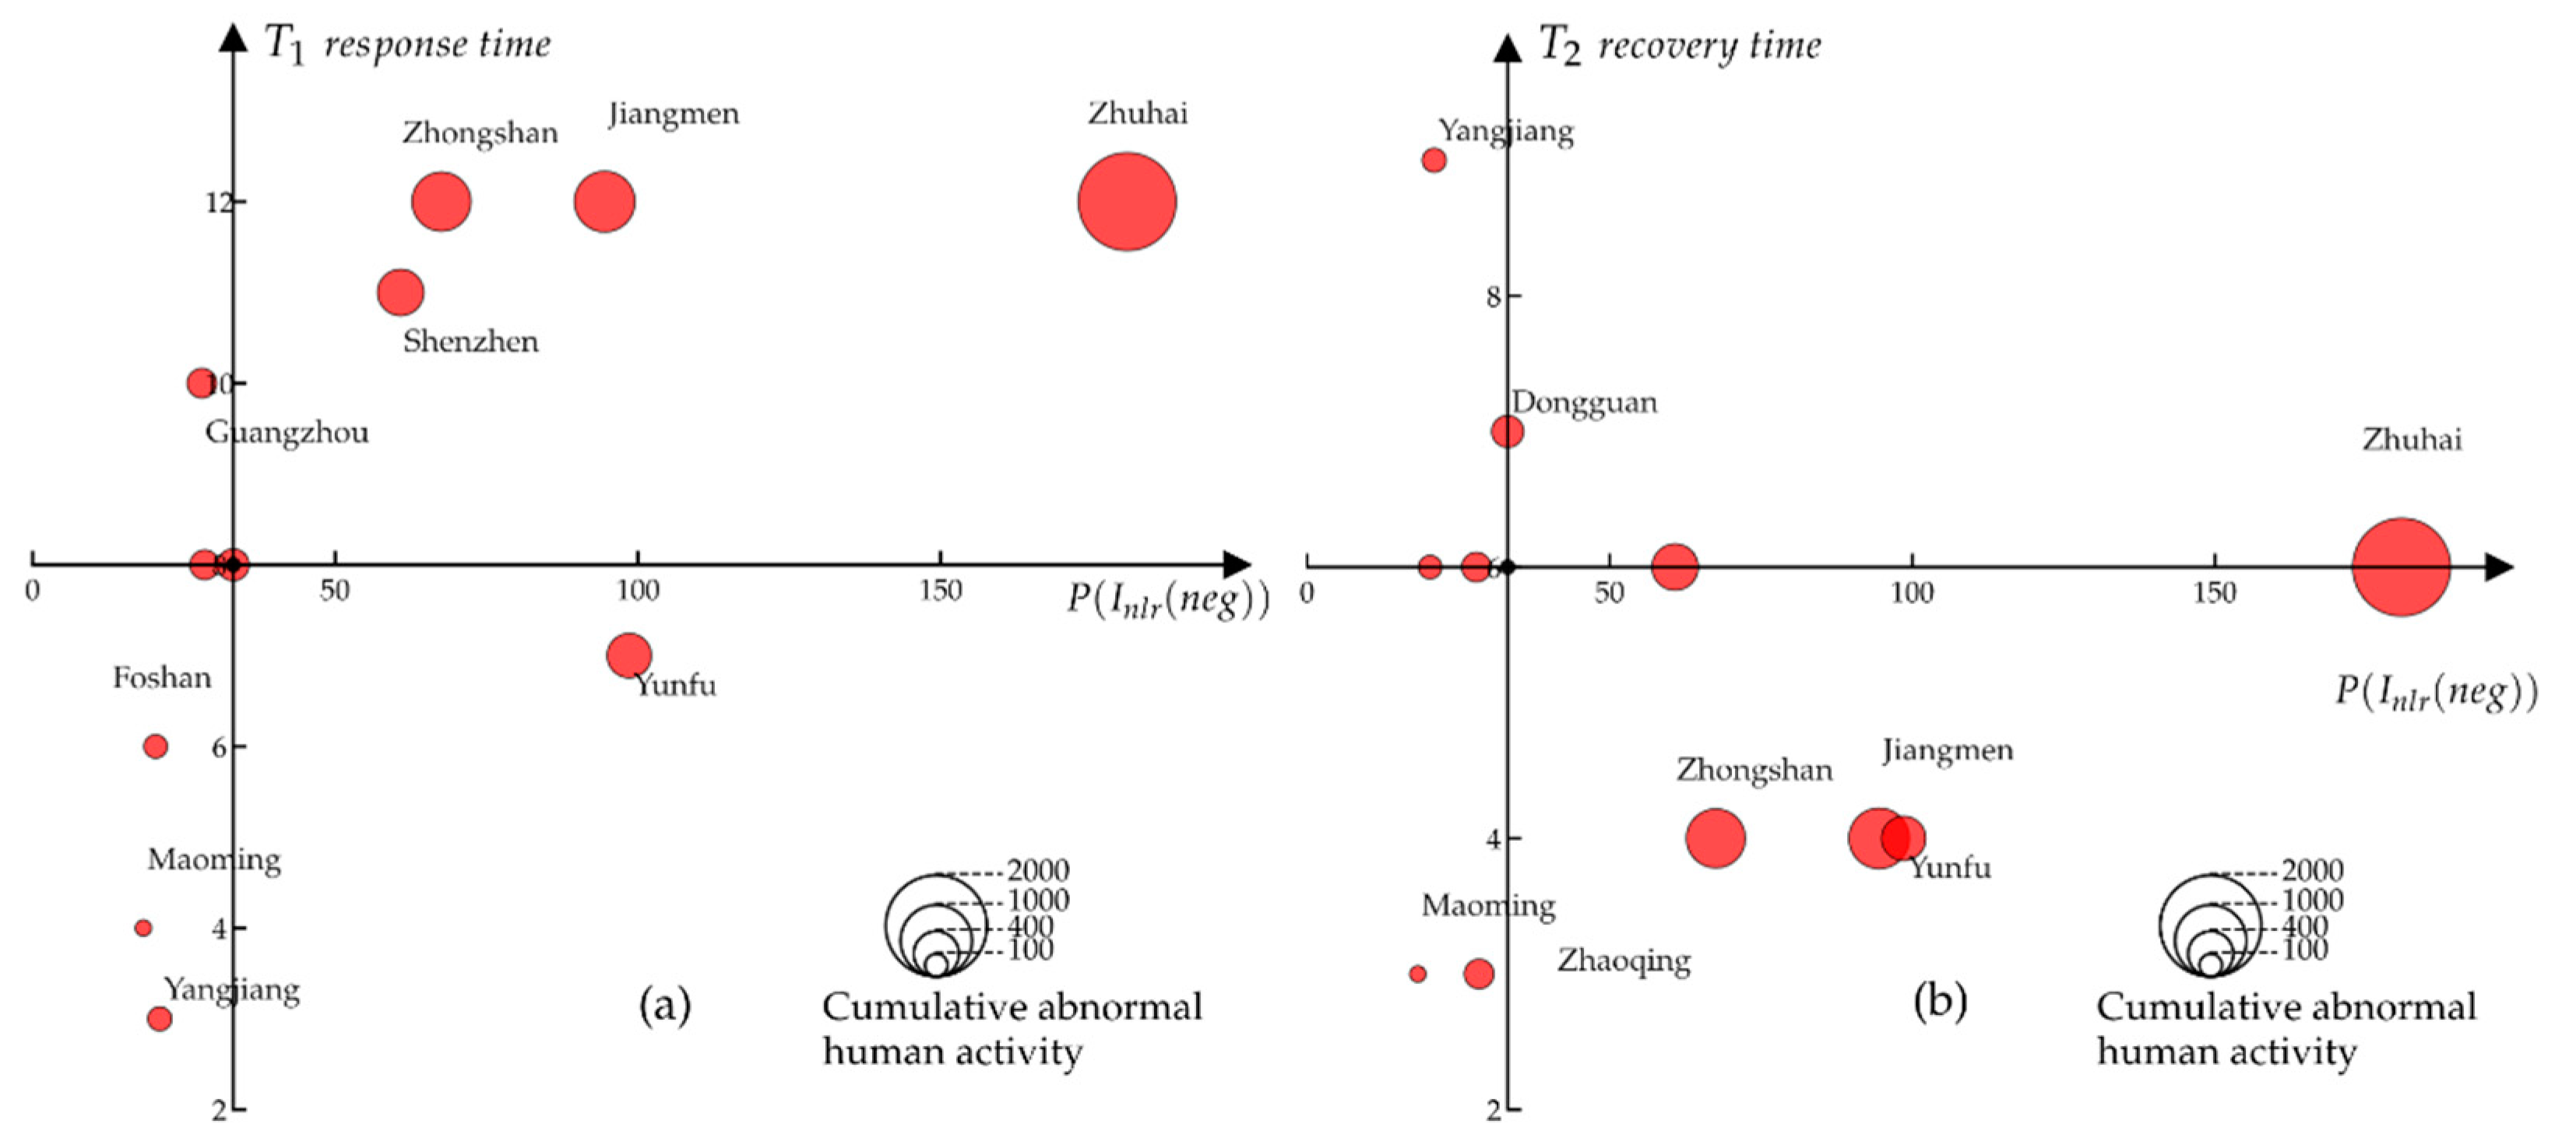
4.2. Assessment of Typhoon Process, Cities’ Responses, and Recovery

Figure 6 shows how the 11 cities impacted respond to Hato. Generally, the cities impacted more severely by Hato have a longer response time ( T 1 ) though notable distinctions exist among cities (Figure 6a). The response time varies significantly in some cities such as Yangjiang, Maoming, and Guangzhou that are less affected by Hato. More specifically, Guangzhou shows the longest response time, which may be due to its large population. On the other hand, some cities were impacted more by Hato yet show a shorter response time. For example, Hato hit Yunfu four hours later after it landed in Zhuhai but its response duration lasted only four hours, possibly indicating that dwellers in Yunfu were well informed and responded rapidly before Hato entered the city’s territory (Figure 6a).
The recovery time ( T 2 ) in different cities varied significantly across our study area (Figure 6b). Overall, the cities impacted more significantly showed a shorter recovery time period. More specifically, the recovery time of Zhuhai, Jiangmen, and Yunfu, which were on Hato’s path, was between four and six hours. By contrast, the recovery time in the cities that were less impacted ranged from 3 to 9 h. Yangjiang had the longest recovery time of 9 h, highlighting the weaker disaster resilience in this city.
The negative NLR anomalies are associated with Hato-induced damage at the city level. As shown in Table 4, the strongest correlation was found between the maximal NLR anomalies and the direct economic loss as suggested by an adjusted R 2 of 0.80; and between the cumulative NLR anomalies and the affected population ( adjust   R 2 = 0.84 ). Such associations show that human activity anomalies could be used to support the rapid hazard-induced damage assessment.

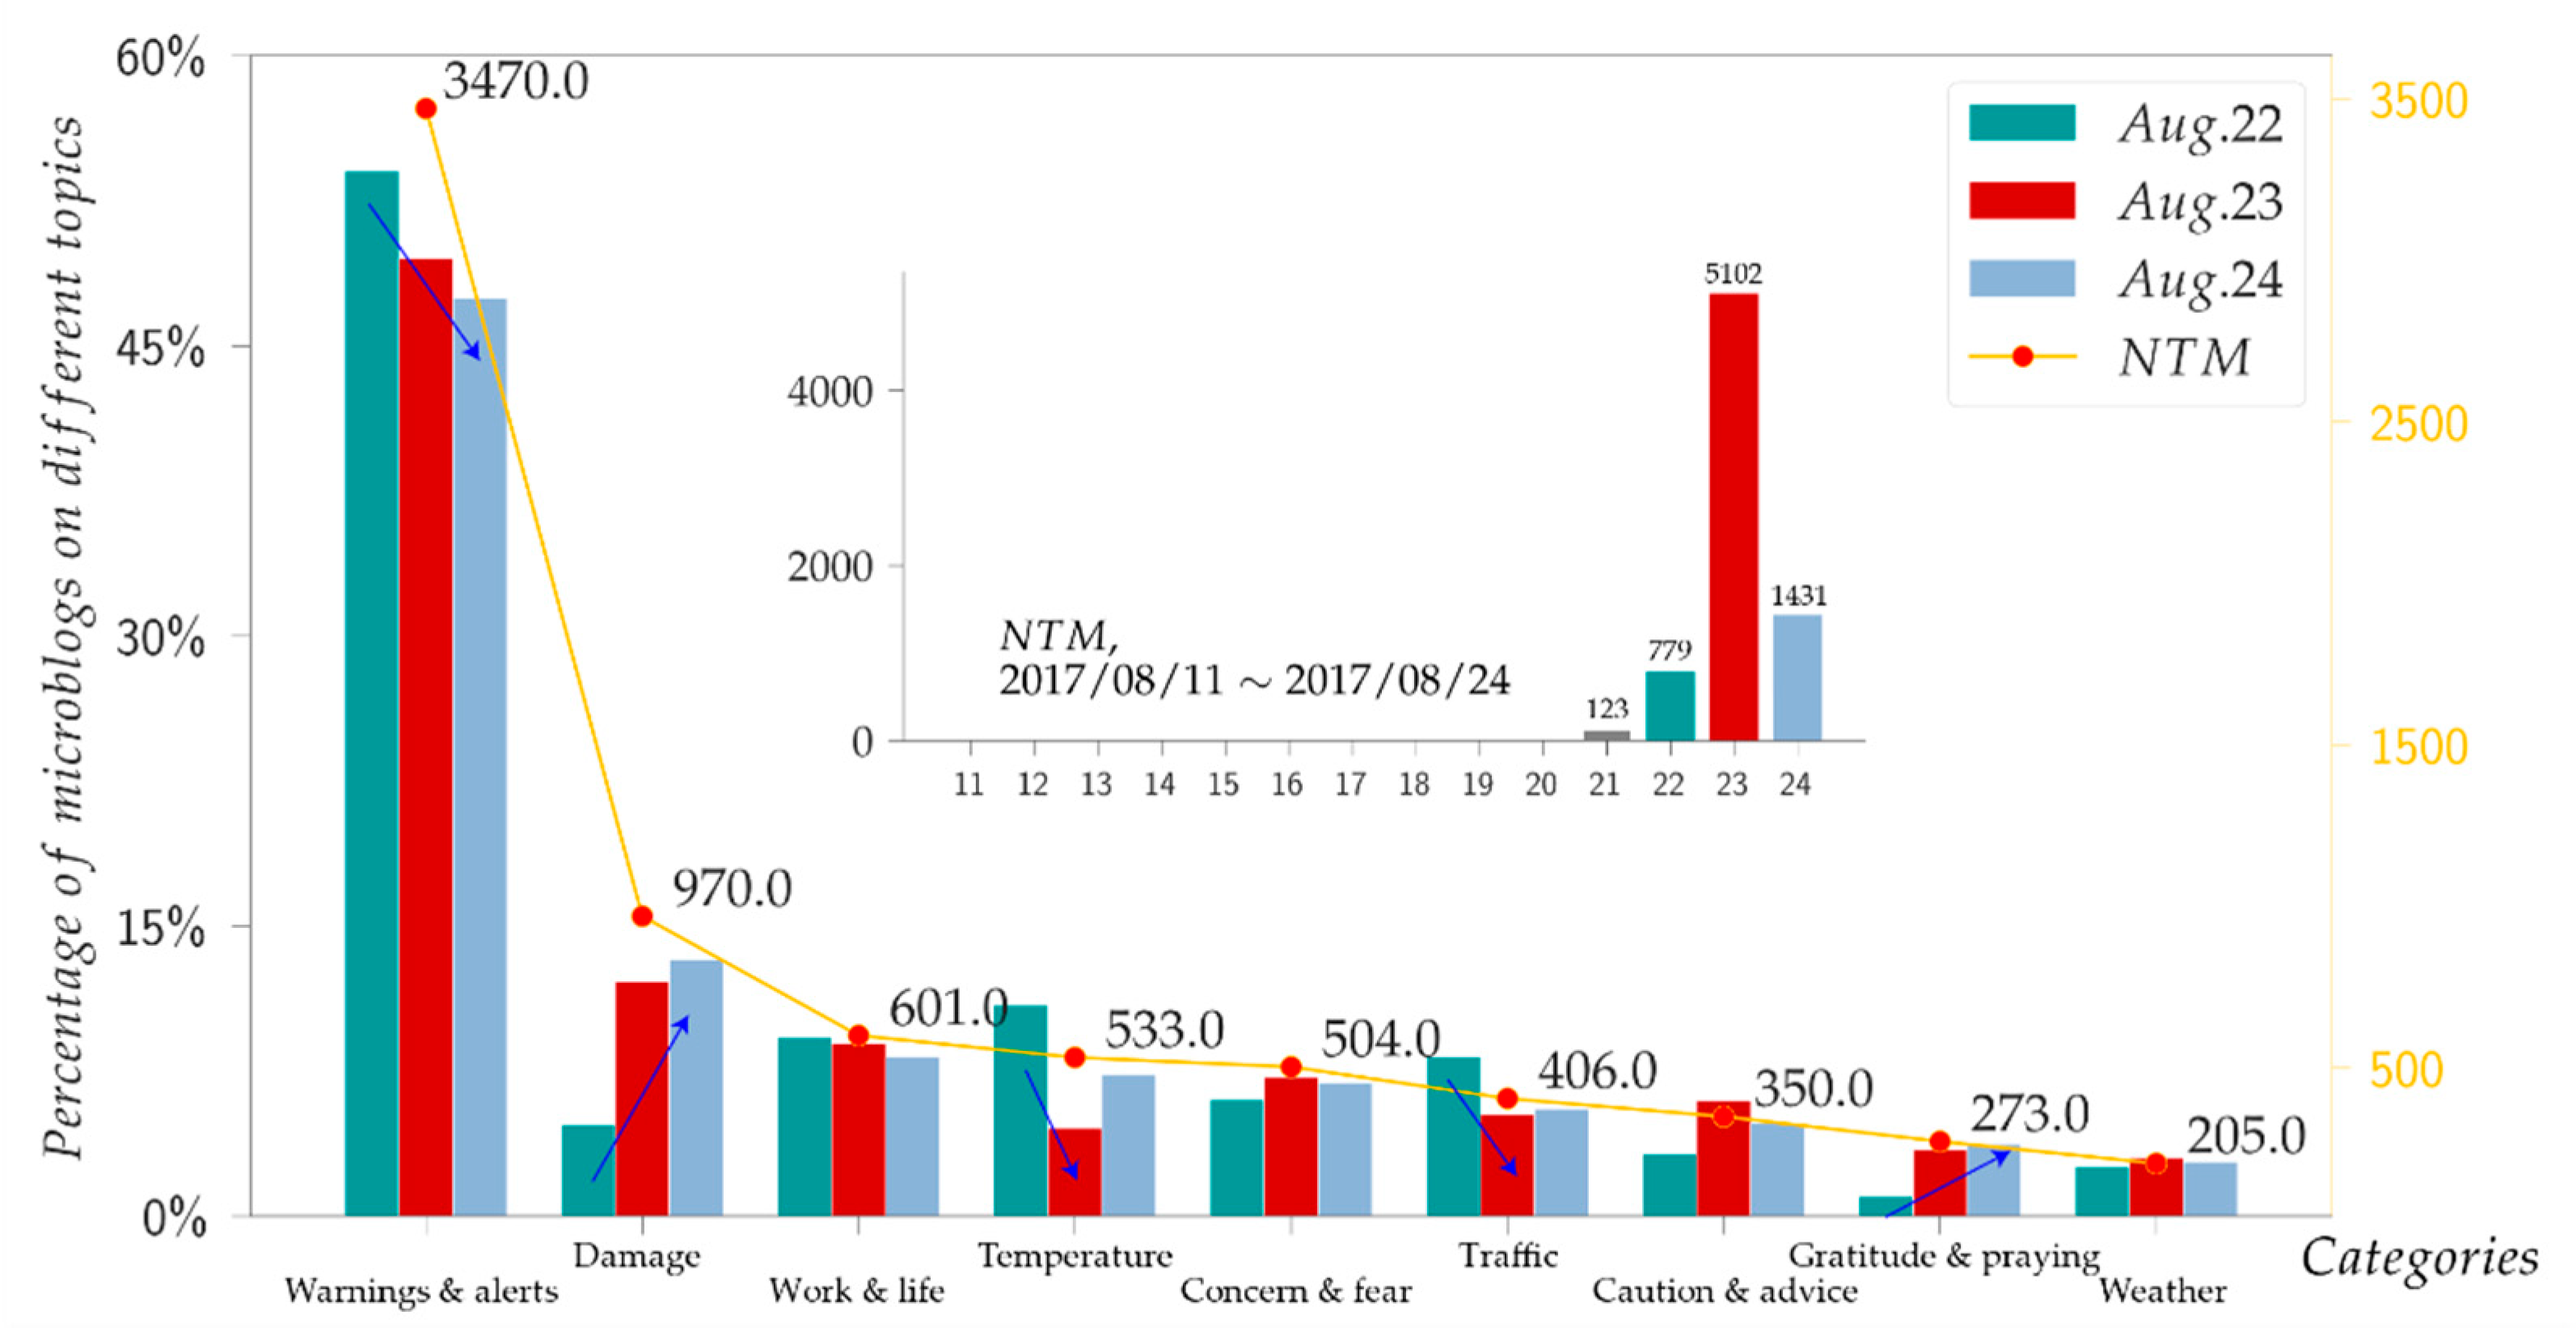
4.3. Topics of Typhoon-Related Microblogs

The Hato-related microblogs are grouped into nine distinct and diverse categories (Table 5), which characterize the influences of the typhoon on dwellers in multiple aspects. For example, during the typhoon process, the warnings and alerts topic group generally covers the information about typhoon’s landing location and early warning, transportation hub shutdown, and school closure announcements that were mainly issued by governments. The damage topic group includes the information about water outages, power outages, and fallen trees or branches. The topics related to traffic include information about flight delays and subway suspensions. The microblogs also show a cooling topic as Hato brought cool air to Guangdong in a hot summer and dwellers were excited about that.
The temporal variations in the number of typhoon-related microblogs (NTM) in different topic categories reveal the different concerns of the dwellers in response to Hato from 22 to 24 August (Figure 7). About 70% of the Hato-related microblogs were posted on 23 August, when the typhoon hit our study area most significantly. The largest number of Hato-related microblogs are found in the warning and damage categories, accounting for over half of all Hato-related microblogs. The topics in the warning and alerts, damage, temperature, traffic, and gratitude and praying categories show significant changes over time. As the typhoon approached and departed Guangdong, the number of the microblogs in the warning and alerts topic category gradually dropped, whereas those in the damage and gratitude and praying topic categories gradually increased over time. Furthermore, we also found more traffic-related microblogs were posted before the typhoon, more cooling-related microblogs were posted before and after the typhoon. By contrast, microblogs in the caution and advice topic category were more popular during the typhoon process.

4.4. Topic Analysis within Areas with NLR Anomalies

The microblogs in the areas with positive and negative anomalies tend to center around a specific topic. We first identified whether a grid shows no, positive, or negative anomalies. A grid is identified as with a positive anomaly if it shows positive anomalies over a longer period than when it shows negative anomalies. We then used the Getis-Ord Gi* [63] method to examine whether there are significant hotspots of positive and negative anomalies (p < 0.05). Finally, we conducted the Two-Proportions test to examine if the proportion of the microblogs regarding a specific topic in an area with a positive NLR anomaly is significantly higher than that of the microblogs regarding the same topic in another area (Table 6).
Table 6 shows the associations between the topics in the microblogs and the positive and negative NLR anomalies. In the areas with a positive NLR anomaly, the proportion of traffic-topic-related microblogs (the F column in Table 6) is significantly higher than in other areas though the proportion is only 8%. The numbers of damage- and concern and fear-related microblogs (B and E) in negative anomaly areas are both significantly higher than those in the areas with normal NLR, particularly in the hotspots with negative anomalies (28%). As a result, the negative NLR anomalies are well associated with disaster-induced damage and the positive anomalies associated with traffic-related topics, suggesting that negative anomalies could be used for rapid assessment of disaster loss. By contrast, positive NLR anomalies are likely to show the negative impact of Hato on traffic.
The associations between the areas with anomalies and the proportions of specific-topic microblogs pre- and post-Hato are consistent with the aforementioned proportion test results (Figure 8). Before the typhoon, negative anomalies are mainly found in Guangzhou and Shenzhen. During and after the typhoon, we found noticeable negative anomalies in Zhuhai and Jiangmen, where Hato landed, and most damage-related microblogs were posted.
Although numerous positive anomalies are found in the areas when Hato is passing through, no significant changes in terms of the distribution of abnormal grids were found before and after the typhoon. This may also be the reason why only four cities show significant positive anomalies (Section 4.1). Moreover, traffic-related microblogs were posted during/after Hato and were mainly from Dongguan, Shenzhen, and Guangzhou. However, we cannot find significant a change of grids with positive anomalies in these three cities. More similar studies are needed to validate the findings regarding the positive anomaly during typhoons.
Our results cross-verified the associations between the proportion of specific topic-related microblogs and the areas with NLR anomalies. The semantic information from microblogs provides further knowledge about how dwellers responded to Hato and what the public were concerned with most in the places with significant changes in human activities.

5. Discussion

Results from this study reveal that typhoon Hato triggered significant positive and negative location request anomalies, and a negative NLR anomaly is tightly related to Hato’s wind speed, whereas an NLR positive anomaly to the rainfall. Such findings are consistent with previous studies [54,55], showing that the typhoon had a significant impact on human activities, which could be inferred from the changes in the number of location requests. This study further examined the social media posts, which usually reflect the concerns of the people impacted and how the concerns change in response to the evolution of a natural hazard. In this study, we integrated the semantic information in the microblogs with Tencent’s NLR data to investigate the collective human activities and public concerns in response to Hato as well as the possible reasons that trigger the NLR anomalies. We found that negative NLR anomalies are closely related to damage-related topics and negative emotion, whereas the positive anomalies to traffic-related topics. Our findings suggest that integration of multi-source data can further boost our understating of how people respond to a typhoon.
Many theoretical studies on urban resilience to disasters have been completed [41,54,55] and existing studies show that the urban recovery time after a natural hazard is associated with socioeconomic disparities [26,33,56]. In this study, we further explored the urban resilience from the NLR anomalies by examining the response and recovery time during Hato. Our results indicate that the response and recovery time of the cities that were affected by Hato shows significant disparities across our study area. Some cities impacted less significantly by Hato, such as Yangjiang and Dongguan, show a longer recovery time and a slower recovery pace than those that were impacted more significantly, highlighting these cities’ weaker disaster resilience. Findings from this study show the potential of using Tencent’s location request data to monitor the impacts of a typhoon. The framework we proposed in this study could be used to examine other typhoon processes and their impacts on cities with different geographic natural and social–economical settings. In fact, with slight modifications, our framework could also be used to study the urban resilience to other hazards across a large geographic scale. When more similar case studies become available, it is very possible to establish a quantitative system to evaluate urban resilience in response to a variety of hazards.
In this study, we found a moderate positive correlation between the maximal negative NLR anomalies and the direct economic loss; and between the cumulative NLR anomalies and the evacuated population. All measures are statistically significant with p < 0.05. Liu et al. [42] also analyzed the relationship between NLR activity and hazard-induced damage at city level. Many other studies have shown that online social media activity can be used for rapid assessment of damage caused by a large-scale disaster [22,27,64,65,66]. For example, Kryvasheyeu, Y. et al. [27] found that per-capita Twitter activity in the USA strongly correlates with the per-capita economic damage inflicted by Hurricane Sandy. However, the results might be undermined as geotagged tweets only account for 1∼2% of all tweets [67], and a similar dataset shows its advantages in real-time disaster assessment.
In this study, we combined the NLR and microblog data to analyze the collective human activities and public concerns in response to Hato. Such integration can overcome the limitations of using a single data source to improve our understanding the impacts of a typhoon on human activities. The NLR data only capture collective and geotagged human activities with a fine temporal and spatial resolution yet without any specific information about the typhoon. The microblogs data can provide the public perception of the event but are not available in many cities, especially in the underdeveloped areas. A combination of the two datasets can significantly improve our understanding of the impacts of Hato on human activities. However, this study could be further improved. Firstly, this study only examined the human activities that could be inferred from TLR and geotagged microblogs. More geolocation datasets such as cell records and taxi trajectories data need to be examined. Secondly, the Tencent’s location data and geotagged microblogs data can only be used to infer representation of certain groups of the users, and vulnerable groups in disasters such as children and elderly people may be underrepresented [36]. Third, more studies are needed as future work needs to be done to understand the abnormal collective human activities in response to hazards such as typhoons. There is a significant spatiotemporal gap between the microblogs and the areas with NLR anomalies. In other words, grids with NLR anomalies are numerous but without enough microblogs, mainly located in the well-developed cities such as Zhuhai, Shenzhen, and Guangzhou (Figure 8). Lacking a sufficient number of microblogs may undermine the study of the association between NLR anomalies and microblog topics. More similar studies are needed to evaluate the cities’ resilience in the areas with different natural settings and socioeconomic development status. It is possible to build a more robust model to use TLR anomalies to predict disaster-induced loss when more case studies become available.

6. Conclusions

Previous studies have shown that typhoons could significantly impact human activities and the impact extent and degree can be inferred from the anomalies of location requests. However, it is impossible to reveal dwellers’ concerns and how the concerns change from the spatial anomalies of location request data alone. This study advances our understanding of the collective human perceptions of a typhoon, the changes in the dwellers’ concerns during a typhoon disaster, and the typhoon-induced spatial anomalies in human activities.
The main findings of this study include the following: (1) We found significant negative and positive humans’ location request anomalies when Hato hit our study area and such anomalies could be utilized to characterize the impacts of wind and rainfall caused by Hato, respectively. Topic analysis based on geotagged microblogs reveals that the negative location request anomalies are closely related to the damage-related microblog topics, whereas the positive anomalies to traffic-related topics. (2) The Tencent’s location request data can be used as a low-cost tool for decision-makers to monitor disaster situations. The response and recovery of the cities affected by Hato show significant disparities across our study area. Cities impacted less significantly by Hato show a longer recovery time and a slower recovery speed than those impacted more significantly. (3) The Tencent’s location big data could become a potential tool for real-time and low-cost assessment of the typhoon-induced damage. The negative anomalies are significantly correlated with economic loss and population affected at city level, with an adjusted R 2 greater than 0.7. The framework in this study could be applied to examine other typhoon processes and other natural hazards to help us better understand how cities respond and recover from a hazard across a large geographic scale.

Author Contributions

Conceptualization, S.H., Y.D. and J.Y.; data curation, S.H., J.Q., N.W. and W.T.; formal analysis, S.H. and J.Y.; funding acquisition, Y.D. and J.Y.; investigation, J.Q. and W.T.; methodology, S.H.; project administration, Y.D. and J.Y.; supervision, Y.D. and F.L.; validation, J.Q. and N.W.; visualization, S.H. and J.Y.; writing—original draft, S.H.; writing—review and editing, Y.D. and F.L. All authors have read and agreed to the published version of the manuscript.

Funding

This research was funded by the National Natural Science Foundation of China, grant number 41901395 and the National Natural Science Foundation of China, grant number 42176205.

Institutional Review Board Statement

Not applicable.

Informed Consent Statement

Not applicable.

Data Availability Statement

Not applicable.

Acknowledgments

The authors would like to thank the editor and anonymous reviewers for their positive comments on the manuscript.

Conflicts of Interest

The authors declare no conflict of interest.

References

  1. UNDRR (United Nations Office for Disaster Risk Reduction). Economic Losses, Poverty & Disasters: 1998–2017. Available online: https://www.undrr.org/publication/economic-losses-poverty-disasters-1998-2017 (accessed on 12 September 2020).
  2. Emanuel, K. Increasing destructiveness of tropical cyclones over the past 30 years. Nature 2005, 436, 686–688. [Google Scholar] [CrossRef] [PubMed]
  3. Webster, P.J.; Holland, G.J.; Curry, J.A.; Chang, H.R. Atmospheric science: Changes in tropical cyclone number, duration, and intensity in a warming environment. Science 2005, 309, 1844–1846. [Google Scholar] [CrossRef] [PubMed] [Green Version]
  4. Elsner, J.B.; Kossin, J.P.; Jagger, T.H. The increasing intensity of the strongest tropical cyclones. Nature 2008, 455, 92–95. [Google Scholar] [CrossRef]
  5. Emanuel, K.A. Downscaling CMIP5 climate models shows increased tropical cyclone activity over the 21st century. Proc. Natl. Acad. Sci. USA 2013, 110, 12219–12224. [Google Scholar] [CrossRef] [Green Version]
  6. Mei, W.; Xie, S.P. Intensification of landfalling typhoons over the northwest Pacific since the late 1970s. Nat. Geosci. 2016, 9, 753–757. [Google Scholar] [CrossRef]
  7. CNKI (China National Knowledge Infrastructure). Yearbook of Meteorological Disasters in China. Available online: https://data.oversea.cnki.net/chn/yearbook/Single/N2020070612 (accessed on 12 September 2020).
  8. Voigt, S.; Giulio-Tonolo, F.; Lyons, J.; Kučera, J.; Jones, B.; Schneiderhan, T.; Platzeck, G.; Kaku, K.; Hazarika, M.K.; Czaran, L. Global trends in satellite-based emergency mapping. Science 2016, 353, 247–252. [Google Scholar] [CrossRef] [PubMed]
  9. Liu, Y.; Liu, X.; Gao, S.; Gong, L.; Kang, C.; Zhi, Y.; Chi, G.; Shi, L. Social Sensing: A New Approach to Understanding Our Socioeconomic Environments. Ann. Assoc. Am. Geogr. 2015, 105, 512–530. [Google Scholar] [CrossRef]
  10. Imran, M.; Elbassuoni, S.; Castillo, C.; Diaz, F.; Meier, P. Extracting information nuggets from disaster- Related messages in social media. In Proceedings of the ISCRAM 2013 Conference Proceedings—10th International Conference on Information Systems for Crisis Response and Management, Baden-Baden, Germany, 12–15 May 2013; pp. 791–801. [Google Scholar]
  11. Zhao, Q.; Chen, Z.; Liu, C.; Luo, N. Extracting and classifying typhoon disaster information based on volunteered geographic information from Chinese Sina microblog. Concurr. Comput. Pract. Exp. 2019, 31, e4910. [Google Scholar] [CrossRef]
  12. Yu, J.; Zhao, Q.; Chin, C.S. Extracting typhoon disaster information from VGI based on machine learning. J. Mar. Sci. Eng. 2019, 7, 318. [Google Scholar] [CrossRef] [Green Version]
  13. Fan, C.; Wu, F.; Mostafavi, A. A Hybrid Machine Learning Pipeline for Automated Mapping of Events and Locations from Social Media in Disasters. IEEE Access 2020, 8, 10478–10490. [Google Scholar] [CrossRef]
  14. Bagrow, J.P.; Wang, D.; Barabasi, A.L. Collective Response of Human Populations to Large-Scale Emergencies. PLoS ONE 2011, 6, e17680. [Google Scholar] [CrossRef] [PubMed] [Green Version]
  15. D’Agostino, G.; Tofani, A. Obserbot: A Totally Automated Watcher to Monitor Essential Services. In Proceedings of the International Conference on Advanced Information Networking and Applications, Toronto, ON, Canada, 12–14 May 2021; Springer: Berlin/Heidelberg, Germany, 2021; pp. 149–158. [Google Scholar]
  16. Vieweg, S.; Hughes, A.L.; Starbird, K.; Palen, L. Microblogging during two natural hazards events: What twitter may contribute to situational awareness. Conf. Hum. Factors Comput. Syst.-Proc. 2010, 2, 1079–1088. [Google Scholar] [CrossRef]
  17. Huang, Q.; Xiao, Y. Geographic situational awareness: Mining tweets for disaster preparedness, emergency response, impact, and recovery. ISPRS Int. J. Geo-Inf. 2015, 4, 1549–1568. [Google Scholar] [CrossRef] [Green Version]
  18. Yu, M.; Huang, Q.; Qin, H.; Scheele, C.; Yang, C. Deep learning for real-time social media text classification for situation awareness–using Hurricanes Sandy, Harvey, and Irma as case studies. Int. J. Digit. Earth 2019, 12, 1230–1247. [Google Scholar] [CrossRef]
  19. Fan, C.; Jiang, Y.; Mostafavi, A. Social Sensing in Disaster City Digital Twin: Integrated Textual–Visual–Geo Framework for Situational Awareness during Built Environment Disruptions. J. Manag. Eng. 2020, 36, 04020002. [Google Scholar] [CrossRef]
  20. Wang, Z.; Ye, X. Space, time, and situational awareness in natural hazards: A case study of Hurricane Sandy with social media data Hurricane Sandy with social media data. Cartogr. Geogr. Inf. Sci. 2019, 46, 334–346. [Google Scholar] [CrossRef]
  21. Wang, Q.; Taylor, J.E. Quantifying human mobility perturbation and resilience in hurricane sandy. PLoS ONE 2014, 9, e112608. [Google Scholar] [CrossRef]
  22. Zou, L.; Lam, N.S.N.; Cai, H.; Qiang, Y. Mining Twitter Data for Improved Understanding of Disaster Resilience. Ann. Am. Assoc. Geogr. 2018, 108, 1422–1441. [Google Scholar] [CrossRef]
  23. Wang, Y. Tracking Disaster Dynamics for Urban Resilience: Human-Mobility and Semantic Perspectives. Ph.D. Thesis, Virginia Tech, Blacksburg, VA, USA, 12 April 2018. [Google Scholar]
  24. Yabe, T.; Tsubouchi, K.; Fujiwara, N.; Sekimoto, Y.; Ukkusuri, S.V. Understanding post-disaster population recovery patterns. J. R. Soc. Interface 2020, 17, 20190532. [Google Scholar] [CrossRef] [Green Version]
  25. Eyre, R.; De Luca, F.; Simini, F. Social media usage reveals recovery of small businesses after natural hazard events. Nat. Commun. 2020, 11, 1629. [Google Scholar] [CrossRef]
  26. Wang, K.; Lam, N.S.N.; Zou, L.; Mihunov, V. Twitter use in hurricane isaac and its implications for disaster resilience. ISPRS Int. J. Geo-Inf. 2021, 10, 116. [Google Scholar] [CrossRef]
  27. Kryvasheyeu, Y.; Chen, H.; Obradovich, N.; Moro, E.; Van Hentenryck, P.; Fowler, J.; Cebrian, M. Rapid assessment of disaster damage using social media activity. Sci. Adv. 2016, 2, e1500779. [Google Scholar] [CrossRef] [PubMed] [Green Version]
  28. Nguyen, D.T.; Ofli, F.; Imran, M.; Mitra, P. Damage assessment from social media imagery data during disasters. In Proceedings of the 2017 IEEE/ACM International Conference on Advances in Social Networks Analysis and Mining ASONAM 2017, Sydney, Australia, 31 July–3 August 2017; pp. 569–576. [Google Scholar] [CrossRef]
  29. Cervone, G.; Schnebele, E.; Waters, N.; Moccaldi, M.; Sicignano, R. Using Social Media and Satellite Data for Damage Assessment in Urban Areas during Emergencies BT—Seeing Cities through Big Data: Research, Methods and Applications in Urban Informatics. In Seeing Cities through Big Data; Thakuriah, P., Tilahun, N., Zellner, M., Eds.; Springer International Publishing: Cham, Switzerland, 2017; pp. 443–457. [Google Scholar] [CrossRef]
  30. Resch, B.; Usländer, F.; Havas, C. Combining machine-learning topic models and spatiotemporal analysis of social media data for disaster footprint and damage assessment. Cartogr. Geogr. Inf. Sci. 2018, 45, 362–376. [Google Scholar] [CrossRef] [Green Version]
  31. Yuan, F.; Liu, R. Integration of social media and unmanned aerial vehicles (UAVs) for rapid damage assessment in hurricane matthew. In Proceedings of the Construction Research Congress 2018, New Orleans, LA, USA, 2–4 April 2018; pp. 513–523. [Google Scholar] [CrossRef]
  32. Li, X.; Caragea, D.; Zhang, H.; Imran, M. Localizing and quantifying damage in social media images. In Proceedings of the 2018 IEEE/ACM International Conference on Advances in Social Networks Analysis and Mining (ASONAM), Barcelona, Spain, 28–31 August 2018; pp. 194–201. [Google Scholar] [CrossRef] [Green Version]
  33. Hong, B.; Bonczak, B.J.; Gupta, A.; Kontokosta, C.E. Measuring inequality in community resilience to natural disasters using large-scale mobility data. Nat. Commun. 2021, 12, 1870. [Google Scholar] [CrossRef] [PubMed]
  34. Ahmad, K.; Pogorelov, K.; Riegler, M.; Conci, N.; Halvorsen, P. Social media and satellites: Disaster event detection, linking and summarization. Multimed. Tools Appl. 2019, 78, 2837–2875. [Google Scholar] [CrossRef]
  35. Qi, L.; Li, J.; Wang, Y.; Gao, X. Urban Observation: Integration of Remote Sensing and Social Media Data. IEEE J. Sel. Top. Appl. Earth Obs. Remote Sens. 2019, 12, 4252–4264. [Google Scholar] [CrossRef]
  36. Wang, Z.; Ye, X. Social media analytics for natural disaster management. Int. J. Geogr. Inf. Sci. 2018, 32, 49–72. [Google Scholar] [CrossRef]
  37. Said, N.; Ahmad, K.; Riegler, M.; Pogorelov, K.; Hassan, L.; Ahmad, N.; Conci, N. Natural disasters detection in social media and satellite imagery: A survey. Multimed. Tools Appl. 2019, 78, 31267–64615. [Google Scholar] [CrossRef] [Green Version]
  38. Ma, T. Multi-level relationships between satellite-derived nighttime lighting signals and social media-derived human population dynamics. Remote Sens. 2018, 10, 1128. [Google Scholar] [CrossRef] [Green Version]
  39. Ma, T.; Pei, T.; Song, C.; Liu, Y.; Du, Y.; Liao, X. Understanding geographical patterns of a city’s diurnal rhythm from aggregate data of location-aware services. Trans. GIS 2019, 23, 104–117. [Google Scholar] [CrossRef]
  40. Ma, T. An estimate of the pixel-level connection between visible infrared imaging radiometer suite day/night band (VIIRS DNB) nighttime lights and land features across China. Remote Sens. 2018, 10, 723. [Google Scholar] [CrossRef] [Green Version]
  41. Liu, Z.; Du, Y.; Yi, J.; Liang, F.; Ma, T.; Pei, T. Quantitative association between nighttime lights and geo-tagged human activity dynamics during Typhoon Mangkhut. Remote Sens. 2019, 11, 2091. [Google Scholar] [CrossRef] [Green Version]
  42. Liu, Z.; Du, Y.; Yi, J.; Liang, F.; Ma, T.; Pei, T. Quantitative estimates of collective geo-tagged human activities in response to typhoon Hato using location-aware big data. Int. J. Digit. Earth 2020, 13, 1072–1092. [Google Scholar] [CrossRef]
  43. Yang, J.; Li, L.; Zhao, K.; Wang, P.; Wang, D.; Sou, I.M.; Yang, Z.; Hu, J.; Tang, X.; Mok, K.M. A comparative study of Typhoon Hato (2017) and Typhoon Mangkhut (2018)—Their impacts on coastal inundation in Macau. J. Geophys. Res. Oceans 2019, 124, 9590–9619. [Google Scholar] [CrossRef]
  44. Sui, G.; Tang, D.; Chen, H. Economic Influence of Typhoon Catastrophe and the Construction of Recovery System. Int. Econ. Trade Res. 2010, 2, 32–36. [Google Scholar] [CrossRef]
  45. China Weather Website. Available online: http://typhoon.weather.com.cn/ (accessed on 31 August 2017).
  46. Tencent’s Location Big Data Portal. Available online: http://heat.qq.com (accessed on 31 August 2017).
  47. Ma, T.; Lu, R.; Zhao, N.; Shaw, S.-L. An estimate of rural exodus in China using location-aware data. PLoS ONE 2018, 13, e0201458. [Google Scholar] [CrossRef]
  48. Yi, J.; Du, Y.; Liang, F.; Tu, W.; Qi, W.; Ge, Y. Mapping human’s digital footprints on the Tibetan Plateau from multi-source geospatial big data. Sci. Total Environ. 2020, 711, 134540. [Google Scholar] [CrossRef]
  49. Cheng, Z.; Wang, J.; Ge, Y. Mapping monthly population distribution and variation at 1-km resolution across China. Int. J. Geogr. Inf. Sci. 2020, 1–19. [Google Scholar] [CrossRef]
  50. Sina Weibo Platform. Available online: https://weibo.com/ (accessed on 31 August 2017).
  51. China Meteorological Data Service Centre. Available online: http://data.cma.cn/ (accessed on 7 September 2017).
  52. Hochenbaum, J.; Vallis, O.S.; Kejariwal, A. Automatic Anomaly Detection in the Cloud Via Statistical Learning. arXiv 2017, arXiv:1704.07706. [Google Scholar]
  53. Cheng, X.; Yan, X.; Lan, Y.; Guo, J. BTM: Topic modeling over short texts. IEEE Trans. Knowl. Data Eng. 2014, 26, 2928–2941. [Google Scholar] [CrossRef]
  54. Rus, K.; Kilar, V.; Koren, D. Resilience assessment of complex urban systems to natural disasters: A new literature review. Int. J. Disaster Risk Reduct. 2018, 31, 311–330. [Google Scholar] [CrossRef]
  55. Kontokosta, C.E.; Malik, A. The Resilience to Emergencies and Disasters Index: Applying big data to benchmark and validate neighborhood resilience capacity. Sustain. Cities Soc. 2018, 36, 272–285. [Google Scholar] [CrossRef]
  56. Ligutom, C.; Orio, J.V.; Ramacho, D.A.M.; Montenegro, C.; Roxas, R.E.; Oco, N. Using Topic Modelling to make sense of typhoon-related tweets. In Proceedings of the 2016 International Conference on Asian Language Processing (IALP), Tainan, Taiwan, 21–23 November 2016; pp. 362–365. [Google Scholar] [CrossRef]
  57. Gorro, K.; Ancheta, J.R.; Capao, K.; Oco, N.; Roxas, R.E.; Sabellano, M.J.; Nonnecke, B.; Mohanty, S.; Crittenden, C.; Goldberg, K. Qualitative data analysis of disaster risk reduction suggestions assisted by topic modeling and word2vec. In Proceedings of the 2017 International Conference on Asian Language Processing (IALP), Singapore, 5–7 December 2017; pp. 293–297. [Google Scholar] [CrossRef]
  58. Rudra, K.; Goyal, P.; Ganguly, N.; Mitra, P.; Imran, M. Identifying sub-events and summarizing disaster-related information from microblogs. In Proceedings of the 41st International ACM SIGIR Conference on Research & Development in Information Retrievalc (SIGIR’18), Ann Arbor, MI, USA, 8–12 July 2018; pp. 265–274. [Google Scholar] [CrossRef]
  59. Zhang, T.; Shen, S.; Cheng, C.; Su, K.; Zhang, X. A topic model based framework for identifying the distribution of demand for relief supplies using social media data. Int. J. Geogr. Inf. Sci. 2021, 35, 2216–2237. [Google Scholar] [CrossRef]
  60. Blei, D.M.; Ng, A.Y.; Jordan, M.T. Latent dirichlet allocation. Adv. Neural Inf. Process. Syst. 2002, 3, 993–1022. [Google Scholar]
  61. Vongkusolkit, J.; Huang, Q. Situational awareness extraction: A comprehensive review of social media data classification during natural hazards. Ann. GIS 2021, 27, 5–28. [Google Scholar] [CrossRef]
  62. Yi, J.; Du, Y.; Liang, F.; Pei, T.; Ma, T.; Zhou, C. Anomalies of dwellers’ collective geotagged behaviors in response to rainstorms: A case study of eight cities in China using smartphone location data. Nat. Hazards Earth Syst. Sci. 2019, 19, 2169–2182. [Google Scholar] [CrossRef] [Green Version]
  63. Getis, A.; Ord, J.K. The Analysis of Spatial Association by Use of Distance Statistics. In Perspectives on Spatial Data Analysis. Advances in Spatial Science; The Regional Science Series; Anselin, L., Rey, S., Eds.; Springer: Berlin/Heidelberg, Germany, 2010; pp. 127–145. [Google Scholar] [CrossRef]
  64. Wu, D.; Cui, Y. Disaster early warning and damage assessment analysis using social media data and geo-location information. Decis. Support Syst. 2018, 111, 48–59. [Google Scholar] [CrossRef]
  65. Shan, S.; Zhao, F.; Wei, Y.; Liu, M. Disaster management 2.0: A real-time disaster damage assessment model based on mobile social media data—A case study of Weibo (Chinese Twitter). Saf. Sci. 2019, 115, 393–413. [Google Scholar] [CrossRef]
  66. Yuan, F.; Liu, R. Mining social media data for rapid damage assessment during Hurricane Matthew: Feasibility study. J. Comput. Civ. Eng. 2020, 34, 5020001. [Google Scholar] [CrossRef]
  67. Palen, L.; Anderson, K.M. Crisis informatics—New data for extraordinary times. Science 2016, 353, 224–225. [Google Scholar] [CrossRef] [Green Version]
Figure 1. Typhoon Hato’s track obtained from the China Weather Website [45].
Remotesensing 14 01269 g001
Figure 2. A flowchart showing the data analysis process in this study.
Remotesensing 14 01269 g002
Figure 3. Variations in human activities as reflected from NLR anomalies in response to Typhoon Hato. Letters t1t2t3 represent the start, peak, and end of the anomalies, respectively.
Remotesensing 14 01269 g003
Figure 4. Spatiotemporal variations in wind speed (a) and rainfall (b) intensities in different cities on 23 August 2017.
Remotesensing 14 01269 g004
Figure 5. Spatiotemporal variations in NLR anomaly against wind speed and rainfall on 23 August. The map shows the NLR anomalies by city with the insets showing the linear correlations and the statistical significance test of P ( I n l r ( n e g ) )   and P ( I w ) , t 1 ( I n l r ( n e g ) ) and t 1 ( I w ) , respectively. The square graphs on the left and bottom show the variation in I n l r ( p o s ) and I p , I n l r ( n e g ) , and I w , respectively.
Remotesensing 14 01269 g005
Figure 6. Scatter plots showing the impacts of Hato on the cities impacted, regarding the response time (a) and recovery time (b). The x axes show the maximum value of NLR negative anomaly. The y axes show the response time ( T 1 ) and recovery time ( T 2 ), respectively. The size of the circles represents the strength of the cumulative abnormal human activity.
Remotesensing 14 01269 g006
Figure 7. The temporal variations in the daily percentages of the microblogs in a specified category from 21 to 24 August. The horizontal axis is the topic category, and the vertical axis is the ratio of the number of microblogs with a given topic per day. The inset figure shows the change of Hato-related microblogs in August 2017.
Remotesensing 14 01269 g007
Figure 8. The distribution of NLR anomalies and the damage- and traffic-related microblogs pre-, peri-, and post-typhoon.
Remotesensing 14 01269 g008
Table 1. Indicators used to describe Hato’s impacts and human activity anomalies.
ObjectsIndicatorsScale
Typhoon I p : The intensity of rainfall anomaliesCity; hourly
I w : The intensity of wind speed anomaliesCity; hourly
Human
activity
I n l r ( g r i d ,   p o s ) , I n l r ( g r i d ,   n e g ) : The intensity of positive and negative NLR anomalies at gird scaleGrid; hourly
I n l r ( p o s ) , I n l r ( n e g ) : The intensity of positive and negative NLR anomalies at city scaleCity; hourly
Table 2. Indicators that were used to characterize Hato’s process and cities’ responses and recovery.
TargetsIndicatorsValues
Typhoon characteristics P ( I w ) , P ( I p ) , MAX ( I ) = f ( t 2 )
Human activity anomalies P ( I n l r ( p o s ) ) , P ( I n l r ( n e g ) )
Cumulative NLR anomalies C I t 1 t 3 f ( t ) dt
Duration of response T 1 t 2 t 1
Duration of recovery T 2 t 3 t 2
Table 3. Results of the accuracy evaluation of the BTM. The Hato-related microblogs are grouped into nine categories: Warnings and alerts, Damage, Work and life, Temperature, Concern and fear, Traffic, Caution and advice, Gratitude and praying, Weather (marked as A–I in here).
IndicatorABCDEFGHI
Precision0.740.710.730.600.630.600.910.550.71
Recall0.920.650.430.760.520.650.750.430.5
Overall accuracy = 70.3%
Table 4. The linear relationship between the typhoon-induced damage and the maximum wind speed anomalies, maximum and cumulative NLR anomalies, respectively, and their corresponding significance test results. The definitions of the indicators are shown in Table 2.
Y (log Scale)X (log Scale)Slope Adjust   R 2 RSE
Economic loss P ( I w ) 3.5810.62 *1.823
P ( I n l r ( n e g ) ) 3.15560.80 **1.341
C ( I n l r ( n e g ) ) 2.14590.72 **1.584
Affected population P ( I w ) 2.5960.571.366
P ( I n l r ( n e g ) ) 2.14580.71 *1.134
C ( I n l r ( n e g ) ) 1.78320.84 *0.8485
‘**’ p < 0.01; ‘*’ p < 0.05.
Table 5. Categories of microblog topics.
Topic CodesMeaningful High-Frequency WordsCategoriesDescriptionPercentage
AShenzhen, Zhuhai, landing, early warning, Guangdong, holiday. Guangzhou, heavy rain, red, powerful typhoon, Zhongshan, safety, closed, shutdown, suspend classesWarnings and alertsDisaster warning and notification47.46%
BZhuhai, after, power failure, water supply, recovery, serious, the sea, community, Shenzhen, trees, scaredDamageDamage related13.27%
CGo to work, the company, go out, work, holiday, weather, at home, customers, outside, heavy rain, studyWork
and life
Daily life 8.22%
DAfter, weather, Shenzhen, sky, stopping the heat, cool, comfortable, heavy rain, cool, calm, feeling, sultry, hotTemperatureCool; positive emotion7.29%
EExperience, terrible, power, terror, go out, badly, feeling, Guangdong, Zhuhai, life, hope, Shenzhen, blow away, Guangzhou, home, DongguanConcern and fearNegative emotion6.89%
FGuangzhou, Shenzhen, shut down, hours, flight, now, go home, plane, influence, late, high-speed rail, delay, cancel, subway, trapped, ZhuhaiTrafficAffected traffic5.55%
GGo out, CAUTION, remember, incoming, Shenzhen, don’t, tip, danger, wind, rain gear, rain, indoor, stay away from, sea, be careful, riverCaution and adviceTips on dangerous places and safety measures4.79%
HNature, Zhuhai, after, city, peace, cherish, small, side, hard work, thank you, humans, personnel, devastated, hope, life, work, saluteGratitude and
praying
Gratitude to the staff and prayer to the city3.73%
IThe heavy rain, the storm, the wind, terrible, quiet, fierce, balcony, wind blows, go home, the office, windWeatherThe weather conditions2.80%
Table 6. Results of the proportional test and their corresponding significance test results for various topic categories versus the areas with no, positive, negative anomaly areas (negative hotspots indicates the significant hotspots with negative anomalies). The values in the table represent the proportion of a specific topic-related microblog in relation to the total number of all microblogs in the area with a specific anomaly. Statistically significant values (p < 0.001) are presented in bold. Letters A–E in the first row correspond to the topic categories in Table 5.
Area_1Area_2ABCDEFGHI
PositiveNormal0.44 --0.16 +++0.080.07 --0.080.08 ++0.04 --0.030.04
NegativeNormal0.480.17 +++0.080.05 ---0.08 +0.04 --0.04 --0.040.02
NegativePositive0.48 ++0.170.080.05 --0.080.04 ---0.040.040.02
Positive
hotspots
××××××××××
Negative
hotspots
Negative0.41 ---0.28 +++0.05 --0.02 --0.11 ++0.02 --0.02 --0.06 ++0.02
Normal0.41 ---0.28 +++0.05 ---0.02 ---0.11 +++0.02 ---0.02 ---0.060.02
Positive0.410.28 +++0.050.02 ---0.11 +++0.02 ---0.02 -0.06 ++0.02
+++ Greater with p < 0.001; ++ greater with p < 0.05; + greater with p < 0.1; ---less with p < 0.001; -- less with p < 0.05; - less with p < 0.1.
Publisher’s Note: MDPI stays neutral with regard to jurisdictional claims in published maps and institutional affiliations.

