Article

Predicting Days to Maturity, Plant Height, and Grain Yield in Soybean: A Machine and Deep Learning Approach Using Multispectral Data

by
Paulo Eduardo Teodoro
1,
Larissa Pereira Ribeiro Teodoro
1,
Fábio Henrique Rojo Baio
1,
Carlos Antonio da Silva Junior
2,
Regimar Garcia dos Santos
1,
Ana Paula Marques Ramos
3,
Mayara Maezano Faita Pinheiro
3,
Lucas Prado Osco
4,
Wesley Nunes Gonçalves
5,
Alexsandro Monteiro Carneiro
6,
José Marcato Junior
5,
Hemerson Pistori
6,7 and
Luciano Shozo Shiratsuchi
8,*
1
Department of Agronomy, Federal University of Mato Grosso do Sul, Rodovia MS 306, km. 305, Caixa Postal 112, Chapadão do Sul 79560-000, MS, Brazil
2
Department of Geography, State University of Mato Grosso, Av. dos Ingas, 3001-Jardim Imperial, Sinop 78555-000, MT, Brazil
3
Post-Graduate Program of Environment and Regional Development, University of Western São Paulo, Rodovia Raposo Tavares, km 572–Limoeiro, Presidente Prudente 19067-175, SP, Brazil
4
Faculty of Engineering and Architecture and Urbanism, University of Western São Paulo, Rodovia Raposo Tavares, km 572–Limoeiro, Presidente Prudente 19067-175, SP, Brazil
5
Faculty of Engineering, Architecture and Urbanism and Geography, Federal University of Mato Grosso do Sul, Cidade Universitária, Av. Costa e Silva–Pioneiros, Campo Grande 79070-900, MS, Brazil
6
Inovisão, Universidade Católica Dom Bosco, Av. Tamandaré, 6000, Campo Grande 79117-900, MS, Brazil
7
Faculty of Computing, Federal University of Mato Grosso do Sul, Cidade Universitária, Av. Costa e Silva–Pioneiros, Campo Grande 79070-900, MS, Brazil
8
AgCenter, School of Plant, Environmental and Soil Sciences, Louisiana State University, Baton Rouge, LA 70808, USA
*
Author to whom correspondence should be addressed.
Remote Sens. 2021, 13(22), 4632; https://doi.org/10.3390/rs13224632
Submission received: 15 October 2021 / Revised: 14 November 2021 / Accepted: 15 November 2021 / Published: 17 November 2021
(This article belongs to the Special Issue UAVs in Sustainable Agriculture)

Abstract

:
In soybean, there is a lack of research aiming to compare the performance of machine learning (ML) and deep learning (DL) methods to predict more than one agronomic variable, such as days to maturity (DM), plant height (PH), and grain yield (GY). As these variables are important to developing an overall precision farming model, we propose a machine learning approach to predict DM, PH, and GY for soybean cultivars based on multispectral bands. The field experiment considered 524 genotypes of soybeans in the 2017/2018 and 2018/2019 growing seasons and a multitemporal–multispectral dataset collected by embedded sensor in an unmanned aerial vehicle (UAV). We proposed a multilayer deep learning regression network, trained during 2000 epochs using an adaptive subgradient method, a random Gaussian initialization, and a 50% dropout in the first hidden layer for regularization. Three different scenarios, including only spectral bands, only vegetation indices, and spectral bands plus vegetation indices, were adopted to infer each variable (PH, DM, and GY). The DL model performance was compared against shallow learning methods such as random forest (RF), support vector machine (SVM), and linear regression (LR). The results indicate that our approach has the potential to predict soybean-related variables using multispectral bands only. Both DL and RF models presented a strong (r surpassing 0.77) prediction capacity for the PH variable, regardless of the adopted input variables group. Our results demonstrated that the DL model (r = 0.66) was superior to predict DM when the input variable was the spectral bands. For GY, all machine learning models evaluated presented similar performance (r ranging from 0.42 to 0.44) for each tested scenario. In conclusion, this study demonstrated an efficient approach to a computational solution capable of predicting multiple important soybean crop variables based on remote sensing data. Future research could benefit from the information presented here and be implemented in subsequent processes related to soybean cultivars or other types of agronomic crops.

1. Introduction

Farmers must consider crop genotype management and environmental factors (temperature, rainfall, soil, etc.) to obtain cultivars with maximum yield [1]. Recently, to help monitor such conditions, they can count on remote sensing systems and technologies to survey their production fields. Nonetheless, predicting agronomic variables such as days to maturity (DM), plant height (PH), and grain yield (GY), is still a challenging task, especially when considering indirect methods, such as multispectral data collected with remote sensing system based on unmanned aerial vehicle (UAV). Recently, the advent of new UAV platforms promoted rapid and high-detailed mapping of multiple farmlands, which generated high amounts of data to be evaluated and incorporated to support agricultural management [2,3,4,5,6,7].
In the last decade, remote sensing data has been processed with machine learning (ML) methods, which is a promising strategy to support varieties of evaluation and selection and other agricultural applications. In the related literature, it is possible to find a representative number of studies addressing crop yield prediction based on ML models for different crops, such as cherry tree (Prunus avium L.) [8], sugarcane (Saccharum officinarum L.) [9], wheat (Triticum aestivum L.) [10,11,12], potato (Solanum tuberosum L.) [10], coffee (Coffea arabica L.) [13], rice (Oryza sativa L.) [14], and maize (Zea mays L.) [15], among others. Review papers have [16,17] argued that the rapid technological advances in remote sensing systems and ML techniques can provide a cost-effective and efficient solution for better decision-making practices related to crop management in the next few years.
In the context mentioned above, it should be noted that agronomic variables inference for soybean (Glycine max (L.) Merril) cultivars using only remote sensing data is still an unsolved and challenging task, mainly when considering multiple genotype varieties in different geographical areas and seasons. As agricultural activity represents an essential component of the economic sector for many countries, identifying or predicting variables such as DM, PH, and GY can support decision-making and benefit future crop management strategies [2,6,18,19,20]. Soybean is the world’s major oilseed, accounting for 85% of the world’s oil seeds, and given its economic importance, soybean cultivation area worldwide is steadily increasing [21]. Brazil, for example, is the world’s largest producer of soybean, obtaining a record production estimated at 124.8 million tons in the last season, which represents an increase of 4.3% compared to the 2018/19 harvest [2]. The planted soybean area in Brazil grew 3% compared to the last season (2019/2020), from 35,874 to the current 36,949.8 hectares [22]. Thus, technological solutions involving intelligent methods and remote sensing data can improve yield and help to estimate other related agronomic variables while producing novel information to be incorporated to support crop management for subsequent seasons.
Previous studies demonstrated that other plant-related agronomic variables, such as biomass [3], chlorophyll content, macro and micronutrients [4], water content and stress effect [5], already returned satisfactory results using artificial intelligence techniques. However, predicting grain yield with remote sensing imagery is still somewhat difficult. Wei and Molin [23] explored relationships between soybean yield and plant components (number of grains—NG and thousand grains weight—TGW) using a regression approach. They demonstrated that TGW and NG presented, respectively, weak and strong linear relationships with yield. For maize yield prediction, Khanal et al. [24] implemented a combination of multiple agronomic and sensing variables into an ML environment and achieved satisfactory performances. These and other related research [25] demonstrated the importance of the use of artificial intelligence to model this dataset. These methods included most shallow learners, such as random forest, neural network, support vector machine, and gradient boosting model. Nonetheless, in recent years, a more robust approach, known as deep learning (DL), has gained attention in this area of nontraditional statistical analysis.
DL is a computational intelligence technique based on artificial neural networks with multiple layers that adopt a hierarchical learning process [18,26]. These layers consist of activation, pooling, convolutional, recurrent, encode–decode, and others to form an architecture capable of learning from a given pattern [27]. These approaches often require an expressive amount of data compared to traditional or shallow methods to achieve high performance. Regardless, the learning capability of these networks is superior, mostly resulting in practical and reproducible alternatives; however, because of that, they also demand a high computational cost. Even so, in agriculture-related problems, it has demonstrated a high potential to model biomass phenotyping [28], counting plants and detecting plantation rows [29], and, related to this research, yield prediction [1,12,16,19,30,31,32]. While these studies have achieved considerable performance in estimating yield in different crops, there is still a lack of research comparing different machine learning methods to predict more than one variable, such as plant height (PH), days to maturity (DM), and grain yield (GY), which are considered important for an overall precision farming model.
As mentioned, in the precision agriculture context, several approaches have been implemented to obtain the maximum potential of machine learning models to predict agronomic variables. A concern regarding studies associating agronomic variables and multispectral imagery is that vegetation indices rely on a small number of available spectral bands and therefore do not utilize all the information conveyed by the plant genetic trait [16]. Thus, the question arises: Which spectral bands or vegetation indices (VIs) are better for the given task? Previous studies [3,5,15] evaluated the importance of different input variables configurations of remote sensing datasets using ML approaches related to plant analysis. Marques Ramos et al. [15] analyzed the individual contribution of VIs for a set of shallow learning models. There, the random forest (RF) returned the overall most effective estimative for maize yield. However, studies comparing different input variables configurations using both shallow and deep learning approaches are still lacking. As DL can extract key features from the data for estimation, amplifying aspects of the input that are important for prediction and suppressing irrelevant variations, it can be expected to have less dependency on the input data than shallow learning models [16,33]. Additionally, something that still needs to be further investigated is the performance evaluation of deep and shallow learning models to predict variables such as DM, PH, and GY, since they are important agronomic/plant parameters to support decision-making in soybean crops. To perform such evaluation, several soybean genotypes, considering a multitemporal dataset, should be required to produce representative conditions of farmers across the country.
To help fulfil the aforementioned gap, here, we propose machine and deep learning approaches to predict soybean agronomic variables (DM, PH, and GY) using multispectral data from a UAV-based sensor. Our approach implemented a multilayer deep learning regression network, and we evaluated three different input configurations using spectral bands and VIs to infer these variables. For this, a total of 34 spectral indices and different combinations of spectral bands and VIs were used. Moreover, we compared the DL model against three shallow learning models: random forests (RF), support vector machine (SVM), and linear regression (LR), showing their potential to predict soybean-related variables. The main contribution of this study is to demonstrate a computational solution capable of predicting important soybean agronomic variables based on an efficient machine learning approach. In this regard, we consider a challenging situation: 524 genotypes of soybean in 2017/2018 and 2018/2019 crop seasons in four different geographical areas.

2. Materials and Methods

2.1. Field Trials

The data used in this research consist of experimental field trials conducted with soybean genotypes in the soybean macroregion 301, Brazil (Figure 1). The first trial was conducted in the 2017/2018 crop season in Chapadão do Sul/MS. The second and third trials were conducted in Aporé/GO and Chapadão do Sul/MS, respectively, in the 2018/2019 crop season. The fourth trial was conducted in Chapadão do Sul in the 2019/2020 crop season. In all site-years, the crop seasons corresponded from October to January. We evaluated 123, 135, 103, and 163 soybean genotypes in trials 1, 2, 3, and 4, respectively, in a randomized block design with two replications. The experimental plots consisted of three 3 m rows spaced at 0.45 m. with a stand of 15 plants m−1. The cultural treatments carried out during the tests followed the recommendation for the soybean crops in the Brazilian Cerrado environment.
The variables evaluated in each trial were: plant height (PH, cm), days to maturity (DM), and grain yield (GY, kg ha−1). PH was obtained with the aid of a tape measure, measuring from the base of the plant to its apex. The DM was obtained by counting the number of days between emergence and maturation of more than 90% of the plants in the plot. Grain yield was obtained by harvesting 2 m long of the central row from each plot, weighing the grains, correcting for 13% moisture, and extrapolating to kg ha−1.

2.2. Aerial Multispectral Image Acquisition and Vegetation Indices Calculation

At 60 days after crop emergence, the senseFly eBee® RTK fixed-wing UAV was used in all four trials. This equipment has autonomous take-off, flight plan, and landing control. The eBee was equipped with the senseFly Parrot Sequoia® multispectral sensor, a multispectral camera for agriculture that uses a sunshine sensor and an additional 16 MP RGB camera for scouting. The overflights were performed at 100 m altitude, allowing a spatial image resolution of 0.10 m. The overflights were carried out near the zenith due to the minimization of the shadows of the plants at 11 a.m., given that the multispectral sensor is a passive type (i.e., dependent on solar luminosity). Radiometric calibration was performed for the entire scene based on a calibrated reflective surface provided by the manufacturer. Multispectral reflectance images were obtained for green (550 nm ± 40 nm), red (660 nm ± 40 nm), red-edge (735 nm ± 10 nm), and near-infrared (NIR, 790 nm ± 40 nm) spectral bands. The information obtained at these wavelengths allows the calculation of various vegetation indices maps to be used in computational algorithms.
The images were mosaicked and orthorectified by the computer program Pix4Dmapper. The positional accuracy of the orthoimages was verified with ground control points (GPC) surveyed with real-time kinematic (RTK). Table 1 presents all the VIs used in experiments. The group of VIs included in this work is based on the Osco et al. [5] and Marques Ramos et al. [15] approaches, as they evaluated data from the same spectral regions.

2.3. Machine Learning

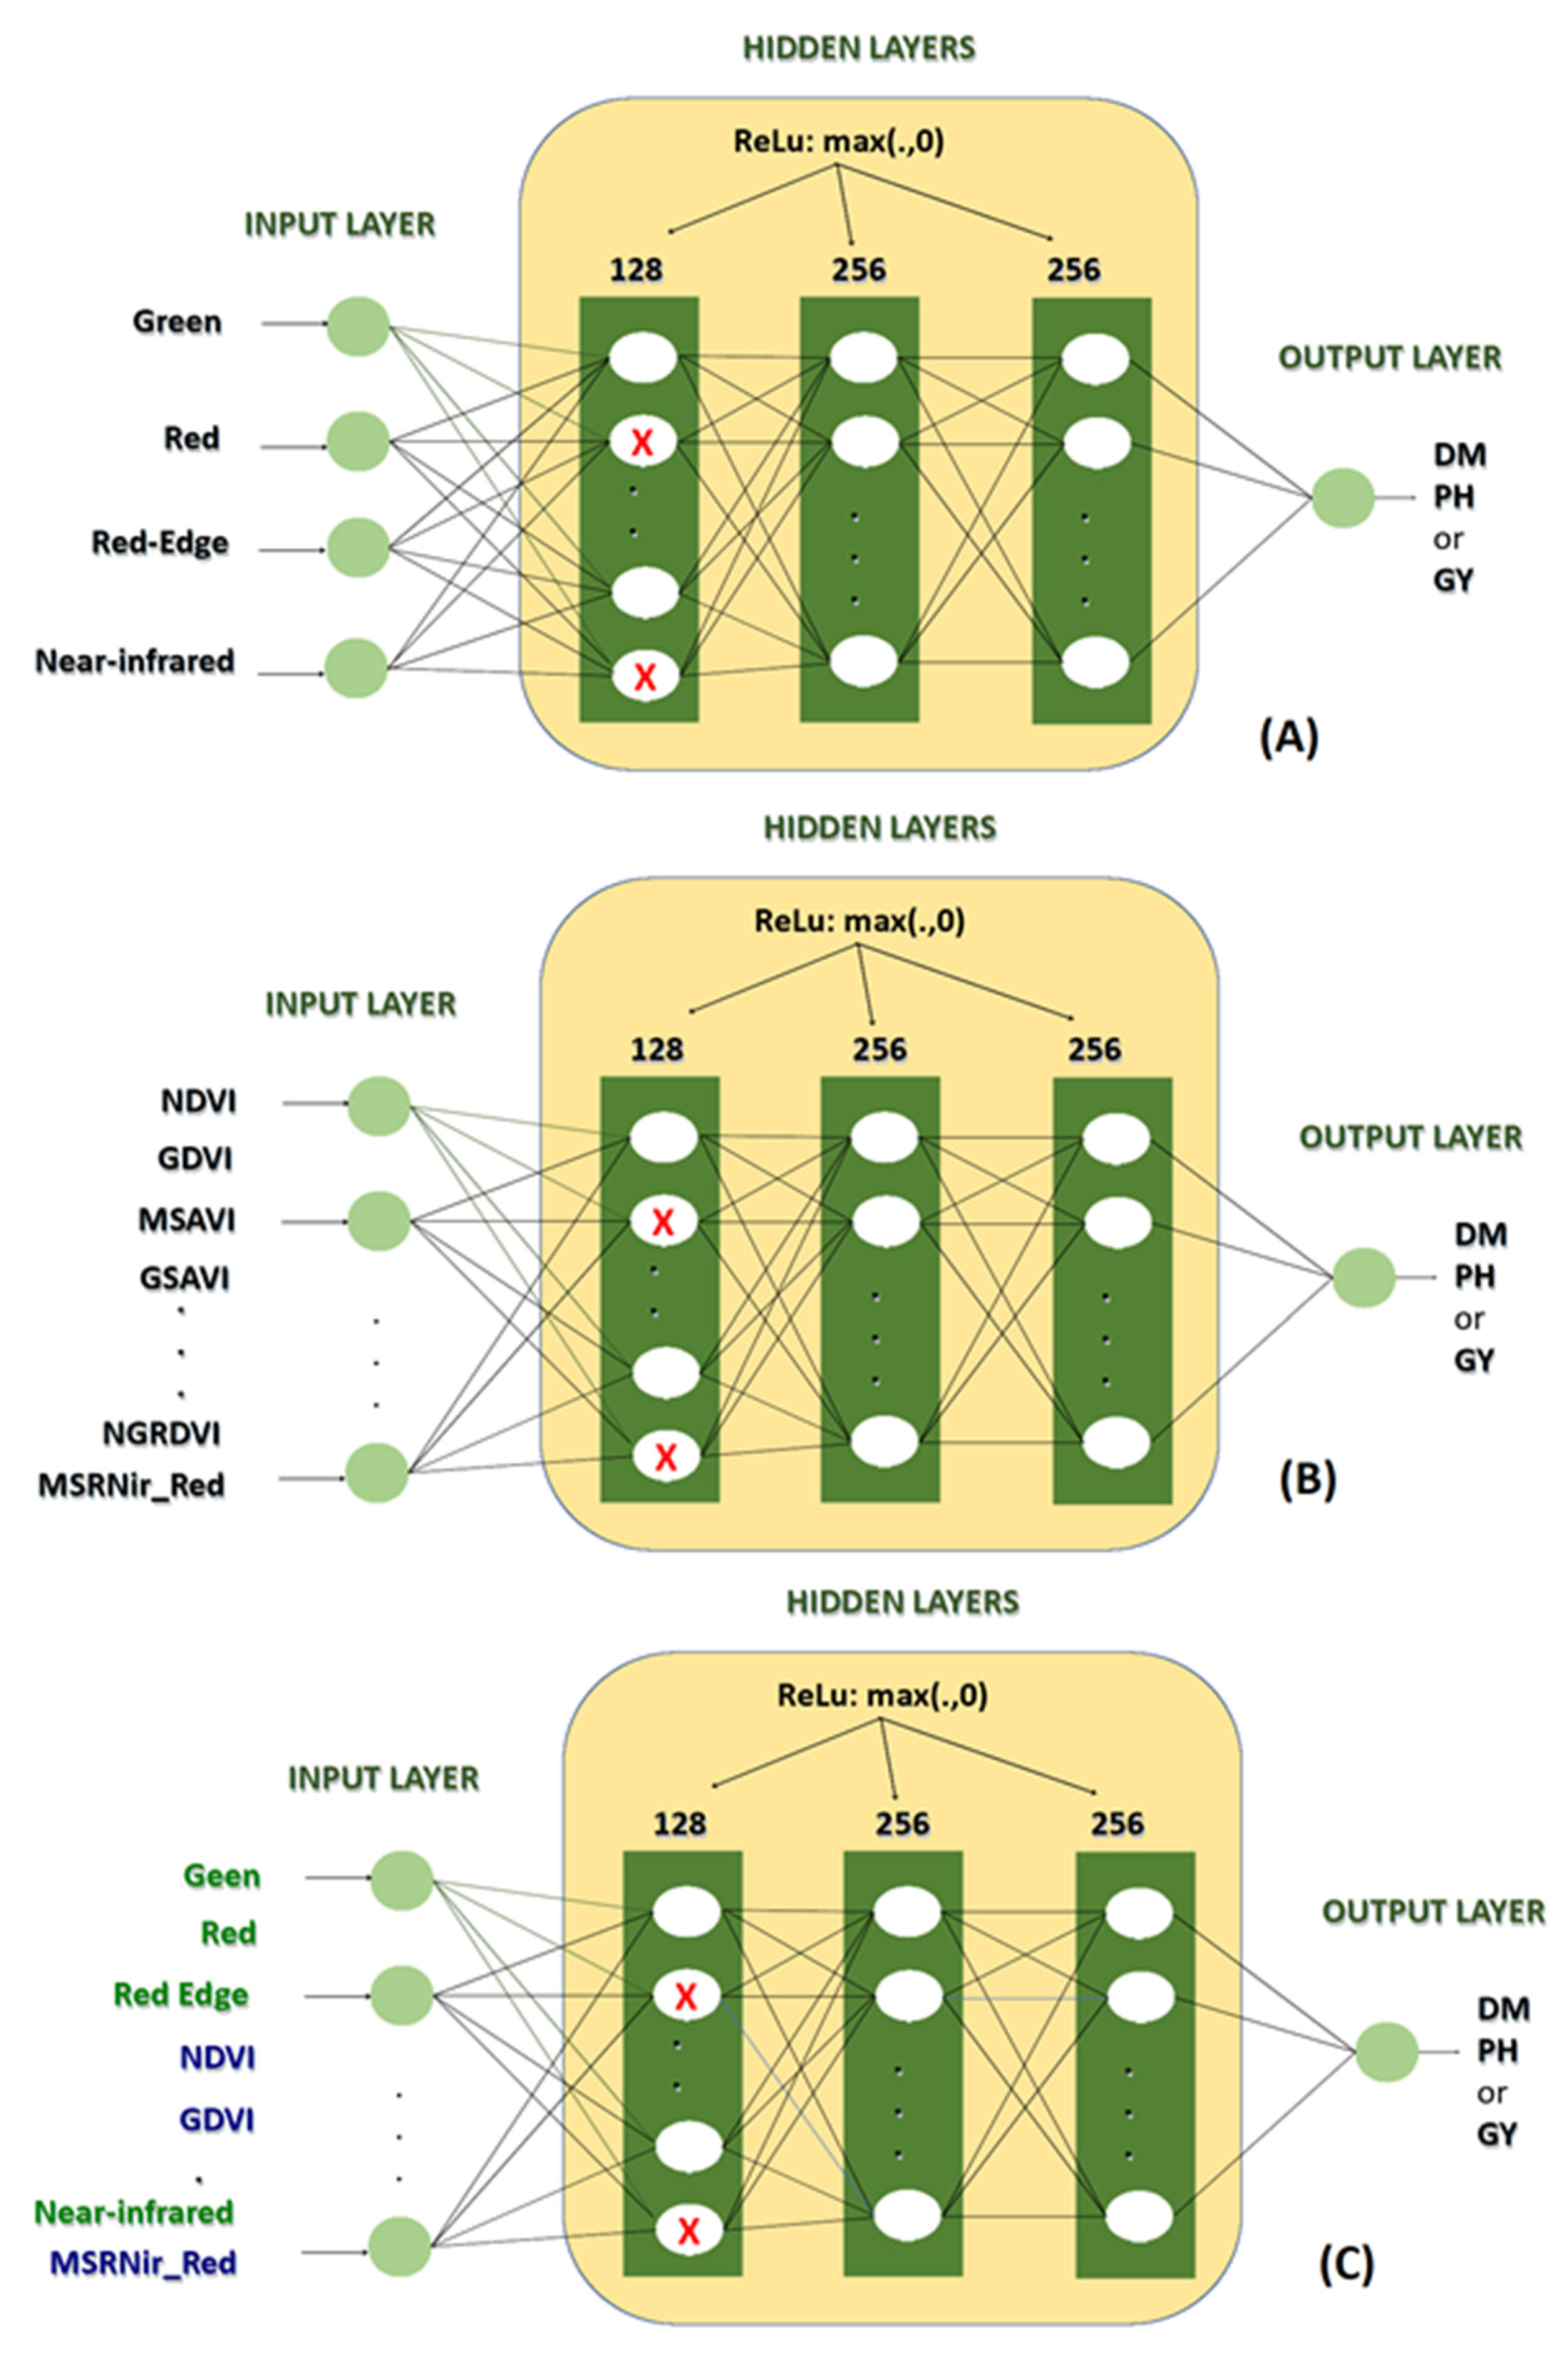
A deep learning (DL) model was implemented and tested against three shallow learning models: random forests (RF), support vector machine (SVM), and linear regression (LR). For all models, three data input configurations were adopted: (1) spectral wavelengths (WL), (2) spectral vegetation indices (VI), and (3) a combination between spectral wavelengths and vegetation indices (WLVI).The DL architecture proposed in this work (Figure 2) comprises three dense (completely connected) hidden layers, with 128, 256, and 256 neurons, respectively. The first hidden layer used dropout at 50% as a regularization strategy. An adaptive subgradient method, adagrad, was used for training the model over 2000 epochs, with a learning rate of 0.01, batch size of 32, and an early stop with 400 epochs (patience). The activation function used for all neurons was a rectified linear unit (ReLU), and the weights were randomly initialized using a standard Gaussian method. The mean squared error (MSE) was used as the loss function. The number of neurons in the input layer depended on the three different input configurations used in the experiments, as follows: (1) WL—4 neurons, (2) VI—34 neurons, and (3) WLVI—38 neurons. The output layer comprises only one neuron, as the network was trained for a regression approach. The number of trainable parameters (network weights) varied from 99,713 (WL) to 104,065 (WLVI).
The RF algorithm was trained using 100% of the training set as the bag size and 100 trees. SVM used the optimizer proposed by Shevade et al. [29] that improves sequential minimal optimization (SMO) for regression with a polynomial kernel. The LR performs a ridge regression using the Akaike information criterion (ACI) for model selection. The ridge parameter was set to 1 × 10⁻⁸. All four models (DL, RF, SVM, and LR) were trained and tested in 30 repetitions, using a random split of 80% for training and 20% for testing each time. The deep learning model further used 20% of the training set as validation. The other models (RF, SVM, and LR) did not need a validation set. For all the three input configurations, WL, VI, and WLVI, the models were trained to independently predict PH, DM, and GY output variables, given 36 tests.

2.4. Statistical Analyses

Mean absolute error (MAE), root mean squared error (RMSE), and Pearson’s correlation coefficient (r) between the observed and estimated values were obtained in each test and repetition. Boxplots were created for all these 36 test results. A two-way ANOVA was performed for each output variable, PH, DM, and GY, followed by the Scott–Knott test at a 5% significance to identify the input configurations and ML models that provided the highest r means. In this ANOVA, the first factor consisted of the tested models (DL, RF, SVM, and LR), while the second factor was composed of the data input configurations (WL, VI, and WLVI).

3. Results

The results indicated that there was a significant interaction between the ML models (DL, RF, SVM, and LR) and the input settings (WL, VI, and WLVI) for the mean absolute error (MAE), root mean squared error (RMSE), and Pearson’s correlation coefficient (r) between observed and estimated values for DM (Table 2) and PH (Table 3). The results of the significant interaction between models versus input configurations for PH and DM demonstrate that there is a variable relationship between these factors, i.e., the best model depends on the configuration used, and vice versa. For GY, there were significant differences between the ML models tested for MAE and RMSE (Table 4). The r was statistically equal for ML models and tested inputs for GY.
Table 2 demonstrates the unfolding of the significant interaction between ML and input configuration for MAE, RMSE, and r between estimated and observed values for DM in soybean. When analyzing the input for DL, we observed that WL had the lowest means for MAE (6.05) and RMSE (8.01) and the highest mean for r (0.66). For RF and LR, there were no statistical differences between the tested inputs. For SVM, the input with WLVI provided statistically lower MAE (6.38) and RMSE (8.82) values and higher r (0.58). When comparing the ML models using the WL as input, we found that DL had the lowest means for MAE (6.05) and RMSE (8.01), as well as the highest mean for r (0.66). However, when using VI or WLVI as inputs, RF was the best model due to the lower MAE (6.65 and 6.38, respectively) and RMSE (8.28 and 8.23, respectively) and the higher r (0.65 for both inputs).
The unfolding of the significant interaction between ML and input for MAE, RMSE, and between estimated and observed values for plant height in soybean is shown in Table 3. When analyzing the input for DL, we observed that WL had the lowest means for MAE and RMSE and the highest mean for r. For RF and LR, there were no statistical differences between the tested inputs for MAE and RMSE, but for r, the best inputs were VI and WLVI. For SVM and LR, the inputs with VI and WLVI provided statistically lower MAE and RMSE values and higher r. When comparing the ML models using the WL as input, we found that DL and RF had the lowest means of MAE and RMSE, in addition to the highest means of r. When using VI or WLVI as inputs, RF was the best model due to the lower MAE and RMSE means and the highest r mean.
For GY, there was no significant interaction between inputs and ML models. The tested inputs did not differ statistically from each other. There were differences only between ML models in isolation for MAE and RMSE (Table 4). Among these, the DL, SVM, and LR models stood out for presenting lower MAE and RMSE in relation to the RF. For r, there was no difference between the ML models.
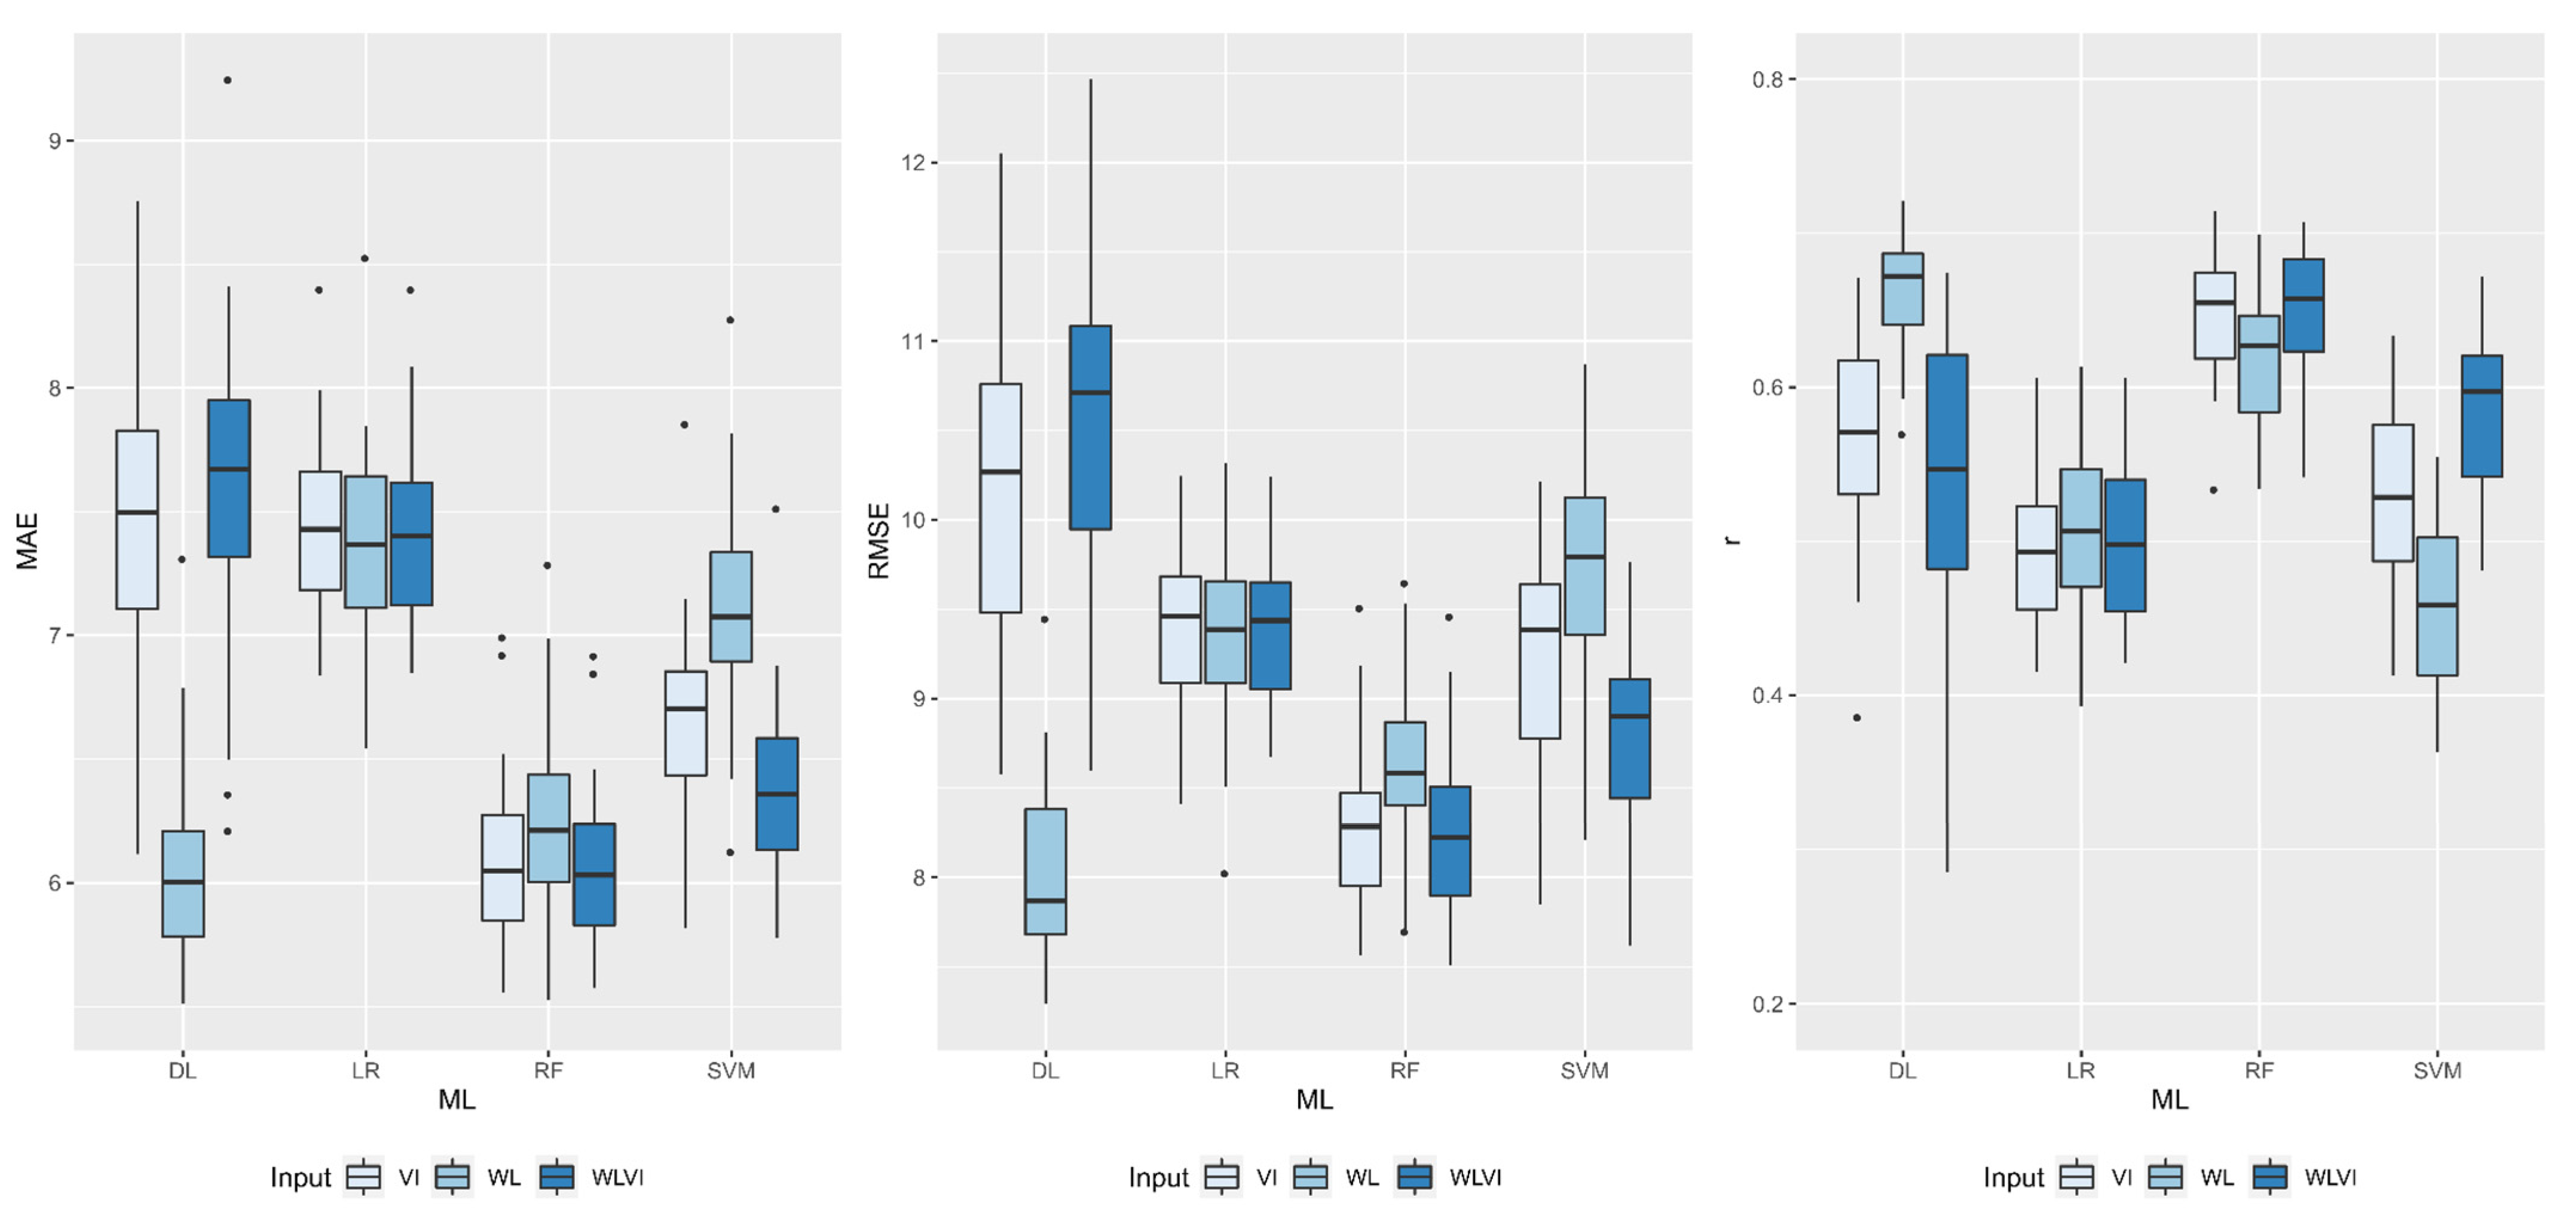
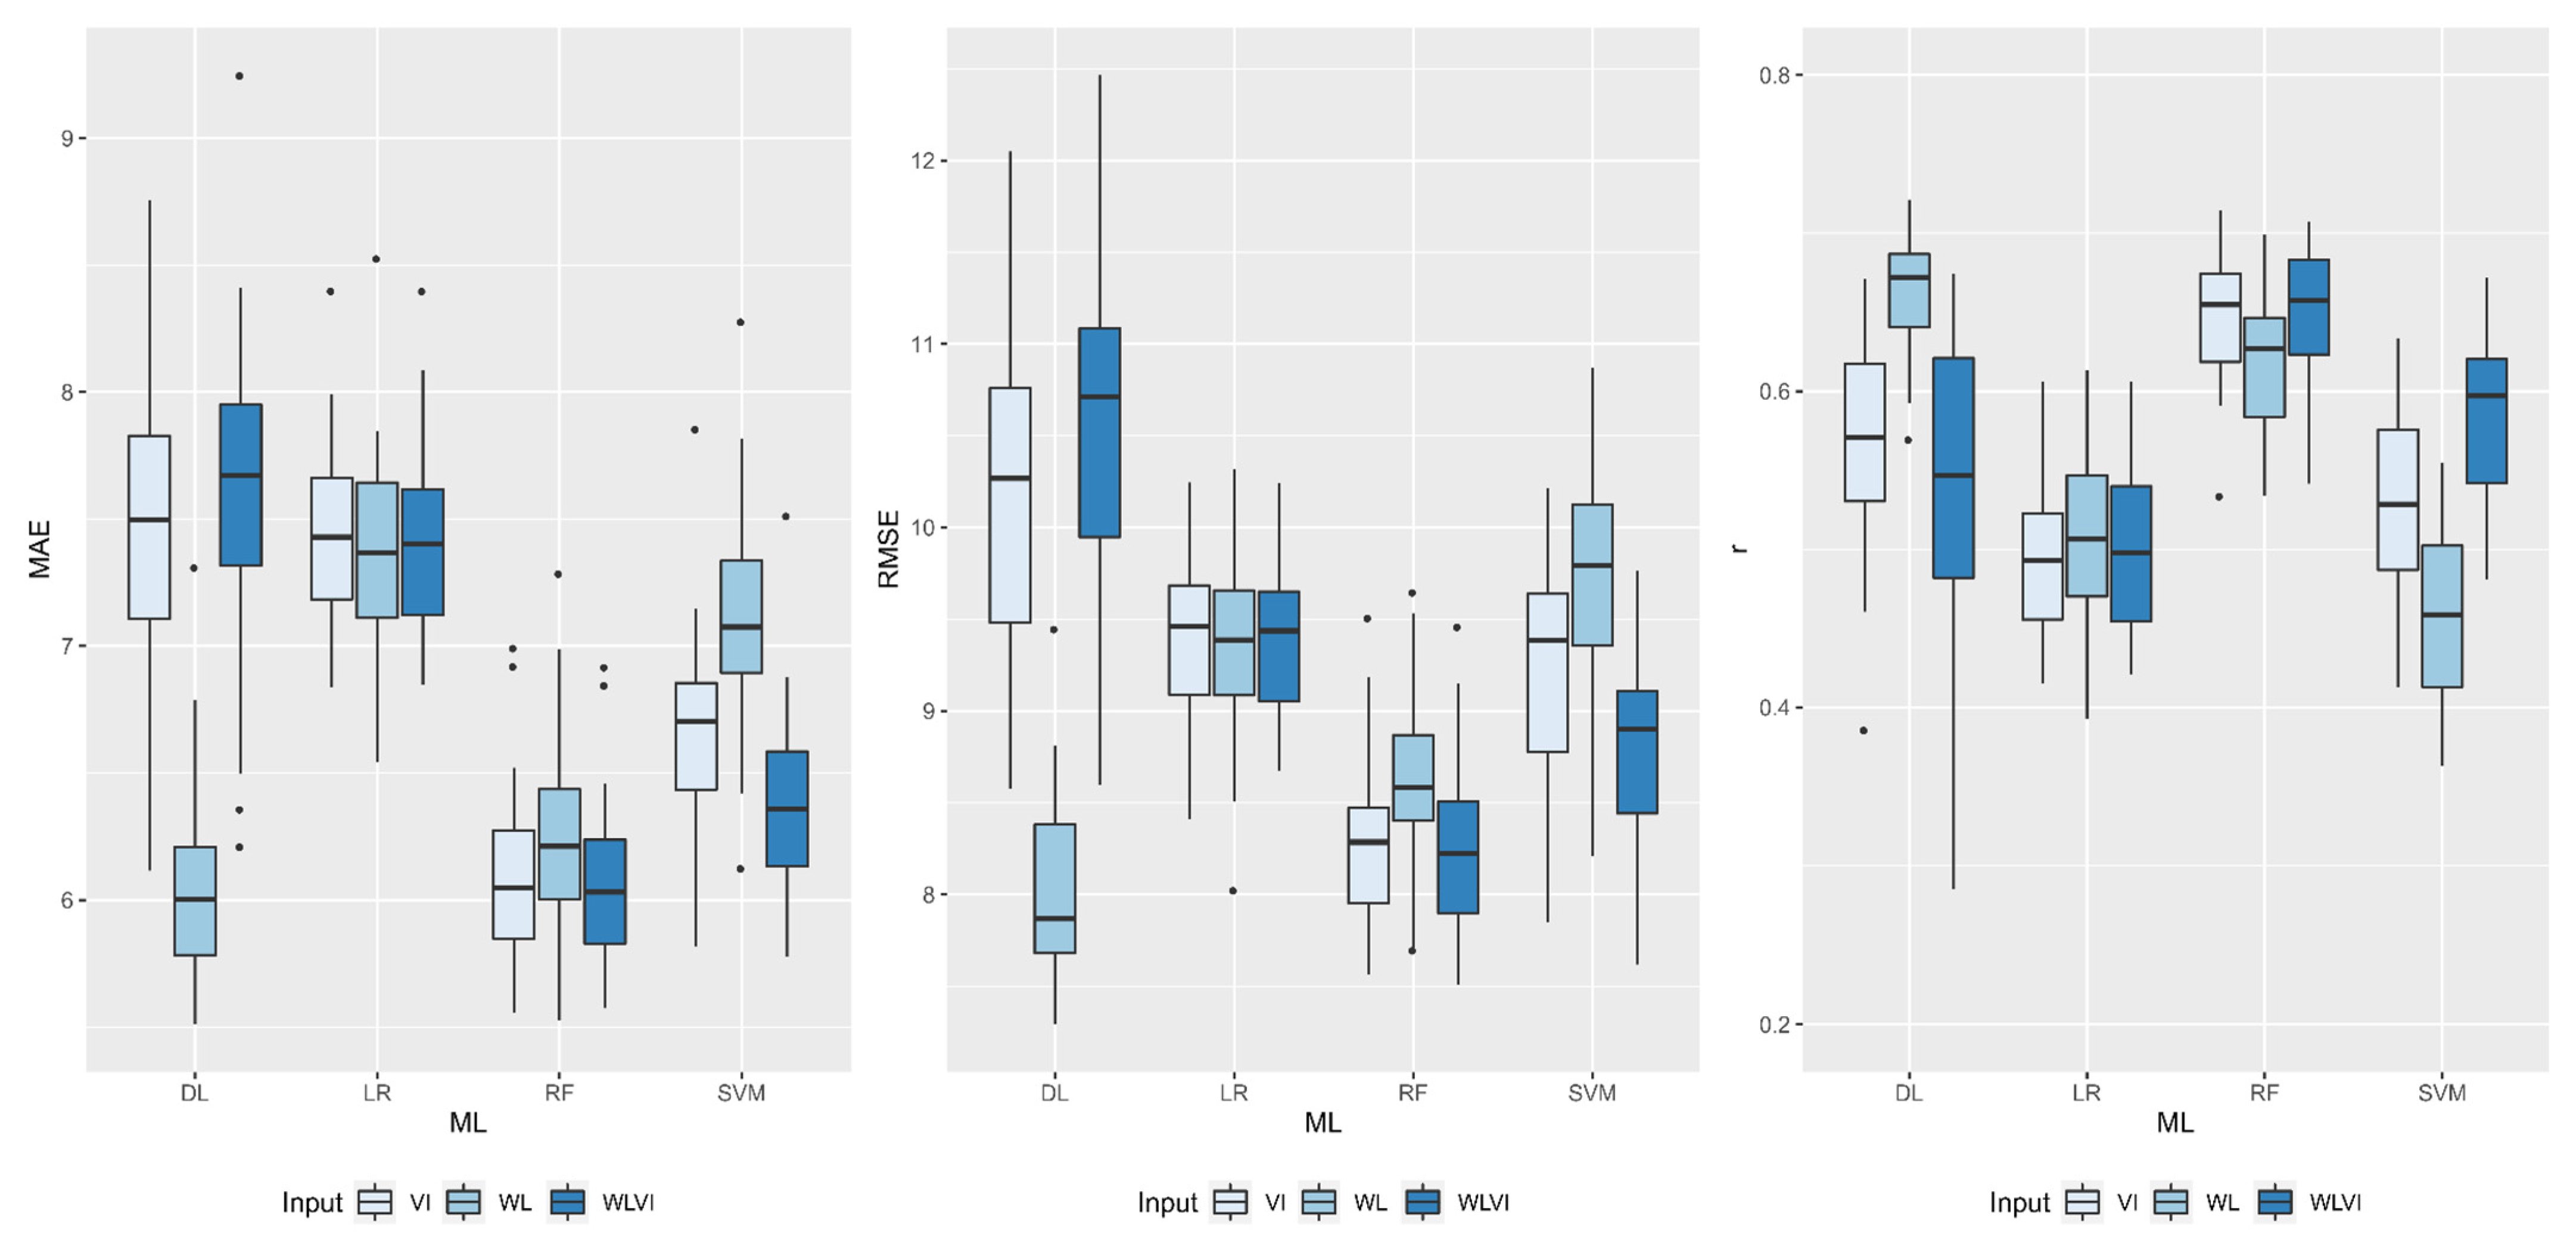
The boxplots for mean absolute error (MAE), root mean squared error (RMSE), and Pearson’s correlation coefficient (r) values between estimated and observed values for days to maturity (DM), plant height (PH), and grain yield (GY) in soybean obtained with different machine learning models (DL, RF, SVM, and LR) and input configurations (WL, VI, and WLVI) are grouped in Figure 3, Figure 4 and Figure 5, respectively. In general, the combination between DL and WL provided greater accuracy for all variables evaluated, as it obtained lower median values for MAE and RMSE and higher values for r. Furthermore, in this combination, the boxes were smaller, which indicates less dispersion between the results of the 30 folds used to obtain the MAE, RMSE, and r. RF had slightly lower median accuracy values than DL when using WL as input. However, for the other inputs (VI and WLVI), this model had the lowest median values for MAE and RMSE, in addition to the highest values for r. However, it is important to highlight that the boxes for this model showed higher variability.

4. Discussion

The significant interaction between inputs and ML models for DM and PH indicates differences between the models when using WL, VI, or WLVI as inputs. In the other sense, there are differences between the inputs for each ML model tested. The results obtained from MAE, RMSE, and r between estimated and observed values for DM and PH variables indicated a slightly superior performance of the proposed DL approach compared to the other traditional machine learning methods when only the WL are considered. DL methods extract features automatically, and this provides an advantageous approach. As verified in our experiments, the establishment of vegetation indices was not required, which implies an easy alternative to soybean variable prediction task. Another important observation regarding DL methods is the ability of updating novel training information based on a transfer learning strategy. Even though DL methods are known for demanding a computational power higher than ML approaches, the mentioned ability should be considered, especially in precision-farming tasks, as deep networks are more adaptive to new areas, images, and variables than shallow methods.
When considering only vegetation indices (VI) or vegetation indices combined with the wavelengths (WLVI) for both DM and PH, we found that RF outperformed the other models (lowest means of MAE and RMSE and highest means of r). The highest performance found here using RF possibly occurred due to the internal structure of the algorithm, which is based on multiple decision tree sets. Recent studies have classified RF as an effective and versatile machine learning method for crop yield predictions [4,10,15]. Moreover, RF has been considered superior to other shallow learning algorithms because it can easily handle many model parameters, reduce estimate bias, and has no problems with overfitting. These findings are similar to previous reports on the prediction of agronomic traits using spectral data and machine learning. Yu et al. [20] found a good accuracy in yield prediction (r = 0.82) of soybean breeding lines by using the RF model on data obtained with the UAV-based high-throughput phenotyping (HTP) platform. Sakamoto [18], when carrying out a MODIS-based crop yield estimation for corn and soybean with the RF algorithm, verified that the method provided an accurate estimate of yield reduction in soybeans caused by a drought that occurred during late vegetative stages. However, as performed here, the RF and shallow models have been little studied in predicting the maturity and plant height in soybean.
Days to maturity (DM) has been an important trait in studies aimed at improving soybean crops since, through this trait, it is possible to measure the earliness of cultivars. Earliness is one of the main targets currently required by the Brazilian soybean market. This occurs because farmers of the major producing regions, located in the Cerrado biome, can grow corn or cotton in the second season, between February and July, increasing the profitability of the agricultural system. Furthermore, early-cycle genotypes remain in the field for less time and are subject to less disease pressure during the late growing season, which causes considerable losses in crop yield [34]. However, measuring earliness is a time-demanding and labor-intensive task [6,35], since it requires counting, in the field, the number of days until each genotype blooms or matures. In this aspect, the approach proposed here may help to minimize this cost by implementing only remote sensing and computational options to perform said task.
Likewise, plant height (PH) is another important feature for improved soybean cultivars, since plants must be up to 1 m in height to avoid lodging and losses in mechanized harvesting. Several studies on genetic progress and breeding in soybean have identified a decrease in plant height and consequent reduction in the lodging score in modern cultivars [36,37,38]. However, PH assessment is also a time- and labor-consuming task. Thus, using a machine learning method that only needs spectral bands or vegetation indices from UAV-based imagery, agricultural practices can benefit from this approach to estimate PH with satisfactory performance. In a previous study, PH was also predicted with machine learning methods and obtained good accuracies, as in here, but in maize plants [7].
UAV-based multispectral imagery arises as a fast, cost-effective, and reliable technique for assessing crop attributes of interest, which is critical for high-throughput phenotyping in agriculture [39]. The literature has already reported the prediction of important agronomic variables (e.g., plant height, biomass, and grain yield) by using remote sensing techniques [2,3,7,15,20,40]. Nonetheless, studies aiming to predict crop maturity are recent, especially in soybean, and research using shallow and deep machine learning approaches is still scarce in the literature [20]. To the best of our knowledge, this is one of the first studies to perform a prediction for soybean maturity and plant height with shallow/deep learning-based methods applied to multispectral data considering multiple agronomic variables (PH, GY, and DM) at different cultivars, sites, and crop years. Our findings show that it is possible to predict days to maturity and plant height in soybean. The use of artificial intelligence techniques associated with data obtained by remote sensing shows to be a fast, low-cost, and efficient approach to be adopted in precision-farming practices, supporting crop management and helping in the decision-making process.
In this study, our interest was to investigate the performance of different machine learning methods and input configurations to predict days for maturation, plant height, and grain yield for soybeans using only multispectral UAV images. Overall, RF outperformed the other models when considering as inputs all of the VI and WLVI variables. This provided better accuracy in both the DM and PH predictions than when considering only the spectral bands. Yet, when using only the spectral bands as input, the DL model returned the overall best performance. We verified that the DL model can predict DM and PH in soybean using lesser variables, which is an advantageous and promising approach in terms of implementation and spectral data analysis.
The approach adopted here can be implemented with different datasets on different soybean cultivars. For further studies, we recommend that this approach be tested for different crop traits and using a larger number of wavelengths as input in the models.

5. Conclusions

We mainly verified significant interaction between machine learning models and input settings for MAE, RMSE, and r between observed and estimated values for both DM and PH traits. Our findings showed that the DL model outperformed the other models when using only WL as input configuration. The RF algorithm performed better when considering the VI, both single and combined with spectral bands (WLVI). Regardless, mainly because of its characteristics, the DL approach may learn more patterns in new datasets, which is an advantage over the traditional shallow learners. We conclude that our method can be adopted in future research to evaluate other traits in soybean. With this, we observed that this procedure can support the decision-making process on variety selection and yield prediction and supply more information to assist precision agriculture practices.

Author Contributions

P.E.T., L.P.R.T., F.H.R.B. and C.A.d.S.J. designed the field trials and collected the phenotypic data. H.P. performed all statistical analyses. P.E.T., L.P.R.T., A.P.M.R., L.P.O. and J.M.J. designed the manuscript, and produced a draft of the manuscript. R.G.d.S., M.M.F.P., W.N.G., A.M.C. and L.S.S. contributed with a critical review of the manuscript. All authors have read and agreed to the published version of the manuscript.

Funding

This research was funded by National Council for Scientific and Technological Development (CNPq), grant number 303767/2020-0, 303559/2019-5, 433783/2018-4, 314902/2018-0, and 304173/2016-9; Coordenação de Aperfeiçoamento de Pessoal de Nível Superior–Brazil (CAPES), grant number 88881.311850/2018-01, Fundação de Apoio ao Desenvolvimento do Ensino, Ciência e Tecnologia do Estado de Mato Grosso do Sul (FUNDECT), grant number 71/019.039/2021, 59/300.066/2015, 23/200.248/2014, and 59/300.095/2015.

Informed Consent Statement

Not applicable.

Data Availability Statement

The datasets used and/or analyzed during the current study are available from the corresponding author on reasonable request.

Acknowledgments

The authors acknowledge the support of UFMS (Federal University of Mato Grosso do Sul), UCDB (Dom Bosco Catholic University), CNPq (National Council for Scientific and Technological), CAPES (Coordination for the Improvement of Higher Education Personnel–Finance code 001), and NVIDIA Corporation.

Conflicts of Interest

The authors declare no conflict of interest. The funders had no role in the design of the study; in the collection, analyses, or interpretation of data; in the writing of the manuscript, or in the decision to publish the results.

References

  1. Khaki, S.; Wang, L.; Archontoulis, S.V. A CNN-RNN Framework for Crop Yield Prediction. Front. Plant Sci. 2020, 10, 1750. [Google Scholar] [CrossRef]
  2. da Silva, E.E.; Baio, F.H.R.; Teodoro, L.P.R.; Junior, C.A.D.S.; Borges, R.S.; Teodoro, P.E. UAV-multispectral and vegetation indices in soybean grain yield prediction based on in situ observation. Remote Sens. Appl. Soc. Environ. 2020, 18, 100318. [Google Scholar] [CrossRef]
  3. Osco, L.P.; Ramos, A.P.M.; Pereira, D.R.; Moriya, A.S.; Imai, N.N.; Matsubara, E.T.; Estrabis, N.; De Souza, M.; Junior, J.M.; Gonçalves, W.N.; et al. Predicting Canopy Nitrogen Content in Citrus-Trees Using Random Forest Algorithm Associated to Spectral Vegetation Indices from UAV-Imagery. Remote Sens. 2019, 11, 2925. [Google Scholar] [CrossRef] [Green Version]
  4. Osco, L.; Junior, J.; Ramos, A.; Furuya, D.; Santana, D.; Teodoro, L.; Gonçalves, W.; Baio, F.; Pistori, H.; Junior, C.; et al. Leaf Nitrogen Concentration and Plant Height Prediction for Maize Using UAV-Based Multispectral Imagery and Machine Learning Techniques. Remote Sens. 2020, 12, 3237. [Google Scholar] [CrossRef]
  5. Osco, L.P.; Ramos, A.P.M.; Moriya, É.A.S.; Bavaresco, L.G.; De Lima, B.C.; Estrabis, N.; Pereira, D.R.; Creste, J.E.; Júnior, J.M.; Gonçalves, W.N.; et al. Modeling Hyperspectral Response of Water-Stress Induced Lettuce Plants Using Artificial Neural Networks. Remote Sens. 2019, 11, 2797. [Google Scholar] [CrossRef] [Green Version]
  6. Zhou, J.; Yungbluth, D.C.; Vong, C.N.; Scaboo, A.M.; Zhou, J. Estimation of maturity date of soybean breeding lines using UAV-based imagery. Remote Sens. 2019, 11, 2075. [Google Scholar] [CrossRef] [Green Version]
  7. Osco, L.P.; Ramos, A.P.M.; Pinheiro, M.M.F.; Moriya, A.S.; Imai, N.N.; Estrabis, N.; Ianczyk, F.; De Araújo, F.F.; Liesenberg, V.; Jorge, L.A.D.C.; et al. A Machine Learning Framework to Predict Nutrient Content in Valencia-Orange Leaf Hyperspectral Measurements. Remote Sens. 2020, 12, 906. [Google Scholar] [CrossRef] [Green Version]
  8. Amatya, S.; Karkee, M.; Gongal, A.; Zhang, Q.; Whiting, M.D. Detection of cherry tree branches with full foliage in planar architecture for automated sweet-cherry harvesting. Biosyst. Eng. 2015, 146, 3–15. [Google Scholar] [CrossRef] [Green Version]
  9. Vani, S.; Sukumaran, R.; Savithri, S. Prediction of sugar yields during hydrolysis of lignocellulosic biomass using artificial neural network modeling. Bioresour. Technol. 2015, 188, 128–135. [Google Scholar] [CrossRef]
  10. Jeong, J.H.; Resop, J.; Mueller, N.D.; Fleisher, D.; Yun, K.; Butler, E.E.; Timlin, D.; Shim, K.-M.; Gerber, J.; Reddy, V.R.; et al. Random Forests for Global and Regional Crop Yield Predictions. PLoS ONE 2016, 11, e0156571. [Google Scholar] [CrossRef]
  11. Pantazi, X.; Moshou, D.; Alexandridis, T.; Whetton, R.; Mouazen, A. Wheat yield prediction using machine learning and advanced sensing techniques. Comput. Electron. Agric. 2016, 121, 57–65. [Google Scholar] [CrossRef]
  12. Hunt, M.L.; Blackburn, G.A.; Carrasco, L.; Redhead, J.W.; Rowland, C.S. High resolution wheat yield mapping using Sentinel-2. Remote Sens. Environ. 2019, 233, 111410. [Google Scholar] [CrossRef]
  13. Ramos, P.; Prieto, F.; Montoya, E.; Oliveros, C. Automatic fruit count on coffee branches using computer vision. Comput. Electron. Agric. 2017, 137, 9–22. [Google Scholar] [CrossRef]
  14. Su, Y.-X.; Xu, H.; Yan, L.-J. Support vector machine-based open crop model (SBOCM): Case of rice production in China. Saudi J. Biol. Sci. 2017, 24, 537–547. [Google Scholar] [CrossRef]
  15. Ramos, A.P.M.; Osco, L.P.; Furuya, D.E.G.; Gonçalves, W.N.; Santana, D.C.; Teodoro, L.P.R.; Junior, C.A.D.S.; Capristo-Silva, G.F.; Li, J.; Baio, F.H.R.; et al. A random forest ranking approach to predict yield in maize with uav-based vegetation spectral indices. Comput. Electron. Agric. 2020, 178, 105791. [Google Scholar] [CrossRef]
  16. Chlingaryan, A.; Sukkarieh, S.; Whelan, B. Machine Learning Approaches for Crop Yield Prediction and Nitrogen Status Estimation in Precision Agriculture: A Review. Comput. Electron. Agric. 2018, 151, 61–69. [Google Scholar] [CrossRef]
  17. Liakos, K.G.; Busato, P.; Moshou, D.; Pearson, S.; Bochtis, D. Machine learning in agriculture: A review. Sensors 2018, 18, 2674. [Google Scholar] [CrossRef] [PubMed] [Green Version]
  18. Sakamoto, T. Incorporating environmental variables into a MODIS-based crop yield estimation method for United States corn and soybeans through the use of a random forest regression algorithm. ISPRS J. Photogramm. Remote Sens. 2019, 160, 208–228. [Google Scholar] [CrossRef]
  19. Sun, J.; Di, L.; Sun, Z.; Shen, Y.; Lai, Z. County-Level Soybean Yield Prediction Using Deep CNN-LSTM Model. Sensors 2019, 19, 4363. [Google Scholar] [CrossRef] [Green Version]
  20. Yu, N.; Li, L.; Schmitz, N.; Tian, L.F.; Greenberg, J.A.; Diers, B.W. Development of methods to improve soybean yield estimation and predict plant maturity with an unmanned aerial vehicle based platform. Remote Sens. Environ. 2016, 187, 91–101. [Google Scholar] [CrossRef]
  21. Taha, R.S.; Seleiman, M.F.; Alotaibi, M.; Alhammad, B.A.; Rady, M.M.; Mahdi, A.H.A. Exogenous potassium treatments elevate salt tolerance and performances of Glycine max L. by boosting antioxidant defense system under actual saline field conditions. Agronomy 2020, 10, 1741. [Google Scholar] [CrossRef]
  22. Conab—Monitoramento Agrícola. Available online: https://www.conab.gov.br/index.php/info-agro/safras/graos/monitoramento-agricola (accessed on 15 April 2021).
  23. Wei, M.; Molin, J. Soybean Yield Estimation and Its Components: A Linear Regression Approach. Agriculture 2020, 10, 348. [Google Scholar] [CrossRef]
  24. Khanal, S.; Fulton, J.; Klopfenstein, A.; Douridas, N.; Shearer, S. Integration of high resolution remotely sensed data and machine learning techniques for spatial prediction of soil properties and corn yield. Comput. Electron. Agric. 2018, 153, 213–225. [Google Scholar] [CrossRef]
  25. Soltis, P.S.; Nelson, G.; Zare, A.; Meineke, E.K. Plants meet machines: Prospects in machine learning for plant biology. Appl. Plant Sci. 2020, 8, e11371. [Google Scholar] [CrossRef]
  26. Badrinarayanan, V.; Kendall, A.; Cipolla, R. Segnet: A deep convolutional encoder-decoder architecture for image segmentation. IEEE Trans. Pattern Anal. Mach. Intell. 2017, 39, 2481–2495. [Google Scholar] [CrossRef]
  27. Ball, J.E.; Anderson, D.T.; Chan, C.S. Comprehensive survey of deep learning in remote sensing: Theories, tools, and challenges for the community. J. Appl. Remote Sens. 2017, 11, 042609. [Google Scholar] [CrossRef] [Green Version]
  28. Castro, W.; Junior, J.M.; Polidoro, C.; Osco, L.P.; Gonçalves, W.; Rodrigues, L.; Santos, M.; Jank, L.; Barrios, S.; Valle, C.; et al. Deep Learning Applied to Phenotyping of Biomass in Forages with UAV-Based RGB Imagery. Sensors 2020, 20, 4802. [Google Scholar] [CrossRef]
  29. Chen, Y.; Ribera, J.; Boomsma, C.; Delp, E.J. Plant Leaf Segmentation for Estimating Phenotypic Traits; Video and Image Processing Laboratory (VIPER); Purdue University: West Lafayette, IN, USA, 2017; pp. 3884–3888. [Google Scholar]
  30. Jin, Z.; Azzari, G.; You, C.; Di Tommaso, S.; Aston, S.; Burke, M.; Lobell, D.B. Smallholder maize area and yield mapping at national scales with Google Earth Engine. Remote Sens. Environ. 2019, 228, 115–128. [Google Scholar] [CrossRef]
  31. Nevavuori, P.; Narra, N.; Lipping, T. Crop yield prediction with deep convolutional neural networks. Comput. Electron. Agric. 2019, 163, 104859. [Google Scholar] [CrossRef]
  32. Barbosa, A.; Trevisan, R.; Hovakimyan, N.; Martin, N.F. Modeling yield response to crop management using convolutional neural networks. Comput. Electron. Agric. 2020, 170, 105197. [Google Scholar] [CrossRef]
  33. LeCun, Y.; Bengio, Y.; Hinton, G. Deep learning. Nature 2015, 521, 436–444. [Google Scholar] [CrossRef]
  34. Finoto, E.L.; Sediyama, T.; Carrega, W.C.; De Albuquerque, J.A.A.; Cecon, P.R.; Reis, M.S. Efeito da aplicação de fungicida sobre caracteres agronômicos e severidade das doenças de final de ciclo na cultura da soja. Rev. Agro@Mbiente On-Line 2011, 5, 44. [Google Scholar] [CrossRef]
  35. Masuka, B.; Atlin, G.N.; Olsen, M.; Magorokosho, C.; Labuschagne, M.; Crossa, J.; Bänziger, M.; Pixley, K.V.; Vivek, B.S.; von Biljon, A.; et al. Gains in Maize Genetic Improvement in Eastern and Southern Africa: I. CIMMYT Hybrid Breeding Pipeline. Crop. Sci. 2017, 57, 168–179. [Google Scholar] [CrossRef] [Green Version]
  36. Morrison, M.J.; Voldeng, H.D.; Cober, E.R. Agronomic Changes from 58 Years of Genetic Improvement of Short-Season Soybean Cultivars in Canada. Agron. J. 2000, 92, 780–784. [Google Scholar] [CrossRef]
  37. Jin, J.; Liu, X.; Wang, G.; Mi, L.; Shen, Z.; Chen, X.; Herbert, S.J. Agronomic and physiological contributions to the yield improvement of soybean cultivars released from 1950 to 2006 in Northeast China. Field Crop. Res. 2010, 115, 116–123. [Google Scholar] [CrossRef]
  38. Todeschini, M.H.; Milioli, A.S.; Rosa, A.C.; Dallacorte, L.V.; Panho, M.C.; Marchese, J.A.; Benin, G. Soybean genetic progress in South Brazil: Physiological, phenological and agronomic traits. Euphytica 2019, 215, 124. [Google Scholar] [CrossRef]
  39. Xie, C.; Yang, C. A review on plant high-throughput phenotyping traits using UAV-based sensors. Comput. Electron. Agric. 2020, 178, 105731. [Google Scholar] [CrossRef]
  40. Eugenio, F.C.; Grohs, M.; Venancio, L.P.; Schuh, M.; Bottega, E.L.; Ruoso, R.; Schons, C.; Mallmann, C.L.; Badin, T.L.; Fernandes, P. Estimation of soybean yield from machine learning techniques and multispectral RPAS imagery. Remote Sens. Appl. Soc. Environ. 2020, 20, 100397. [Google Scholar] [CrossRef]
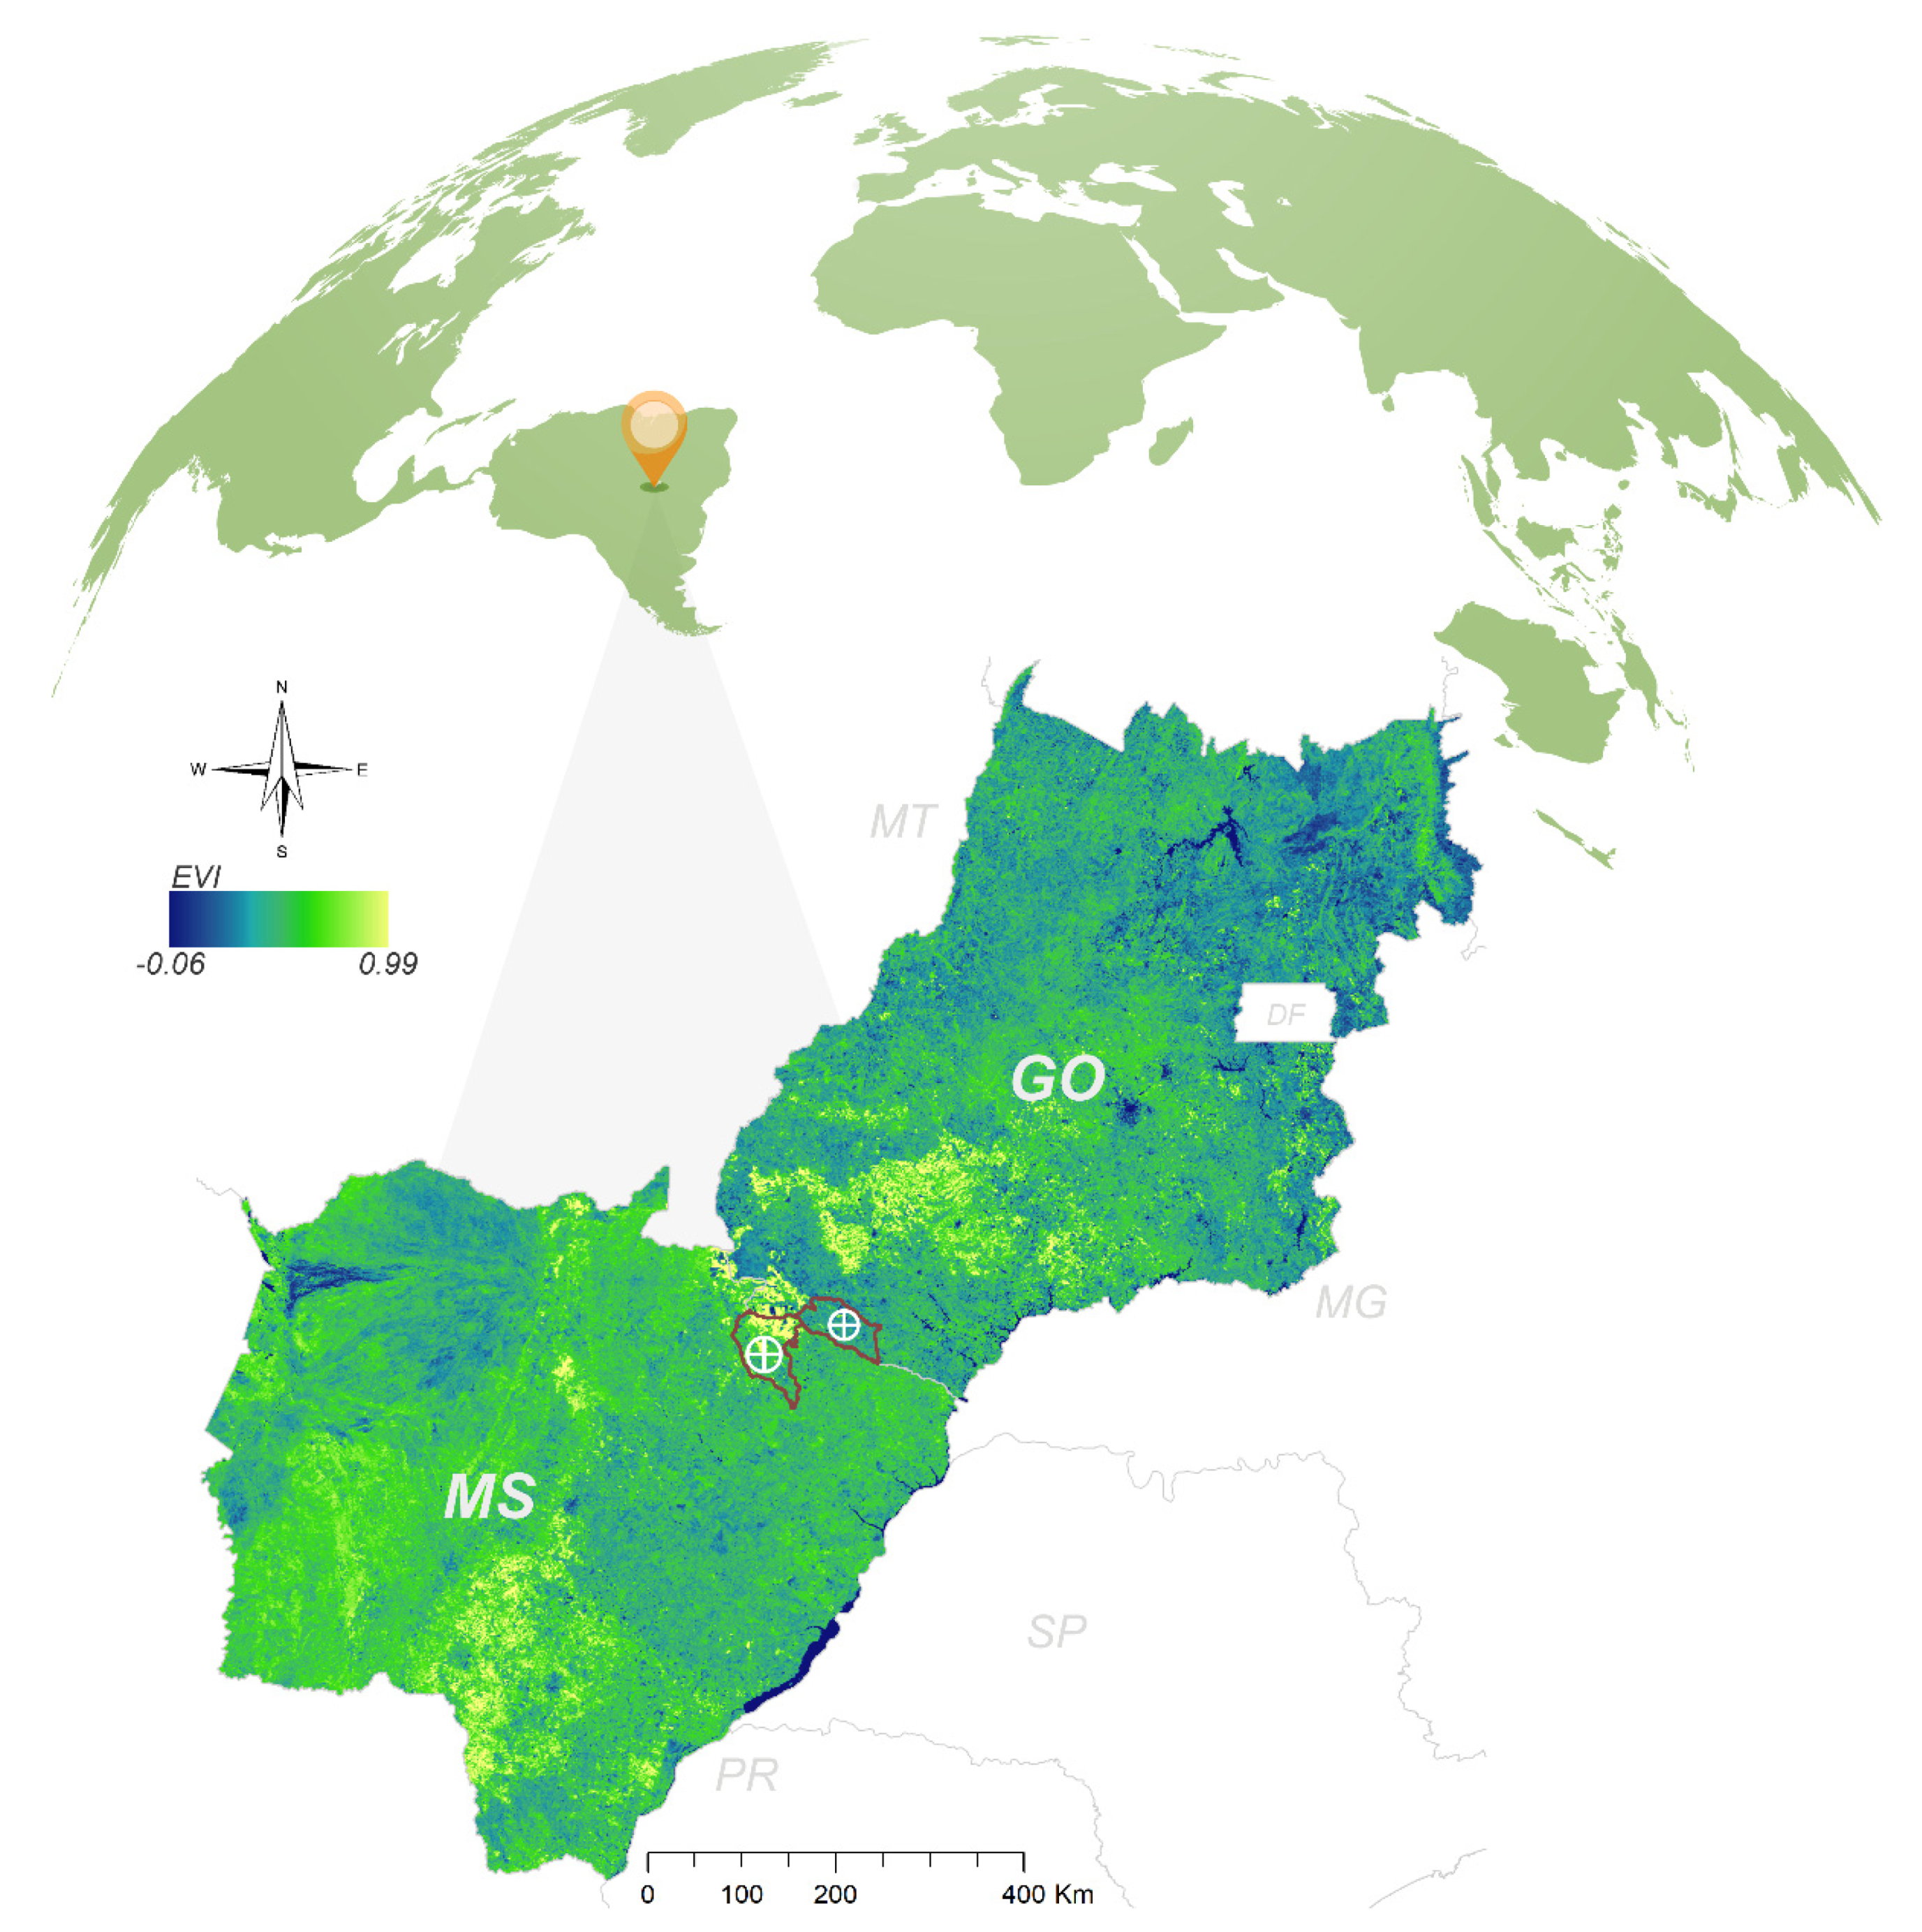
Figure 1. Location of the studied areas in Chapadão do Sul (MS) and Aporé (GO), Brazil. EVI = enhanced vegetation index.
Remotesensing 13 04632 g001
Figure 2. Architecture of the three deep learning networks (DL) proposed in the study. (A) corresponds to the network using the spectral bands of the images as input layer; (B) corresponds to the network using the vegetation indices as input layer; (C) corresponds to the network using the spectral bands and vegetation indices as input layer.
Remotesensing 13 04632 g002
Figure 3. Boxplot for mean absolute error (MAE), root mean squared error (RMSE), and Pearson’s correlation coefficient (r) between estimated and observed values for days to maturity in soybean obtained with different machine learning models (DL, RF, SVM, and LR) and input configurations. DL: deep learning (DL); RF: random forests; SVM: support vector machine; LR: linear regression; WL: spectral bands wavelengths; VI: spectral vegetation indices; WLVI: a combination between spectral bands and vegetation indices.
Remotesensing 13 04632 g003
Figure 4. Boxplot for mean absolute error (MAE), root mean squared error (RMSE), and Pearson’s correlation coefficient (r) between estimated and observed values for plant height in soybean obtained with different machine learning models (DL, RF, SVM, and LR) and input configurations. DL: deep learning (DL); RF: random forests; SVM: support vector machine; LR: linear regression; WL: spectral bands wavelengths; VI: spectral vegetation indices; WLVI: a combination between spectral bands and vegetation indices.
Remotesensing 13 04632 g004
Figure 5. Boxplot for mean absolute error (MAE), root mean squared error (RMSE), and Pearson’s correlation coefficient (r) between estimated and observed values for grain yield in soybean obtained with different machine learning models (DL, RF, SVM, and LR) and input configurations. DL: deep learning (DL); RF: random forests; SVM: support vector machine; LR: linear regression; WL: spectral bands wavelengths; VI: spectral vegetation indices; WLVI: a combination between spectral bands and vegetation indices.
Remotesensing 13 04632 g005
Table 1. Vegetation indices used in the experiments.
IndexEquation
ARVI2 (Atmospherically Resistant Vegetation Index 2) 0.18 + 1.17 ( ( R λ n i r R λ r e d ) / ( R λ n i r + R λ r e d ) )
ATSAVI (Adjusted Transformed soil-adjusted VI) 1.22 [ ( R λ n i r 1.22 R λ r e d 0.03 ) ( 1.22 R λ n i r + R λ r e d 1.22 0.03 + 0.08 ( 1 + 1.22 2 ) ]
BWDRVI (Blue-wide dynamic range vegetation index) 0.1 ( R λ n i r + R λ r e d )
CCCI (Canopy Chlorophyll Content Index) [ ( R λ n i r R λ r e d e d g e ) ] [ ( R λ n i r + R λ r e d e d g e ) ] / [ ( R λ n i r R λ r e d ) ( R λ n i r + R λ r e d ) ]
CIgreen (Chlorophyll Index Green) ( R λ n i r ) R λ g r e e n 1
CIrededge (Chlorophyll Index RedEdge) ( R λ n i r ) R λ r e d e d g e 1
CVI (Chlorophyll Vegetation Index) R λ n i r ( R λ r e d ) R λ g r e e n 2
DVI (Difference Vegetation Index) R λ n i r / R λ r e d
EVEI2 (Enhanced Vegetation Index 2) 2.5 ( R λ n i r R λ r e d )   /   ( R λ n i r + 2.4 R λ r e d + 1 )
GDVI (Difference NIR/Green Difference Vegetation Index) R λ n i r R λ g r e e n
GEMI (Global Environment Monitoring Index) 2 ( 1 0.25 2 ) ( ( R λ r e d 0.125 ) / ( 1 R λ r e d ) )
GNDVI (Green Normalized Difference Vegetation Index) ( R λ n i r R λ r g r e e n ) ( R λ n i r + R λ g r e e n )
GRNDVI (Green-Red NDVI) [ R λ n i r ( R λ g r e e n + R λ r e d ) ] / [ R λ n i r + ( R λ g r e e n + R λ r e d )
GRVI (Green-Red Vegetation Index) ( R λ g r e e n R λ r e d ) ( R λ g r e e n + R λ r e d )
GSAVI (Green Soil Adjusted Vegetation Index) [ ( R λ n i r R λ g r e e n ) / ( R λ n i r + R λ g r e e n + 0.5 ) ] 1.5
GTVI (Green Triangle Vegetation Index) ( N D V I + 0.5 ) / ( N D V I + 0.5 ) [ ( N D V I + 0.5 ) ]
IPVI (Infrared Percentage Vegetation Index) R λ n i r / ( ( R λ n i r + R λ r e d ) / 2 ) ( N D V I + 1 )
LogR (Log Ratio) Log ( R λ n i r /   R λ r e d )
MSAVI (Modified Soil Adjusted Vegetation Index) [ 2 ( R λ n i r + 1 ) ( 2 R λ n i r + 1 ) 2 8 ( R λ n i r R λ r e d ) ] / 2
MSRNir_Red (Modified Simple Ratio NIR/RED) ( R λ n i r / R λ r e d 1 ) ( R λ n i r / R λ r e d + 1
NDRE (Normalized Difference Red-Edge Index) R λ n i r R λ r e d e d g e λ n i r + R λ r e d e d g e
NDVI (Normalized Difference Vegetation Index) ( R λ n i r R λ r e d ) ( R λ n i r + R λ r e d )
NGRDI (Normalized Green-Red Difference Index) ( R λ g r e e n R λ r e d ) ( R λ g r e e n + R λ r e d )
NormR1 (Normalized G) R λ g r e e n ( R λ n i r + R λ r e d + R λ g r e e n )
NormR2 (Normalized NIR) R λ n i r ( R λ n i r + R λ r e d + R λ g r e e n )
NormR3 (Normalized R) R λ r e d ( R λ n i r + R λ r e d + R λ g r e e n )
RGR (Red Green Ratio Index) ( R λ r e d ) R λ g r e e n
RI (Redness Index) R λ r e d R λ g r e e n / R λ r e d + R λ g r e e n
RRI 1 R λ n i r R λ r e d e d g e
SRQT_IR_R (Square root of the NIR/Red ratio) R λ n i r   / R λ r e d
SRRed_NIR R λ r e d R λ n i r
TNDVI (Transformed NDVI) [ ( R λ n i r R λ r e d ) / ( R λ n i r + R λ r e d ) + 0.5 ]
TVI (Transformed Vegetation Index) [ N D V I + 0 , 5 ]
WDRVI (Wide Dynamic Range Vegetation Index)(0.1 ∗ ( ( R λ n i r R λ r e d ) ) /   ( 0.1 ( R λ n i r + R λ r e d ))
NIR = near-infrared; = wavelength reflectance; RRI = Simple Ratio NIR/Rededge RedEdge Ratio Index 1; SRQT_IR_R = square root of the NIR/Red ratio; SRRed_NIR = Simple Ratio Red/NIR Ratio Vegetation-Index.
Table 2. Grouping of means of mean absolute error (MAE), root mean squared error (RMSE), and Pearson’s correlation coefficient (r) between estimated and observed values for days to maturity in soybean obtained with different machine learning models and input configurations.
ModelInput
WLVIWLVI
MAE
DL6.05 Bc7.45 Aa7.62 Aa
RF6.24 Ac6.09 Ac6.04 Ac
SVM7.11 Ab6.65 Bb6.38 Bb
LR7.37 Aa7.43 Aa7.41 Aa
RMSE
DL8.01 Cd10.23 Ba10.58 Aa
RF8.58 Ac8.28 Ac8.23 Ad
SVM9.76 Aa9.25 Bb8.82 Cc
LR9.34 Ab9.41 Ab9.39 Ab
r
DL0.66 Aa0.57 Bb0.54 Cc
RF0.62 Ab0.65 Aa0.65 Aa
SVM0.46 Cd0.53 Bc0.58 Ab
LR0.51 Ac0.50 Ad0.50 Ad
Means followed by the same uppercase letters in the same row and the same lowercase letters in the same column do not differ by the Scott–Knott test at 5% probability. DL: deep learning (DL); RF: random forests; SVM: support vector machine; LR: linear regression; WL: spectral bands wavelengths; VI: spectral vegetation indices; WLVI: a combination between spectral bands and vegetation indices.
Table 3. Grouping of means of mean absolute error (MAE), root mean squared error (RMSE), and Pearson’s correlation coefficient (r) between estimated and observed values for plant height in soybean obtained with different machine learning models and input configurations.
ModelInput
WLVIWLVI
MAE
DL8.32 Cb10.89 Ba11.92 Aa
RF8.38 Ab8.09 Ac8.11 Ac
SVM8.98 Aa8.55 Bb8.49 Bb
LR9.03 Aa8.65 Bb8.67 Bb
RMSE
DL10.51 Cb13.38 Ba14.55 Aa
RF10.88 Ab10.49 Ac10.51 Ac
SVM11.77 Aa11.05 Bb10.97 Bb
LR11.78 Aa11.24 Bb11.21 Bb
r
DL0.79 Aa0.77 Ab0.75 Bb
RF0.77 Ba0.79 Aa0.79 Aa
SVM0.73 Bb0.76 Ac0.77 Ab
LR0.73 Bb0.75 Ac0.75 Ab
Means followed by the same uppercase letters in the same row and the same lowercase letters in the same column do not differ by the Scott–Knott test at 5% probability. DL: deep learning (DL); RF: random forests; SVM: support vector machine; LR: linear regression; WL: spectral bands wavelengths; VI: spectral vegetation indices; WLVI: a combination between spectral bands and vegetation indices.
Table 4. Grouping of means of mean absolute error (MAE), root mean squared error (RMSE), and Pearson’s correlation coefficient (r) between estimated and observed values for grain yield in soybean obtained with different machine learning models.
ModelMAERMSEr
DL788.31 b1000.48 b0.45 a
RF807.16 a1025.59 a0.42 a
SVM787.87 b1010.11 b0.44 a
LR790.88 b105.06 b0.43 a
Means followed by the same uppercase letters in the same row and the same lowercase letters in the same column do not differ by the Scott–Knott test at 5% probability. DL: deep learning (DL); RF: random forests; SVM: support vector machine; LR: linear regression.
Publisher’s Note: MDPI stays neutral with regard to jurisdictional claims in published maps and institutional affiliations.