
Assessing the Potential of Upcoming Satellite Altimeter Missions in Operational Flood Forecasting Systems


Abstract
:1. Introduction
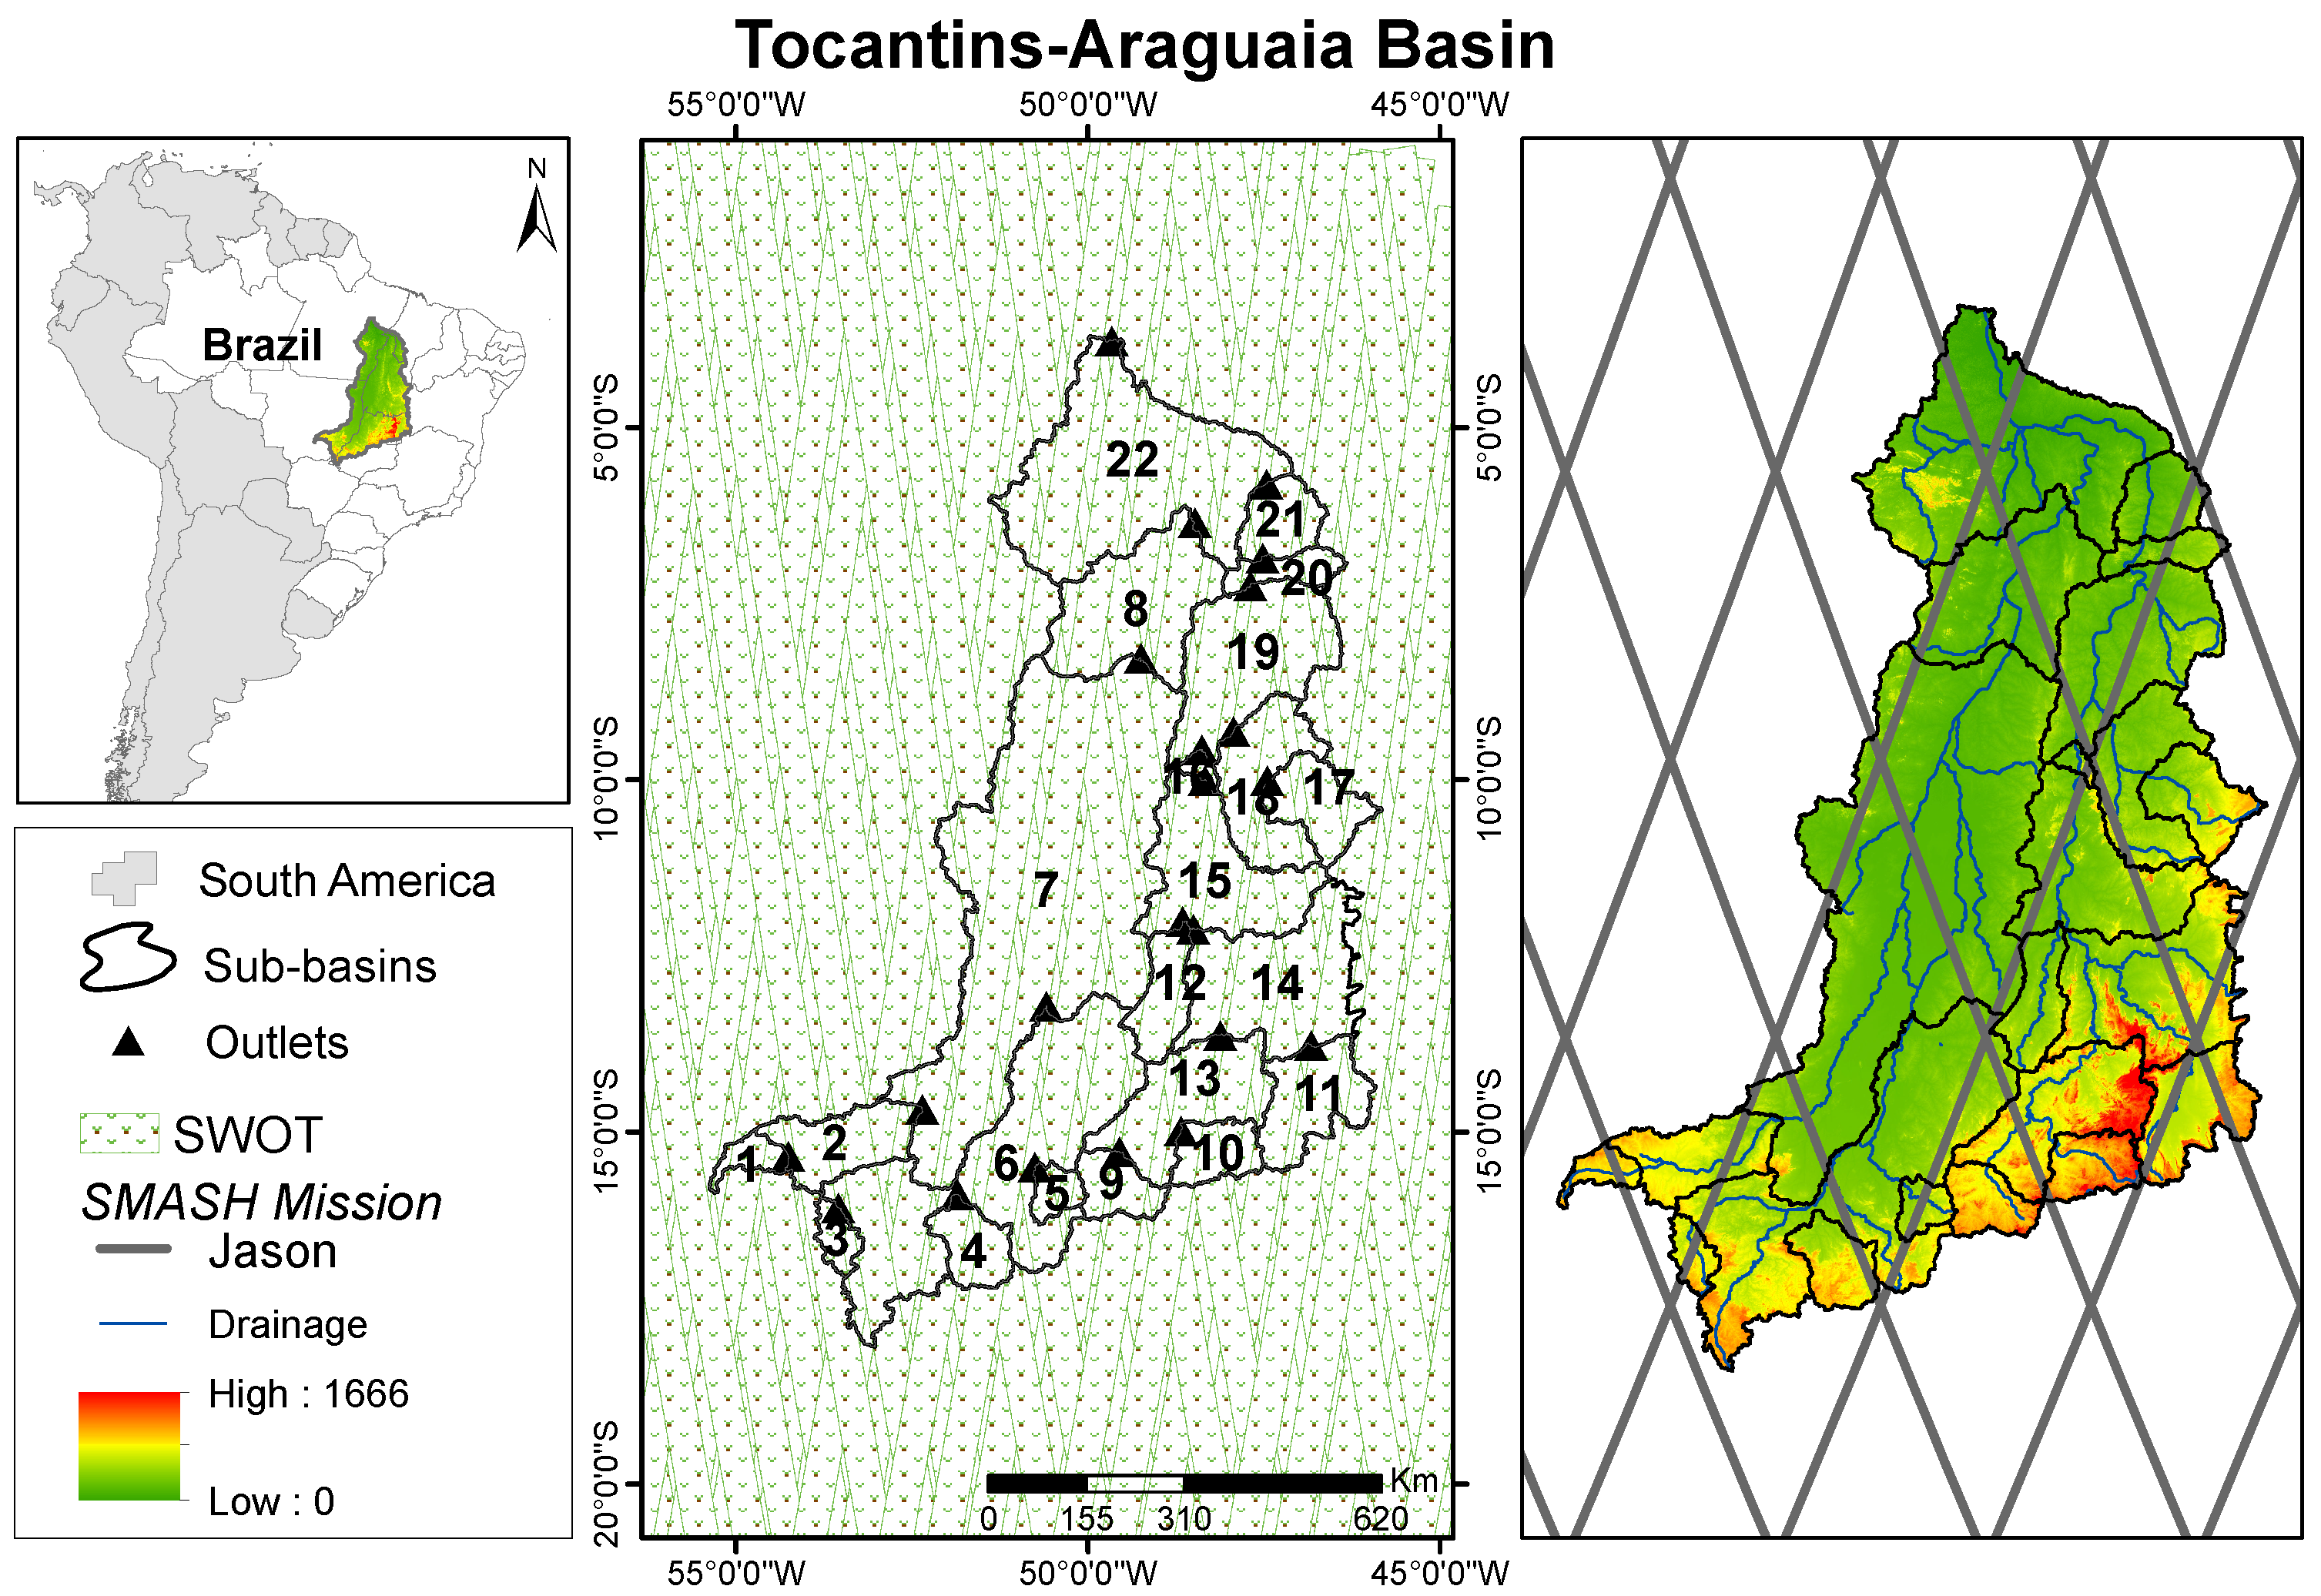
2. Study Area
3. Hydrological Model and Datasets
3.1. Hydrological Model
- Using the HAND model [40], soil environments were classified as suggested by Cuartas et al. [41], subdividing the basins into four different environments: valley, footslope, upslope, and plateau. The threshold for different HAND environments was determined by visual analysis, with comparative support of the basin soil map Santos et al. [42] and by relating soil toposequences to the HAND environments [41];
- Annual Land Use and Land Cover change (LULC) maps used in this study were provided by the MapBiomas Project Collection 5 [43] for the period 2000–2014. Vegetation types within the basin include forest formation, savanna formation, mangrove, forest plantation, grassland, pasture, agricultural mosaic, and silviculture. Consequently, the hydrological response units were updated yearly in accordance with the LULC maps, as described by Rodriguez and Tomasella [31].
3.2. Hydrometeorological Data
3.3. Satellite Rainfall Estimates
3.4. Daily Weather Forecast
4. Methodology
4.1. Hydrological Run Experiments
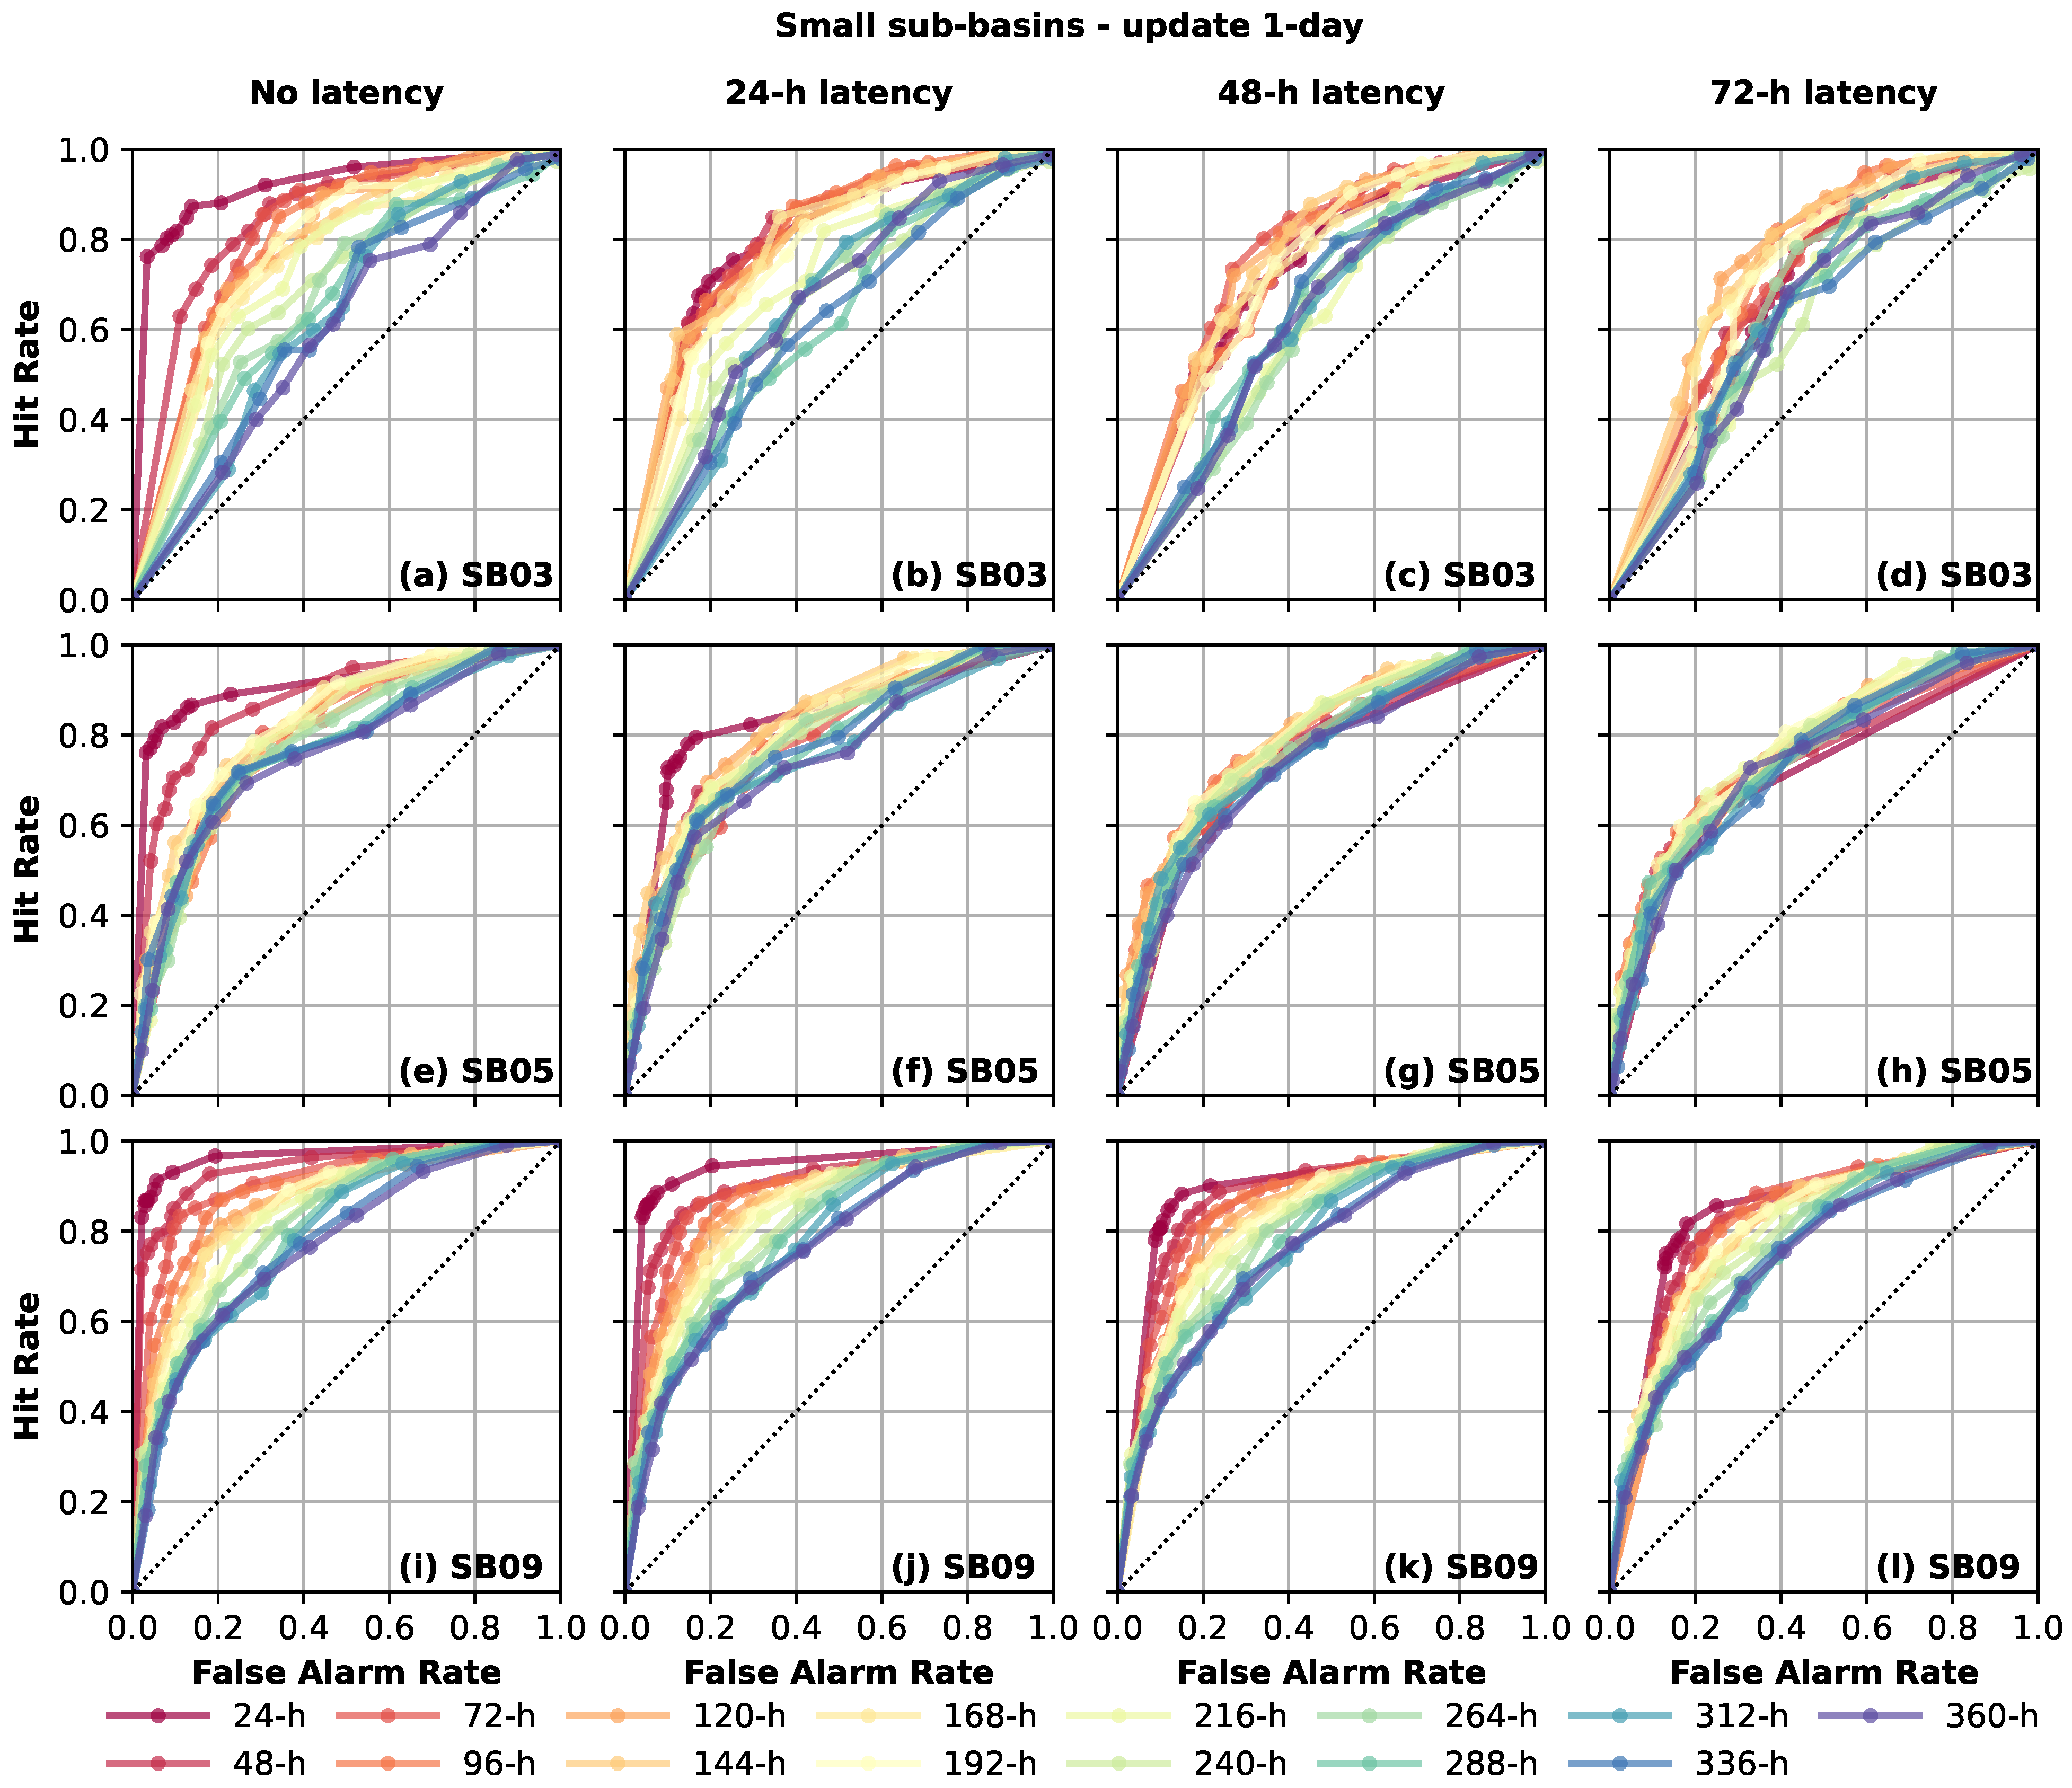
4.2. Performance Analysis
4.3. Ensemble Flood Forecast Performance
5. Results and Discussion
5.1. Hydrological Model Performance
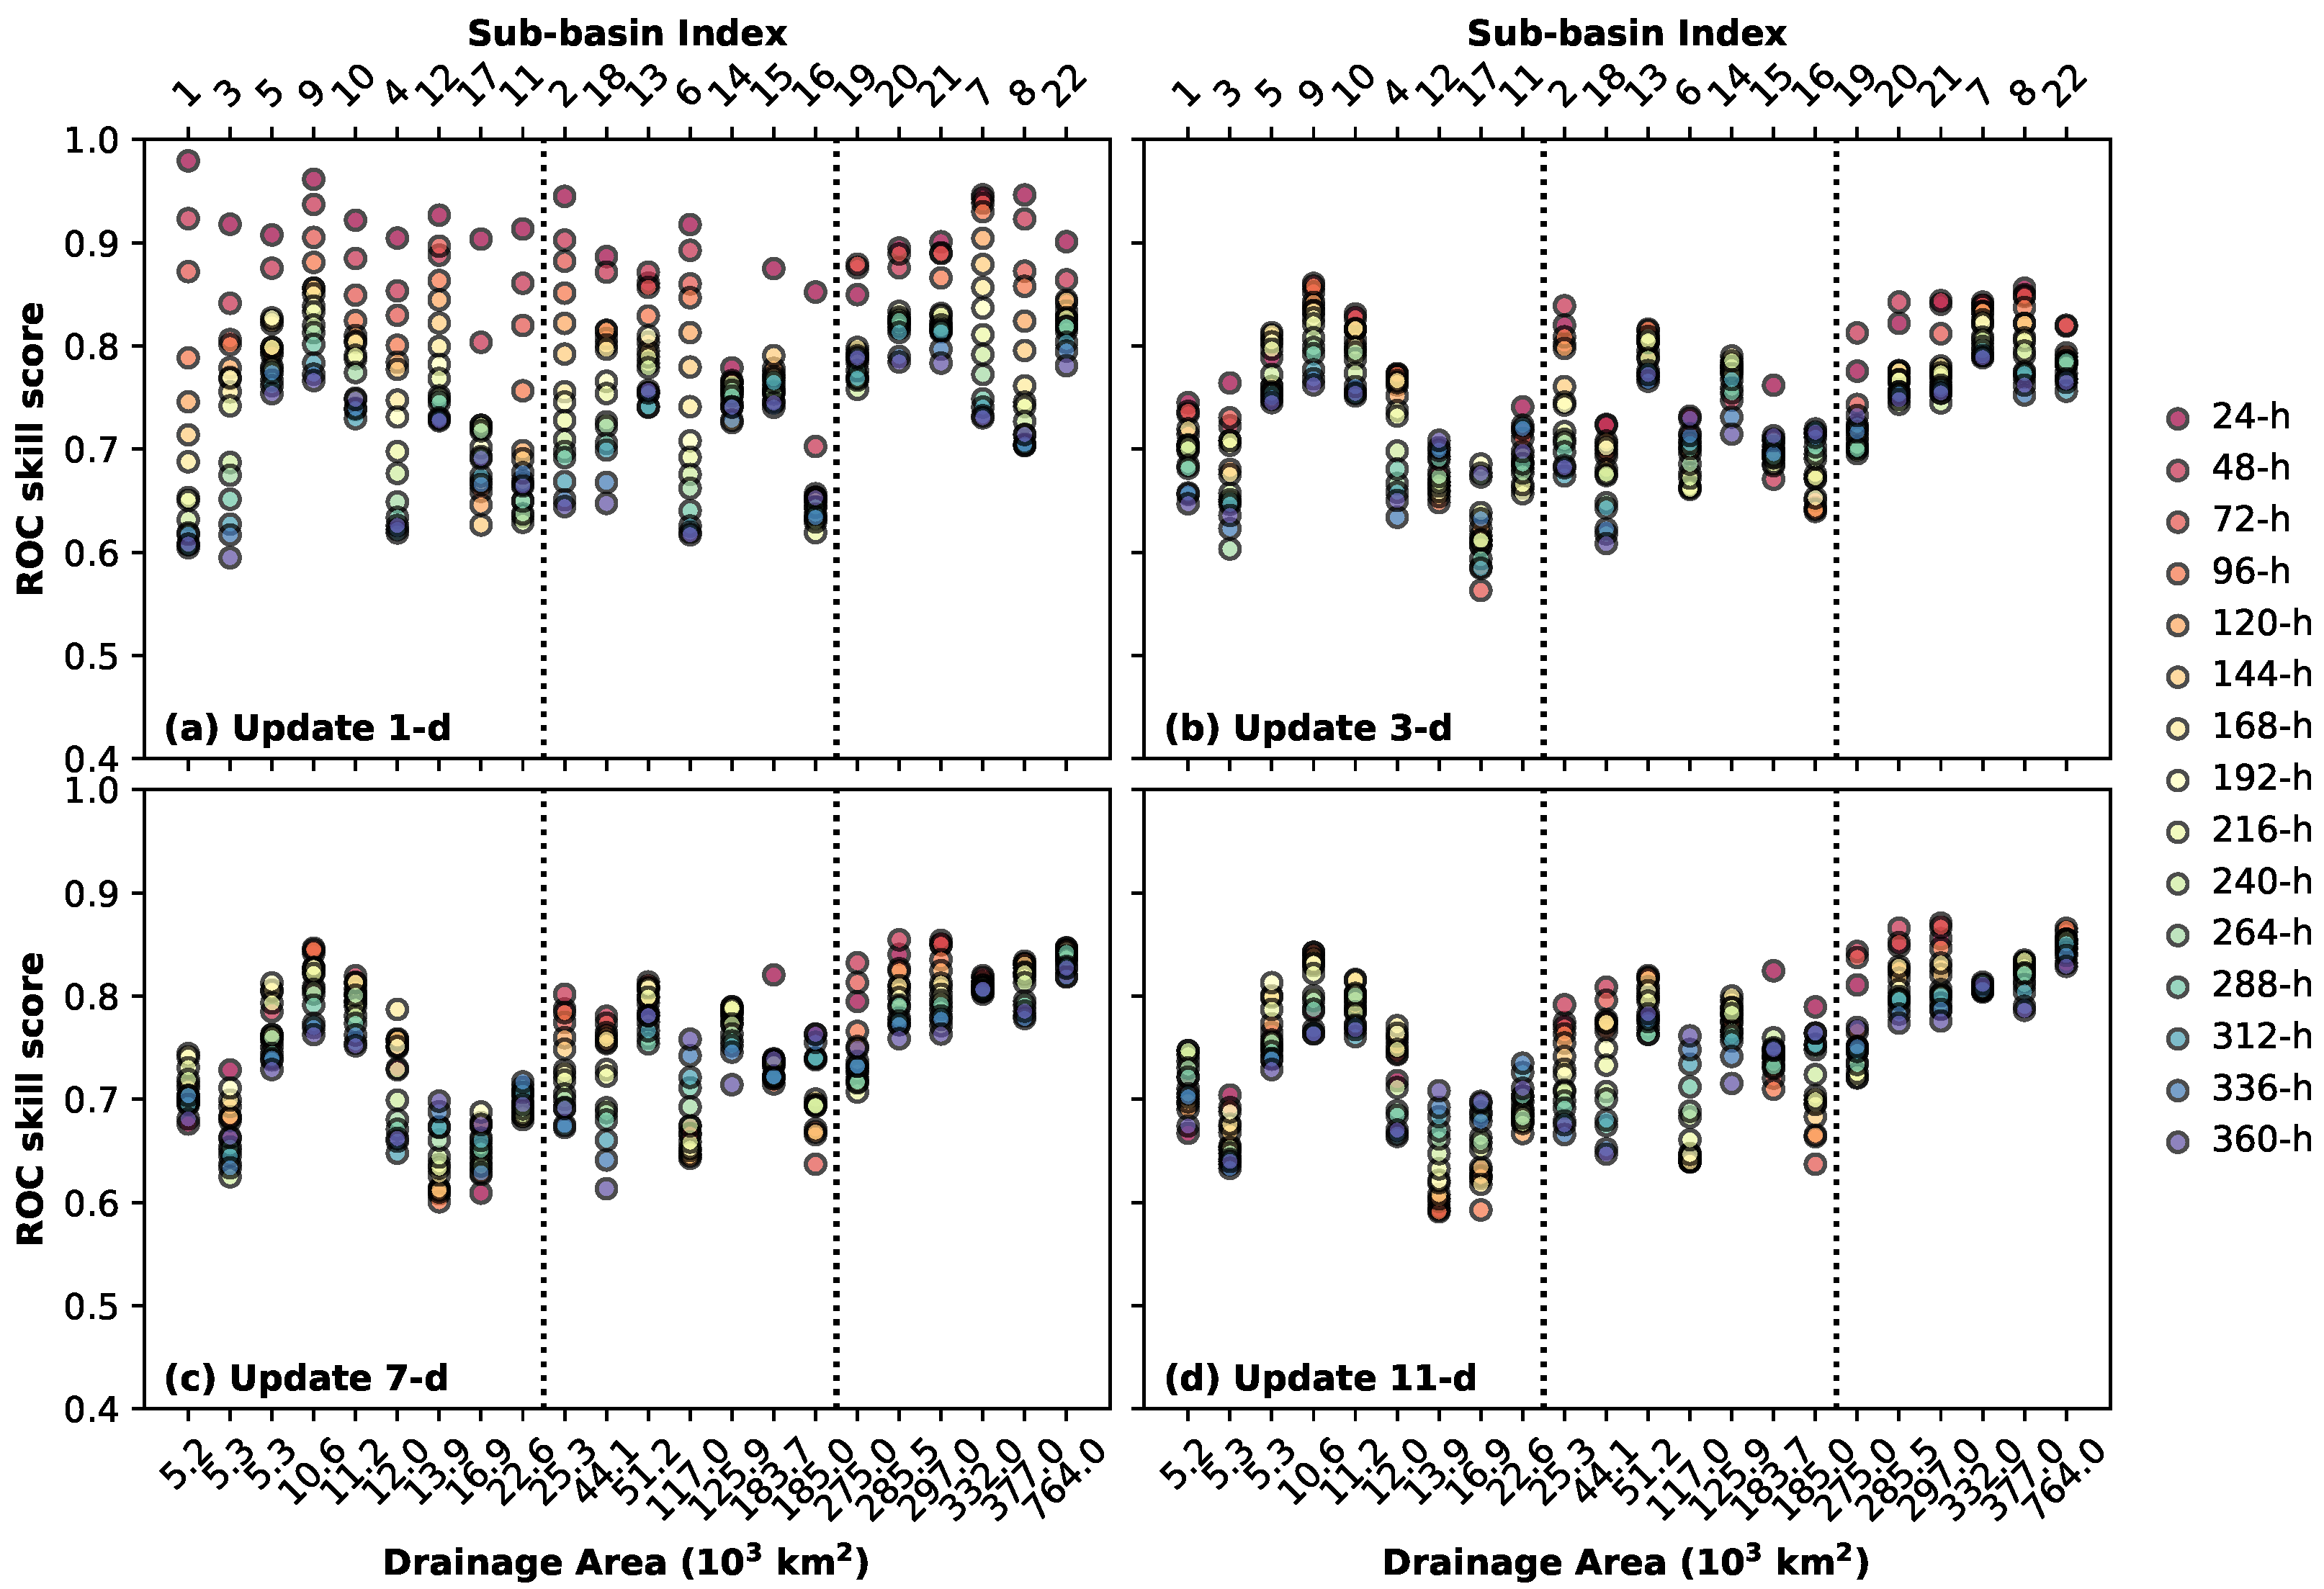
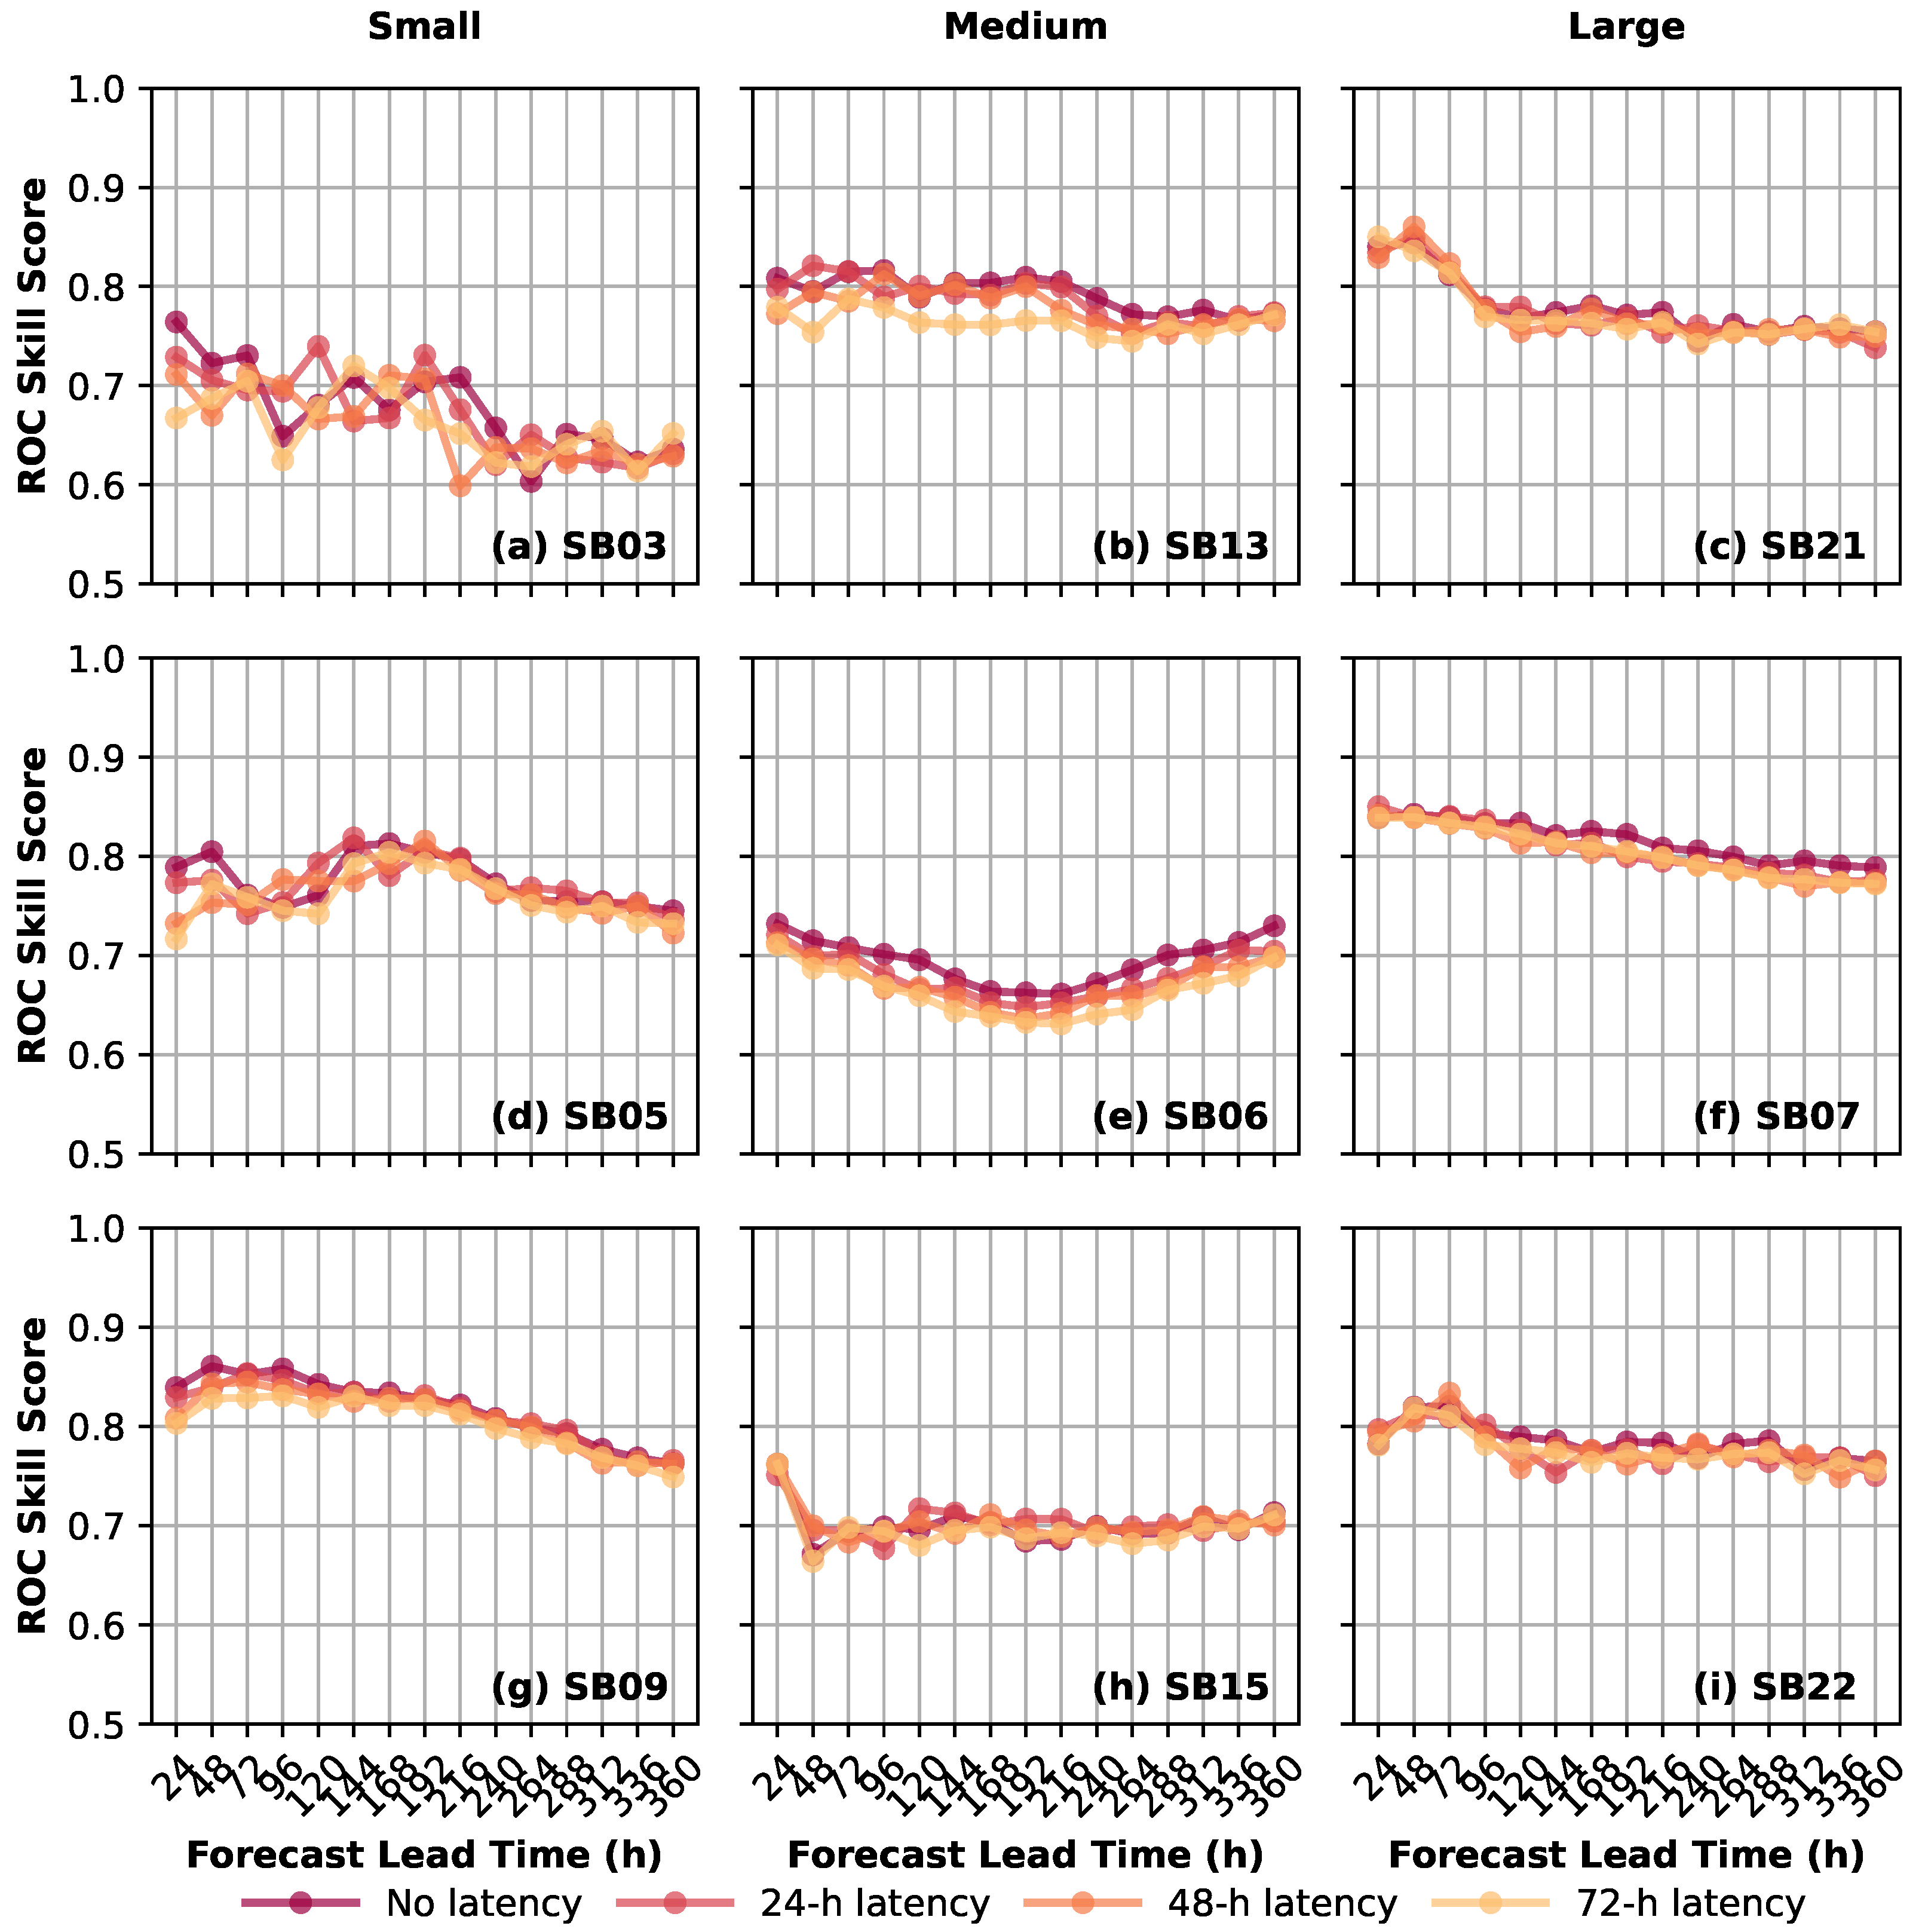
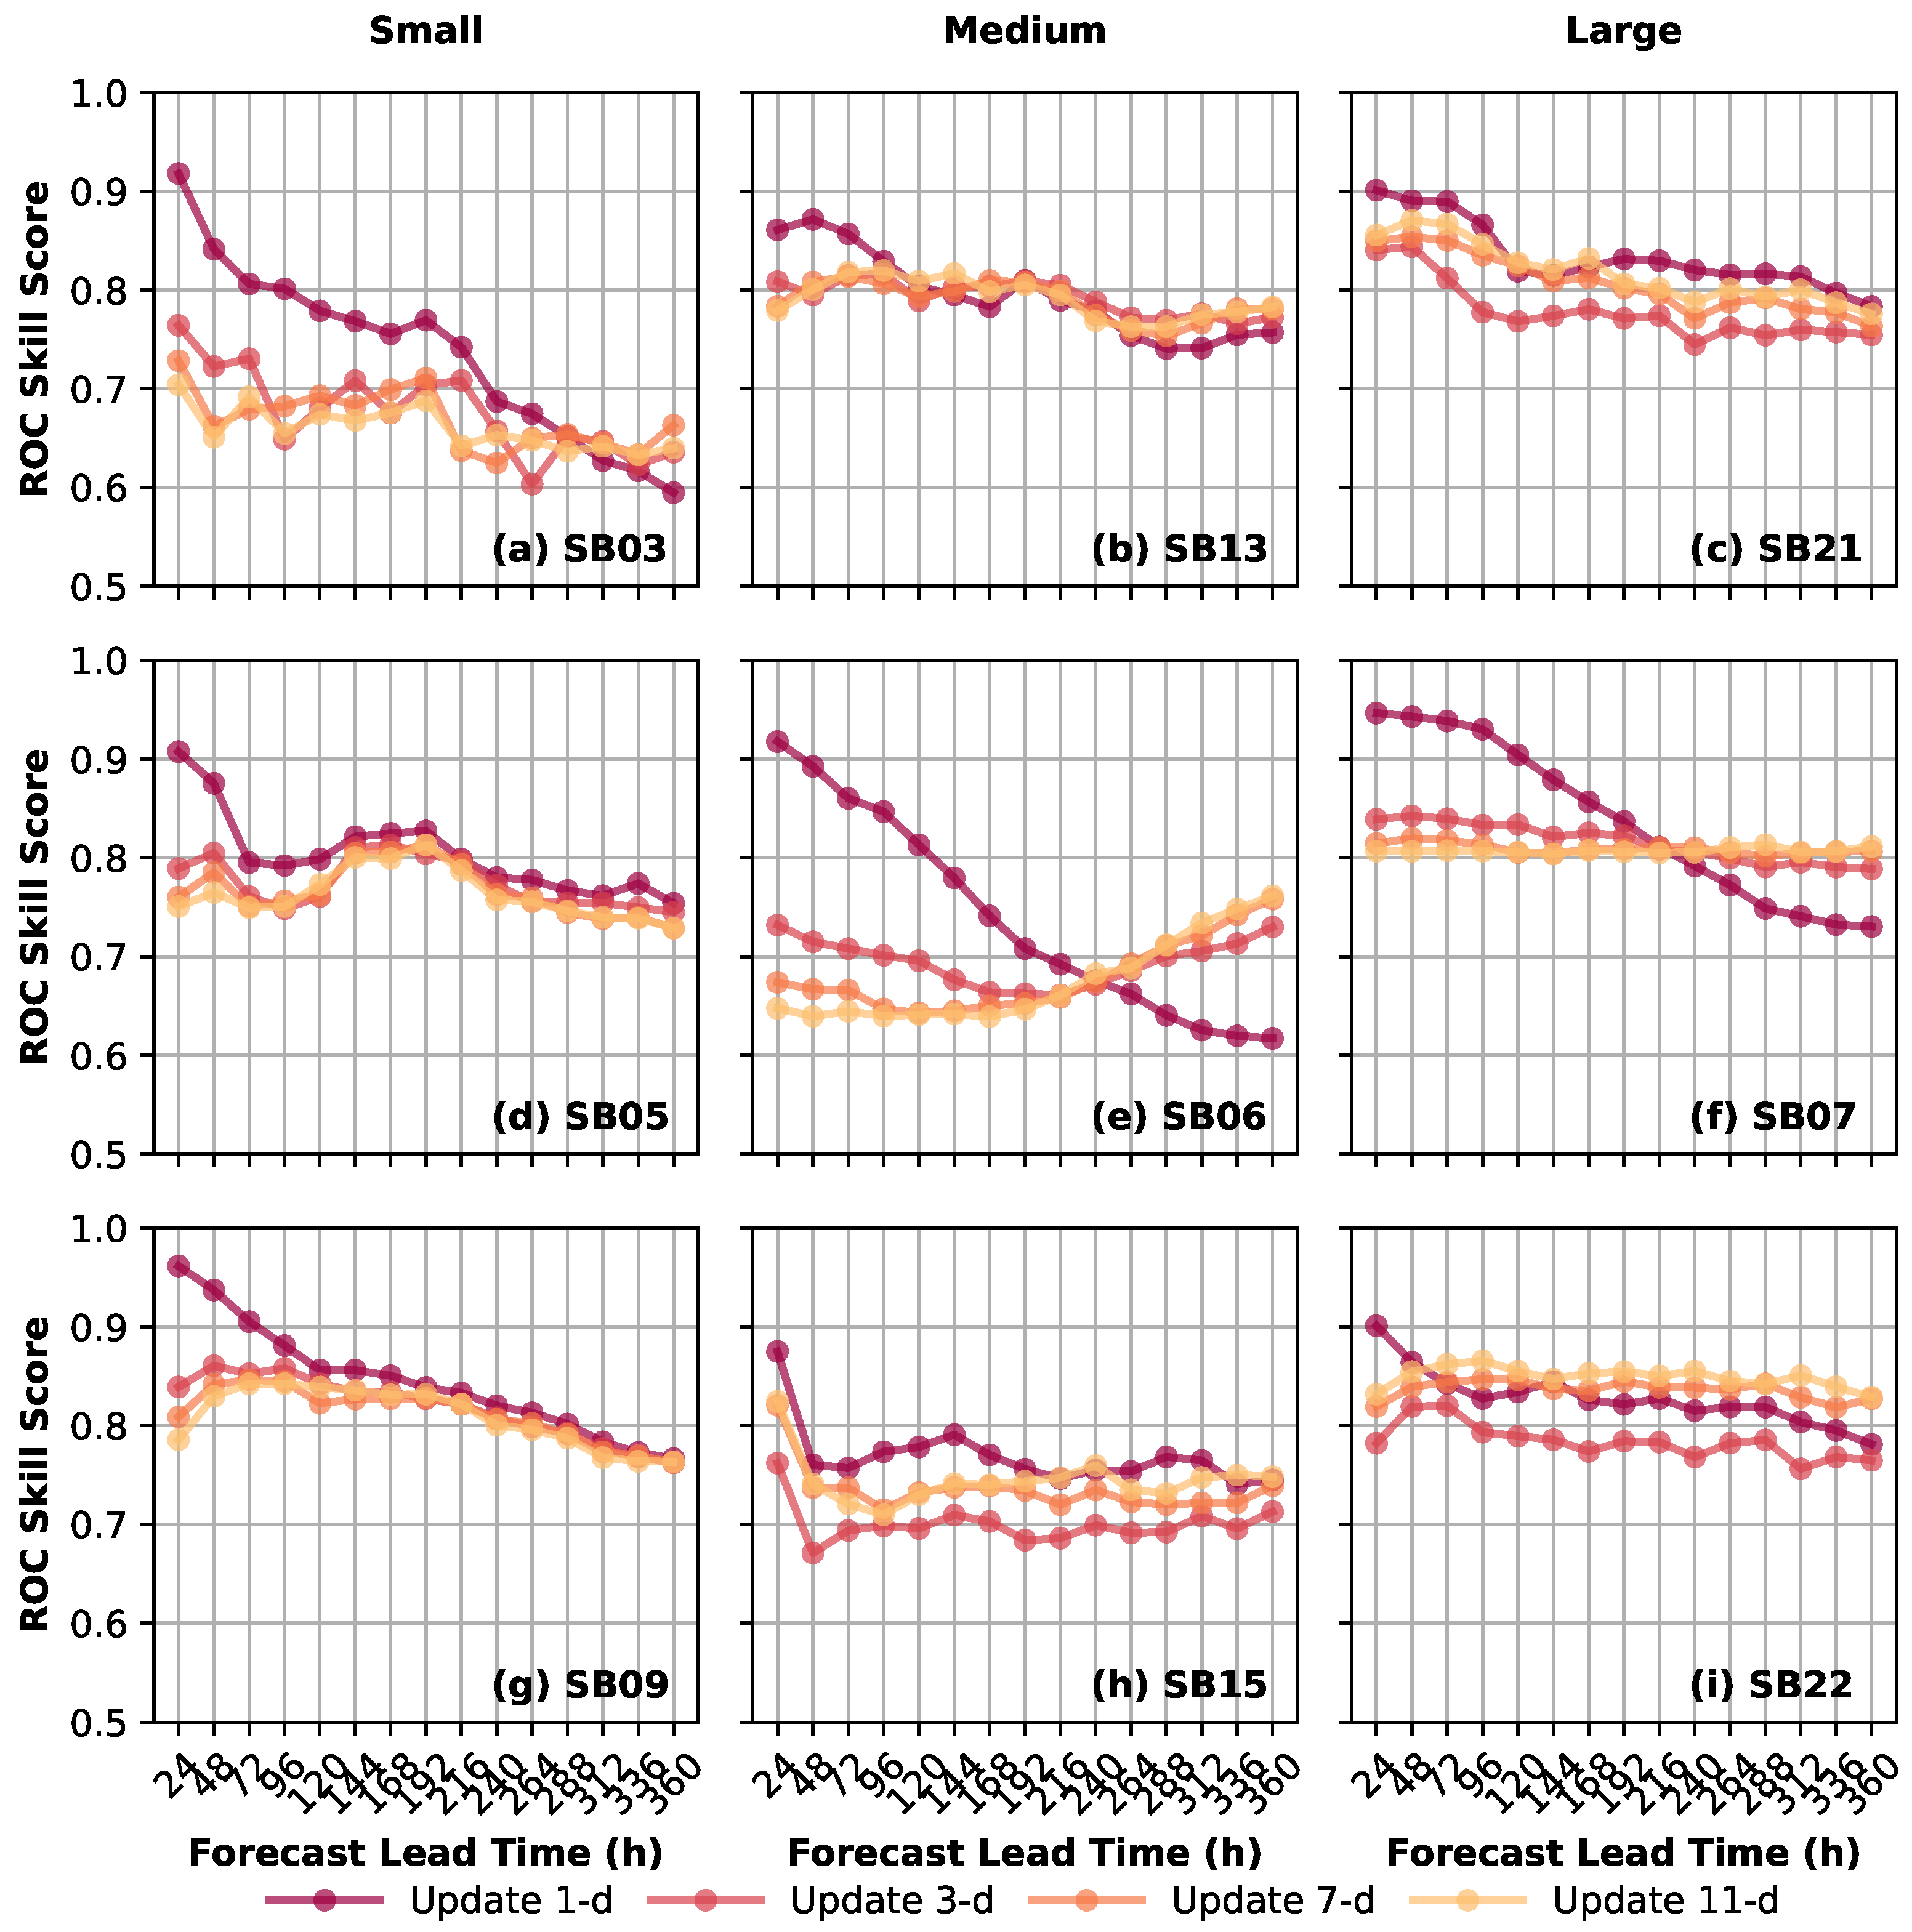
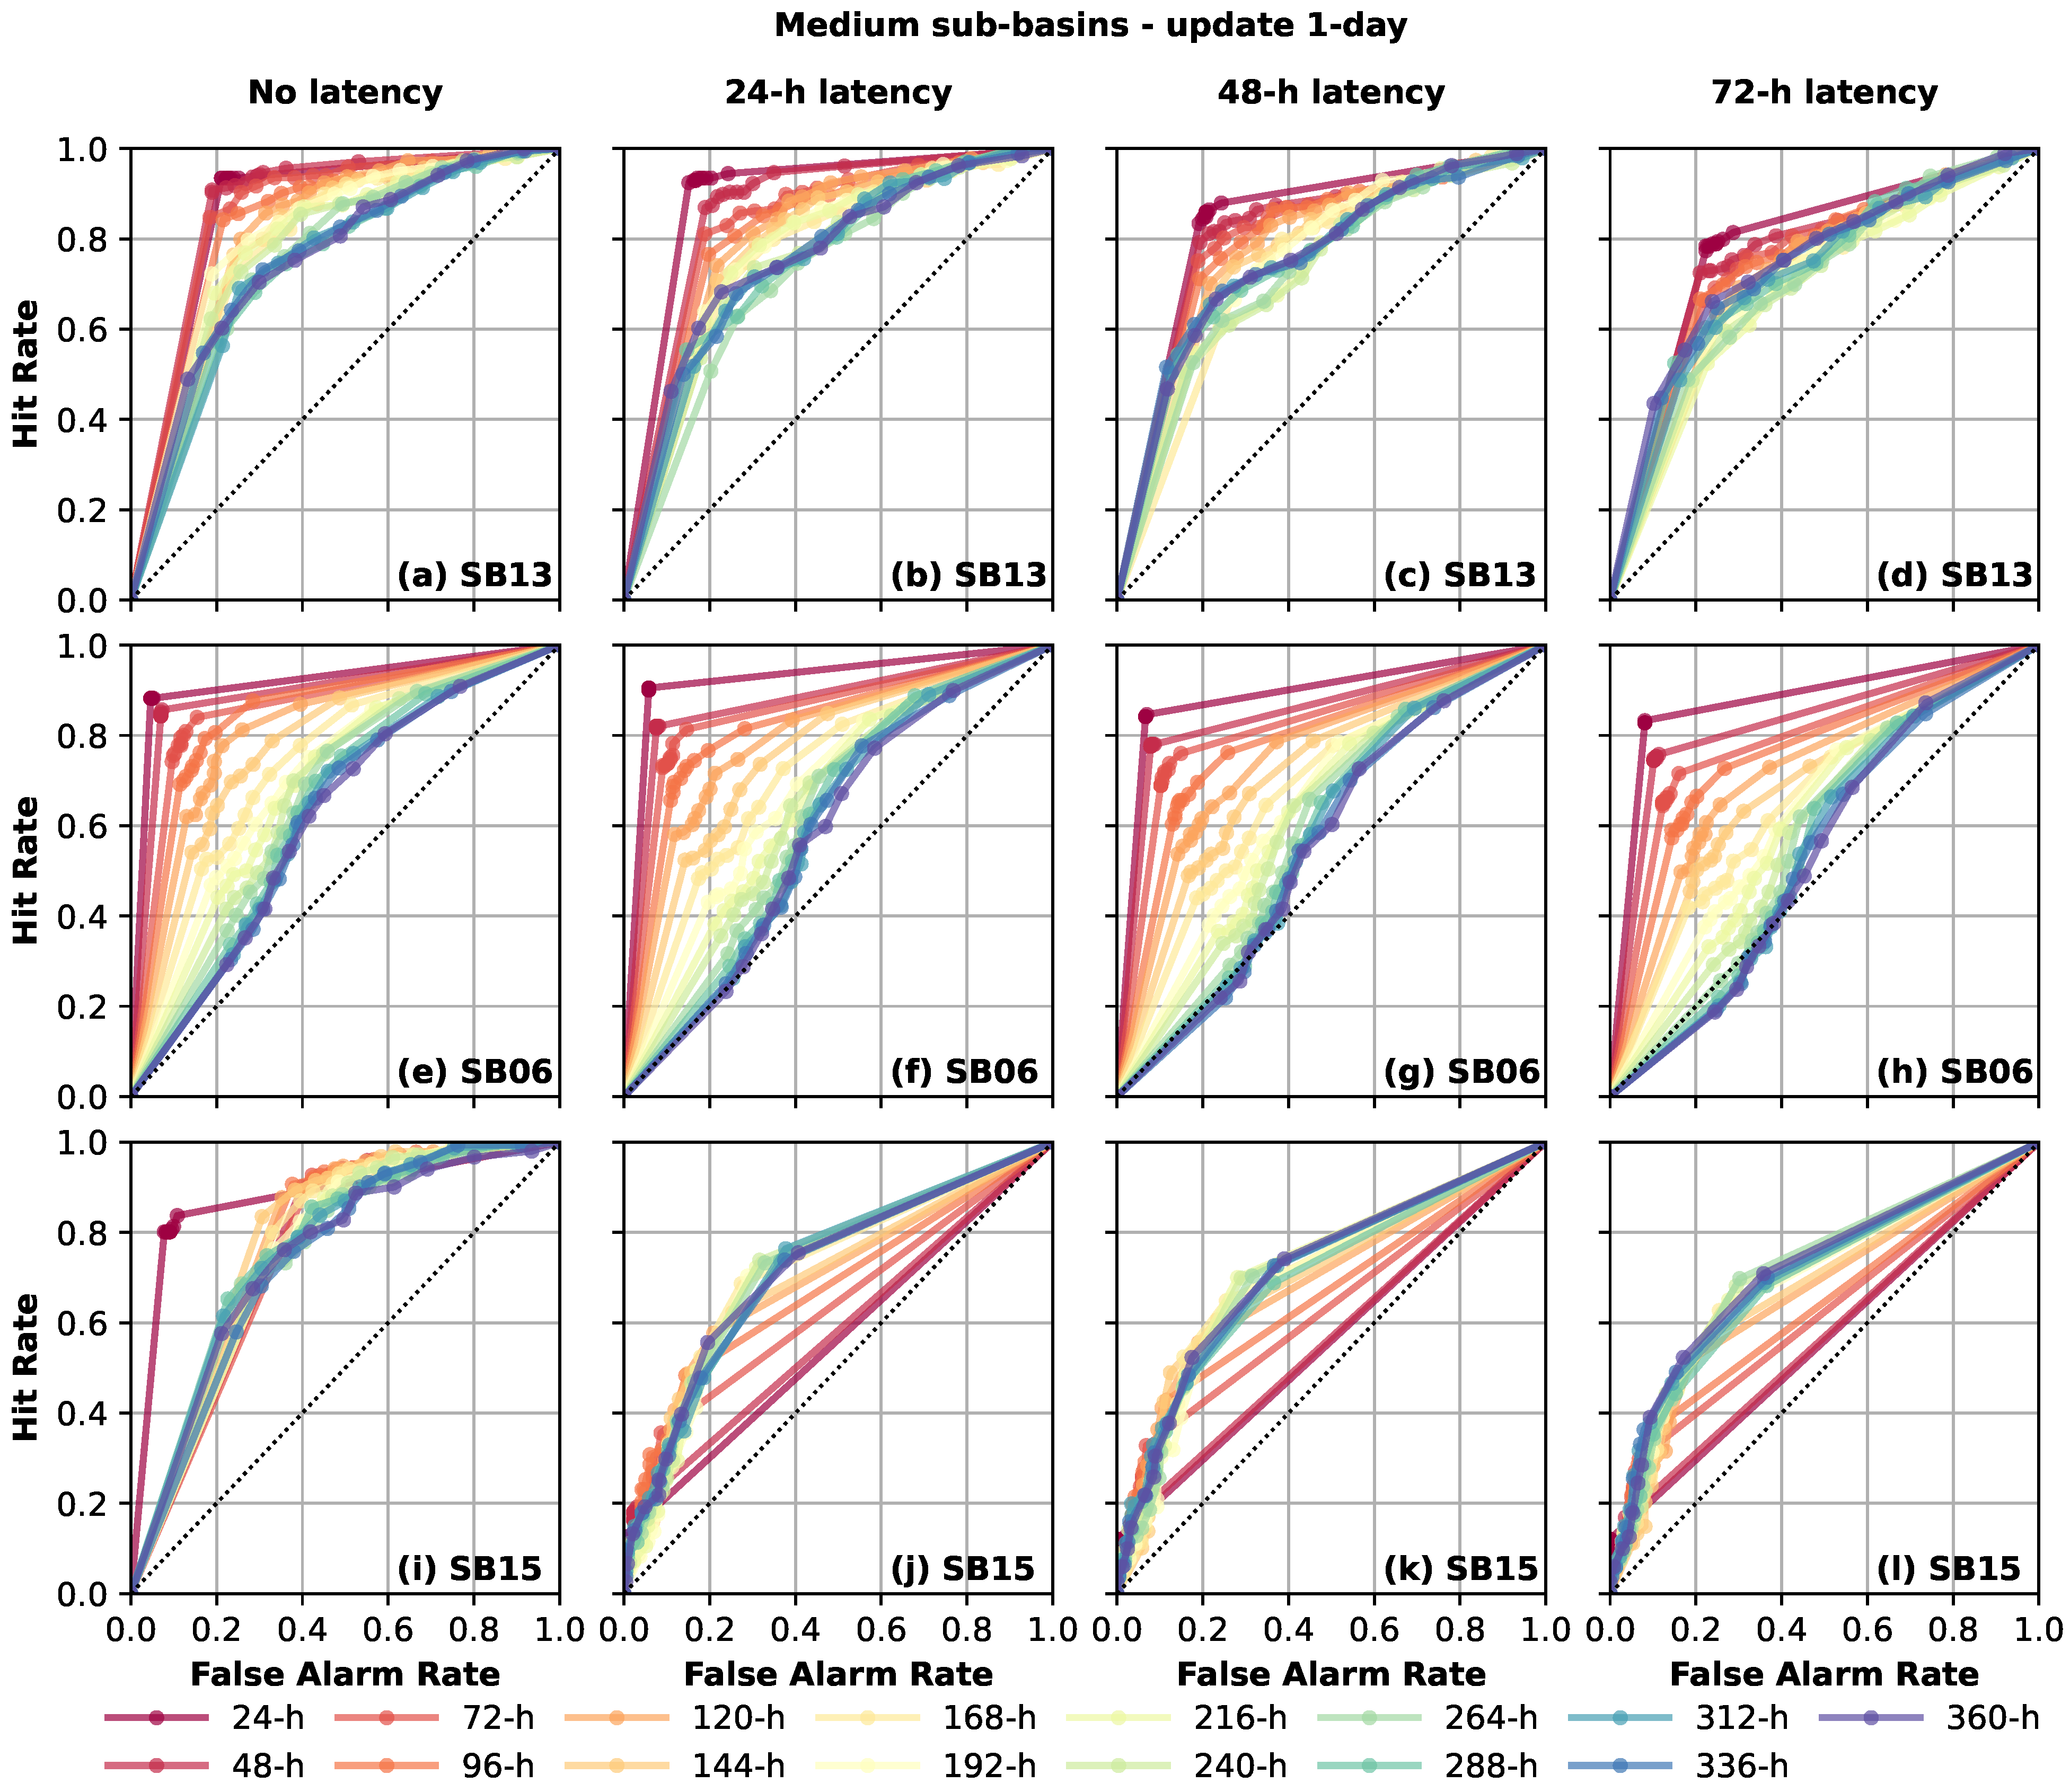
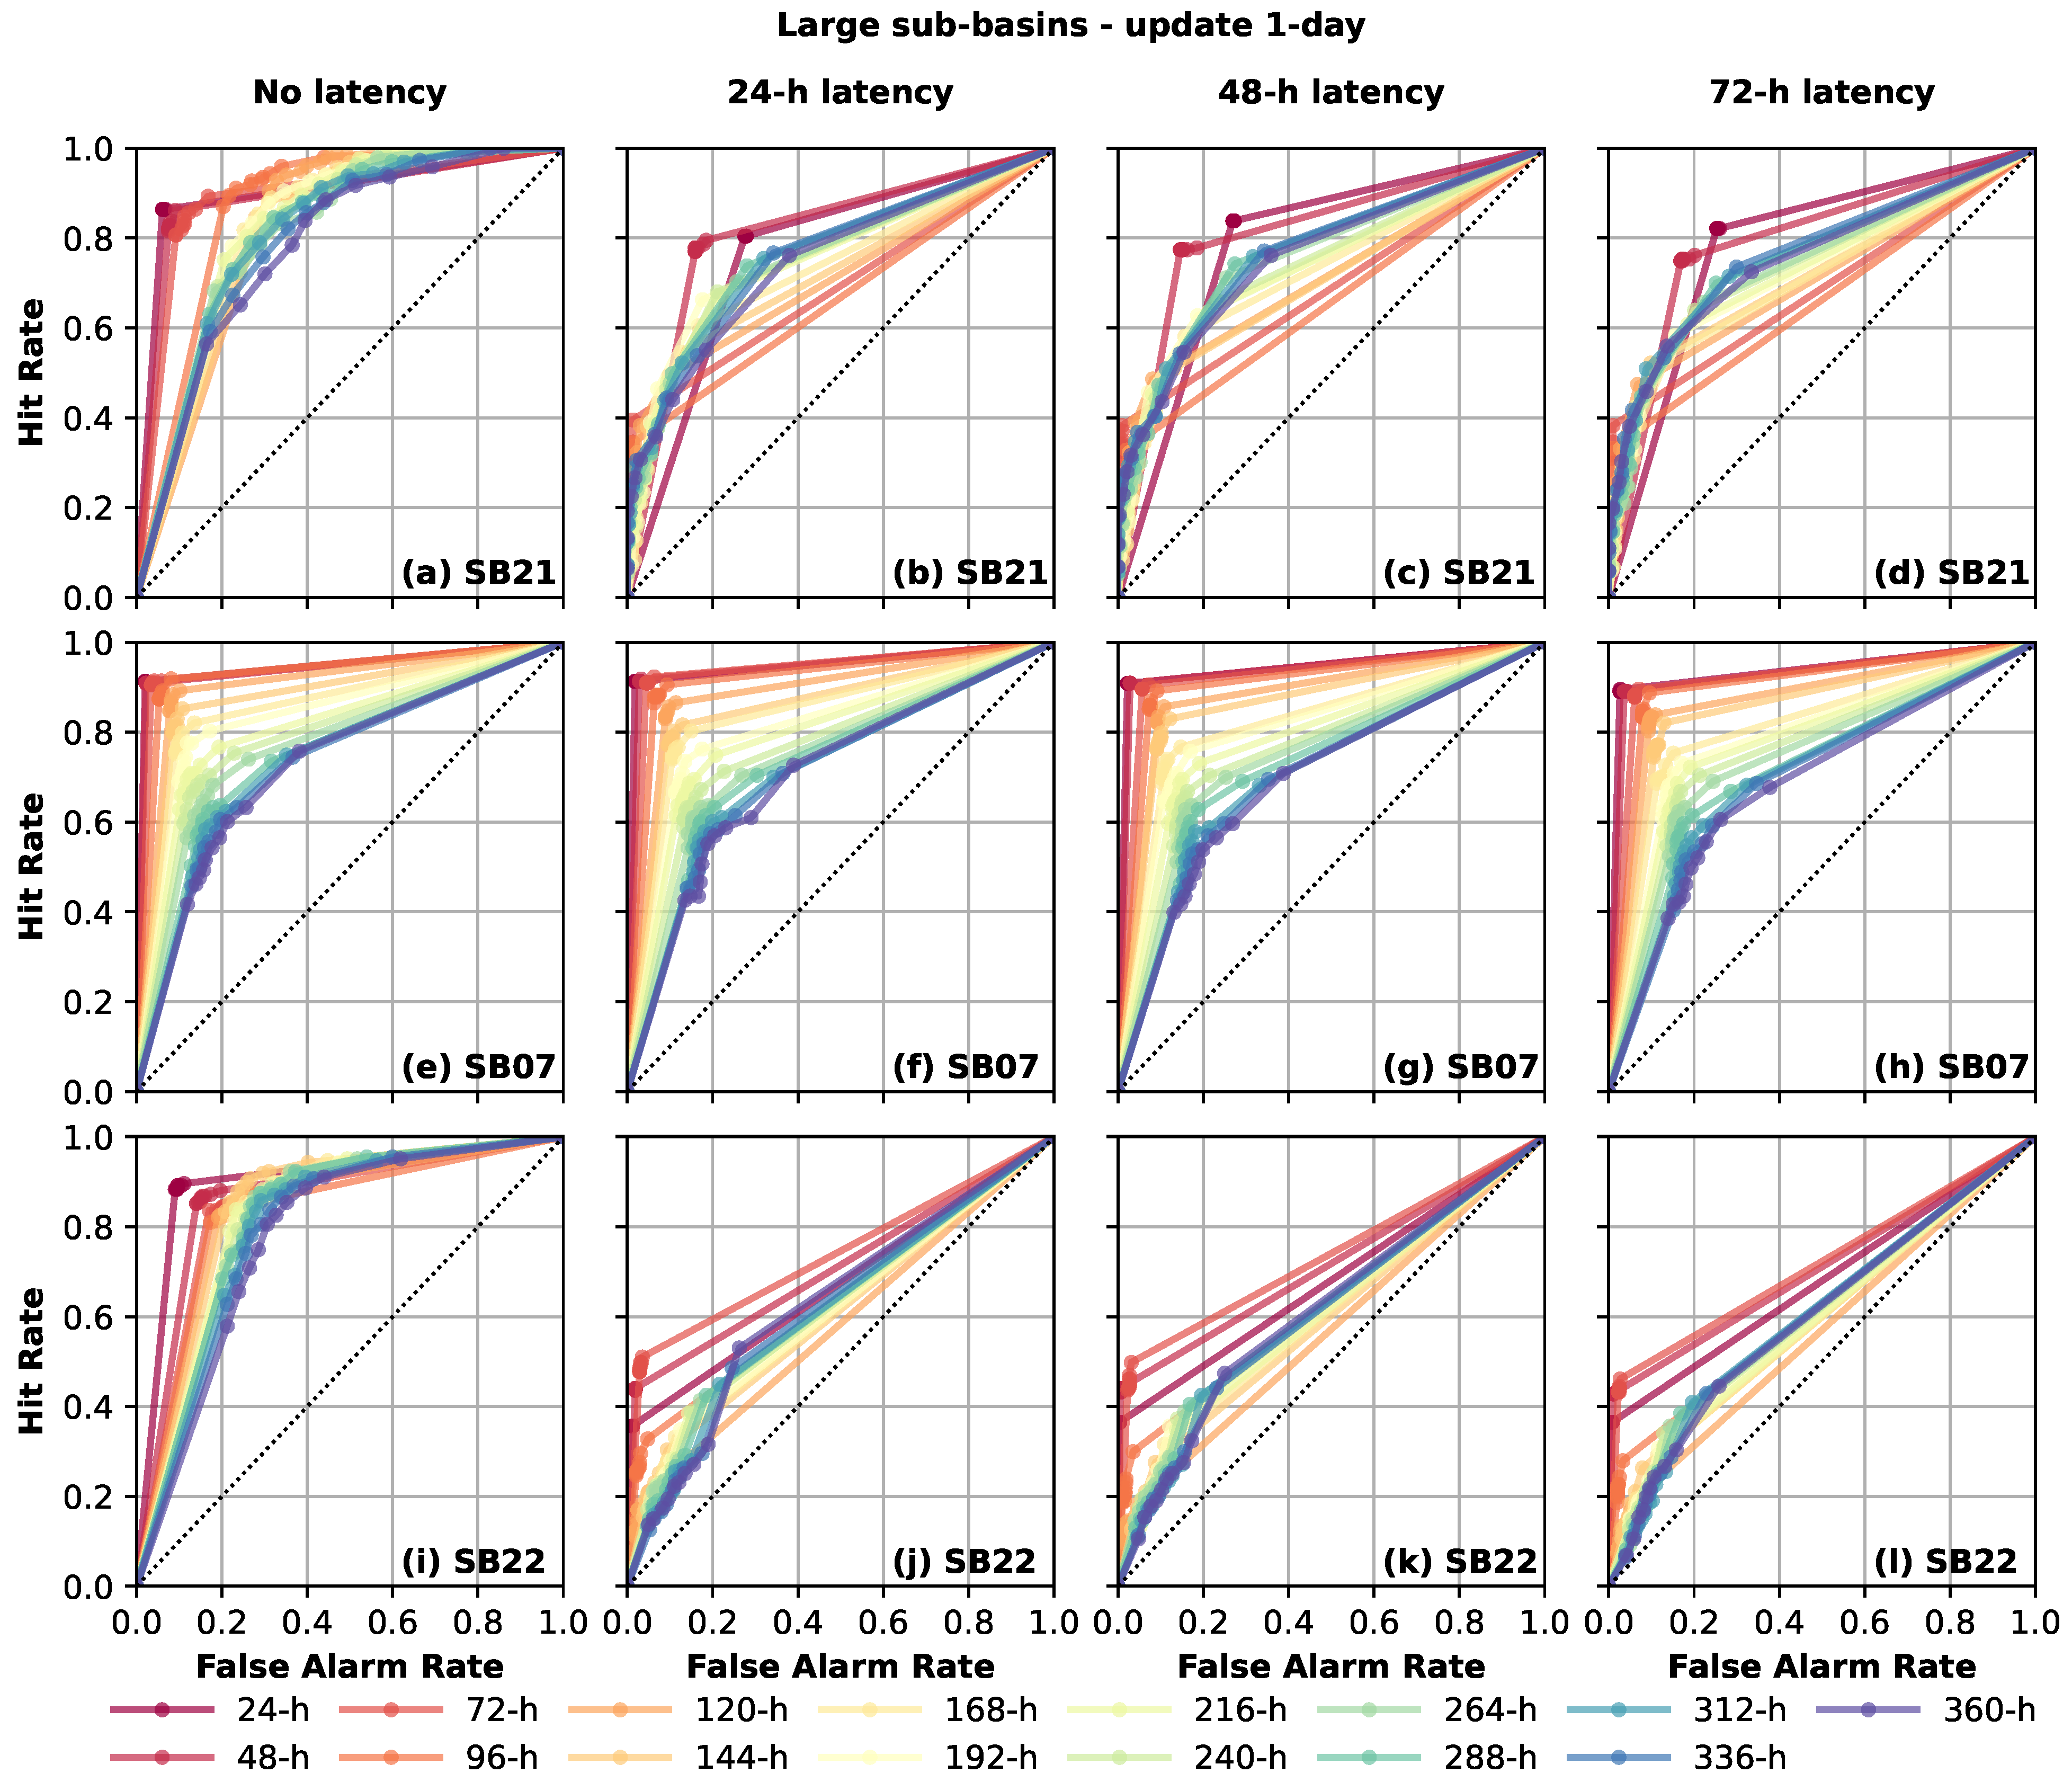
5.2. ROC Skill Score in Terms of Update
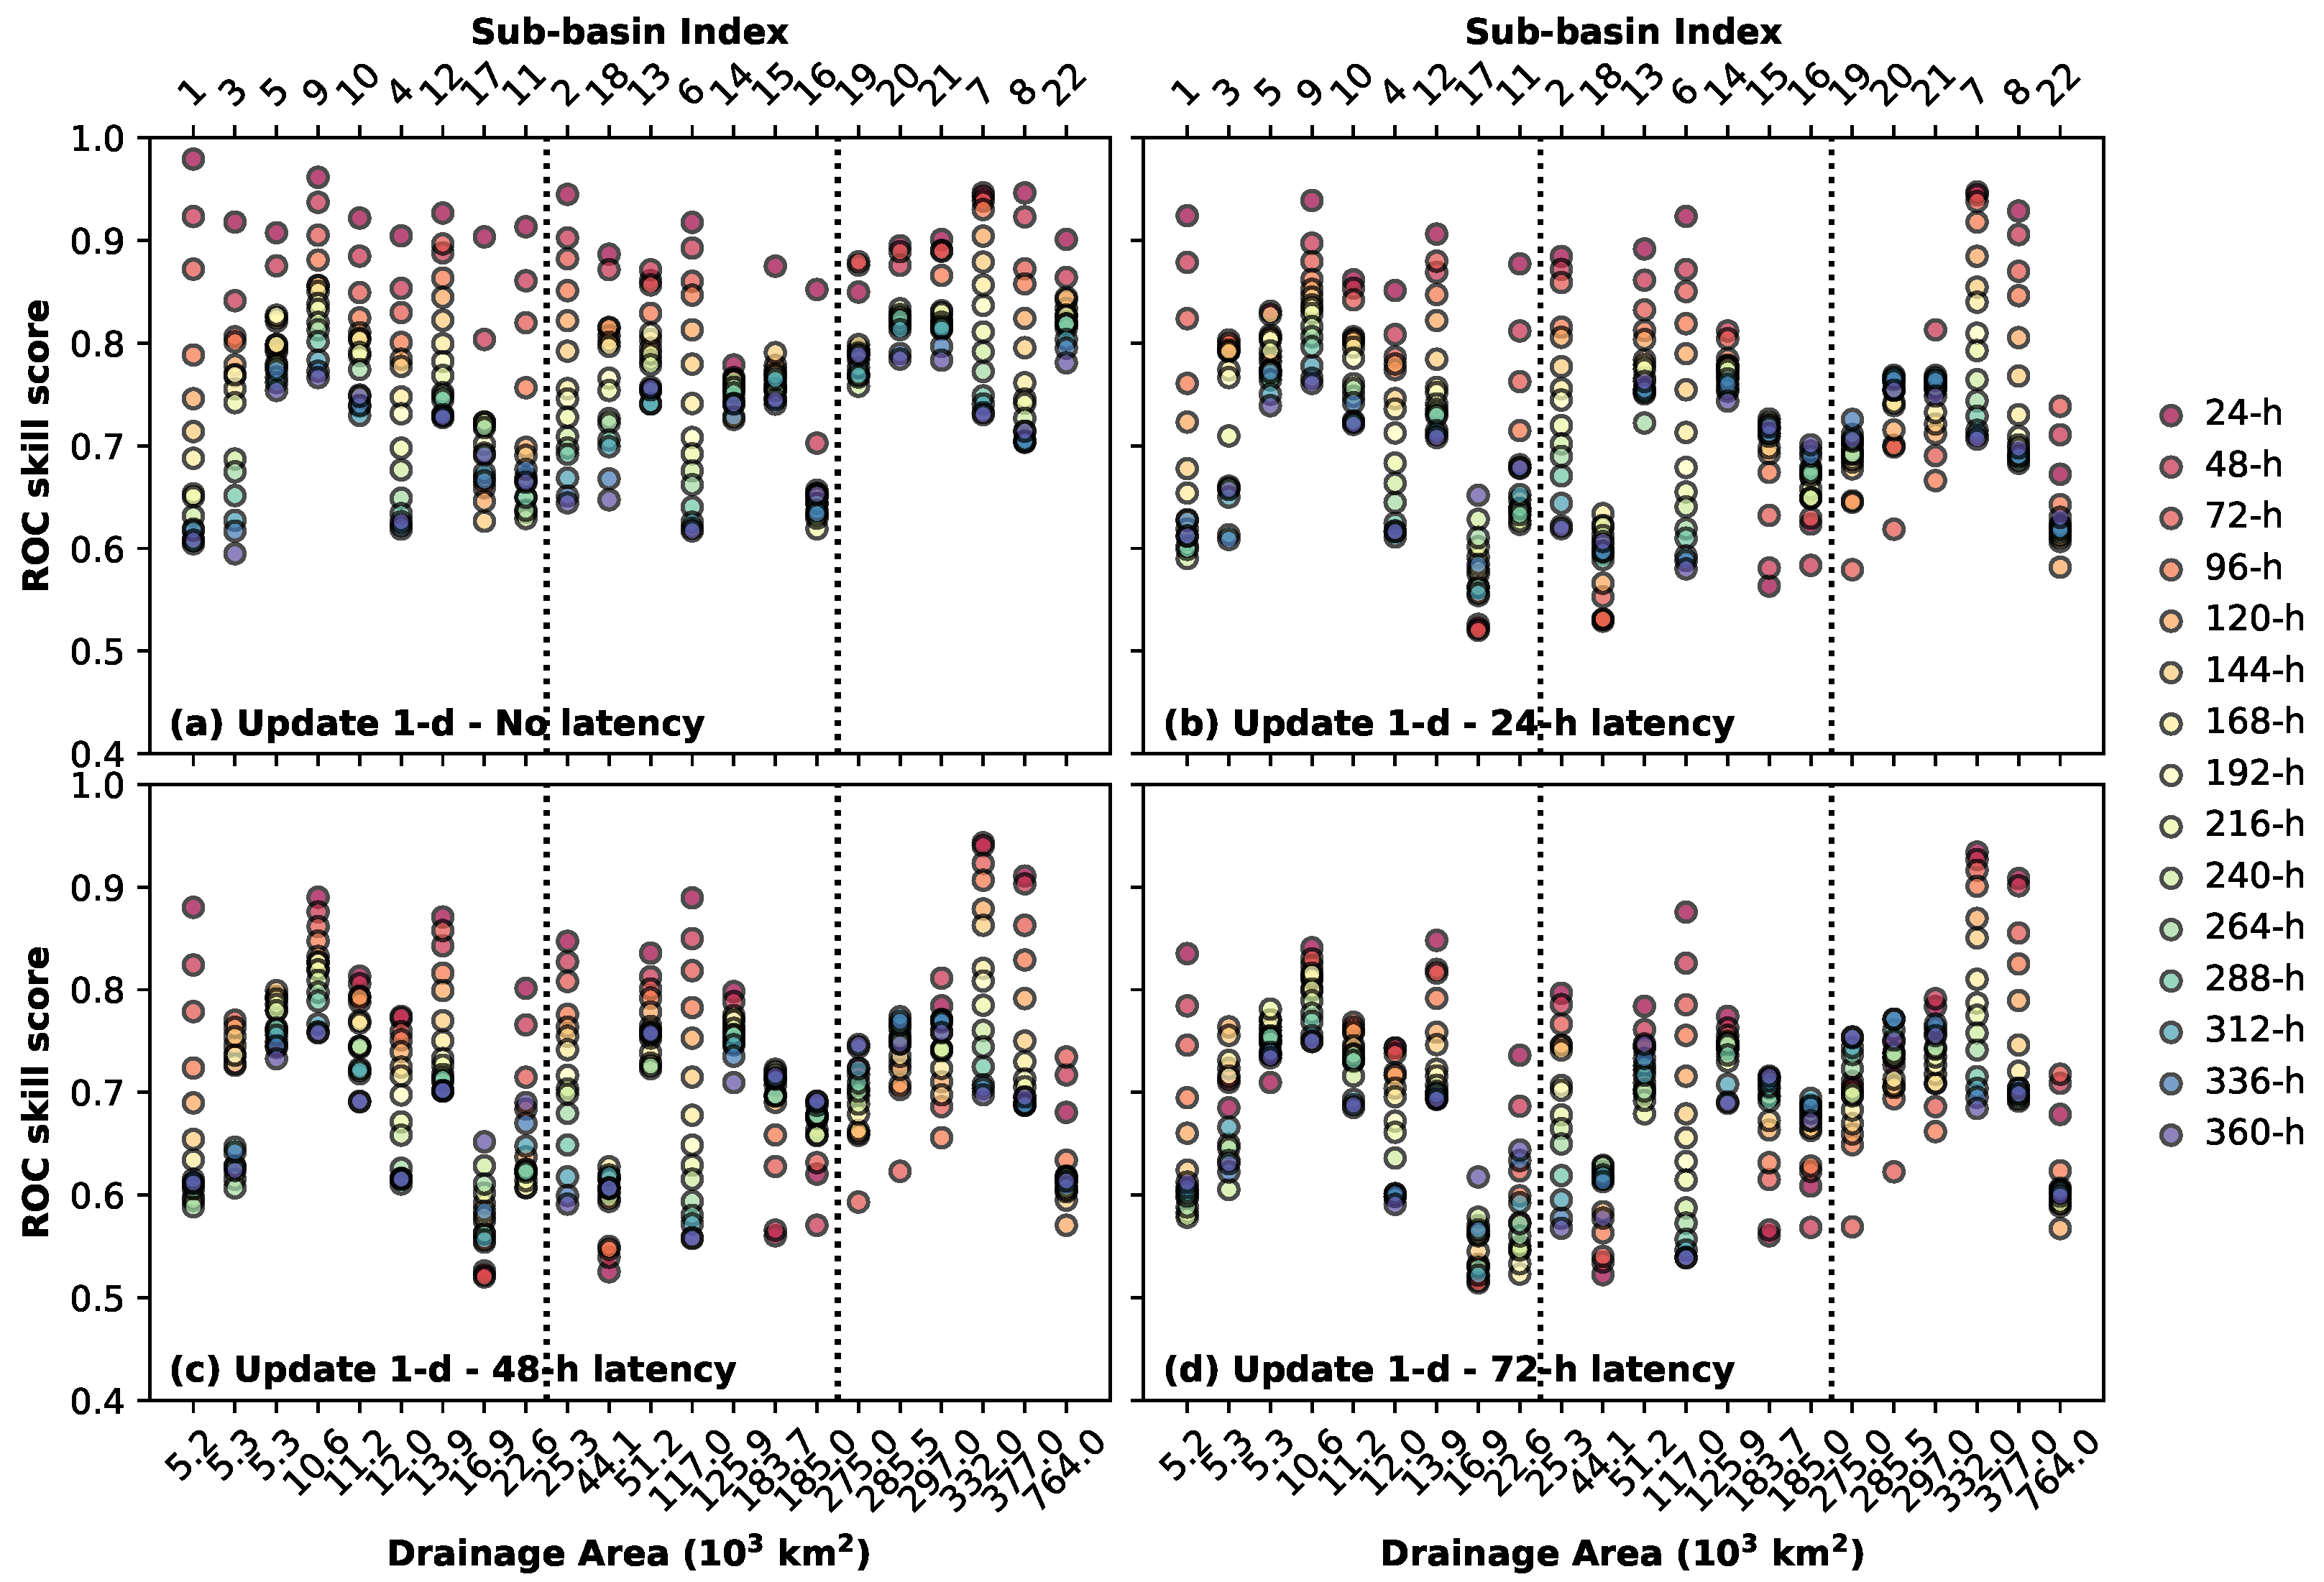
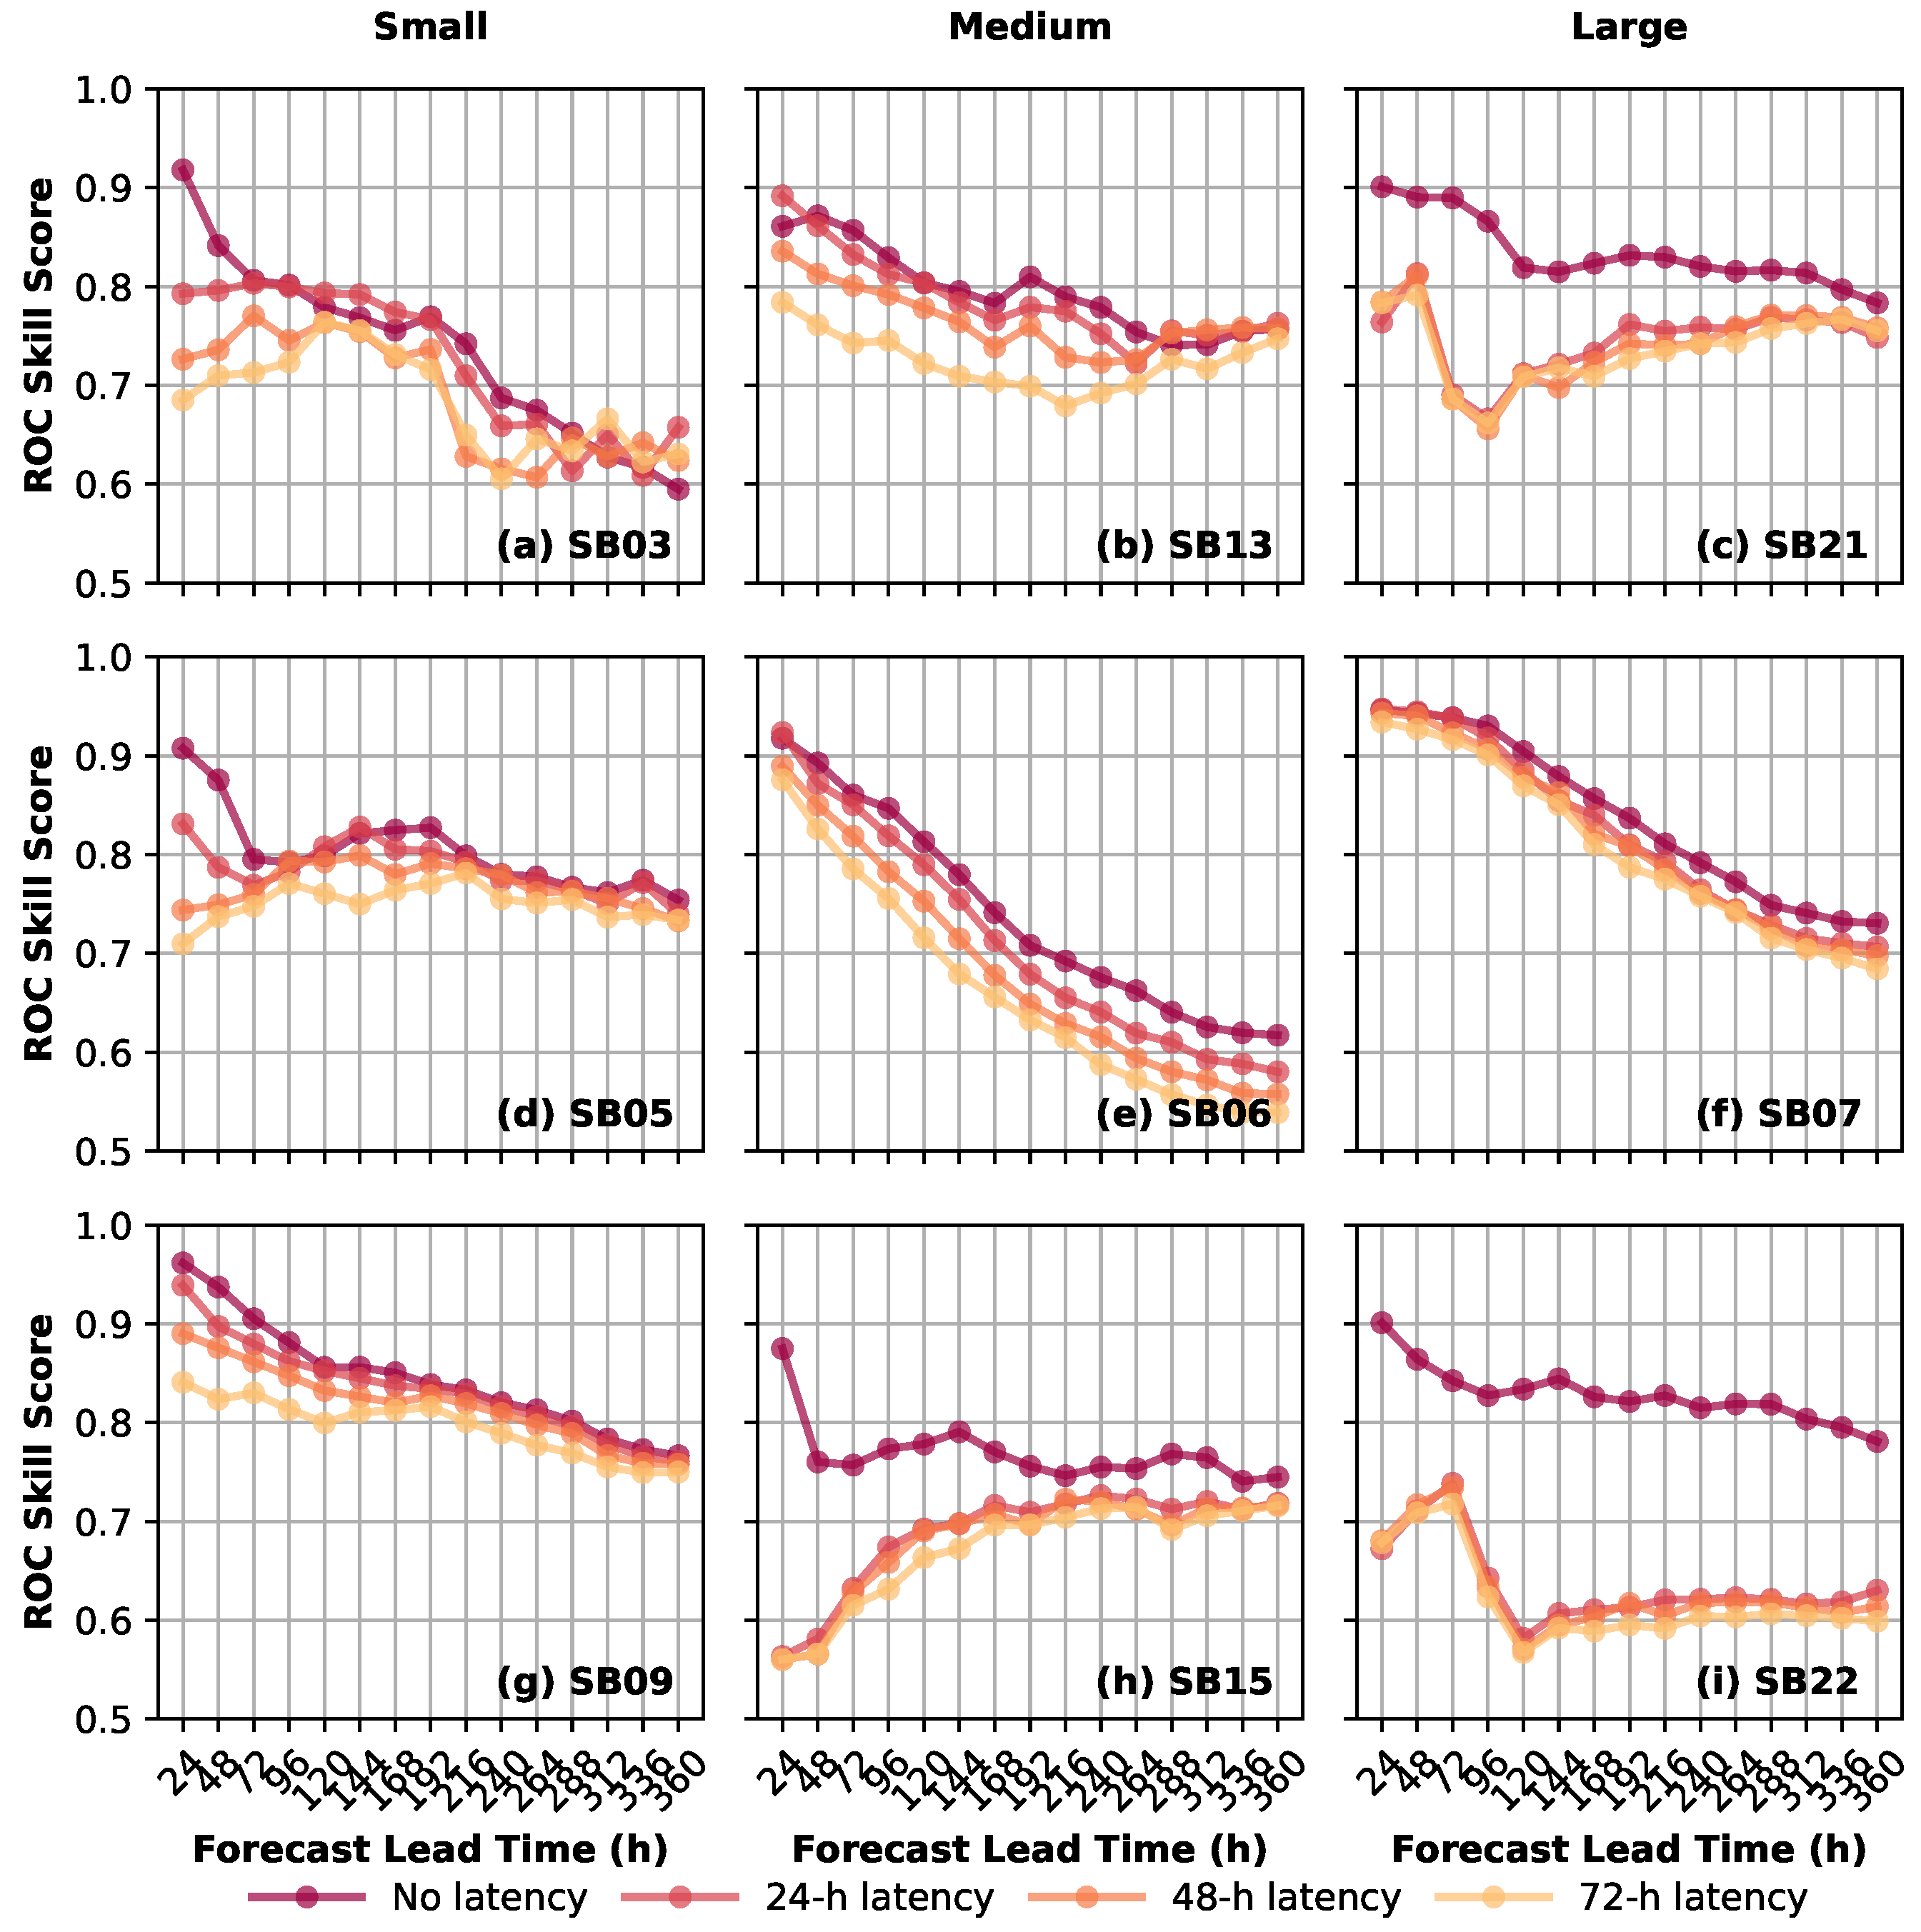
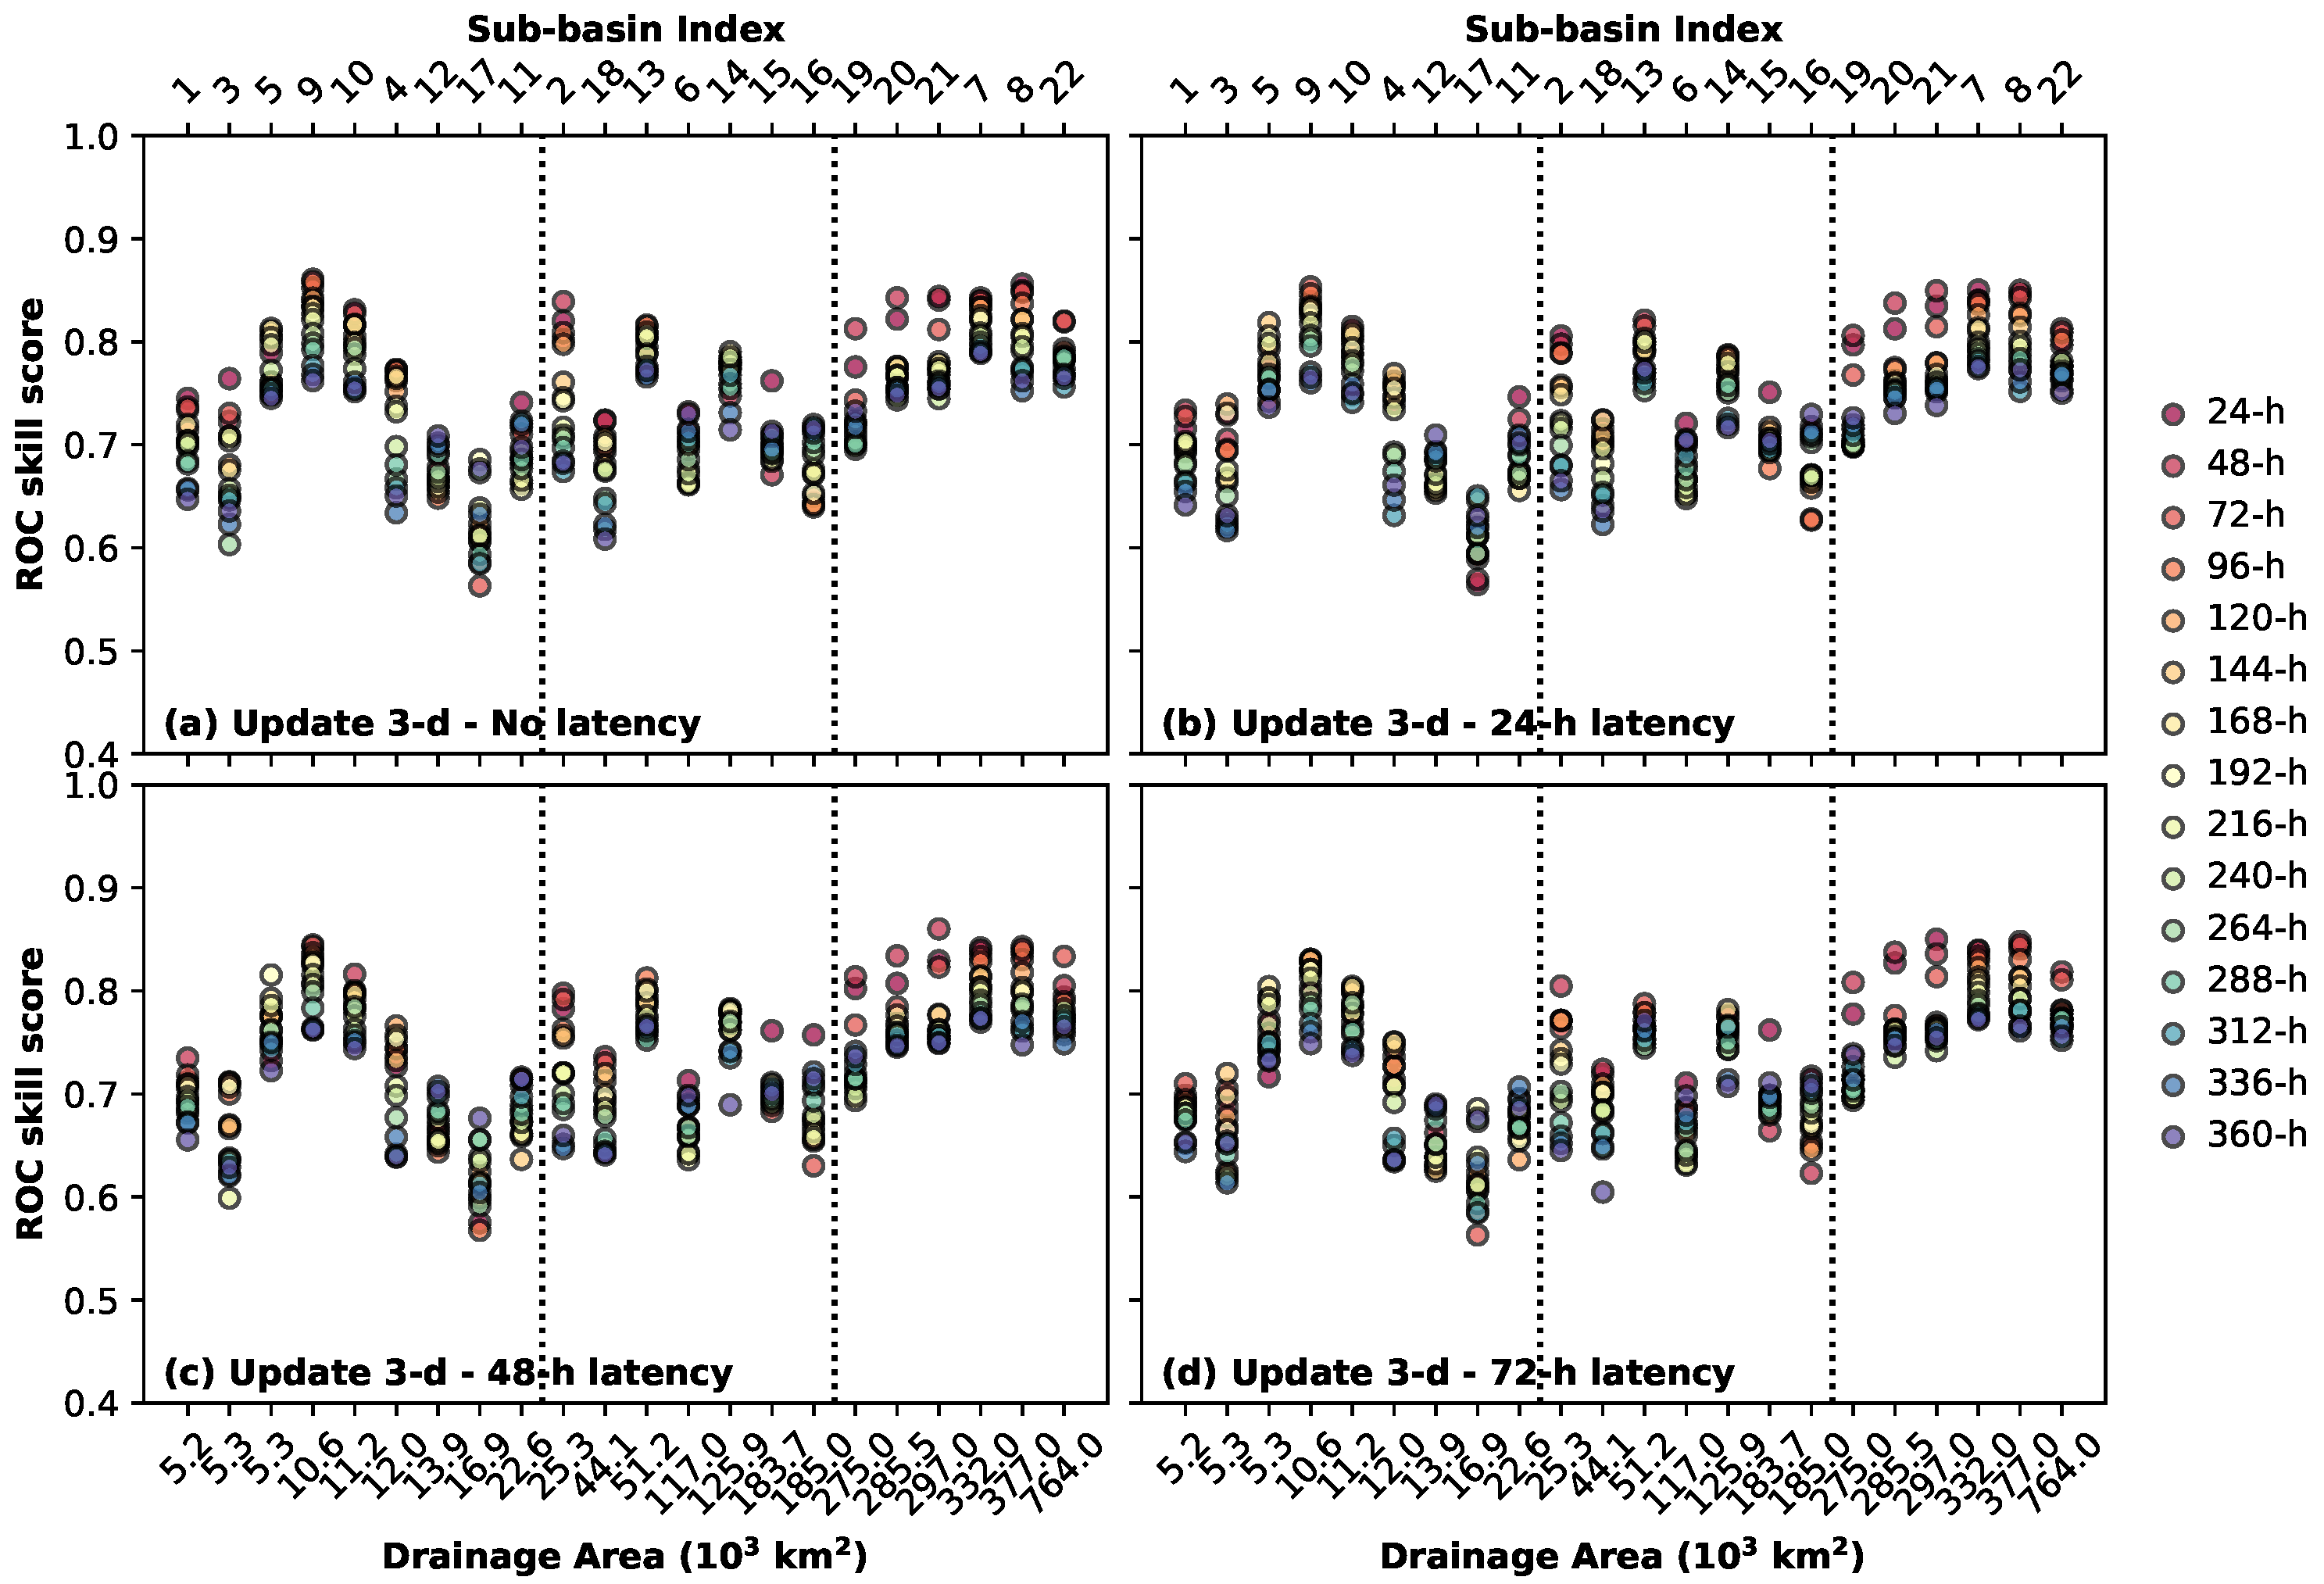
5.3. ROC Skill Score in Terms of Latency
6. Summary and Conclusions
Author Contributions
Funding
Acknowledgments
Conflicts of Interest
References
- Liu, Y.; Weerts, A.H.; Clark, M.; Hendricks Franssen, H.J.; Kumar, S.; Moradkhani, H.; Seo, D.J.; Schwanenberg, D.; Smith, P.; van Dijk, A.I.J.M.; et al. Advancing data assimilation in operational hydrologic forecasting: Progresses, challenges, and emerging opportunities. Hydrol. Earth Syst. Sci. 2012, 16, 3863–3887. [Google Scholar] [CrossRef] [Green Version]
- Moradkhani, H.; DeChant, C.M.; Sorooshian, S. Evolution of ensemble data assimilation for uncertainty quantification using the particle filter-Markov chain Monte Carlo method. Water Resour. Res. 2012, 48, W12520. [Google Scholar] [CrossRef]
- Nie, S.; Zhu, J.; Luo, Y. Simultaneous estimation of land surface scheme states and parameters using the ensemble Kalman filter: Identical twin experiments. Hydrol. Earth Syst. Sci. 2011, 15, 2437–2457. [Google Scholar] [CrossRef] [Green Version]
- Ricci, S.; Piacentini, A.; Thual, O.; Le Pape, E.; Jonville, G. Correction of upstream flow and hydraulic state with data assimilation in the context of flood forecasting. Hydrol. Earth Syst. Sci. 2011, 15, 3555–3575. [Google Scholar] [CrossRef] [Green Version]
- Thirel, G.; Martin, E.; Mahfouf, J.F.; Massart, S.; Ricci, S.; Regimbeau, F.; Habets, F. A past discharge assimilation system for ensemble streamflow forecasts over France—Part 2: Impact on the ensemble streamflow forecasts. Hydrol. Earth Syst. Sci. 2010, 14, 1639–1653. [Google Scholar] [CrossRef] [Green Version]
- Vrugt, J.A.; ter Braak, C.J.; Diks, C.G.; Schoups, G. Hydrologic data assimilation using particle Markov chain Monte Carlo simulation: Theory, concepts and applications. Adv. Water Resour. 2013, 51, 457–478. [Google Scholar] [CrossRef]
- Li, Y.; Ryu, D.; Western, A.W.; Wang, Q.; Robertson, D.E.; Crow, W.T. An integrated error parameter estimation and lag-aware data assimilation scheme for real-time flood forecasting. J. Hydrol. 2014, 519, 2722–2736. [Google Scholar] [CrossRef]
- ANA. Evolução da Rede HidrometeorolóGica Nacional/Superintendência de Administração da Rede Hidrometeorológica; v. 1, n. 1; Agência Nacional de Águas: Brasília, Brasil, 2007.
- de Assis Dias, M.C.; Saito, S.M.; dos Santos Alvalá, R.C.; Stenner, C.; Pinho, G.; Nobre, C.A.; de Souza Fonseca, M.R.; Santos, C.; Amadeu, P.; Silva, D.; et al. Estimation of exposed population to landslides and floods risk areas in Brazil, on an intra-urban scale. Int. J. Disaster Risk Reduct. 2018, 31, 449–459. [Google Scholar] [CrossRef]
- Alvarez-Garreton, C.; Ryu, D.; Western, A.; Crow, W.; Robertson, D. The impacts of assimilating satellite soil moisture into a rainfall–runoff model in a semi-arid catchment. J. Hydrol. 2014, 519, 2763–2774. [Google Scholar] [CrossRef]
- Crow, W.T.; Ryu, D. A new data assimilation approach for improving runoff prediction using remotely-sensed soil moisture retrievals. Hydrol. Earth Syst. Sci. 2009, 13, 1–16. [Google Scholar] [CrossRef] [Green Version]
- Dechant, C.; Moradkhani, H. Radiance data assimilation for operational snow and streamflow forecasting. Adv. Water Resour. 2011, 34, 351–364. [Google Scholar] [CrossRef]
- Massari, C.; Brocca, L.; Barbetta, S.; Papathanasiou, C.; Mimikou, M.; Moramarco, T. Using globally available soil moisture indicators for flood modelling in Mediterranean catchments. Hydrol. Earth Syst. Sci. 2014, 18, 839–853. [Google Scholar] [CrossRef] [Green Version]
- Wanders, N.; Karssenberg, D.; de Roo, A.; de Jong, S.M.; Bierkens, M.F.P. The suitability of remotely sensed soil moisture for improving operational flood forecasting. Hydrol. Earth Syst. Sci. 2014, 18, 2343–2357. [Google Scholar] [CrossRef] [Green Version]
- Cretaux, J.; Frappart, F.; Papa, F.; Calmant, S.; Nielsen, K.; Benveniste, J. Satellite Altimetry over Oceans and Land Surfaces. In Hydrological Applications of Satellite Altimetry Rivers, Lakes, Man-Made Reservoirs, Inundated Areas; CRC Press: Boca Raton, FL, USA, 2017; pp. 459–504. [Google Scholar]
- Santos da Silva, J.; Calmant, S.; Seyler, F.; Rotunno Filho, O.C.; Cochonneau, G.; Mansur, W.J. Water levels in the Amazon Basin derived from the ERS 2 and ENVISAT radar altimetry missions. Remote Sens. Environ. 2010, 114, 2160–2181. [Google Scholar] [CrossRef]
- Emery, C.M.; Paris, A.; Biancamaria, S.; Boone, A.; Calmant, S.; Garambois, P.A.; Santos da Silva, J. Large-scale hydrological model river storage and discharge correction using a satellite altimetry-based discharge product. Hydrol. Earth Syst. Sci. 2018, 22, 2135–2162. [Google Scholar] [CrossRef] [Green Version]
- Emery, C.M.; Paris, A.; Biancamaria, S.; Boone, A.; Calmant, S.; Garambois, P.A.; Silva, J.S.D.; David, C.H. Discharge Estimation via Assimilation of Multisatellite-Based Discharge Products: Case Study Over the Amazon Basin. IEEE Geosci. Remote Sens. Lett. 2020, 1–5. [Google Scholar] [CrossRef]
- Paris, A.; Dias de Paiva, R.; Santos Da Silva, J.; Medeiros Moreira, D.; Calmant, S.; Garambois, P.A.; Collischonn, W.; Bonnet, M.P.; Seyler, F. Stage-discharge rating curves based on satellite altimetry and modeled discharge in the Amazon Basin. Water Resour. Res. 2016, 52, 3787–3814. [Google Scholar] [CrossRef] [Green Version]
- Papa, F.; Biancamaria, S.; Lion, C.; Rossow, W.B. Uncertainties in mean river discharge estimates associated with satellite altimeters temporal sampling intervals: A case study for the annual peak flow in the context of the future SWOT hydrology mission. IEEE Geosci. Remote Sens. Lett. 2012, 4, 569–573. [Google Scholar] [CrossRef] [Green Version]
- Papa, F.; Bala, S.K.; Pandey, R.K.; Durand, F.; Gopalakrishna, V.V.; Rahman, A.; Rossow, W.B. Ganga-Brahmaputra river discharge from Jason-2 radar altimetry: An update to the long-term satellite-derived estimates of continental freshwater forcing flux into the Bay of Bengal. J. Geophys. Res. Ocean. 2012, 117. [Google Scholar] [CrossRef] [Green Version]
- Sikder, M.S.; Bonnema, M.; Emery, C.M.; David, C.H.; Lin, P.; Pan, M.; Biancamaria, S.; Gierach, M.M. A Synthetic Data Set Inspired by Satellite Altimetry and Impacts of Sampling on Global Spaceborne Discharge Characterization. Water Resour. Res. 2021, 57, e2020WR029035. [Google Scholar] [CrossRef]
- Allen, G.H.; David, C.H.; Andreadis, K.M.; Hossain, F.; Famiglietti, J.S. Global Estimates of River Flow Wave Travel Times and Implications for Low-Latency Satellite Data. Geophys. Res. Lett. 2018, 45, 7551–7560. [Google Scholar] [CrossRef] [Green Version]
- Biancamaria, S.; Lettenmaier, D.P.; Pavelsky, T.M. The SWOT Mission and Its Capabilities for Land Hydrology. Surv. Geophys. 2016, 37, 307–337. [Google Scholar] [CrossRef] [Green Version]
- Blumstein, D.; Biancamaria, S.; Guérin, A.; Maisongrande, P. A potential constellation of small altimetry satellites dedicated to continental surface waters (SMASH mission). In Proceedings of the AGU Fall Meeting Abstracts, San Francisco, CA, USA, 9–13 December 2019; Volume 5805, p. H43N-2257. [Google Scholar]
- Valente, C.; Latrubesse, E.; Ferreira, L. Relationships among vegetation, geomorphology and hydrology in the Bananal Island tropical wetlands, Araguaia River Basin, Central Brazil. J. S. Am. Earth Sci. 2013, 46, 150–160. [Google Scholar] [CrossRef]
- Seluchi, M.; Marengo, J.A. Tropical-Mid Latitude Exchange of Air Masses during Summer and Winter in South America: Climatic aspects and extreme events. Int. J. Climatol. 2000, 20, 1167–1190. [Google Scholar] [CrossRef]
- Alvares, C.A.; Stape, J.L.; Sentelhas, P.C.; de Moraes Gonçalves, J.L.; Sparovek, G. Köppen’s climate classification map for Brazil. Meteorol. Z. 2013, 22, 711–728. [Google Scholar] [CrossRef]
- Siqueira, J.L., Jr.; Tomasella, J.; Rodriguez, D.A. Impacts of future climatic and land cover changes on the hydrological regime of the Madeira River basin. Clim. Chang. 2015, 129, 117–129. [Google Scholar] [CrossRef]
- Mohor, G.S.; Rodriguez, D.A.; Tomasella, J.; Júnior, J.L.S. Exploratory analyses for the assessment of climate change impacts on the energy production in an Amazon run-of-river hydropower plant. J. Hydrol. Reg. Stud. 2015, 4, 41–59. [Google Scholar] [CrossRef] [Green Version]
- Rodriguez, D.A.; Tomasella, J. On the ability of large-scale hydrological models to simulate land use and land cover change impacts in Amazonian basins. Hydrol. Sci. J. 2016, 61, 1831–1846. [Google Scholar] [CrossRef] [Green Version]
- Von Randow, R.C.S.; Rodriguez, D.A.; Tomasella, J.; Aguiar, A.P.D.; Kruijt, B.; Kabat, P. Response of the river discharge in the Tocantins River Basin, Brazil, to environmental changes and the associated effects on the energy potential. Reg. Environ. Chang. 2019, 19, 193–204. [Google Scholar] [CrossRef]
- Michels-Brito, A.; Rodriguez, D.A.; Cruz Junior, W.L.; Nildo de Souza Vianna, J. The climate change potential effects on the run-of-river plant and the environmental and economic dimensions of sustainability. Renew. Sustain. Energy Rev. 2021, 147, 111238. [Google Scholar] [CrossRef]
- Falck, A.S.; Maggioni, V.; Tomasella, J.; Vila, D.A.; Diniz, F.L.R. Propagation of satellite precipitation uncertainties through a distributed hydrologic model: A case study in the Tocantins-Araguaia basin in Brazil. J. Hydrol. 2015, 527, 943–957. [Google Scholar] [CrossRef]
- Falck, A.S.; Maggioni, V.; Tomasella, J.; Diniz, F.L.R.; Mei, Y.; Beneti, C.A.; Herdies, D.L.; Neundorf, R.; Caram, R.O.; Rodriguez, D.A. Improving the use of ground-based radar rainfall data for monitoring and predicting floods in the Iguaçu river basin. J. Hydrol. 2018, 567, 626–636. [Google Scholar] [CrossRef]
- Casagrande, L.; Tomasella, J.; dos Santos Alvalá, R.C.; Bottino, M.J.; de Oliveira Caram, R. Early flood warning in the Itajaí-Açu River basin using numerical weather forecasting and hydrological modeling. Nat. Hazards 2017, 88, 741–757. [Google Scholar] [CrossRef]
- Tomasella, J.; Sene Gonçalves, A.; Schneider Falck, A.; Oliveira Caram, R.; Rodrigues Diniz, F.; Rodriguez, D.; Rodrigues do Prado, M.; Negrão, A.; Sueiro Medeiros, G.; Chagas Siquiera, G. Probabilistic flood forecasting in the Doce Basin in Brazil: Effects of the basin scale and orientation and the spatial distribution of rainfall. J. Flood Risk Manag. 2019, 12, e12452. [Google Scholar] [CrossRef] [Green Version]
- Falck, A.S.; Tomasella, J.; Diniz, F.L.; Maggioni, V. Applying a precipitation error model to numerical weather predictions for probabilistic flood forecasts. J. Hydrol. 2021, 598, 126374. [Google Scholar] [CrossRef]
- Farr, T.G.; Rosen, P.A.; Caro, E.; Crippen, R.; Duren, R.; Hensley, S.; Kobrick, M.; Paller, M.; Rodriguez, E.; Roth, L.; et al. The Shuttle Radar Topography Mission. Rev. Geophys. 2007, 45, 1–33. [Google Scholar] [CrossRef] [Green Version]
- Rennó, C.D.; Nobre, A.D.; Cuartas, L.A.; Soares, J.V.; Hodnett, M.G.; Tomasella, J.; Waterloo, M.J. HAND, a new terrain descriptor using SRTM-DEM: Mapping terra-firme rainforest environments in Amazonia. Remote Sens. Environ. 2008, 112, 3469–3481. [Google Scholar] [CrossRef]
- Cuartas, L.A.; Tomasella, J.; Nobre, A.D.; Nobre, C.A.; Hodnett, M.G.; Waterloo, M.J.; de Oliveira, S.M.; de Cássia von Randow, R.; Trancoso, R.; Ferreira, M. Distributed hydrological modeling of a micro-scale rainforest watershed in Amazonia: Model evaluation and advances in calibration using the new HAND terrain model. J. Hydrol. 2012, 462–463, 15–27. [Google Scholar] [CrossRef]
- Santos, H.G.d.; Carvalho Junior, W.d.; Dart, R.d.O.; Aglio, M.L.D.; Sousa, J.S.d.; Pares, J.G.; Fontana, A.; Martins, A.L.d.S.; Oliveira, A.P.d.O. O Novo Mapa de Solos do Brasil: Legenda Atualizada; Embrapa Solos: Rio de janeiro, Brazil, 2011; 68p. [Google Scholar]
- Souza, C.M.; Z. Shimbo, J.; Rosa, M.R.; Parente, L.L.; A. Alencar, A.; Rudorff, B.F.T.; Hasenack, H.; Matsumoto, M.; G. Ferreira, L.; Souza-Filho, P.W.M.; et al. Reconstructing Three Decades of Land Use and Land Cover Changes in Brazilian Biomes with Landsat Archive and Earth Engine. Remote Sens. 2020, 12, 2735. [Google Scholar] [CrossRef]
- Duan, Q.; Sorooshian, S.; Gupta, V. Effectivo and efficient global optimization for conceptual rainfall-runoff models. Water Resour. Res. 1992, 28, 1015–1031. [Google Scholar] [CrossRef]
- Rozante, J.R.; Moreira, D.S.; de Goncalves, L.G.G.; Vila, D.A. Combining TRMM and Surface Observations of Precipitation: Technique and Validation over South America. Weather Forecast. 2010, 25, 885–894. [Google Scholar] [CrossRef] [Green Version]
- Rozante, J.R.; Gutierrez, E.R.; de Almeida Fernandes, A.; Vila, D.A. Performance of precipitation products obtained from combinations of satellite and surface observations. Int. J. Remote Sens. 2020, 41, 7585–7604. [Google Scholar] [CrossRef]
- WMO. Manual on Codes. Volumes I.2 & 1.2 Volumes I.2 & 1.2; Secretariat of the World Meteorological Organization: Geneva, Switzerland, 2007. [Google Scholar]
- Rozante, J.R.; Vila, D.A.; Barboza Chiquetto, J.; Fernandes, A.D.A.; Souza Alvim, D. Evaluation of TRMM/GPM Blended Daily Products over Brazil. Remote Sens. 2018, 10, 882. [Google Scholar] [CrossRef] [Green Version]
- Bougeault, P.; Toth, Z.; Bishop, C.; Brown, B.; Burridge, D.; Chen, D.H.; Ebert, B.; Fuentes, M.; Hamill, T.M.; Mylne, K.; et al. The THORPEX Interactive Grand Global Ensemble. Bull. Am. Meteorol. Soc. 2010, 91, 1059–1072. [Google Scholar] [CrossRef]
- Swinbank, R.; Kyouda, M.; Buchanan, P.; Froude, L.; Hamill, T.M.; Hewson, T.D.; Keller, J.H.; Matsueda, M.; Methven, J.; Pappenberger, F.; et al. The TIGGE Project and Its Achievements. Bull. Am. Meteorol. Soc. 2016, 97, 49–67. [Google Scholar] [CrossRef]
- ECMWF. Part V: Ensemble Prediction System. In IFS Documentation CY47R1; Number 5 in IFS Documentation; ECMWF: Reading, UK, 2020; Chapter 5; p. 23. [Google Scholar]
- Buizza, R.; Bidlot, J.R.; Wedi, N.; Fuentes, M.; Hamrud, M.; Holt, G.; Vitart, F. The new ECMWF VAREPS (Variable Resolution Ensemble Prediction System). Q. J. R. Meteorol. Soc. 2007, 133, 681–695. [Google Scholar] [CrossRef]
- Alfieri, L.; Pappenberger, F.; Wetterhall, F.; Haiden, T.; Richardson, D.; Salamon, P. Evaluation of ensemble streamflow predictions in Europe. J. Hydrol. 2014, 517, 913–922. [Google Scholar] [CrossRef] [Green Version]
- Wöhling, T.; Lennartz, F.; Zappa, M. Technical Note: Updating procedure for flood forecasting with conceptual HBV-type models. Hydrol. Earth Syst. Sci. 2006, 10, 783–788. [Google Scholar] [CrossRef] [Green Version]
- Wilks, D.S. Statistical Methods in the Atmospheric Sciences, 2nd ed.; International Geophysics, Elsevier Science: Amsterdam, The Netherlands, 2005. [Google Scholar]
- Fawcett, T. An introduction to ROC analysis. Pattern Recognit. Lett. 2006, 27, 861–874. [Google Scholar] [CrossRef]
- Ridolfi, E.; Kumar, H.; Bárdossy, A. A methodology to estimate flow duration curves at partially ungauged basins. Hydrol. Earth Syst. Sci. 2020, 24, 2043–2060. [Google Scholar] [CrossRef] [Green Version]
- Moriasi, D.N.; Arnold, J.G.; Van Liew, M.W.; Bingner, R.L.; Harmel, R.D.; Veith, T.L. Model Evaluation Guidelines for Systematic Quantification of Accuracy in Watershed Simulations. Trans. ASABE 2007, 50, 885–900. [Google Scholar] [CrossRef]
- Mei, Y.; Anagnostou, E.N.; Nikolopoulos, E.I.; Borga, M. Error Analysis of Satellite Precipitation Products in Mountainous Basins. J. Hydrometeorol. 2014, 15, 1778–1793. [Google Scholar] [CrossRef]
- Bryndal, T.; Franczak, P.; Kroczak, R.; Cabaj, W.; Kołodziej, A. The impact of extreme rainfall and flash floods on the flood risk management process and geomorphological changes in small Carpathian catchments: A case study of the Kasiniczanka river (Outer Carpathians, Poland). Nat. Hazards 2017, 88, 95–120. [Google Scholar] [CrossRef]


| Sub-Basin | Station | River | Classf. | Area () | Calibration | Validation | ||
|---|---|---|---|---|---|---|---|---|
| SB01 | Rio das Mortes | Mortes | Small | 5230 | 0.711 | 0.740 | - | - |
| SB02 | Xavantina | Mortes | Medium | 25,300 | 0.821 | 0.842 | 0.859 | 0.889 |
| SB03 | Tesouro | Garças | Small | 5280 | 0.584 | 0.682 | 0.610 | 0.657 |
| SB04 | Peres | Caiapó | Small | 12,000 | 0.695 | 0.795 | 0.703 | 0.853 |
| SB05 | Travessão | Vermelho | Small | 5310 | 0.665 | 0.816 | 0.588 | 0.786 |
| SB06 | Luiz Alves | Araguaia | Medium | 117,000 | 0.842 | 0.900 | 0.878 | 0.897 |
| SB07 | Conceição do Araguaia | Araguaia | Large | 332,000 | 0.853 | 0.890 | 0.882 | 0.906 |
| SB08 | Xambioá | Araguaia | Large | 377,000 | 0.897 | 0.901 | 0.944 | 0.932 |
| SB09 | Ceres | Almas | Small | 10,600 | 0.745 | 0.803 | 0.707 | 0.824 |
| SB10 | Ponte Quebra Linha | Maranhão | Small | 11,200 | 0.631 | 0.792 | 0.581 | 0.746 |
| SB11 | Nova Roma (Faz.Sucuri) | Paraná | Small | 22,600 | 0.743 | 0.767 | 0.769 | 0.809 |
| SB12 | Jacinto | Sta Tereza | Small | 13,900 | 0.734 | 0.793 | 0.752 | 0.792 |
| SB13 | HPP Serra da Mesa | Tocantins | Medium | 51,233 | 0.798 | 0.747 | 0.773 | 0.791 |
| SB14 | HPP Peixe Angical | Tocantins | Medium | 125,884 | 0.614 | 0.598 | 0.756 | 0.737 |
| SB15 | HPP Lajeado | Tocantins | Medium | 183,718 | 0.843 | 0.865 | 0.884 | 0.900 |
| SB16 | Miracema do Tocantins | Tocantins | Medium | 185,000 | 0.872 | 0.836 | 0.812 | 0.829 |
| SB17 | Jatobá (Faz. Boa Nova) | Sono | Small | 16,900 | 0.590 | 0.660 | 0.665 | 0.774 |
| SB18 | Porto Real | Sono | Medium | 44,100 | 0.795 | 0.864 | 0.850 | 0.892 |
| SB19 | Carolina | Tocantins | Large | 275,000 | 0.868 | 0.946 | - | - |
| SB20 | HPP Estreito | Tocantins | Large | 285,491 | 0.942 | 0.922 | 0.952 | 0.949 |
| SB21 | Descarreto | Tocantins | Large | 297,000 | 0.957 | 0.953 | 0.992 | 0.992 |
| SB22 | HPP Tucuruí | Tocantins | Large | 764,000 | 0.946 | 0.953 | 0.965 | 0.968 |
Publisher’s Note: MDPI stays neutral with regard to jurisdictional claims in published maps and institutional affiliations. |
© 2021 by the authors. Licensee MDPI, Basel, Switzerland. This article is an open access article distributed under the terms and conditions of the Creative Commons Attribution (CC BY) license (https://creativecommons.org/licenses/by/4.0/).
Share and Cite
Falck, A.; Tomasella, J.; Papa, F. Assessing the Potential of Upcoming Satellite Altimeter Missions in Operational Flood Forecasting Systems. Remote Sens. 2021, 13, 4459. https://doi.org/10.3390/rs13214459
Falck A, Tomasella J, Papa F. Assessing the Potential of Upcoming Satellite Altimeter Missions in Operational Flood Forecasting Systems. Remote Sensing. 2021; 13(21):4459. https://doi.org/10.3390/rs13214459
Chicago/Turabian StyleFalck, Aline, Javier Tomasella, and Fabrice Papa. 2021. "Assessing the Potential of Upcoming Satellite Altimeter Missions in Operational Flood Forecasting Systems" Remote Sensing 13, no. 21: 4459. https://doi.org/10.3390/rs13214459
APA StyleFalck, A., Tomasella, J., & Papa, F. (2021). Assessing the Potential of Upcoming Satellite Altimeter Missions in Operational Flood Forecasting Systems. Remote Sensing, 13(21), 4459. https://doi.org/10.3390/rs13214459