Article

A Google Earth Engine Application to Retrieve Long-Term Surface Temperature for Small Lakes. Case: San Pedro Lagoons, Chile

by
María Pedreros-Guarda
1,*,
Rodrigo Abarca-del-Río
2,
Karen Escalona
3,
Ignacio García
2 and
Óscar Parra
4
1
Environmental Sciences with Mention in Continental Aquatic Systems, Aquatic Systems Department, Faculty of Environmental Sciences, University of Concepción, Concepción 4030000, Chile
2
Geophysics Department, Faculty of Physical Sciences and Mathematics, University of Concepción, Concepción 4030000, Chile
3
Physical Sciences, Faculty of Physical Sciences and Mathematics, University of Concepción, Concepción 4030000, Chile
4
EULA-Chile and Faculty of Environmental Sciences, University of Concepción, Concepción 4030000, Chile
*
Author to whom correspondence should be addressed.
Remote Sens. 2021, 13(22), 4544; https://doi.org/10.3390/rs13224544
Submission received: 21 August 2021 / Revised: 16 October 2021 / Accepted: 18 October 2021 / Published: 12 November 2021

Abstract

:
Lake surface water temperature (LSWT) is a crucial water quality parameter that modulates many lake and reservoir processes. Therefore, it is necessary to monitor it from a long-term perspective. Over the last decades, many methods to retrieve LSWT fields from satellite imagery have been developed. This work aims to test, implement and automate six methods. These are performed in the Google Earth Engine (GEE) platform, using 30 m spatial resolution images from Landsat 7 and 8 satellites for 2000–2020. Automated methods deliver long-term time series. Series are then calibrated with in situ data. Two-dimensional (2D) × time data fields are built on the lakes with the calibration, and a subsequent LSWT climatology is derived. Our study area is two urban lagoons with areas smaller than two (2) km 2 of the city of San Pedro de la Paz, South-Central Chile. The six methods describe the seasonal variation of LSWT (Willmott’s index of agreement > 0.91, R 2 > 0.67). The main difference between series is their bias. Thus, after a simple calibration, all series adequately describe the LSWT. We utilized the Pedro de la Paz lagoons to demonstrate the method’s utility. Our research demonstrates that these adjacent lagoons exhibit comparable LSWT spatial (15.5–17 C) and temporal (7–25 C) trends throughout the year. Differences in geographical pattern might result from the northern island’s heat impact and the existence of the Biobío river to the east. Our work represents an efficient alternative for obtaining LSWT in particular lakes and reservoirs, especially useful in medium and small-sized ones.

1. Introduction

Water temperature modulates many physical and biochemical processes in lakes and reservoirs. It determines vertical stratification [1], regulates species and nutrient cycle distribution and dissolved gas concentration [2].
Today, the World’s lakes share the same problem: increased eutrophication, related to nutrients increase, mainly phosphorus and nitrogen [3]. Nutrient concentration and water temperature modulate the frequency of harmful algal blooms (HABs), which has been rising across the globe [4]. For the above, a correct knowledge of the lake surface water temperature (LSWT), which is a crucial quality parameter [5,6], is vital.
The traditional method to measure LSWT is taking field samples. However, additionally to being localized, inhomogeneous between measuring stations, it is costly logistically and economically inefficient. It explains why spatial remote sensing methods that get LSWT over large surface areas play a fundamental role nowadays [7].
At the moment, local and global databases of LSWT have been established using remote sensing techniques. Numerous attempts have been launched to establish regional lake databases. For instance, there is a long-term dataset of lake surface water temperature over the Tibetan Plateau using AVHRR [8], other addressing sub-alpine lakes using a variety of sensors [9], and another monitoring European lakes using AVHRR [8]. Now, concerning worldwide lakes, Copernicus [10] monitors the Earth using satellite and in-situ sensors. LSWT for 258 large lakes in the world (surface area > 500 km 2 ) for 1995–2009 is freely available in [11]. Although the Copernicus project could be extended to medium and small lakes, according to what we know today, there are no global databases that provide temperature in these cases. A good solution is an initiative implemented in the United States: a platform that shows LSWT for over 11,000 US lakes in real-time and a 5-day forecast [12]. This initiative includes large, medium and small lakes. Nevertheless, there is no such initiative in South America. That led us to develop this work. This article is intended for individual researchers who wish to obtain LSWT from remote sensing methods for any specific lake, especially a medium or small-sized one. Having said that, this effort is the first step in developing a satellite database covering all of South America’s lakes, which will be inspired in the future by [12,13] works.
However, computing water temperature from remote sensing images is time-consuming and complex because of the processing data chain [14]. Today, the Google Earth Engine (GEE) platform provides a helpful solution. It is an innovative tool for geospatial analysis that uses cloud processing. The user does not need the latest computer with high processing efficiency, just a basic internet connection [14]. GEE provides the possibility to analyze satellite data files [15], estimate satellite-derived bathymetry [16] and drought assessment [17], among many others.
All of the aforementioned points imply that this effort will employ the GEE platform to extract LSWT in any lake, particularly those of small and medium size (surfaces of up to 100 km 2 [18]). This small spatial scale is an additional difficulty as not just any satellite will serve. A sensor with adequate spatial resolution is required. Landsat files, the most used data set in the GEE platform [14], have proven to be helpful for this purpose [5,6,19,20]. Landsat sensors have a temporal resolution of 16 days and a spatial resolution of 30 m, except for their thermal bands with a spatial resolution of 60–120 m. Besides, Landsat 7 and 8 had a lag of 8 days, so together, they provided four (4) satellite images for every 32 days. Landsat 9 has launched in October 2021, taking over Landsat 7. Thus, Landsat 8 and 9 now provide together four (4) images every 32 days [21]. Landsat 1-8 image collections are available through the GEE platform [22]. These collections are in their original version (in digital numbers) (see, e.g., in [23]). For the same collections, there is also the reflectance and brightness temperature product at the top of the atmosphere (ToA) (see, e.g., in [24]). It is even possible to find the surface reflectance and brightness temperature product (see, e.g., in [25]).
The spatial pattern of the satellite temperature is an advantage over the other types of temperature measurements. First, the satellite image generally encompasses the whole surface of small lakes, which is technically impossible over certain large lakes or seas. Second, we obtain spatial fields with a resolution of 30 m using Landsat images. Additionally, the grid could be lowered further (to 10 m) by using newer satellites such as Sentinel.
Numerous methods exist for deriving LSWT from satellite data [7]. In most cases, a radiometric correction is required to convert the satellite’s original images to radiance at the top of the atmosphere (ToA). The temperature at the Earth’s surface is then computed using an atmospheric correction. The radiative transfer equation removes the atmospheric component. Here, specific atmospheric profiles are required. A model of these parameters is available on NASA’s Atmospheric Correction Parameter Calculator [20,26,27] (details in Section 3.2.1). On the other hand, well-known algorithms eliminate the atmospheric component: the mono window algorithms (MWA) [28] and the split-window algorithm (SWA) [6,29,30]. The algorithms are an alternative to the radiative transfer equation. All these methodologies must be validated using ground measurements, particularly in the Southern Hemisphere (SH) [31].
The objective of this work is to evaluate several strategies for retrieving the LSWT series using GEE and Landsat 7 (L7) and 8 (L8) archives in two lagoons with areas smaller than 2 km 2 . Following the test, we compile LSWT field data and create a climatology for the lakes. The work is presented in four (4) parts: Section 2 presents the study area. Section 3 shows the data, methods and a work strategy. Section 4 shows the results and the discussion, to conclude in Section 5.
This article is the first step in developing a lake’s environmental characteristics database using remote sensing throughout Latin America. The significance of selecting these specific lagoons (San Pedro Lagoons, see Section 2) stems from their geographic location. Because they are urban lagoons, they are particularly susceptible to environmental degradation [32,33].

2. Study Area

The study area is in the Biobío region, close to the ocean, in south-central Chile. A temperate climate characterizes this area [34].
The lake basins analyzed are sub-basins of Biobío, Chile’s second-longest, one of the most flowing [35] and the region’s core river basin [36].
Laguna Grande and Laguna Chica are lakes located inside the city of San Pedro de la Paz. However, they are referred to as lagoons because they are relatively small (surface areas < 2 km 2 ). The significance of studying these lakes stems from their unique geographic location. They are components of a larger hydrological system that also includes wetlands and estuaries [37]. The lake and wetland ecosystem support vast biodiversity, a diverse range of species, including fish, reptiles, amphibians, birds and mammals [37]. These lagoons are the city of San Pedro de la Paz’s primary attraction [38]. Both lagoons’ water quality is determined by their drainage basins, which may be used for forestry, agriculture, tourism or urban purposes [3,39].
The commune of San Pedro de la Paz (see Figure 1) is home to unique environmental heritage [37]. It contains two lake ecosystems habitat within an urban area, providing a diversity of ecosystem services and relevant water security in one of the most Chile’s most affected locations by climate change [37,38]. Thus, understanding how temperature behavior evolves in these two bodies of water is crucial for understanding how both water bodies’ trophic condition evolve now and probably in the future under more severe anthropogenic conditions. Unfortunately, it is already commonly recognized that both lagoons are already undergoing a serious eutrophication process [3]. Thus, if this knowledge is applied appropriately throughout the lagoons management and preservation process, it can potentially impact the ecosystem services provided by these lagoons.
The dimensions of the studied lakes are shown in Table 1. The described study area is shown in Figure 1.

3. Data and Methodology

This section is divided into three parts. In the first (Section 3.1), we present the data collected for the study. The second (Section 3.2) presents the different remote sensing methods applied to the satellite data. The third part (Section 3.3) details the distinct steps of the work strategy.

3.1. Data

3.1.1. In Situ

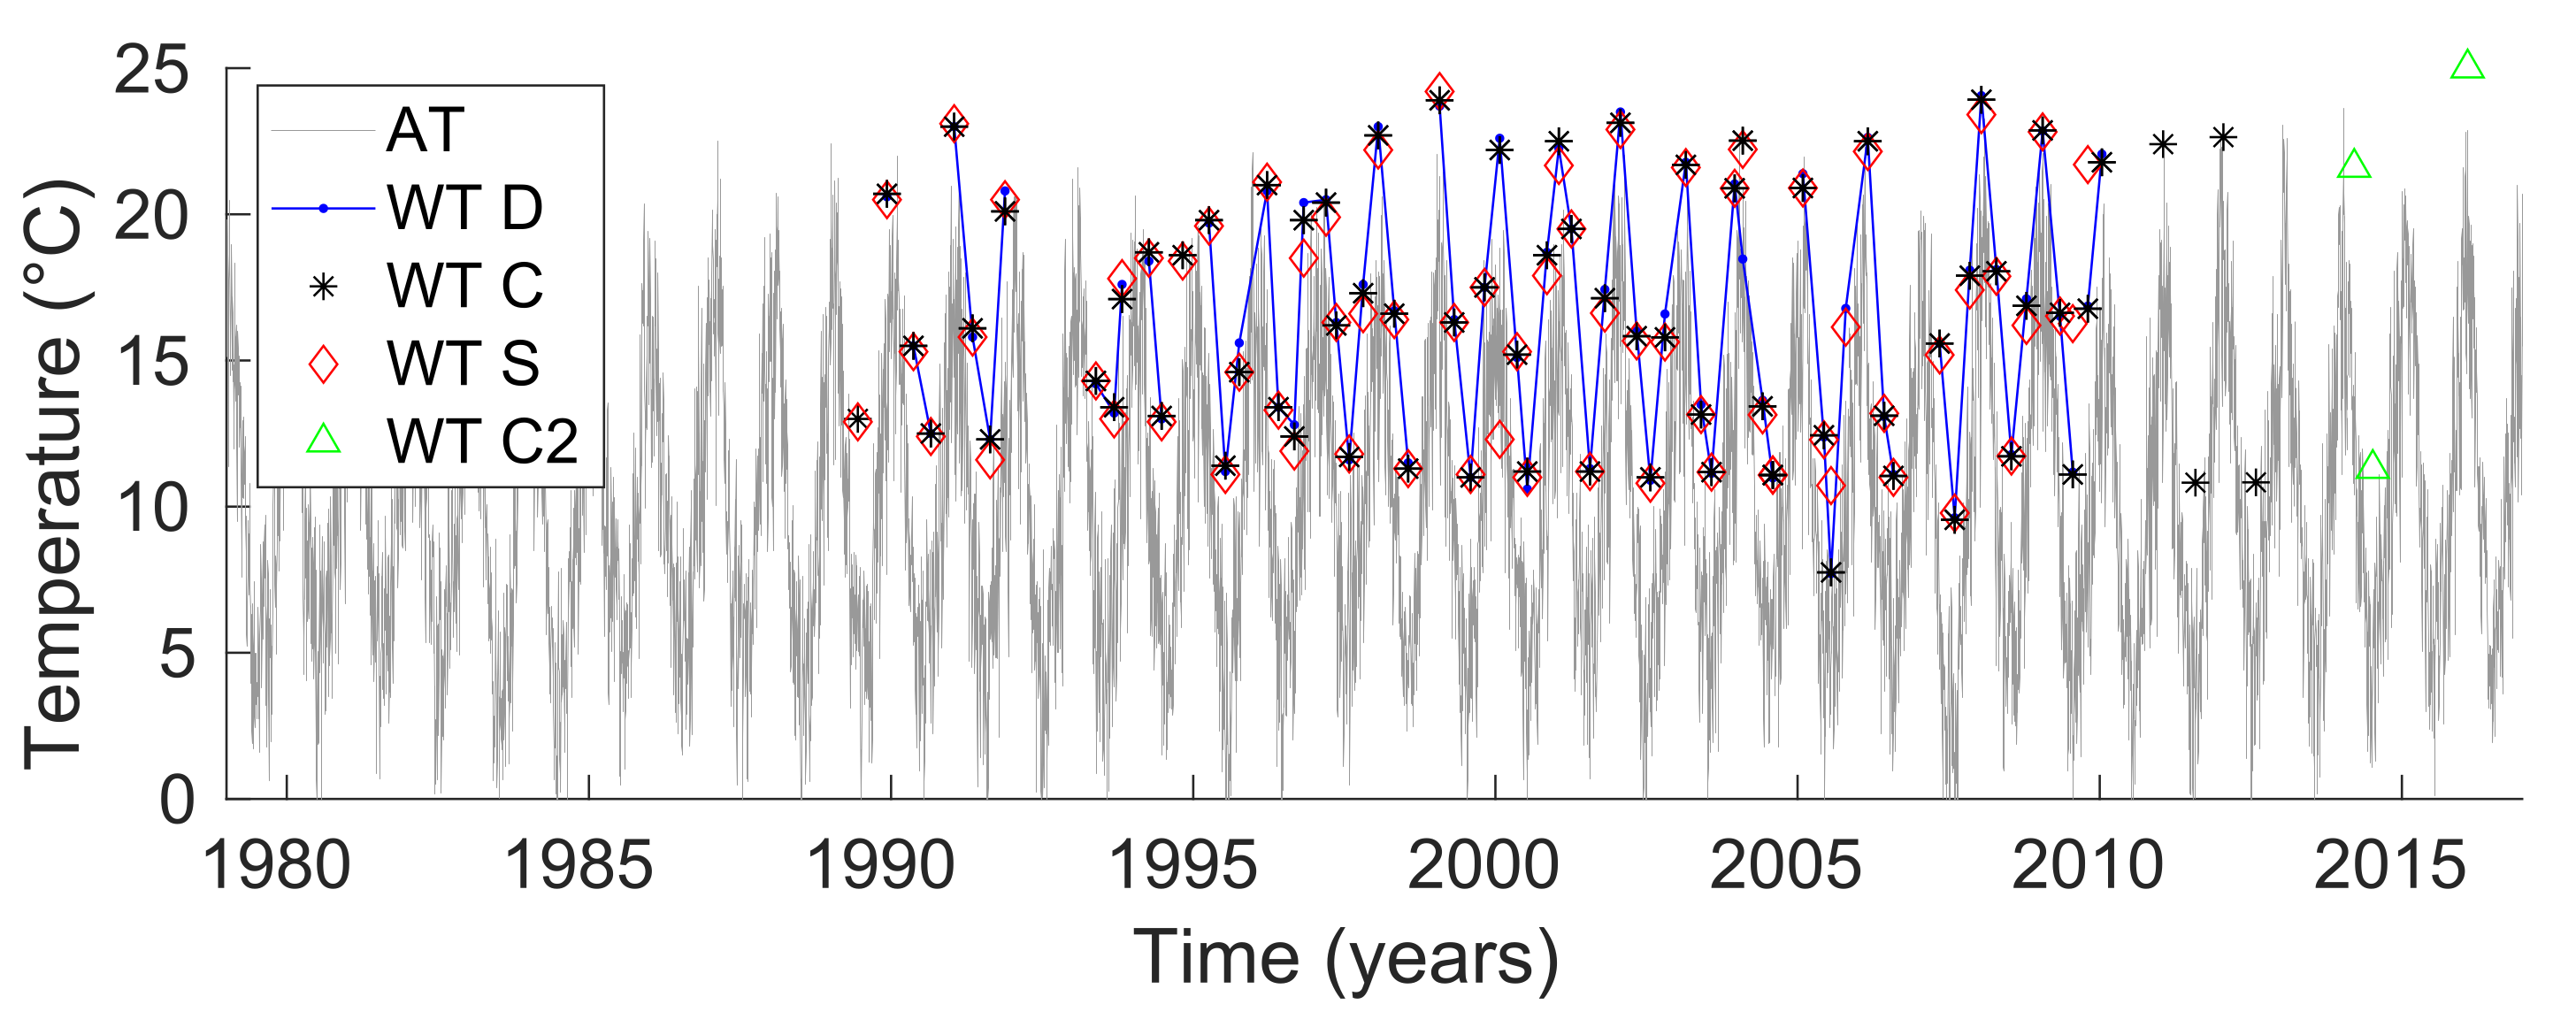
The Chilean Directorate of water resources (DGA) provides the local LSWT time series. DGA is a state agency responsible for managing, verifying and disseminating water information in Chile. It makes available physical-chemical parameters of water quality (temperature, specific conductivity, pH, dissolved oxygen, oxygen saturation, chlorophyll, % turbidity and Disco Secchi transparency) in different Chilean lakes (see in [40]). In the study area, the physical-chemical parameter measurement stations (Centro (C), Desagüe (D), Sur (S) and Centro 2 (C2) stations) are all located in Laguna Grande de San Pedro (see Figure 1, water temperature (WT) station in red dots and Table 2). Between 1988 and 2016, there are historical series of LSWT (at 0 m). Samples are collected at various intervals throughout the day, between 9 a.m. and 6 p.m. (UTC-4). Samplings was conducted between 1988 to 2013 at stations C, D, and S. Regrettably, these stations are no longer operational. Since 2014, samplings has been conducted at station C2, although only three-time sampling between 2014 and 2016 is known. It explains why we used stations C, D and S instead. This data (in C, D and S stations) is only continuous between 1990 and 2009, with at least one measurement for each season. The remainder of the period includes sporadic measurements of one, two, or no measurements at all per year. Between 1988 and 2016, the percentage of missing data in C, D and S stations is 28%, assuming four (4) measurements per year. However, because there is only 7.5% missing data from 2000 to 2009, we use the latter period for calibration.
In addition, there is a meteorological station with air temperature data at approximately 2 km from the lagoons (see Figure 1, AT station yellow dot), next to the Biobío River. The data are daily mean air temperature, continuous between 1979 and 2016 (see Table 2). The percentage of missing data is 0%. This data is going to be mentioned only for discussion purposes in Section 4.
The details of this database are shown in Figure 2 (see Table 2).

3.1.2. Satellite

The USGS makes available through the GEE platform all of the satellite images collections selected here (see Table 3). The following collections between 2000 and 2020 are used: (i) Landsat 7 and 8 Tier 1, and (ii) Landsat 7 and 8 Surface Reflectance Tier 1. The Landsat satellite mission always passes across the study area at approximately 10:40 (local time, UTC-4) (this information can be retrieved from each image’s metadata).
Collections (i) are in digital numbers, and collections (ii) already include surface brightness temperature. Collections (ii) have been corrected using the Landsat Ecosystem Disturbance Adaptive Processing System and Land Surface Reflectance Code software (more details in Section 3.2.4). The USGS resampled them to a spatial resolution of 30 m using cubic convolution. The collections are then pre-filtered, splitting them into images of higher quality (Tier 1), lower quality (Tier 2) and real-time [21]. In our case, we select Tier 1 collections. Then, we filter these collections by selecting images with cloud cover <30%. Furthermore, we consider the BQA band, which contains information on each image’s low-quality pixels. We remove low-quality pixels from all remaining images. Finally, lake’s mask is required. The masks for all Chilean continental water bodies are available on the page [41]. This page belongs to the National Environmental Information System (SINIA). These masks (see water bodies in Figure 1) are used to filter the collections and get the study area’s images.
We observe the following after applying these filters. The number of images for L7 ranges between four (4) and twelve (12) images. The maximum (12) was reached in 2014, while the minimum (4) was reached in 2003. Now, per month there are 1 to 2 images available in December, January and February (summer in SH). Instead, in June and July (winter in SH), it is reduced to 1 or no images. Each year, L8 has between ten (10) and thirteen (13) images per year. Meanwhile, there are 1 to 2 images per month and sometimes 0, with May, July, and October being more frequent. Thus, 168 L7 and 85 L8 images are retrieved from a total possible 401 and 173 images accessible in GEE, respectively. The database details are available in Table 3.

3.2. Satellite Data Processing

We compare six (6) methods that allow computing LSWT. One technique is based on the radiative transfer equation (M1), two are split-window algorithms (M2, M3), there is one mono-window algorithm (M6) and USGS created two other approaches (M4, M5). For convenience we refer to them as M1 (Landsat 7, ref. [20]), M2 (Landsat 8, ref. [6,30]), M3 (Landsat 8, ref. [29]), M4 and M5 (Landsat 7 and 8, Section 3.2.4) and M6 (Landsat 7, ref. [28]).
The six methods’ required input is summarized in Table 4. These methods are implemented in the GEE platform. The source codes may be found available at [42].

3.2.1. Method 1 (M1)

The authors of [20] determined the surface temperature using this approach (M1). This is accomplished by clearing the surface radiance ( L s u p ) from the radiative transfer equation, as shown in the Equation (2). This equation subtracts atmospheric effects from the satellite data considering three atmospheric parameters (see input in Table 4): atmospheric transmittance ( τ ), emitted radiance ( L u p ) and absorbed radiance ( L d o w n ). NASA’s Atmospheric Correction Parameter Calculator [26,27] enables the calculation of these parameters (as described in [20]). It is a free online platform that utilizes atmospheric profiles from the National Centers for Environmental Prediction (NCEP/NOAA) applying MODTRAN 4.0 to retrieve the radiative transfer equation’s required parameters [20]. The procedure is outlined below.
The thermal band (band 6, 10.40–12.50 μ m) is the sole band used in this method (see input in Table 4). According to [20] band B6 2 is used because it has higher radiometric precision than band B6 1 [48]. The digital levels ( D N ) are transformed to radiance ToA ( L λ ) with the equation:
L λ = M λ * D N + A λ
where M λ : band specific multiplicative rescaling factor, A λ : band specific additive rescaling factor.
Then the surface radiance ( L s u p ) is obtained from the radiative transfer equation, as follows:
L s u p = L λ L u p τ L d o w n ( 1 ϵ ) ϵ τ
where L u p , L d o w n and τ are the atmospheric parameters (obtained from the page [43]).
Water’s emissivity is required. It is typically assumed to have values between 0.97 and 1 [20]. We empirically determined the emissivity of the water near 0.9875 in both lagoons, using the Equation (6). We also checked against the ASTER Global Emissivity Dataset 100-meter V003 values, which are also available in GEE (from [44]) and found a nearly identical number (0.9866) (see input in Table 4).
The radiance at the Earth’s surface obtained in Equation (2) is transformed into surface brightness temperature (T) (equal to the surface temperature), through
T = K 2 ln ( 1 + K 1 L s u p )
where K 1 and K 2 are thermal conversion constants.

3.2.2. Method 2 (M2)

The authors of [6,30] retrieved LSWT using this approach (M2). It uses only L8 archives as input (see input in Table 4) and applies an SWA as atmospheric correction. The method is described in detail below.
From L8, the thermal spectrum is represented in bands 10 and 11, while the visible spectrum is represented by bands 4 and 5. For bands 4, 5, 10 and 11, we use Equation (1) to convert D N to ToA radiance. The thermal bands are then converted to brightness temperature ToA (T) using Equation (3) while bands 4 and 5 are converted to ToA reflectance ( ρ λ ) using the following formula:
ρ λ = M ρ * L λ + A ρ s i n ( θ )
where M ρ : band specific multiplicative rescaling factor, A ρ : band specific additiva rescaling factor, θ : sun elevation angle.
From the ToA reflectance, the N D V I is obtained according to
N D V I = N I R R N I R + R
where N I R and R are the ToA reflectance of bands 5 and 4, respectively.
Then, the emissivity (E) is calculated according to
E = 0.004 P v + 0.986
where
P v = N D V I N D V I m i n N D V I m a x N D V I m i n 2
Finally, the surface temperature can be calculated with
T ( C ) = T B ¯ 1 + T B ¯ ρ * λ * l n ( E )
where T B ¯ : average temperature between bands 10 and 11, λ : wavelength at 11.197 μ m, ρ = h C σ = 14388.15 μ mK, E: emissivity, h: Planck’s constant (6.626 × 10 34 JK 1 ), σ : Boltzmann’s constant (1.38×10 23 JK 1 ), C: speed of light (2.998 × 10 8 ms 1 ).

3.2.3. Method 3 (M3)

As with method 2, the (M3) method [29] is an L8 method (see input in Table 4) that employs an SWA as atmospheric correction.
The D N of bands 10 and 11 from L8 files are converted to ToA radiance using the Equation (1). Then, to ToA brightness temperature using the Equation (3). Finally, the surface temperature (T) is obtained through the SWA:
T = 5.1424 + 0.95578 T 10 + 0.83653 ( T 10 T 11 )
where T 10 and T 11 are the brightness temperatures of bands 10 and 11, respectively.

3.2.4. Methods 4 and 5 (M4 y M5)

The USGS developed these methods (M4 and M5) and generated ready-to-use surface temperature products for Landsat 4–8 collections [46,47] (see input in Table 4). On the GEE platform these products are accessible. It is classified as USGS Landsat (4–8) Surface Reflectance Tier 1. We use the Landsat 7 and 8 Surface Reflectance (SR) Tier 1 collections.
These products have been generated from the Landsat Ecosystem Disturbance Adaptive Processing System (LEDAPS [46]) and Land Surface Reflectance Code (LaSRC [47]). It generates Top-of-Atmosphere (ToA) Reflectance and ToA Brightness Temperature (BT) from metadata encoded calibration parameters. After applying atmospheric correction routines to Landsat ToA Reflectance, SR is generated. LEDAPS also takes additional input data into account, including water vapor, ozone, atmospheric pressure, aerosol optical thickness and digital elevation. The data are then fed into the Solar Spectrum radiative transfer model using Landsat ToA Reflectance and ToA BT. LaSRC also incorporates additional input data including water vapor and ozone from the Moderate Resolution Imaging Spectroradiometer (MODIS) and digital elevation from the Earth Topography Five Minute Grid (ETOP05) [46,47].
The product is already reflectance or surface brightness temperature. Thus, the user just needs to apply the pretreatment to the thermal bands (10 and 11) and multiply them by 0.1; a scaling factor taken from [46,47].

3.2.5. Method 6 (M6)

The M6 method is a statistical mono-window algorithm (SMWA). It is a linearization of the radiative transfer equation. It is dependent on surface emissivity (Equation (10)):
T = A i T b ϵ + B i 1 ϵ + C i
where T b : ToA brightness temperature in the TIR channel, ϵ : surface emissivity, A i , B i and C i : algorithm coefficients.
The algorithm coefficients are determined from linear regressions of radiative transfer simulations. They are calibrated from dataset of air temperature, water vapor and ozone profiles (the work in [49] cited by the authors of [28]). The GEE code is already available by [28] (see input in Table 4).

3.3. Work Strategy

This section details the work strategy, whose flow diagram is shown in Figure 3. Three subsections are included here: (i) LSWT series calculation (Section 3.3.1), in which LSWT series are obtained using the six methods (Section 3.2), (ii) calibration process (Section 3.3.2), in which the LSWT series are calibrated using in situ data (Section 3.1.1) and (iii) LSWT field data set and climatology (Section 3.3.3), in which the calibration is extended to two dimensional (2D) × time LSWT data field from which a seasonal climatology is created to demonstrate the results.

3.3.1. LSWT Series

In Section 3.2, six methods are detailed to retrieve long-term LSWT series (see flow diagram in Figure 3). For each method (M1 to M6), three LSWT series are obtained, one in each sampling station (D, C and S). However, for simplicity, we refer to the series by their method, regardless of their location. The LSWT series are denoted: tM1, tM2, tM3, tM4, tM5 and tM6.
Certain characteristics of method 1 (M1) should be discussed in detail. This method produces a series (tM1) that spans 2000–2009 (see Figure 3). While it is conceivable to extend it till 2020, this method is the only strategy in this study that could not be automated in the GEE platform. It requires manually extracting atmospheric parameters from the website [43]. For this reason, we limited it to the period 2000–2009, which coincides with a time of increased in situ data continuity (see Table 2 and Figure 2).
All time series were screened for outliers. The term ‘outlier’ refers to values that exceed three scaled median absolute deviations.

3.3.2. Calibration Process

The aim of this section is to calibrate the LSWT series to the in situ series. To accomplish this, we fit LSWT series linearly.
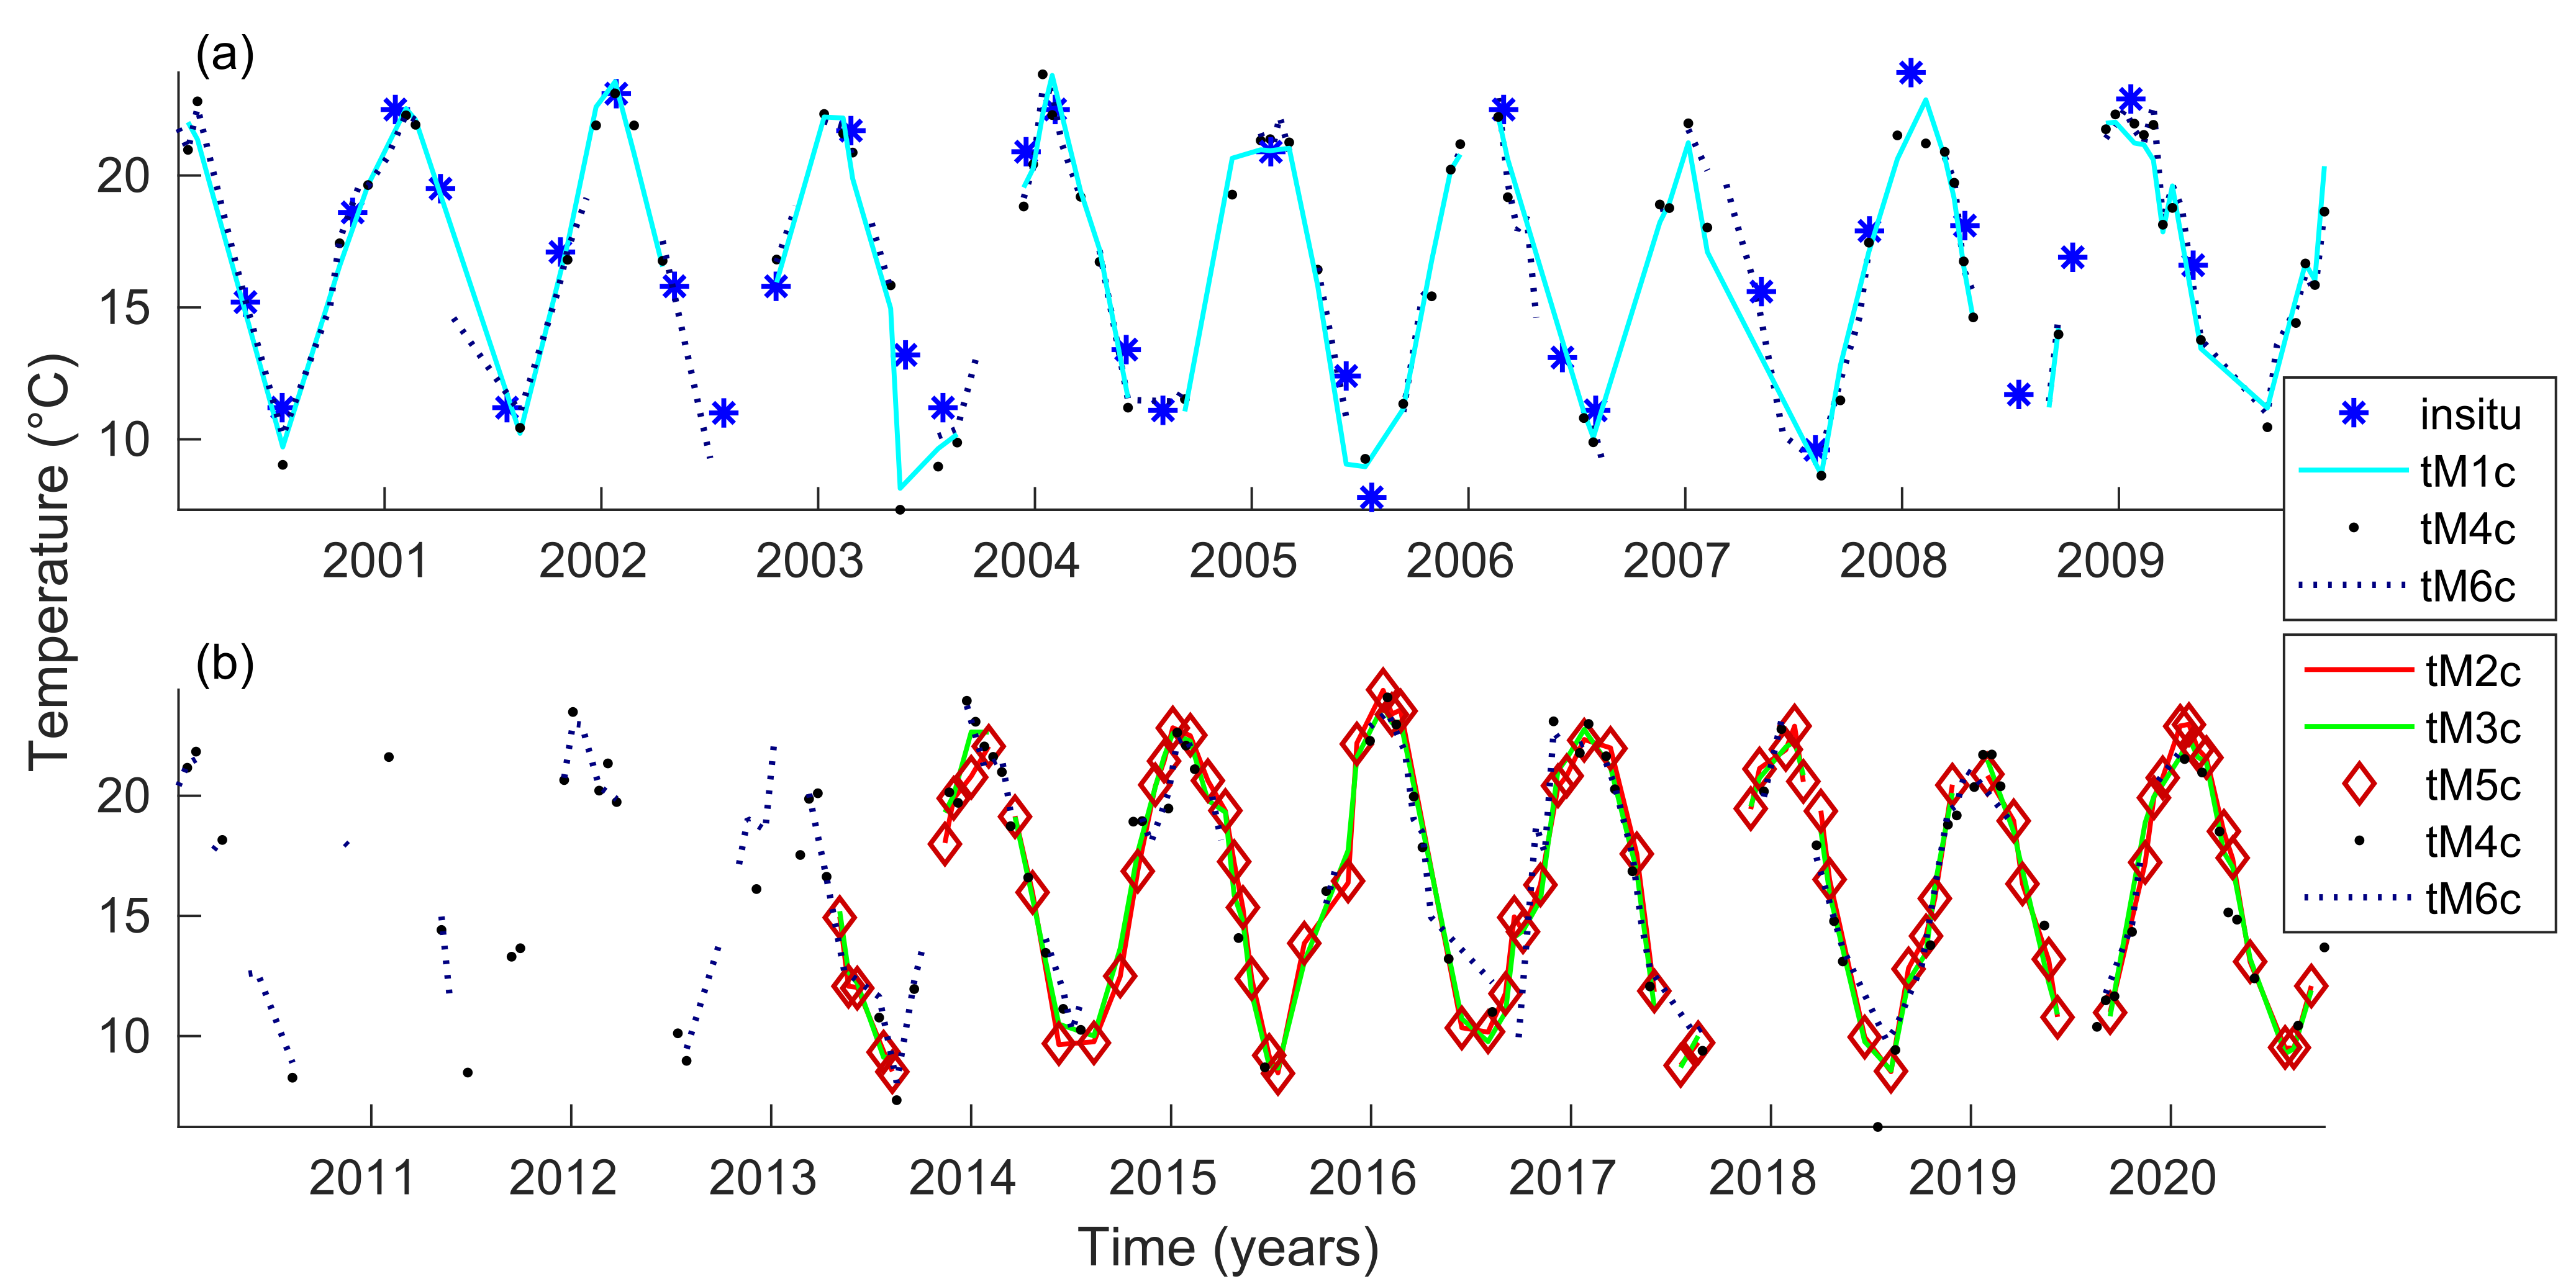
The calibration or adjustment shall be performed between distinct pairs of series. We keep the following in mind in advance. The L7 LSWT series (tM1, tM4 and tM6) may be directly calibrated against the real data since they share the same time period from 2000 to 2009 (see diagram in Figure 3 and in-situ data in Figure 2). However, the L8 series does not begin until 2013, when no in-situ data are available. As a result the in-situ data cannot be used to calibrate the L8 series. However, the tM4 and tM6 series are present throughout the entire period (2000–2020). Then using the already calibrated tM4 (or tM6), it is possible to calibrate all the others. The series tM1–tM6 are then denoted by the abbreviations tM1c, tM2c, tM3c, tM4c, tM5c and tM6c. All these time series plus the local LSWT data series are shown in Figure 4.
Additionally, we conduct a statistical analysis of the six remote sensing series (tM1- to -tM6) as well as the in situ data series. We employ a variety of comparison statistics: b i a s (Equation (11)), Willmott’s index of agreement (d, Equation (12)), root mean square error ( R M S E ; Equation (13)) and the square of the correlation coefficient ( R 2 , Equation (14)).
b i a s = 1 n i = 1 n ( X i Y i )
d = 1 i = 1 n ( X i Y i ) 2 i = 1 n ( | X i X | + | Y i X | ) 2
R M S E = 1 n i = 1 n ( X i Y i ) 2 1 2
R 2 = 4 [ i = 1 n ( X i X ) ( Y i Y ) i = 1 n ( X i X ) 2 i = 1 n ( Y i Y ) 2 4 ] 2
where X i and Y i are the ith observations of datasets X and Y, X and Y are the mean values of X and Y, and n is the number of observations.
According to the authors of [50,51], b i a s is the averaged difference between two datasets, d is the proportion of agreement (0, no agreement, and 1, perfect agreement), R M S E denotes the overall difference between two datasets and R 2 represents the proportion of shared variance.

3.3.3. LSWT Field Data Set and Climatology

After testing the behavior of the calibrated methods, we apply the linear fit to a spatial two-dimensional (2D) × LSWT data field.
We have three (3) choices to build the LSWT field: (i) tM1c between the years 2000 and 2009, 76 images; (ii) tM4c or tM6c between the years 2000 and 2020, 168 images; and (iii) tM2c, tM3c, or tM5c between the years 2013 to 2020, 85 images (see Table 3). Table 5 provides the number of images per month available for climatology construction.
The LSWT data field generated with one of these databases will cover a significant portion of the surface area of the lagoons, equivalent to a 2261-pixel grid of 30 × 30 m 2 . This is not the original surface; we first applied a 30 m buffer to the lagoons’ surface shapes to avoid water–land interface pixels.
From the above, we begin by constructing a 2D × time database spanning the years 2013–2020, from which we first extract a monthly climatology. To accomplish this, the January values are averaged, followed by February’s, and so on, until 12 final values are obtained. Climatology enables us to determine the typical pattern (so called normals) of a variable’s seasonal mean cycle. The climatology approximates what occurs in the area with respect to the LSWT and shows the method’s scope.

4. Results and Discussion

The results are shown below according to Section 3.3 order.

4.1. LSWT Series

Six LSWT time series (tM1, tM2, tM3, tM4, tM5 and tM6) are obtained for the lagoons. One for each remote sensing method (M1 to M6). Each series demonstrate the same temporal fluctuation in LSWT (see Figure 4). The most significant difference between them turned out to be their bias. This is evidenced, before calibrating, in Table 6 and Table 7. It led us to perform the calibration process using a simple linear fit.
Both tables (Table 6 and bias values of Table 7) indicate that the closest series to the in situ series prior to calibration are tM1 and tM6. This is because M1 and M6 use local atmospheric variables as input, which help calibrate the results. The farthest series from the in situ series is tM3. This particular SWA (M3, Section 3.2.3) has been developed and commonly used in marine water bodies [52] including estuaries [53], but not in freshwater bodies. As a result, M1 and M6 performed the best, without calibrating.

4.2. Calibration Process

Different pairs were calibrated with a linear fit considering all the series: tM1 to tM6 and the in-situ series. Note that all the series (tM1 to tM6 and the in situ series) are monthly interpolated before the adjustment. As mentioned in Section 3.3.2, according to the period in which the time series is initially present, we calibrate tM1, tM4, and tM6 directly with the in situ series. Then we calibrate tM2, tM3 and tM5 with the already calibrated tM4.
The statistics calculated to compare ( b i a s , d, R M S E and R 2 ) are shown in the Table 7. The calibrated tM1 to tM6 series are shown in Figure 4. We show only one sampling station (C) because in all three (D, C and S), LSWT has the same behavior. Indeed, after calibration the series are at the same level ( b i a s = 0 in Table 7), which is clear in Figure 4). Therefore, after a simple calibration, all the methods describe the LSWT variable adequately.
Note here that air temperature has a significant effect on the lake thermal dynamics [1,54]. This is evidenced in Figure 2. Other factors are wind and precipitation [55]. Under specific hypotheses the air temperature variation implicitly contains and provides pertinent information about the other significant processes involved [54,56]. Indeed, a simple model allows to get the LSWT using almost only the air temperature as an input variable: the air2water model [1,57]. With in-situ data (see Figure 2) we tested that model in our study area and the Pearson correlation between the air2water results and tM4 series is 0.92. This opens the possibility of integrating numerical models and satellite data in the future, as in [13]. However, this generally applies to small lakes with little atmospheric circulation. In other circumstances wind may become a substantial forcing factor modulating the LSWT [58,59].

4.3. LSWT Field Data Set and Climatology

We consider that any method is optimal to build an LSWT data field in the lagoons and their subsequent climatology from the calibration process results.
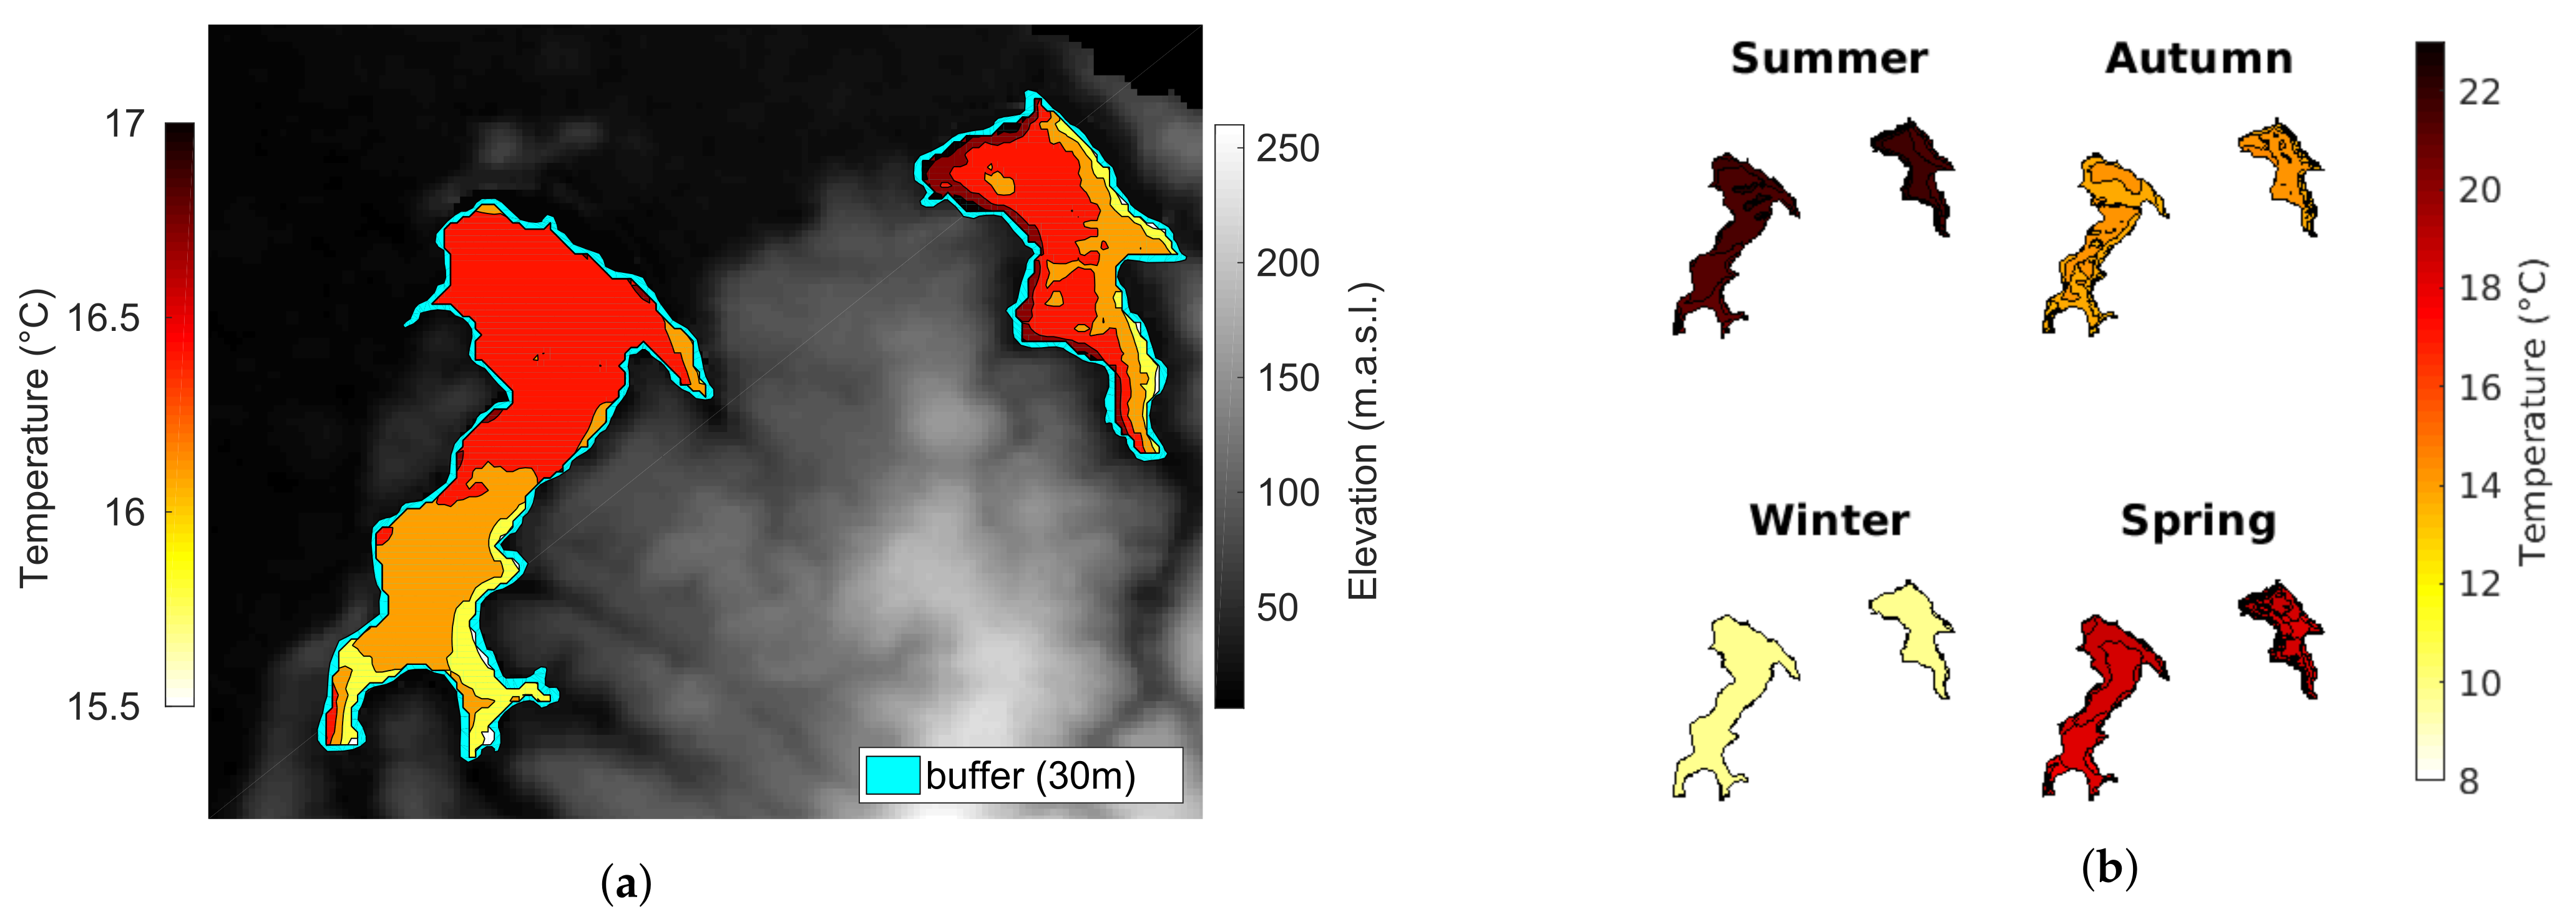
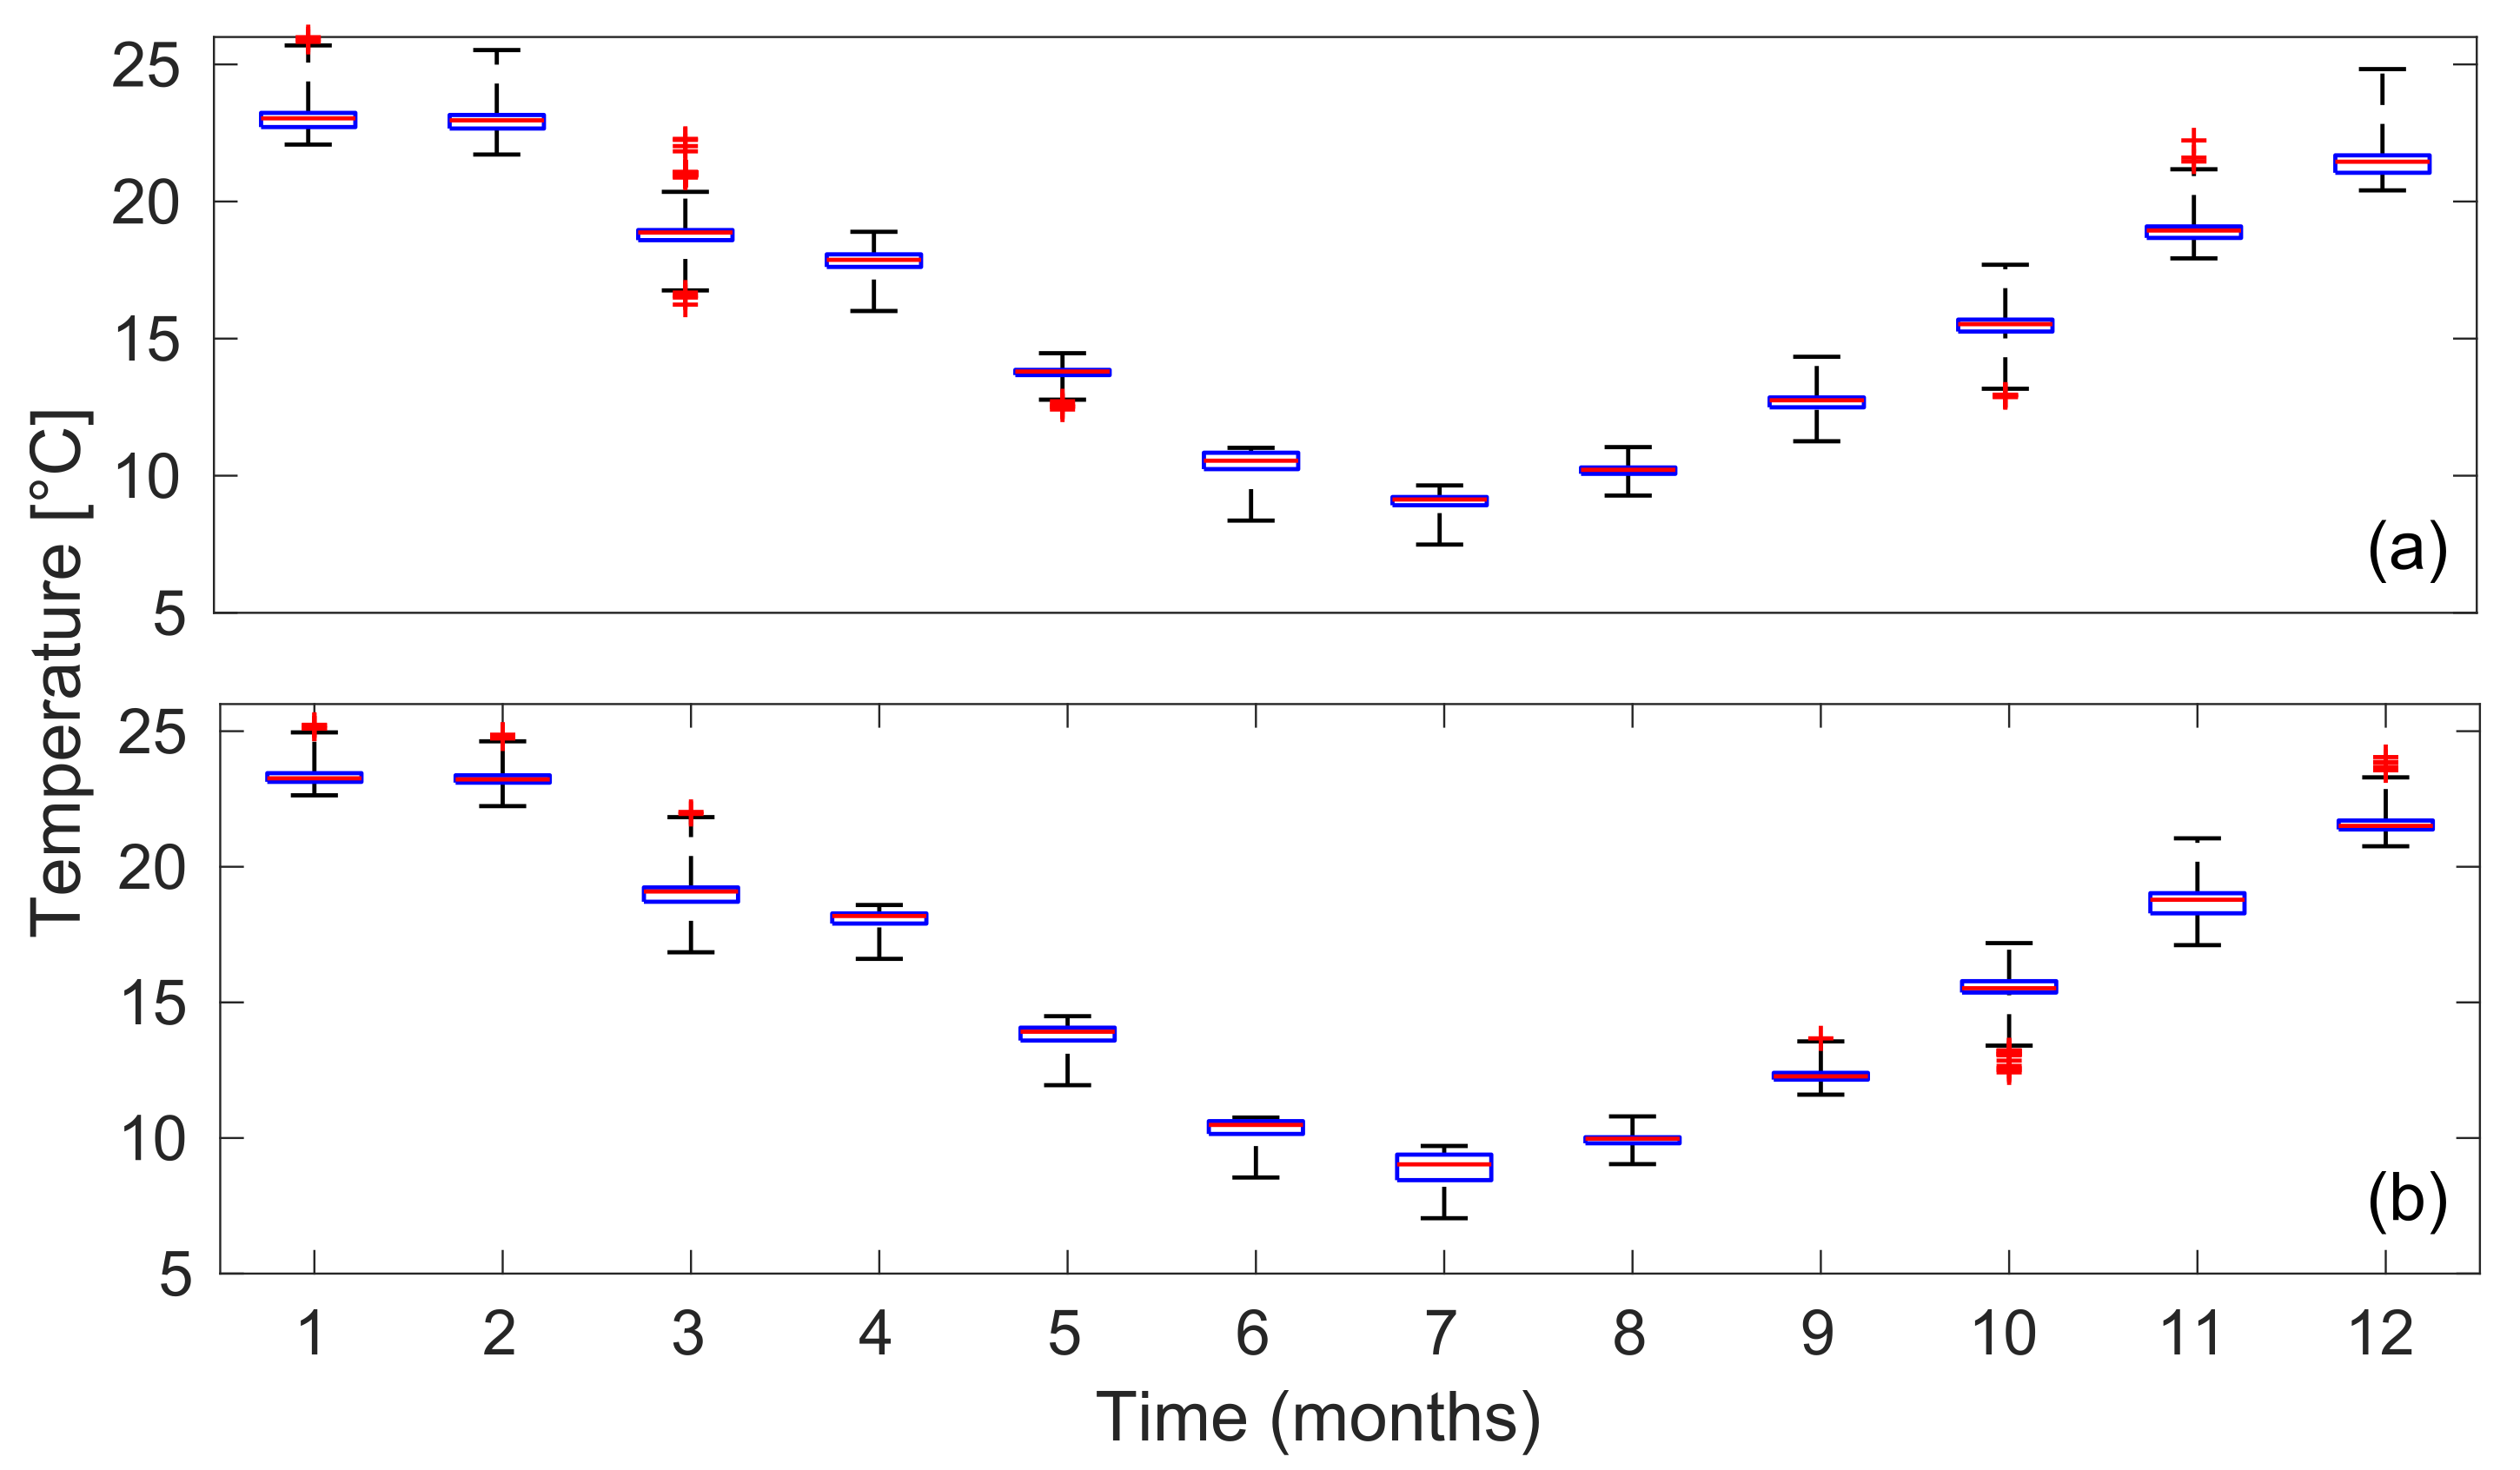
The average monthly climatology is depicted in Figure 5a. Both lagoons have comparable seasonal cycles and temperature ranges (15.5–17 C) (see Figure 6). Throughout the year, the monthly LSWT temperature fluctuates between approximately 7 and 25 C. However, there are some variations in the spatial temperature pattern between the two lagoons. The temperature gradient in Laguna Grande (left water body, Figure 5a) is north–south, whereas the gradient in Laguna Chica is east–west. As seen in Figure 1d, one explanation for this might be the well-known heat island effect, which generates a temperature differential. As a result, temperature increases in areas next to cities and lowers in areas with vegetational cover [60]. This significant effect may also be enhanced by the increased wind speed associated with the existence of the Biobío River in the instance of Laguna Chica (see Figure 1).
Figure 5b shows that the LSWT at 10:40 am (UTC-4) exhibits a seasonal variation, reaching a maximum in Summer (defined as January, February and March) with values of around 23 °C and its minimum in Winter (defined as July, August and September) with temperatures near to 9 °C. Now the spatial distribution of LSWT can be appreciated in Figure 5a. This spatial variation is ~1.5 °C. Similarly, in Figure 6, the spatial variation in the LSWT climatology is displayed for each month (in each pixel of the spatial grid detailed in Section 3.3.3). Thus, over these small lagoons, each month temperature swing geographically by approximately 2 °C.
It is worth mentioning that satellite images and in situ data are collected at different times. The in situ data is gathered at various times throughout the day (between 9 a.m. and 6 p.m., local time, UTC-4, Section 3.1.1). This illustrates a pervasive problem with inland waters: a dearth of in situ data. A data shortage owing to the inherent difficulties of not only installing aquatic sensors, or collecting data, but most importantly, maintaining the monitoring and checking its quality and homogeneity over time, in water bodies that may not be top priority for the financial authorities.
On the other hand, the satellite images are always provided at the same time: 10:40 UTC-4 (Section 3.1.2). The temporal gap between the two sensors, satellite and local, may naturally lead to measurement inconsistencies, resulting in satellite data calibration inaccuracies. If we have already passed the question of whether we were calibrating against reliable data, will the lack of synchronization have an influence on the quality, i.e., representativeness, of our satellite fields? Obviously, the answer will vary based on the scientific issues we wish to address, i.e., what is the frequency target for the sectors we wish to explore. If we were to build daily fields, we may be able to think, ‘Houston, we have a problem’. However, our aim here is long term, monthly or even seasonal fields. Already, the monthly comparison with air temperature data and its relationship to the fluctuation of the lake data demonstrates that its monthly changes are rather steady in comparison to the daily variation (Figure 4). Then, if we examine the monthly series’ climatological boxplot data (Figure 6), we see that same stability is also present, demonstrating that the LSWT fluctuates little within a single month. Due to the fact that our study examines monthly or seasonal changes, this little difference is not significant.
Still, to ensure that the climatology is representative throughout time, the best choice is to utilize the M4 or M6 techniques to extract tM4 and tM6 (the longest series: years 2000 to 2020, with 168 images, Table 3). However, when we evaluate this option, we observe a clear effect of mobile spatial gaps over time because of the error of the ETM+ sensor in its Scan Line Corrector [21]. Thus, for each image, ±10% of the lagoons’ area is lost. As a result, we disregard L7 methods (M1, M4 and M6). Rather than that, we opted for one of the L8 methods (M2, M3 and M5). The graphic similarity between the related series (tM2c, tM3c and tM5c) in Figure 4 is evident. Also the values of R 2 between them with no calibration are almost 1 and they share the same period (2013–2020). That is why we have the option of selecting any of the three series. Following calibration, we select M5 (tM5c series). The LSWT climatology in Figure 5a is made with the data set iii (Table 5).
It is worthwhile to engage in a debate that enables us to put our work into context and define its future stages. Landsat 7 and 8 (and now 9) provide an enormous temporal coverage (since 1999) and sufficient geographic resolution for lakes of different sizes, even small ones. Additionally, we find a vast number of methods to obtain this parameter (and we probably missed some). We note that any valid method may be acquired using the simplest calibration process (a linear fit). Now, to build the spatial and temporal field of data, we encounter several circumstances. There is a 10-year period (2000–2013) that L8 does not cover, but L7 does, although with its widely known gaps. As a consequence, the LSWT data field on the surface of the lagoons was built using Landsat 8 files, which was an outstanding choice and produced great results. The next step, however, is to build the LSWT fields with Landsat 7 data (since 1999). The question then becomes: what happens if we interpolate the images to fill the spatial gaps present in the Landsat 7 files? How does the LSWT data fields result? Additionally, it would also be prudent to improve the quality of the data fields by merging them with MODIS data. With this, we could reconstruct data fields throughout the last 21 years (1999–2020).
The ability to construct monthly lake surface temperature fields and climatology for the previous 21 years enables establishing a first-order link with the eutrophication process in both water bodies. This is critical when considering the extent of intervention these lagoons’ basins have had. The intervention has been mainly for construction projects. Several of them are so huge that they altered the wind and lighting influence on the water column. This is a well-studied and well-known phenomenon [61,62,63] and it is of course incredible, but not surprising, that it was not studied prior to construction. As a result, this entails a change in the lake’s vertical structure and, consequently, its eutrophication process. A phenomenon that we are now studying in great detail.
By developing techniques for determining long-term LSWT fields, we can gain a better understanding of how climate change affects and operates in lake systems. Additionally, by building vertical temperature profiles through CTDs, it is possible to investigate the vertical stratification suffered by the lakes [64]. By combining this information with the land use history that a lake basin has experienced may explain the cause of the variation in the lake’s thermal regime, we may learn more about the eutrophication process, and probable HABs occurrences. Thus, thanks to the efforts of space agencies that make their remote sensed data freely available, together with big data processing platforms such as GEE, that enables the online processing of massive amounts of data, it is the start of a low-cost environmental monitoring system. It may be complemented with additional water quality metrics or currently existing data on lake’s height [65], surface, or volume [66] changes. This will be aided by the Surface Water and Ocean Topography (SWOT) satellite mission, which will conduct the world’s first inventory of all terrestrial surface water bodies with a surface area greater than 250 m 2 (lakes, reservoirs, and wetlands), as well as the Copernicus high resolution-LSTM mission, which will provide nearly daily surface temperature values at approximately the same resolution.

5. Conclusions

The purpose of this study is to evaluate six different methods for estimating LSWT using Landsat 7 and 8 archives. Landsat files that has been properly calibrated may be used to obtain LSWT series for any lake, including medium and small-sized lakes. We used the Google Earth Engine (GEE) platform as it reduces image processing work by automating huge sets of image collections.
The six methods are described in detail in Section 3.2. One method is based on the radiative transfer equation (M1), two are split-window algorithms (M2, M3), and one is a mono-window algorithm based on the radiative transfer equation (M6). The USGS developed two approaches (M4, M5). After calibration using in situ data, the six approaches adequately characterize the seasonal variation of LSWT (Willmott’s index of agreement > 0.91, R 2 > 0.67). M1 and M6 produce the best results without calibration. With calibration, any method is appropriate.
The climatology field reveals that both lagoons display similar spatial (15.5–17 C) and temporal (7–25 C) LSWT patterns throughout the year. The variations in geographical patterns are most likely due to the island’s heat and the presence of the Biobío river. The investigation of the origins of these shifting patterns within the lagoons, the strong suspicion that some anthropogenic influence is causing harm to their environment or the ecosystems of other lakes in South America, and the pursuit of strategies to cure or mitigate these consequences all serve as motivations for this study.
Having in situ data as near to the time the satellites pass over the research area would help to enhance the calibration process. Thus, if no local data is available, we recommend using the radiative transfer equation (M1) or the mono-window approach based on the radiative transfer equation (M6) methods, as those techniques are those which are closer to reality.
The work reported here is the first phase of a project to build a database of remote sensing monitoring of all water bodies throughout Latin America. Regardless, we hope that our work will enable several teams worldwide investigating small lakes to build their own databases.

Author Contributions

Writing - original draft and formal analysis, M.P.-G.; writing - review, editing and supervision, R.A.-d.-R.; formal analysis, I.G. and K.E.; writing—review, Ó.P. All authors have read and agreed to the published version of the manuscript.

Funding

This research was funded by Agencia Nacional de Investigación y Desarrollo, National Doctoral Scholarship, Chile, folio 21212143.

Acknowledgments

The authors gratefully acknowledges the reviewers and editor comments, which have improved the quality of the present work.

Conflicts of Interest

The authors declare no conflict of interest.

References

  1. Piccolroaz, S.; Toffolon, M.; Majone, B. A simple lumped model to convert air temperature into surface water temperature in lakes. HESS 2013, 17, 3323. [Google Scholar]
  2. Beutel, M.W.; Horne, A.J.; Roth, J.C.; Barratt, N.J. Limnological effects of anthropogenic desiccation of a large, saline lake, Walker Lake, Nevada. Hydrobiologia 2001, 466, 91–105. [Google Scholar] [CrossRef]
  3. Parra, O.; Valdovinos, C.; Urrutia, R.; Cisternas, M.; Habit, E.; Mardones, M. Caracterización y tendencias tróficas de cinco lagos costeros de Chile central. Limnetica 2003, 22, 51–83. [Google Scholar]
  4. Parra, O.; Baeza, C.; Almanza, V.; Urrutia, R.; Figueroa, R.; Fernández, X.; de Orúe, P.; González, P.; Beltrán, J.; Becerra, J.; et al. Una aproximación interdisciplinaria al estudio de floraciones de algas nocivas en Lagos Urbanos En Chile. In Desarrollo Sustentable; Barra, R., Rojas, J., Eds.; University of Concepción: Concepción, Chile, 2016; pp. 133–146. [Google Scholar]
  5. Prats, J.; Reynaud, N.; Rebière, D.; Peroux, T.; Tormos, T.; Danis, P. A. LakeSST: Lake Skin Surface Temperature in French inland water bodies for 1999–2016 from Landsat archives. ESSD 2018, 10, 727–743. [Google Scholar] [CrossRef] [Green Version]
  6. Randrianiaina, J.; Rakotonirina, I.; Ratiarimanana, R.; Lahatra, F. Temperature Retrieval of Lake Itasy Using Remote Sensing. Resour. Environ. 2018, 8, 241–244. [Google Scholar]
  7. Elachi, C.; Van Zyl, J.J. Introduction. In Introduction to the Physics and Techniques of Remote Sensing; John Wiley & Sons: Hoboken, NJ, USA, 2006; pp. 1–18. [Google Scholar]
  8. Lieberherr, G.; Wunderle, S. Lake surface water temperature derived from 35 years of AVHRR sensor data for European lakes. Remote Sens. 2018, 10, 990. [Google Scholar] [CrossRef] [Green Version]
  9. Pareeth, S.; Salmaso, N.; Adrian, R.; Neteler, M. Homogenised daily lake surface water temperature data generated from multiple satellite sensors: A long-term case study of a large sub-Alpine lake. Sci. Rep. 2016, 6, 1–14. [Google Scholar] [CrossRef] [PubMed] [Green Version]
  10. Copernicus Global Land Service. Available online: https://land.copernicus.eu/global/products/lswt (accessed on 1 June 2021).
  11. Edinburgh Data Share. Available online: https://datashare.ed.ac.uk/handle/10283/88 (accessed on 1 June 2021).
  12. Lake Water Temperatures. Available online: https://www.beachtemp.us/beach/870958/ (accessed on 1 June 2021).
  13. Guo, L.; Zheng, H.; Wu, Y.; Fan, L.; Wen, M.; Li, J.; Zhang, F.; Zhu, L.; Zhang, B. An integrated dataset of daily lake surface water temperature over Tibetan Plateau. Earth Syst. Sci. Data Discuss. Under review. 2021. [Google Scholar]
  14. Kumar, L.; Mutanga, O. Google Earth Engine applications since inception: Usage, trends, and potential. Remote Sens. 2018, 10, 1509. [Google Scholar]
  15. Amani, M.; Ghorbanian, A.; Ahmadi, S.A.; Kakooei, M.; Moghimi, A.; Mirmazloumi, S.M.; Moghaddam, S.H.A.; Mahdavi, S.; Ghahremanloo, M.; Parsian, S.; et al. Google Earth Engine Cloud Computing Platform for Remote Sensing Big Data Applications: A Comprehensive Review. IEEE J. Sel. Top. Appl. Earth Obs. Remote Sens. 2020, 13, 5326–5350. [Google Scholar]
  16. Traganos, D.; Poursanidis, D.; Aggarwal, B.; Chrysoulakis, N.; Reinartz, P. Estimating satellite-derived bathymetry (SDB) with the google earth engine and sentinel-2. Remote Sens. 2018, 10, 859. [Google Scholar]
  17. Sazib, N.; Mladenova, I.; Bolten, J. Leveraging the google earth engine for drought assessment using global soil moisture data. Remote Sens. 2018, 10, 1265. [Google Scholar]
  18. Solheim, A.L.; Globevnik, L.; Austnes, K.; Kristensen, P.; Moe, S.J.; Persson, J.; Phillips, G.; Poikane, S.; van de Bund, W.; Birk, S. A new broad typology for rivers and lakes in Europe: Development and application for large-scale environmental assessments. Sci. Total Environ. 2019, 697, 134043. [Google Scholar] [CrossRef]
  19. Ogilvie, A.; Belaud, G.; Massuel, S.; Mulligan, M.; Le Goulven, P.; Calvez, R. Surface water monitoring in small water bodies: Potential and limits of multi-sensor Landsat time series. HESS 2018, 22, 4349. [Google Scholar]
  20. Tavares, M.H.; Cunha, A.H.F.; Motta-Marques, D.; Ruhoff, A.L.; Cavalcanti, J.R.; Fragoso, C.R.; Bravo, J.M.; Munar, A.M.; Fan, F.M.; Rodrigues, L.H.R. Comparison of methods to estimate lake-surface-water temperature using landsat 7 ETM+ and MODIS imagery: Case study of a large shallow subtropical lake in Southern Brazil. Water 2019, 11, 168. [Google Scholar] [CrossRef] [Green Version]
  21. U.S. Geological Survey. Available online: https://www.usgs.gov/ (accessed on 1 August 2020).
  22. Google Earth Engine Code. Available online: https://code.earthengine.google.com/ (accessed on 15 August 2020).
  23. Earth Engine Data Catalog. Available online: https://developers.google.com/earth-engine/datasets/catalog/LANDSAT_LO08_C01_T1_RT (accessed on 15 August 2020).
  24. Earth Engine Data Catalog. Available online: https://developers.google.com/earth-engine/datasets/catalog/LANDSAT_LC08_C01_T1_TOAEarthEngineDataCatalog. (accessed on 15 August 2020).
  25. Earth Engine Data Catalog. Available online: https://developers.google.com/earth-engine/datasets/catalog/LANDSAT_LC08_C01_T1_SR (accessed on 15 August 2020).
  26. Barsi, J.A.; Barker, J.L.; Schott, J.R. An Atmospheric Correction Parameter Calculator for a Single Thermal Band Earth-Sensing Instrument. Int. Geosci. Remote Sens. Symp. 2003, 5, 3014–3016. [Google Scholar]
  27. Barsi, J.A.; Schott, J.R.; Palluconi, F.D.; Hook, S.J. Validation of a web-based atmospheric correction tool for single thermal band instruments. Earth Obs. Syst. X 2005, 5882, 58820E-1–58820E-7. [Google Scholar]
  28. Ermida, S.L.; Soares, P.; Mantas, V.; Göttsche, F.-M.; Trigo, I.F. Google Earth Engine open-source code for Land Surface Temperature estimation from the Landsat series. Remote Sens. 2020, 12, 1471. [Google Scholar] [CrossRef]
  29. Bayat, F.; Hasanlou, M. Feasibility study of Landsat-8 imagery for retrieving sea surface temperature (case study Persian Gulf). ISPRS Arch. 2003, 41, 1107–1110. [Google Scholar]
  30. Rajeshwari, A.; Mani, N.D. Estimation of land surface temperature of Dindigul district using Landsat 8 data. IJRET 2014, 3, 122–126. [Google Scholar]
  31. Allan, M.; Hamilton, D.P.; Trolle, D.; Muraoka, K.; McBride, C. Spatial heterogeneity in geothermally-influenced lakes derived from atmospherically corrected Landsat thermal imagery and three-dimensional hydrodynamic modelling. Int. J. Appl. Earth Observ. Geoinf. 2016, 50, 106–116. [Google Scholar] [CrossRef]
  32. Gianello, D.; Ávila-Hernández, E.; Aguer, I.; Crettaz-Minaglia, M.C. Water quality assessment of a temperate urban lagoon using physico-chemical and biological indicators. SN Appl. Sci. 2019, 1, 470. [Google Scholar] [CrossRef] [Green Version]
  33. Odunuga, S.; Udofia, S.; Osho, O.E.; Adegun, O. Environmental Degradation in the Ikorodu Sub-Urban Lagos-Lagoon Coastal Environment, Nigeria. Open Environ. Sci. 2018, 10, 16–33. [Google Scholar] [CrossRef] [Green Version]
  34. Sarricolea, P.; Herrera-Ossandon, M.; Meseguer-Ruiz, Ó. Climatic regionalisation of continental Chile. J. Maps 2017, 13, 66–73. [Google Scholar] [CrossRef]
  35. Bertrán, C.; Arenas, J.; Parra, O. Macrofauna del curso inferior y estuario del río Biobío (Chile): Cambios asociados a variabilidad estacional del caudal hídrico. Rev. Chil. Hist. Nat. 2001, 74, 331–340. [Google Scholar] [CrossRef]
  36. Peña Cortés, F.A. Geomorfología de la ribera norte del río Bío-Bío en su curso inferior: Limitaciones y potencialidades del área. RGNG 1995, 22, 27–33. [Google Scholar]
  37. Municipalidad de San Pedro de la Paz. Guía de Patrimonio Ambiental de San Pedro de la Paz; Dirección de Medio Ambiente: San Pedro de la Paz, Chile, 2019. [Google Scholar]
  38. Rojas, O.; Zamorano, M.; Vega, C.; Pacheco, F.; Figueroa, R. Percepción científica de los Servicios Ecosistémicos en el humedal Los Batros San Pedro de la Paz. In Urbanización en el Humedal Los Batros; Rojas, C., de la Fuente, H., Matínez, M., Rueda, I., Eds.; University of Concepción: Concepción, Chile, 2017; pp. 46–51. [Google Scholar]
  39. Parra, O.; Basualto, S.; Urrutia, R.; Valdovinos, C. Estudio comparativo de la diversidad fitoplanctónica de cinco lagos de diferentes niveles de eutroficación del área litoral de la región del Biobio (Chile). Gayana Bot. 1999, 56, 93–108. [Google Scholar]
  40. Dirección General de Aguas. Available online: https://dga.mop.gob.cl/servicioshidrometeorologicos/Paginas/default.aspx (accessed on 1 August 2020).
  41. Infraestructura de Datos Espaciales (IDE) del Ministerio del Medio Ambiente. Available online: https://ide.mma.gob.cl/ (accessed on 15 August 2020).
  42. Git Hub. Available online: https://github.com/mpedreros/LSWT_methods.git (accessed on 1 December 2020).
  43. Atmospheric Correction Parameter Calculator. Available online: https://atmcorr.gsfc.nasa.gov/ (accessed on 30 August 2020).
  44. Earth Engine Data Catalog. Available online: https://developers.google.com/earth-engine/datasets/catalog/NASA_ASTER_GED_AG100_003?hl=en (accessed on 15 August 2020).
  45. Earth Engine Data Catalog. Available online: https://developers.google.com/earth-engine/datasets/catalog/LANDSAT_LE07_C01_T1_RT?hl=en (accessed on 15 August 2020).
  46. Sayler, K. Product Guide Landsat 4-7 Collection 1 (C1) Surface Reflectance (LEDAPS); Zanter, K., Ed.; USGS: Reston, VA, USA, 2020. [Google Scholar]
  47. Sayler, K. Product Guide Landsat 8 Collection 1 (C1) Land Surface Reflectance Code (LaSRC); Zanter, K., Ed.; USGS: Sioux Falls, SD, USA, 2020. [Google Scholar]
  48. Chander, G.; Markham, B.L.; Helder, D.L. Summary of current radiometric calibration coefficients for Landsat MSS, TM, ETM+, and EO-1 ALI sensors. Remote Sens. Environ. 2009, 113, 893–903. [Google Scholar] [CrossRef]
  49. Martins, J.; Trigo, I.; Bento, V.; da Camara, C. A Physically Constrained Calibration Database for Land Surface Temperature Using Infrared Retrieval Algorithms. Remote Sens. 2016, 8, 808. [Google Scholar] [CrossRef] [Green Version]
  50. Ji, L.; Senay, G.B.; Verdin, J.P. Evaluation of the global land data assimilation system (GLDAS) air temperature data products. JHM 2015, 16, 2463–2480. [Google Scholar] [CrossRef]
  51. Willmott, C.J. On the validation of models. Phys. Geogr. 1981, 2, 184–194. [Google Scholar] [CrossRef]
  52. McClain, E.P.; Pichel, W.G.; Walton, C.C. Comparative performance of AVHRR-based multichannel sea surface temperatures. J. Geophys. Res. Oceans. 1985, 90, 11587–11601. [Google Scholar] [CrossRef]
  53. Eom, J.; Park, W.; Syifa, M.; Lee, C.; Yoon, S. Monitoring Variation in Sea Surface Temperature in the Nakdong River Estuary, Korea, Using Multiple Satellite Images. J. Coast. Res. 2019, 90, 183–189. [Google Scholar]
  54. O’Sullivan, P.; Reynolds, C.S. The Lakes Handbook: Limnology and Limnetic Ecology, 2nd ed.; Blackwell Publishing Company: Malden, MA, USA, 2008; Volume 1, pp. 107–114. [Google Scholar]
  55. Rooney, G.G.; Lipzig, N.V.; Thiery, W. Estimating the effect of rainfall on the surface temperature of a tropical lake. Hydrol. Earth Syst. Sci. 2018, 22, 6357–6369. [Google Scholar]
  56. Piccolroaz, S.; Healey, N.C.; Lenters, J.D.; Schladow, S.G.; Hook, S.J.; Sahoo, G.B.; Toffolon, M. On the predictability of lake surface temperature using air temperature in a changing climate: A case study for Lake Tahoe (USA). Limnol. Oceanogr. 2018, 63, 243–261. [Google Scholar] [CrossRef] [Green Version]
  57. Piccolroaz, S. Prediction of lake surface temperature using the air2water model: Guidelines, challenges, and future perspectives. Adv. Oceanogr. Limnol. 2016, 7, 36–50. [Google Scholar] [CrossRef] [Green Version]
  58. Ptak, M.; Sojka, M.; Nowak, B. Characteristics of daily water temperature fluctuations in lake kierskie (West Poland). Quaest. Geogr. 2019, 38, 41–49. [Google Scholar] [CrossRef] [Green Version]
  59. Yang, K.; Yu, Z.; Luo, Y. Analysis on driving factors of lake surface water temperature for major lakes in Yunnan-Guizhou Plateau. Water Res. 2020, 184, 116018. [Google Scholar]
  60. Peña, M.A. Relationships between remotely sensed surface parameters associated with the urban heat sink formation in Santiago, Chile. Int. J. Remote Sens. 2008, 29, 4385–4404. [Google Scholar]
  61. Hala, E.; Nepravishta, F.; Panariti, A. The wind flow effects and high-rise buildings in urban spatial morphology. In Cities in Transitions, Proceedings of the 1st International Forum on Architecture and Urbanism, Tirana, Albania, 14–16 December 2017; La scuola di Pitagora Editrice: Napoli, Italy, 2019. [Google Scholar]
  62. Mittal, H.; Sharma, A.; Gairola, A. A review on the study of urban wind at the pedestrian level around buildings. J. Build. Eng. 2018, 18, 154–163. [Google Scholar] [CrossRef]
  63. Bharat, A.; Ahmed, A. S. Effects of high rise building complex on the wind flow patterns on surrounding urban pockets. Int. J. Eng. Res. Dev. 2012, 4, 21–26. [Google Scholar]
  64. Stetler, J.T.; Girdner, S.; Mack, J.; Winslow, L.A.; Leach, T.H.; Rose, K.C. Atmospheric stilling and warming air temperatures drive long-term changes in lake stratification in a large oligotrophic lake. Limnol. Oceanogr. 2021, 66, 954–964. [Google Scholar] [CrossRef]
  65. Crétaux, J.F.; Abarca-del-Río, R.; Bergé-Nguyen, M.; Arsen, A.; Drolon, V.; Clos, G.; Maisongrande, P. Lake Volume Monitoring from Space. Surv. Geophys. 2016, 37, 269–305. [Google Scholar]
  66. Crétaux, J.F.; Arsen, A.; Calmant, S.; Kouraev, A.; Vuglinski, V.; Bergé-Nguyen, M.; Gennero, M.C.; Nino, F.; Abarca Del Rio, R.; Cazenave, A.; et al. SOLS: A lake database to monitor in the Near Real Time water level and storage variations from remote sensing data. Adv. Space Res. 2011, 47, 1497–1507. [Google Scholar] [CrossRef]
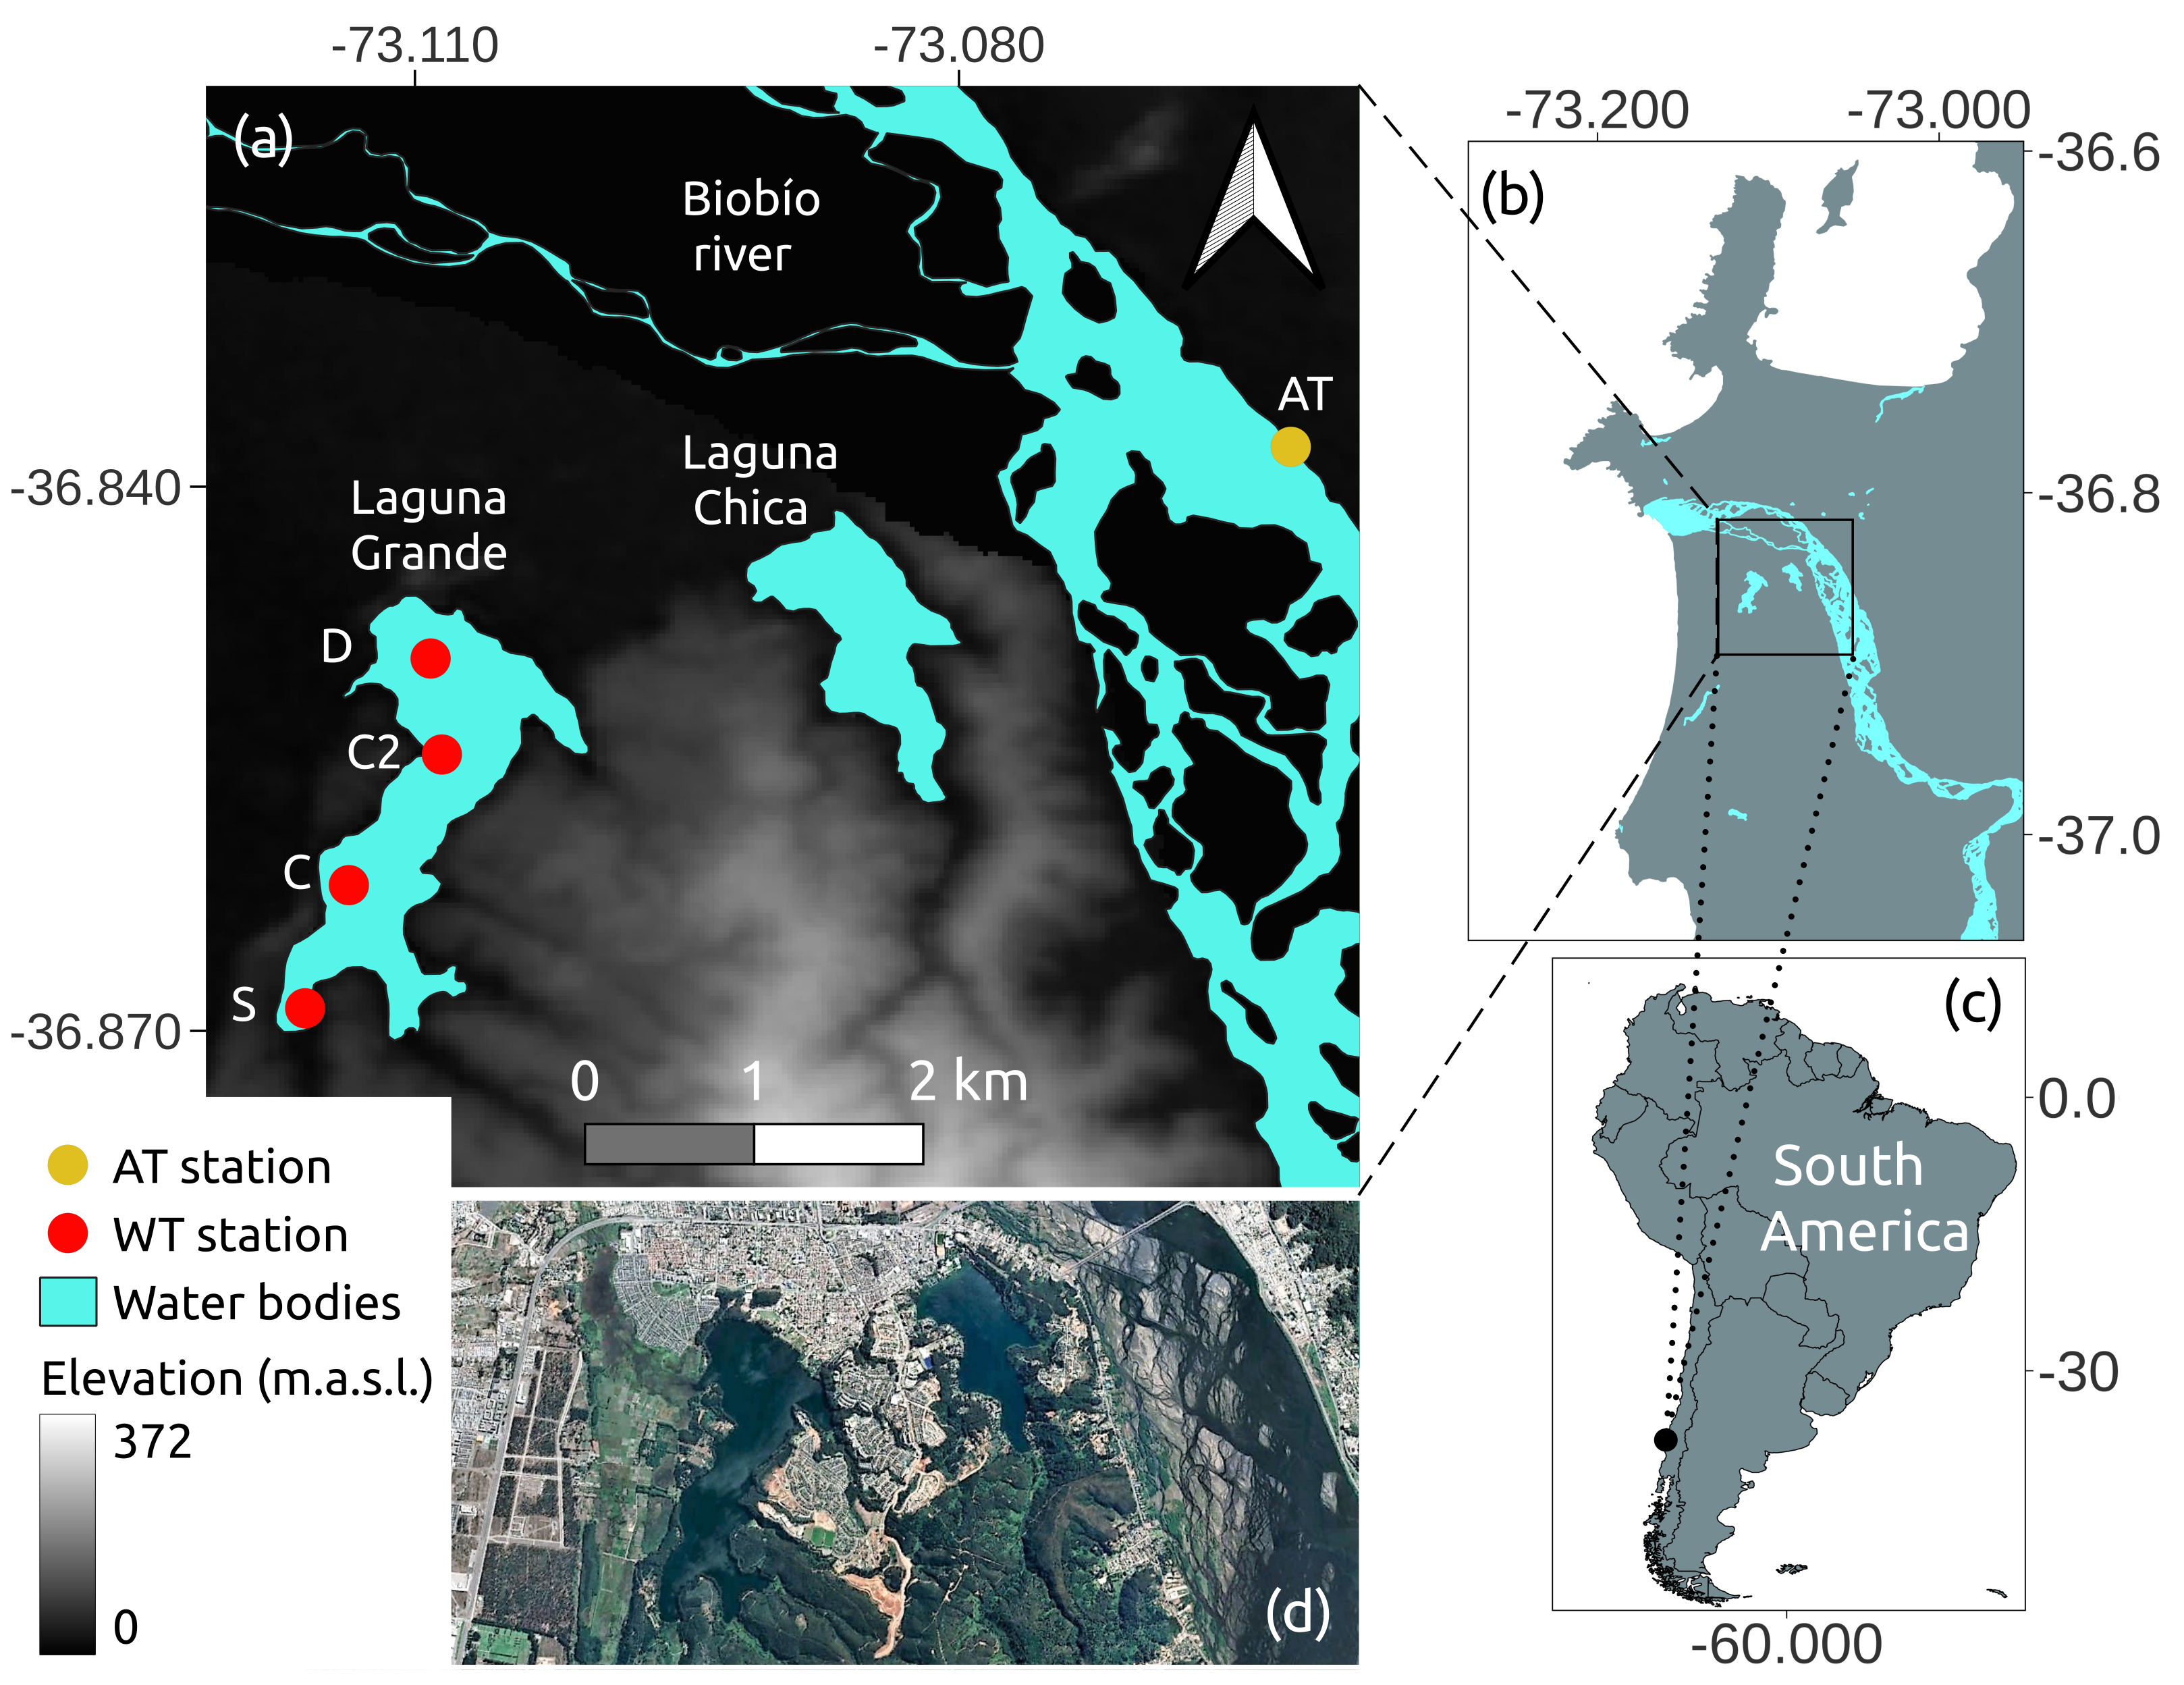
Figure 1. (a) Study lagoons. Water temperature (WT) stations (Desagüe (D), Centro (C), Sur (S) and Centro 2 (C2)) are represented by red dots. Water bodies are in cyan. Air temperature (AT) station is in yellow dot. (b) Zoom out of the study lagoons area. (c) South America. (d) Google Earth image of the study area.
Remotesensing 13 04544 g001
Figure 2. LSWT available data in sampling stations: Desagüe (WT D), Centro (WT C), Sur (WT S) and Centro 2 (WT C2). Air temperature near study area (AT).
Remotesensing 13 04544 g002
Figure 3. Work strategy flow chart. Within stage 1: preprocessing and six methods to retrieve LSWT series. Within stage 2: calibration of the LSWT series through a linear fit. Within stage 3: Extending the linear fit to a 2D × time LSWT field and building a climatology.
Remotesensing 13 04544 g003
Figure 4. Calibrated time series of LSWT (tM1c, tM2c, tM3c, tM4c, tM5c and tM6) and in situ series in Laguna Grande in Centro (C) station for the period (a) 2000–2010 and (b) 2010–2020. The dates of the images used from landsat 7 and 8 can be seen in black dots and red rhombuses, respectively. In situ data are in blue asterisks.
Remotesensing 13 04544 g004
Figure 5. (a) Average annual climatology of the studied lakes obtained from the M5 method applying a buffer of 30 m (in cyan). (b) Seasonal mean. Lagunas Grande and Chica de San Pedro to the left and right, respectively.
Remotesensing 13 04544 g005
Figure 6. Boxplot of the monthly climatology of the LSWT of San Pedro lagoons. (a) Laguna Grande and (b) Laguna Chica. Outliers in red.
Remotesensing 13 04544 g006
Table 1. Dimensions of the studied lakes [3].
PARAMETERL. CHICAL. GRANDE
Lake area (km 2 )0.821.55
Mean depth (m)10.38.1
Maximum depth (m)1713.5
Maximum length (km)1.92.7
Height (m.a.s.l.)54
Table 2. Available LSWT sample stations: Desagüe (D), Centro (C), Sur (S) and Centro 2 (C2). Seasonal samplings: 4 per year. (I) Used sample stations: D, C and S. Available data: LSWT in the period 1988–2013, 28% of missing data. Used data: LSWT in the period 2000–2009, 7.5% of missing data. (II) Centro 2 sample station: available LSWT data in the period 2014–2016, 75% of missing data. Available air temperature station: AT. Available data: mean daily temperature in the period 1979–2016, 0% of missing data.
StationCoordinates
(Decimal Degrees)
Period
D−36.8495, −73.1091
C−36.8620, −73.11361988–2013
S−36.8688, −73.1161
C2−36.8582, −73.11052014–2016
AT−36.8378, −73.06171979–2016
Table 3. Satellite data. Available and used period. From the latter: possible and resulting images after Tier 1 and cloud cover <30% filters.
Image CollectionAvailable
Period
(DD/MM/YYYY)
Used Period
(DD/MM/YYYY)
Possible ImagesTier 1 ImagesImages
Filtered
by Clouds
Min and Max
of Images
per Year
L7 Tier 1
L7 Surface Reflectance Tier 1
15/4/1999
–present
1/1/2000–31/12/2009
1/1/2000–7/10/2020
205
401
128
298
76
168
4 and
12
L8 Tier 1
L8 Surface Reflectance Tier 1
11/2/2013
–present
11/2/2013–13/9/20201731468510 and
13
Table 4. Required input of six methods (M1 to M6).
MethodInputReference
M1Atmospheric parameters
Water emissivity
L7 Tier 1 (Table 3)
[43]
Equation (6) or [44]
[45]
M2L8 Tier 1 (Table 3)[23]
M3L8 Tier 1 (Table 3)[23]
M4L7 Surface Reflectance Tier 1 (Table 3)[46]
M5L8 Surface Reflectance Tier 1 (Table 3)[47]
M6Atmospheric parámeters
Collection L7 Tier 1 (Table 3)
GEE code provided by [28]
[45]
Table 5. Available data sets to build climatology: (i) tM1c (2000–2009), 76 images; (ii) tM4c or tM6 (2000–2020), 168 images y; (iii) tM2c, tM3c or tM5c (2013–2020), 85 images. Number of images per month: mean, minimum (Min.) and maximum (Max.) values.
Data SetMean Images per Month (Month)Min. Images per Month (Month)Max. Images per Month (Month)
i72 (June)13 (February)
ii146 (June)26 (February)
iii74 (October)9 (April, December)
Table 6. Mean ( μ ) and standard desviation ( σ ) of LSWT time series before (Bf cal) and after (Af cal) calibration. Average values at Laguna Grande sampling stations (St.: D, C y S).
Time SeriePeriodBf Cal Af Cal σ (°C)
μ (°C)
in situ2000–2009 16.18 4.34
tM116.54 16.183.96
tM22013–202015.22 3.90
tM38.67 16.004.00
tM514.43 3.89
tM42000–202015.22 16.063.90
tM616.98 16.364.29
Table 7. Pairs of series to be calibrated with their respective statistics (bias, Willmott’s index of agreement (d), root mean square error (RMSE) and square of the correlation coefficient ( R 2 )). Average values over the three sampling stations (Desagüe (D), Centro (C) and Sur (S)) of Laguna Grande de San Pedro. Before and after calibration.
Time SerieComparisson PeriodR 2 Before CalibrationAfter Calibration
RMSEBiasdBiasd
in situ–tM12000–20090.742.08−0.360.92 0.92
in situ–tM40.712.351.250.8800.91
in situ–tM60.672.53−0.300.90 0.91
tM4c–tM22013–20200.871.750.770.95 0.96
tM4c–tM30.897.467.330.6100.97
tM4c–tM50.872.211.570.93 0.96
Publisher’s Note: MDPI stays neutral with regard to jurisdictional claims in published maps and institutional affiliations.