Abstract
Under the circumstance of global climate change, the evolution of thermal environments has attracted more attention, for which the surface urban heat island (SUHI) is one of the major concerns. In this research, we focused on the spatiotemporal patterns for two “stove cities” in China, i.e., Wuhan and Nanchang, based on the long-term (1984–2018) and fine-scale (Landsat-like) series of satellite images. The results showed opposite spatiotemporal patterns for the two cities, even though they were both widely concerned to be the hottest cities. No matter which definition of surface urban heat island intensity (SUHII) was selected, Nanchang presented higher and more fluctuating SUHII than Wuhan, with a relatively higher land surface temperature (LST) of the urban area and lower LST of the rural area in Nanchang, especially in recent years. For the spatial pattern, the highest LST center (i.e., the SUHI) has expanded obviously for the past 35 years in Nanchang. For Wuhan, the LST in SUHI has gone through a trend of a relatively increase at first, followed by a decrease. For the temporal pattern, an increasing trend of LST could be detected in Nanchang. However, the LST in Wuhan presented a slightly decreasing trend. Moreover, the SUHII evolution in Nanchang decreased at first then increased, while Wuhan showed a slight increasing trend at first, followed by a decrease for SUHII. In addition, different SUHII definitions would not affect the spatial pattern and temporal trend of SUHI, but only controlled the exact SUHII value, especially in those years with extreme weather.
1. Introduction
Urbanization is one of the most important global effects of human forces on the Earth’s surface [1,2,3,4], resulting in the changes of thermal properties (e.g., surface radiation and humidity) over urban areas [5,6,7]. To discover the thermal environment changes in urban area, the urban heat island (UHI) is recognized as a well-known perspective [8,9], which can be expressed as the air temperature or land surface temperature in urban area being higher than that in the surrounding rural area [10,11,12,13]. The UHI also has a great impact on the environment (e.g., climate, atmospheric conditions and biodiversity) [3,14,15,16,17,18] and human beings (e.g., refrigeration energy consumption, increase in morbidity and mortality) [19,20,21]; therefore, it has received world-wide attention.
A UHI caused by LST is termed a surface urban heat island (SUHI). Because of the continuous coverage and easy access of satellite images [22,23,24], SUHIs have been widely studied with the help of satellite products. For long-term monitoring, coarse-resolution LST datasets were mostly utilized, such as the Advanced Very High Resolution Radiometer (AVHRR) data [25] and the Moderate Resolution Imaging Spectroradiometer (MODIS) MOD11A1 or MOD11A2 products [22,23,26,27,28,29,30,31]. The literature helps us understand the general situation of SUHI at a resolution of 1 km. However, it has been proved that much heterogeneity in neighborhoods would be lost at a resolution of 1 km [32]. To explore more elaborate patterns for SUHI, LST series with a resolution higher than 1 km are needed. Generally, studies with high-resolution LSTs (e.g., Landsat, ASTER) have been conducted in some cities [6,33,34,35,36], but they were mostly carried out every few years so that the SUHI information was missed in some years. Therefore, to fill in these gaps, in this study, we focused on the long-term and fine-scale monitoring of SUHI.
Generally speaking, current research has discussed the SUHI patterns from different perspectives. For example, Imhoff et al. [27] and Zhang et al. [28] interpreted the correlation between SUHII and ecological control across continental USA, Zhao et al. [31] discussed the strong contributions of the local background climate to SUHII across continental USA, Zhou et al. [26,29] described the spatiotemporal patterns of SUHII along with the variation of some potential drivers in China, Peng et al. [23] figured out the SUHII patterns and discovered the relationship between SUHII and several features across 419 cities world-wide and Clinton and Gong [22] detected the global SUHII changes corresponding to different definitions of rural area, land cover changes and geolocations differences. However, we could find two inadequacies in these papers: firstly, the comparisons between cities were not well climate-controlled. In other words, the papers about the contrast of the thermal environments for those cities with similar climate backgrounds were still insufficient. Secondly, the definition of SUHII was not uniform in the literature, which resulted in different SUHII across different papers, even though the same study area was used. The discussion of SUHII defined by two different rural areas also confirmed that a large difference existed between different SUHII definitions [37].
Therefore, to detect the contrast for cities under the similar climate background, and to explore the error brought by different SUHII definitions, we carried out long-term and fine-scale comparisons for different SUHII definitions, taking the cities Nanchang and Wuhan as the study area. Nanchang and Wuhan have gone through rapid urban expansion, and they have both been regarded as “stove cities” for a long time. In addition, in the current SUHII studies for Wuhan and Nanchang, we could not conclude a uniform SUHII due to the different SUHII definitions. For example, Yao et al. [38] claimed that the average SUHII on a summer day in Nanchang is 3.37K, Zhou et al. measured the average SUHII on a summer day in Nanchang as around 1–2K [26] and Wu et al. found the SUHII in Nanchang to be around 3.60–6.94K [39]. The large difference among the papers informed us that it was not well discussed how the long-term and fine-scale SUHII is controlled by different SUHII definitions. Hence, the purpose of this study is to investigate spatiotemporal patterns for different SUHIIs and figure out how the SUHII acts in different cities with similar climate backgrounds. With the help of Landsat images, MOD11A1 product and AVHRR surface reflectance product, we were able to generate the long-term (1984–2018) and fine-scale (Landsat-like) LST series by spatiotemporal fusion. Based on the generated LST series, the SUHII for each year could be obtained; exhaustive discussions are described in this paper to present the thermal environment evolution in Nanchang and Wuhan.
2. Study Region and Data
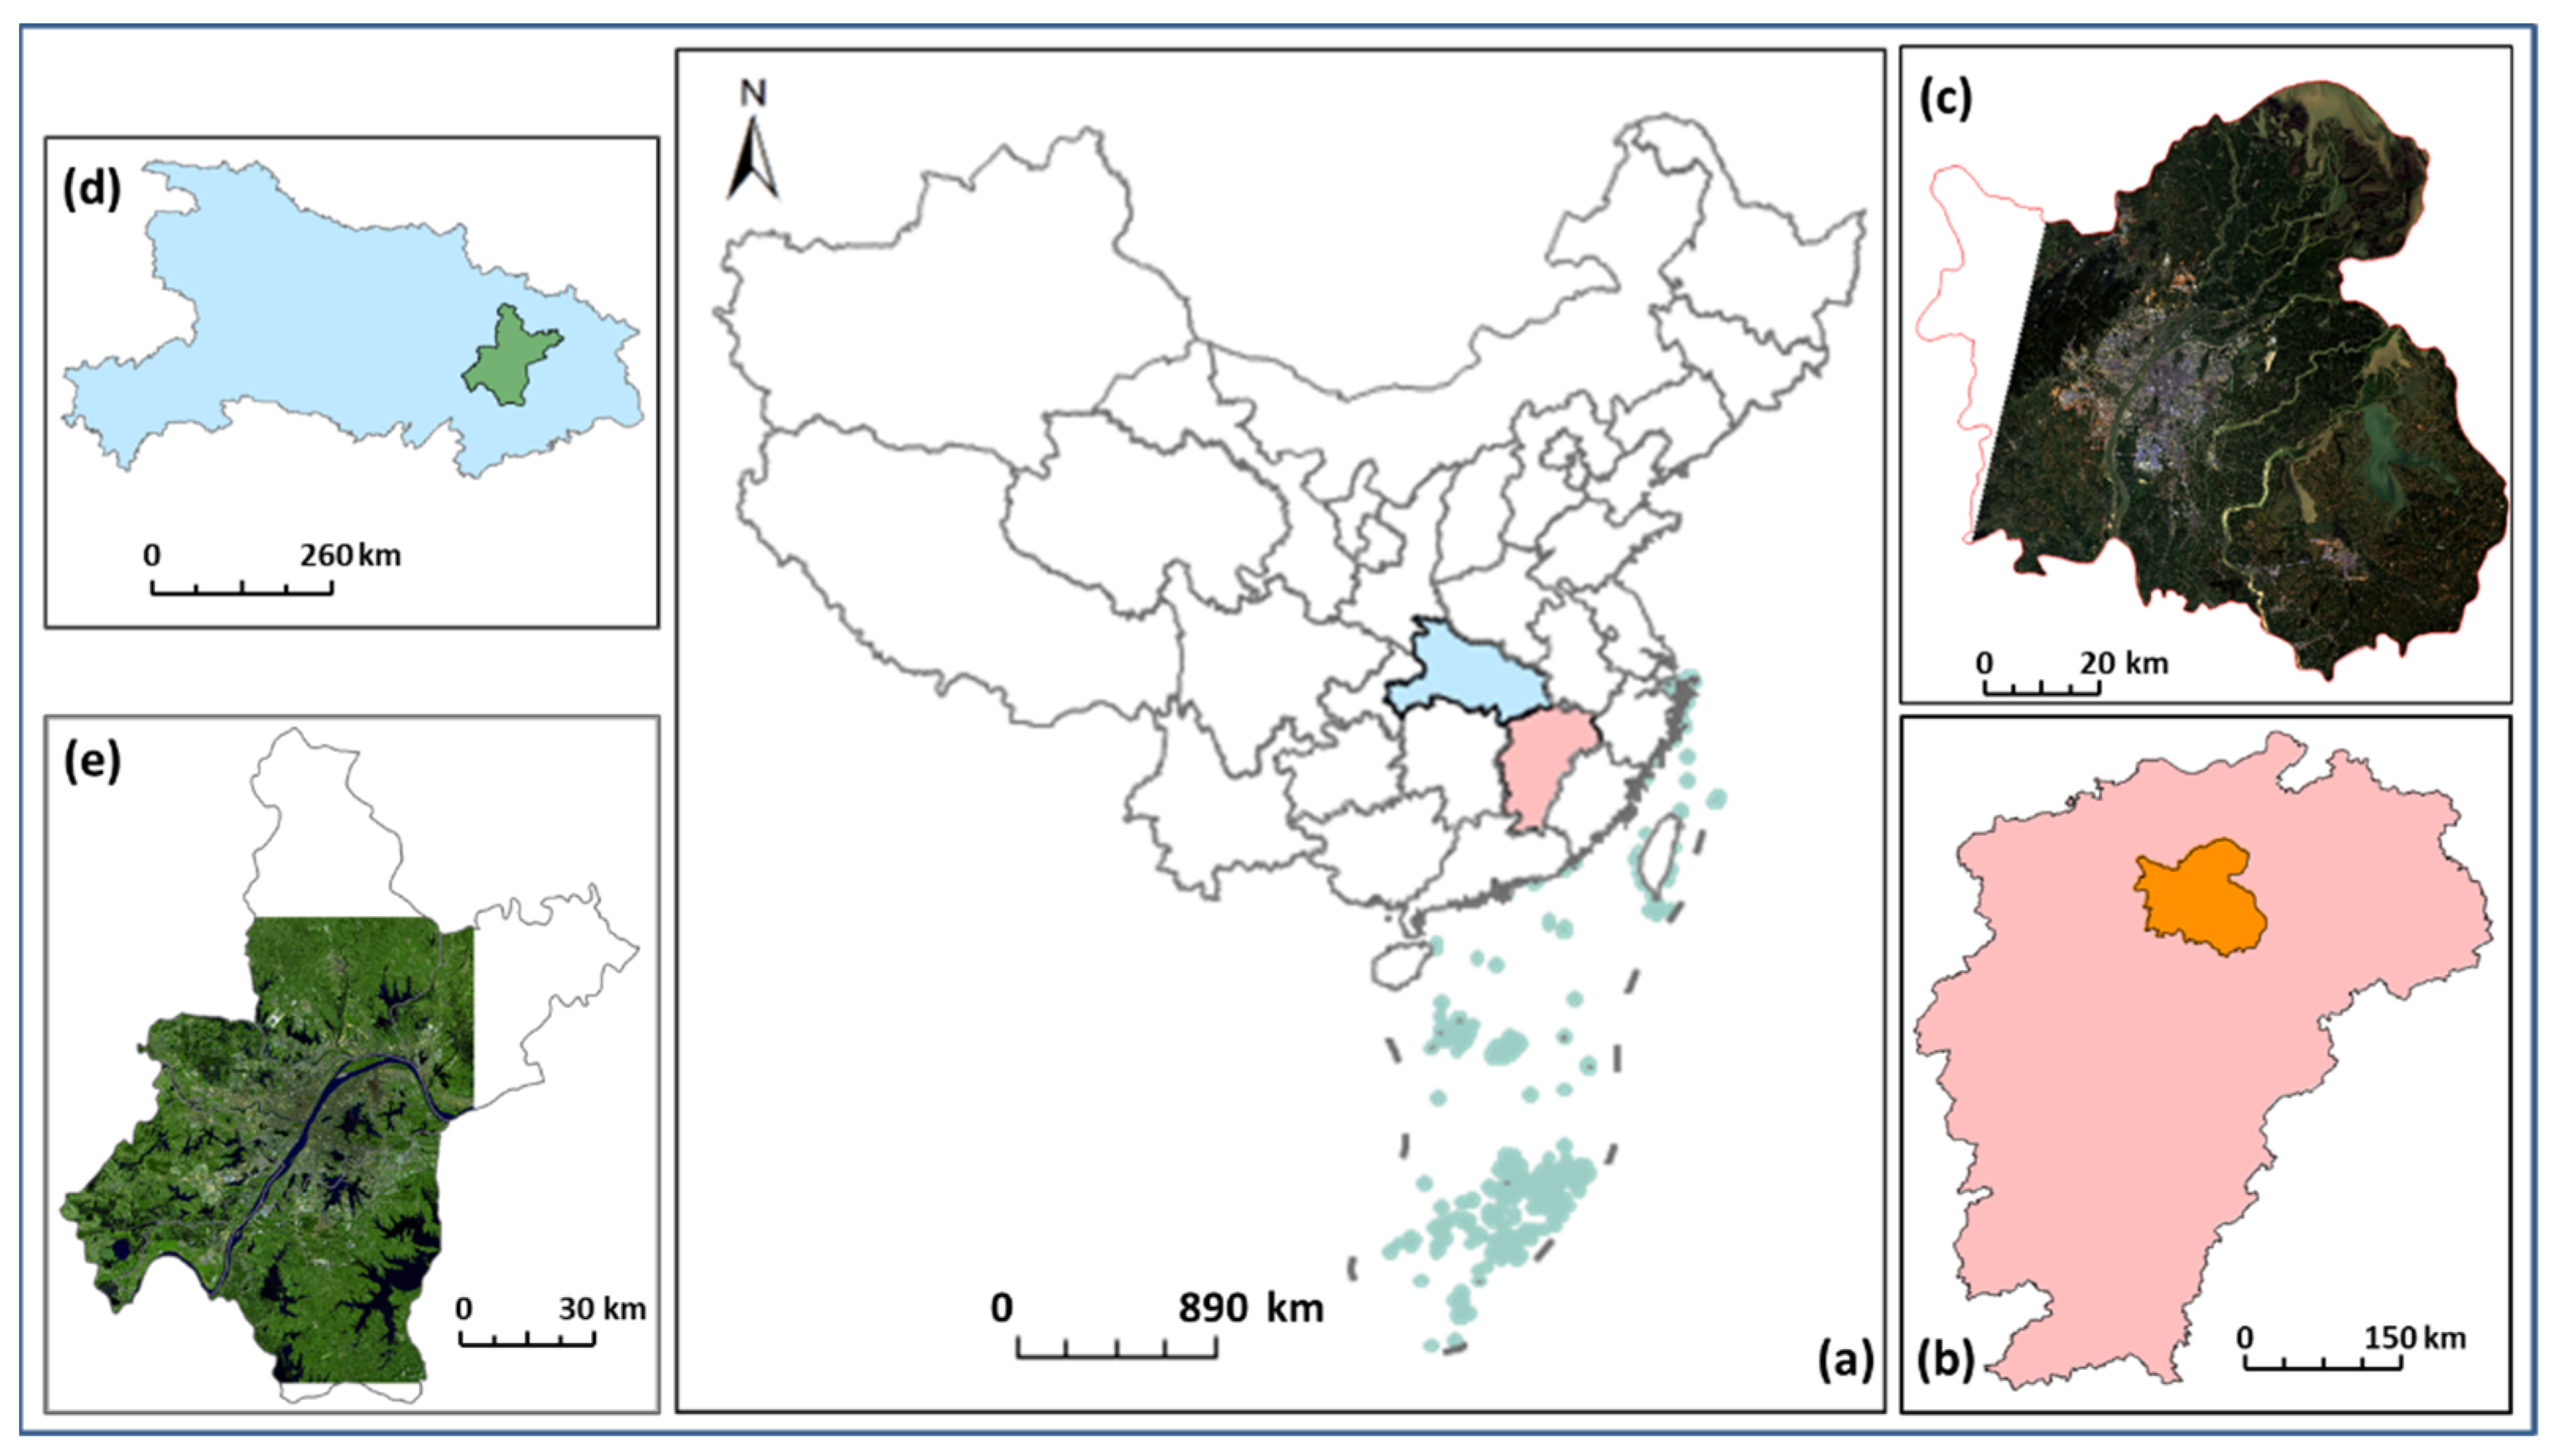
Nanchang and Wuhan were selected as the study area in this research. Nanchang is the capital city of Jiangxi province (Figure 1), and is located between 115°27′ E–116°35′ E, and 28°10′ N–29°11′ N, with a total administrative area around 7402 km2. Wuhan is the capital city of Hubei province, and is located between 113°41′ E–115°05′ E, and 29°58′ N–31°22′ N, with a total administrative area around 8494 km2. Affected by a subtropical monsoon climate, Nanchang and Wuhan experience hot summers. According to the meteorological data by the National Climate Center, Nanchang and Wuhan have been regarded as some of the hottest “stove cities” in China up to now, and could be considered as the ideal areas to study SUHI.
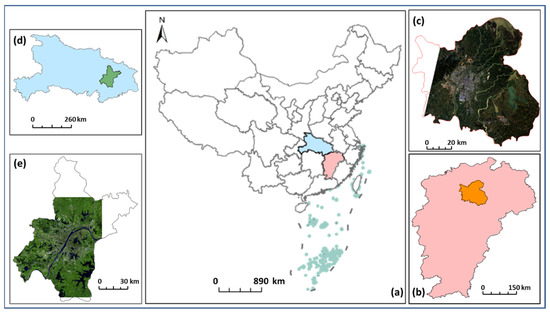
Figure 1.
The study area. (a) The location of Jiangxi and Hubei province in China; (b) the location of Nanchang in Jiangxi province; (c) the Landsat image used in this research for Nanchang, from a Landsat 8 OLI image from 09/14/2017; (d) the location of Wuhan in Hubei province; (e) the Landsat image used in this research for Wuhan, from a Landsat 8 OLI image from 15 September 2018.
To generate the LST series for SUHI monitoring, two main sources of data were needed (Table 1). (1) Satellite data. Cloud-free Landsat images (Landsat 5/8) were obtained over several months during 1984–2018, covering 91.4% of Nanchang and 80% of Wuhan, from the United States Geological Survey (USGS) website (http://glovis.usgs.gov/ (accessed on 30 September 2020)). The spatial resolution for different Landsat thermal bands used in this research was 120 m (Landsat-5 TM), 60 m (Landsat-7 ETM+) and 100 m (Landsat-8 TIRS), respectively, and they were all resampled into 30 m resolution when downloaded. In general, 26 Landsat images were collected for Nanchang, and 30 Landsat images were collected for Wuhan, with the time span between two adjacent years less than three years. From 2000 to 2018, the MOD11A1 product corresponds to the dates of the cloud-free Landsat images, covering the whole summer (1 June to 31 August) were obtained from the Level-1 and Atmosphere Archive & Distribution System Distributed Active Archive Center (LAADS DAAC) website (https://ladsweb.modaps.eosdis.nasa.gov/ (accessed on 30 September 2020)). The spatial resolution for the MOD11A1 product was 1000 m. The AVHRR surface reflectance product (version 4) covering the whole summer were collected from the National Oceanic & Atmospheric Administration (NOAA) Climate Data Record (CDR) from the NOAA website (https://data.nodc.noaa.gov/ (accessed on 30 September 2020)). The spatial resolution for AVHRR surface reflectance product was 0.05 degrees, which included surface reflectance for the red band and near-infrared band, and brightness temperature for the mid-infrared band and thermal infrared bands. From 1984 to 1999, the AVHRR data covering the whole summer and corresponding to the dates of cloud-free Landsat images were also collected. Global Multi-resolution Terrain Elevation Data 2010 (GMTED2010) were obtained from The Environment for Visualizing Images software (ENVI), with a spatial resolution of 30 s [40]. (2) Reanalysis data. The water vapor for LST inversion was collected from the National Centers for Environmental Prediction (NCEP)/National Center for Atmospheric Research (NCAR) reanalysis dataset [41], with a spatial resolution of 2.5 degrees.

Table 1.
Data used in this research.
3. Materials and Methods
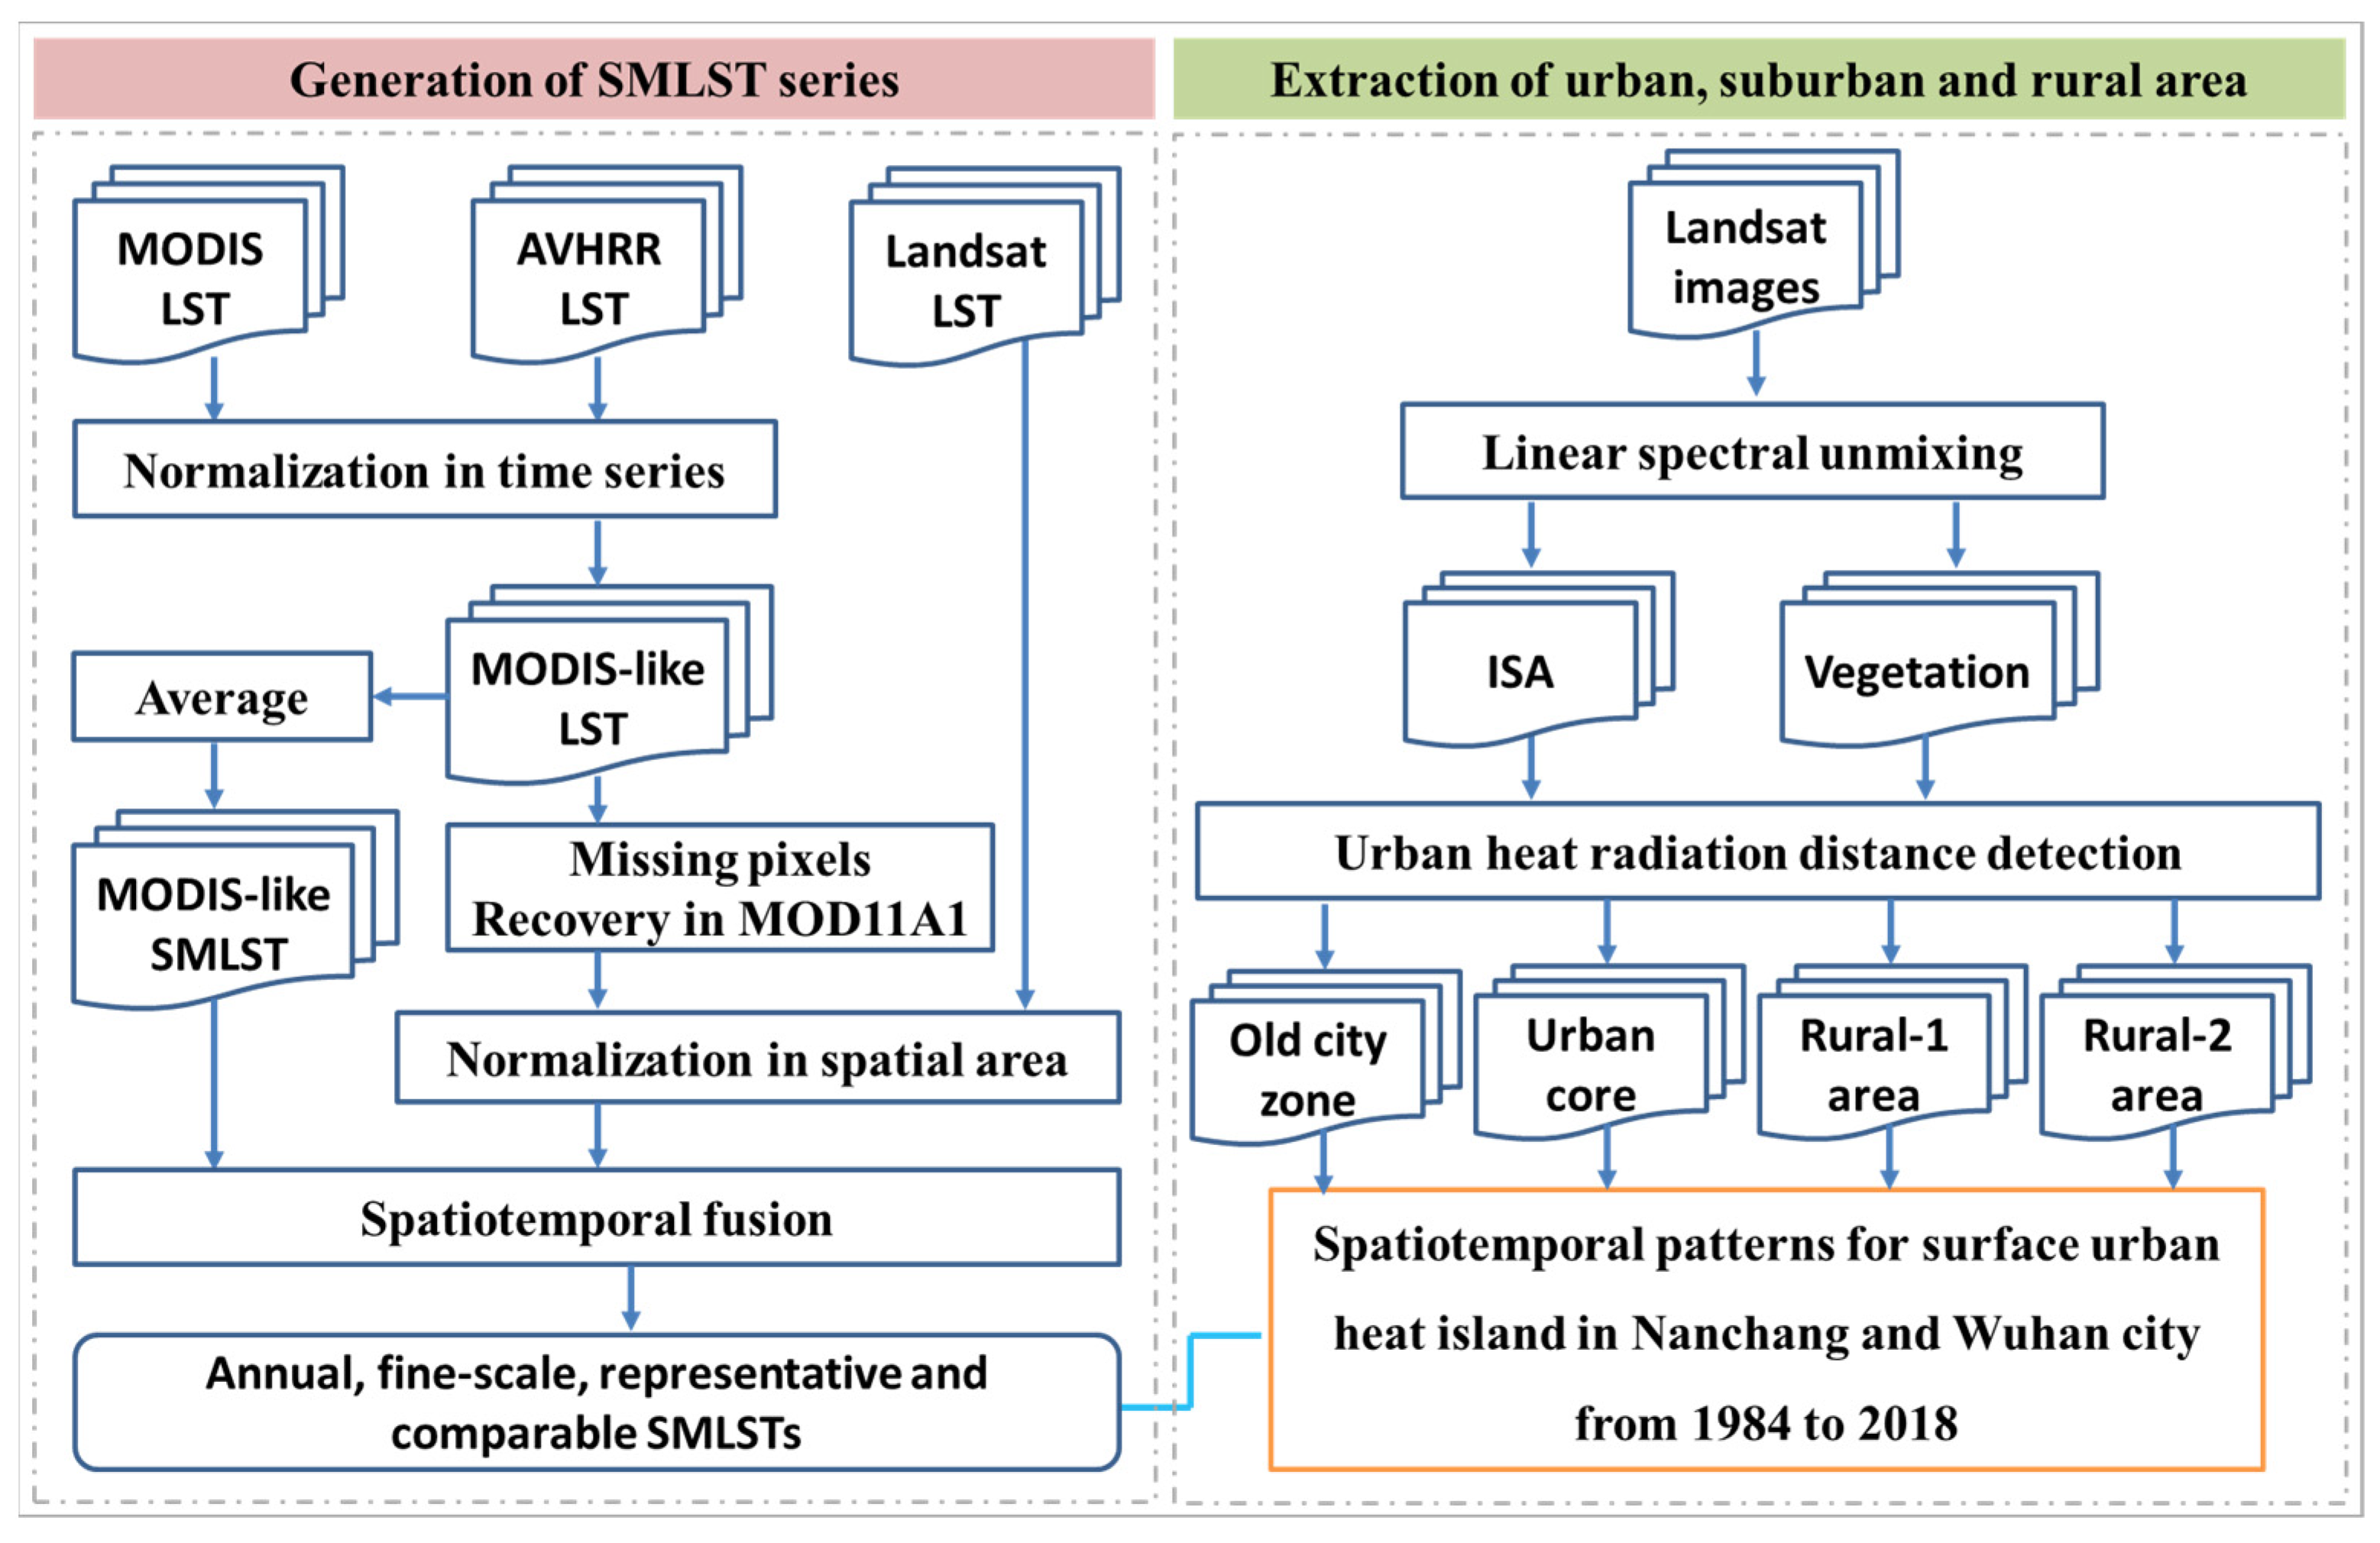
In order to monitor the spatiotemporal patterns for SUHII in Nanchang and Wuhan, a long-term and fine-scale series for LST was required. A long-term and fine-scale LST generation procedure has been proposed in our previous research [42]. In detail, to meet the demand of high spatial and temporal resolution, we generated the long-term and fine-scale summer mean LST (SMLST) by spatiotemporal fusion. Furthermore, to compare the difference between several definitions of SUHII, the OCZ, UC, and rural area for Nanchang and Wuhan were extracted to gain the LST difference (i.e., SUHII). To generate a more precise extent for those areas, a linear spectral mixture analysis (LSMA) method was involved [43]. The flowchart of the whole method is shown in Figure 2. The details are discussed in the following sections.
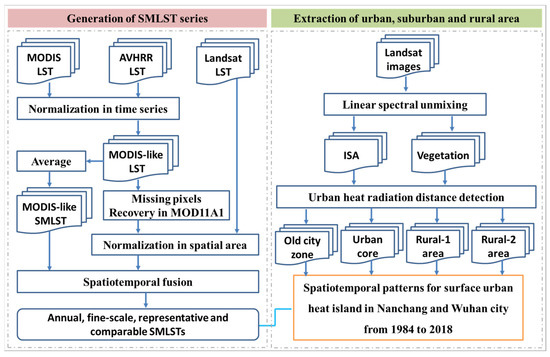
Figure 2.
The workflow for this research.
3.1. Generation of Summer Mean Surface Temperature Series
The LST inversion was first conducted in Landsat and AVHRR data. Briefly, after radiation calibration and atmospheric correction by the Fast Line-of-sight Atmospheric Analysis of Spectral Hypercubes (FLAASH), the Landsat images were inversed into LST by single-channel LST inversion method, for which only the TOA radiance, the emissivity and the water vapor were needed [34,35,44,45,46,47]. In addition, a simple split-window LST algorithm was applied to retrieve AVHRR LST, which only required the brightness temperature and emissivity for two thermal infrared bands of AVHRR product [48,49].
Based on the inversed LSTs, a spatiotemporal fusion model was utilized to generate a series of LSTs with high spatiotemporal resolution. In detail, we normalized the LST between AVHRR LST and MODIS LST by robust fitting with Huber M-estimator (Li et al., 2014) to produce a uniform MODIS-like dataset. Next, the MODIS-like images were averaged for the whole summer to obtain a representative SMLST for each summer. In the meantime, a linear regression was conducted between the Landsat LST and the MODIS-like LST to reduce the difference between different sensors. Finally, the normalized Landsat LST, MODIS-like LST and MODIS-like SMLST were put into the spatial and temporal nonlocal filter-based data fusion model (STNLFFM, software downlink: http://sendimage.whu.edu.cn (accessed on 30 September 2020)) [50]. The reference pairs and target image are shown in Table 2. Thus, the representative, comparable and high spatiotemporal resolution SMLST series for Nanchang and Wuhan were generated.

Table 2.
Reference LSTs and target LSTs for spatiotemporal fusion in Nanchang and Wuhan.
3.2. Calculation of the Surface Urban Heat Island Intensity
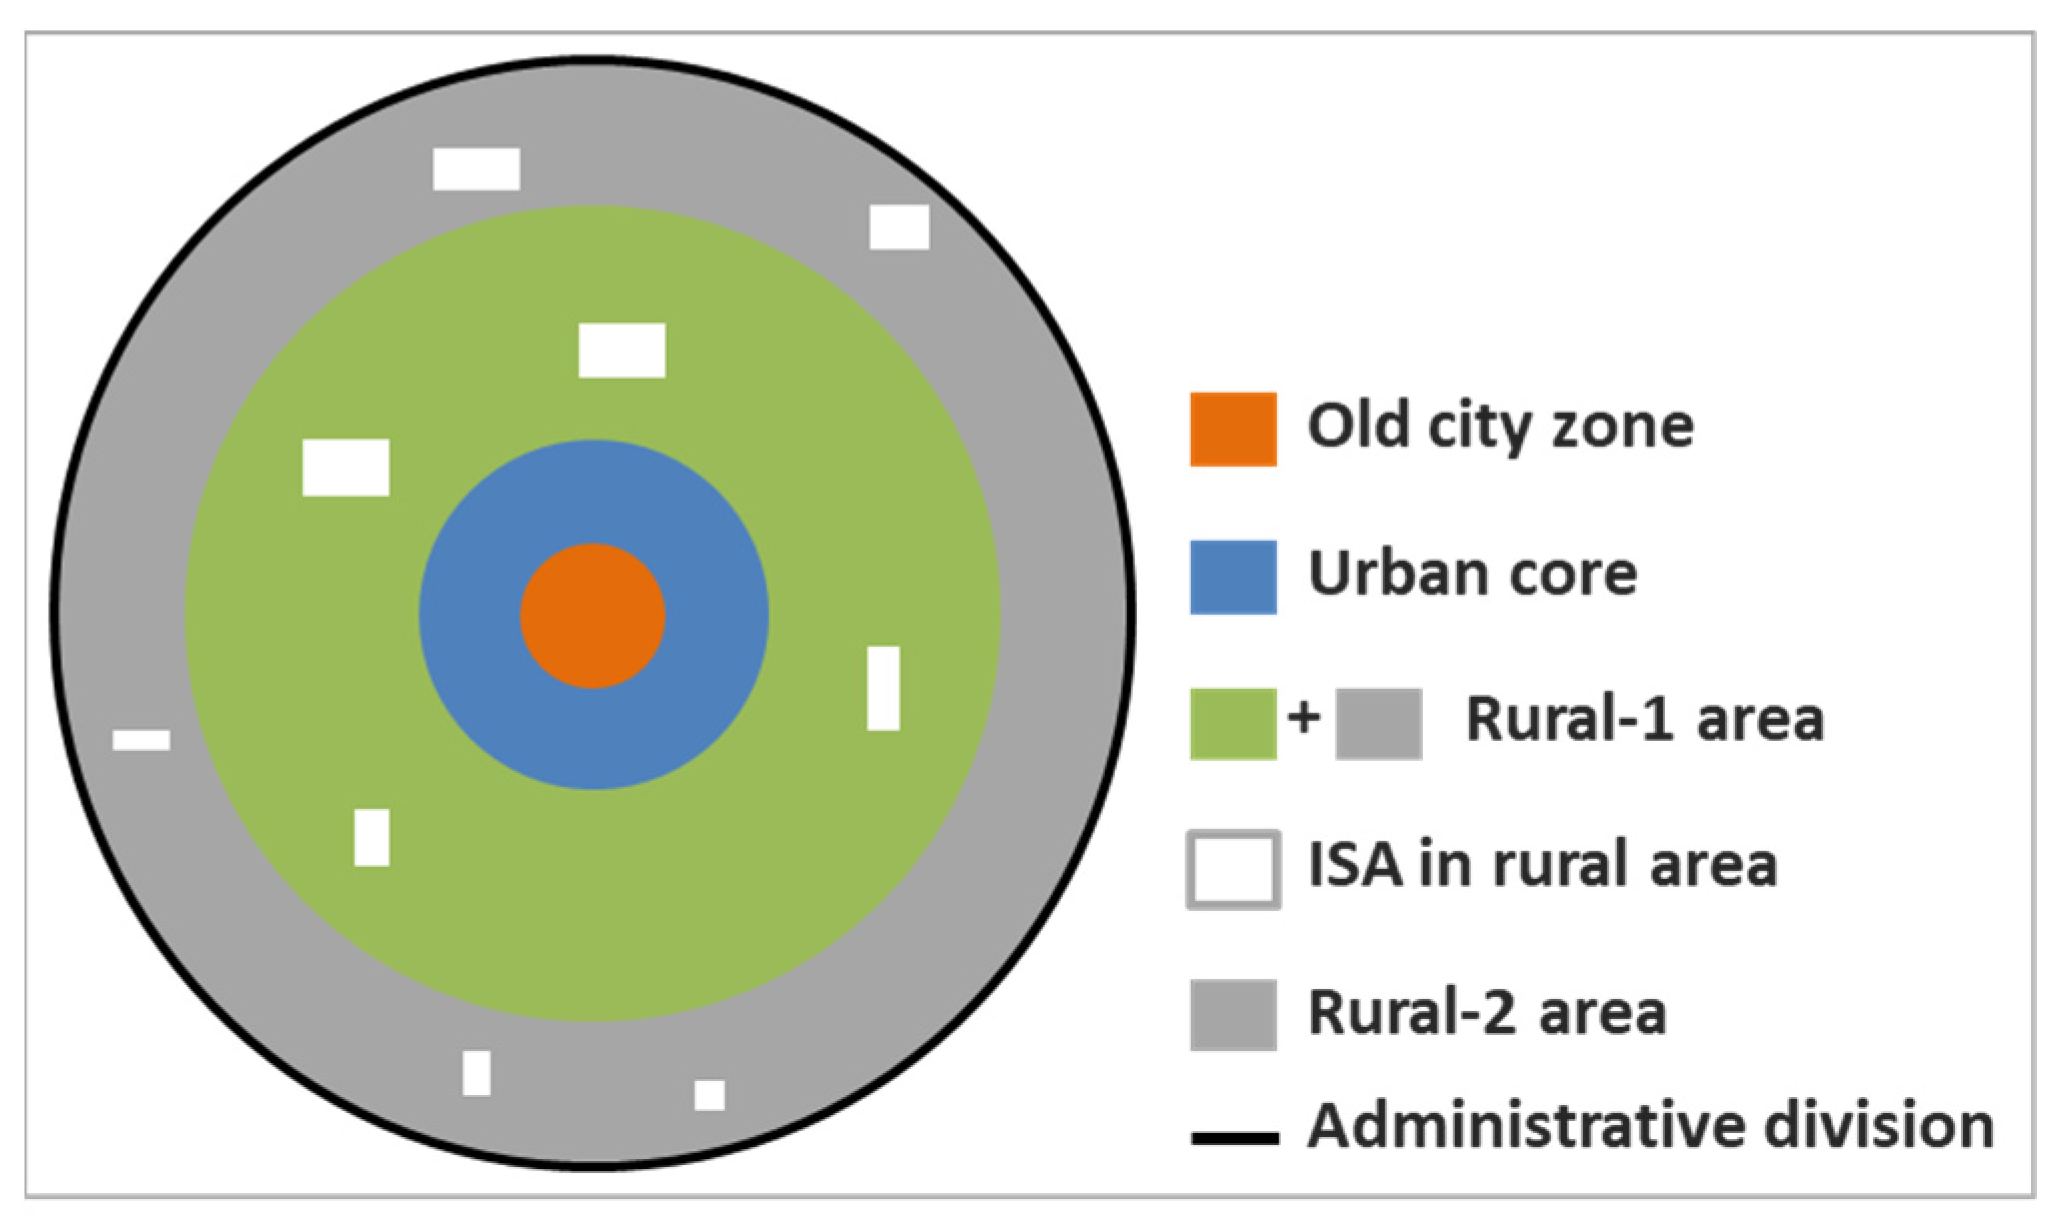
The SUHII was widely defined as the LST difference between urban and rural areas (Equation (1)). Thus, the distinction of “urban” and “rural” was of great importance. In this paper, we attempted to discover how different SUHII definitions affect the SUHII pattern. According to the current studies, the urban area could be defined as: (1) the old city zone [6,23,38] and (2) the urban core [26,51,52]. The rural area could be defined as: (1) the pervious surface outside the urban core within the administrative district [6,53] (Rural-1) and (2) buffers far from urban core [27,28,51] (Rural-2). Therefore, we used those two urban extents and those two rural areas in this research (Figure 3), and finally, four SUHII could be gained. The details for the extraction of these regions were discussed as follows:
where ALST (urban) represents the average LST in urban areas and ALST (rural) is the average LST in rural areas. Specifically, the water body is excluded from the SUHII calculation. For more information on water body exclusion, we refer to our previous research [54].
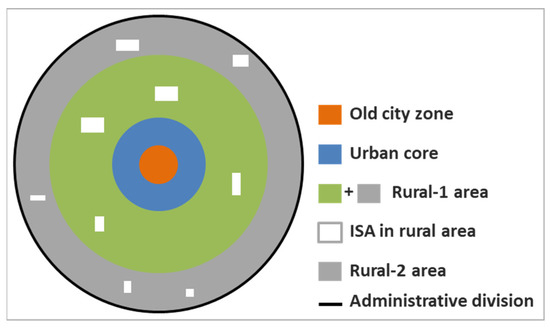
Figure 3.
Spatial location for the research regions.
Therefore, we could obtain four SUHIIs in this research: (1) LST in OCZ subtracted the LST in Rural-1 (SUHII1); (2) LST in OCZ subtracted the LST in Rural-2 (SUHII2); (3) LST in UC subtracted the LST in Rural-1 (SUHII3); (4) LST in UC subtracted the LST in Rural-2 (SUHII4). The temporal trend of SUHII for the past three decades was estimated by a Mann–Kendall test [55,56].
3.2.1. Urban Area Extraction
In this manuscript, we extracted two urban extents: OCZ and UC. In practice, the OCZ was defined as the district which was consistently urban for the past three decades. For Nanchang and Wuhan, the urban core in 1986 and 1987 was selected as the OCZ, respectively. The UC was defined as the city extent for each year. According to our previous research [54], we utilized LSMA to extract impervious surface area (ISA) for each year with the assistance of Landsat data. Next, the extracted ISA was aggregated into UC by city cluster algorithm [23,57,58]. After the exclusion of some misclassifications, the UC for Nanchang and Wuhan in each year was extracted. The urban area extraction part was done in our previous research [54].
3.2.2. Rural Area Extraction
In this paper, we extracted two rural areas: the pervious surface outside the urban core (Rural-1 area) and buffers far from the urban core (Rural-2 area). In practice, by excluding all the ISAs and water bodies within the administrative district, we could obtain the rural-1 area.
For the rural-2 area, the most important point was how to detect the suitable distance away from the urban core. It is well known that the extent of SUHI is generally greater than the urban area size [30,59,60]. In other words, there exists a district outside the urban area which was still influenced by the urban heating effect. Thus, there should be a maximum distance affected by urban heating. This maximum distance was considered as the urban heat island footprint (UHIF) [60,61,62]. Theoretically, the LST would decrease as the distance to the urban area became longer but within the UHIF; beyond the UHIF, due to the uniform climate and homogeneous land cover (mostly vegetation) in the rural area, the LST would be relatively stable, even though the distance to urban area still increased. Hence, if we generated different buffers surrounding the urban area and recorded the average LST for each buffer, the LST evolution with the increase of the distance to the urban area would present as a decrease at first, which then levels off. The breakpoint at which the trend for LST changes from decreasing to stable was defined as the UHIF. In practice, we generated 21 rings for each urban area in this research. In detail, for each urban area, we generated its 1 km buffer to 21 km buffer (increased by 1 km) within the administrative division. Next, the area within the 1 km buffer can be marked as the first ring, the area between the 1 km buffer and 2 km buffer would be marked as the second ring and so forth. An example can be seen in Figure 4. Thus, we could find that the UHIF for Nanchang in 2017 was 9 km.

Figure 4.
The urban heat radiation distance for Nanchang in 2017. (a) The spatial location for each buffer in Nanchang. (b) The average LST for each buffer in Nanchang.
Therefore, the rural-2 area in this research could be considered as the district consistently unaffected by urban heating. Thus, it should meet the following conditions: (1) the rural-2 area located within the administrative division, (2) the land cover in the rural-2 area should be pervious surface (ISAs and water bodies excluded) and (3) the rural-2 area was beyond the UHIF. In practice, the area between the UHIF boundary and the administrative division boundary was considered as the extent of the rural-2 area for each year. Particularly, an elevation threshold was set to eliminate the elevation effect between the urban and rural area. In detail, the maximum and minimum elevation of the urban area (OCZ and UC), extracted with the help of GMTED2010, were set as the threshold for the rural (Rural-1 and Rural-2) elevation. Those pixels with an elevation higher than the maximum of urban elevation or lower than the minimum of urban elevation were excluded from the rural area.
4. Results
4.1. Temporal Evolution for Surface Urban Heat Island
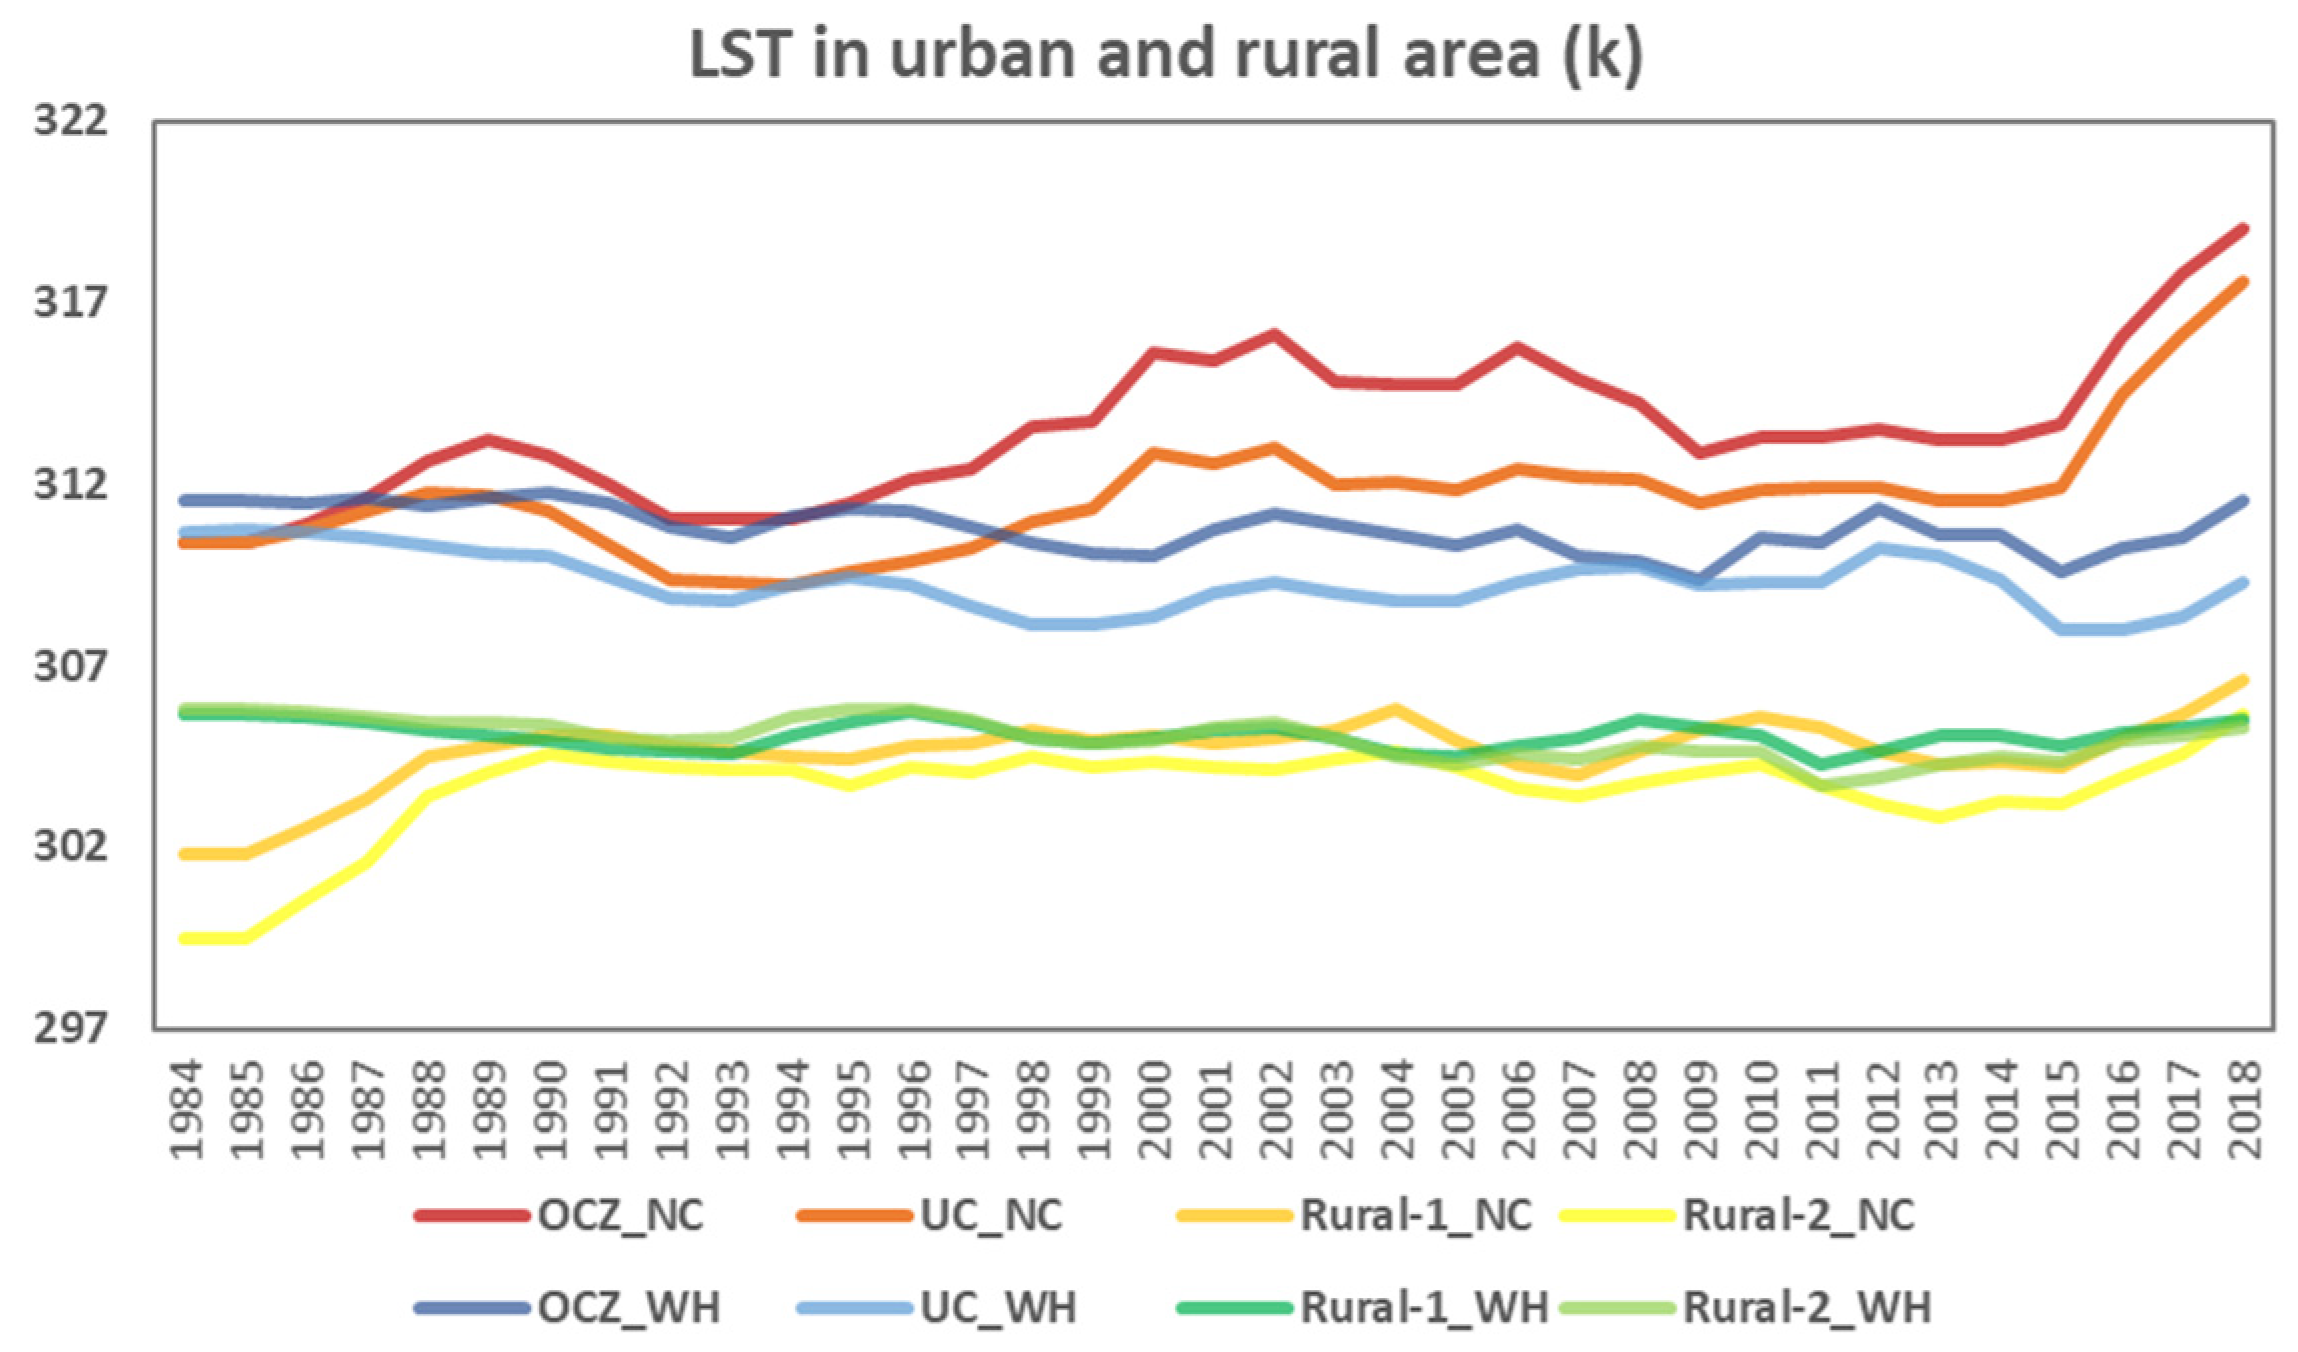
Based on the methods above, the long-term and fine-scale series of SMLSTs were gained for Nanchang and Wuhan. For Nanchang, the LST averaging from 1984 to 2018 for OCZ, UC, Rural-1 and Rural-2 was 313.50K, 311.69K, 304.62K and 303.60K, respectively. Thus, we could find that the OCZ was the area for highest LST, and the area less affected by UHI (Rural-2) would present a lower LST. For Wuhan, the LST averaging from 1984 to 2018 for OCZ, UC, Rural-1 and Rural-2 was 310.80K, 309.32K, 305.10K and 305.01K, respectively. Similar conclusions could be drawn that the LST in OCZ was also the highest, and the LST in Rural-2 was also the lowest.
The long-term temporal trends for LST in the OCZ, UC, Rural-1 and Rural-2 areas are shown in Figure 5. For Nanchang, it was easy to detect that the LST in OCZ was higher than the LST in UC in the whole time series, and the LST in the Rural-1 area was higher than the LST in the Rural-2 area from 1984 to 2018. The temporal evolution of LST showed an increasing trend in the urban and rural area. However, for Wuhan, the LST in the Rural-1 area was higher than the LST in the Rural-2 area from 1984 to 2003, and this phenomenon reversed after 2004. A slightly decreasing trend was detected for urban and rural LST in Wuhan, which was opposite to the LST evolution of Nanchang.
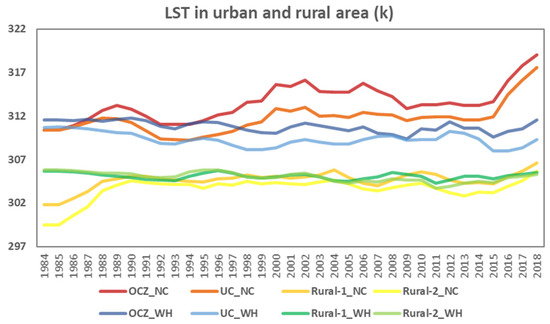
Figure 5.
Temporal evolution for average LST in different area in Nanchang and Wuhan. The suffix “_NC” represents Nanchang; the suffix “_WH” represents Wuhan.
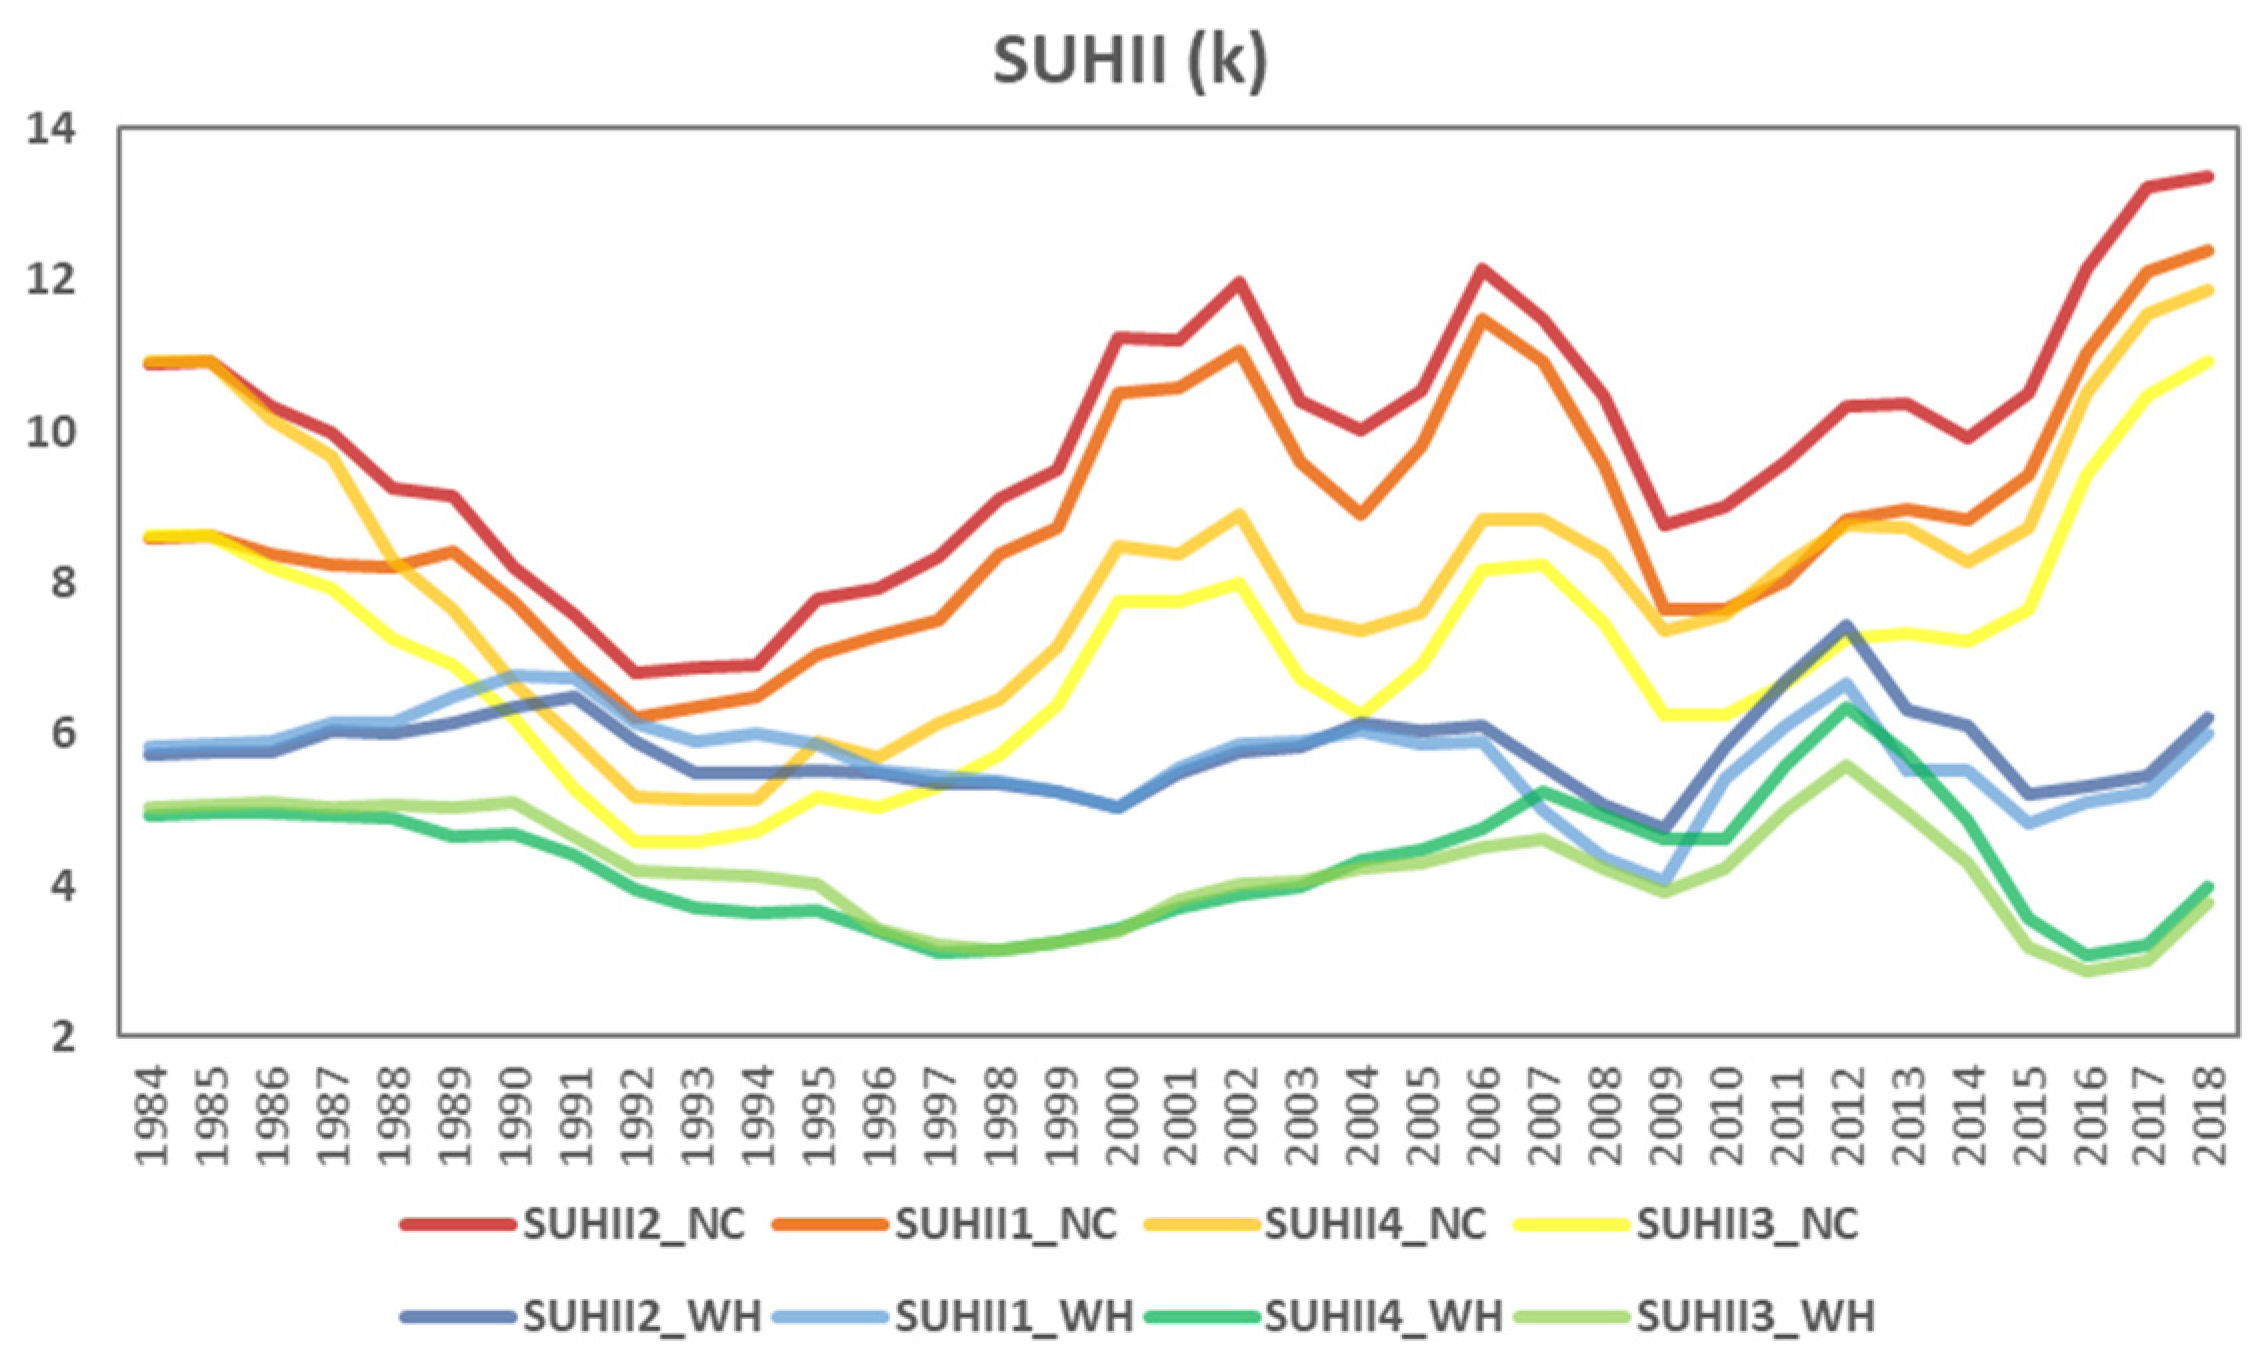
Comparing the LST in urban and rural areas, we could obtain four long-term series of SUHII for each city. Generally speaking, the SUHII values in Nanchang averaged from 1984 to 2018 were 8.87K, 9.89K, 7.07K and 8.09K for SUHII1, SUHII2, SUHII3 and SUHII4, respectively. There was no doubt that the difference between the highest LST (OCZ) and the lowest LST (Rural-2) generated the highest SUHII. A similar result was obtained in Wuhan, where the SUHII2 is also the highest, with SUHII values of 5.70K, 5.79K, 4.22K and 4.30K for SUHII1, SUHII2, SUHII3 and SUHII4, respectively. In addition, we could find that the SUHII differences caused by different SUHII definitions were lower in Wuhan.
As for the temporal evolution, the temporal trends for those four SUHII are shown in Figure 6. For Nanchang, it could be seen that SUHII2 was the highest in the long series, and SUHII3 was the lowest. However, SUHII1 was the highest SUHII in Wuhan from 1984 to 2003, and SUHII2 was the highest from 2004 to 2018. SUHII3 acted as the lowest SUHII in Nanchang, but in Wuhan, SUHII4 was the lowest before 2003 and SUHII3 was the lowest after 2003.
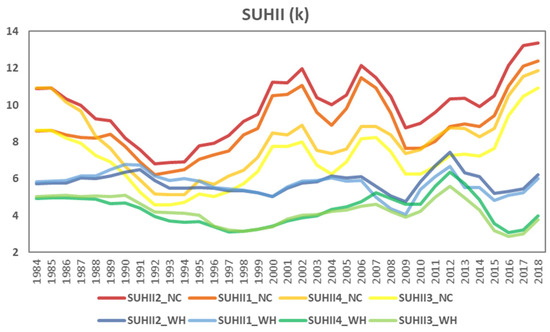
Figure 6.
Temporal evolution for different SUHII trends in Nanchang and Wuhan. The suffix “_NC” represents Nanchang; the suffix “_WH” represents Wuhan.
Interestingly, opposite trends can be seen in Nanchang and Wuhan with regards to the temporal evolution of SUHII. The temporal variation of SUHII for Nanchang decreased at first then increased no matter which SUHII definition was selected. However, Wuhan showed a slight increasing at first, then a decreasing trend for SUHII evolution. The fluctuation range (maximum SUHII subtracted minimum SUHII) of each temporal trend in Nanchang was 6.19K, 6.53K, 6.35K and 6.74K for SUHII1, SUHII2, SUHII3 and SUHII4, respectively. Moreover, the fluctuation range (maximum SUHII subtracted minimum SUHII) of each temporal trend in Wuhan was 2.70K, 2.70K, 2.73K and 3.29K for SUHII1, SUHII2, SUHII3 and SUHII4, respectively. We could also find that the fluctuation range for different SUHII was almost the same. In other words, different calculations of SUHII would not change the type of temporal trend, but only controlled the value of SUHII in each year.
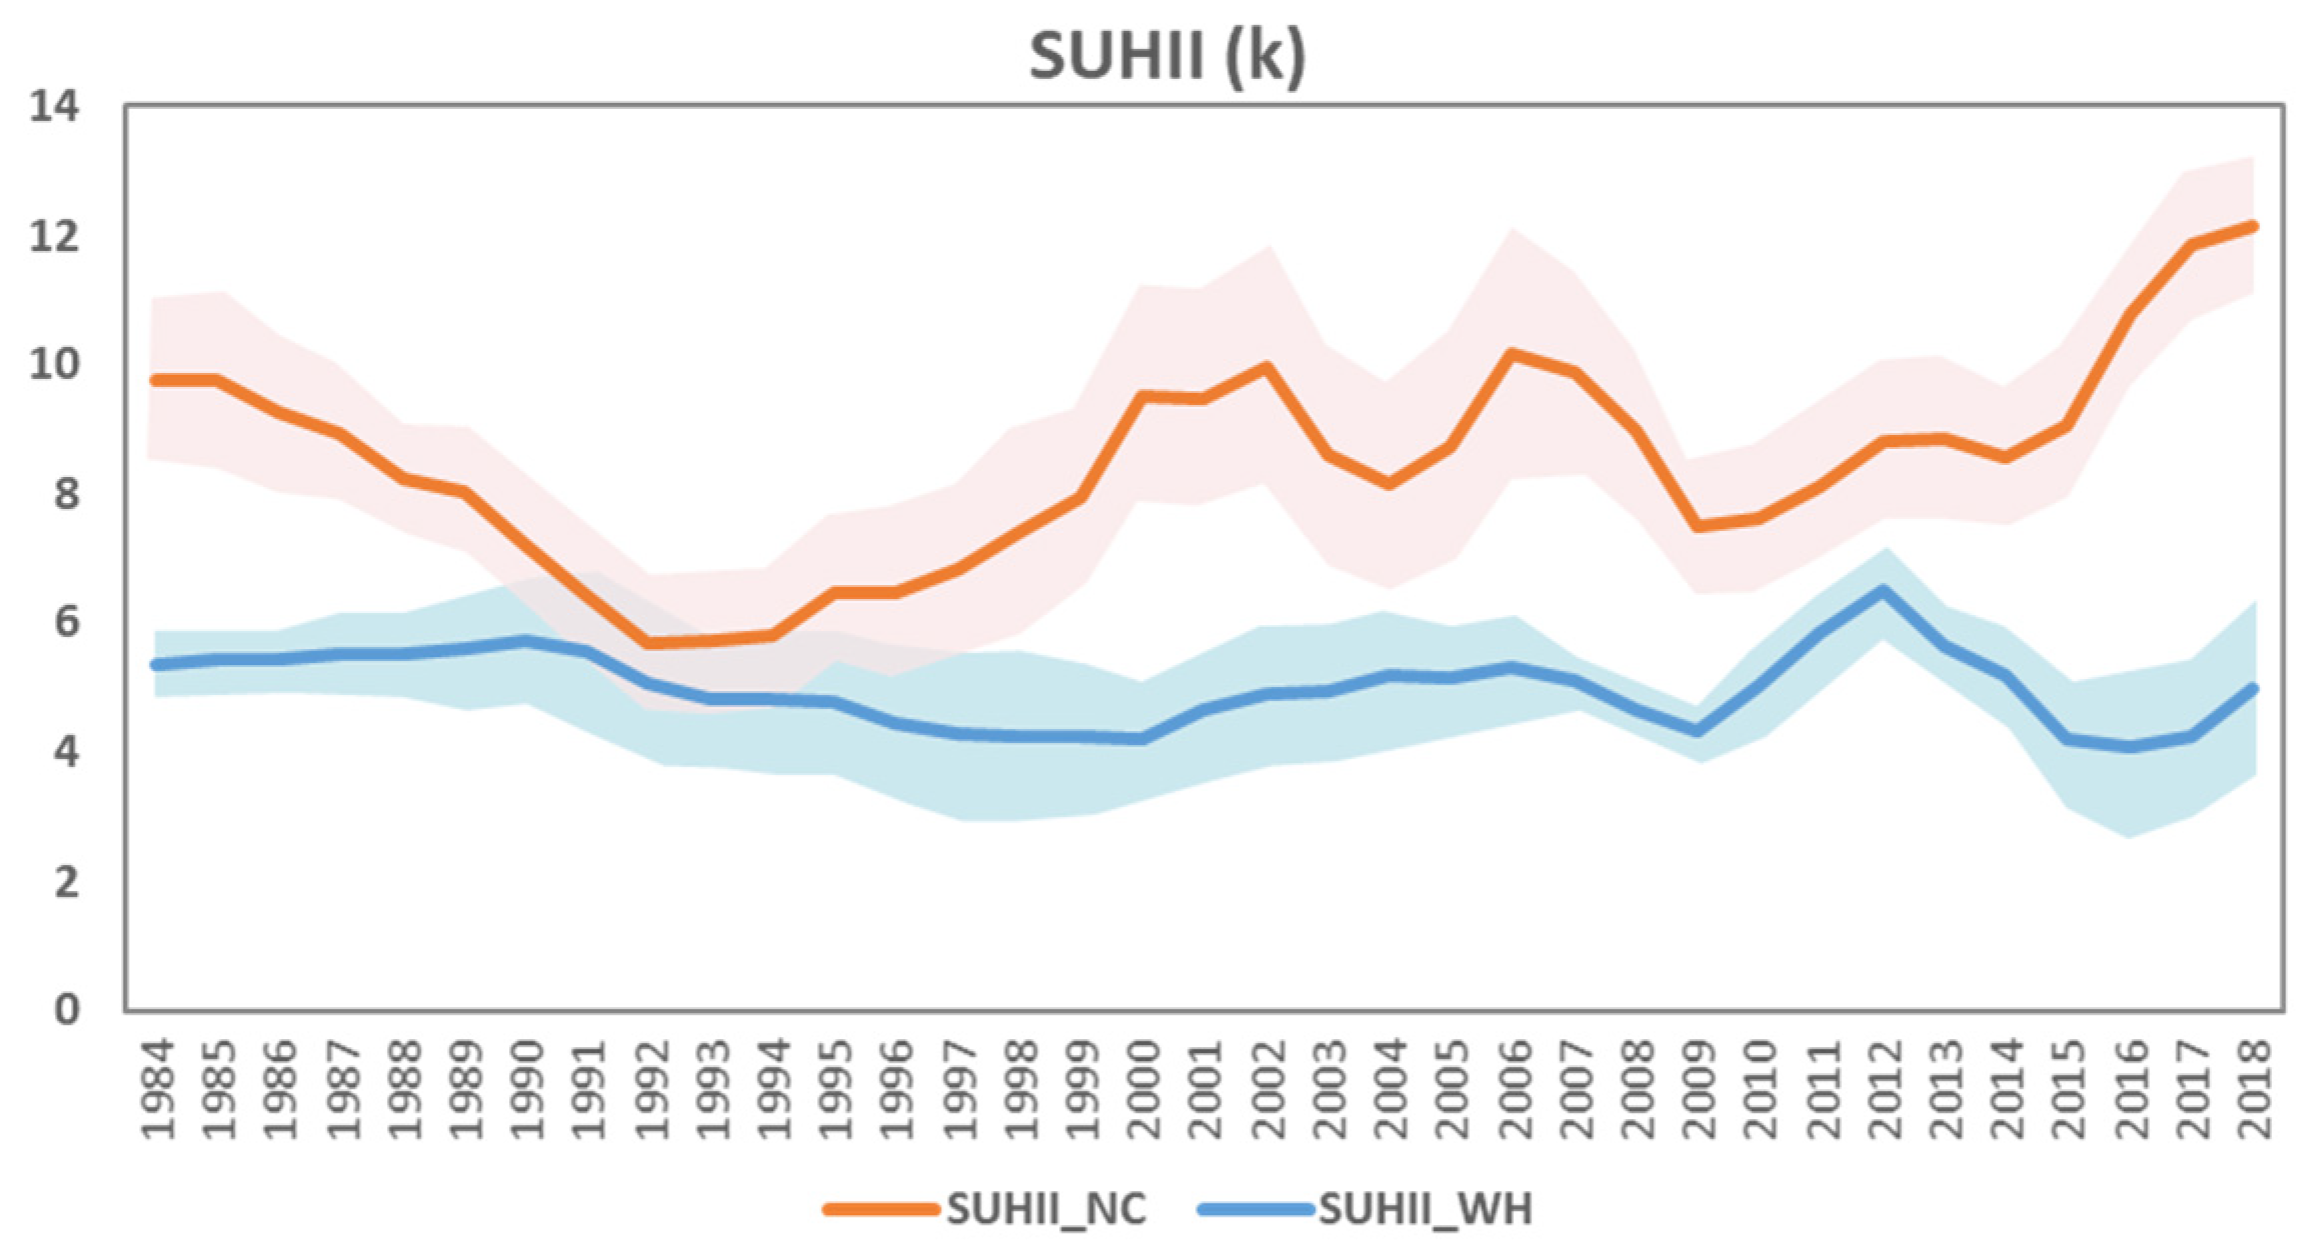
Hence, we could generally consider the different SUHII trends as parallel lines. In this way, we could generate the average SUHII of each year in Nanchang and Wuhan with the error bar (Figure 7). From Nanchang, the lowest SUHII occurred in 1992, and the highest SUHII occurred in 2018. The SUHII in Nanchang decreased from 1984 to 1992, and then increased from 1992 to 2006. A relatively slight decrease was found from 2006 to 2009; finally, the SUHII continued to increase from 2009 to 2018. For Wuhan, the SUHII slightly increased from 1984 to 1990, and then decreased from 1990 to 2009. A relatively sharper increase was detected from 2009 to 2012; finally, the SUHII continued to decrease from 2009 to 2018. The highest SUHII was shown in 2012 and the lowest SUHII was found in 2016. Referring to the temporal trend for ISA in OCZ gained from our previous research [54], in Nanchang, we detected an ISA evolution trend opposite to the SUHII evolution trend—first increasing, then decreasing. However, the SUHII trend in the time series was consistent with the ISA variation in OCZ in Wuhan. Therefore, it could be concluded that the SUHII should be the balance between urban and rural areas. The one-sided description of land cover change in urban or rural areas could not exactly present the true variation of SUHII.
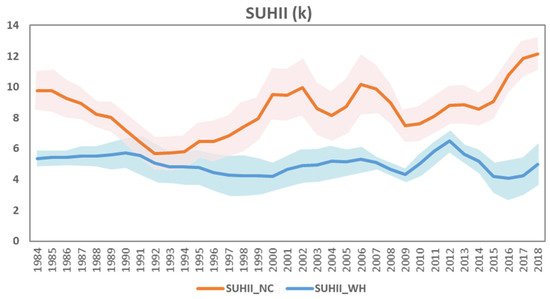
Figure 7.
Temporal trends for average SUHII values and its shaded uncertainty region in Nanchang and Wuhan. The pink area is the shaded uncertainty region using the standard deviation of different SUHIIs in Nanchang. The blue area is the shaded uncertainty region using the standard deviation of different SUHIIs in Wuhan. The suffix “_NC” represents Nanchang; the suffix “_WH” represents Wuhan.
From Figure 7, the greatest difference was found in 2006 for Nanchang, with the error bar around 3.90K. The greatest difference was 2.60K for Wuhan in 2016. Those years were both the inflection points in the temporal trends of SUHII. Thus, we could find that the error bar was relatively greater at extreme points. Intuitively, the pink or blue stripe in Figure 7 would be wider at extreme points, which were also the extreme points of the LST variation detected in Figure 5. Thus, a conclusion could be drawn that the SUHII variation by different SUHII definitions would be heavier under a circumstance of extreme weather. In other words, for those colder or hotter years, different SUHII definitions would bring up larger differences.
4.2. Spatial Distribution for Surface Urban Heat Island
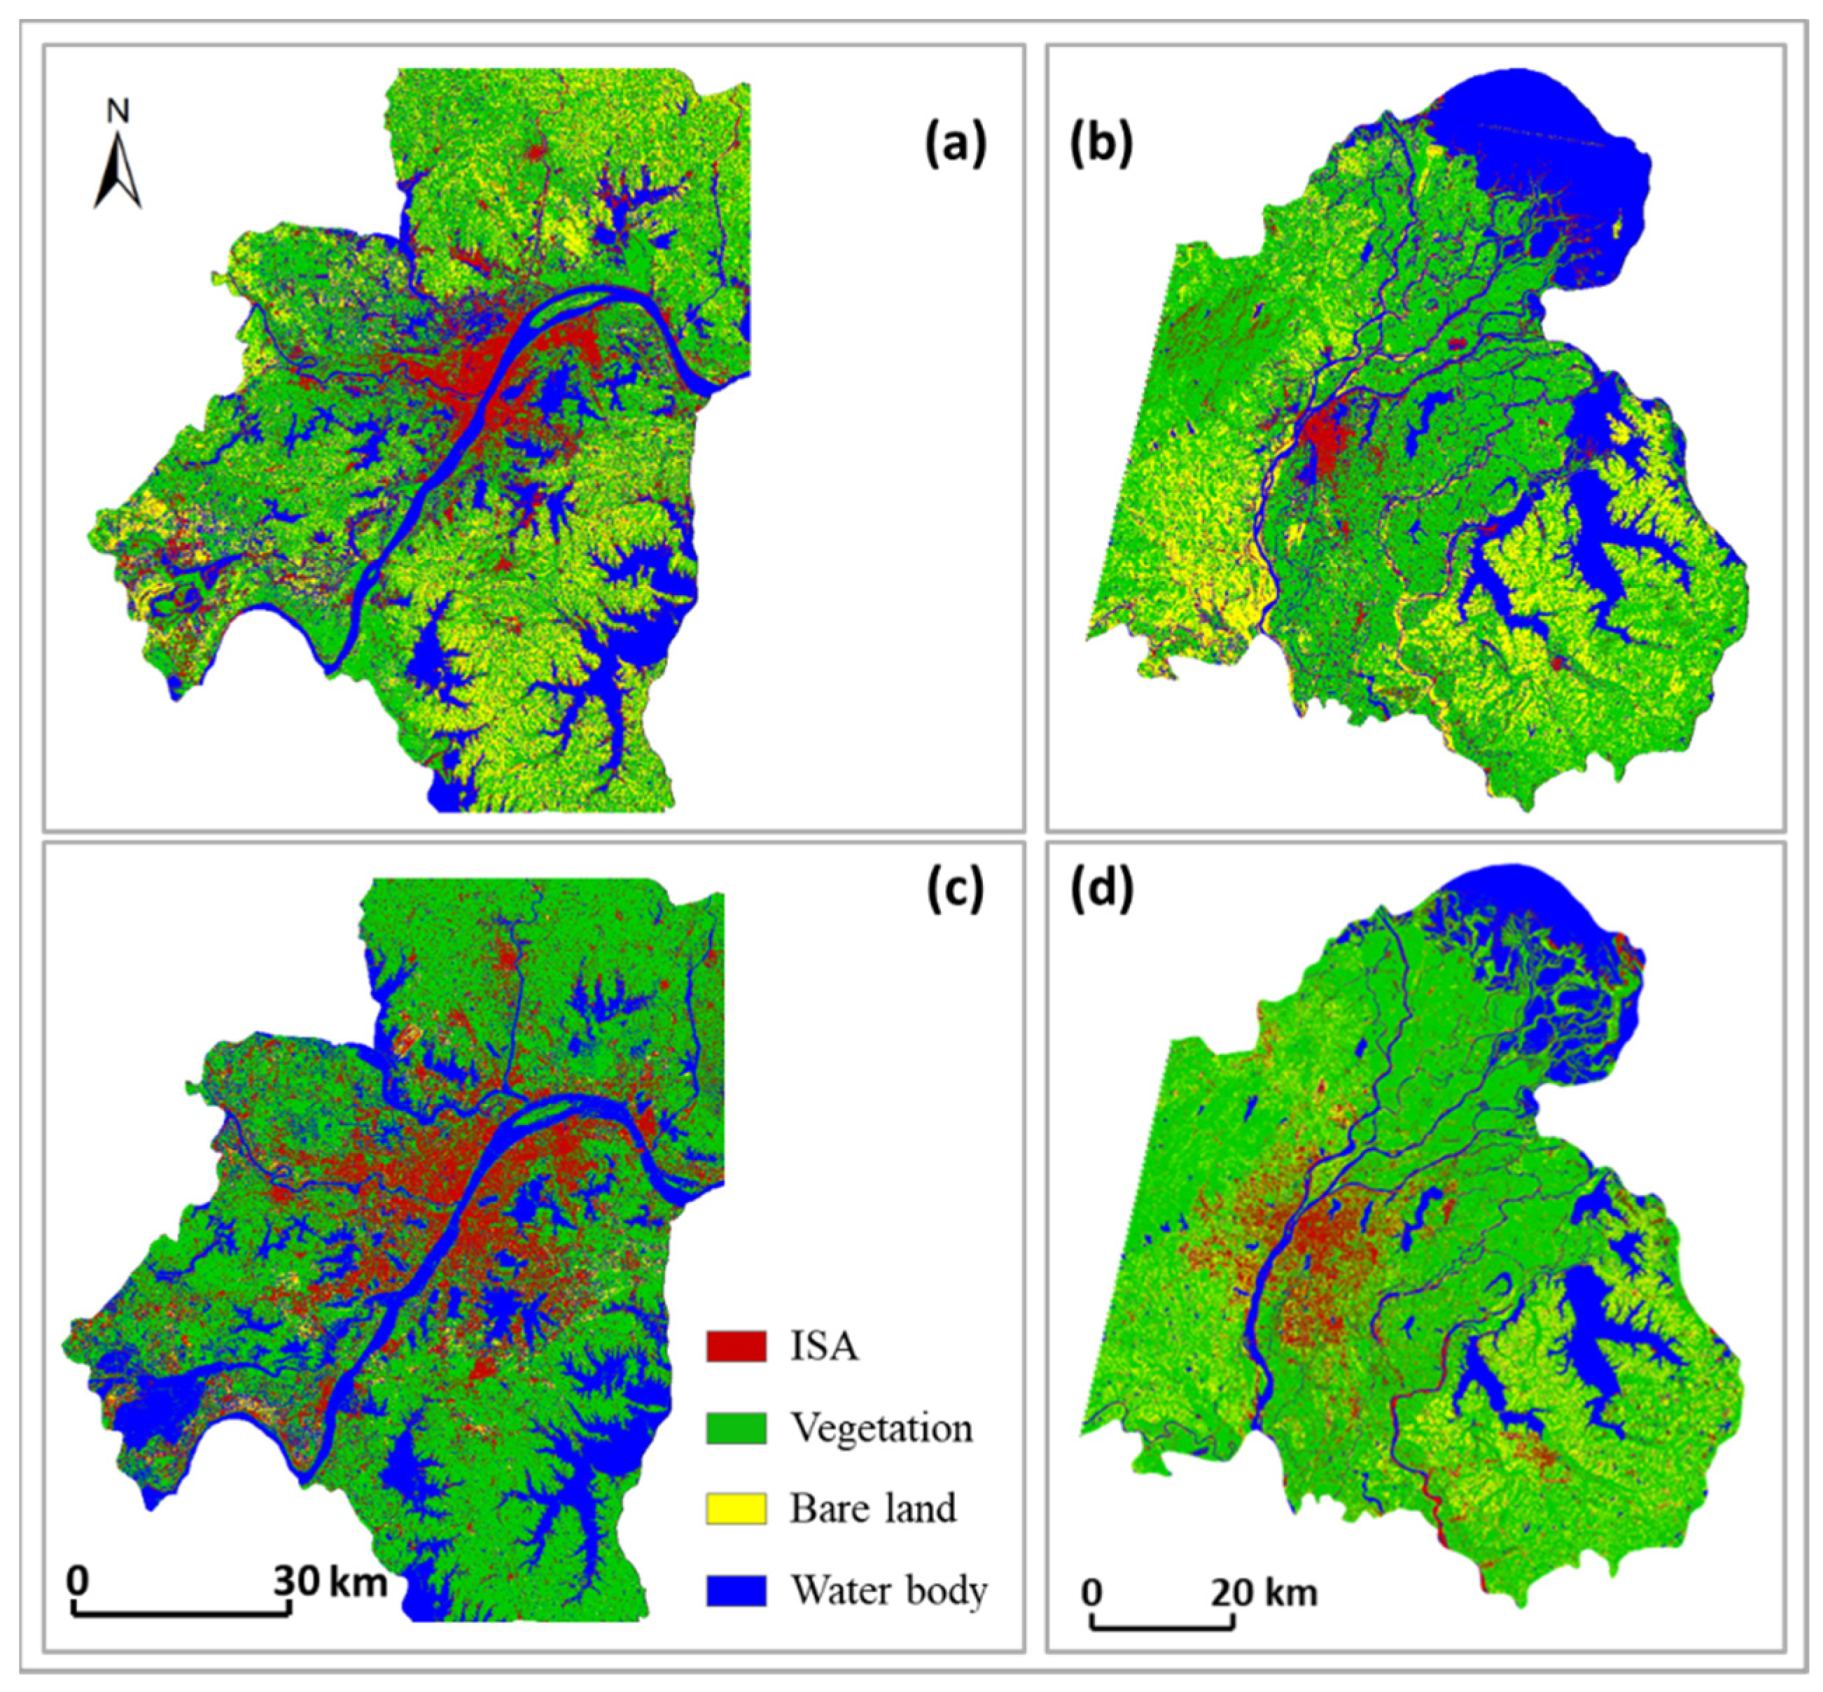
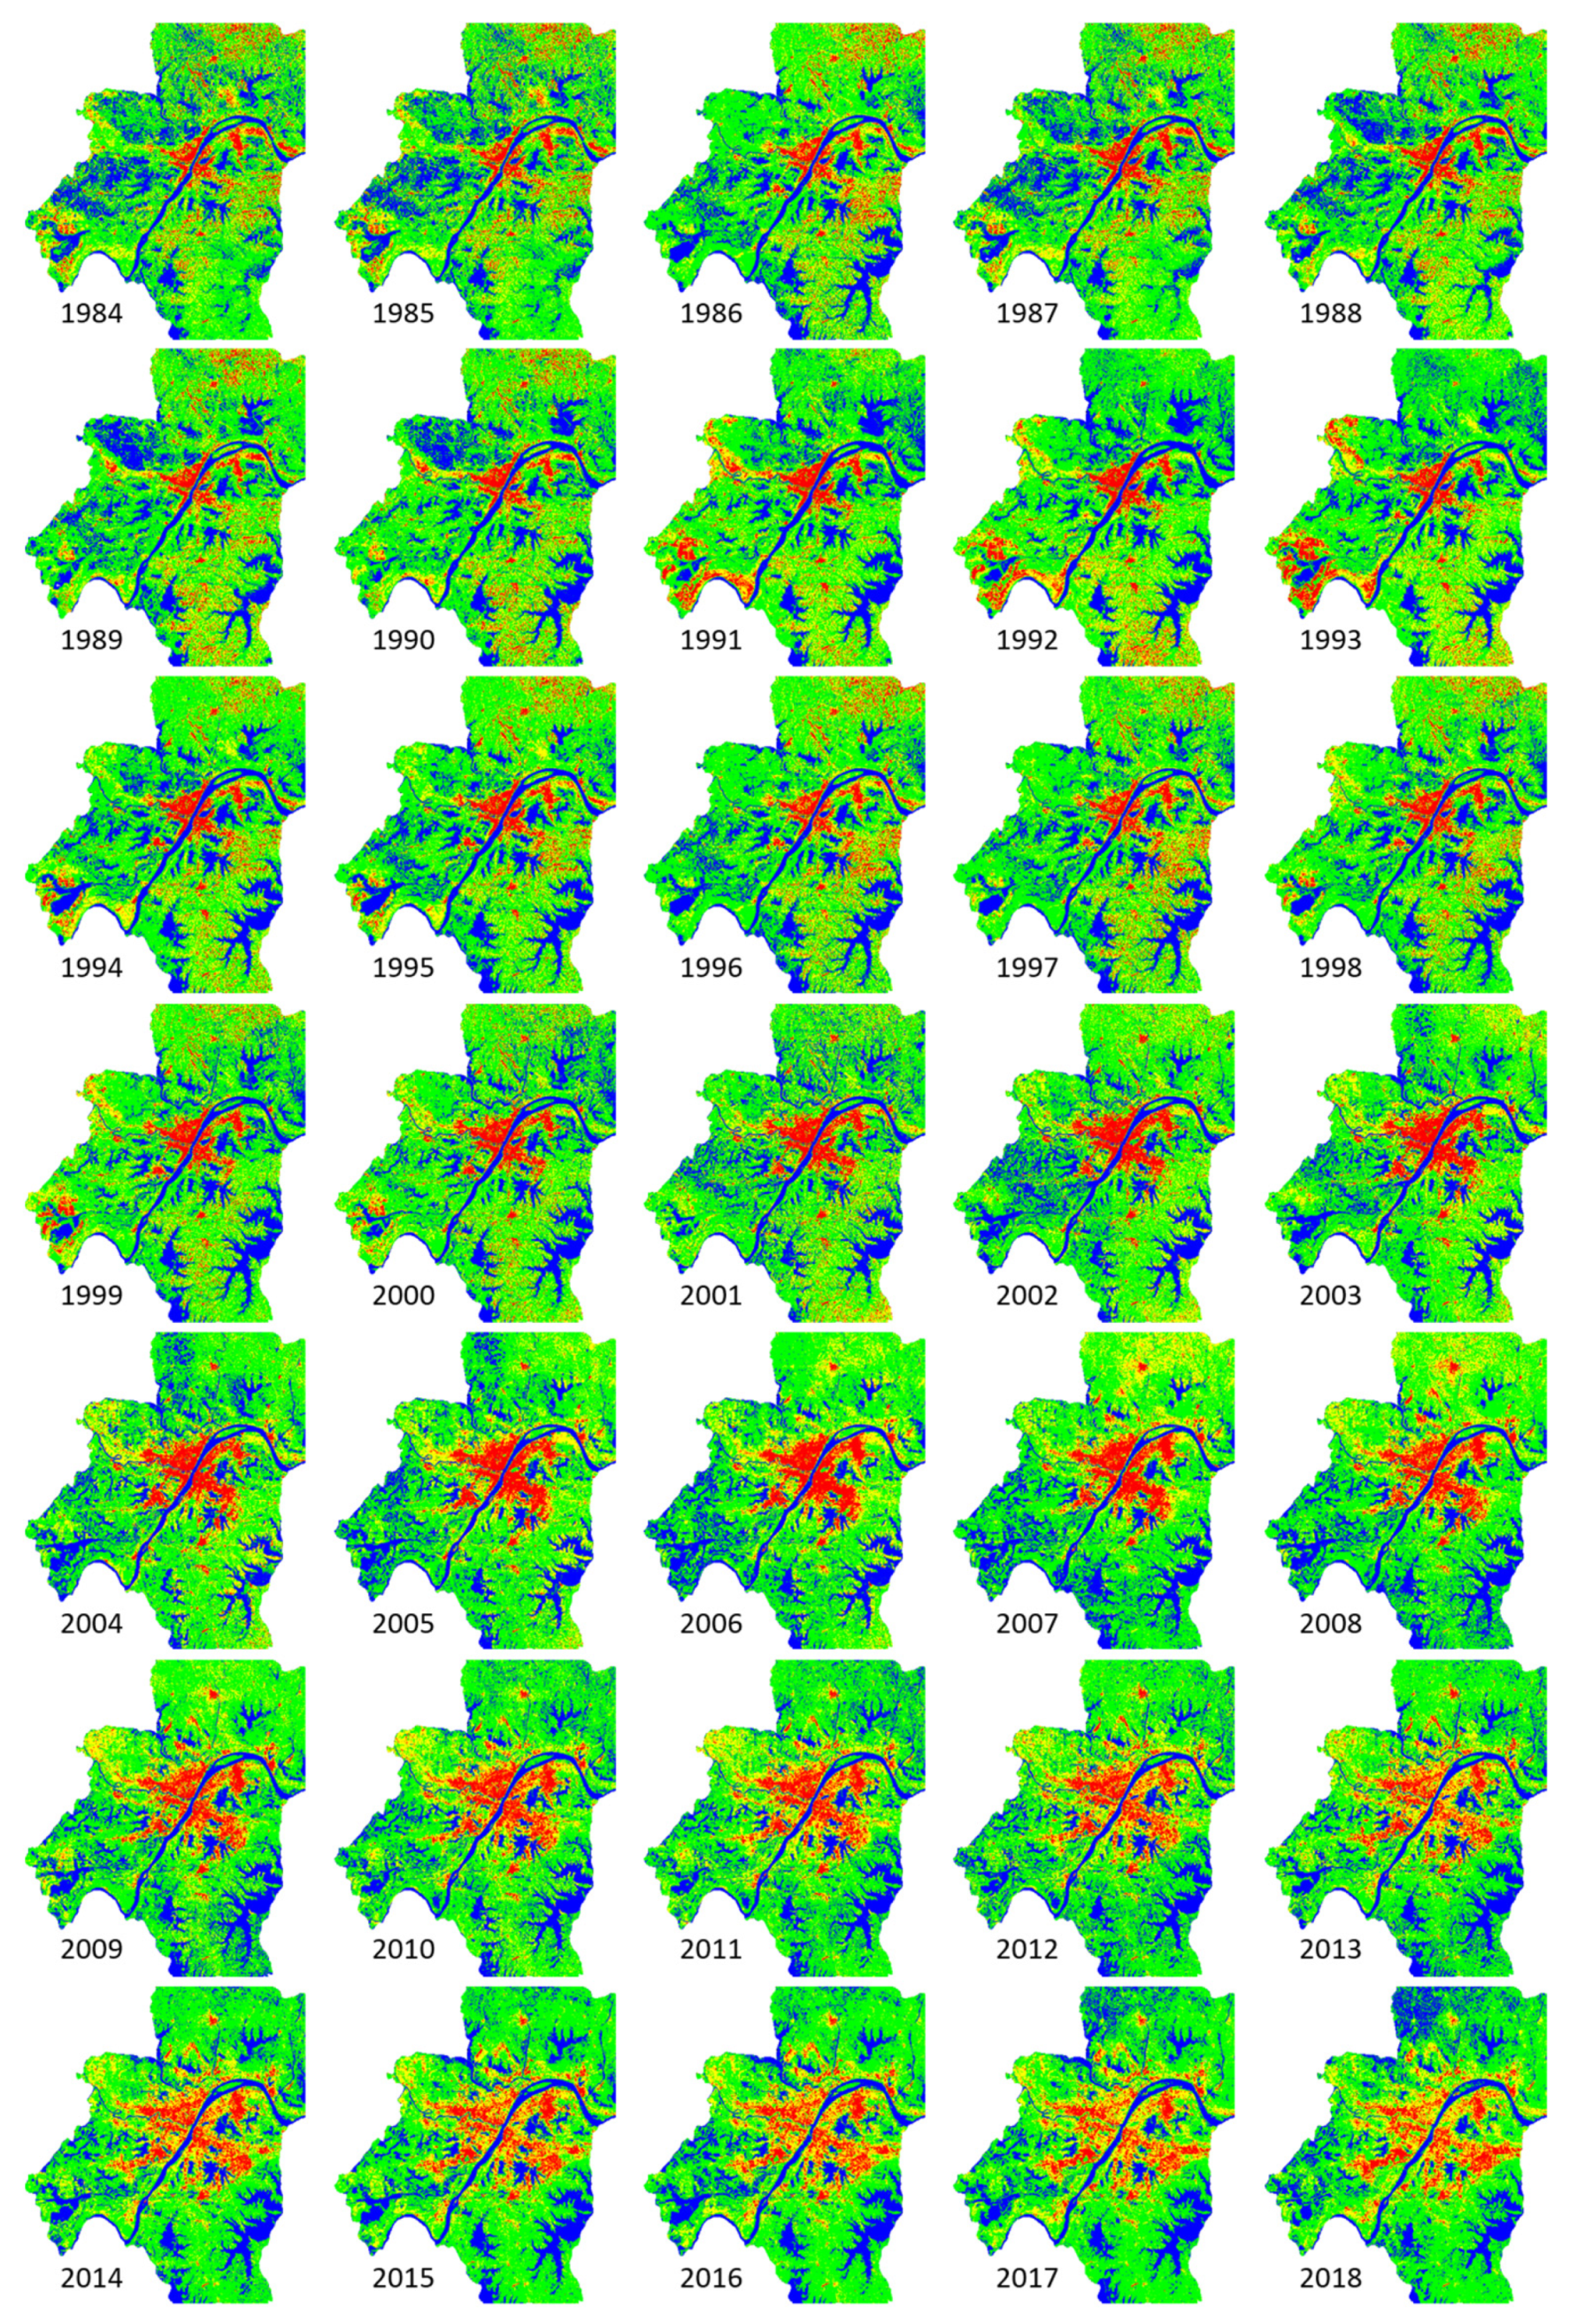
Based on the generated SMLST series, the spatial distribution for SUHIs in Nanchang and Wuhan could be detected. In each year, referring to the relative density classification [6], we could figure out the region of higher and lower LST, and thus, point out the SUHIs. Using this method of spatial illustration, different SUHII definitions would not affect the distribution of SUHI. Thus, we could obtain a uniform conclusion for the spatial pattern of SUHIs no matter which SUHII definition was selected. Moreover, comparing the SUHI distribution with the land cover map (Figure 8), the correlation between the SUHI and land covers could also be found. The spatial distribution for SUHII of each year in Nanchang was listed in Figure 9. From Figure 9, before 2002, the highest LST center could be found adjacent to the Ganjiang River (center 1). The other highest LST was scattered on the southeast and southwest of Nanchang. In the period from 2002 to 2018, we obtained the two highest LST centers in Nanchang. One was still the urban core along the Ganjiang River (center 1). The other was the built-up aggregation of Jinxian county located in the southeast of Nanchang (center 2).
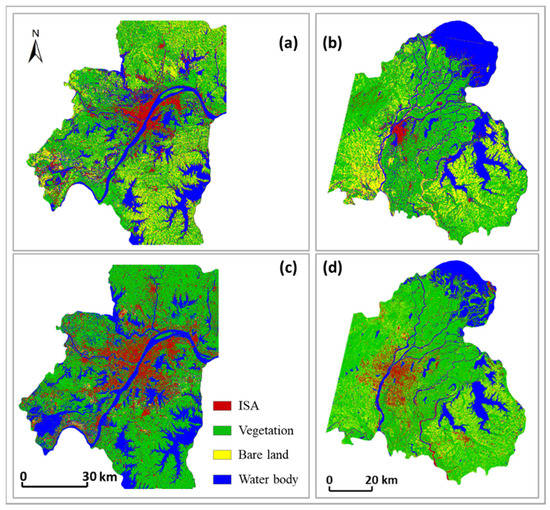
Figure 8.
The land cover maps for Wuhan and Nanchang. (a) The land covers in Wuhan on 26 September 1987. (b) The land covers in Nanchang on 17 October 1988. (c) The land covers in Wuhan on 23 July 2016. (d) The land covers in Nanchang on 14 September 2017.
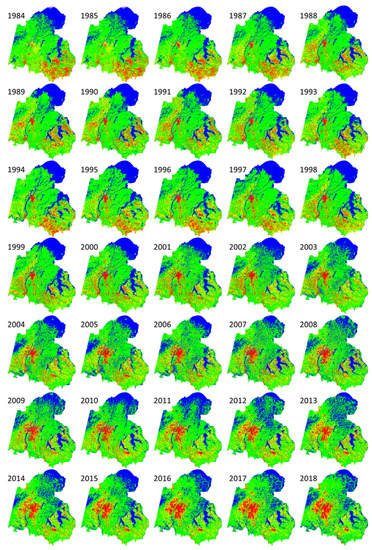
Figure 9.
SUHI distribution in Nanchang from 1984 to 2018. For each image, the red area is the top 7.5% LST, the yellow area is the top 7.5–25% LST, the green area is the top 25–80% LST and the blue area is the last 20% LST.
For the past 35 years (1984–2018), an obvious expansion could be seen for center 1. In the beginning, center 1 was a small section located on the eastern bank of the Ganjiang River. With the development of Nanchang, center 1 gradually expanded. Different from the development of the eastern bank of the Ganjiang River, the highest LST on the western bank of the Ganjiang River was scattered at the outset, and gradually gathered as time went by, finally combining with the eastern part and turning into a large center. The extent of center 1 was 10.75 km2 in 1984, and it changed into 398.82 km2 in 2018. Center 1 has expanded 37 times compared to its original extent. Center 2 was not obvious before 2002. Most parts of the southeastern area in Nanchang presented as the highest LST before 2002. From 2002 to 2018, center 2 could be clearly distinguished with its surrounding area. Compared with the development of center 1, the expansion of center 2 was not rapid. Qualitatively, the extent of center 2 almost remained the same from 2002 to 2018, as can be visually interpreted from Figure 8. Quantitatively, the center 2 has experienced a slight variation of expanding at first and then shrinking. The largest extent of center 2 occurred in 2014 with 32.88 km2.
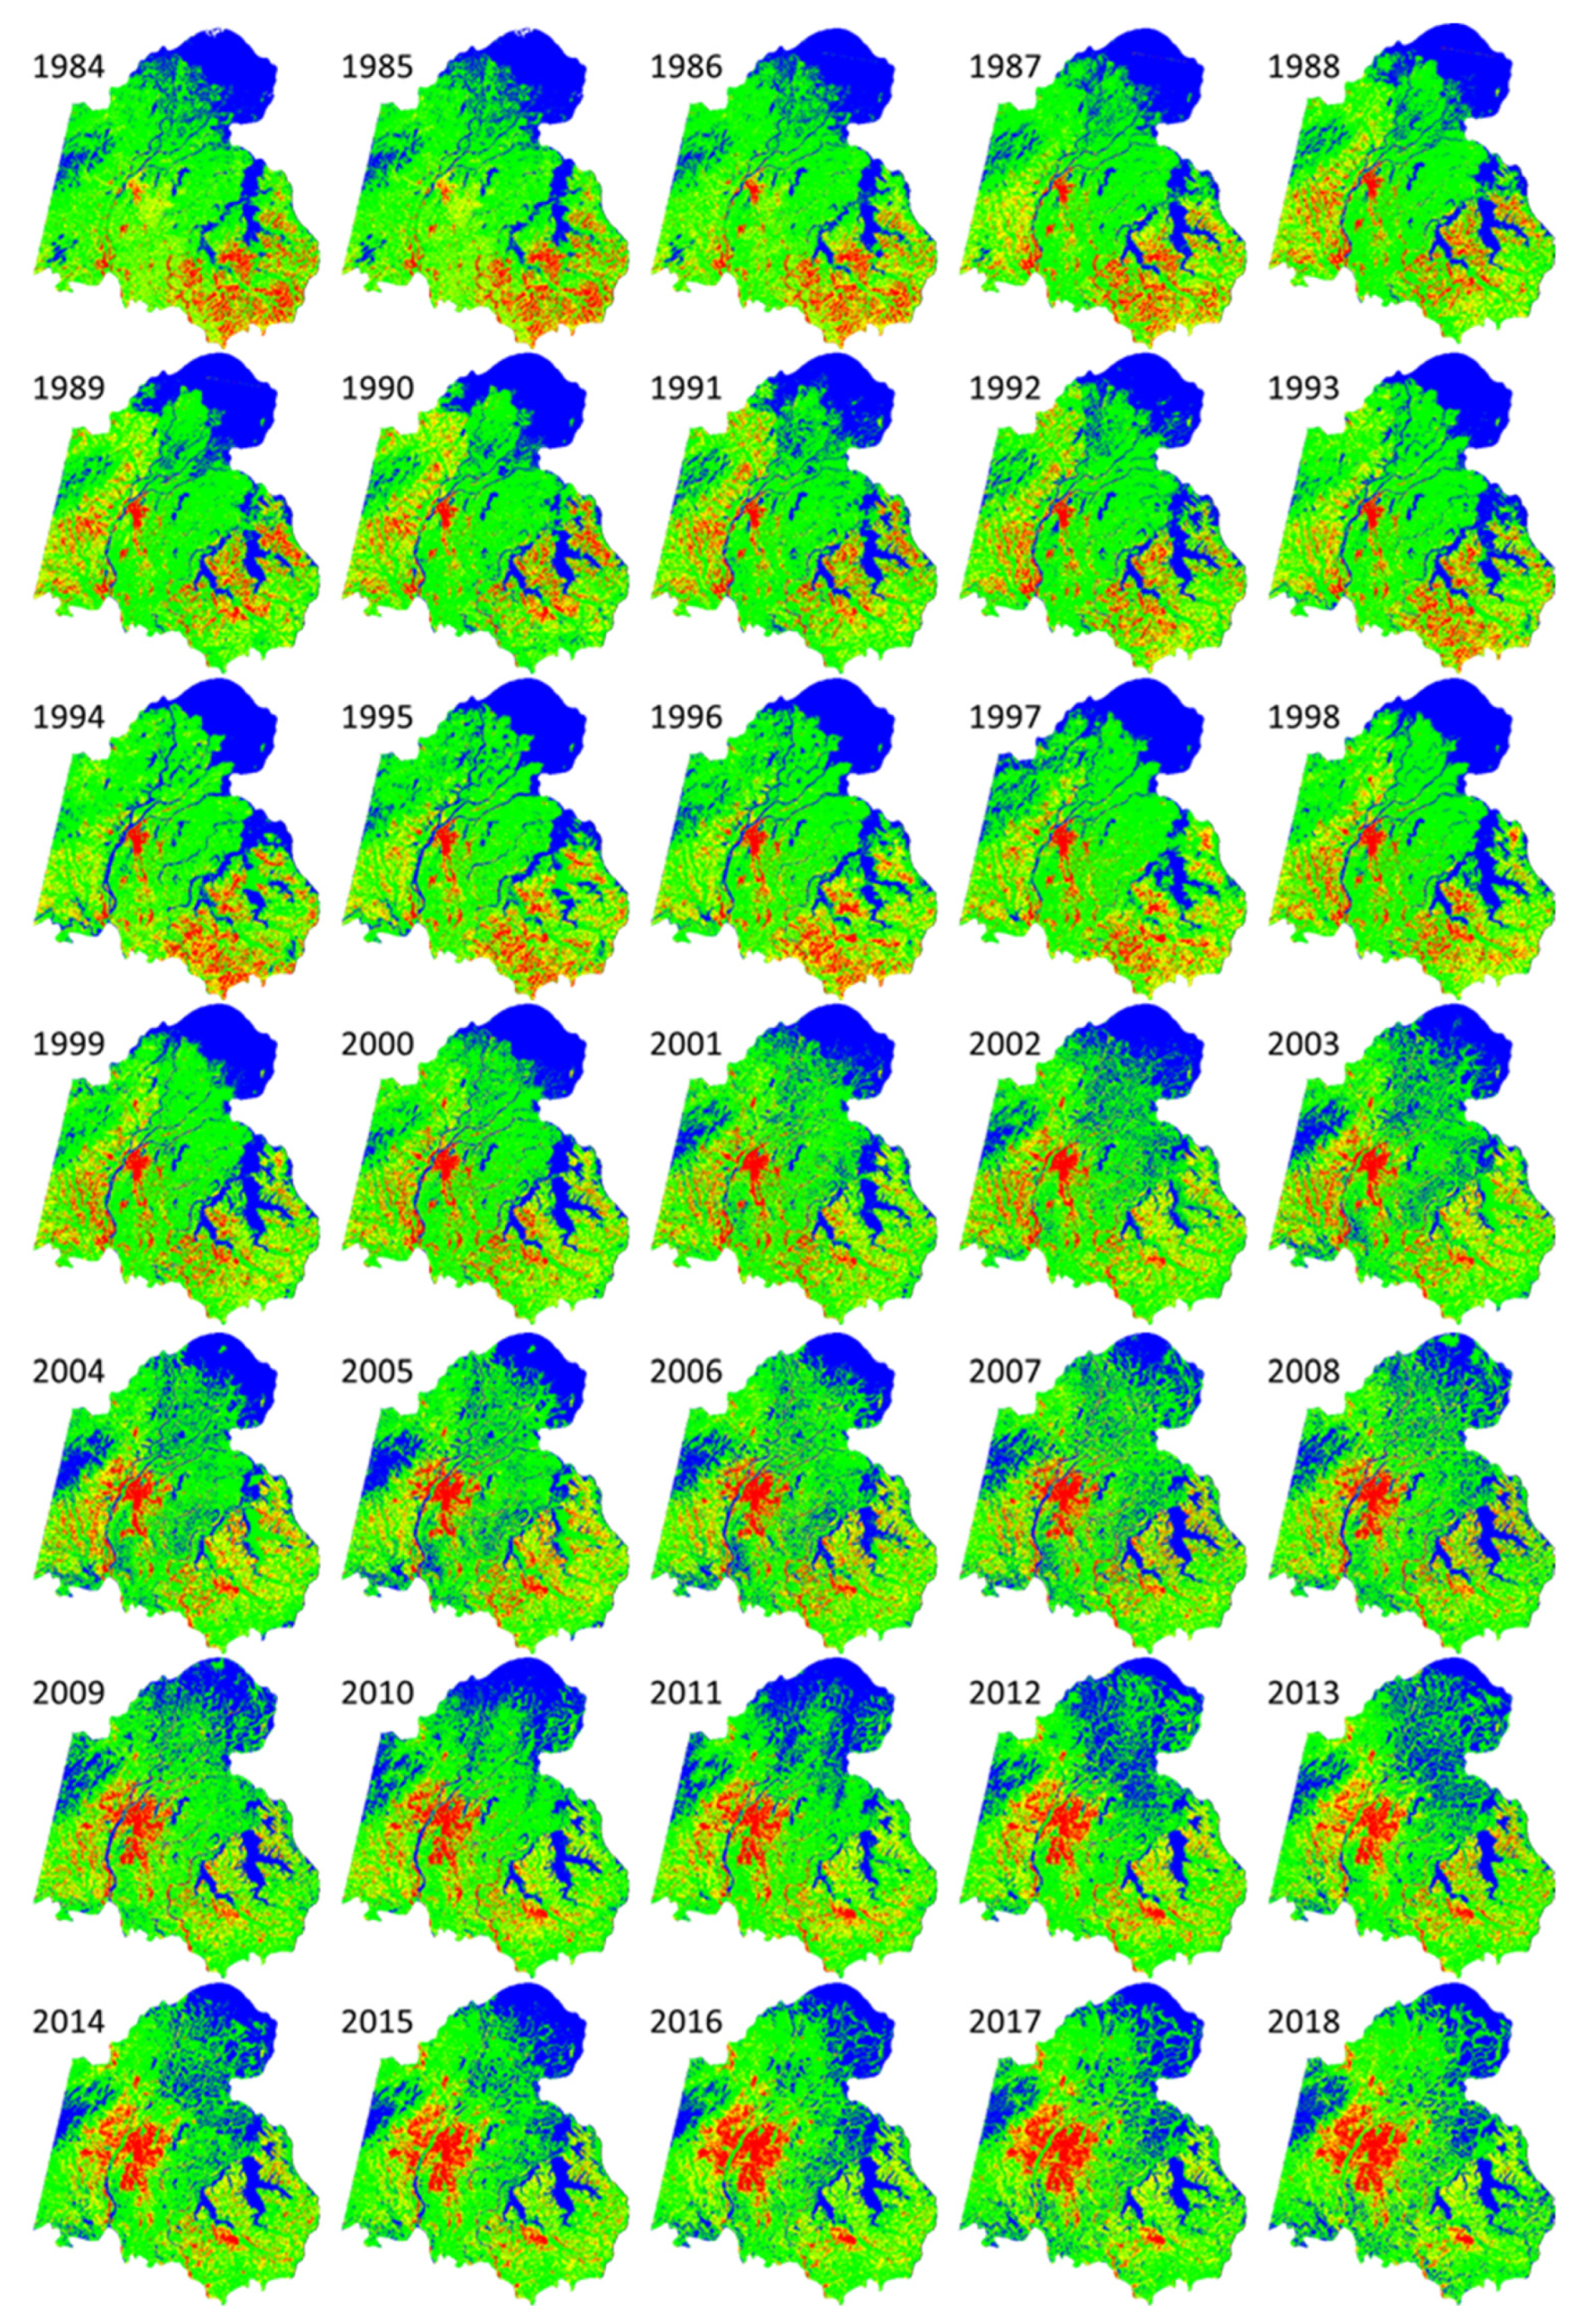
The spatial distribution for SUHII of each year in Wuhan is illustrated in Figure 10. From Figure 10, an obvious SUHI was detected adjacent to the Yangtze River—the urban core of Wuhan. The SUHI has gone through a dramatic expansion from 1984 to 2018. An interesting phenomenon could be found that the SUHI was centralizing at first and then scattering (the red and yellow area in Figure 10). Different from the spatial pattern of SUHII in Nanchang, the SUHI center in Wuhan showed a gradually decreasing of LST from 2008 to 2018, especially after 2013. Up to 2018, those highest LST points (red color in Figure 10) has shifted from near the Yangtze River to away from the Yangtze River. An obvious shift of the SUHI center could be detected from the central of Wuhan to the surrounding area, which was highly distinguished with the pattern of SUHII in Nanchang. The water bodies in Wuhan were stable, presenting as the lowest LST center for the past 35 years.
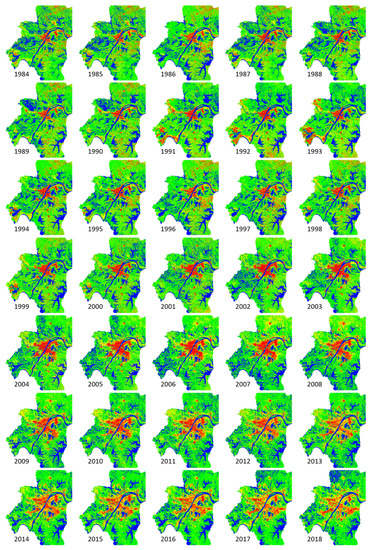
Figure 10.
SUHI distribution in Wuhan from 1984 to 2018. For each image, the red area is the top 7.5% LST, the yellow area is the top 7.5–25% LST, the green area is the top 25–80% LST and the blue area is the last 20% LST.
Compared with the current studies, the long-term and fine-scale SMLST series helped us detect more details for SUHI evolution. For example, we could figure out that the expansion rate of the highest LST center was not steady year by year in Nanchang. The expansion before 2003 was relatively lower than that after 2003 in Nanchang, and the pattern of the highest LST center was different, taking 2008 as the cut-off point. If we only measured the SUHI for several years, such as every ten years or every five years, we would miss the exact transformation across the years. For example, for the low LST in Nanchang, from 2005 to 2015, if we only took the images in 2005 and 2015 into consideration, we might conclude that the LST of Poyang Lake was relatively stable. However, the long-term and fine-scale SMLST series leads to a different conclusion, namely that the Poyang Lake has gone through a dramatic LST variation. Therefore, to comprehensively monitor the SUHI distribution and evolution, the long term and fine scale were of great importance.
5. Discussions
Based on the above analysis for SUHI in Nanchang and Wuhan, we could find obviously opposite patterns for the two cities, even though they are both considered well-known “stove cities”. Theoretically, under the same climate background, the two cities should receive similar sun radiation with adjacent latitudes. However, four opposite patterns were observed for the two cities: (1) LST evolution: an increasing trend of LST in Nanchang and a slight decreasing trend of LST in Wuhan, (2) SUHII variation: a temporal trend of first decreasing and then increasing in Nanchang, and a temporal tendency of first slightly increasing and then decreasing in Wuhan, (3) SUHI center: gathering of the highest LST from 1984 to 2018 in Nanchang, while the LST in SUHI center decreased from 2008 to 2018 in Wuhan and (4) spatial pattern of SUHI: obvious expansion of the SUHI center in Nanchang, while the SUHI center centralized at first and then scattered in Wuhan.
In Wuhan, as a new-first tier city in China, the Gross Domestic Product (GDP) has changed from 8.38 billion in 1984 to 1341.03 billion in 2018. In Nanchang, as a second-tier city in China, the development level was relatively lower than that in Wuhan, with a GDP of 2.58 billion in 1984 and 364.09 billion in 2018. A large difference in economy could be detected for the two cities. In other words, the development foundation in Nanchang was relatively weaker. Thus, Nanchang was consistently dependent on some ISA-related industries. Finally, it resulted in an increase in the LST and SUHII, and the highest LST centralizing in Nanchang. However, in Wuhan, as a relatively developed city, the industrial upgrading and transformation should be considered in the development progress. Finally, the LST and SUHII would be alleviated, and the SUHI center was gradually transferred from the downtown to the urban fringe.
The population movement might be another factor leading to the opposite patterns for those two cities, as the anthropogenic heat emission was also an important part of SUHII. On the one hand, more people moved into Wuhan to seek for work, attracted by the relatively rich development foundation. On the other hand, the people in Nanchang tended to seek for work elsewhere due to the relatively weaker development foundation in Nanchang. Thus, the SUHII in Wuhan presented as increasing at first, and a decreasing tendency was found in the early years for Nanchang.
There are some other limitations in our study. Firstly, the error of LST inversion and spatiotemporal fusion need to be reduced to alleviate the relatively obvious fluctuation for SUHII across years. Secondly, the spatial resolution of the reference AVHRR images is too coarse to catch the slight change before 2000, which is why the variation of Poyang Lake is hard to figure out before 2000. Thirdly, the policies or plans by the government were seldom discussed in this paper. The interaction between the specific urban plans and SUHII changes is expected to be interpreted in our future work.
6. Conclusions
In this paper, to investigate the difference between “stove cities”, we have mapped and analyzed the spatiotemporal patterns for SUHII in Nanchang and Wuhan based on the long-term (1984–2018) and fine-scale (Landsat-like) SMLST series. In particular, to discuss the difference brought up by different SUHII definitions, we compared the temporal evolution for different SUHII. The highest SUHII was generally defined by the difference between LST in OCZ and LST in the previous surface unaffected by UHI. The lowest SUHII was defined by the difference between LST in UC and LST in the previous surface outside the UC. Although a large SUHII difference existed between different SUHII definitions, the temporal trend of SUHII would not be affected by SUHII definitions. Under these definitions, opposite patterns were found regarding the LST evolution, SUHII variation, SUHI center transformation and spatial SUHI pattern for Nanchang and Wuhan. The differences in these two “stove cities” were probably due to the large difference in development level.
Briefly speaking, the spatiotemporal patterns for SUHII help us interpret the historical progress and geographical division of the change in thermal environment in each city. To some extent, the opposite spatiotemporal patterns of two “stove cities” with similar climate background told us that the thermal environment evolution was more affected by the cities’ development rather than the natural climate. The spatiotemporal pattern of SUHI in each city also informed us that the long term and fine scale were necessary for SUHI monitoring. An LST series with a longer term and finer scale would help us figure out more details of the SUHI evolution, so as to comprehend the transformation within a short time.
Author Contributions
H.S. and C.Z. designed the research; Y.S. and C.Z. performed the research; Y.S., C.Z., Q.C. and H.S. analyzed the data and wrote the paper. All authors have read and agreed to the published version of the manuscript.
Funding
This research was funded by the National Key R&D Program of China (No.2019YFB2102900), and the 2019 Innovation Platform Construction Special Project from Department of Science and Technology, Qinghai Province(2019-ZJ-T04).
Acknowledgments
We would like to thank the data providers of the United States Geological Survey (USGS) Earth Resources Observation and Science (EROS) Center, Atmosphere Archive & Distribution System Distributed Active Archive Center (LAADS DAAC) and National Oceanic & Atmospheric Administration (NOAA).
Conflicts of Interest
The authors declare no conflict of interest.
References
- Zuo, L.; Zhang, Z.; Carlson, K.M.; MacDonald, G.K.; Brauman, K.A.; Liu, Y.; Zhang, W.; Zhang, H.; Wu, W.; Zhao, X.; et al. Progress towards sustainable intensification in China challenged by land-use change. Nat. Sustain. 2018, 1, 304–313. [Google Scholar] [CrossRef]
- Bloom, D.E.; Canning, D.; Fink, G. Urbanization and the Wealth of Nations. Science 2008, 319, 772. [Google Scholar] [CrossRef] [Green Version]
- Grimm, N.B.; Faeth, S.H.; Golubiewski, N.E.; Redman, C.L.; Wu, J.; Bai, X.; Briggs, J.M. Global change and the ecology of cities. Science 2008, 319, 756–760. [Google Scholar] [CrossRef] [PubMed] [Green Version]
- Newbold, T.; Hudson, L.N.; Hill, S.L.; Contu, S.; Lysenko, I.; Senior, R.A.; Borger, L.; Bennett, D.J.; Choimes, A.; Collen, B.; et al. Global effects of land use on local terrestrial biodiversity. Nature 2015, 520, 45–50. [Google Scholar] [CrossRef] [PubMed] [Green Version]
- Wang, K.; Wang, J.; Wang, P.; Sparrow, M.; Yang, J.; Chen, H. Influences of urbanization on surface characteristics as derived from the Moderate-Resolution Imaging Spectroradiometer: A case study for the Beijing metropolitan area. J. Geophys. Res. Atmos. 2007, 112, D22S06. [Google Scholar] [CrossRef]
- Shen, H.; Huang, L.; Zhang, L.; Wu, P.; Zeng, C. Long-term and fine-scale satellite monitoring of the urban heat island effect by the fusion of multi-temporal and multi-sensor remote sensed data: A 26-year case study of the city of Wuhan in China. Remote Sens. Environ. 2016, 172, 109–125. [Google Scholar] [CrossRef]
- Kalnay, E.; Cai, M. Impact of urbanization and land-use change on climate. Nature 2003, 423, 528–531. [Google Scholar] [CrossRef]
- Arnfield, A.J. Two decades of urban climate research: A review of turbulence, exchanges of energy and water, and the urban heat island. Int. J. Climatol. A J. R. Meteorol. Soc. 2003, 23, 1–26. [Google Scholar] [CrossRef]
- Voogt, J.A.; Oke, T.R. Thermal remote sensing of urban climates. Remote Sens. Environ. 2003, 86, 370–384. [Google Scholar] [CrossRef]
- Oke, T.R. The energetic basis of the urban heat island. Q. J. R. Meteorol. Soc. 1982, 108, 1–24. [Google Scholar] [CrossRef]
- Howard, L. The Climate of London; London Harvey and Dorton: London, UK, 1833; Volume 2. [Google Scholar]
- Mills, G. Luke Howard and The Climate of London. Weather 2008, 63, 153–157. [Google Scholar] [CrossRef]
- Oke, T.R. City size and the urban heat island. Atmos. Environ. 1973, 7, 769–779. [Google Scholar] [CrossRef]
- Knapp, S.; Kühn, I.; Stolle, J.; Klotz, S. Changes in the functional composition of a Central European urban flora over three centuries. Perspect. Plant Ecol. Evol. Syst. 2010, 12, 235–244. [Google Scholar] [CrossRef]
- Reid, W.V. Biodiversity hotspots. Trends Ecol. Evol. 1998, 13, 275–280. [Google Scholar] [CrossRef]
- Mackey, C.W.; Lee, X.; Smith, R.B. Remotely sensing the cooling effects of city scale efforts to reduce urban heat island. Build. Environ. 2012, 49, 348–358. [Google Scholar] [CrossRef]
- Jin, M.; Dickinson, R.E.; Zhang, D. The footprint of urban areas on global climate as characterized by MODIS. J. Clim. 2005, 18, 1551–1565. [Google Scholar] [CrossRef]
- Jin, M.; Shepherd, J.M.; King, M.D. Urban aerosols and their variations with clouds and rainfall: A case study for New York and Houston. J. Geophys. Res. Atmos. 2005, 110. [Google Scholar] [CrossRef]
- Gong, P.; Liang, S.; Carlton, E.J.; Jiang, Q.; Wu, J.; Wang, L.; Remais, J.V. Urbanisation and health in China. Lancet 2012, 379, 843–852. [Google Scholar] [CrossRef]
- O’Loughlin, J.; Witmer, F.D.; Linke, A.M.; Laing, A.; Gettelman, A.; Dudhia, J. Climate variability and conflict risk in East Africa, 1990–2009. Proc. Natl. Acad. Sci. USA 2012, 109, 18344–18349. [Google Scholar] [CrossRef] [PubMed] [Green Version]
- Steeneveld, G.-J.; Koopmans, S.; Heusinkveld, B.; Van Hove, L.; Holtslag, A. Quantifying urban heat island effects and human comfort for cities of variable size and urban morphology in the Netherlands. J. Geophys. Res. Atmos. 2011, 116, D20129. [Google Scholar] [CrossRef]
- Clinton, N.; Gong, P. MODIS detected surface urban heat islands and sinks: Global locations and controls. Remote Sens. Environ. 2013, 134, 294–304. [Google Scholar] [CrossRef]
- Peng, S.; Piao, S.; Ciais, P.; Friedlingstein, P.; Ottle, C.; Breon, F.M.; Nan, H.; Zhou, L.; Myneni, R.B. Surface urban heat island across 419 global big cities. Environ. Sci. Technol. 2012, 46, 696–703. [Google Scholar] [CrossRef] [PubMed]
- Li, J.; Song, C.; Cao, L.; Zhu, F.; Meng, X.; Wu, J. Impacts of landscape structure on surface urban heat islands: A case study of Shanghai, China. Remote Sens. Environ. 2011, 115, 3249–3263. [Google Scholar] [CrossRef]
- Dousset, B.; Gourmelon, F. Satellite multi-sensor data analysis of urban surface temperatures and landcover. ISPRS-J. Photogramm. Remote Sens. 2003, 58, 43–54. [Google Scholar] [CrossRef]
- Zhou, D.; Zhao, S.; Liu, S.; Zhang, L.; Zhu, C. Surface urban heat island in China’s 32 major cities: Spatial patterns and drivers. Remote Sens. Environ. 2014, 152, 51–61. [Google Scholar] [CrossRef]
- Imhoff, M.L.; Zhang, P.; Wolfe, R.E.; Bounoua, L. Remote sensing of the urban heat island effect across biomes in the continental USA. Remote Sens. Environ. 2010, 114, 504–513. [Google Scholar] [CrossRef] [Green Version]
- Zhang, P.; Imhoff, M.L.; Wolfe, R.E.; Bounoua, L. Characterizing urban heat islands of global settlements using MODIS and nighttime lights products. Can. J. Remote Sens. 2010, 36, 185–196. [Google Scholar] [CrossRef] [Green Version]
- Zhou, D.; Zhang, L.; Hao, L.; Sun, G.; Liu, Y.; Zhu, C. Spatiotemporal trends of urban heat island effect along the urban development intensity gradient in China. Sci. Total Environ. 2016, 544, 617–626. [Google Scholar] [CrossRef] [PubMed]
- Yao, R.; Wang, L.; Huang, X.; Gong, W.; Xia, X. Greening in Rural Areas Increases the Surface Urban Heat Island Intensity. Geophys. Res. Lett. 2019, 46, 2204–2212. [Google Scholar] [CrossRef]
- Zhao, L.; Lee, X.; Smith, R.B.; Oleson, K. Strong contributions of local background climate to urban heat islands. Nature 2014, 511, 216–219. [Google Scholar] [CrossRef]
- Sobrino, J.A.; Oltra-Carrió, R.; Sòria, G.; Bianchi, R.; Paganini, M. Impact of spatial resolution and satellite overpass time on evaluation of the surface urban heat island effects. Remote Sens. Environ. 2012, 117, 50–56. [Google Scholar] [CrossRef]
- Li, Y.-y.; Zhang, H.; Kainz, W. Monitoring patterns of urban heat islands of the fast-growing Shanghai metropolis, China: Using time-series of Landsat TM/ETM+ data. Int. J. Appl. Earth Obs. 2012, 19, 127–138. [Google Scholar] [CrossRef]
- Fu, P.; Weng, Q. Consistent land surface temperature data generation from irregularly spaced Landsat imagery. Remote Sens. Environ. 2016, 184, 175–187. [Google Scholar] [CrossRef]
- Fu, P.; Weng, Q. A time series analysis of urbanization induced land use and land cover change and its impact on land surface temperature with Landsat imagery. Remote Sens. Environ. 2016, 175, 205–214. [Google Scholar] [CrossRef]
- Cai, G.; Du, M.; Xue, Y. Monitoring of urban heat island effect in Beijing combining ASTER and TM data. Int. J. Remote Sens. 2011, 32, 1213–1232. [Google Scholar] [CrossRef]
- Niu, L.; Tang, R.; Jiang, Y.; Zhou, X. Spatiotemporal Patterns and Drivers of the Surface Urban Heat Island in 36 Major Cities in China: A Comparison of Two Different Methods for Delineating Rural Areas. Sustainability 2020, 12, 478. [Google Scholar] [CrossRef] [Green Version]
- Yao, R.; Wang, L.; Gui, X.; Zheng, Y.; Zhang, H.; Huang, X. Urbanization Effects on Vegetation and Surface Urban Heat Islands in China’s Yangtze River Basin. Remote Sens. 2017, 9, 540. [Google Scholar] [CrossRef] [Green Version]
- Fan, W.; Yuanshu, J. Analysis of urban heat island based on Landsat TM/ETM+ imagery in Nanchang city. J. Nanjing Univ. Inf. Sci. Technol. 2013, 5, 326–330. (In Chinese) [Google Scholar]
- Danielson, J.J.; Gesch, D.B. Global Multi-Resolution Terrain Elevation Data 2010 (GMTED2010); U.S. Geological Survey Open-File Report 2011–1073; US Department of the Interior, US Geological Survey: Sioux Falls, SD, USA, 2011.
- Kalnay, E.; Kanamitsu, M.; Kistler, R.; Collins, W.; Deaven, D.; Gandin, L.; Iredell, M.; Saha, S.; White, G.; Woollen, J.; et al. The NCEP/NCAR 40-Year Reanalysis Project. Bull. Am. Meteorol. Soc. 1996, 77, 437–471. [Google Scholar] [CrossRef] [Green Version]
- Shen, Y.; Shen, H.; Cheng, Q.; Zhang, L. Generating Comparable and Fine-Scale Time Series of Summer Land Surface Temperature for Thermal Environment Monitoring. IEEE J. Sel. Top. Appl. Earth Obs. Remote Sens. 2021, 14, 2136–2147. [Google Scholar] [CrossRef]
- Shen, Y.; Shen, H.; Li, H.; Cheng, Q. Long-term urban impervious surface monitoring using spectral mixture analysis: A case study of Wuhan city in China. In Proceedings of the 2016 IEEE International Geoscience and Remote Sensing Symposium (IGARSS), Beijing, China, 10–15 July 2016; pp. 6754–6757. [Google Scholar]
- Jiménez-Muñoz, J.C. A generalized single-channel method for retrieving land surface temperature from remote sensing data. J. Geophys. Res. 2003, 108. [Google Scholar] [CrossRef] [Green Version]
- Jiménez-Muñoz, J.C.; Sobrino, J.A.; Skoković, D.; Mattar, C.; Cristóbal, J. Land Surface Temperature Retrieval Methods From Landsat-8 Thermal Infrared Sensor Data. IEEE Geosci. Remote. Sens. Ing. Lett. 2014, 11, 1840–1843. [Google Scholar] [CrossRef]
- Jiménez-Muñoz, J.C.; Cristobal, J.; Sobrino, J.A.; Soria, G.; Ninyerola, M.; Pons, X.; Pons, X. Revision of the Single-Channel Algorithm for Land Surface Temperature Retrieval From Landsat Thermal-Infrared Data. IEEE T. Geosci. Remote 2009, 47, 339–349. [Google Scholar] [CrossRef]
- Quan, J.; Zhan, W.; Ma, T.; Du, Y.; Guo, Z.; Qin, B. An integrated model for generating hourly Landsat-like land surface temperatures over heterogeneous landscapes. Remote Sens. Environ. 2018, 206, 403–423. [Google Scholar] [CrossRef]
- Streutker, D.R. A remote sensing study of the urban heat island of Houston, Texas. Int. J. Remote Sens. 2002, 23, 2595–2608. [Google Scholar] [CrossRef]
- Price, J.C. Land surface temperature measurements from the split window channels of the NOAA 7 advanced very high resolution radiometer. J. Geophys. Res. 1984, 89, 7231–7237. [Google Scholar] [CrossRef]
- Cheng, Q.; Liu, H.; Shen, H.; Wu, P.; Zhang, L. A Spatial and Temporal Nonlocal Filter-Based Data Fusion Method. IEEE T. Geosci. Remote 2017, 55, 4476–4488. [Google Scholar] [CrossRef] [Green Version]
- Wu, X.; Wang, G.; Yao, R.; Wang, L.; Yu, D.; Gui, X. Investigating Surface Urban Heat Islands in South America Based on MODIS Data from 2003–2016. Remote Sens. 2019, 11, 1212. [Google Scholar] [CrossRef] [Green Version]
- Yao, R.; Wang, L.; Huang, X.; Chen, J.; Li, J.; Niu, Z. Less sensitive of urban surface to climate variability than rural in Northern China. Sci. Total Environ. 2018, 628–629, 650–660. [Google Scholar] [CrossRef]
- Niu, L.; Tang, R. Long-term analysis of the relationship between urban heat island and economic development over 34 major cities in China. IOP Conf. Ser. Mater. Sci. Eng. 2019, 592, 12178. [Google Scholar] [CrossRef]
- Shen, Y.; Shen, H.; Cheng, Q.; Huang, L.; Zhang, L. Monitoring Three-Decade Expansion of China’s Major Cities Based on Satellite Remote Sensing Images. Remote Sens. 2020, 12, 491. [Google Scholar] [CrossRef] [Green Version]
- Mann, H.B. Nonparametric tests against trend. Econom. J. Econom. Soc. 1945, 13, 245–259. [Google Scholar] [CrossRef]
- Kendall, M.G. Rank Correlation Methods; Griffin: Oxford, UK, 1948. [Google Scholar]
- Gong, P.; Howarth, P. The use of structural information for improving land-cover classification accuracies at the rural-urban fringe. Photogramm. Eng. Remote Sens. 1990, 56, 67–73. [Google Scholar]
- Rozenfeld, H.D.; Rybski, D.; Andrade, J.S.; Batty, M.; Stanley, H.E.; Makse, H.A. Laws of population growth. Proc. Natl. Acad. Sci. USA 2008, 105, 18702–18707. [Google Scholar] [CrossRef] [Green Version]
- Zhang, X.; Friedl, M.A.; Schaaf, C.B.; Strahler, A.H.; Schneider, A. The footprint of urban climates on vegetation phenology. Geophys. Res. Lett. 2004, 31. [Google Scholar] [CrossRef]
- Zhou, D.; Zhao, S.; Zhang, L.; Sun, G.; Liu, Y. The footprint of urban heat island effect in China. Sci. Rep. 2015, 5, 11160. [Google Scholar] [CrossRef]
- Yang, Q.; Huang, X.; Tang, Q. The footprint of urban heat island effect in 302 Chinese cities: Temporal trends and associated factors. Sci. Total Environ. 2019, 655, 652–662. [Google Scholar] [CrossRef] [PubMed]
- Qiao, Z.; Wu, C.; Zhao, D.; Xu, X.; Yang, J.; Feng, L.; Sun, Z.; Liu, L. Determining the Boundary and Probability of Surface Urban Heat Island Footprint Based on a Logistic Model. Remote Sens. 2019, 11, 1368. [Google Scholar] [CrossRef] [Green Version]
Publisher’s Note: MDPI stays neutral with regard to jurisdictional claims in published maps and institutional affiliations. |
© 2021 by the authors. Licensee MDPI, Basel, Switzerland. This article is an open access article distributed under the terms and conditions of the Creative Commons Attribution (CC BY) license (https://creativecommons.org/licenses/by/4.0/).

