Article

An Urban Flooding Index for Unsupervised Inundated Urban Area Detection Using Sentinel-1 Polarimetric SAR Images

1
Guangdong Provincial Key Laboratory of Urbanization and Geo-Simulation, School of Geography and Planning, Sun Yat-sen University, Guangzhou 510275, China
2
Key Laboratory of Geographic Information Science (Ministry of Education), School of Geographic Sciences, East China Normal University, 500 Dongchuan Rd, Shanghai 200241, China
3
Pearl River Water Resources Research Institute, 105 Tianshou Rd, Guangzhou 510610, China
*
Author to whom correspondence should be addressed.
Remote Sens. 2021, 13(22), 4511; https://doi.org/10.3390/rs13224511
Submission received: 11 September 2021 / Revised: 7 November 2021 / Accepted: 8 November 2021 / Published: 10 November 2021
(This article belongs to the Special Issue Applications of Remote Sensing Imagery for Urban Areas)

Abstract

:
Urban flooding causes a variation in radar return from urban areas. However, such variation has not been thoroughly examined for different polarizations because of the lack of polarimetric SAR (PolSAR) images and ground truth data simultaneously collected over flooded urban areas. This condition hinders not only the understanding of the effect mechanism of urban flooding under different polarizations but also the development of advanced methods that could improve the accuracy of inundated urban area detection. Using Sentinel-1 PolSAR and Jilin-1 high-resolution optical images acquired on the same day over flooded urban areas in Golestan, Iran, this study investigated the characteristics and mechanisms of the radar return changes induced by urban flooding under different polarizations and proposed a new method for unsupervised inundated urban area detection. This study found that urban flooding caused a backscattering coefficient increase (BCI) and interferometric coherence decrease (ICD) in VV and VH polarizations. Furthermore, VV polarization was more sensitive to the BCI and ICD than VH polarization. In light of these findings, the ratio between the BCI and ICD was defined as an urban flooding index (UFI), and the UFI in VV polarization was used for the unsupervised detection of flooded urban areas. The overall accuracy, detection accuracy, and false alarm rate attained by the UFI-based method were 96.93%, 91.09%, and 0.95%, respectively. Compared with the conventional unsupervised method based on the ICD and that based on the fusion of backscattering coefficients and interferometric coherences (FBI), the UFI-based method achieved higher overall accuracy. The performance of VV was evaluated and compared to that of VH in the flooded urban area detection using the UFI-, ICD-, and FBI-based methods, respectively. VV polarization produced higher overall accuracy than VH polarization in all the methods, especially in the UFI-based method. By using VV instead of VH polarization, the UFI-based method improved the detection accuracy by 38.16%. These results indicated that the UFI-based method improved flooded urban area detection by synergizing the BCI and ICD in VV polarization.

Graphical Abstract

1. Introduction

Urban flooding is one of the most frequent natural disasters that threaten city populations [1,2,3]. According to a report by the United Nations Office for Disaster Risk Reduction (UNISDR), floods accounted for nearly half of all weather-related disasters, affecting approximately 2.30 billion people between 1995 and 2015 [4]. Due to global climate change, extreme rainfall and flooding events are becoming increasingly frequent in urban areas [5,6,7,8]. At nearly two-thirds of the world’s rainfall stations, measurements are on the increase [5]. The extreme precipitation caused by climate change intensifies the magnitude of and susceptibility to flood events [8]. Moreover, growing populations and rising urbanization exacerbate the potential losses and damages caused by floods [9]. Urbanization not only intensifies the flood response, but also the frequency and number of heavy rains [6]. By 2050, it is estimated that worldwide losses due to flooding will reach 52.00 billion dollars in social and economic costs alone [10]. Therefore, it is necessary to develop timely and accurate methods for flooded urban area detection to address the growing threat from floods [11].
Remote sensing is commonly used for flood mapping because of its ability to observe large areas consistently at a reasonable cost [12]. Optical remote sensing images are preferred for monitoring surface water dynamics because they provide detailed spectral information [13,14,15,16]. The main principle is that the absorption of water in near-infrared to mid-infrared bands is stronger than other visible wavelengths [13]. Therefore, some water indices were proposed to extract water range, such as the normalized difference water index (NDWI) [17] and the modified normalized difference water index (MNDWI) [14]. However, it can be difficult to obtain useful optical remote sensing data under the rainy and cloudy weather conditions often accompanying floods [18]. Synthetic aperture radar (SAR), which possesses all-weather and day–night imaging abilities, is a promising tool for timely flood detection [2]. Compared with other land cover types, water typically contains lower radar backscatter due to specular reflection on the water surface [19]. Therefore, floods can be detected based on changes in radar backscatter using multi-temporal SAR images [20,21].
Despite the widespread use of SAR images in flood mapping, it is still challenging to map urban floods using SAR because the propagation of radar signals is complex and ambiguous in urban environments [22]. To date, a few studies have found that SAR images with spatial resolutions higher than 3 m (e.g., TerraSAR-X and COSMO-SkyMed SAR images) can identify inundated roads and streets in urban areas [19,23]. However, tall buildings and trees can cause substantial shadow and layover areas in high-resolution SAR images, obscuring or blocking the inundated streets and roads [19]. Furthermore, rain or wind significantly affect water surface roughness and may cause a significant change in radar backscatter, resulting in flood mapping errors in urban environments [23]. Additionally, most high-resolution SAR images are only acquired occasionally, which may lead to difficulties in timely detection of urban flooding.
Flooded urban areas (i.e., inundated streets, roads, and buildings) can be detected as a whole using medium-resolution SAR data to circumvent the problems encountered by high-resolution SAR images. Recently, medium-resolution SAR data collected by the Sentinel-1 satellites were made available for routine land surface observations. The Sentinel-1 mission consists of a constellation of two satellites with C-band SAR, which reduces the revisit time to 6 days, thereby providing SAR data to global users at no cost within 3 h of observation [24]. Moreover, the Sentinel-1 mission provides polarimetric SAR (PolSAR) data that substantially improves the characterization of different scattering mechanisms of the observed targets, as compared to that of traditional single-polarization SAR images [25]. Therefore, the Sentinel-1 mission provides an unprecedented capability regarding the detection of flooded urban areas. However, problems in flood detection remain, as most of the proposed techniques do not apply to flooded urban areas because of the significant difference in radar return between flooded urban areas and flooded rural areas (Figure 1).
Several studies found that flooding causes a variation in radar backscatter and interferometric coherence [18,22,26]. The double-bounce backscattering between flooded ground and buildings is stronger than that between asphalt surface and buildings [18]. The interferometric coherence between SAR image pairs can decrease in urban areas due to the presence of floodwater. Thus, it can be used alone or jointly with radar backscatter to detect flooded urban areas [26,27]. Nevertheless, limited studies have been carried out to evaluate and compare the radar backscatter and interferometric coherence changes under different polarizations of Sentinel-1 data. Notably, Watanabe, et al. [28] investigated the variation in radar backscatter over inundated built-up areas by using PiSAR images, and found that HV polarization was more sensitive to the radar backscatter variation than the other polarizations. However, this finding was made for L-band images and may not be applicable to C-band Sentinel-1data.
Overall, the way urban flooding affects radar return at different polarizations of Sentinel-1 SAR remains barely known. This lack of information hinders the development of advanced unsupervised methods for improving inundated urban area detection. Unsupervised methods are more practical and necessary than supervised methods for timely flooded urban area detection because ground truth data are difficult to collect during flooding events. This study investigated how urban flooding affected the radar return at different polarizations of Sentinel-1 images and proposed a new method that can take advantage of the radar return variation in the optimal polarization to improve inundated urban area detection. The method proposed herein can provide a synoptic overview of flooded urban areas that can be used to examine flooding disasters and calibrate or validate urban flood inundation models. This study is organized as follows: Section 2 introduces the study area and data; Section 3 investigates the characteristics and mechanisms of the radar return changes caused by urban flooding; Section 4 proposes an urban flooding index (UFI)-based method for detecting inundated urban areas; Section 5 discusses the results of the UFI-based method and other commonly used methods; Section 6 summarizes the findings and conclusions.

2. Study Area and Data
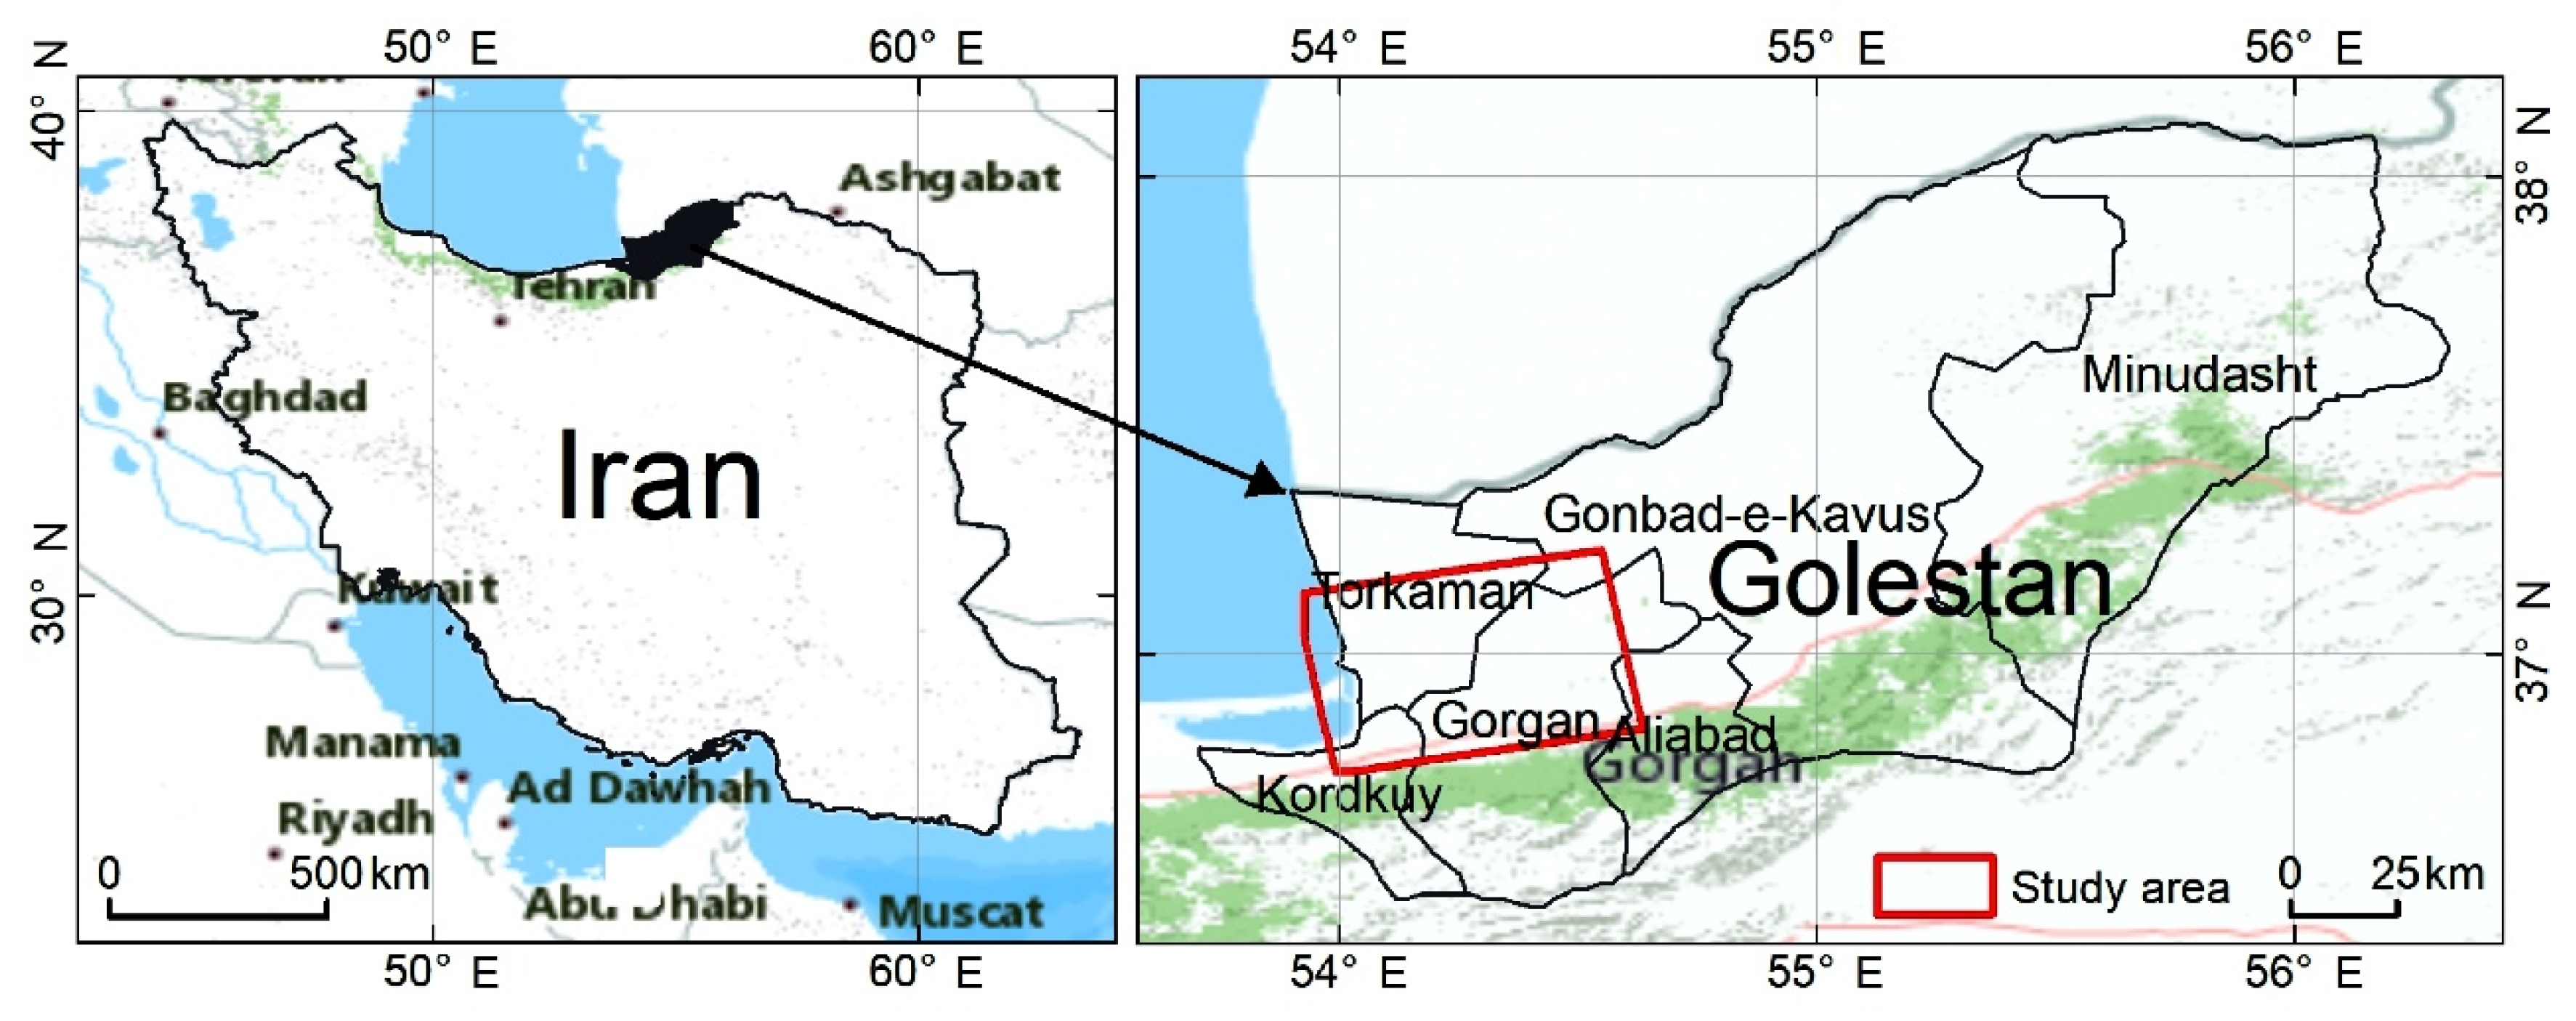
2.1. Study Area

The study area is located in the southwest of the Golestan province, Iran (Figure 2). The climate in Golestan is influenced by the Albertz Mountains, Caspian Sea, northern desert, and forests, which result in significant differences in rainfall among the different regions of the Golestan province [29]. The annual precipitation in Golestan is between 700–1000 mm, which is mainly concentrated in October [30]. The rainfall in the south and west regions is higher than that in the north and east [16]. Furthermore, there are several seasonal rivers, among which the Gorganrood river is the most extended [16], traveling through cities including Aqqala, Siminshahr, Gonbadkavoos, and Bandartorkman.
Iran experienced three severe floods during 17–22 March, 24–26 March, and 31 March to 2 April, in 2019. Cumulatively, these floods affected more than 26 provinces, including 1900 cities and villages, killing more than 70 people and causing property damage of approximately 3.50 billion dollars [31]. In particular, the Golestan province was one of the worst affected provinces during these events (Figure 3), wherein Aqqala and Gonbad Kavous and the villages surrounding these cities were the worst affected areas.

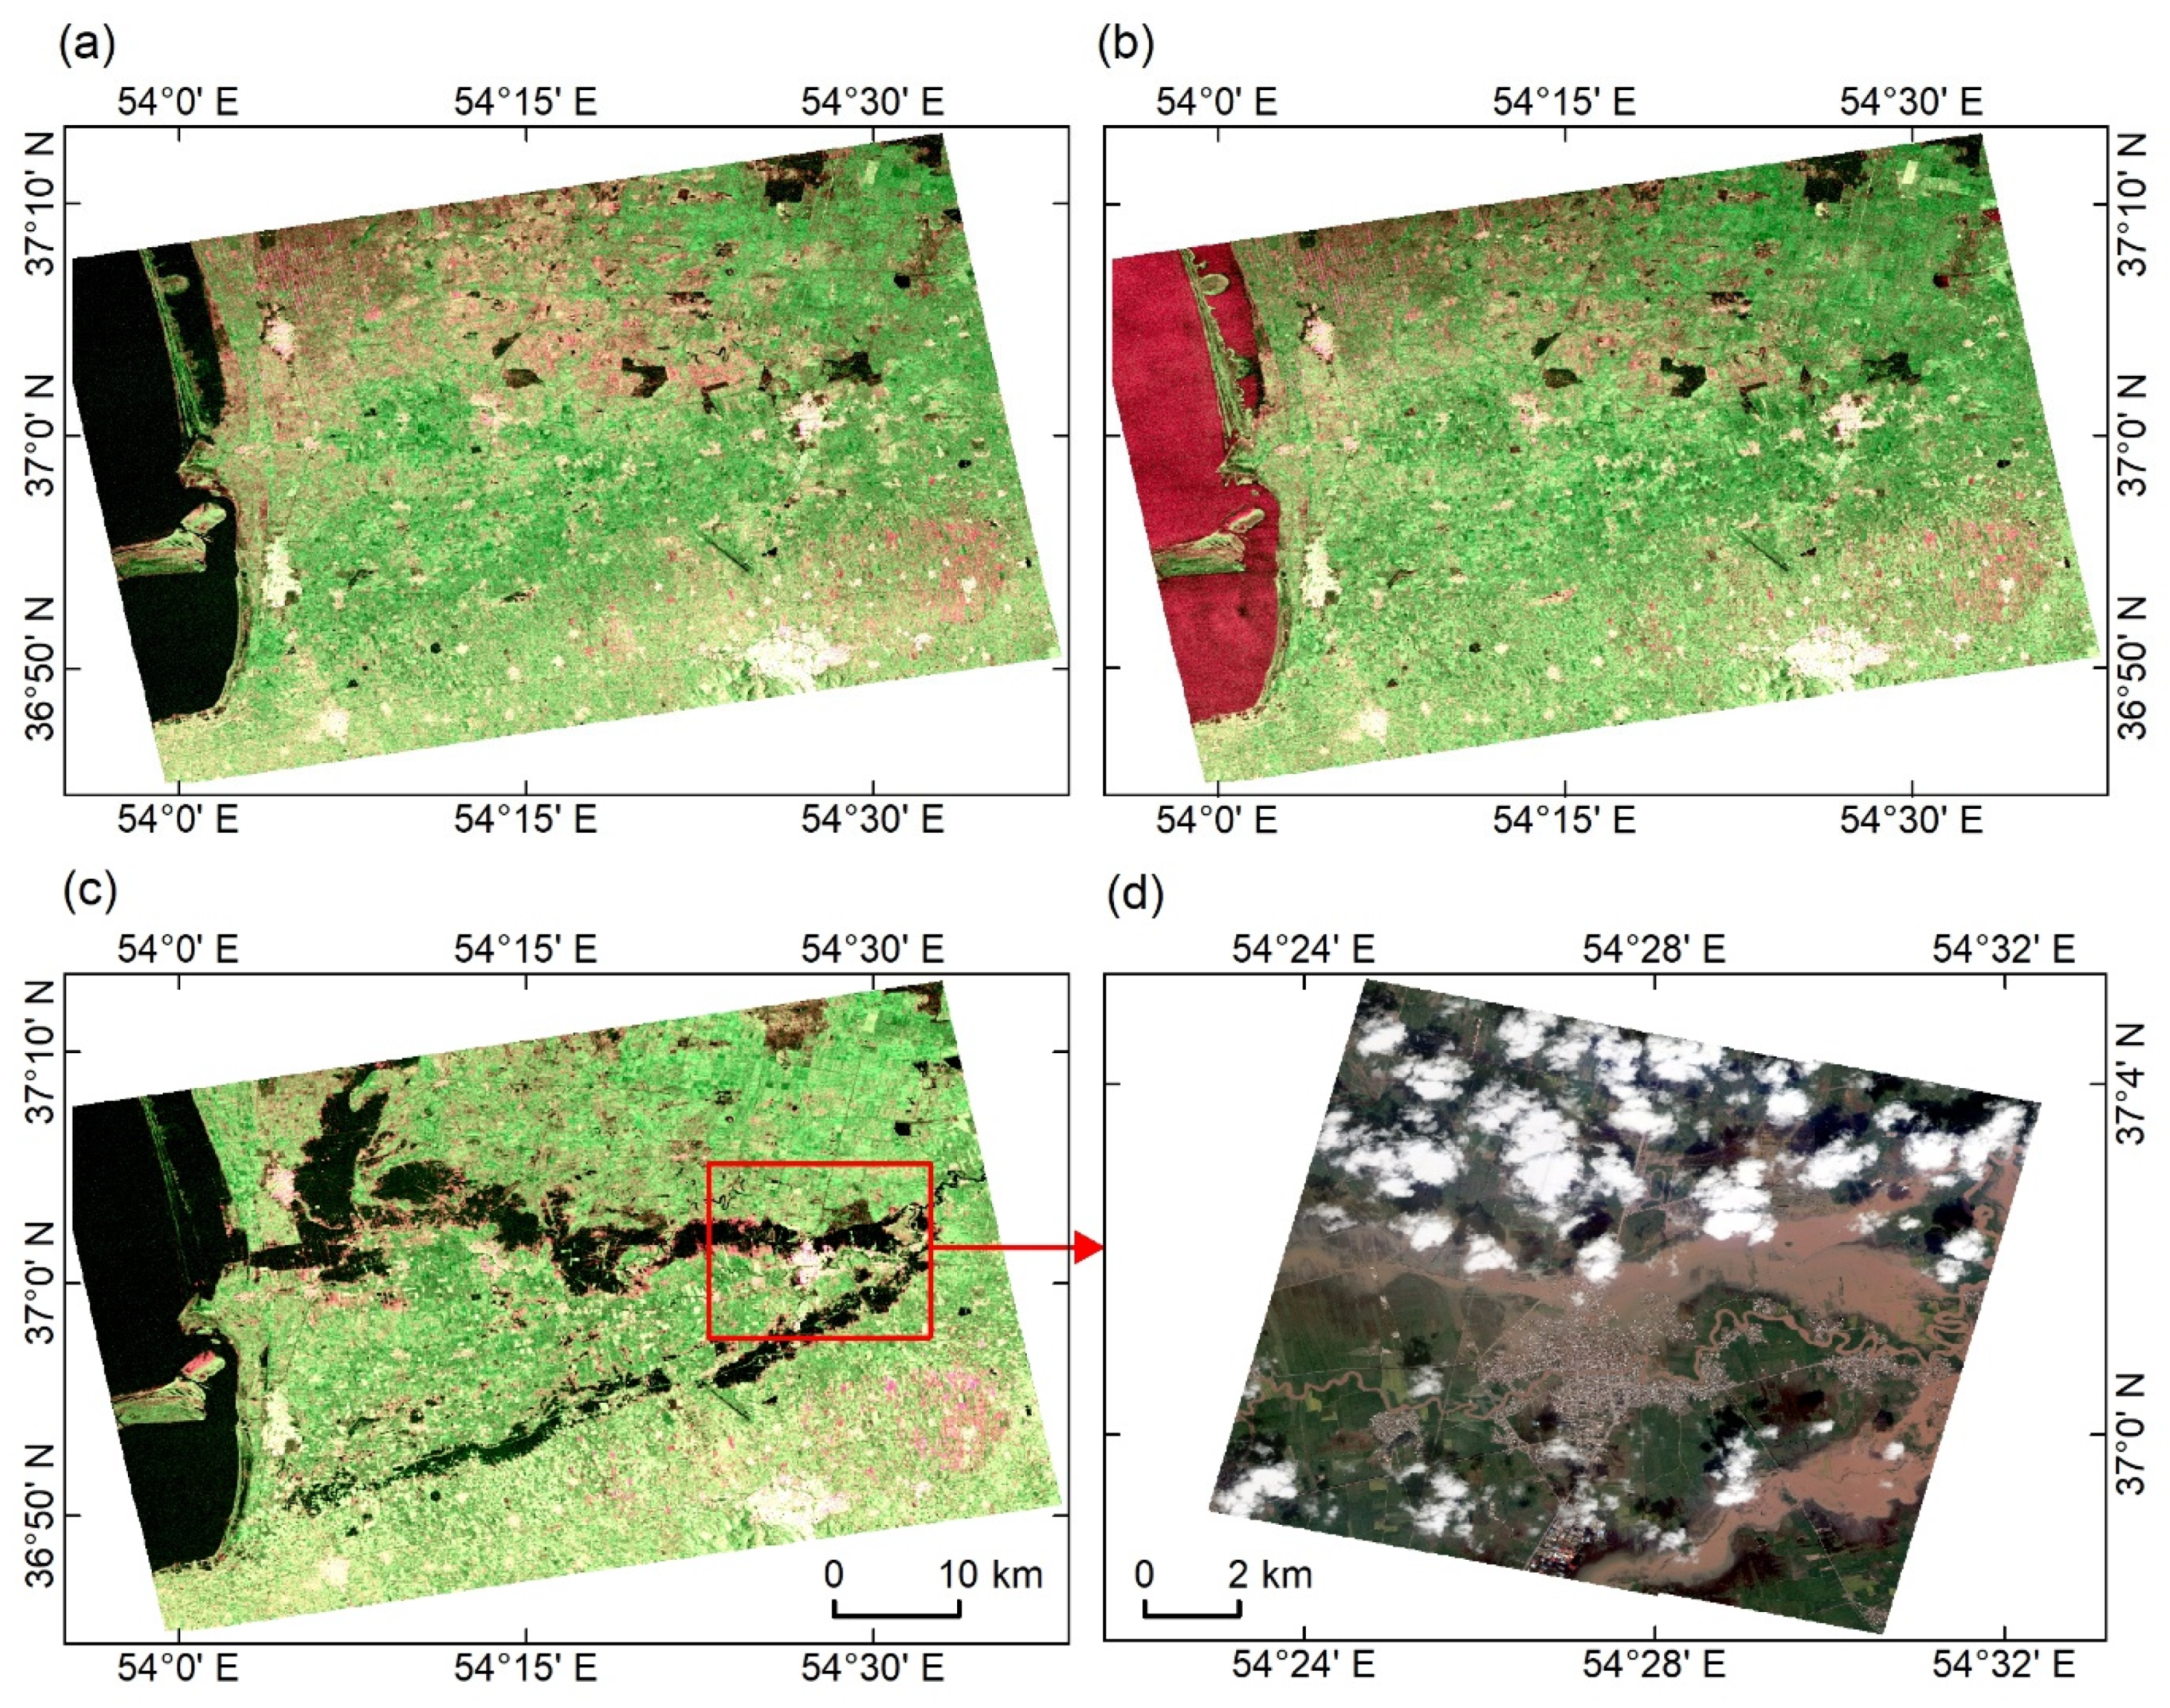
2.2. Sentinel-1 PolSAR Images

Sentinel-1 PolSAR images were used to detect flooded urban areas. As an essential part of the Copernicus program, which is coordinated and managed by the European Commission in partnership with the European Space Agency (ESA), the Sentinel-1 mission consists of a constellation of two satellites (Sentinel-1A and Sentinel-1B), each of which is equipped with a C-band (5.405 GHz) polarimetric SAR instrument, and a revisit period of 12 days [33]. Three repeat-pass Sentinel-1A PolSAR images acquired on March 5, 17, and 29 in 2019 were used to detect the flooded urban areas in the Golestan province. As shown in Figure 4, the first two images (i.e., March 5 and 17) were acquired before flooding, and the third image (i.e., March 29) was obtained during the flooding. The detailed imaging parameters of these images are listed in Table 1. The images were single-look complex (SLC) products acquired in the interferometric wide (IW) swath mode, which includes two polarizations (i.e., VH and VV). As all images were acquired with identical imaging parameters, they could be compared for change detection without the effects of shadows or overlays [23].

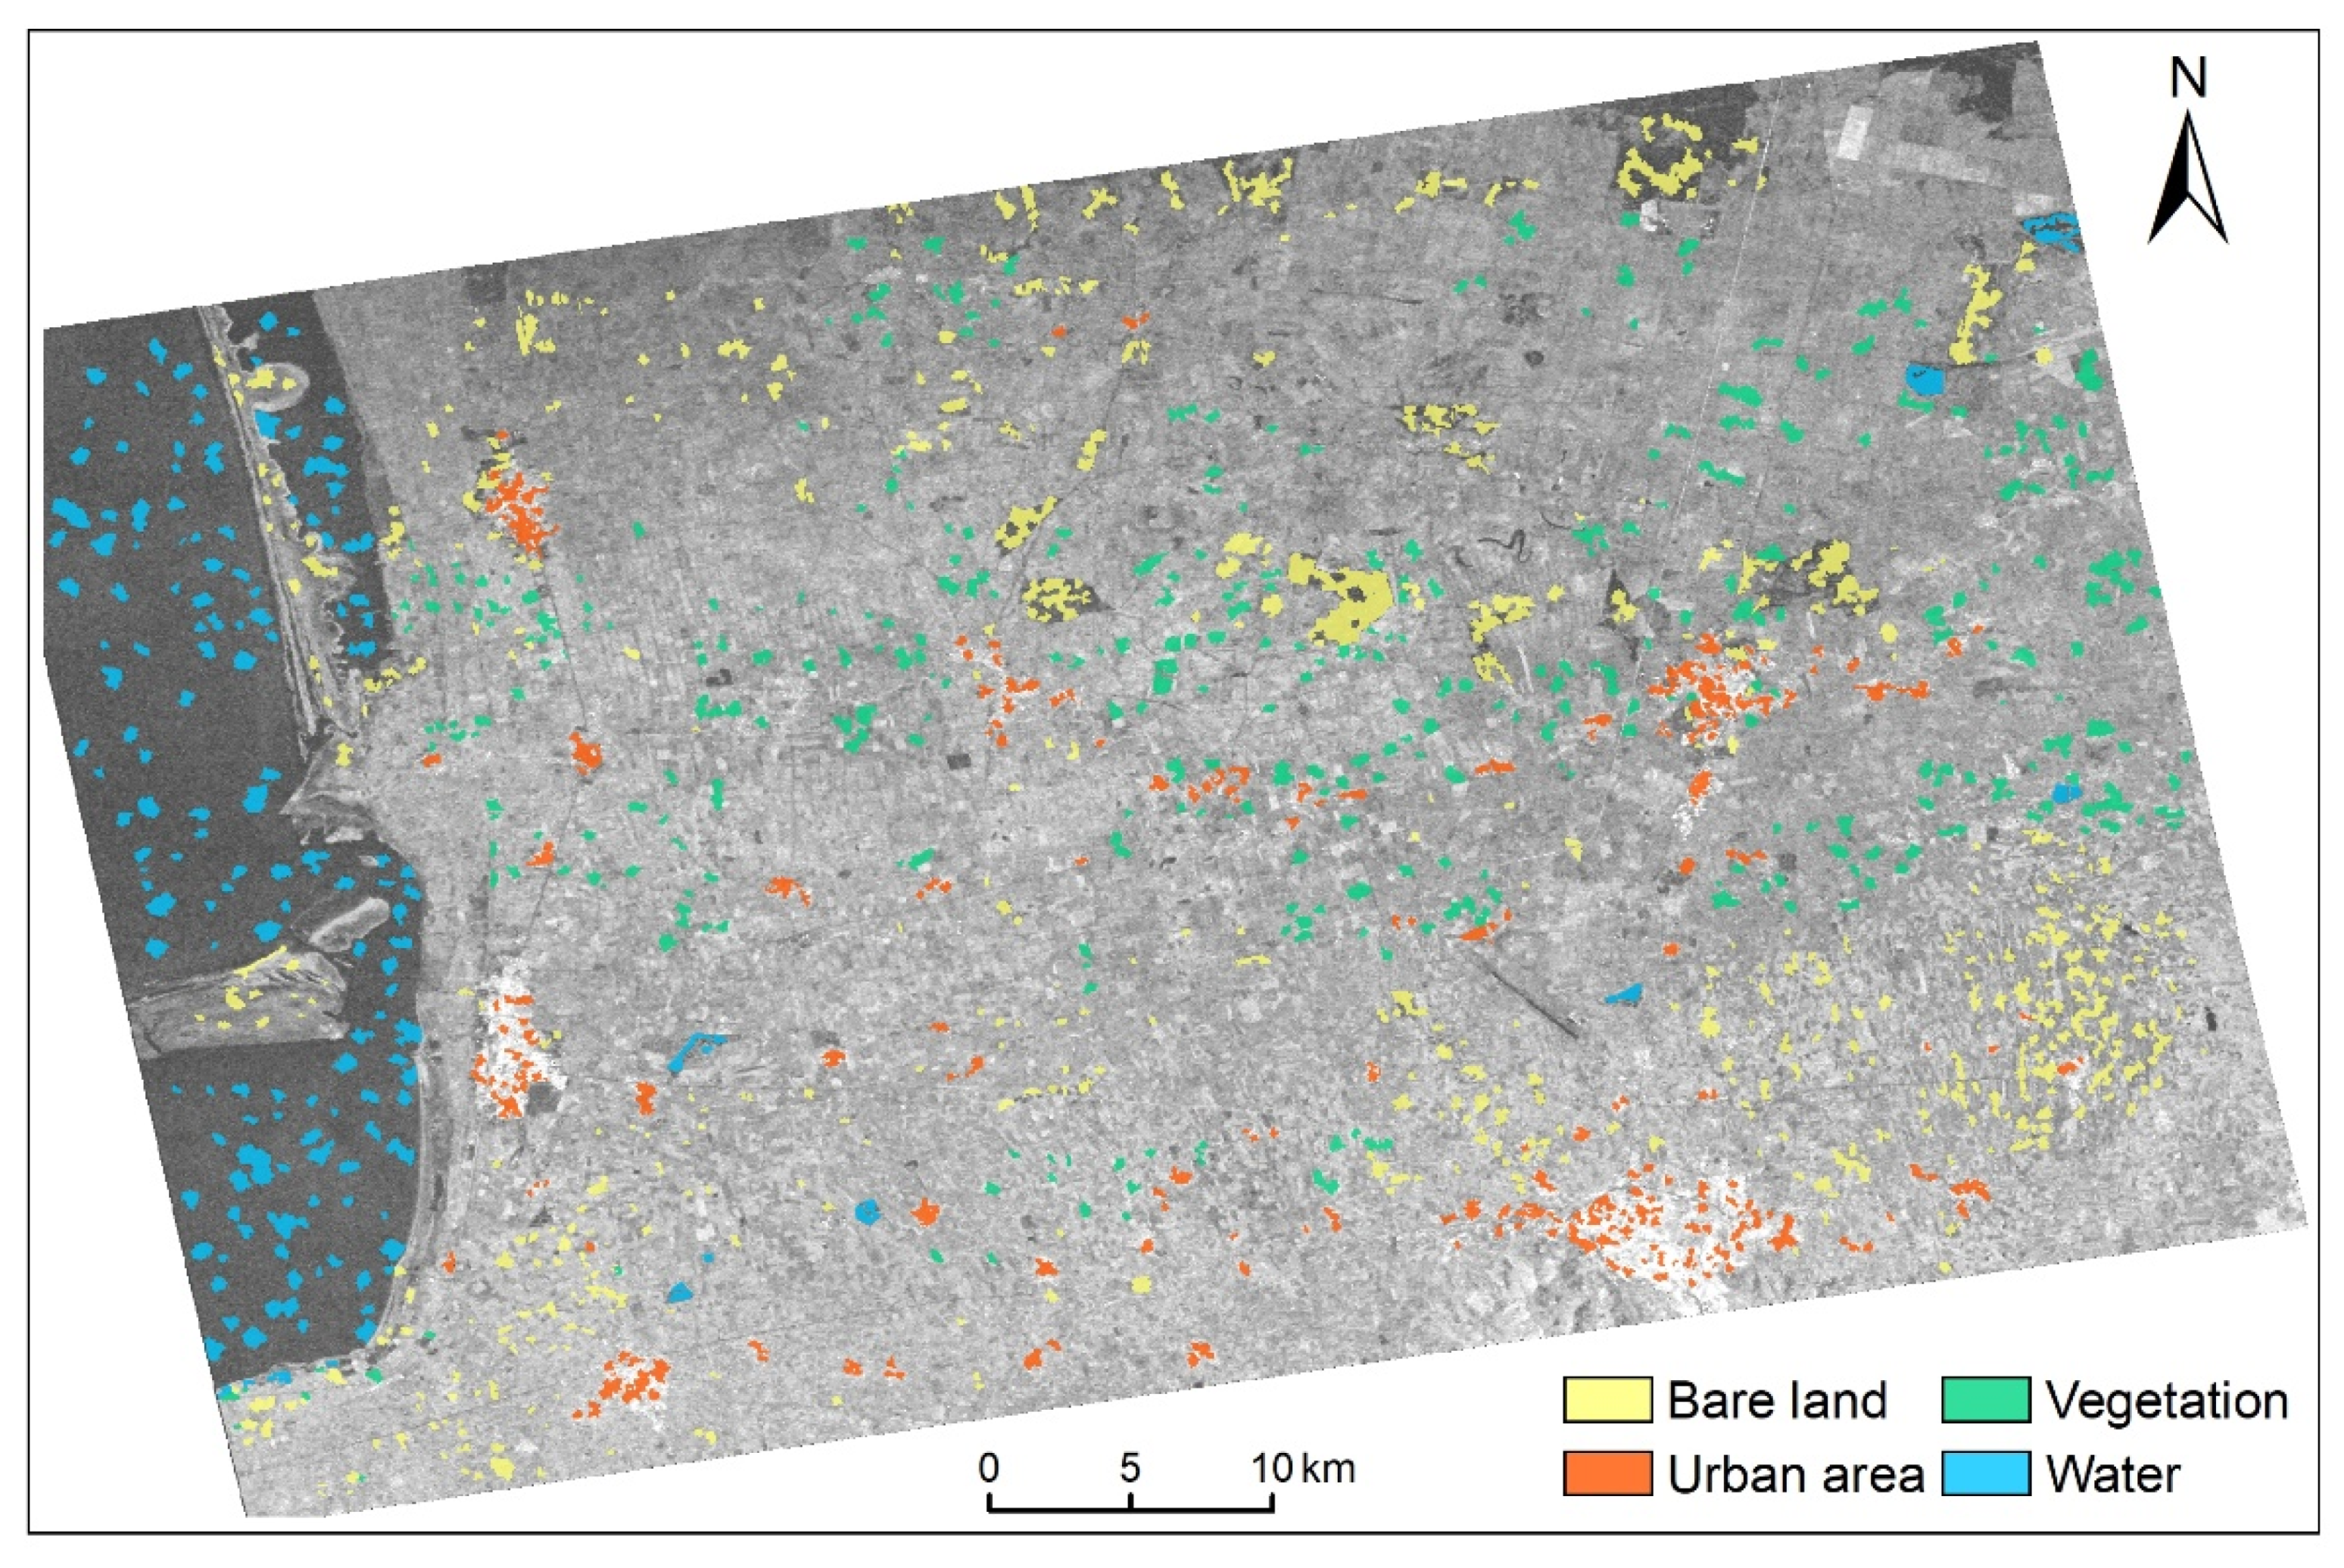
2.3. Ground Truth Data

For an accurate evaluation of inundated urban area detection, flooded and unflooded urban area samples were collected via visual interpretation of a Jilin-1 high-resolution optical image acquired on 29 March 2019(Figure 4d). This Jilin-1 image was provided by the Chang Guang Satellite Technology Corporation (http://discover.charmingglobe.com/ (accessed on 29 September 2019)). It contained one panchromatic band with a spatial resolution of 0.92 m and five multi-spectral bands with spatial resolutions of 3.28 m. The ideal acquisition time and high spatial resolution of the Jilin-1 image allowed us to determine flooded and unflooded urban area samples accurately. In addition to the Jilin-1 image, public news, reports, pictures, and videos on the flooding event were collected to validate the sample selection. The flooded and unflooded urban area samples selected from the Jilin-1 image in Aqqala city are shown in Figure 5. These samples were randomly divided into two groups for training and validation (Table 2). The training samples were used to investigate the characteristics and mechanisms of radar return changes caused by the flooding in urban areas. The validation samples were used for the accuracy assessment on the flooded urban area detection results.
An urban area map was essential for flooded urban area detection to prevent false alarms in other flooded areas, such as flooded trees or crops. In this study, land cover classification was conducted to obtain the urban areas in which flooded urban areas could be detected. Therefore, samples were collected across typical land cover types, including urban areas, vegetation, water, and bare land, by visually interpreting the Sentinel-1 SAR images and high-resolution optical images provided by Google Earth. The spatial distribution of the land cover samples is shown in Figure 6. Note that the samples were randomly categorized into two groups for training and verification (Table 3). A minimum of 128 samples were collected for each land cover class, wherein the sample size of the minimum sample was more than 20 pixels. This quantity and size of samples were sufficient for land cover classification [34].

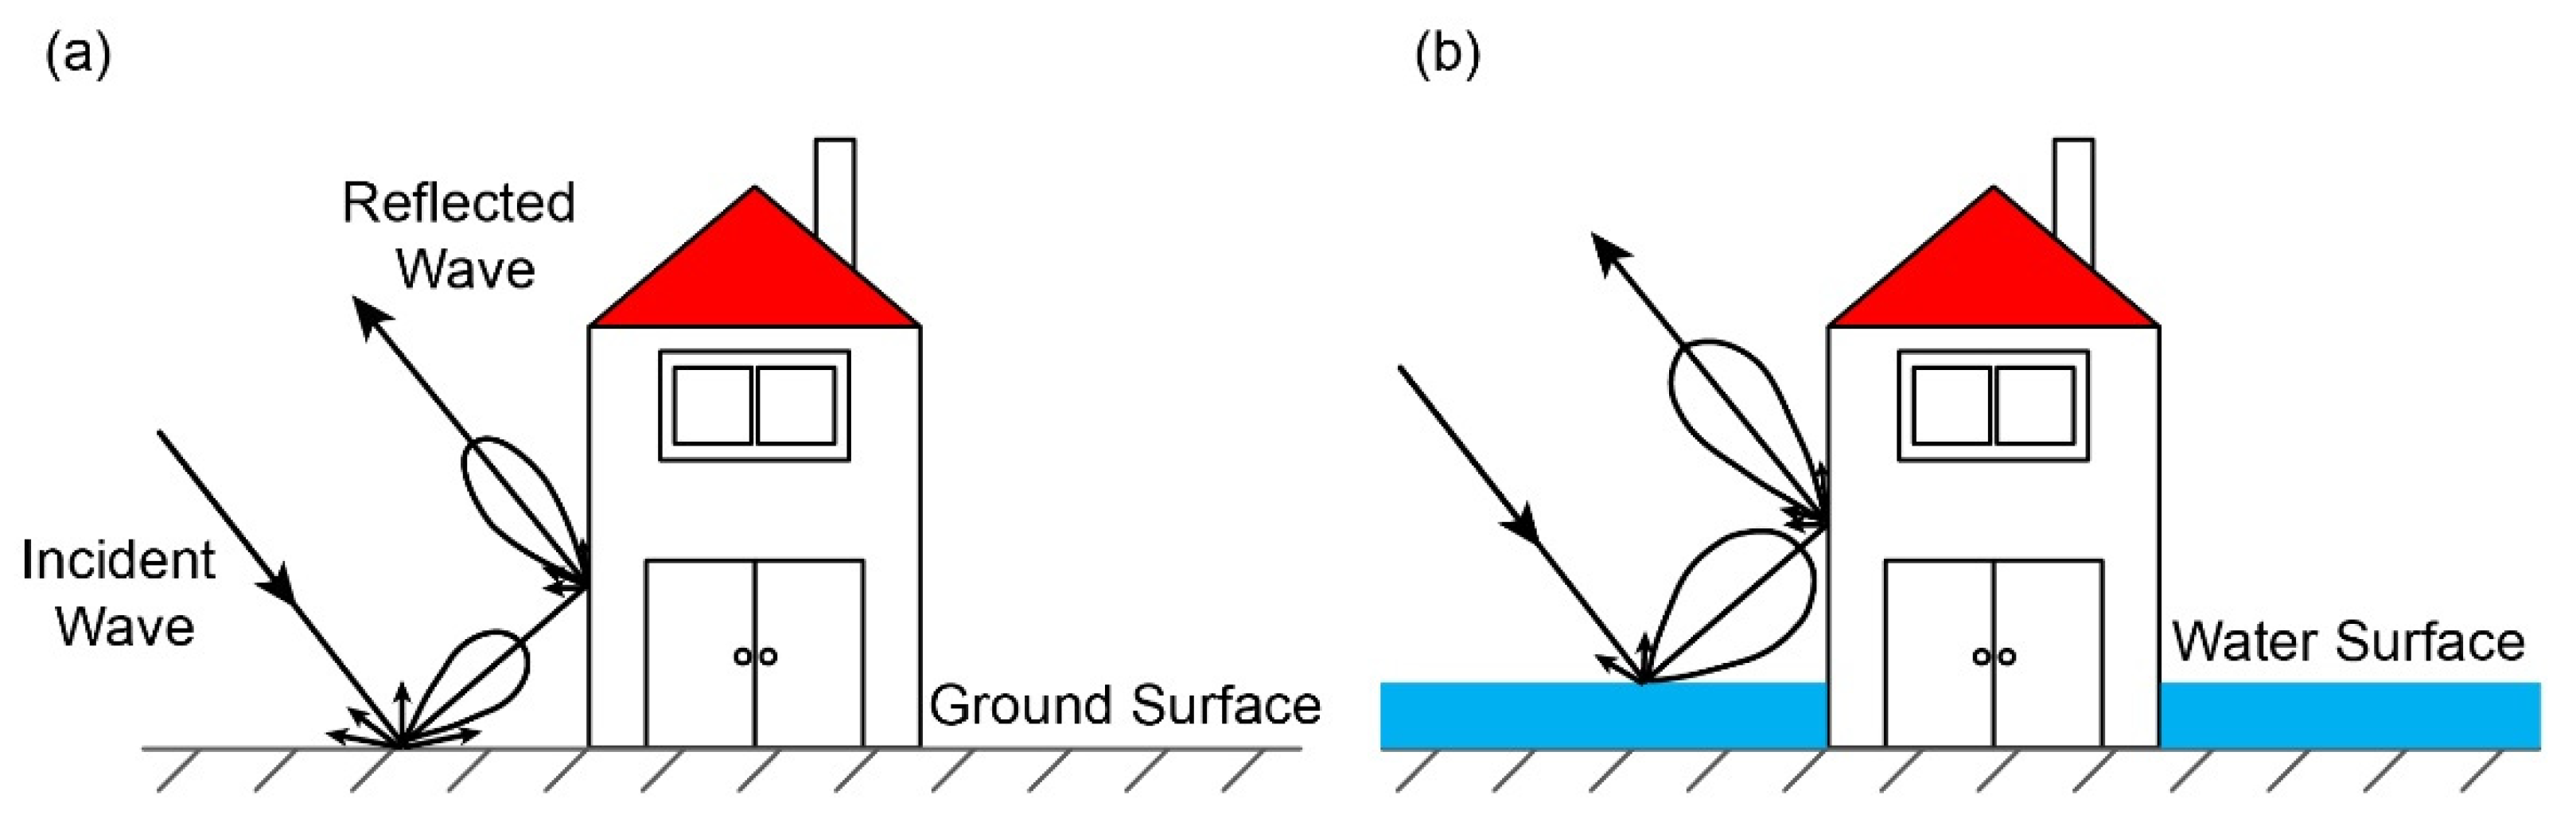
3. Radar Return Changes Caused by Urban Flooding

Flooding can cause the variation in radar backscatter and interferometric coherence in urban areas. However, the signature and mechanism of this change under different polarizations have not been adequately studied. To address this issue, we investigated backscattering coefficient and interferometric coherence variations caused by urban flooding at different polarizations of the Sentinel-1 PolSAR images.

3.1. Preprocessing of Sentinel-1 PolSAR Data

The Sentinel-1 PolSAR data were preprocessed to extract the backscattering coefficients and interferometric coherences. Preprocessing included thermal noise removal, radio calibration, multi-looking, speckle filtering, and terrain correction, which were implemented using SNAP 7.0 software released by the ESA [35]. The radar backscatter from the ground targets observed using terrain observation with progressive scan (TOPS) SAR was affected by thermal noise, especially in the cross-polarization channel. A thermal noise correction aimed to remove such thermal noise in the Sentinel-1 data products. A radiation calibration converted the digital numbers of the PolSAR images to backscattering coefficients, which permitted comparison between PolSAR images acquired on different dates. Multi-looking improved the signal-to-noise ratio of the PolSAR images by reducing the spatial resolution of pixels. The speckles inherent in the PolSAR images were suppressed using the Refined Lee Filter [36], which retains polarization information and subtle details while removing the speckles from homogeneous areas. The range-Doppler terrain correction method was used to compensate for the distance distortion from the observation object to the antenna.

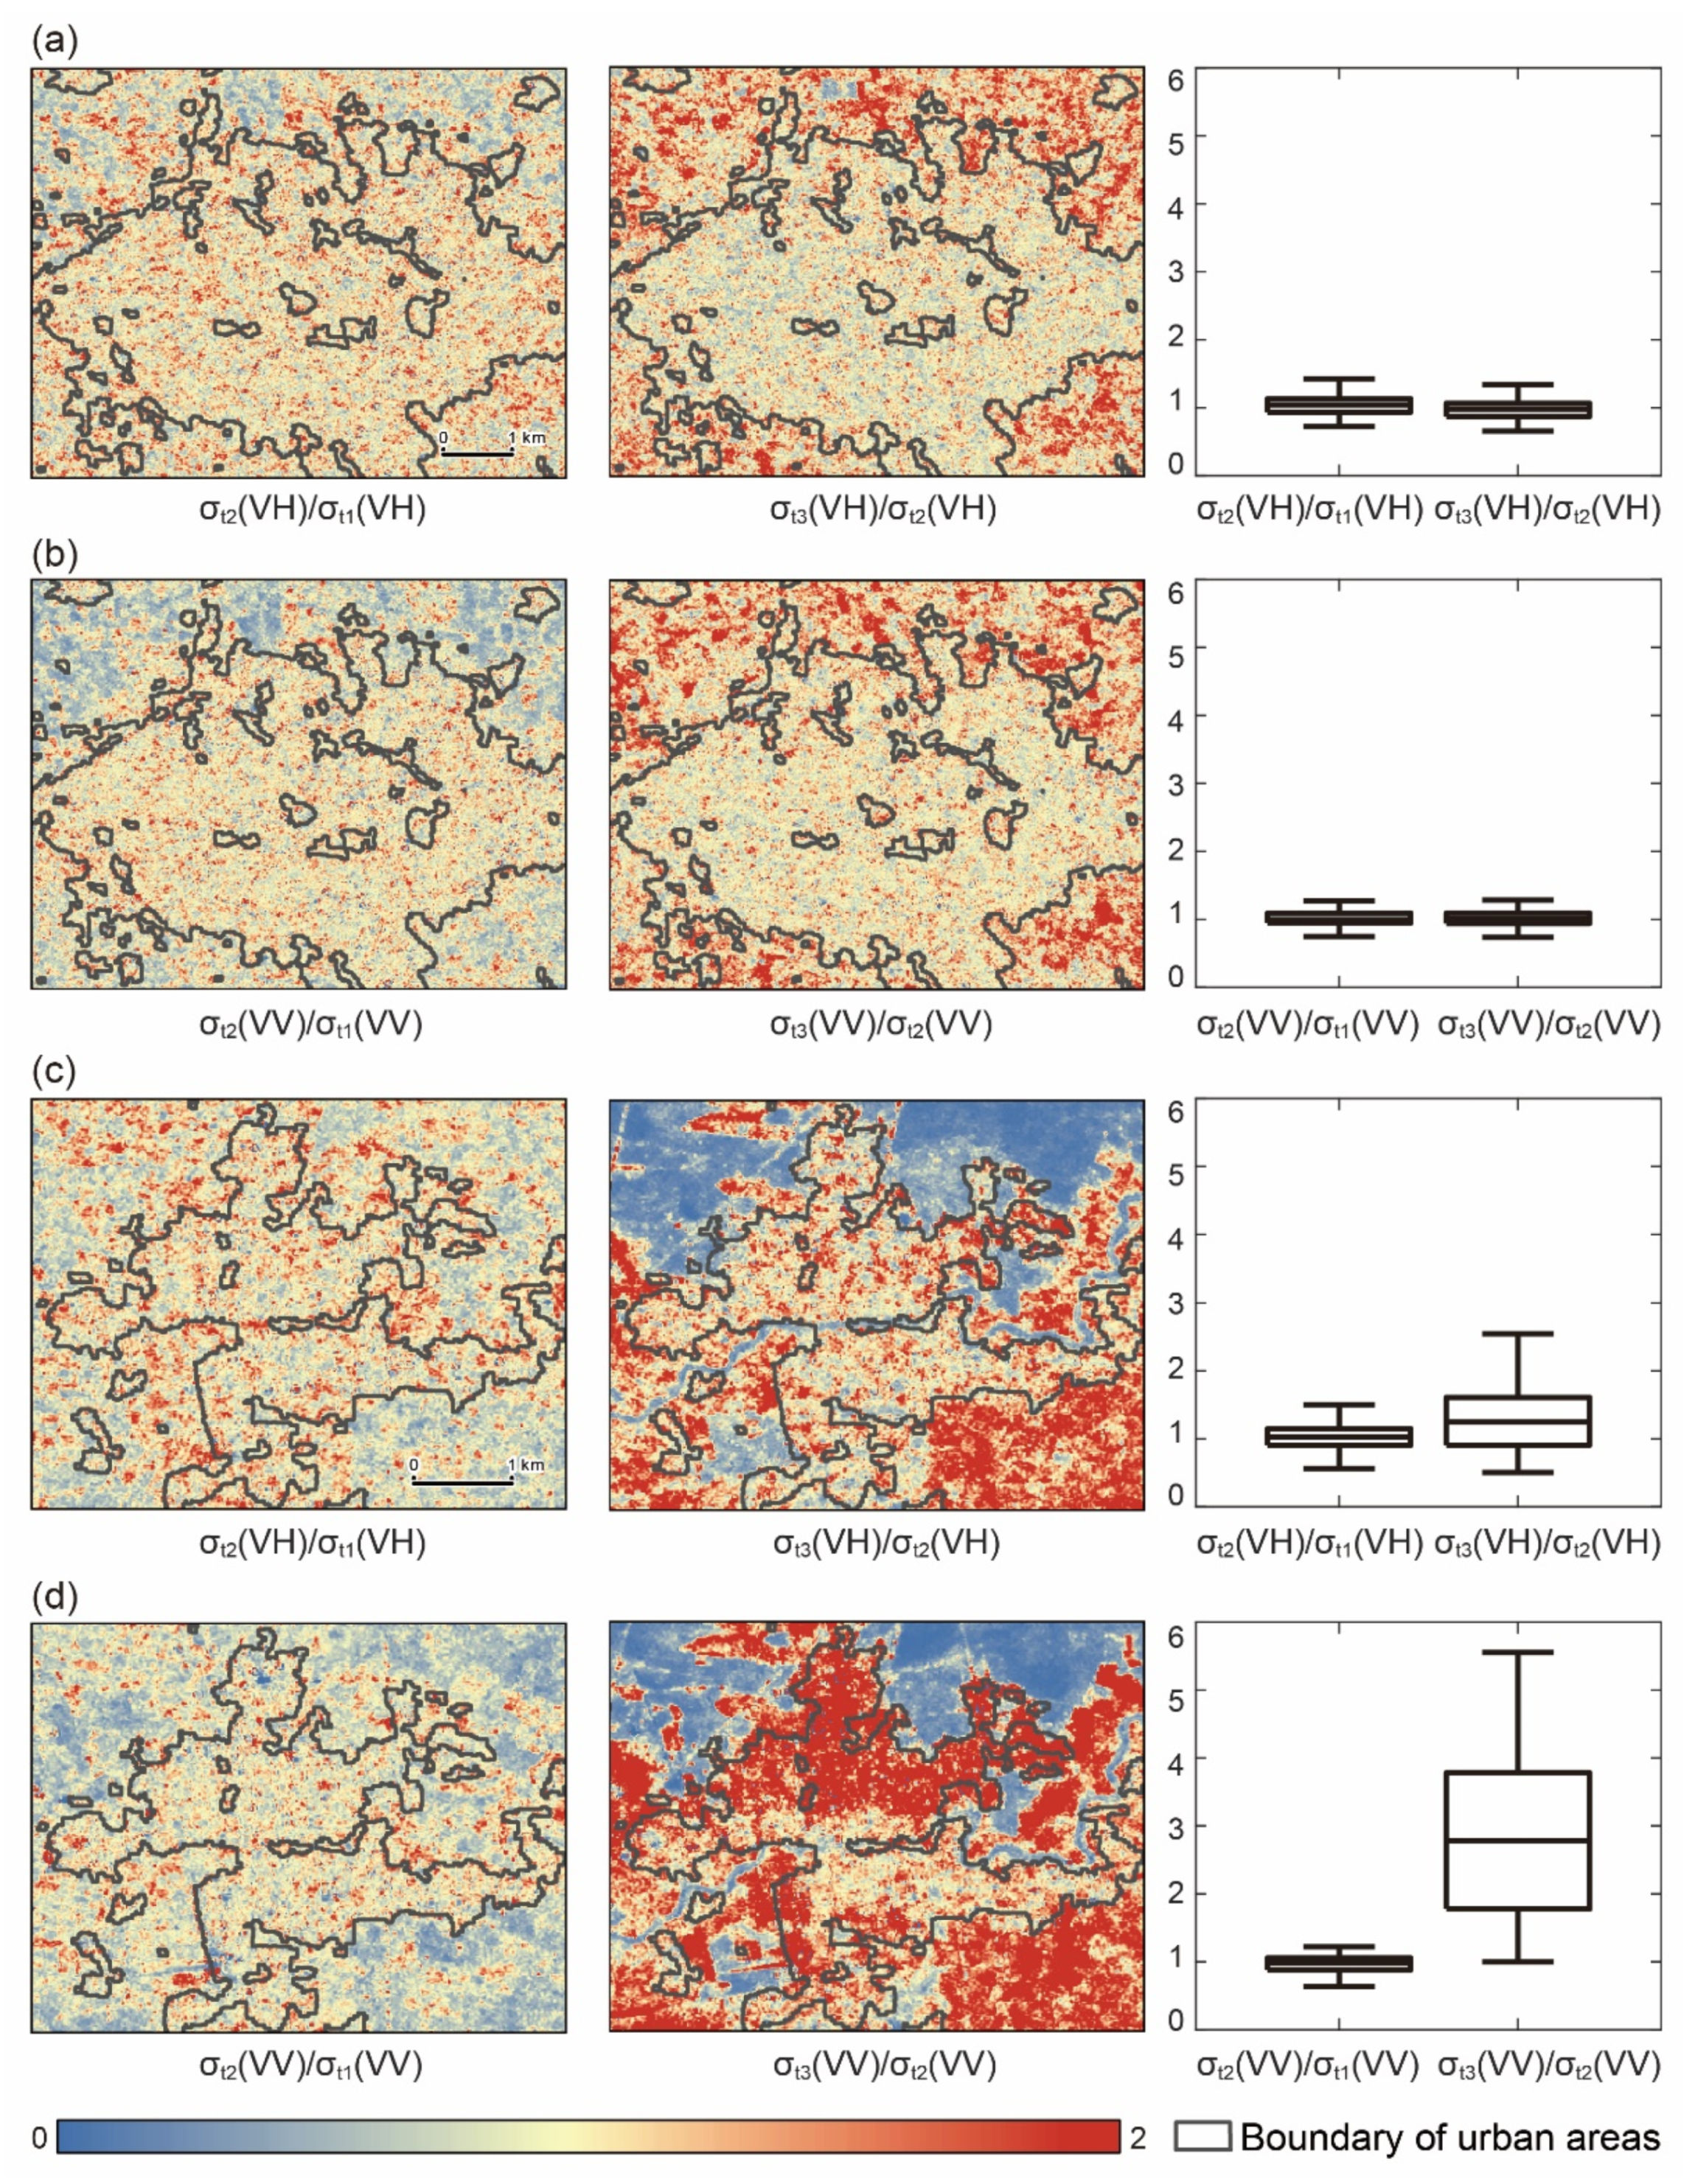
3.2. Backscattering Coefficient Changes Caused by Urban Flooding

After PolSAR data preprocessing, the digital numbers of each image were converted to backscattering coefficients. On the basis of the training samples of flooded and unflooded urban areas, the backscattering coefficient ratio between the first and second images and that between the second and third images were compared to investigate the radar backscatter change caused by the urban flooding. The image ratioing method has been commonly used to detect changes in SAR images, as it can mitigate the multiplicative effect of speckle noise [37,38]. The backscattering coefficients in the decibel scale suppress the radar backscatter differences between the ground targets with high radar backscatter (e.g., buildings). However, this might not be appropriate for assessing radar backscatter changes in urban areas. Therefore, the ratios were calculated based on the backscattering coefficients on a linear scale. As previously mentioned, the first and second images were acquired before flooding, and the third image was acquired during flooding. Therefore, the ratio between the first and second images indicated the radar backscatter variation without a flooding effect. Conversely, the ratio between the second and third images showed the radar backscatter variation caused by a flooding impact. Thus, the comparison between these two ratios could confirm the radar backscatter change caused by urban area flooding rather than other factors.
Figure 7a,b demonstrate the backscattering coefficient variation in unflooded urban areas under VH and VV polarization, respectively. Figure 7c,d illustrate the backscattering coefficient variation in flooded urban areas under VH and VV polarization, respectively. The subfigures in the first column in Figure 7 show the backscattering coefficient ratio of the second image to the first image (i.e., backscattering coefficient variation without the effect of flooding), and those in the second column show the backscattering coefficient ratio of the third image to the second image (i.e., the backscattering coefficient change under the effect of flooding). Thus, the backscattering coefficient change caused by the flooding can be clearly revealed and confirmed by comparing the first and second columns in Figure 7. As shown in Figure 7a,b, the backscattering coefficient changed little in unflooded urban areas under VH and VV polarizations. In contrast, Figure 7c,d indicated a notable change in backscattering coefficient in flooded urban areas under VH and VV polarizations. Moreover, VV polarization was more sensitive to the change than VH polarization.

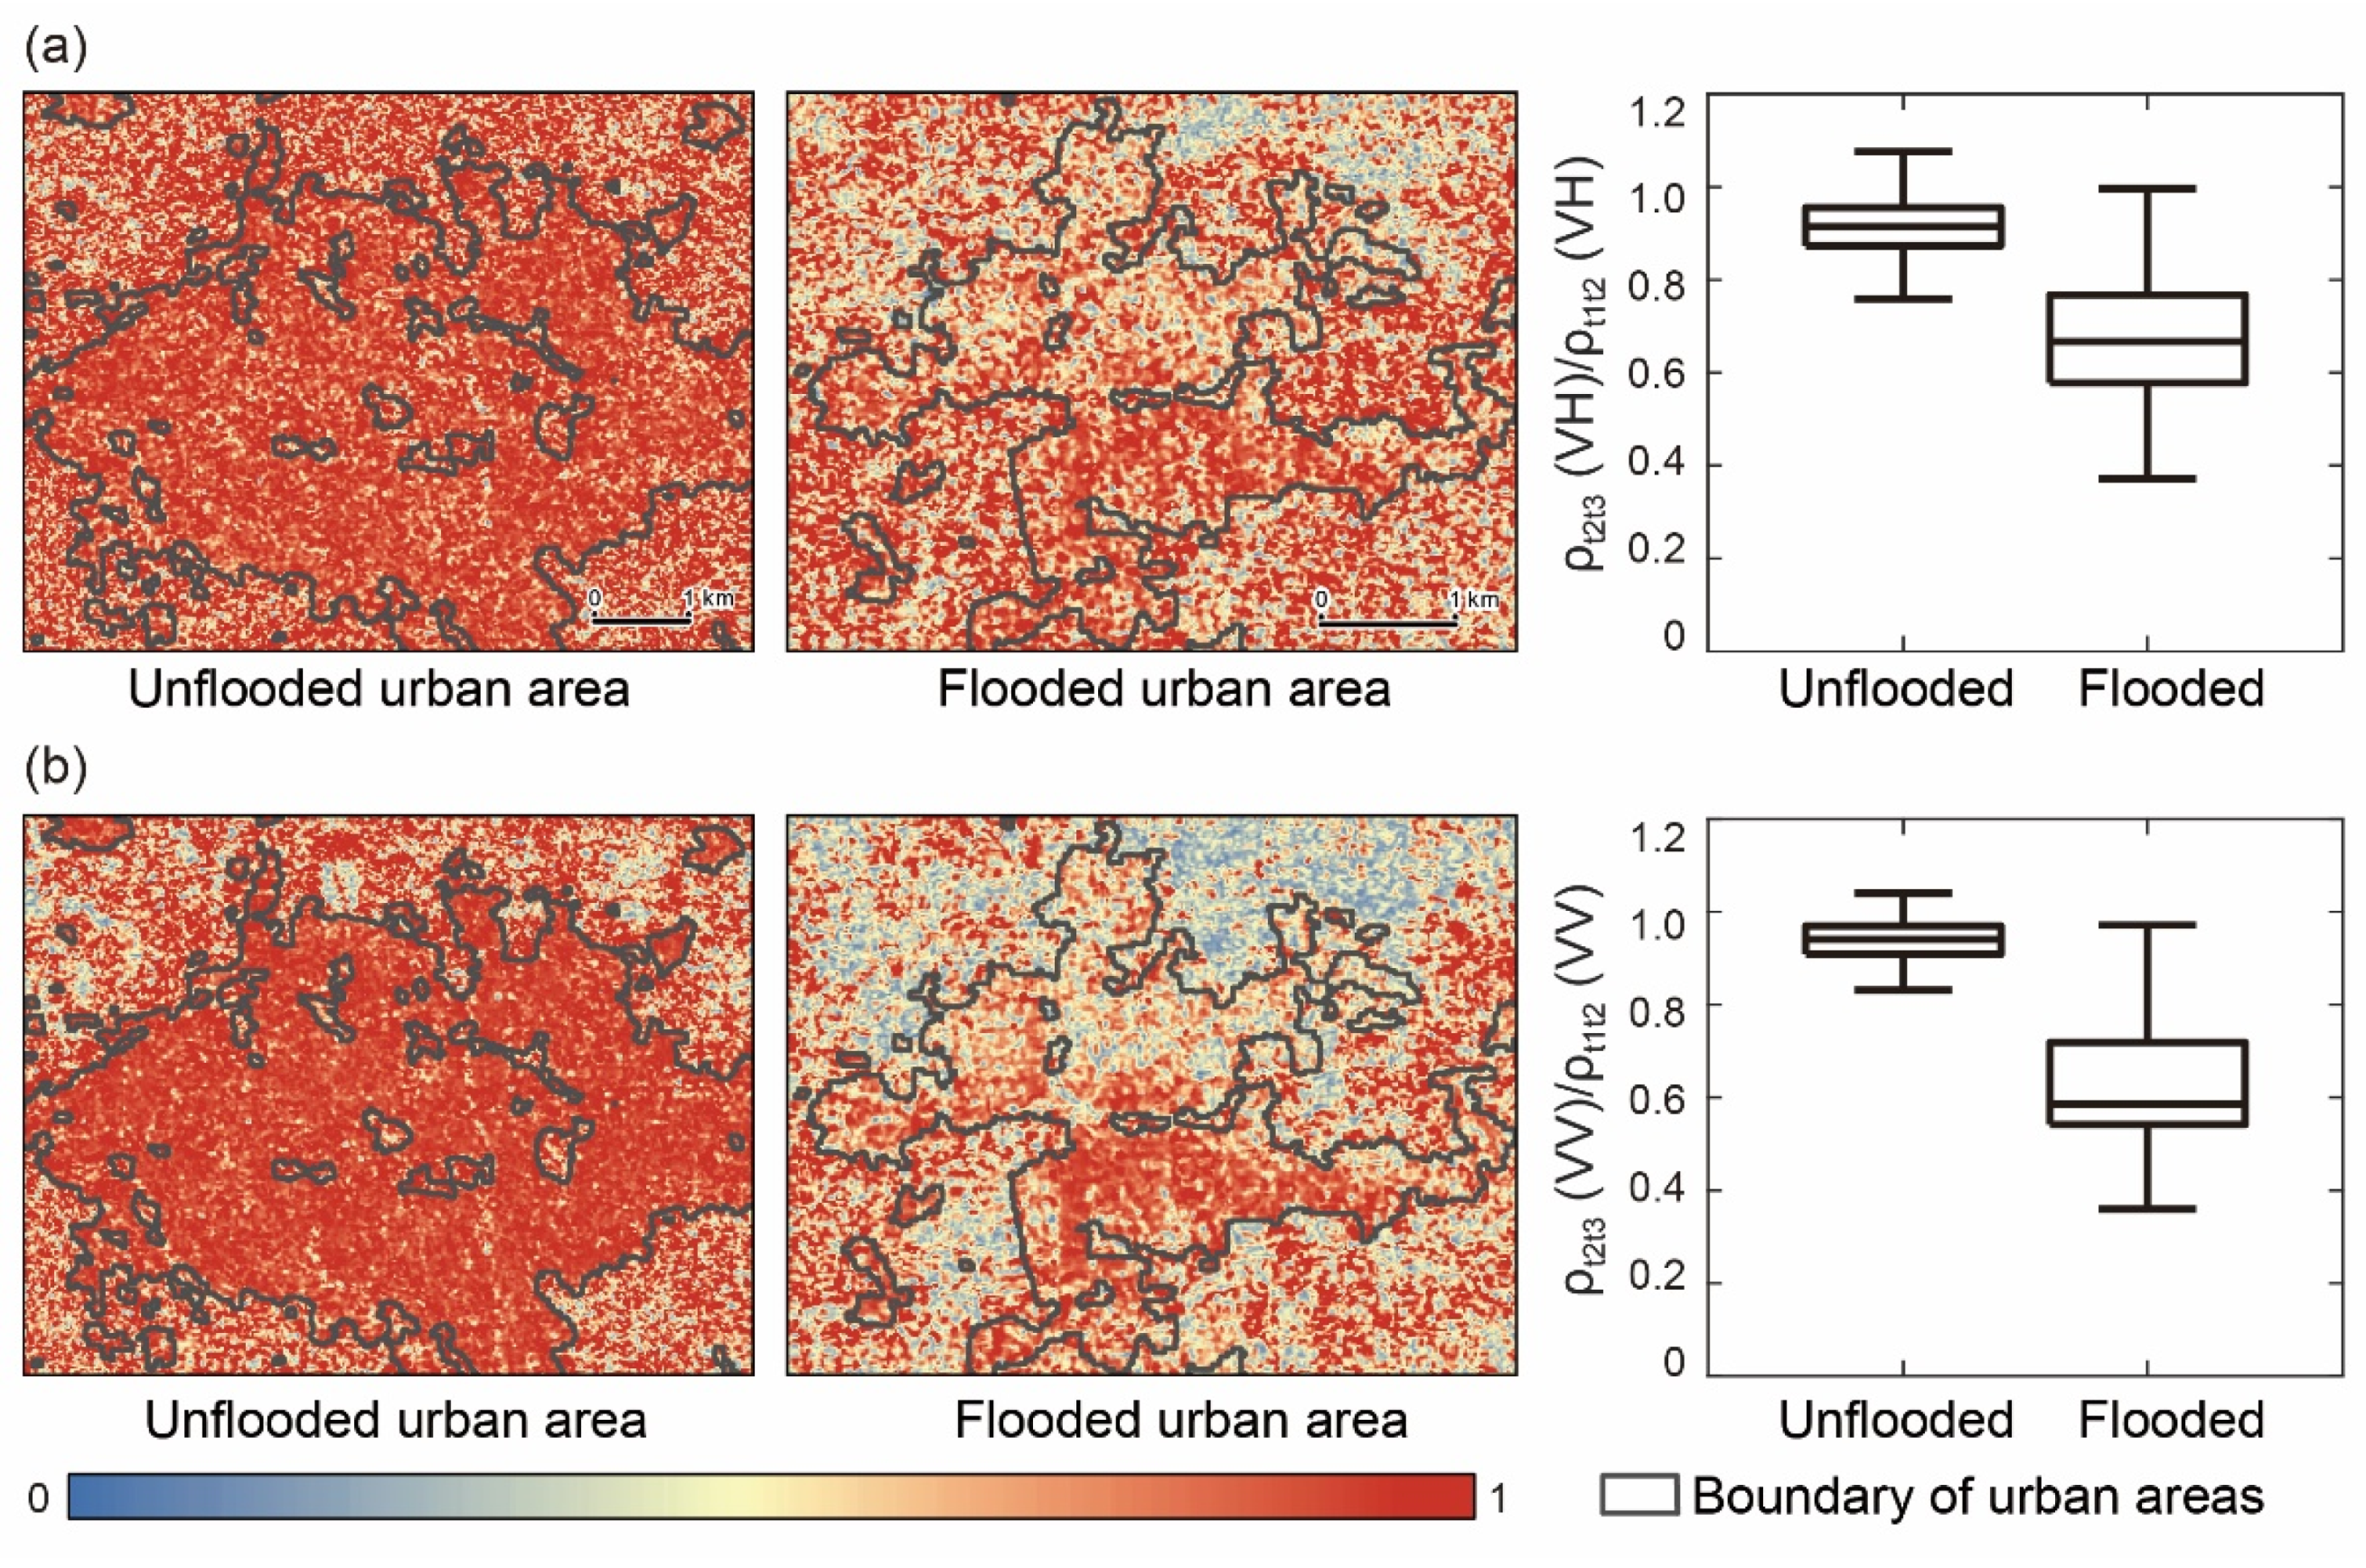
3.3. Interferometric Coherence Change Caused by Flooding in Urban Areas

Interferometric coherence is defined as the amplitude or absolute value of the complex correlation coefficient between two SAR images. It is calculated as follows [39]:
ρ =   | S 1 × S 2 * |   | S 1 × S 1 * | ×   | S 2 × S 2 * |
where ρ is the interferometric coherence ranging from 0 (incoherent) to 1 (coherent), S1 and S2 are two co-registered SAR images, and * denotes a conjugate complex.
High-precision image co-registration is essential for estimating the interferometric coherence. In this study, a precise orbit file with accurate satellite position and velocity information was employed for the co-registration of PolSAR images. Interferometric coherence between the first and second images and that between the second and third images were calculated according to Equation (1), wherein a 7 × 7 window was used to calculate the interferometric coherences. Figure 8 shows the variation in interferometric coherence under different polarizations in unflooded and flooded urban areas. The subfigures in the first column of Figure 8 are the interferometric coherence between the first and second images, and those in the second column are the interferometric coherence between the second and third images. Figure 8a,b reveal the interferometric coherence variation in unflooded urban areas under VH and VV polarizations, respectively. Figure 8c,d show the interferometric coherence variation in flooded urban areas under VH and VV polarizations, respectively. As shown in Figure 8a,b, the interferometric coherence changed little in unflooded urban areas under VV and VH polarizations. In contrast, the comparison of Figure 8c with Figure 8d reveals a notable interferometric coherence decrease (ICD) under VV and VH polarizations. The ICD under VV polarization was more significant than that under VH polarization.
The ratio between the interferometric coherence extracted from the second and third images and that from the first and second images were calculated for different polarizations. As shown in Figure 9, the interferometric coherence ratios in unflooded urban areas were approximately 0.91 and 0.94 under VH and VV polarization, respectively, while those in flooded urban areas were approximately 0.67 and 0.59, respectively. These findings confirm that the interferometric coherence in urban areas varied little without the effect of flooding but decreased significantly when the urban areas were inundated, especially under VV polarization.

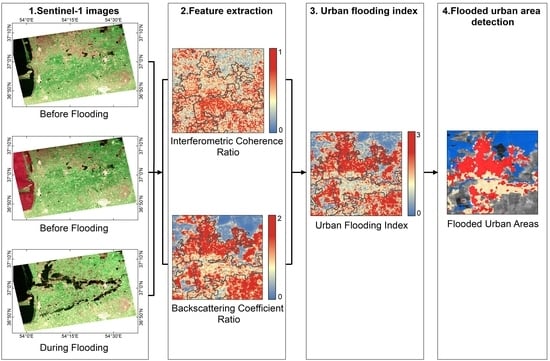
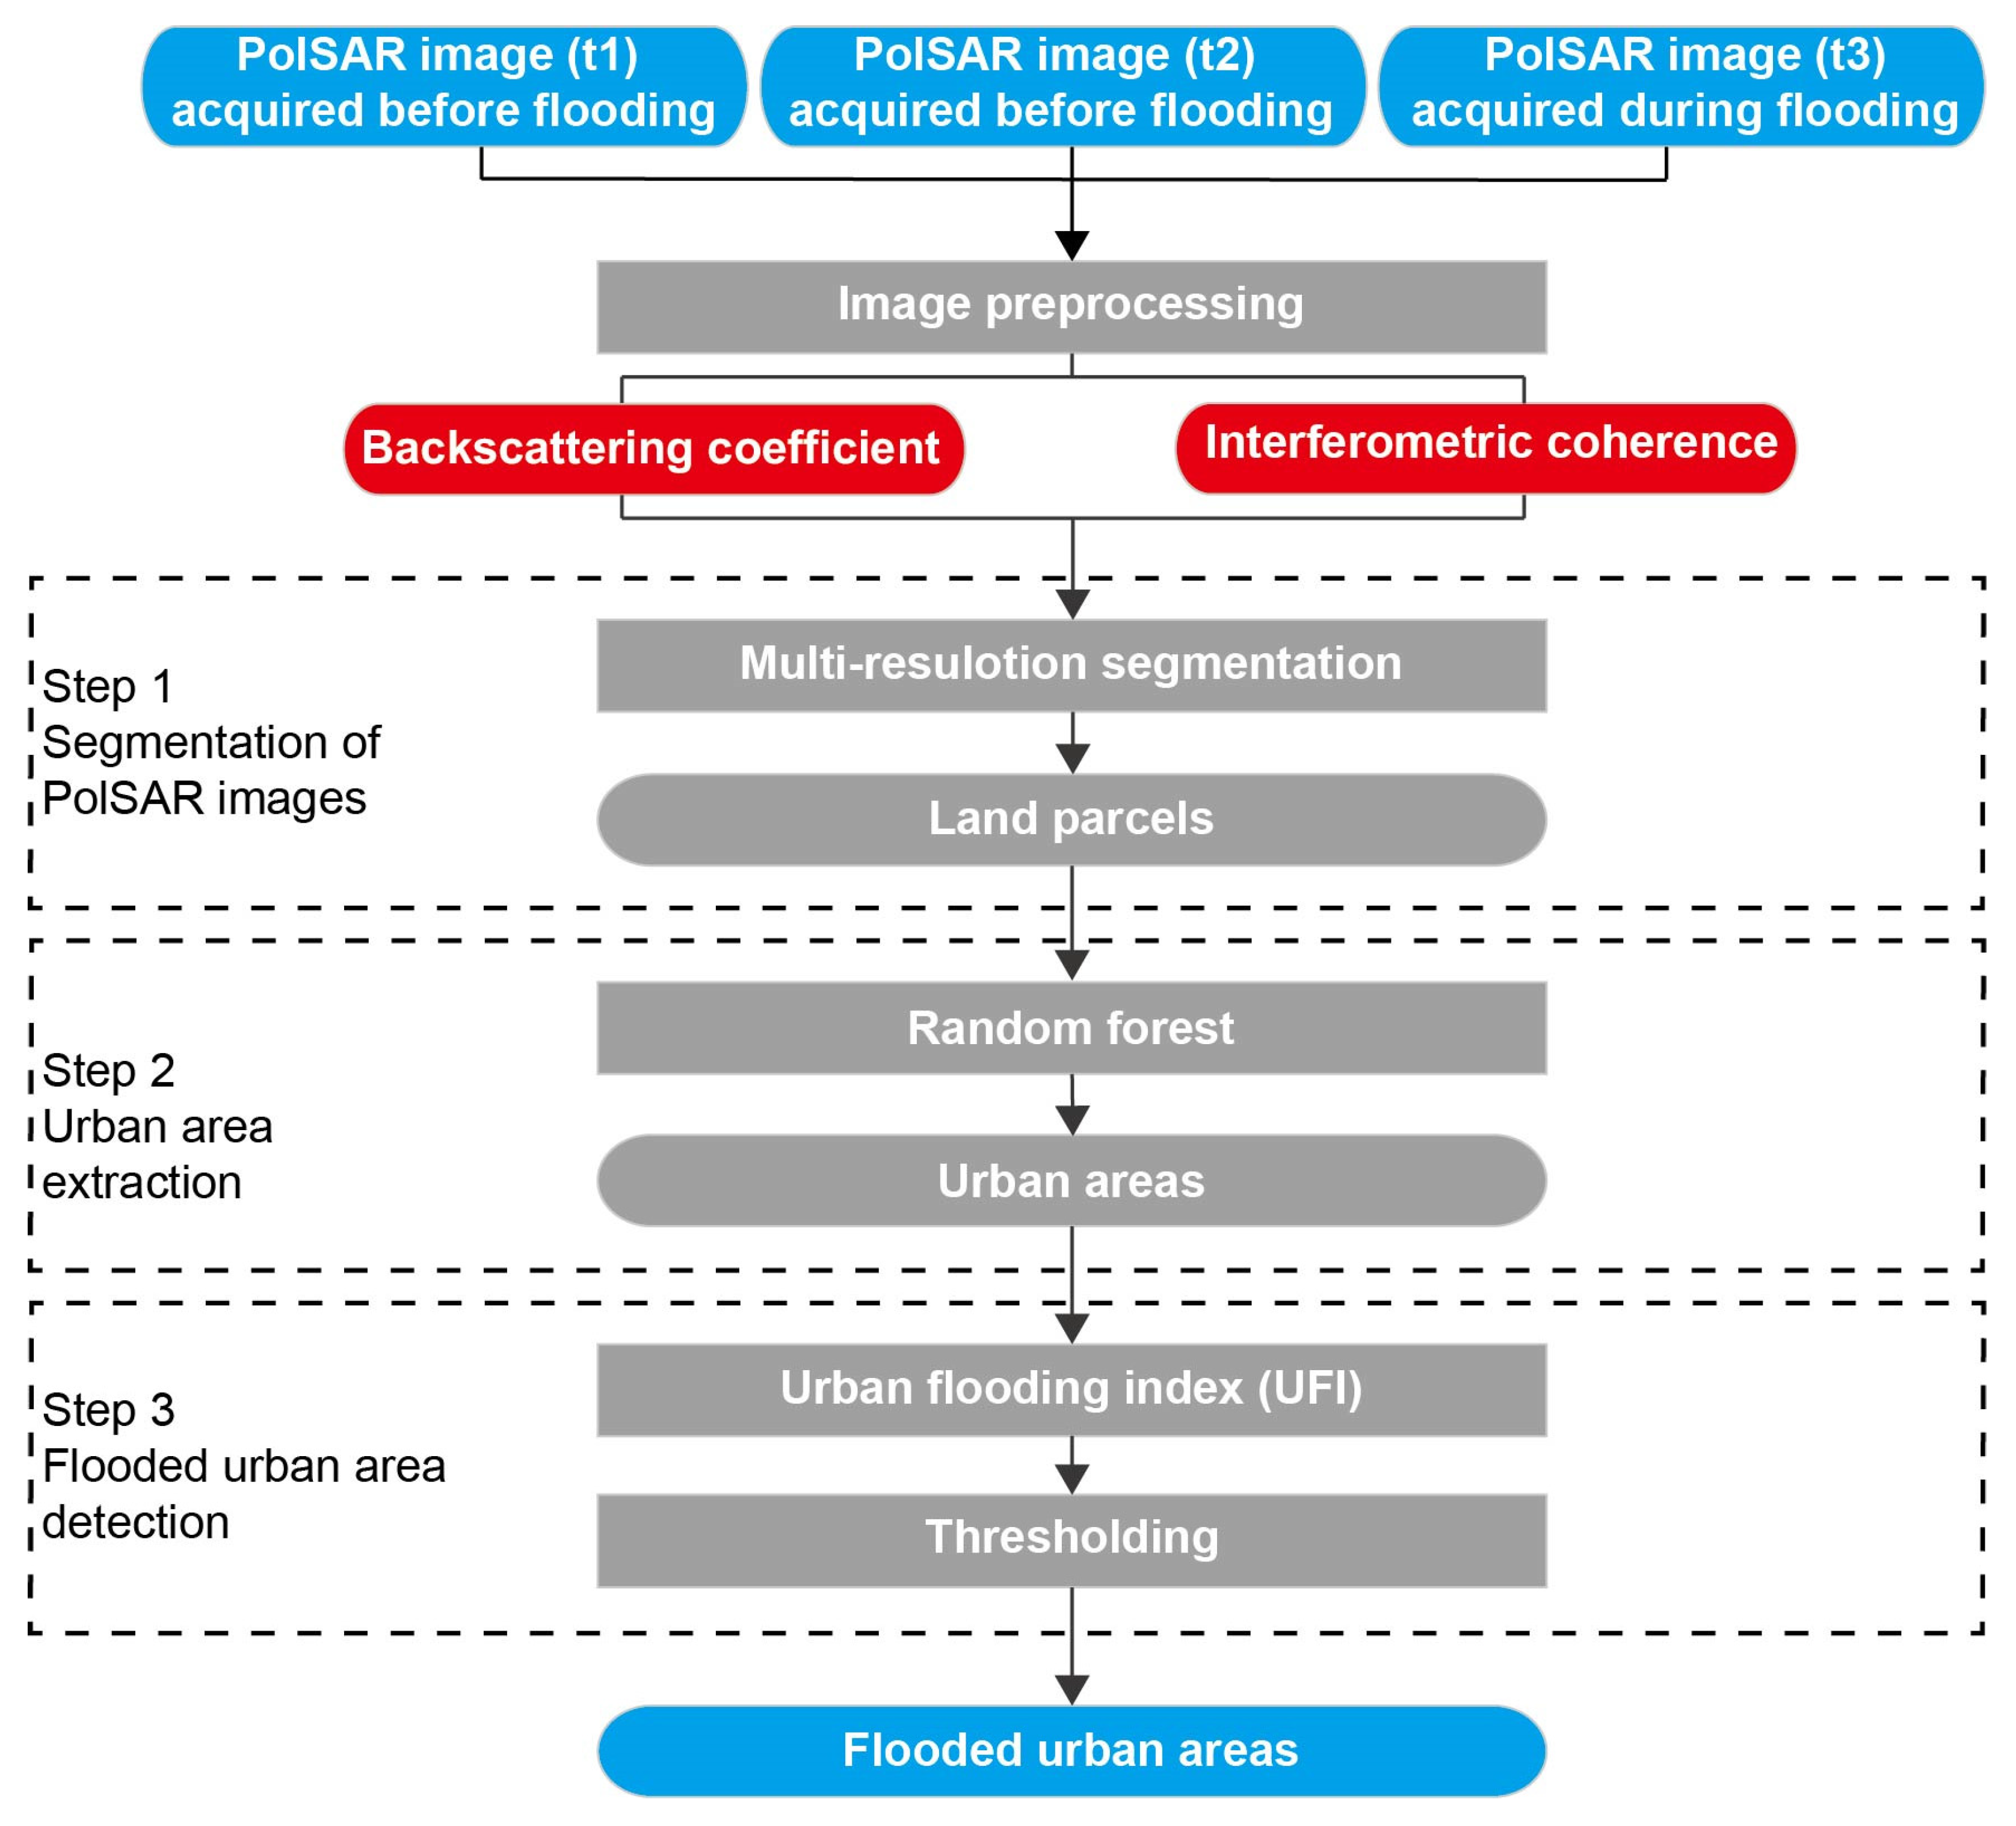
4. UFI for Unsupervised Inundated Urban Area Detection

A UFI was proposed for the unsupervised detection of inundated urban regions. The UFI-based method mainly consisted of three steps (Figure 10): First, the multi-temporal PolSAR images were segmented together using the multi-resolution segmentation technique to delineate land parcels. Second, urban areas were extracted from the SAR images acquired before the flooding by using an object-based random forest algorithm. Third, the UFI was calculated with the BCI and ICD caused by the urban flooding, and the flooded urban areas were detected by implementing thresholding methods on the UFI.

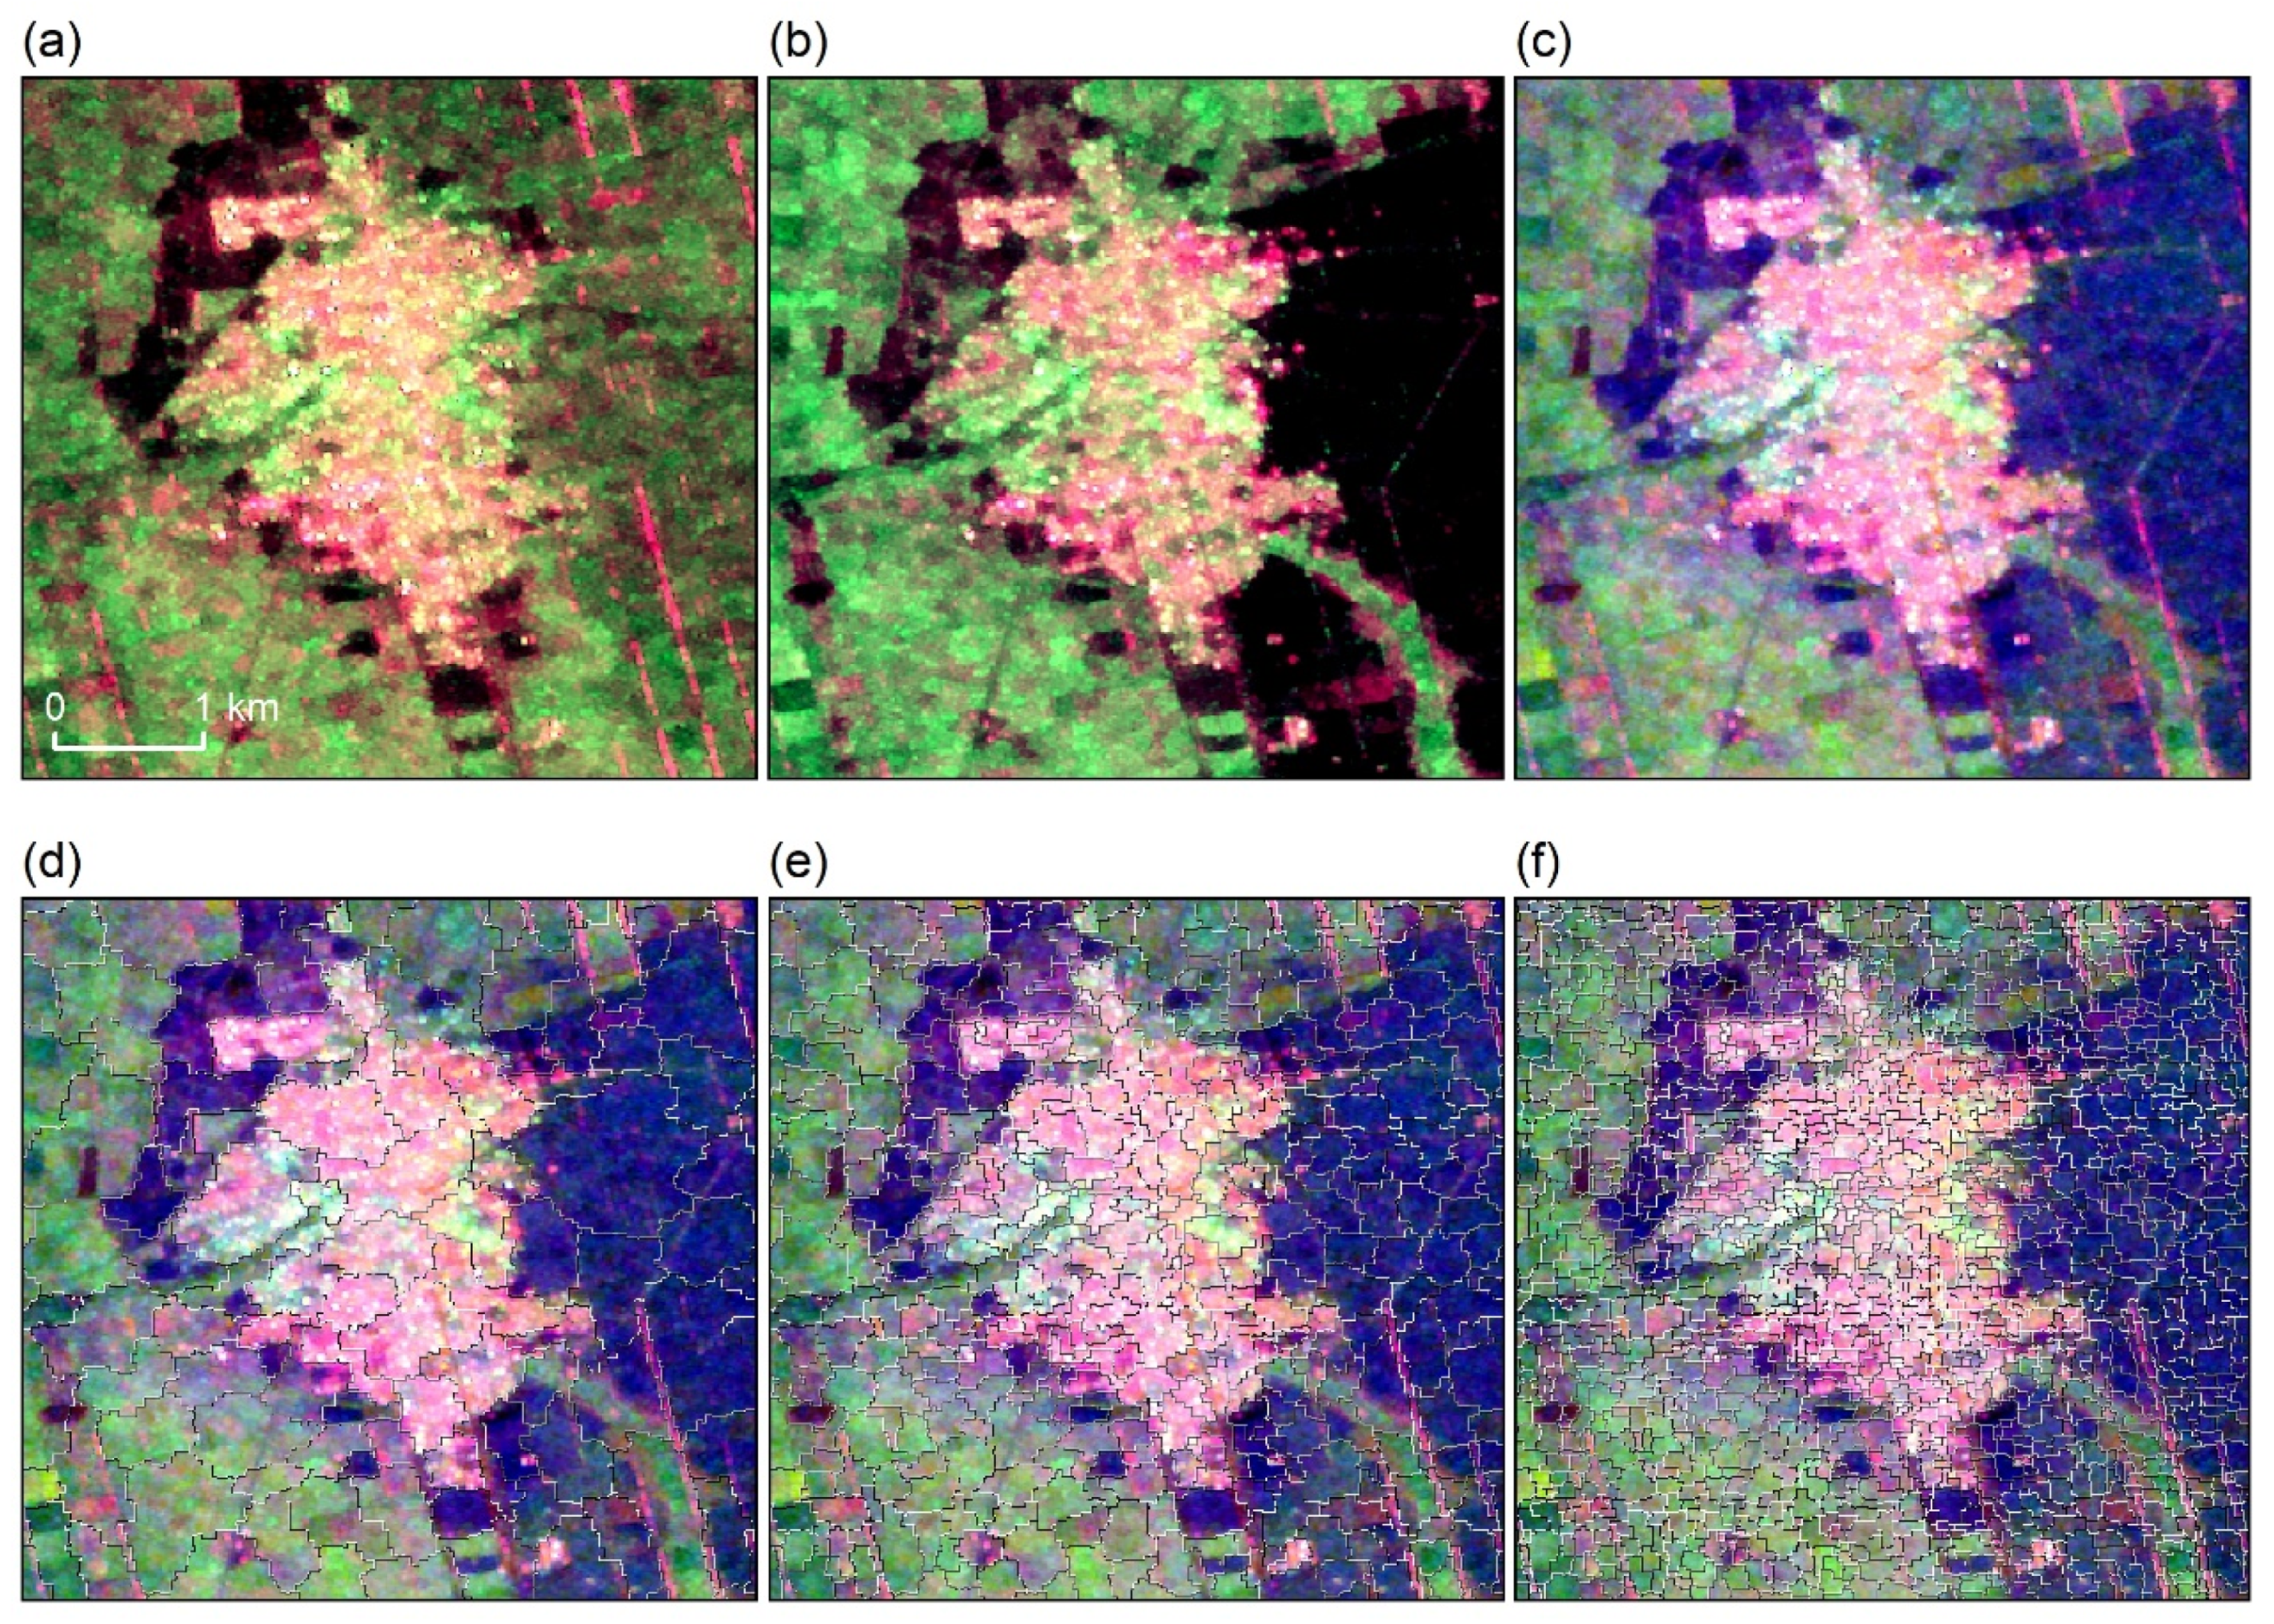
4.1. Segmentation of Sentinel-1 PolSAR Images

Compared with traditional pixel-based methods, object-based methods are more suitable for SAR image classification and change detection because they suppress the speckle effect and exploit textural features to improve accuracy [40]. Therefore, the UFI-based method was performed based on image objects. Herein, the multi-resolution segmentation technique [41] embedded in the eCognition 9.01 software was implemented on the extracted backscattering coefficients and interferometric coherences to delineate image objects (Figure 11). The backscattering coefficient in decibel (dB) units is commonly used for measuring the radar return from a distributed target, so the backscattering coefficient images were used for the segmentation. The multi-resolution segmentation algorithm is an iterative algorithm that creates image objects by grouping adjacent pixels to an object and merging adjacent smaller objects into larger ones. The scale parameter of the multi-resolution segmentation algorithm controls the size of the resultant image objects. Commonly, the optimal scale parameter is determined via a heuristic process. Thus, different scale parameters were tested for the segmentation of PolSAR images. Figure 11d–f are the segmentation results with the different scale parameters (i.e., 20, 10, and 5, respectively). The unit area boundaries in Figure 11d–f are the boundaries of image objects delineated with the multi-resolution segmentation technique.
As shown in Figure 11, the scale parameter of 10 was determined to be optimal for creating accurate land parcel boundaries and avoiding fragmental image objects.

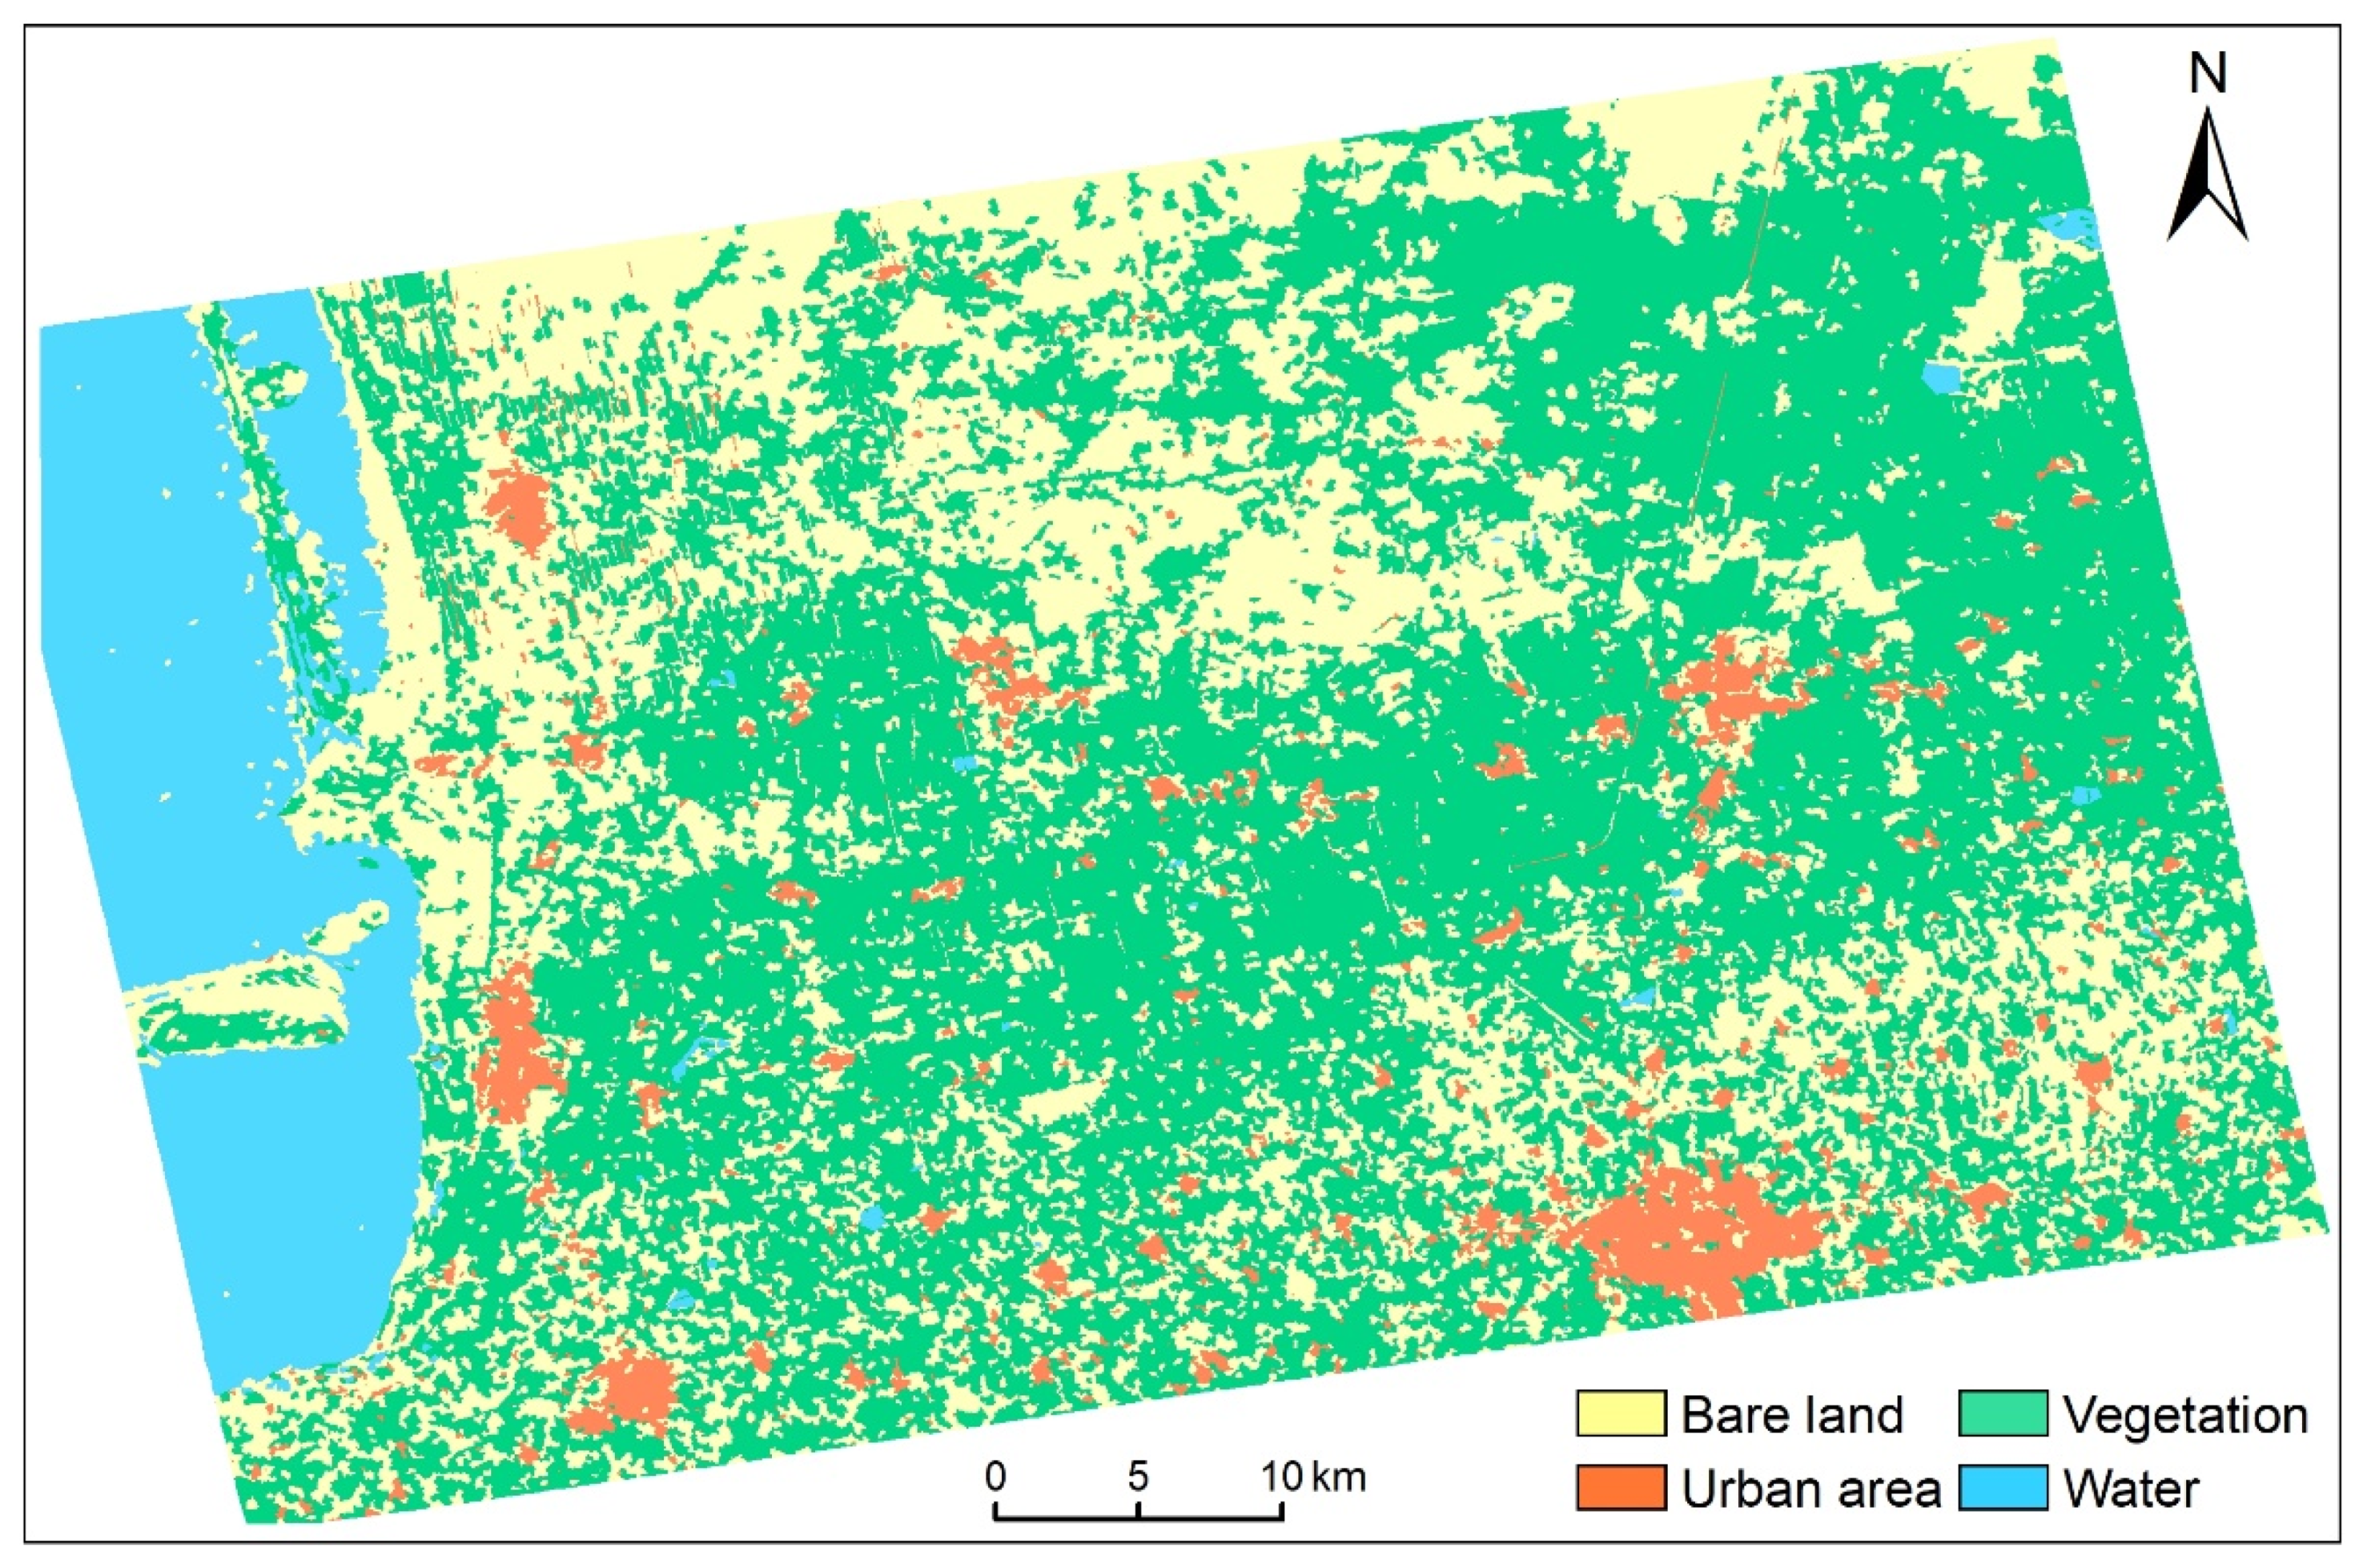
4.2. Mapping Urban Areas using Random Forest Algorithms

It is necessary to ensure that the urban area map excludes false alarms (e.g., inundated trees or crops) from the detection results of flooded urban areas. Herein, an object-based random forest (RF) [42] was employed to produce a pre-flooding land cover map based on the backscattering coefficients and interferometric coherences extracted from the two images acquired before the flooding. Combining the backscattering coefficients and interferometric coherences could improve the land cover classification accuracy, especially for urban areas [40]. The features used for this object-based classification included the mean layer value, standard deviation, skewness of the backscattering coefficients, and interferometric coherences under VH and VV polarizations. The final land cover classification result is shown in Figure 12. The overall accuracy and Kappa coefficient of the classification were 93.35% and 0.91, respectively. The producer’s and user’s accuracies for urban areas were 93.93% and 95.17%, respectively.

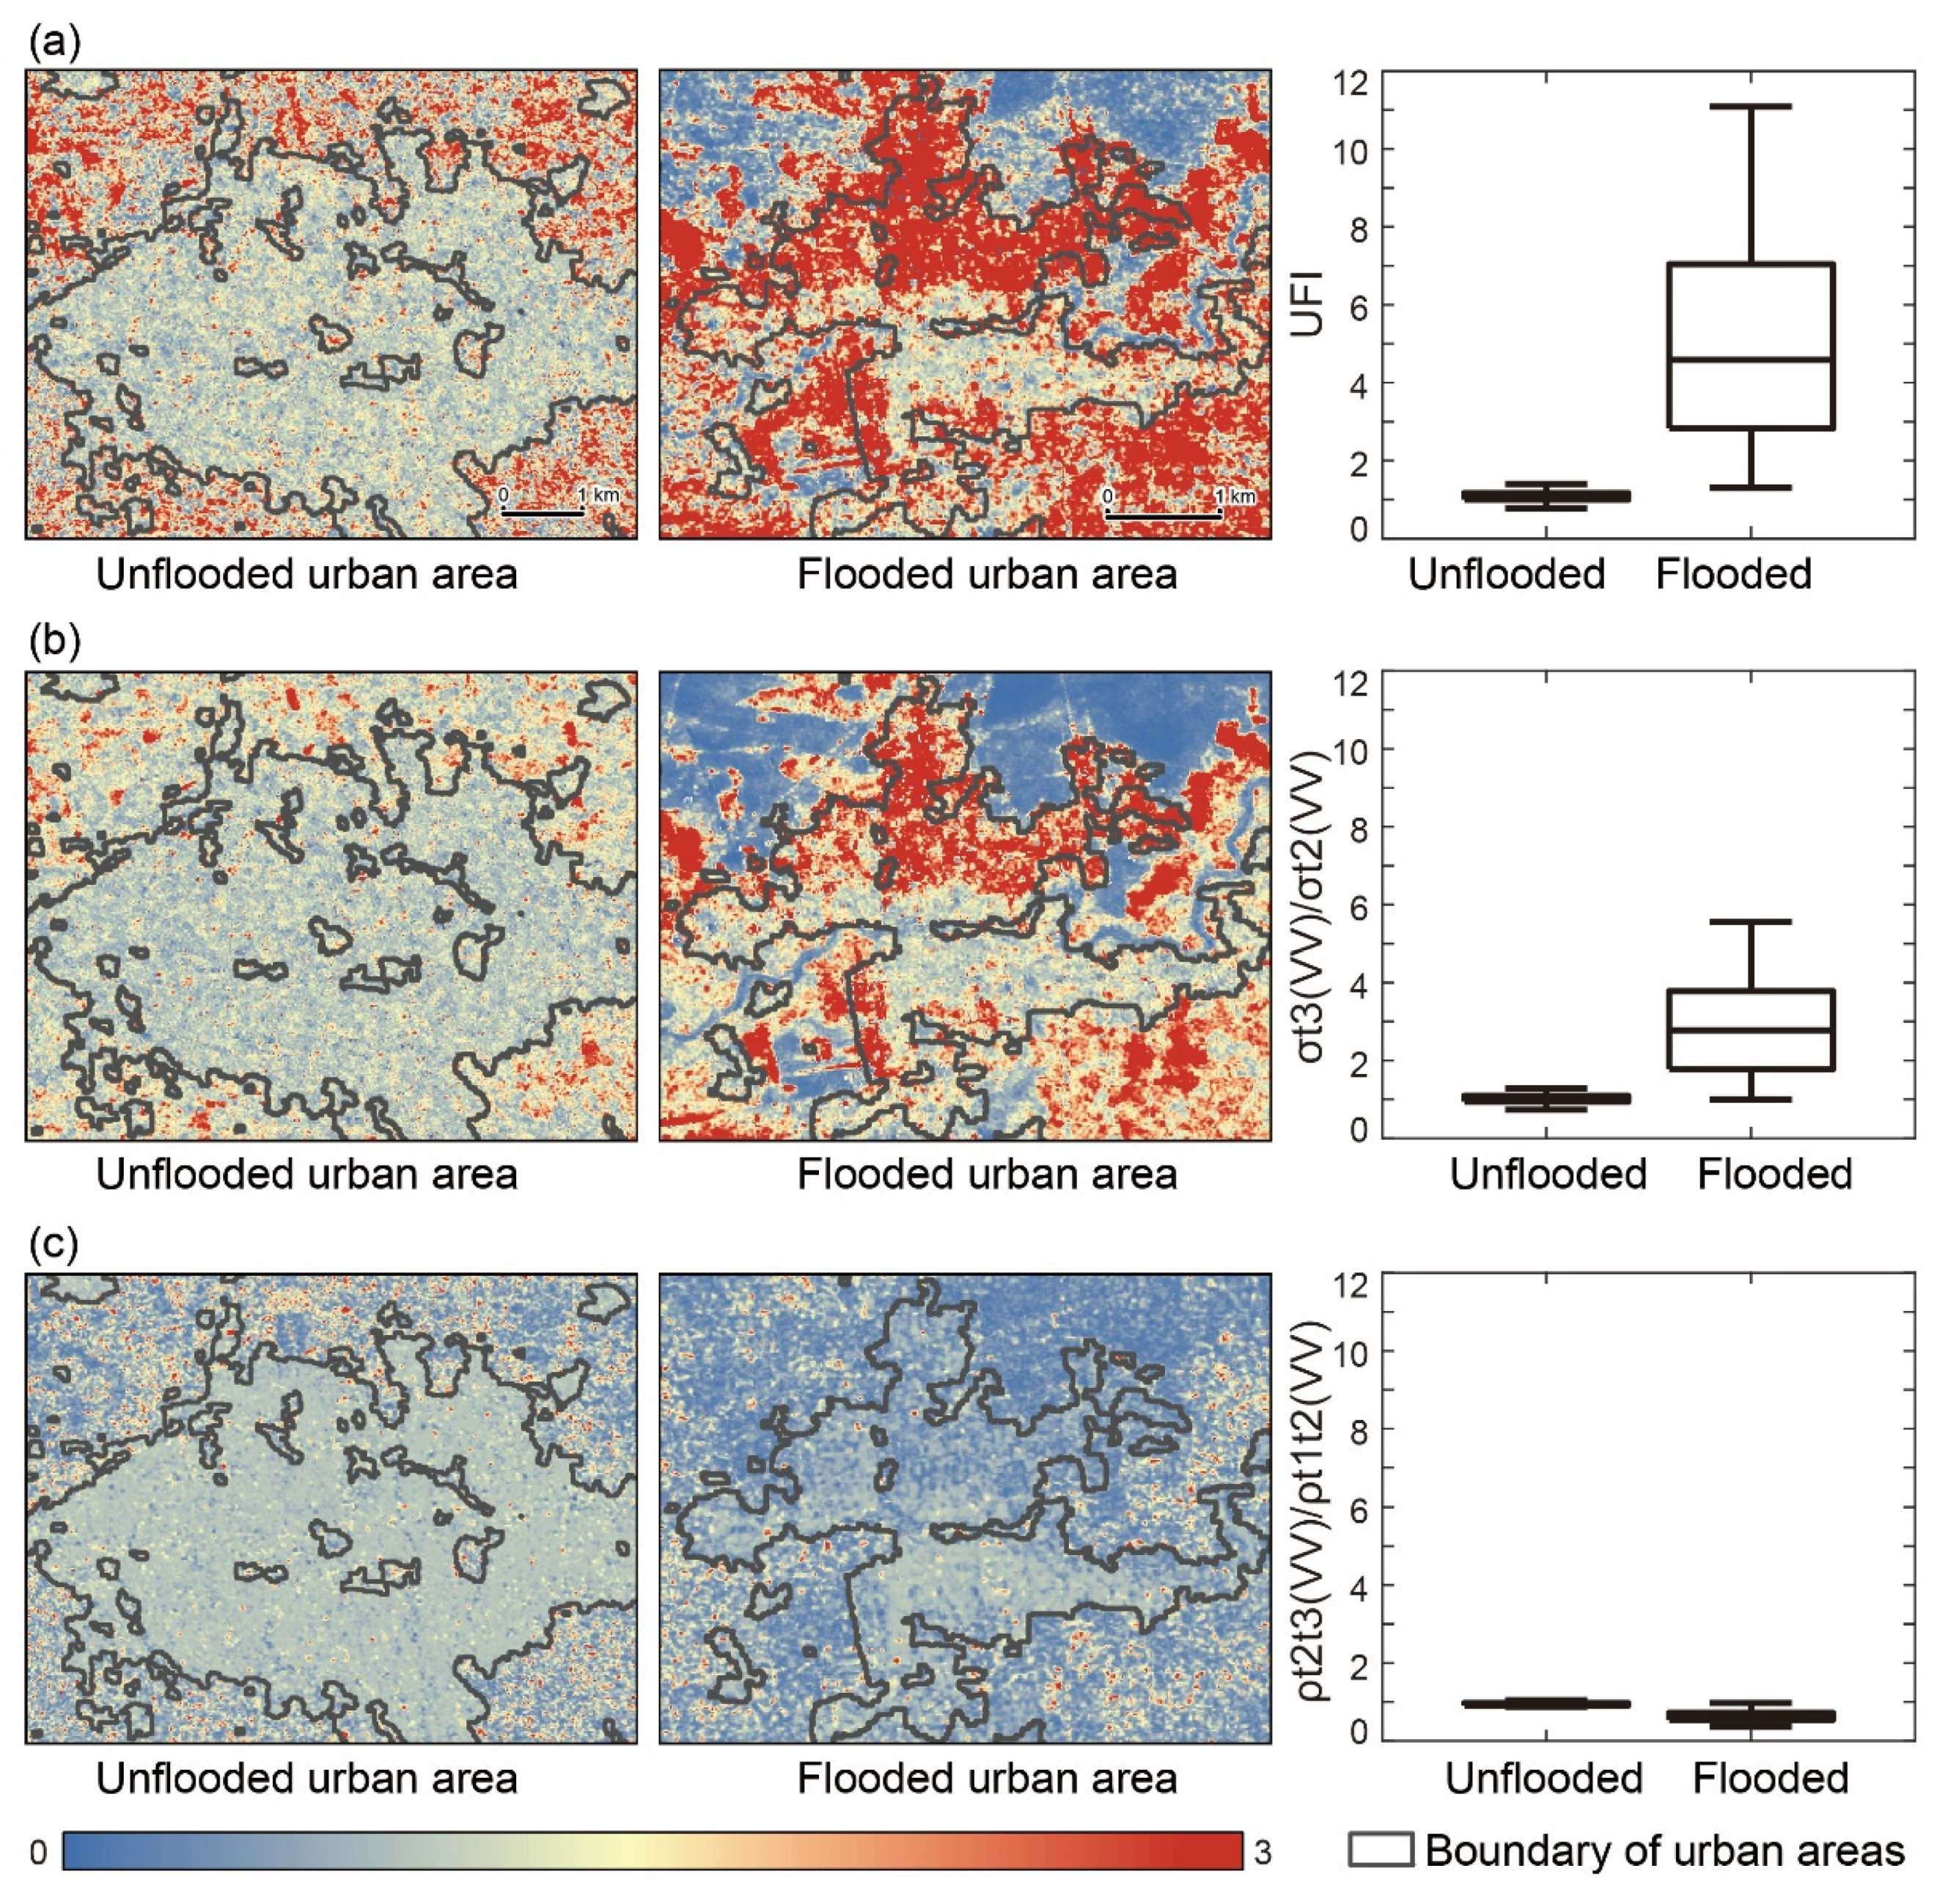
4.3. UFI for Inundated Urban Area Detection
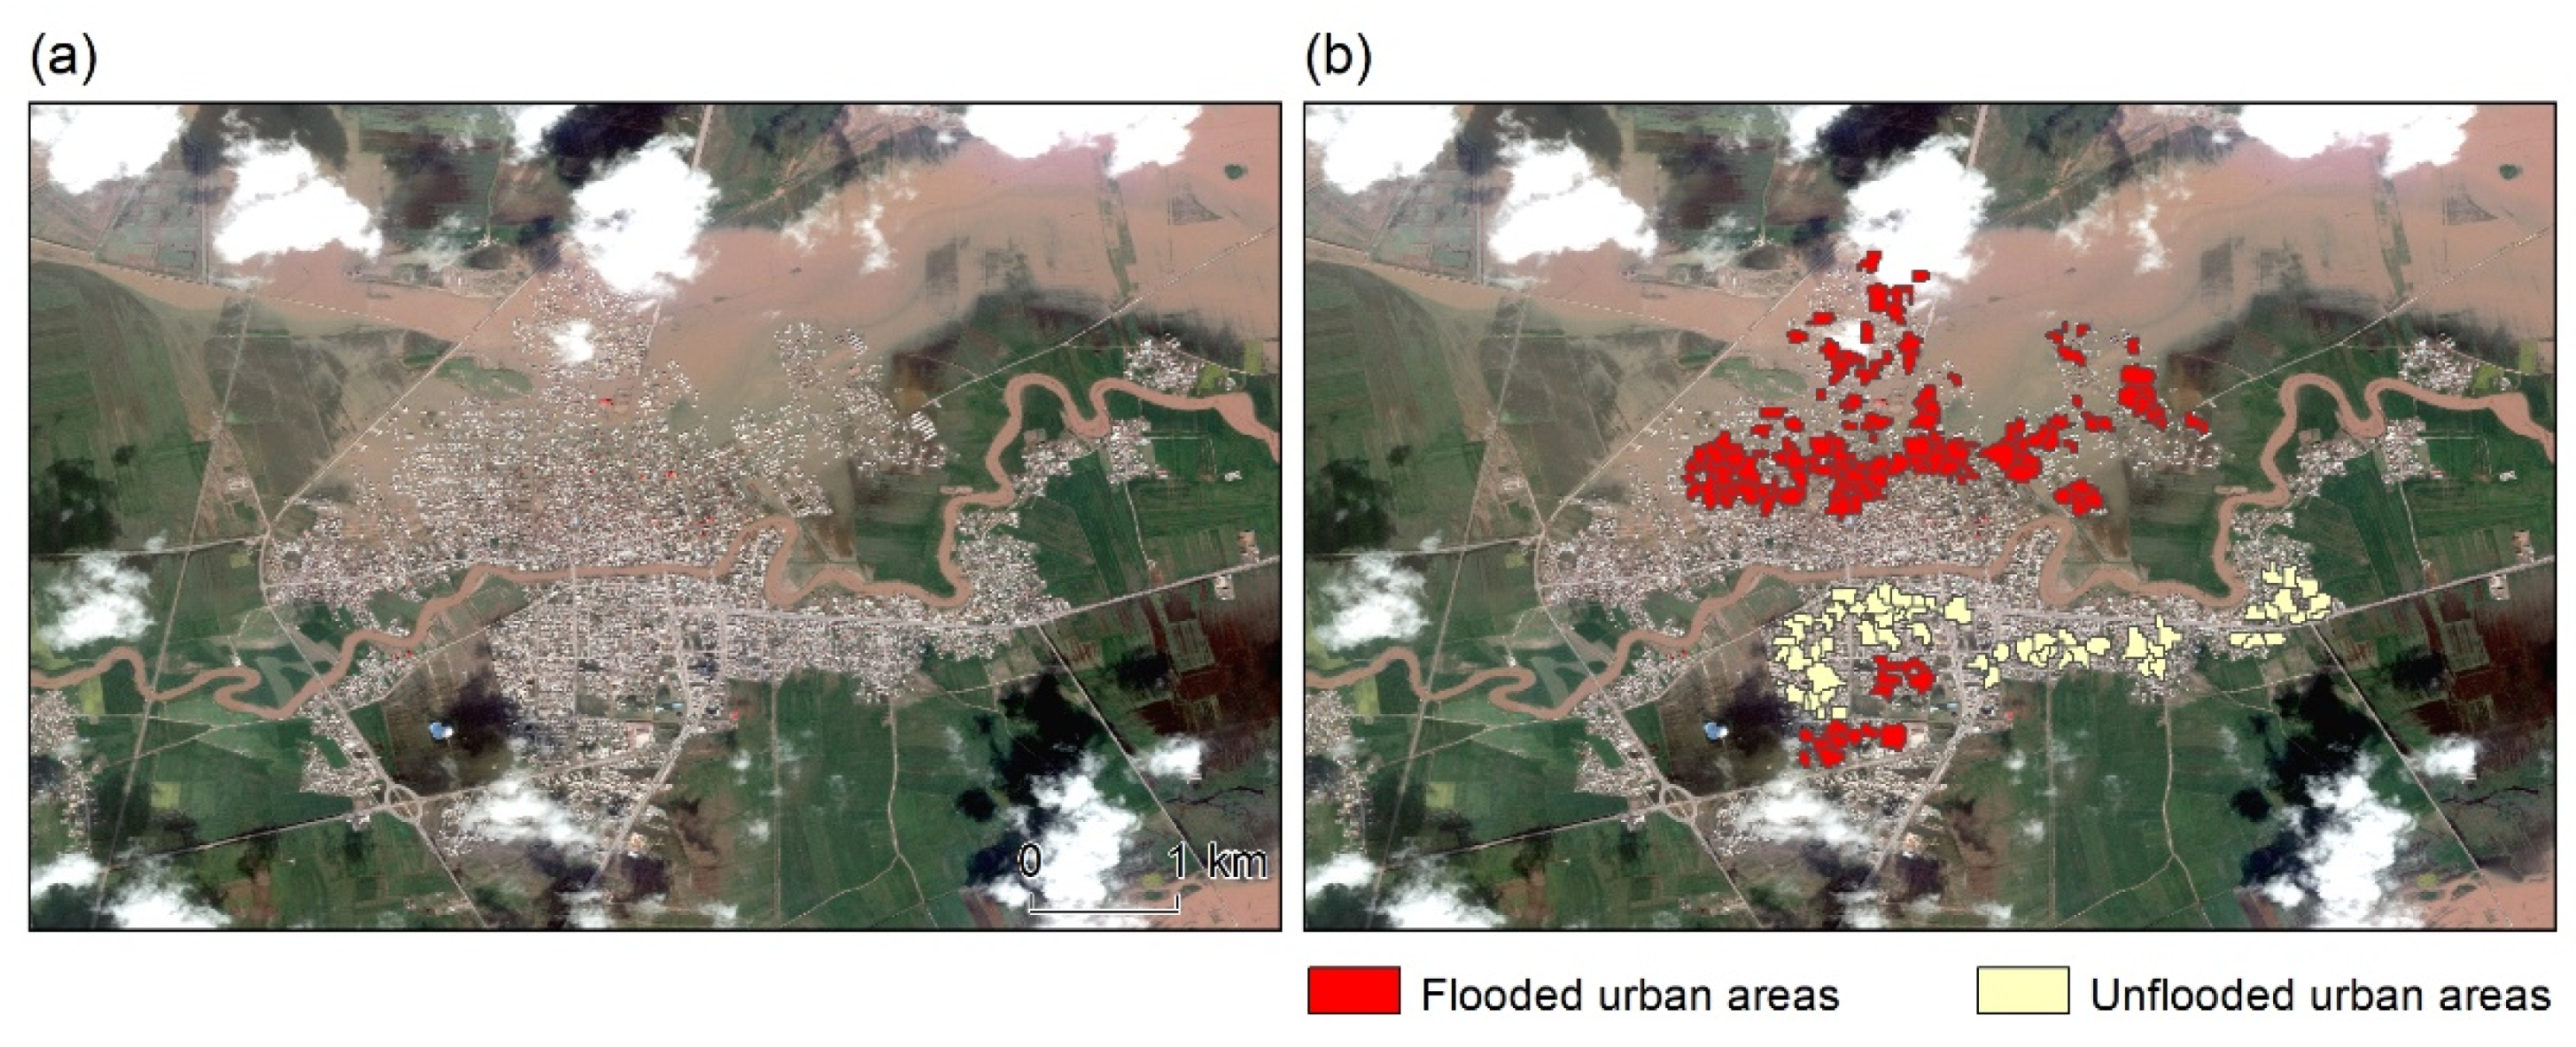
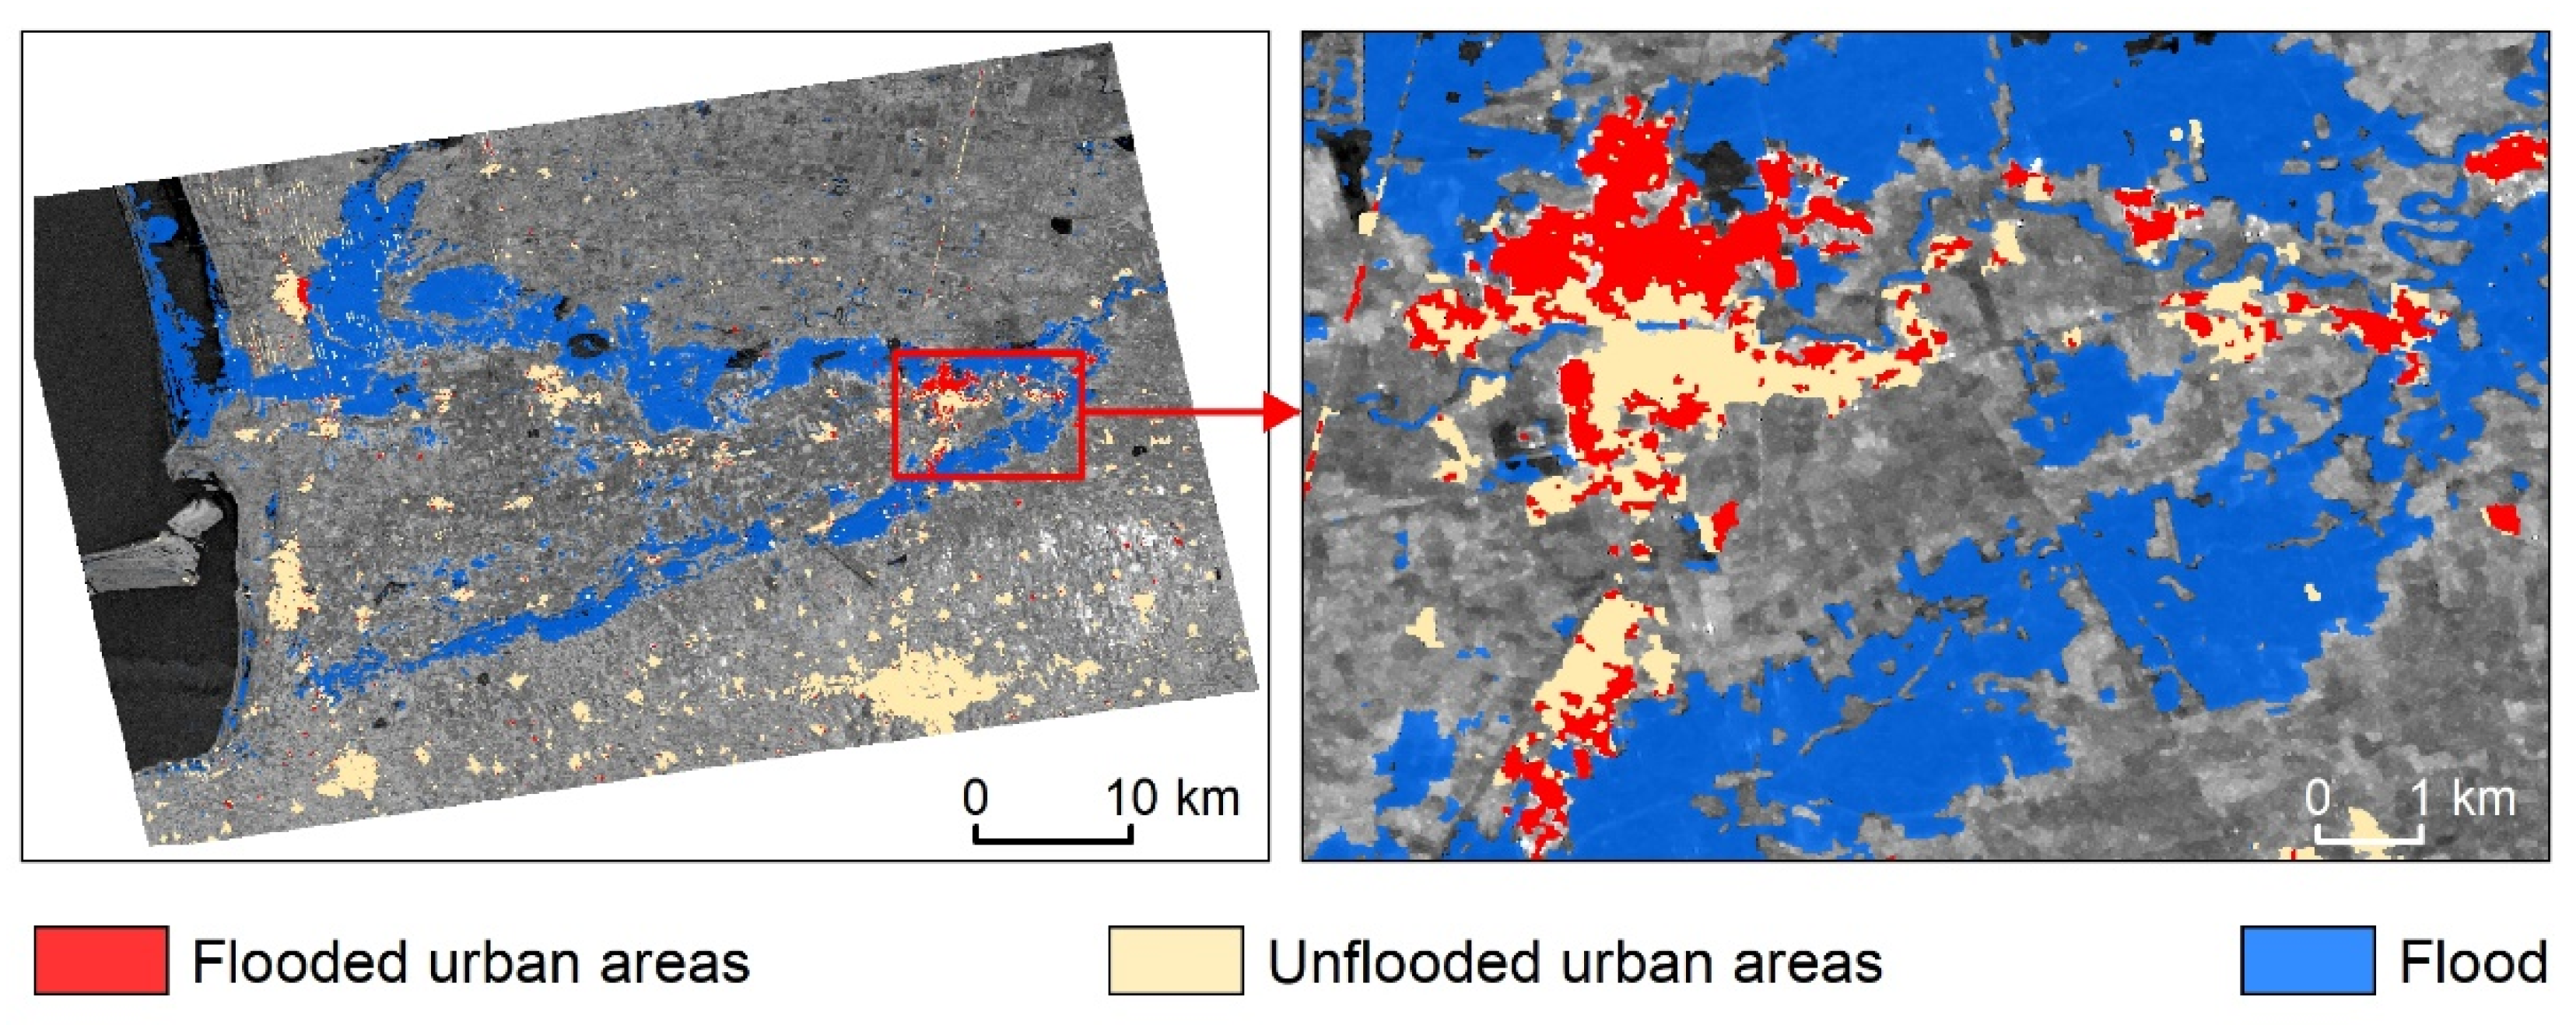
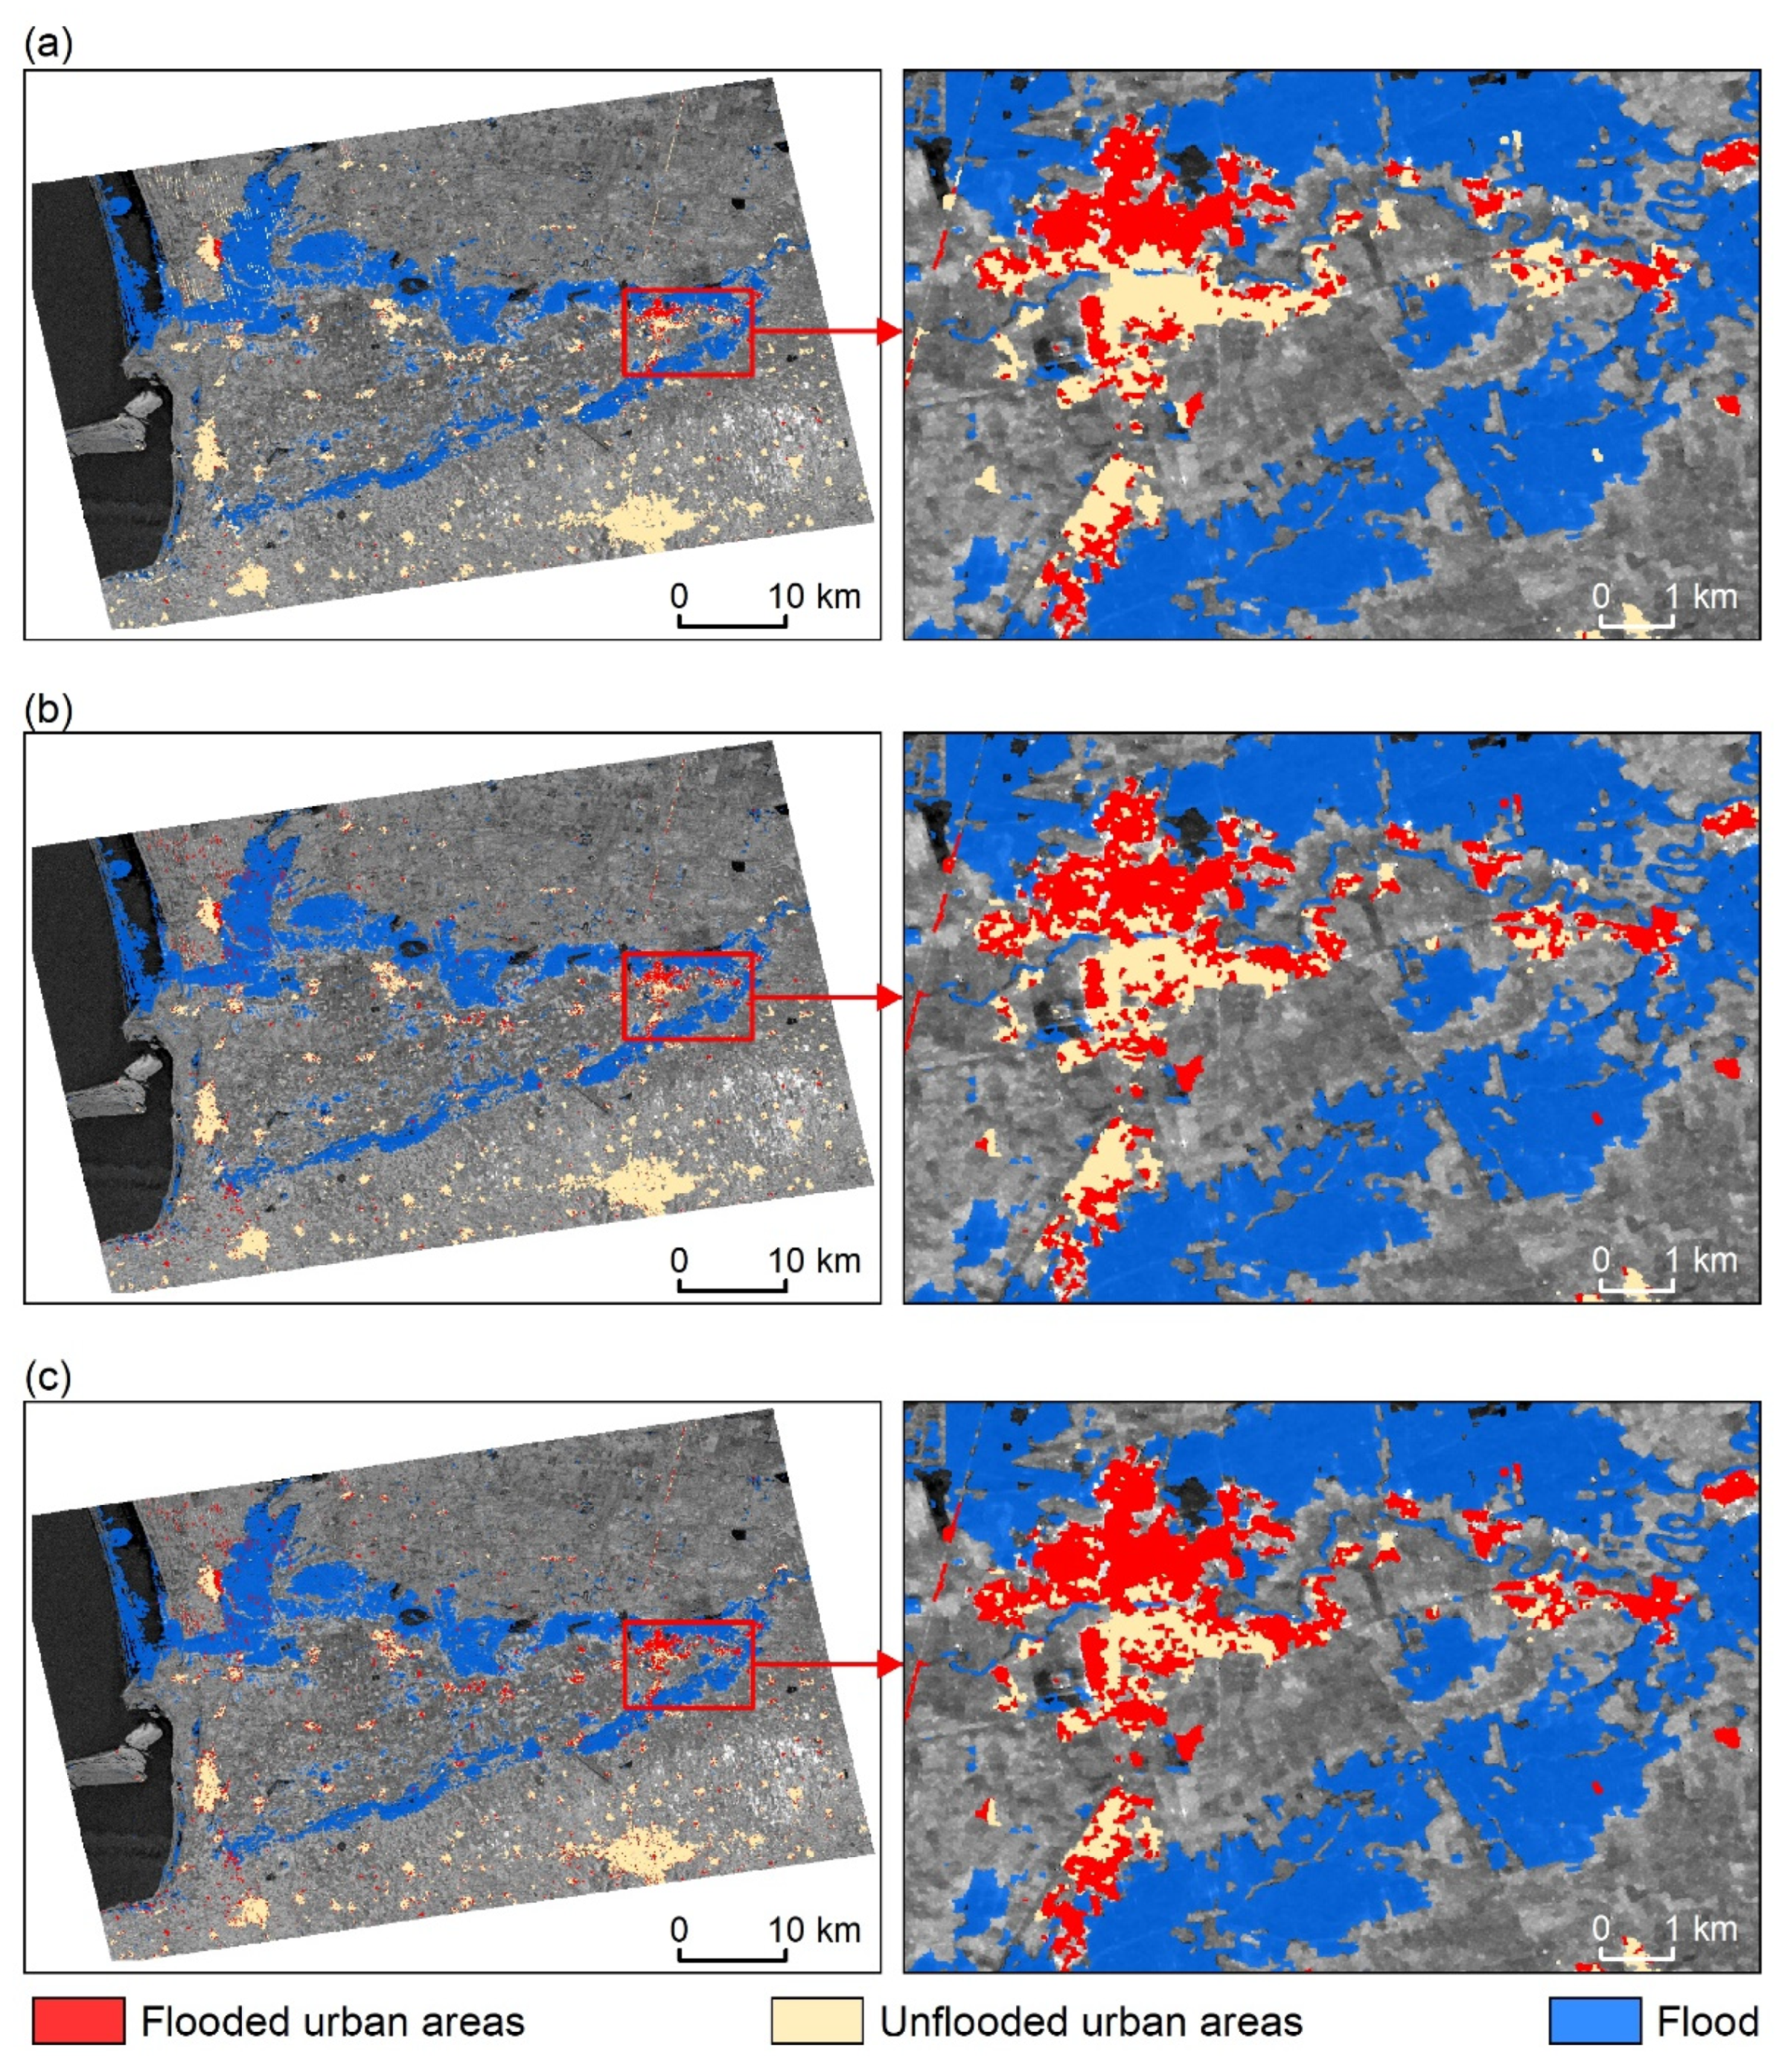
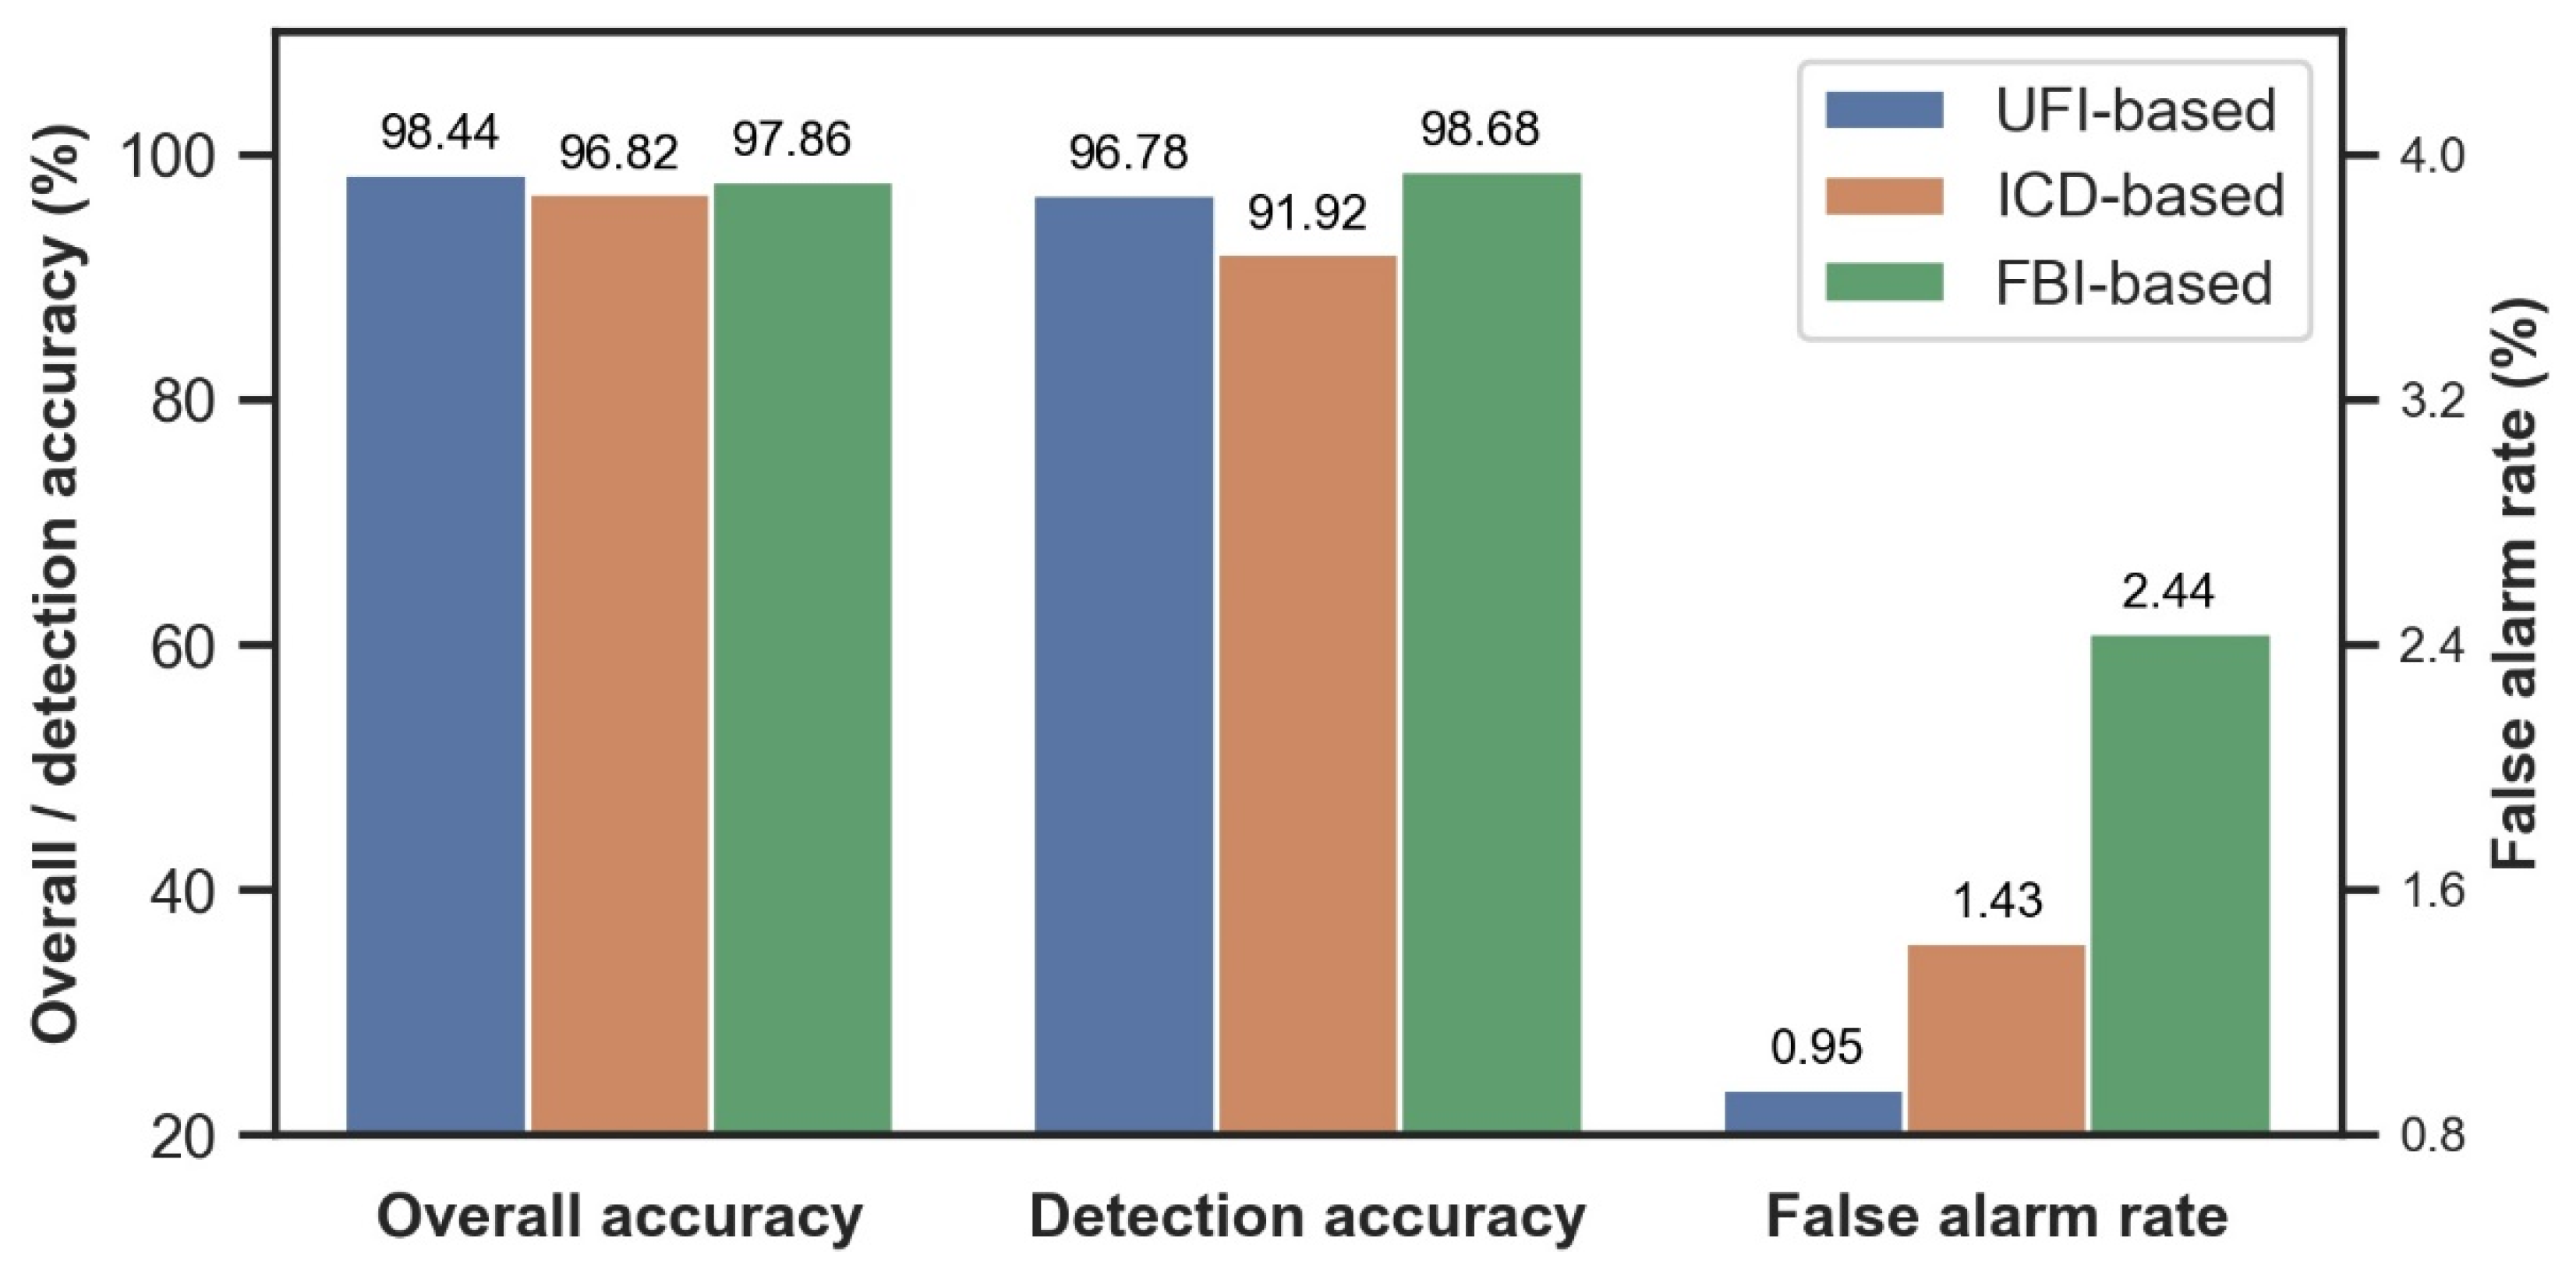
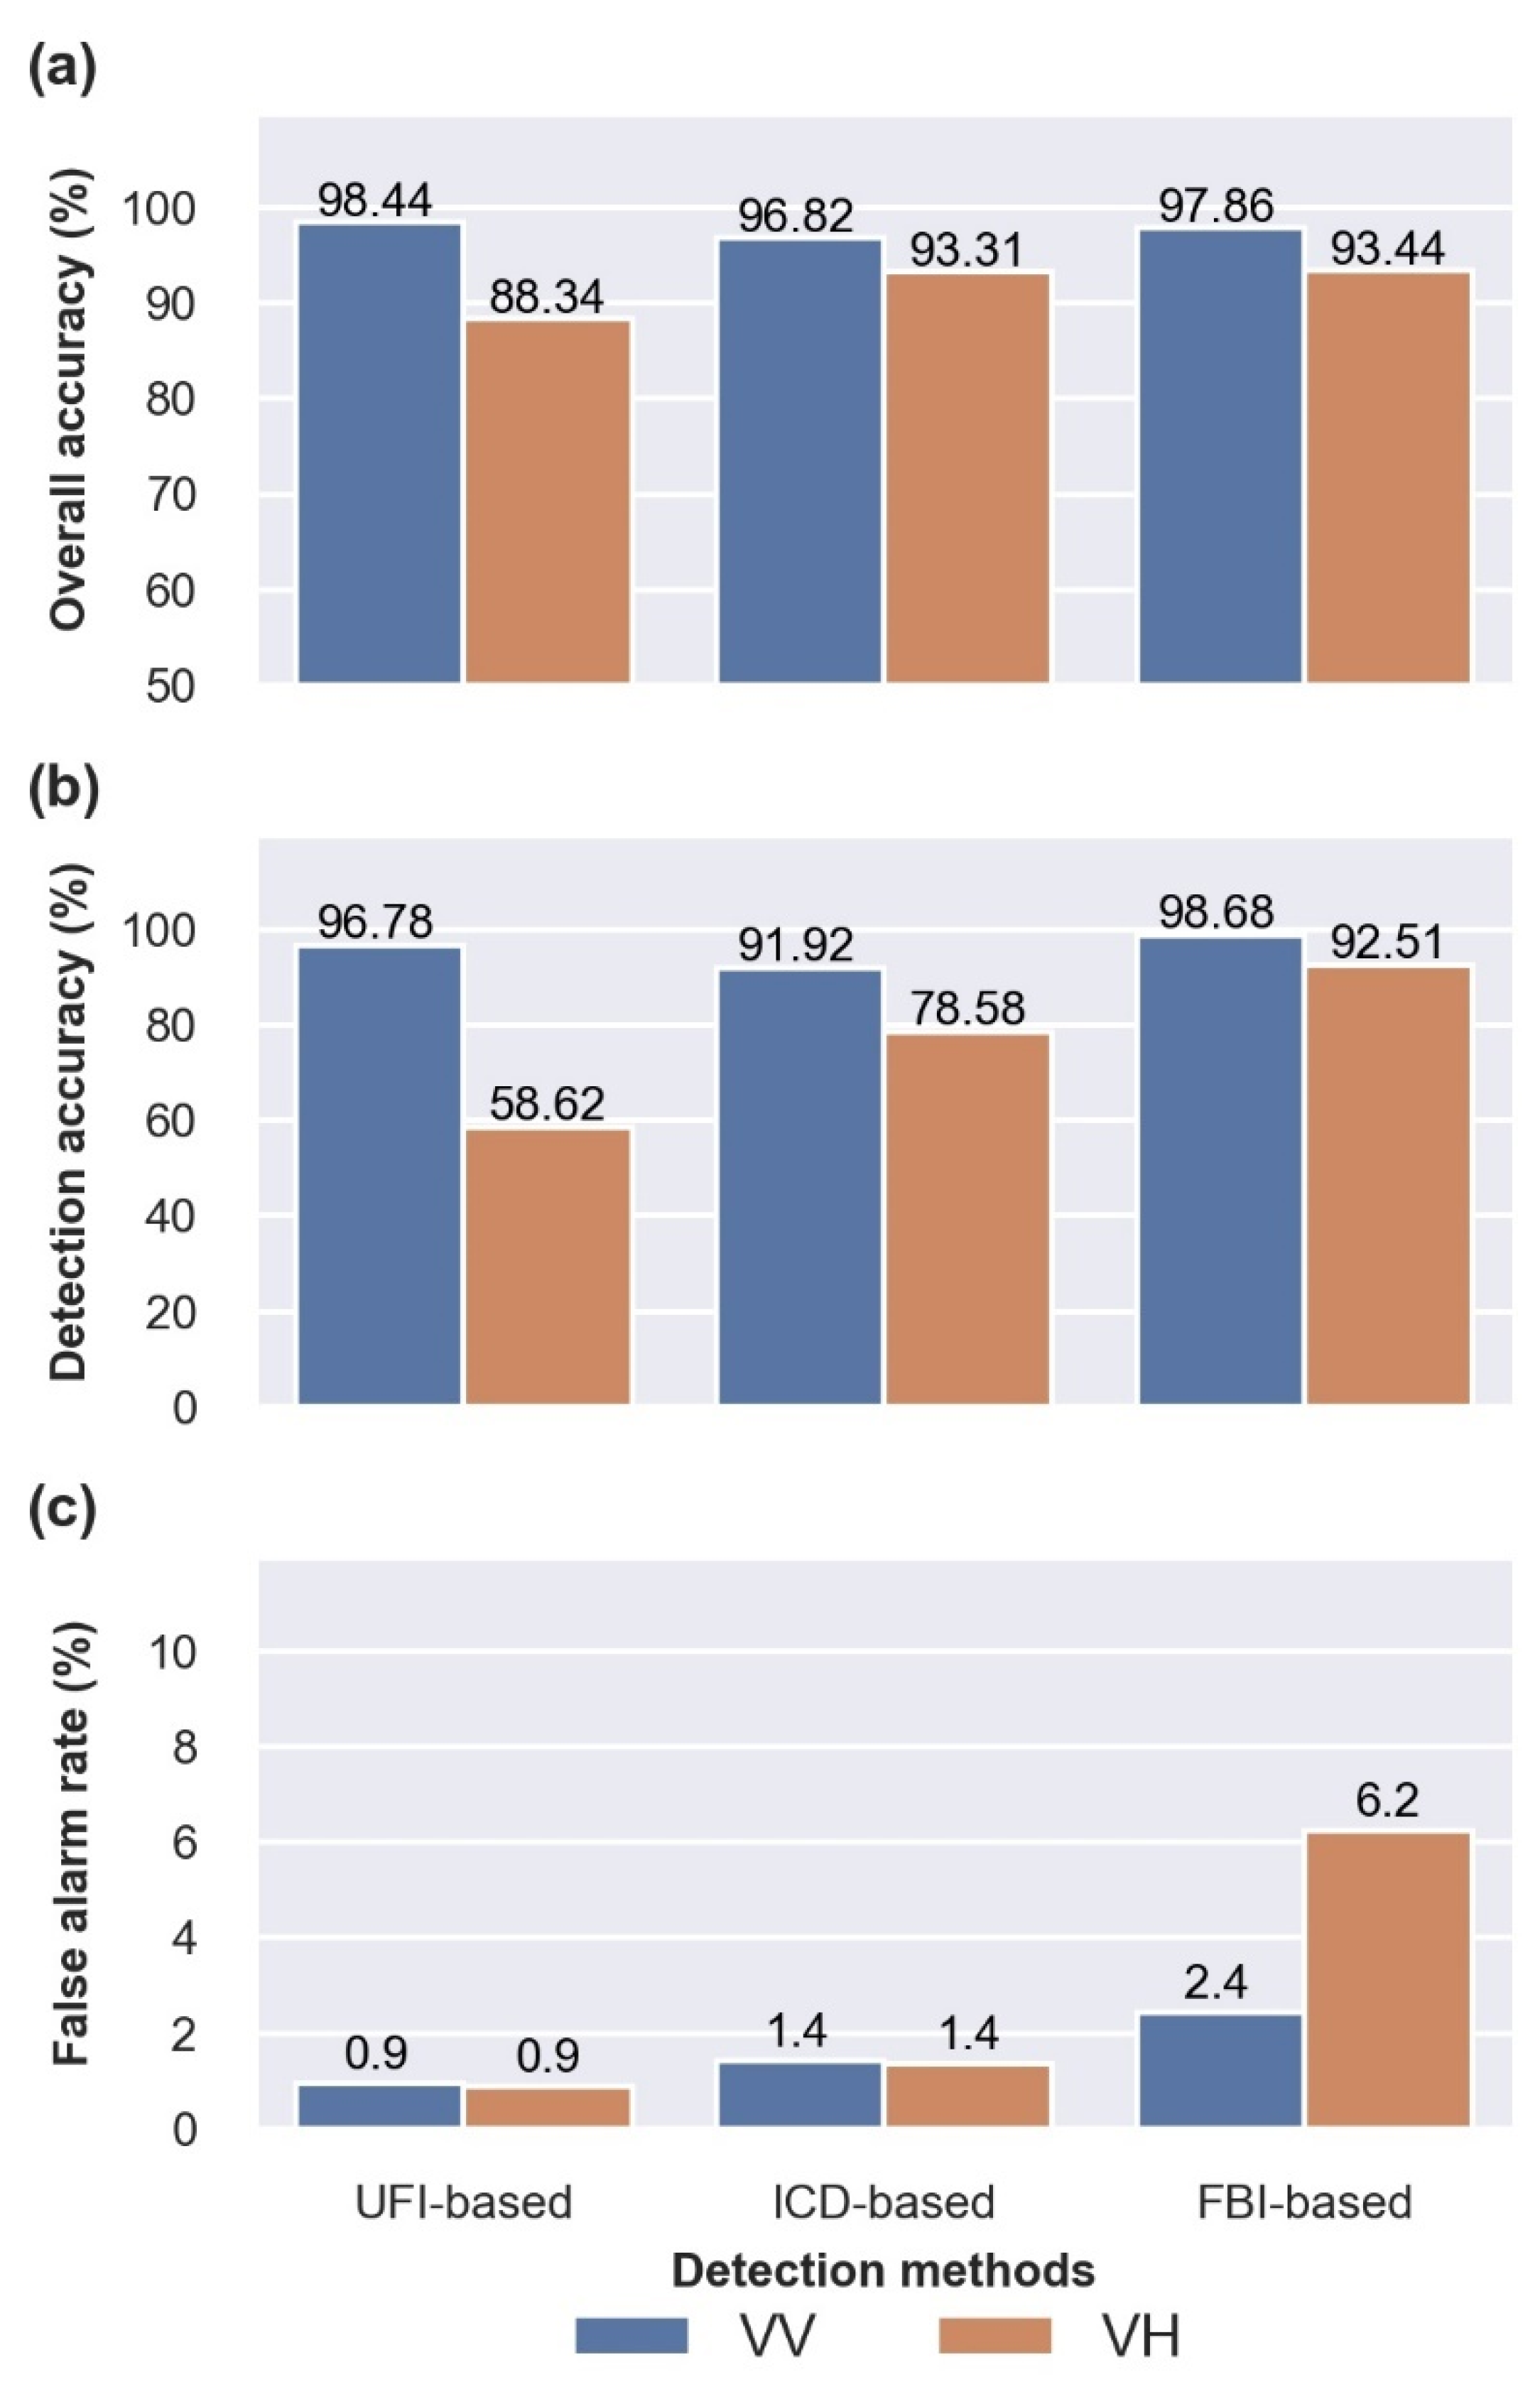
The UFI was proposed for detecting inundated urban areas. Assuming images (t1), (t2), and (t3) are three repeat-pass Sentinel-1 SAR images, among which images (t1) and (t2) were acquired before flooding and image (t3) was acquired during flooding, the UFI can be determined using:
UFI = σ t 3 / σ t 2 ρ t 2 t 3 / ρ t 1 t 2
where σt3 and σt2 denote the backscattering coefficients (linear scale) of images (t3) and (t2), respectively, and ρt2t3 and ρt1t2 stand for the interferometric coherence between images (t2) and (t3) and that between images (t1) and (t2), respectively.
As previously stated, the BCI and ICD are more significant under VV polarization than under VH polarization. Therefore, the UFI calculated with the VV polarization was used to detect flooded urban areas in this study. The UFI, BCI (i.e., σt3t2), and ICD (i.e., ρt2t3/ρt1t2) calculated with the Sentinel-1 VV polarization data are shown in Figure 13. Compared with the BCI and ICD, the UFI magnified the difference between flooded and unflooded urban areas. Thresholding methods or supervising classifiers can be implemented on the UFI to distinguish between the flooded and unflooded urban areas. Since training samples are often infeasible to collect during flooding events, an appropriate threshold should be more practical than supervised classifiers. Theoretically, the UFI of unflooded urban areas should be equal to 1, whereas that of flooded urban areas is much higher than 1. In this study, a threshold of 2.40 was determined based on the visual observation of the statistics in Figure 13 for the unsupervised detection of flooded urban areas.

5. Results

Flooded urban areas were detected using the UFI-based method (Figure 14). Inundated rural areas (e.g., inundated bare land and short vegetation) were also detected using the image ratioing method proposed by [43]. Given that VH polarization is less affected than VV polarization by wind [44], it was used in image ratioing to detect inundated rural areas. These images which include the inundated flooded rural areas could facilitate the observation of the detected inundated urban areas. Three statistics were calculated for the accuracy assessment on the flooded urban area detection, including the detection accuracy, false alarm rate, and overall accuracy. The detection accuracy is the percentage of correctly labeled flooded urban samples, and the false alarm rate denotes the percentage of mistakenly labeled unflooded urban samples. The overall accuracy is the percentage of correctly labeled verification samples (i.e., flooded and unflooded samples). The overall accuracy, detection accuracy, and false alarm rate attained by the UFI-based method were 96.93%, 91.09%, 0.95%, respectively.
The UFI-based method was compared with two conventional unsupervised methods that were proposed for detecting flooded urban area detection using Sentinel-1 PolSAR images. One was the ICD-based method that detects flooded urban areas from the ICD image by using thresholding methods (Chini et al., 2019). The other method was based on the fusion of backscattering coefficients and interferometric coherences (FBI) under the Bayesian network fusion framework (Li et al., 2019). All the three methods were implemented with the VV polarization of the three Sentinel-1 images. Supervised classifiers embedded in the eCognition 9.01 were used in these methods to avoid the influence of the subjective determination of thresholds. The Bayesian network classifier (BNC) was used in the FBI-based method. However, the BNC was not suitable for the UBI- and ICD-based methods because the UBI and ICD might not follow a Gaussian distribution. Given that support vector machines (SVMs) were good at binary classification and do not assume a particular probability density distribution of the input data, they were employed for the UBI- and ICD-based methods. The detection results and accuracy evaluation of these three methods are shown in Figure 15 and Figure 16, respectively. Among all the methods, the UFI-based method achieved the highest overall accuracy.
A comparison was also made between VV and VH polarizations for flooded urban area detection to quantitatively evaluate the improvement made by VV polarization. VV and VH polarizations were used separately with the UFI-, ICD-, and FBI methods to detect flooded urban areas. The detection results are shown in Figure 17, and the accuracy statistics are given in Figure 18. VV polarization produced much a higher detection accuracy and lower false alarm rate than VH polarization no matter what methods were used.

6. Discussion

Our investigation showed that VV polarization exhibits a stronger increase in radar return from flooded urban areas than VH. When urban areas were flooded, buildings were partially submerged by water. Thus, the original dihedral structure between the buildings and the ground was replaced by a new dihedral structure between the buildings and the water. Compared with the materials (e.g., such as asphalt, cement, and soil) that constitute roads, streets, and squares, water typically features a higher dielectric constant and smoother surface [18], which could result in an increase in the radar power reflected from the water surface to the buildings (Figure 19). Consequently, the radar backscatter from built-up areas was enhanced (Figure 19). Moreover, double-bounce scattering dominated the radar backscatter from urban areas because of numerous human-made dihedral structures [45,46]. Therefore, the BCI under VV polarization was more significant than that under VH polarization.
This study also found that VV is more sensitive to decorrelation caused by flooding in urban areas than VH. Interferometric coherence is determined by the position and stability of individual scatter on the ground. Therefore, a decrease in interferometric coherence implies a slight displacement of the ground objects [47]. When urban areas were flooded, the ground was covered by water, resulting in the displacement of the ground scatter and decorrelation in the urban areas. As a result, the interferometric coherence decreased when urban areas were inundated. Furthermore, decorrelation under VV polarization was more substantial than that under VH polarization, probably because VV polarization is more sensitive to double-bounce scattering from urban areas.
The improvement made by the proposed UFI-based method was owing to the synergy between the BCI and ICD in VV polarization. VV polarization attained higher overall accuracy than VH polarization when used with different detection methods, especially when used with the UFI-based method. The detection accuracy of the UFI-based method increased by 38.16% by using VV instead of VH polarization. The results accord with our finding that VV polarization is more sensitive to flooded urban areas than VH polarization. The UFI-based method outperformed the ICD-based and FBI-based methods when implemented with VV polarization. Compared with the ICD-based method, the UFI-based method improved the detection accuracy by 4.90% and 0.48%, respectively. Although the FBI-based method produced an overall accuracy comparable to the UFI-based method, it relied on an assumption that the input data follow a specific distribution, for which the statistical parameters must be determined. The UFI did not assume a particular probability density distribution of the input data, so it was relatively simple, straightforward, and easy to calculate. Moreover, the UFI corresponded to a clear radar return variation mechanism, which was conductive to the determination of an appropriate threshold for identifying inundated urban areas.
The Sentinel-1 mission observes the earth’s surface at a high frequency and resolution and distributes data quickly. The Sentinel-1 data can be delivered within an hour of reception for Near Real-Time (NRT) emergency response, within three hours for NRT priority areas, and within 24 h for systematically archived data (https://sentinels.copernicus.eu/web/sentinel/missions/sentinel-1/data-products (accessed on 19 October 2021)). Combined with Sentinel-1 data, the proposed method can map flooded urban areas quickly to provide valuable information for emergency relief organizations and mitigation departments to reduce casualties, infrastructure, and economic losses. In addition, the results obtained by the proposed method can be used to verify the simulation accuracy of hydrological models. The integration of our proposed method with hydrological models is significant for the prevention and management of urban flood disasters and the planning of urban drainage systems.

7. Conclusions

The Sentinel-1 satellites can provide PolSAR data of the entire world every six days, thereby providing an unprecedented capability to detect inundated urban areas. However, developing advanced methods to improve its detection accuracy remains challenging because the radar return changes caused by urban flooding in different polarizations are rarely evaluated and compared. This study investigated the characteristics and mechanisms of the radar return variations caused by urban flooding using the Sentinel-1 VH and VV data and Jilin-1 high-resolution optical images acquired during a flood in the Golestan province of Iran. The BCI and ICD were found in the inundated urban areas in VH and VV polarizations. Furthermore, VV polarization was found to be more sensitive to the BCI and ICD than VH polarization. The BCI was induced by the dihedral structure between the buildings and water, which produced stronger radar backscatter than that between the buildings and ground (e.g., asphalt, cement, and soil), because water has a higher dielectric constant and smoother surface and could reflect more radar energy than the ground. The ICD was due to the displacement of ground scatter caused by the inundation. Both flooded and unflooded urban areas were dominated by single-and double-bounce scattering, which resulted in slight depolarization. Therefore, the BCI and ICD were more significant in VV than in VH polarizations.
A UFI-based method was developed on the basis of the aforementioned findings for the unsupervised detection of inundated urban areas. The ratio between the BCI and ICD was proposed as the UFI to enhance the difference in radar return between flooded and unflooded urban areas. The UFI calculated with VV polarization data was used to detect flooded urban areas. The overall accuracy, detection accuracy, and false-alarm rate attained by the UFI-based method were 96.93%, 91.09%, 0.95%, respectively. Compared with the conventional ICD- and FBI-based methods, the UFI-based method produced better results. VV and VH polarizations were also compared in flooded urban area detection using the UFI-, ICD-, and FBI-based methods. VV polarization achieved a higher overall accuracy than VH polarization in all the detection methods, especially in the UFI-based method. The detection accuracy of the UFI-based method improved by 38.16% when using VV polarization instead of VH polarization. These results indicate that the improvement made by the UFI-based method was owing to the synergy of the BCI and ICD in the optimal polarization.
Although the threshold determined for the UBI achieved a high overall accuracy in this study, it was not tested in other areas because of the lack of PolSAR and ground truth data collected over inundated urban areas. Further studies are needed to examine the applicability of the threshold in different regions, especially in areas where floods frequently occur, such as highly urbanized coastal areas and tropical areas. Moreover, the radar return changes in other polarizations (e.g., HH, HV) should be investigated in future studies for steering the selection of optimal polarization to further improve the detection of inundated urban areas.

Author Contributions

Conceptualization, Z.Q., Y.C. and Y.H; Methodology, H.Z. and Z.Q.; Software, H.Z.; Validation, H.Z.; Formal analysis, H.Z. and Z.Q.; Investigation, H.Z.; Resources, Z.Q., X.L., Y.C., X.W. and Y.H.; Data curation, H.Z.; Writing—original draft, H.Z. and Z.Q.; Writing—review & editing, Z.Q., X.L., Y.C., X.W. and Y.H.; Visualization, H.Z.; Supervision, Z.Q., X.L. and X.W.; Project administration, Z.Q. and X.L.; Funding acquisition, Z.Q., X.L. and Y.C. All authors have read and agreed to the published version of the manuscript.

Funding

This work was supported by the National Key R&D Program of China (Grant No. 2019YFB2103102), the National Natural Science Foundation of China (Grant No. 41601445), the Natural Science Foundation of Guangdong Province of China (Grant No. 2016A030313230), the Fundamental Research Funds for the Central Universities (No. 20lgzd09), and the Open Fund of Key Laboratory of Geographic Information Science (Ministry of Education), East China Normal University (Grant No. KLGIS2020A02).

Institutional Review Board Statement

Not applicable.

Informed Consent Statement

Not applicable.

Data Availability Statement

The Sentinel-1 images used in this study are accessible through https://scihub.copernicus.eu/dhus/#/home (accessed on 5 May 2019). The Jilin-1 image was provided by the Chang Guang Satellite Technology Corporation (http://discover.charmingglobe.com/ (accessed on 29 September 2019)).

Acknowledgments

The authors are thankful to the anonymous reviews and the academic editors for their advantageous comments and suggestions for upgrading the quality of this paper.

Conflicts of Interest

The authors declare no conflict of interest.

References

  1. Pulvirenti, L.; Chini, M.; Pierdicca, N.; Guerriero, L.; Ferrazzoli, P. Flood monitoring using multi-temporal COSMO-SkyMed data: Image segmentation and signature interpretation. Remote Sens. Environ. 2011, 115, 990–1002. [Google Scholar] [CrossRef]
  2. Martinis, S. Improving Flood Mapping in Arid Areas Using Sentinel-1 Time Series Data. Int. Geosci. Remote Sens. 2017, 193–196. [Google Scholar] [CrossRef] [Green Version]
  3. Santos, M.; Fragoso, M.; Santos, J.A. Damaging flood severity assessment in Northern Portugal over more than 150 years (1865–2016). Nat. Hazards 2018, 91, 983–1002. [Google Scholar] [CrossRef]
  4. Wallemacq, P.; Guha-Sapir, D.; McClean, D.; CRED; UNISDR. The Human Cost of Weather Related Disasters—1995–2015; CRED: Brussels, Belgium, 2015. [Google Scholar] [CrossRef]
  5. Westra, S.; Alexander, L.V.; Zwiers, F.W. Global Increasing Trends in Annual Maximum Daily Precipitation. J. Clim. 2013, 26, 3904–3918. [Google Scholar] [CrossRef] [Green Version]
  6. Zhang, W.; Villarini, G.; Vecchi, G.A.; Smith, J.A. Urbanization exacerbated the rainfall and flooding caused by hurricane Harvey in Houston. Nature 2018, 563, 384–388. [Google Scholar] [CrossRef] [PubMed]
  7. Jia, S.; Li, Y.; Lü, A.; Liu, W.; Zhu, W.; Yan, J.; Liang, Y.; Xiang, X.; Guan, Z. City storm-flood events in China, 1984–2015. Int. J. Water Resour. Dev. 2018, 35, 605–618. [Google Scholar] [CrossRef]
  8. Liuzzo, L.; Freni, G. Quantifying the Uncertainty Related to Climate Change in the Assessment of Urban Flooding-A Case Study. Water 2019, 11, 2072. [Google Scholar] [CrossRef] [Green Version]
  9. Fang, Y.; Du, S.; Scussolini, P.; Wen, J.; He, C.; Huang, Q.; Gao, J. Rapid Population Growth in Chinese Floodplains from 1990 to 2015. Int. J. Environ. Res. Public Health 2018, 15, 1602. [Google Scholar] [CrossRef] [Green Version]
  10. Hallegatte, S.; Green, C.; Nicholls, R.J.; Corfee-Morlot, J. Future flood losses in major coastal cities. Nat. Clim. Chang. 2013, 3, 802–806. [Google Scholar] [CrossRef]
  11. Schlaffer, S.; Matgen, P.; Hollaus, M.; Wagner, W. Flood detection from multi-temporal SAR data using harmonic analysis and change detection. Int. J. Appl. Earth Obs. Geoinf. 2015, 38, 15–24. [Google Scholar] [CrossRef]
  12. Cian, F.; Marconcini, M.; Ceccato, P. Normalized Difference Flood Index for rapid flood mapping: Taking advantage of EO big data. Remote Sens. Environ. 2018, 209, 712–730. [Google Scholar] [CrossRef]
  13. Rokni, K.; Ahmad, A.; Selamat, A.; Hazini, S. Water Feature Extraction and Change Detection Using Multitemporal Landsat Imagery. Remote Sens. 2014, 6, 4173–4189. [Google Scholar] [CrossRef] [Green Version]
  14. Xu, H. Modification of normalised difference water index (NDWI) to enhance open water features in remotely sensed imagery. Int. J. Remote Sens. 2007, 27, 3025–3033. [Google Scholar] [CrossRef]
  15. Du, Z.; Linghu, B.; Ling, F.; Li, W.; Tian, W.; Wang, H.; Gui, Y.; Sun, B.; Zhang, X. Estimating surface water area changes using time-series Landsat data in the Qingjiang River Basin, China. J. Appl. Remote Sens. 2012, 6. [Google Scholar] [CrossRef]
  16. Jafari Shalamzari, M.; Zhang, W. Assessing Water Scarcity Using the Water Poverty Index (WPI) in Golestan Province of Iran. Water 2018, 10, 1079. [Google Scholar] [CrossRef] [Green Version]
  17. McFeeters, S.K. The use of the Normalized Difference Water Index (NDWI) in the delineation of open water features. Int. J. Remote Sens. 1996, 17, 1425–1432. [Google Scholar] [CrossRef]
  18. Mason, D.C.; Giustarini, L.; Garcia-Pintado, J.; Cloke, H.L. Detection of flooded urban areas in high resolution Synthetic Aperture Radar images using double scattering. Int. J. Appl. Earth Obs. Geoinf. 2014, 28, 150–159. [Google Scholar] [CrossRef] [Green Version]
  19. Mason, D.C.; Speck, R.; Devereux, B.; Schumann, G.J.P.; Neal, J.C.; Bates, P.D. Flood Detection in Urban Areas Using TerraSAR-X. IEEE Trans. Geosci. Remote Sens. 2010, 48, 882–894. [Google Scholar] [CrossRef] [Green Version]
  20. Gan, T.Y.; Zunic, F.; Kuo, C.C.; Strobl, T. Flood mapping of Danube River at Romania using single and multi-date ERS2-SAR images. Int. J. Appl. Earth Obs. Geoinf. 2012, 18, 69–81. [Google Scholar] [CrossRef]
  21. DeVries, B.; Huang, C.; Armston, J.; Huang, W.; Jones, J.W.; Lang, M.W. Rapid and robust monitoring of flood events using Sentinel-1 and Landsat data on the Google Earth Engine. Remote Sens. Environ. 2020, 240. [Google Scholar] [CrossRef]
  22. Chini, M.; Pelich, R.; Pulvirenti, L.; Pierdicca, N.; Hostache, R.; Matgen, P. Sentinel-1 InSAR Coherence to Detect Floodwater in Urban Areas: Houston and Hurricane Harvey as A Test Case. Remote Sens. 2019, 11, 107. [Google Scholar] [CrossRef] [Green Version]
  23. Giustarini, L.; Hostache, R.; Matgen, P.; Schumann, G.J.P.; Bates, P.D.; Mason, D.C. A Change Detection Approach to Flood Mapping in Urban Areas Using TerraSAR-X. IEEE Trans. Geosci. Remote Sens. 2013, 51, 2417–2430. [Google Scholar] [CrossRef] [Green Version]
  24. Torres, R.; Snoeij, P.; Geudtner, D.; Bibby, D.; Davidson, M.; Attema, E.; Potin, P.; Rommen, B.; Floury, N.; Brown, M.; et al. GMES Sentinel-1 mission. Remote Sens. Environ. 2012, 120, 9–24. [Google Scholar] [CrossRef]
  25. Lee, J.S.; Grunes, M.R.; Pottier, E. Quantitative comparison of classification capability: Fully polarimetric versus dual and single-polarization SAR. IEEE Trans. Geosci. Remote Sens. 2001, 39, 2343–2351. [Google Scholar] [CrossRef]
  26. Pulvirenti, L.; Chini, M.; Pierdicca, N.; Boni, G. Use of SAR Data for Detecting Floodwater in Urban and Agricultural Areas: The Role of the Interferometric Coherence. IEEE Trans. Geosci. Remote Sens. 2016, 54, 1532–1544. [Google Scholar] [CrossRef]
  27. Li, Y.; Martinis, S.; Wieland, M.; Schlaffer, S.; Natsuaki, R. Urban Flood Mapping Using SAR Intensity and Interferometric Coherence via Bayesian Network Fusion. Remote Sens. 2019, 11, 2231. [Google Scholar] [CrossRef] [Green Version]
  28. Watanabe, M.; Matsumoto, M.; Shimada, M.; Asaka, T.; Nishikawa, H.; Sato, M. Simultaneous observation data of GB-SAR/PiSAR to detect flooding in an urban area. EURASIP J. Adv. Signal Process. 2009, 2010, 1–6. [Google Scholar] [CrossRef] [Green Version]
  29. Kazemi, H.; Bourkheili, S.H.; Kamkar, B.; Soltani, A.; Gharanjic, K.; Nazari, N.M. Estimation of greenhouse gas (GHG) emission and energy use efficiency (EUE) analysis in rainfed canola production (case study: Golestan province, Iran). Energy 2016, 116, 694–700. [Google Scholar] [CrossRef]
  30. Gharibreza, M.; Zaman, M.; Porto, P.; Fulajtar, E.; Parsaei, L.; Eisaei, H. Assessment of deforestation impact on soil erosion in loess formation using 137Cs method (case study: Golestan Province, Iran). Int. Soil Water Conserv. Res. 2020. [Google Scholar] [CrossRef]
  31. Aminyavari; Saghafian; Sharifi. Assessment of Precipitation Estimation from the NWP Models and Satellite Products for the Spring 2019 Severe Floods in Iran. Remote Sens. 2019, 11, 2741. [Google Scholar] [CrossRef] [Green Version]
  32. Motlagh, M. Aerial Photos of Aqqala Devastating Flood. Available online: https://en.mehrnews.com/photo/143596/Aerial-photos-of-Aqqala-devastating-flood (accessed on 20 September 2020).
  33. Geudtner, D.; Torres, R.; Snoeij, P.; Davidson, M.; Rommen, B. Sentinel-1 System Capabilities and Applications. In Proceedings of the 2014 IEEE Geoscience and Remote Sensing Symposium, Quebec City, QC, Canada, 13–18 July 2014; pp. 1457–1460. [Google Scholar] [CrossRef]
  34. Congalton, R.; Green, K. Sample design considerations. Assess. Accuracy Remote Sens. Data 2009, 63–83. [Google Scholar] [CrossRef]
  35. Zuhlke, M.; Fomferra, N.; Brockmann, C.; Peters, M.; Veci, L.; Malik, J.; Regner, P. SNAP (Sentinel Application Platform) and the ESA Sentinel 3 Toolbox. In Proceedings of the Sentinel-3 for Science Workshop, Venice, Italy, 2–5 June 2015. [Google Scholar]
  36. Lee, J.S.; Jurkevich, L.; Dewaele, P.; Wambacq, P.; Oosterlinck, A. Speckle filtering of synthetic aperture radar images: A review. Remote Sens. Rev. 1994, 8, 313–340. [Google Scholar] [CrossRef]
  37. Moser, G.; Serpico, S.B. Generalized minimum-error thresholding for unsupervised change detection from SAR amplitude imagery. IEEE Trans. Geosci. Remote Sens. 2006, 44, 2972–2982. [Google Scholar] [CrossRef]
  38. Bovolo, F.; Bruzzone, L. A detail-preserving scale-driven approach to change detection in multitemporal SAR images. IEEE Trans. Geosci. Remote Sens. 2005, 43, 2963–2972. [Google Scholar] [CrossRef]
  39. Zhang, X.; Liu, W.; He, S. Urban Change Detection in TerraSAR Image Using the Difference Method and SAR Coherence Coefficient. J. Eng. Sci. Technol. Rev. 2018, 11, 18–23. [Google Scholar] [CrossRef]
  40. Qi, Z.; Yeh, A.G.; Li, X.; Lin, Z. Integration of polarimetric decomposition, object-oriented image analysis, and decision tree algorithms for land-use and land-cover classification using RADARSAT-2 polarimetric SAR data. Phtogrammetric Eng. Remote Sens. 2012, 78, 169–181. [Google Scholar] [CrossRef]
  41. Benz, U.C.; Hofmann, P.; Willhauck, G.; Lingenfelder, I.; Heynen, M. Multi-resolution, object-oriented fuzzy analysis of remote sensing data for GIS-ready information. ISPRS J. Photogramm. Remote Sens. 2004, 58, 239–258. [Google Scholar] [CrossRef]
  42. Pal, M. Random forest classifier for remote sensing classification. Int. J. Remote Sens. 2007, 26, 217–222. [Google Scholar] [CrossRef]
  43. Li, Y.; Martinis, S.; Plank, S.; Ludwig, R. An automatic change detection approach for rapid flood mapping in Sentinel-1 SAR data. Int. J. Appl. Earth Obs. Geoinf. 2018, 73, 123–135. [Google Scholar] [CrossRef]
  44. Tanguy, M.; Chokmani, K.; Bernier, M.; Poulin, J.; Raymond, S. River flood mapping in urban areas combining Radarsat-2 data and flood return period data. Remote Sens. Environ. 2017, 198, 442–459. [Google Scholar] [CrossRef] [Green Version]
  45. Lee, J.S.; Pottier, E. Polarimetric Radar Imaging: From Basics to Applications; CRC Press: Boca Raton, FL, USA; London, UK; New York, NY, USA, 2017. [Google Scholar]
  46. Manavalan, R. Review of synthetic aperture radar frequency, polarization, and incidence angle data for mapping the inundated regions. J. Appl. Remote Sens. 2018, 12. [Google Scholar] [CrossRef]
  47. Nico, G.; Pappalepore, M.; Pasquariello, G.; Refice, A.; Samarelli, S. Comparison of SAR amplitude vs. coherence flood detection methods—a GIS application. Int. J. Remote Sens. 2010, 21, 1619–1631. [Google Scholar] [CrossRef]
Figure 1. Comparison of radar return change between flooded urban areas and flooded rural areas. Sentinel-1 SAR images acquired (a) before and (b) during flooding. The RGB composition of the Sentinel-1 images is formed with VV (red), VH (green), and VV (blue).
Remotesensing 13 04511 g001
Figure 2. Study area for flooded urban area detection using Sentinel-1 PolSAR images.
Remotesensing 13 04511 g002
Figure 3. Inundated urban areas in the Golestan province [32].
Remotesensing 13 04511 g003
Figure 4. Sentinel-1 PolSAR images acquired on (a) 5 March 2019, (b) 17 March 2019, and (c) 29 March 2019, respectively, and (d) a Jilin-1 high-resolution optical image collected on 29 March 2019 (Note: the RGB composition of the Sentinel-1 PolSAR images is formed with VV (red), VH (green), and VV + VH (blue)).
Remotesensing 13 04511 g004
Figure 5. (a) Jilin-1 high-resolution optical image. (b) Flooded and unflooded urban area samples selected from the Jilin-1 image in Aqqala city (Note: the samples in this figure are part of the samples selected for this study).
Remotesensing 13 04511 g005
Figure 6. Samples selected for typical land cover classes in the study area.
Remotesensing 13 04511 g006
Figure 7. Backscattering coefficient variation in (a) unflooded urban areas under VH polarization, (b) unflooded urban areas under VV polarization, (c) flooded urban areas under the VH polarization, and (d) flooded urban areas under the VV polarization (Note: σt1, σt2, σt3 denote the backscattering coefficient of the images acquired on 5, 17, and 29 March in 2019, respectively).
Remotesensing 13 04511 g007
Figure 8. Interferometric coherence variation in (a) unflooded urban areas in VH polarization, (b) unflooded urban areas in VV polarization, (c) flooded urban areas in VH polarization, and (d) flooded urban areas in VV polarization (Note: ρt1t2 and ρt2t3 denote the interferometric coherence between the first and second images and that between the second and third images, respectively).
Remotesensing 13 04511 g008
Figure 9. Ratio between the interferometric coherence extracted from the second and third images (i.e., ρt2t3) and that extracted from the first and second images (i.e., ρt1t2) under (a) VH and (b) VV polarizations.
Remotesensing 13 04511 g009
Figure 10. Scheme of the UFI-based method for inundated urban area detection.
Remotesensing 13 04511 g010
Figure 11. Sentinel-1 PolSAR images acquired on (a) 17 March 2019 (before the flooding) and (b) 29 March 2019 (during the flooding). (c) Image fused from the three Sentinel-1 PolSAR images. Segmentation with scale parameters of (d) 20, (e) 10, and (f) 5.
Remotesensing 13 04511 g011
Figure 12. Land cover map produced using a random forest algorithm based on the pre-flooding PolSAR images.
Remotesensing 13 04511 g012
Figure 13. (a) UFI, (b) BCI, and (c) ICD calculated with the Sentinel-1 VV polarization data.
Remotesensing 13 04511 g013
Figure 14. Flooded urban areas detected using the UFI-based method.
Remotesensing 13 04511 g014
Figure 15. Flooded urban areas detected using the (a) UFI-based, (b) ICD-based, and (c) FBI-based methods.
Remotesensing 13 04511 g015
Figure 16. Accuracy statistics of the UFI-, ICD-, and FBI-based methods for flooded urban area detection.
Remotesensing 13 04511 g016
Figure 17. Comparison between VV and VH polarization for flooded urban area detection using (a) UFI-based, (b) ICD-based, and (c) FBI-based methods.
Remotesensing 13 04511 g017
Figure 18. Accuracy improvement achieved by the VV polarization in comparison with VH polarization. (a) overall accuracy, (b) detection accuracy, (c) false alarm rate.
Remotesensing 13 04511 g018
Figure 19. Change in the scattering mechanism of urban areas. Double-bounce scattering between (a) buildings and ground and (b) buildings and water.
Remotesensing 13 04511 g019
Table 1. Imaging parameters of the Sentinel-1 PolSAR images.
Acquisition
Date
PolarizationModePixel Spacing
(Range × Azimuth)
Orbit
5 March 2019VV and VHIW5 m × 20 mAscending
17 March 2019VV and VHIW5 m × 20 mAscending
29 March 2019VV and VHIW5 m × 20 mAscending
Table 2. Training and validation samples of flooded and unflooded urban areas.
ClassTrainingValidationTotal
PlotsPixelsPlotsPixelsPlotsPixels
Flooded urban areas7929,1477928,3617928,361
Unflooded urban areas311149,786310144,812310144,812
Total390178,933389173,173389173,173
Table 3. Training and validation samples selected for each land cover class.
ClassTrainingValidationTotal
PlotsPixelsPlotsPixelsPlotsPixels
Urban area267173,069266157,733533330,802
Vegetation256242,778257257,586513500,364
Water128258,160129240,407257498,567
Bare land305239,610306252,176611491,786
Total956913,617958907,90219141821,519
Publisher’s Note: MDPI stays neutral with regard to jurisdictional claims in published maps and institutional affiliations.

