Abstract
Rapid urbanization has degraded some important ecosystem services and threatens socioeconomic sustainability. Although many studies have focused on the effect of urbanization on ecosystem services, the effect and its threshold have not been well-identified spatially. In this study, we propose a research framework by integrating nighttime light data, the InVEST (Integrated Valuation of Environmental Service and Tradeoffs) model, and a spatial response index to characterize the response of ecosystem services to rapid urbanization. We considered Foshan City as a case study to explore the effect of rapid urbanization on ecosystem services during 2000–2018. Our results showed that rapid urbanization resulted in a 49.13% reduction in agricultural production and a 10.13% reduction in habitat quality. The spatial response index of agricultural production, habitat quality, soil retention, water yield, and carbon sequestration were 14.25%, 2.94%, 0.04%, 0.78%, and 0.07%, respectively. We found that developing urban areas had the highest spatial response index, indicating that this area was the crucial area for future land management. We consider that our research framework can help identify the key areas affected by rapid urbanization. Visualizing the spatial response index and extracting the threshold for different levels of urbanization will be conducive to sustainable urban management and planning.
1. Introduction
Urbanization is one of the most prominent features of contemporary global environmental change [1,2], and Chinese cities are undergoing rapid urbanization [3]. This is evident from the increase in the proportion of the urban population from 17.9% to 52.6% between 1978 and 2012 [4]. In addition, urbanization of the population has been accompanied by considerable land-use changes. These areas have suffered from environmental pollution, ecological deterioration, and economic loss [5,6]. Recently, the effect of rapid urbanization on ecosystems and resilient socio-ecological systems has attracted attention, with previous studies focusing on urban agriculture [1,7,8], urban forests [9,10], urban water [11,12], and habitat quality [13,14]; maintaining a healthy environment is relevant for sustainable urban construction and planning.
Complex urban socio-ecological systems result from the interaction between humans and nature. When planning sustainable cities, we need to move beyond city limits and consider the entirety of the human-dominated system, which depends on natural ecosystems [15]. Nighttime light data are closely linked to human-based systems and are typical signals of regional economic and social activities. Such data have been widely used to determine the extent of built-up land and spatio-temporal characteristics of urbanization dynamics [16,17]. These studies mainly focus on the relationship between nighttime light data and urban construction land expansion [18,19]. Meanwhile, with the expansion of the application range of nighttime light data, these data are applied to more research on the impact of urbanization, such as vegetation primary productivity [20], habitat quality [21], and other ecological effects [22]. Many previous studies use the digital numbers (DN) value of nighttime light data to identify urbanization areas as a main method. However, how to identify urban developed areas, developing areas, and rural areas through threshold division is a still problem worth discussing. Therefore, this study will use population, economy, and land use data to link the nighttime light data with the urbanization levels, and then to identify different levels of urbanization areas.
ES are recognized as the benefits people obtain from ecosystems, which incorporate society and ecosystems and support the survival and development of a population’s well-being [23,24,25]. Studies on the quantification of ES mainly include physically quantifying services and assessing the economic value of interest [24,26]. These quantitative assessments, modeling, and mapping technologies of ES have been widely used for regional sustainable development [27,28], especially in rapidly urbanized areas [25,29]. In the previous studies, land use and land cover change (LULC) data were widely used as basic data to evaluate the ES changes in the process of urbanization [30,31,32,33]. These case studies, such as by Lyu [30], Long [31], Peng [32], and Liu [33], have gradually linked land use, ecosystem services, and urbanization. However, how ecosystem services respond to land use changes due to urbanization is not yet clear. In the meantime, from the perspective of land ecological management, the demand for quantitative and spatial visualization research is increasing. Therefore, it is necessary to clarify the quantitative and spatial response relationship between changes in ecosystem services and land use changes. In our study, we defined a spatial response index to characterize the impact of rapid urbanization on ES, and a threshold was spatially visualized to assist with urban planning and management.
The present study focused on Foshan City in the Pearl River Delta region, which is a typical representative of rapid urbanization in China. Based on the statistics, the unprecedented rate of urbanization increased from 75.06% to 95.00% in 2000–2018 and has had a considerable effect on Foshan. As an important city in the Guangdong–Hong Kong–Macao Greater Bay Area, the rapid development of advanced manufacturing has also affected the ecological environment quality, agricultural production, and human settlement of Foshan. Our objective was to propose a research framework to integrate nighttime light data, the Integrated Valuation of Environmental Service and Tradeoffs (InVEST) model, and a spatial response index to address the effect of rapid urbanization on ES. Based on multi-source data, we established the relationship between the nighttime light data index and the urbanization level to identify the different levels of urbanization areas. We aimed to resolve the following specific research problems: (1) How can the relationship between the nighttime light data index and the urbanization level be established to identify urbanization areas? (2) Which kind of ES is most affected by rapid urbanization? Which area exhibits the most considerable changes in ES and responsiveness of ES to rapid urbanization? We quantified and mapped five vital ES, including agricultural production, carbon sequestration, water yield, soil retention, and habitat quality under three different urbanization levels (developed urban, developing urban, and rural areas) between 2000 and 2018. We considered that our results and maps can be used for ecosystem protection or restoration activities to improve sustainable urban planning and management.
2. Materials and Methods
2.1. Study Area
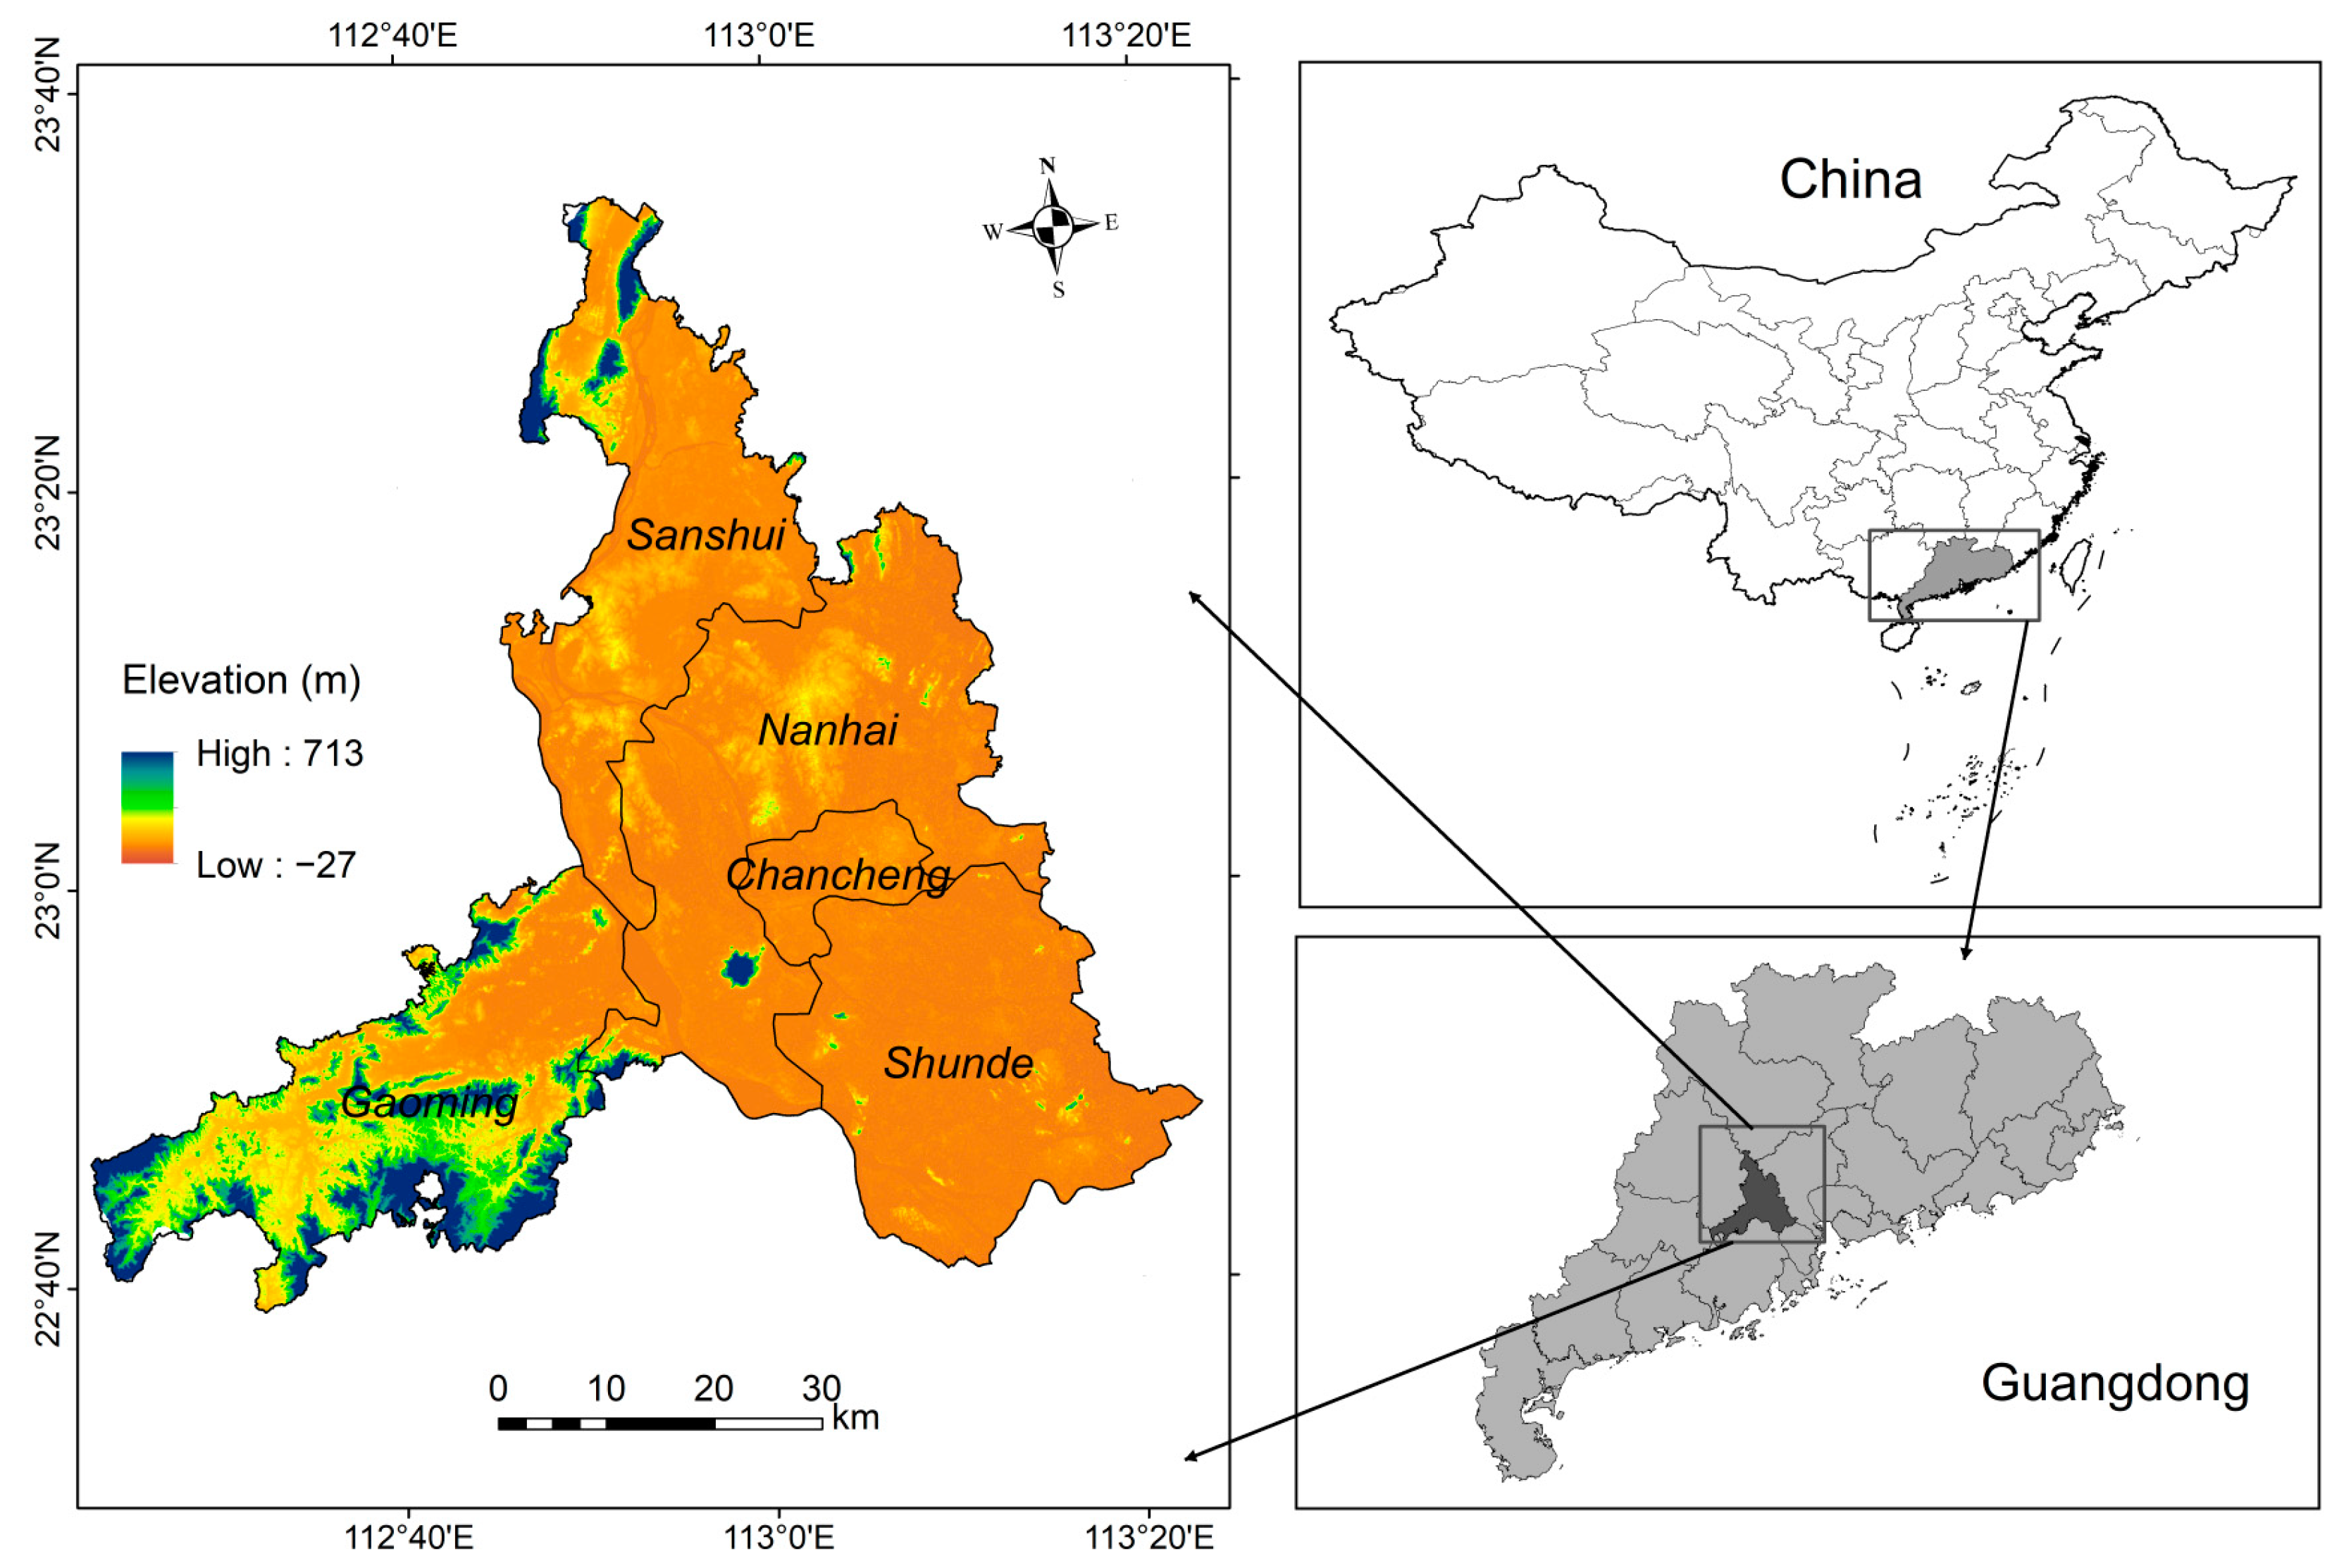
Foshan is spread across an area of approximately 3792.65 km2 in the south–central area of Guangdong Province, southern China (22°38′–23°34′ N, 112°22′–113°23′ E). The Xijiang River, Beijiang River, and tributaries of the Pearl River run through Foshan. The study area has a southern subtropical monsoon climate with an average annual temperature of approximately 24 °C and average annual precipitation of 1600–2000 mm [34]. Abundant hydrothermal conditions have contributed to a distinct “dike-pond” agriculture–aquaculture multiplex system to achieve renewable and sustainable development of ecological agriculture [35].
Administratively, Foshan contains five districts: Sanshui, Nanhai, Chancheng, Shunde, and Gaoming (Figure 1). Since the implementation of the Chinese economic reform policy in 1979, Foshan has experienced unprecedented rapid urbanization and economic growth. The urbanization rate in this area has been far higher than that across the rest of China [36,37]. During 2000–2018, the permanent population increased from 5.34 million to 7.96 million, the rate of urbanization increased from 75.06% to 95.00%, and the gross domestic product increased from 105.04 billion to 993.59 billion yuan [38].

Figure 1.
Location of Foshan City, China.
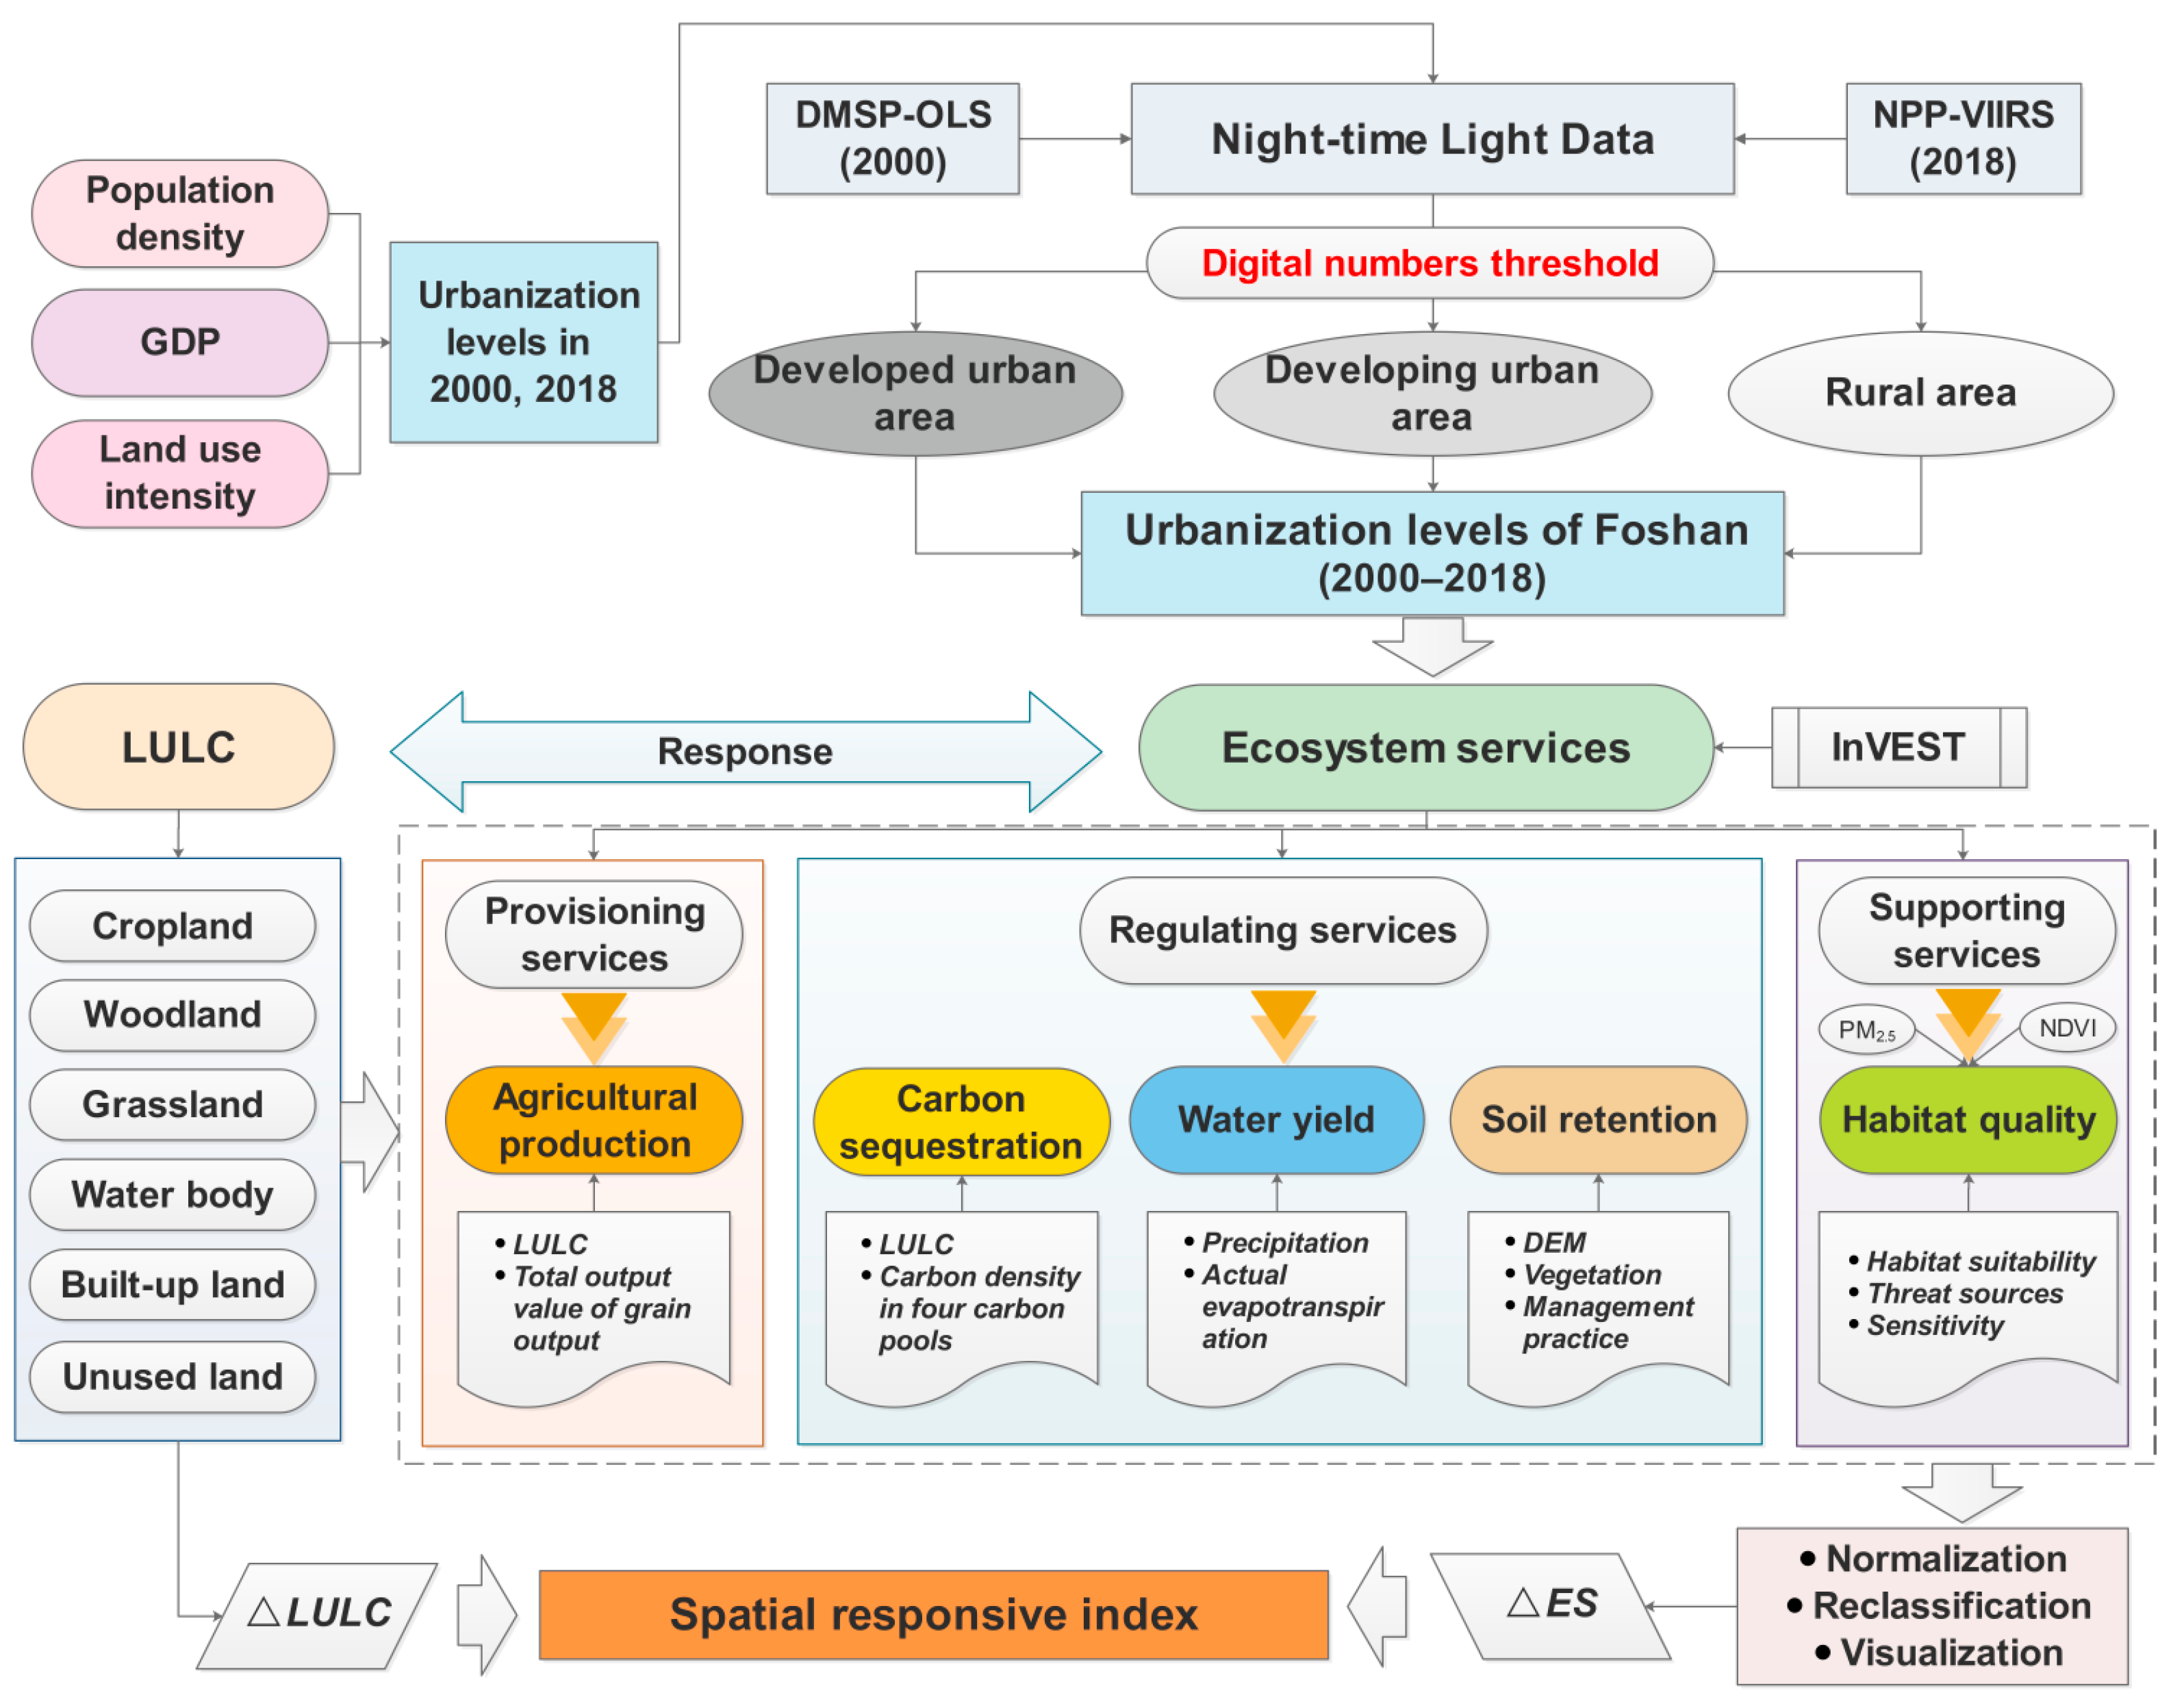
2.2. Research Framework
We developed a framework to integrate nighttime light data, InVEST, and the spatial response index of urban ES. This framework was used to address problems pertaining to the effects of rapid urbanization on vital regional ES and the responsiveness of ES to changes in LULC (Figure 2). The spatial response index and spatial change patterns of ES can help policy makers identify key areas that suffer from increased urbanization.
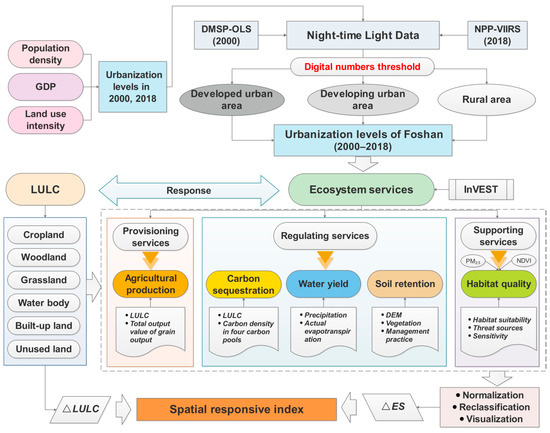
Figure 2.
Method framework linking nighttime light data, land use and land cover change (LULC), and ecosystem services (ES).
First, we constructed a series of consistent nighttime light datasets by integrating the Defense Meteorological Satellite Program’s Operational Line-scan System (DMSP-OLS) and the Suomi National Polar-orbiting Partnership Visible Infrared Imaging Radiometer Suite (NPP-VIIRS). The nighttime light data from 2000 and 2018 were used to classify the urbanization level of Foshan and to identify the rural, developing, and developed areas. Second, we used the InVEST and empirical models to assess the changes in agricultural production, carbon sequestration, water yield, soil retention, and habitat quality. We quantitatively evaluated the changes in LULC and ES from 2000 to 2018 and calculated the spatial response index under different urbanization levels. Finally, the various ES were normalized, reclassified, and overlaid to determine the total ES. The spatial distribution and zoning thresholds of the response of total ES to urbanization were mapped.
2.3. Data Collection
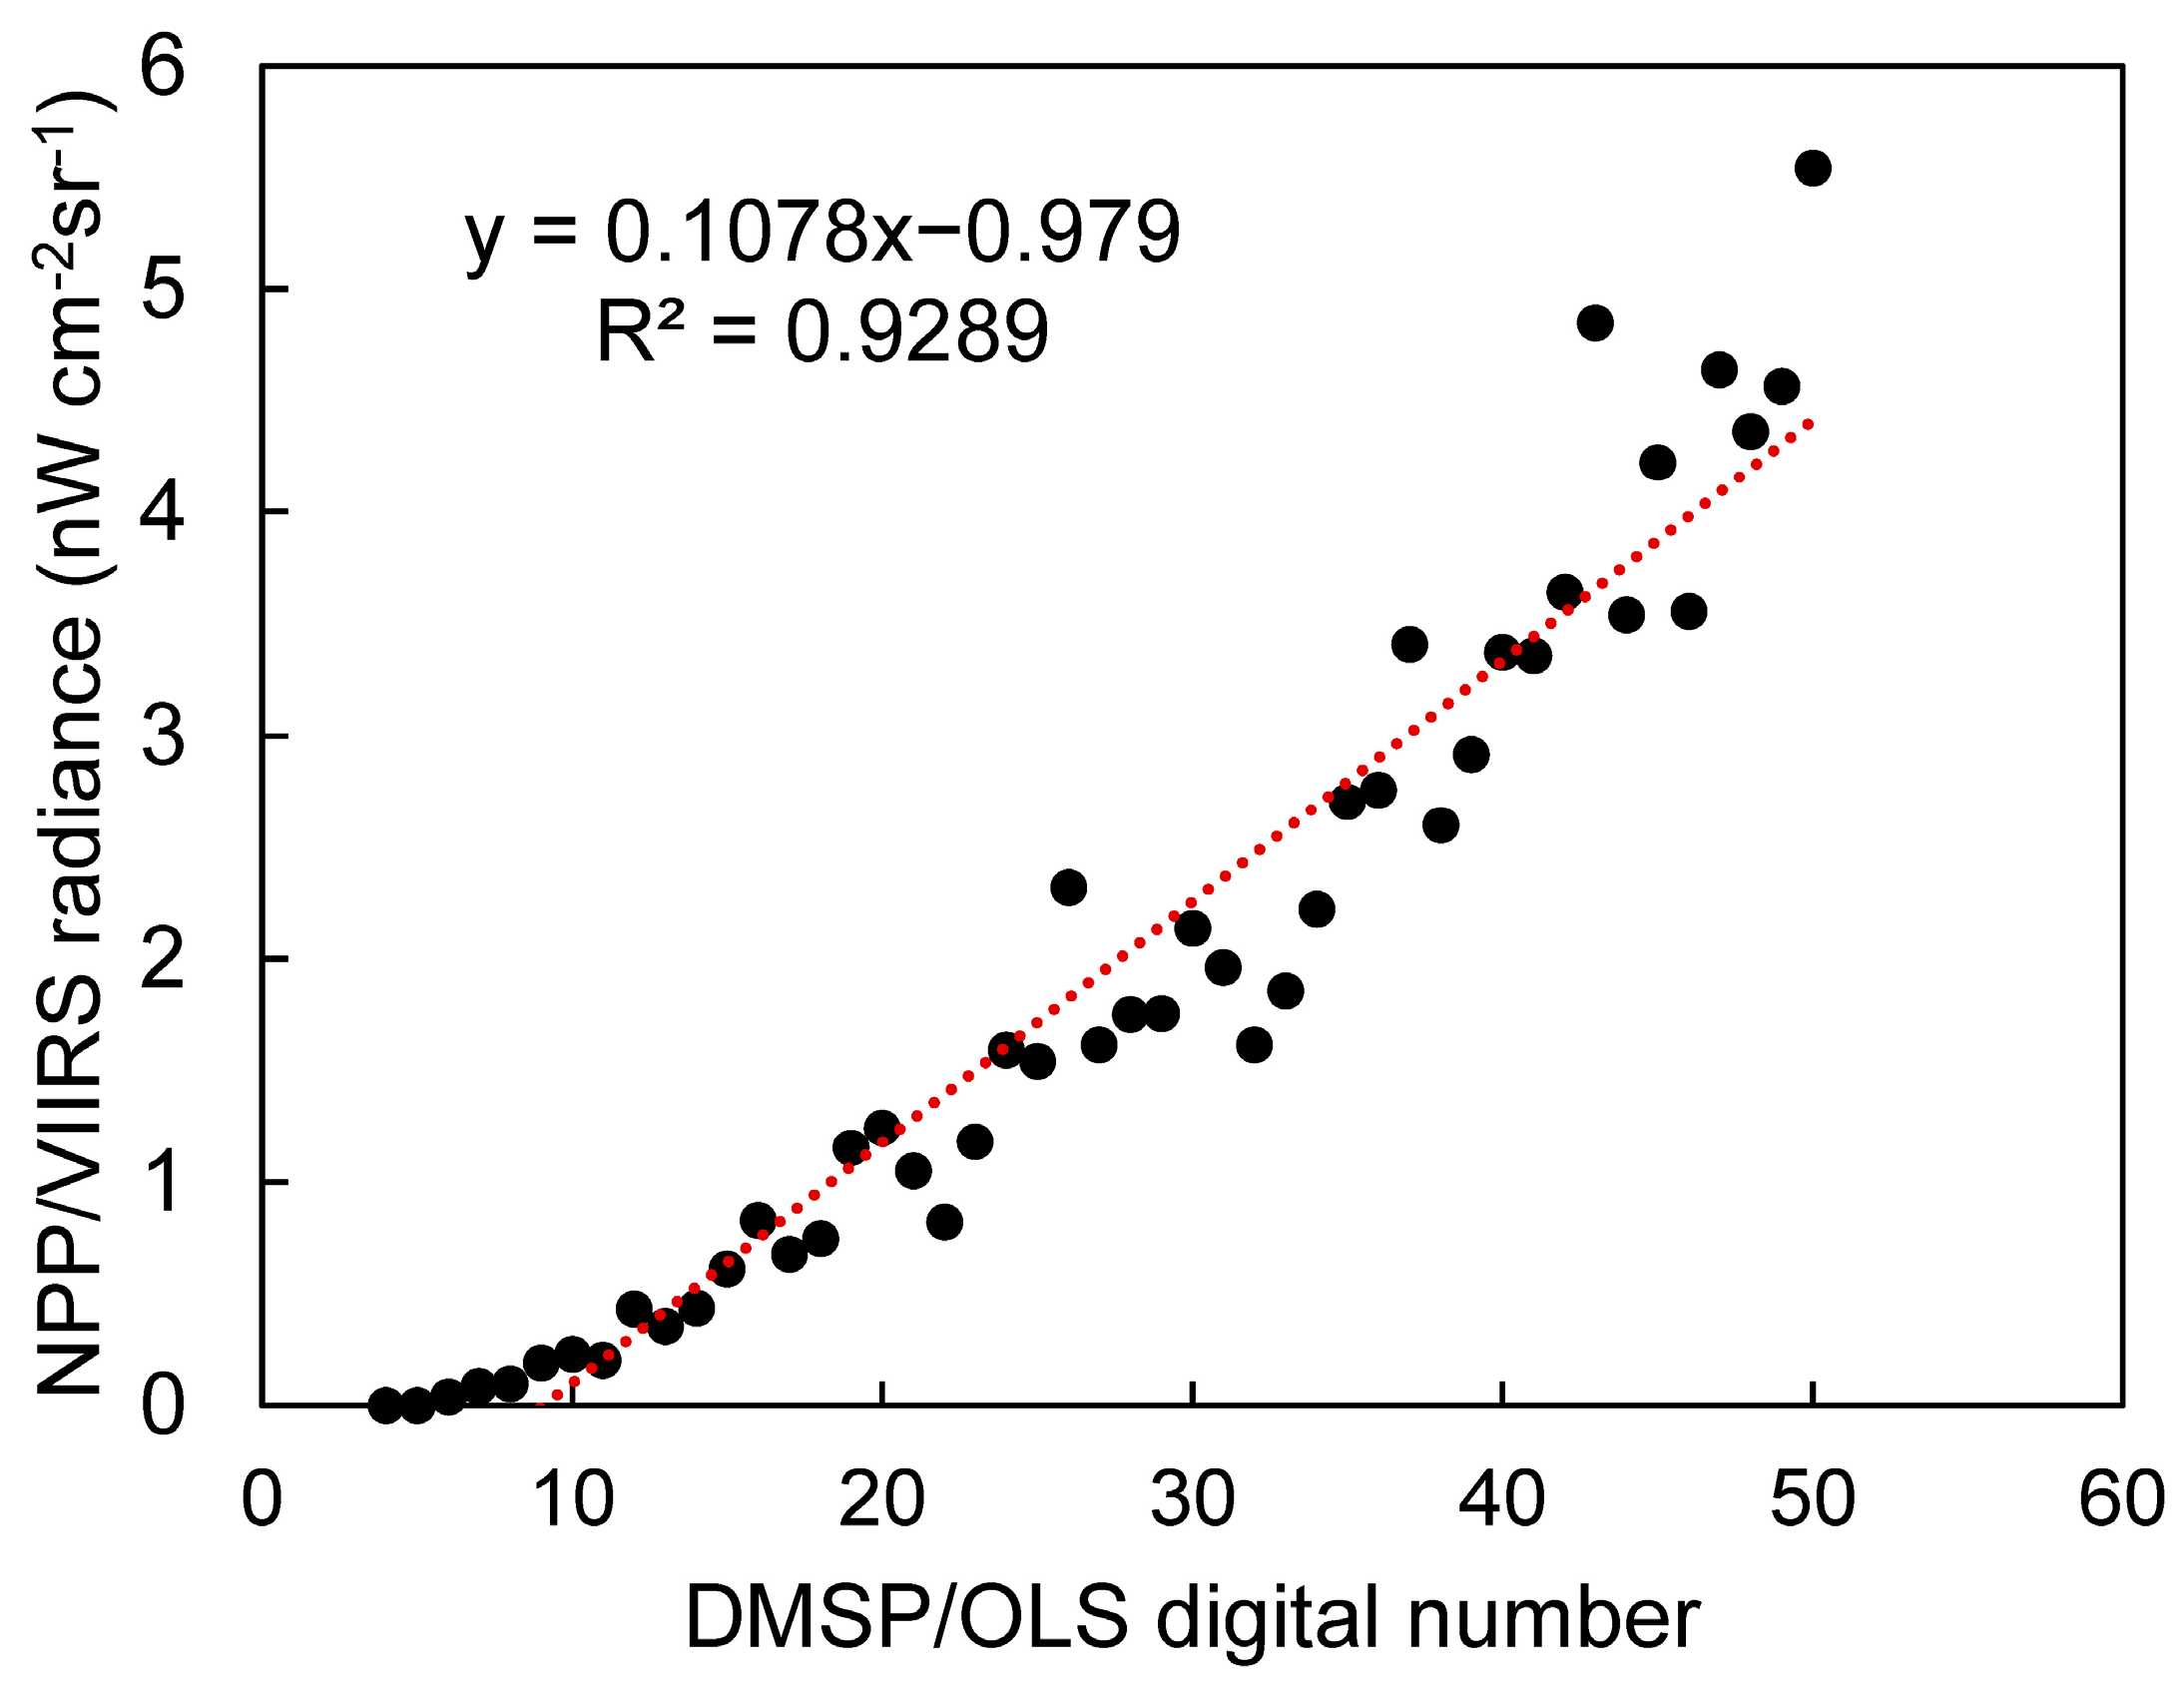
We used nighttime light data to quantify and classify the level of urbanization in Foshan. The DMSP-OLS light product in 2000 and NPP-VIIRS monthly product in 2018 were downloaded from the website of the Earth Observation Group. Owing to the differences between NPP-VIIRS and DMSP-OLS images, we constructed a series of consistent nighttime light datasets through integration and calibration. The inter-calibration method was referred to in the literature [39]. Nighttime light data from two sensors in the overlapping year of 2012 were used to construct the calibration function (Figure 3). The calibrated DN ranged from 0 to 63, with higher values representing higher levels of urbanization [40,41].

Figure 3.
Correlation of DMSP-OLS with NPP-VIIRS in Foshan.
We used data from 2000 and 2018 because the identification of land-use changes and changes in ES requires a long-term process. The data from 2018 were part of the latest and most complete data series that we could obtain. This period was also the period that experienced the fastest urbanization in Foshan. We utilized nighttime light data with 30 arc-second grid spatial resolution (approximately 1 km). Gross domestic product (GDP) and population density data were also at 1 km spatial resolution. The other data category included LULC data at 300 m spatial resolution, the digital elevation model at 30 m spatial resolution, soil data at 1 km, NDVI data at 1 km, and meteorological data from an observation station, which were resampled to 300 m for LULC and ES analysis. The data category and sources are shown in Table 1.

Table 1.
Data category and sources.
2.4. Classification of Urbanization Levels
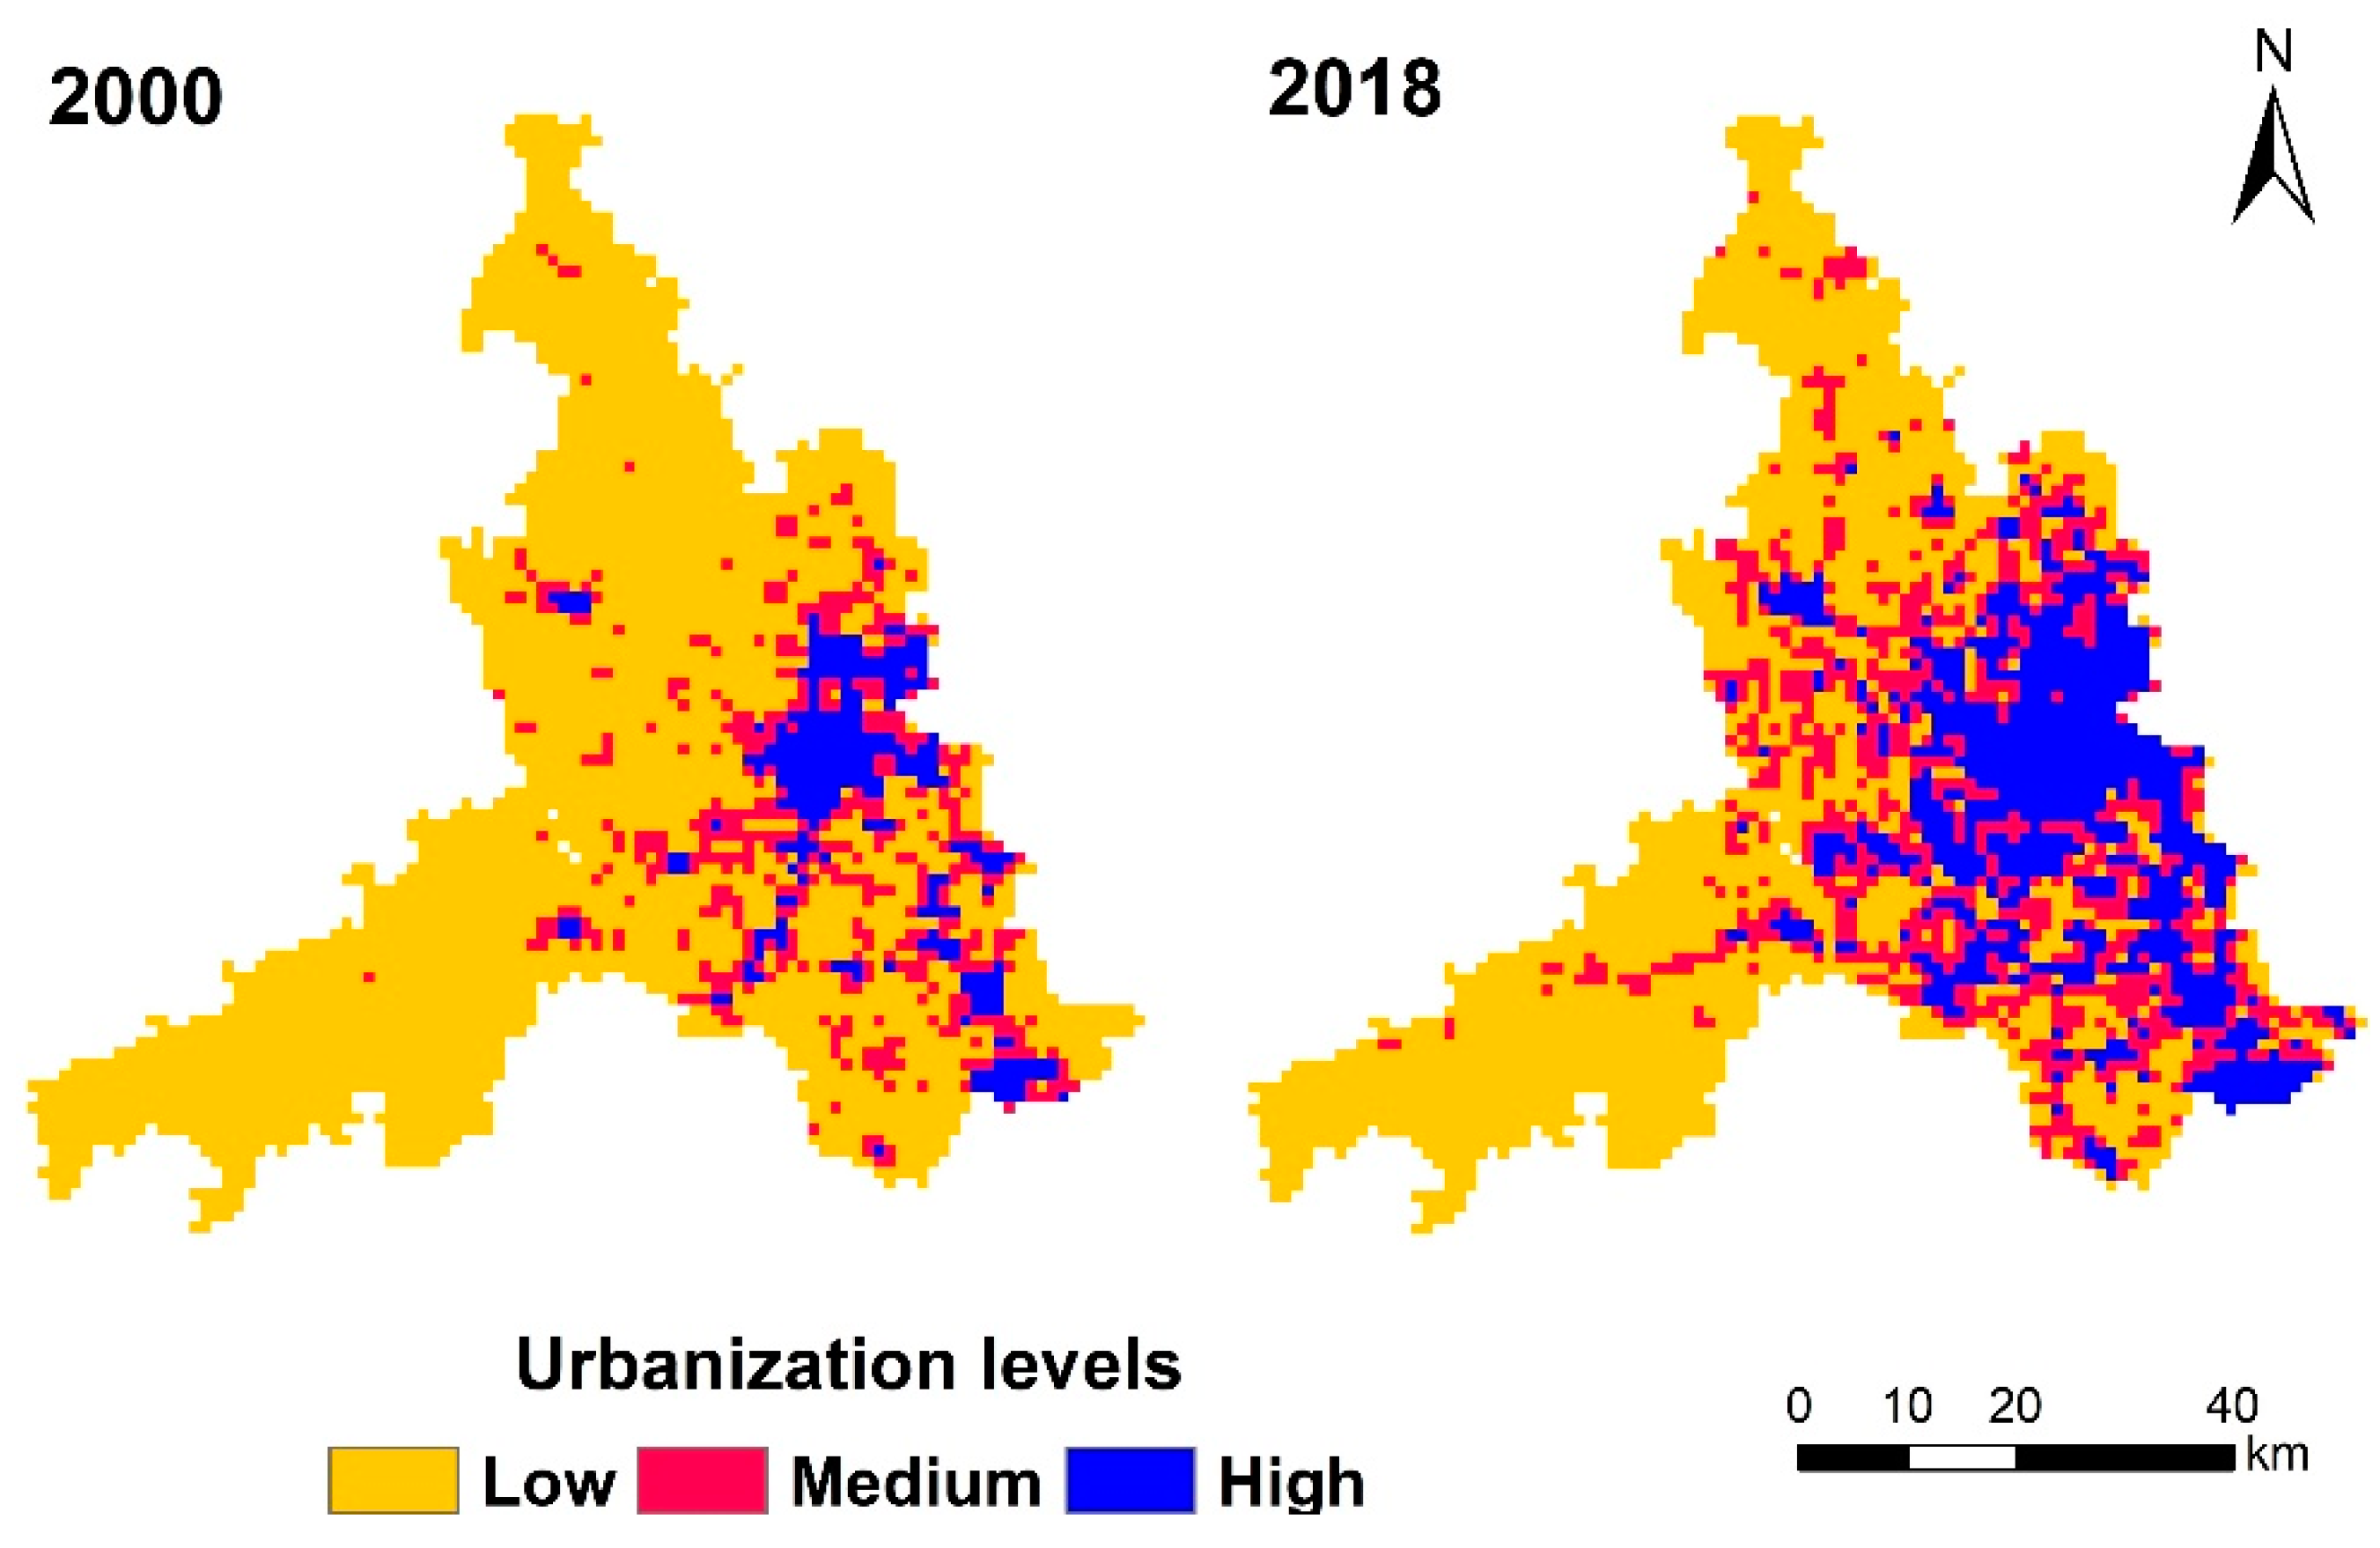
To establish the relationship between nighttime light data and the degree of urbanization development, we used the DN threshold to identify spatial regions under different levels of urbanization development over a period of time (2000–2018) [42]. Based on population density, land use intensity, and GDP, we constructed a comprehensive urban development index that characterized Foshan’s urbanization level. Land use intensity refers to the percentage of construction land area to the total area of the region, reflecting the intensity of human activities [43]. The greater the proportion of construction land area, the greater the intensity of human activities and the higher the level of urbanization. Population density can reflect the degree of population concentration in a city. The greater the population density, the higher the level of urbanization. GDP reflects the economic level of the region. The higher the GDP, the higher the level of urbanization. Due to the obvious differences in population density and GDP per area in some developed areas, the two indicators fluctuate greatly. Therefore, with the method of logarithm in statistics, the weakened volatility characteristics are substituted into the calculation to facilitate subsequent analysis. Based on the results of comprehensive urbanization indicators, the Jenks natural breakpoint method was used to divide the urbanization level into three levels: high, medium, and low, and the spatial distribution of Foshan’s urbanization levels in 2000 and 2018 were obtained (Figure 4). The formula for calculating the comprehensive level of urbanization is as follows:
where Di is the comprehensive level of urbanization in year i, xi is the land use intensity, yi is the population density, and zi is the GDP in Foshan.

Figure 4.
Spatial distribution of urbanization levels in Foshan in 2000 and 2018 based on comprehensive urban development indicators.
Based on the results of urbanization levels in Foshan in 2000 and 2018, we extracted the average DN value of nighttime light data in three areas with different levels of urbanization (high, medium, and low) as the threshold. Based on the calibrated nighttime light data, recorded DN and calibrated DN were used as indicators to identify the urban sprawl in Foshan from 2000 (DN2000) to 2018 (DN2018). We confirmed the DN threshold and classified Foshan into three different levels of urbanization: developed urban, developing urban, and rural areas (Table 2).
Table 2.
Classification of urbanization level and indicators of digital numbers (DN) from nighttime light data.
2.5. ES Assessment and Mapping
We focused on five critical ES, namely, provisioning services (agricultural production), regulating services (carbon sequestration, water yield, and soil retention), and supporting services (habitat quality). The regulating and supporting services were assessed by InVEST, which is an assemblage model jointly developed by Stanford University, the World Wildlife Fund, and the Nature Conservancy under the auspices of the Natural Capital Project. ArcGIS version 10.2 and the InVEST model were integrated for the assessment. The model was spatially explicit, using maps as information sources and producing maps as outputs. The model can be used to analyze the effect of land use on ES based on given land-use maps and biophysical data for the region [44].
2.5.1. Agricultural Production
Agricultural production was used as an indicator of provisioning services. We defined the agricultural production value (based on the 2018 value of the USD) to include the total production value of agriculture, forestry, animal husbandry, and fisheries. Based on the LULC data and the Statistical Yearbook in Foshan (http://www.foshan.gov.cn/gzjg/stjj/tjsj_1110964/lssj/index.html accessed on 8 May 2021), we included the value of food production on the grid. For different types of total output value, agriculture corresponded to cropland, forestry corresponded to woodland, animal husbandry corresponded to grassland, and fisheries corresponded to water bodies. The formula is as follows:
where Gi is the total output value of food type i for a grid, Ai is the area of land-use type corresponding to food type i under the 300-m grid, Fi is the total output value of food type i in Foshan, and Si is the land-use type area corresponding to food type i.
2.5.2. Carbon Sequestration
Carbon sequestration is an important indicator of the terrestrial carbon cycle and regional regulating services [45] and indicates the transfer of atmospheric CO2 into different carbon pools [46]. As used in the InVEST model, carbon sequestration aggregates the amount of carbon stored in four carbon pools (aboveground biomass, belowground biomass, soil, and dead organic matter) according to the land-use maps and carbon density. The formula is as follows:
where Ct is the total carbon storage (MgC), Cabove is the carbon storage (MgC) in aboveground biomass, Cbelow is the carbon storage (MgC) in belowground biomass, Csoil is the carbon storage (MgC) in soil, and Cdead is the carbon storage (MgC) in dead organic matter. The other carbon density parameters refer to previous studies [29,47,48].
2.5.3. Water Yield
The water yield in the InVEST model was defined as the amount of water runoff from the landscape. The water yield was calculated based on the principle of the Budyko curve and annual average precipitation [49]. The formula is as follows [50]:
where Yxj is the annual water yield (mm) per pixel x of LULC j, AETxj is the annual actual evapotranspiration (mm) per pixel x of LULC j, and Px is the annual average precipitation (mm) per pixel x. These parameters were derived from meteorological observation station data (Table 1).
2.5.4. Soil Retention
The soil retention service was calculated based on the revised universal soil loss equation (RUSLE) [51]. The input data included geomorphology, climate, vegetation cover and management, and support practice. The module considers the interception capabilities of the ground. The formulae are as follows [50]:
where USLEi is the amount of actual soil erosion on pixel i; RKLSi is the amount of potential soil erosion on pixel i; SDi is the amount of soil retention (t) on pixel i; Ri is the rainfall erosivity (M J · mm (ha · h)−1), which is calculated by using the Wischmeier formula [52] based on the average monthly and annual precipitation; Ki is the soil erodibility (t· ha · h (M J · ha · mm)−1), which is calculated by the erosion-productivity impact calculator model [53]; and LSi is the slope length-gradient factor.
2.5.5. Habitat Quality
Habitat quality is defined as a supporting ES that can provide conditions appropriate for individual and population persistence [54]. In this study, we integrated the habitat quality results of the InVEST model with NDVI and PM2.5 data (Table 1) to calculate the habitat quality in Foshan. These data and results were overlaid to get a comprehensive habitat quality map. The InVEST habitat quality model was based on a coarse-filter approach, which combined the information on LULC and threats to biodiversity [50]. These threats were considered as the sources of degradation, especially for human-modified LULC types. The sensitivity of each habitat type to degradation was based on general principles of landscape ecology and conservation biology [55,56]. A habitat quality landscape score was translated into a habitat quality index using a half-saturation function, which is simply the aggregate of all grid cell-level scores. Each LULC type was assigned a habitat quality index, and the formula is as follows [50]:
where Qxj is the habitat quality in grid cell x, that is, in LULC type j; Qxj can never be >1; Hj represents habitat suitability; k is the half-saturation constant and was set as 0.5; and Dxj is the total threat level in grid cell x with LULC type j, and the related parameters refer to previous literature [29]. The formula is as follows [50]:
where R is the number of threats, r is the threat, y indexes all grid cells on r’s raster map, Yr is the set of grid cells on r’s raster map, Wr is the threat weight and indicates the relative destructiveness of a degradation source to all habitats, βx indicates the level of accessibility in grid cell x, where 1 indicates complete accessibility, and Sjr is the sensitivity of habitat type j to threat r, where values closer to 1 indicate greater sensitivity. The effect of threat r that originates in grid cell y, ry, on the habitat in grid cell x is given by irxy, and the related parameters refer to previous literature [29]. The formula is as follows [50]:
where dxy is the linear distance between grid cells x and y, and dr max is the maximum effective distance of threat r’s reach across space. If irxy > 0, then grid cell x is in degradation source ry’s disturbance zone.
Based on historical land-use changes in Foshan, we selected cropland, built-up land, and unused land as degradation sources. The input parameters were determined from the literature [50,57,58]. The required inputs included the LULC map, threat factor layers (cropland, built-up land, and unused land), the accessibility to threats, the weight of the threat factor (Table 3), and the sensitivity of land types to each threat. These historical data refer to previous literature [29] to establish threat source parameters. We assumed that these empirical relationships were constant during long-term land-use changes. Habitat quality scores in the maps should be interpreted as relative scores of 0 to 1, with a perfectly suitable habitat scored as 1 and a non-habitat scored as 0.
Table 3.
Attributes of the threat sources for different LULC type.
2.6. Spatial Response of Ecosystem Services to Rapid Urbanization
We defined a spatial response index to characterize the impact of rapid urbanization on ecosystem services. The spatial response index is to measure the percentage change in ES due to the percentage change in LULC. The formula was based on the land-use dynamic index and elasticity for ES values as follows [6]:
where R is the spatial response index of changes in ES in response to LULC, LCD represents the land change dynamics in a period, ΔLUTi is the converted area of LULC type i, LUTi is the area of LULC type i, ESj2018 represents the total amount of ES type j in 2018, and ESj2000 represents the total amount of ES type j in 2000.
For the threshold identification and mapping of the spatial response index, we first normalized the results of all ES to compare the spatio-temporal heterogeneity of effects across ES. Second, we reclassified and recoded the value of each ES based on the natural breaking point of the data. For example, the corresponding codes for high, medium, and low carbon storage were 1, 2, and 3, respectively. The codes corresponding to the high, middle, and low values of agricultural production were 10, 20, and 30, respectively. The codes corresponding to the high, middle, and low values of habitat quality were 1000, 2000, and 3000, respectively. Third, we assumed that the weight of each ES was the same and spatially superimposed the results. Then, we reclassified the coded results again to obtain the total ES. Finally, to determine the threshold of spatial continuity, we converted the results into point data and performed a spatial kriging interpolation. The value of the spatial responsive index was derived from the results of spatially interpolated total ES, ranging from 1 to 3 (a higher value reflects greater spatial responsiveness on the grid).
2.7. Sensitivity Analysis
We used the Morris method [59] to test the sensitivity of the InVEST model to the variations in precipitation, actual evapotranspiration, volumetric plant available water content, vegetation rooting depth, rainfall erosivity, soil erodibility, attributes of threat sources, habitat suitability, and sensitivity. When other parameters remained unchanged, an original value of ± 10% was taken to disturb a certain parameter. Then, the changed parameters were input into the InVEST model and the results were compared. Sensitivity to agricultural production and carbon sequestration were based on empirical formulas with a fixed proportion. The model was run independently for each of these variations.
3. Results
3.1. Urbanization Levels and LULC in Foshan
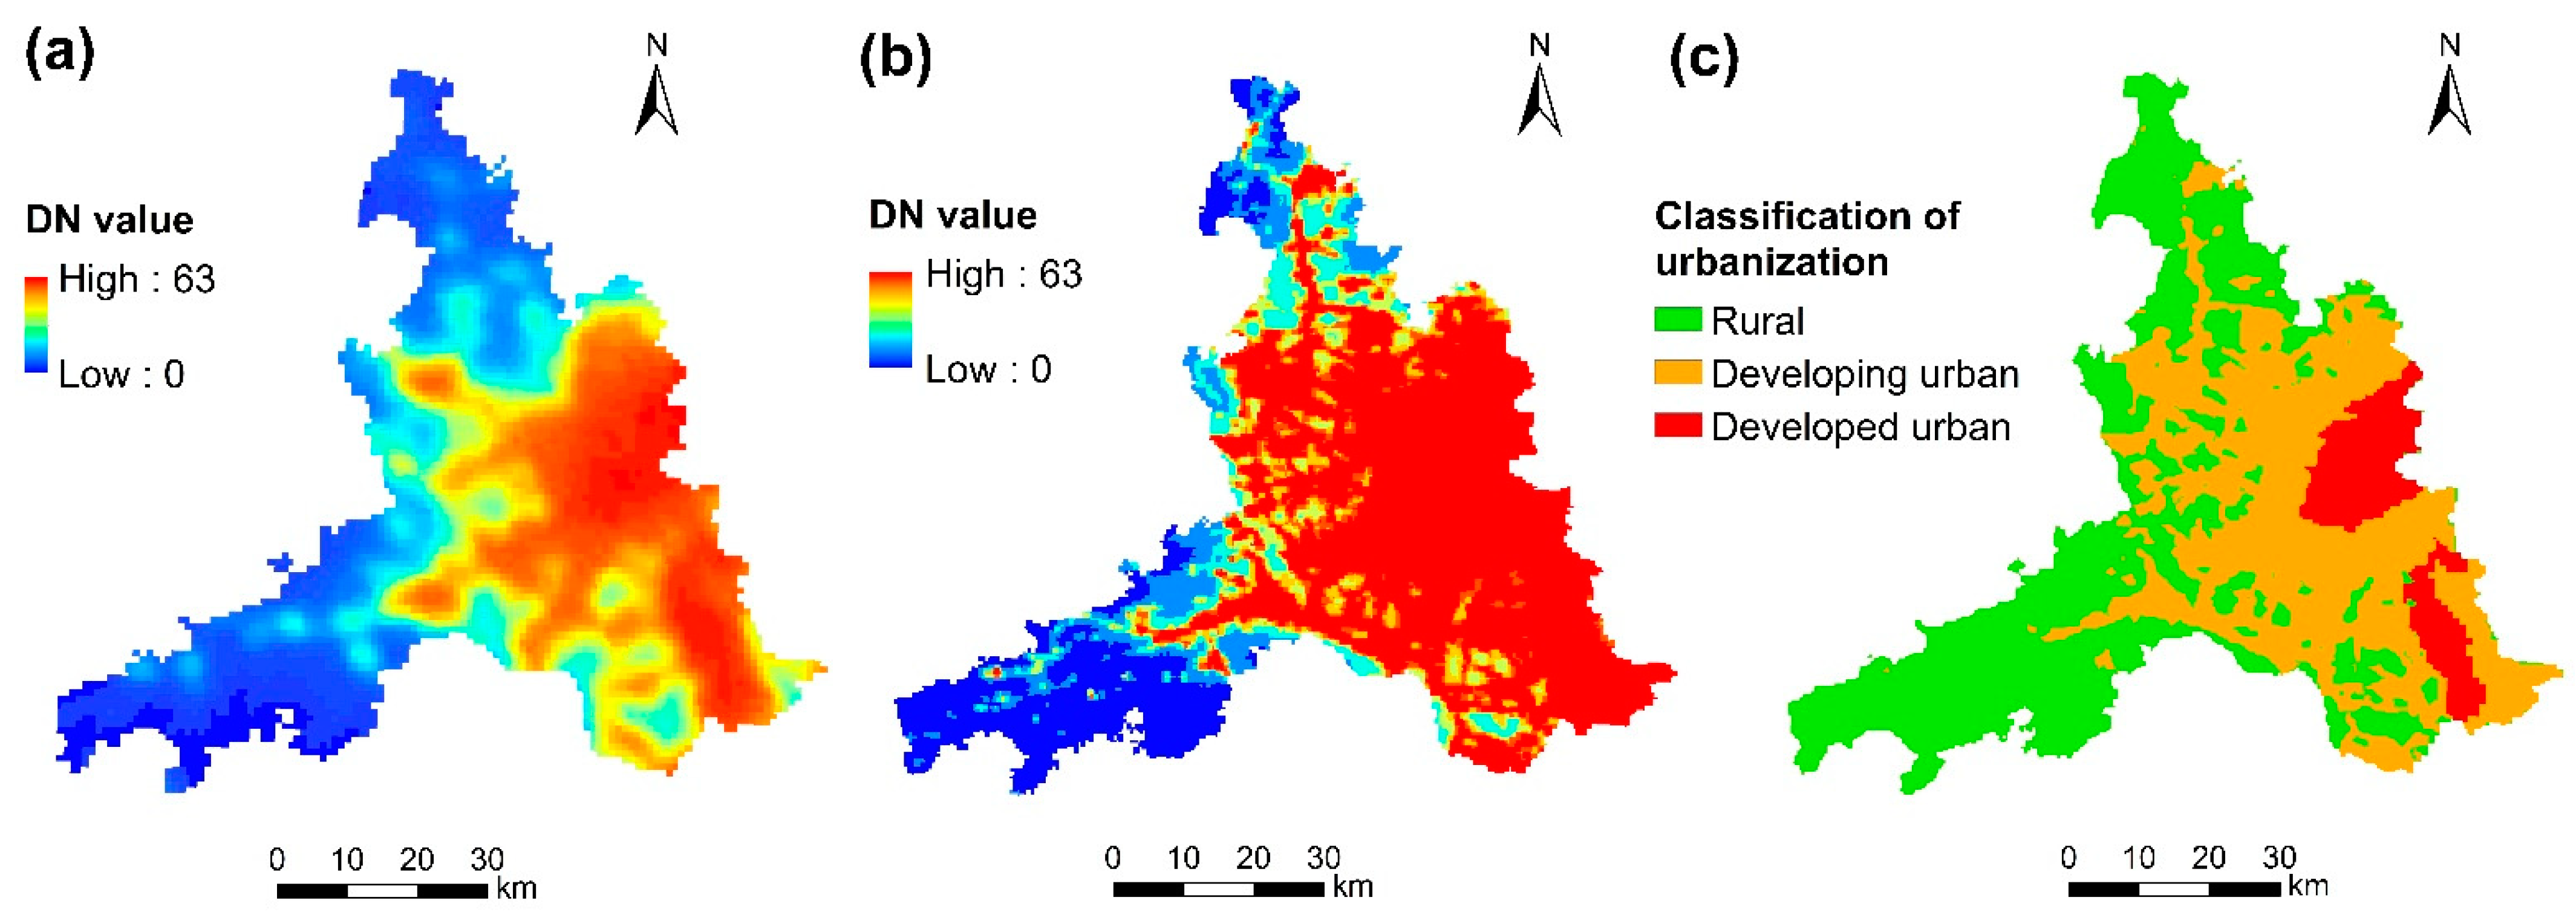
The different urbanization levels in Foshan are shown in Figure 5. The average DN value in Foshan was 31.56 in 2000 and 45.91 in 2018. The higher DN was mainly distributed in eastern Foshan in 2000, progressively extending to the central area in 2018. The mean DN value for developed urban areas (62.99) was greater than that for developing urban areas (62.71) and rural areas (28.02) in 2018. The growth rate of the mean DN value in developing urban areas was 42.04% during 2000–2018. However, the developed urban areas were only responsible for approximately 2.25% of the growth rate. The developed, developing, and rural areas were 339.89, 1596.61, and 1734.60 km2, respectively.

Figure 5.
Classification of urbanization level based on digital numbers (DN) in Foshan from 2000 to 2018: (a) DN value in 2000, (b) calibrated DN value in 2018, and (c) classification of urbanization in Foshan.
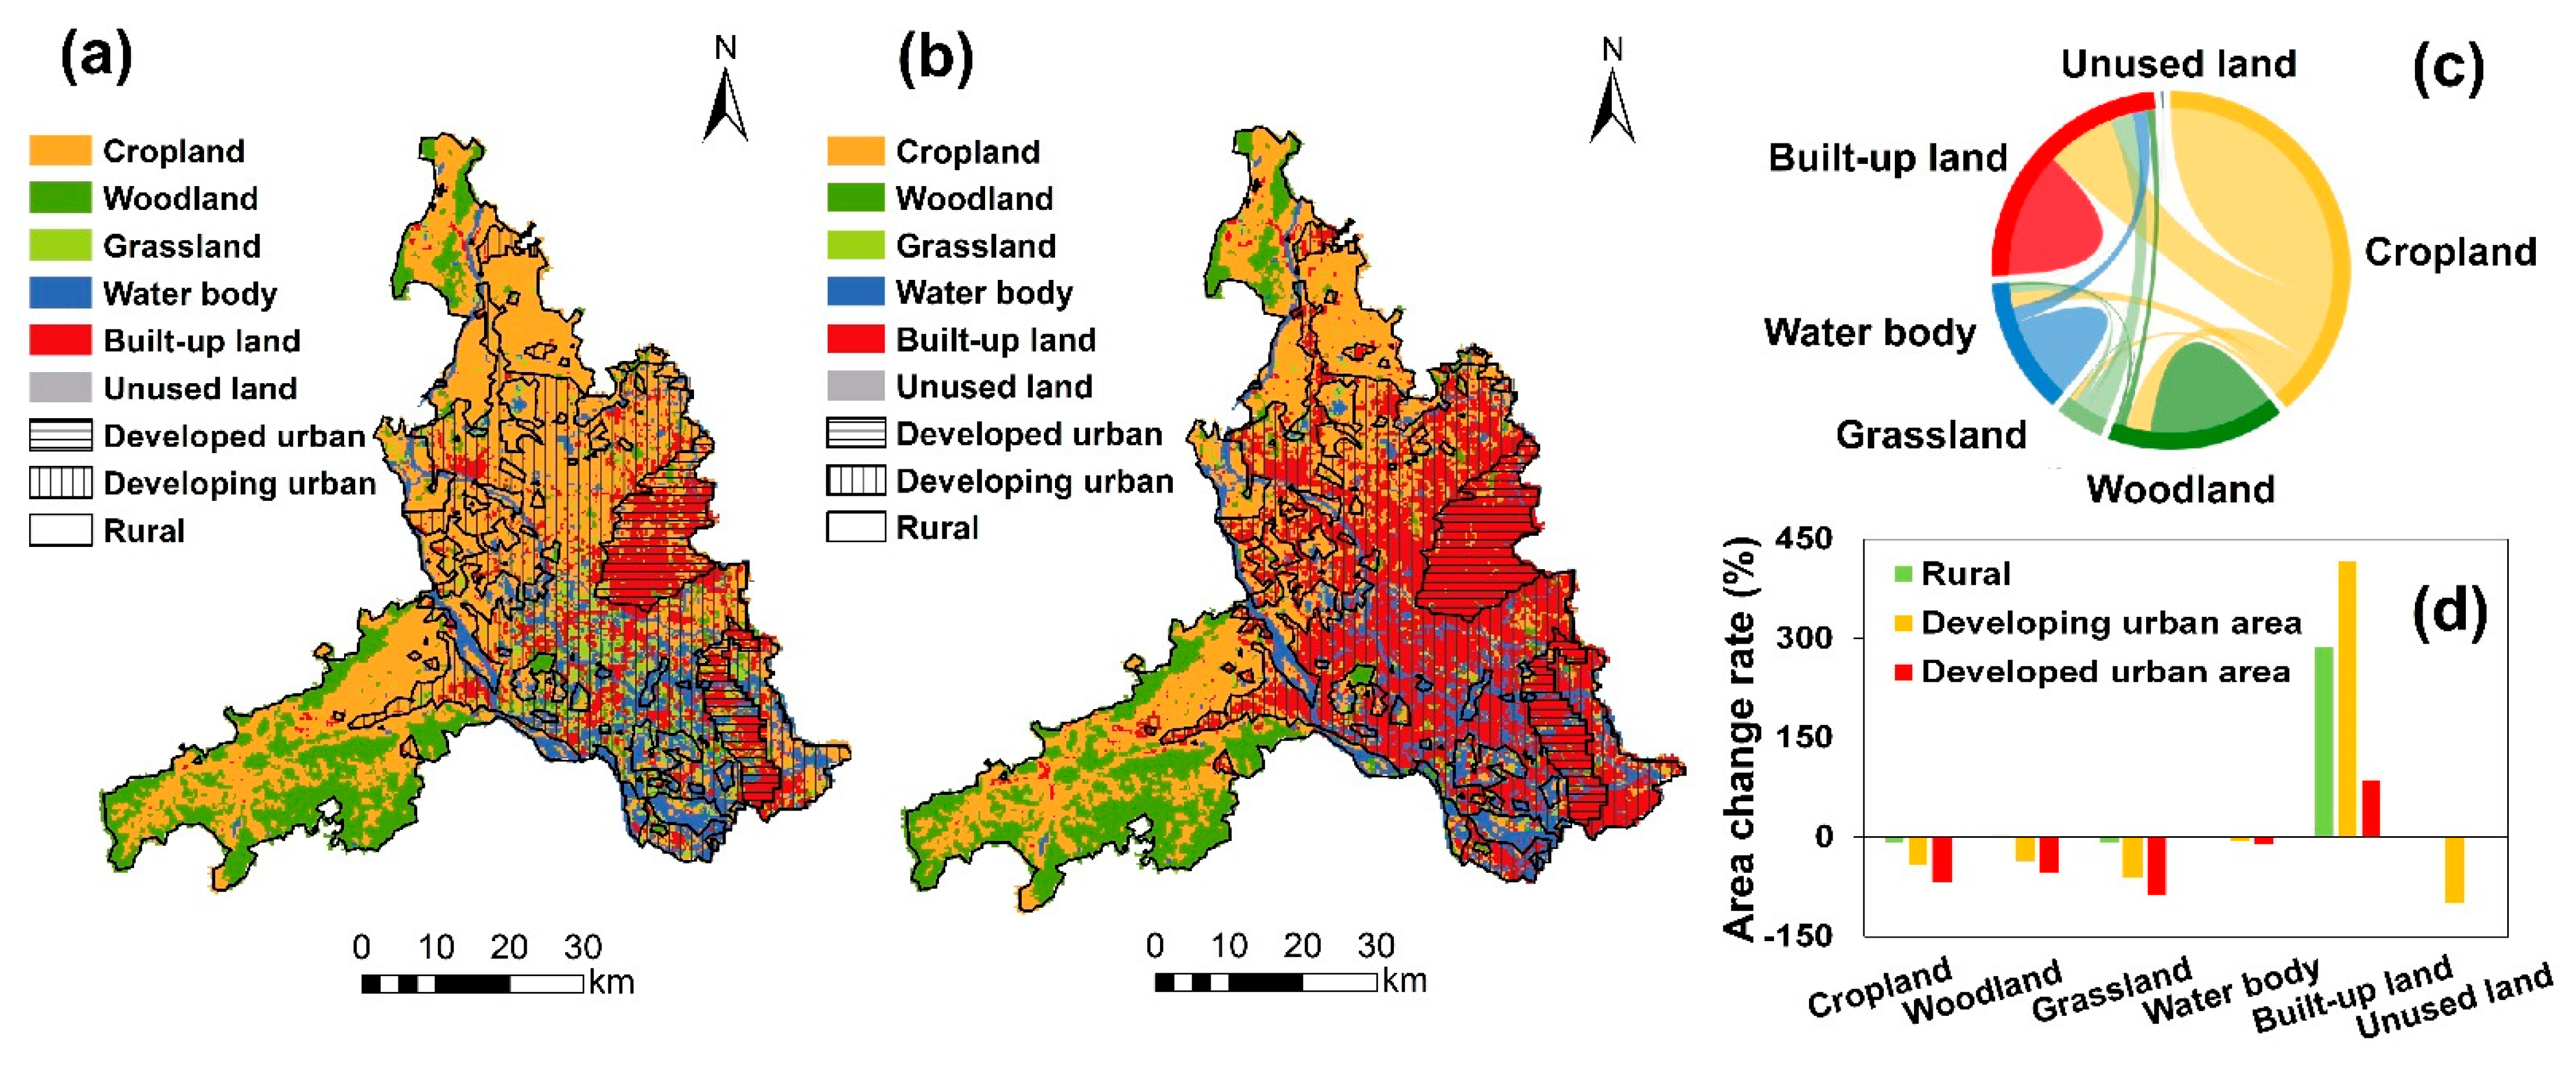
Cropland comprised the largest area in Foshan in 2000, accounting for 48.43% of the total area. In 2018, built-up land was the largest area, accounting for 35.99% of Foshan (Figure 6). Urbanized land increased in area, whereas all other land-use types decreased in area. Regarding the transformation of land-use types, cropland and grassland decreased the most. The area of cropland, woodland, grassland, and water bodies that were transformed to built-up land was 523.53, 56.52, 175.14, and 93.33 km2, respectively. For different urbanization levels, cropland decreased by 66.97%, woodland by 53.34%, and grassland by 87.75%, and built-up land increased by 86.26% in the developed urban area. The developing urban area had the largest increase in built-up land, by 415.77%. Such a rapid expansion in built-up land was also observed in rural areas, with a 286.08% increase.
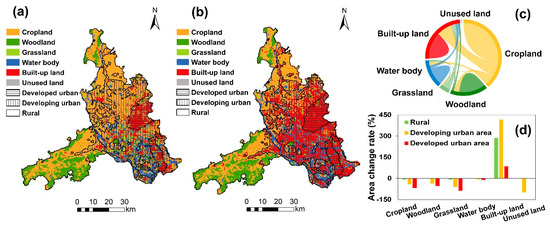
Figure 6.
Land use and land cover change (LULC) in Foshan from 2000 to 2018. (a) LULC map in Foshan in 2000.(b) LULC map in Foshan in 2018. (c) The data of the chord diagram comes from the transfer matrix of land use from 2000 to 2018. The area of the strip represents how much one type of land is transferred to another. (d) The rate of change of the area of each LULC under different urbanization levels.
3.2. Spatio-Temporal Heterogeneity of Effects across ES
3.2.1. Agricultural Production
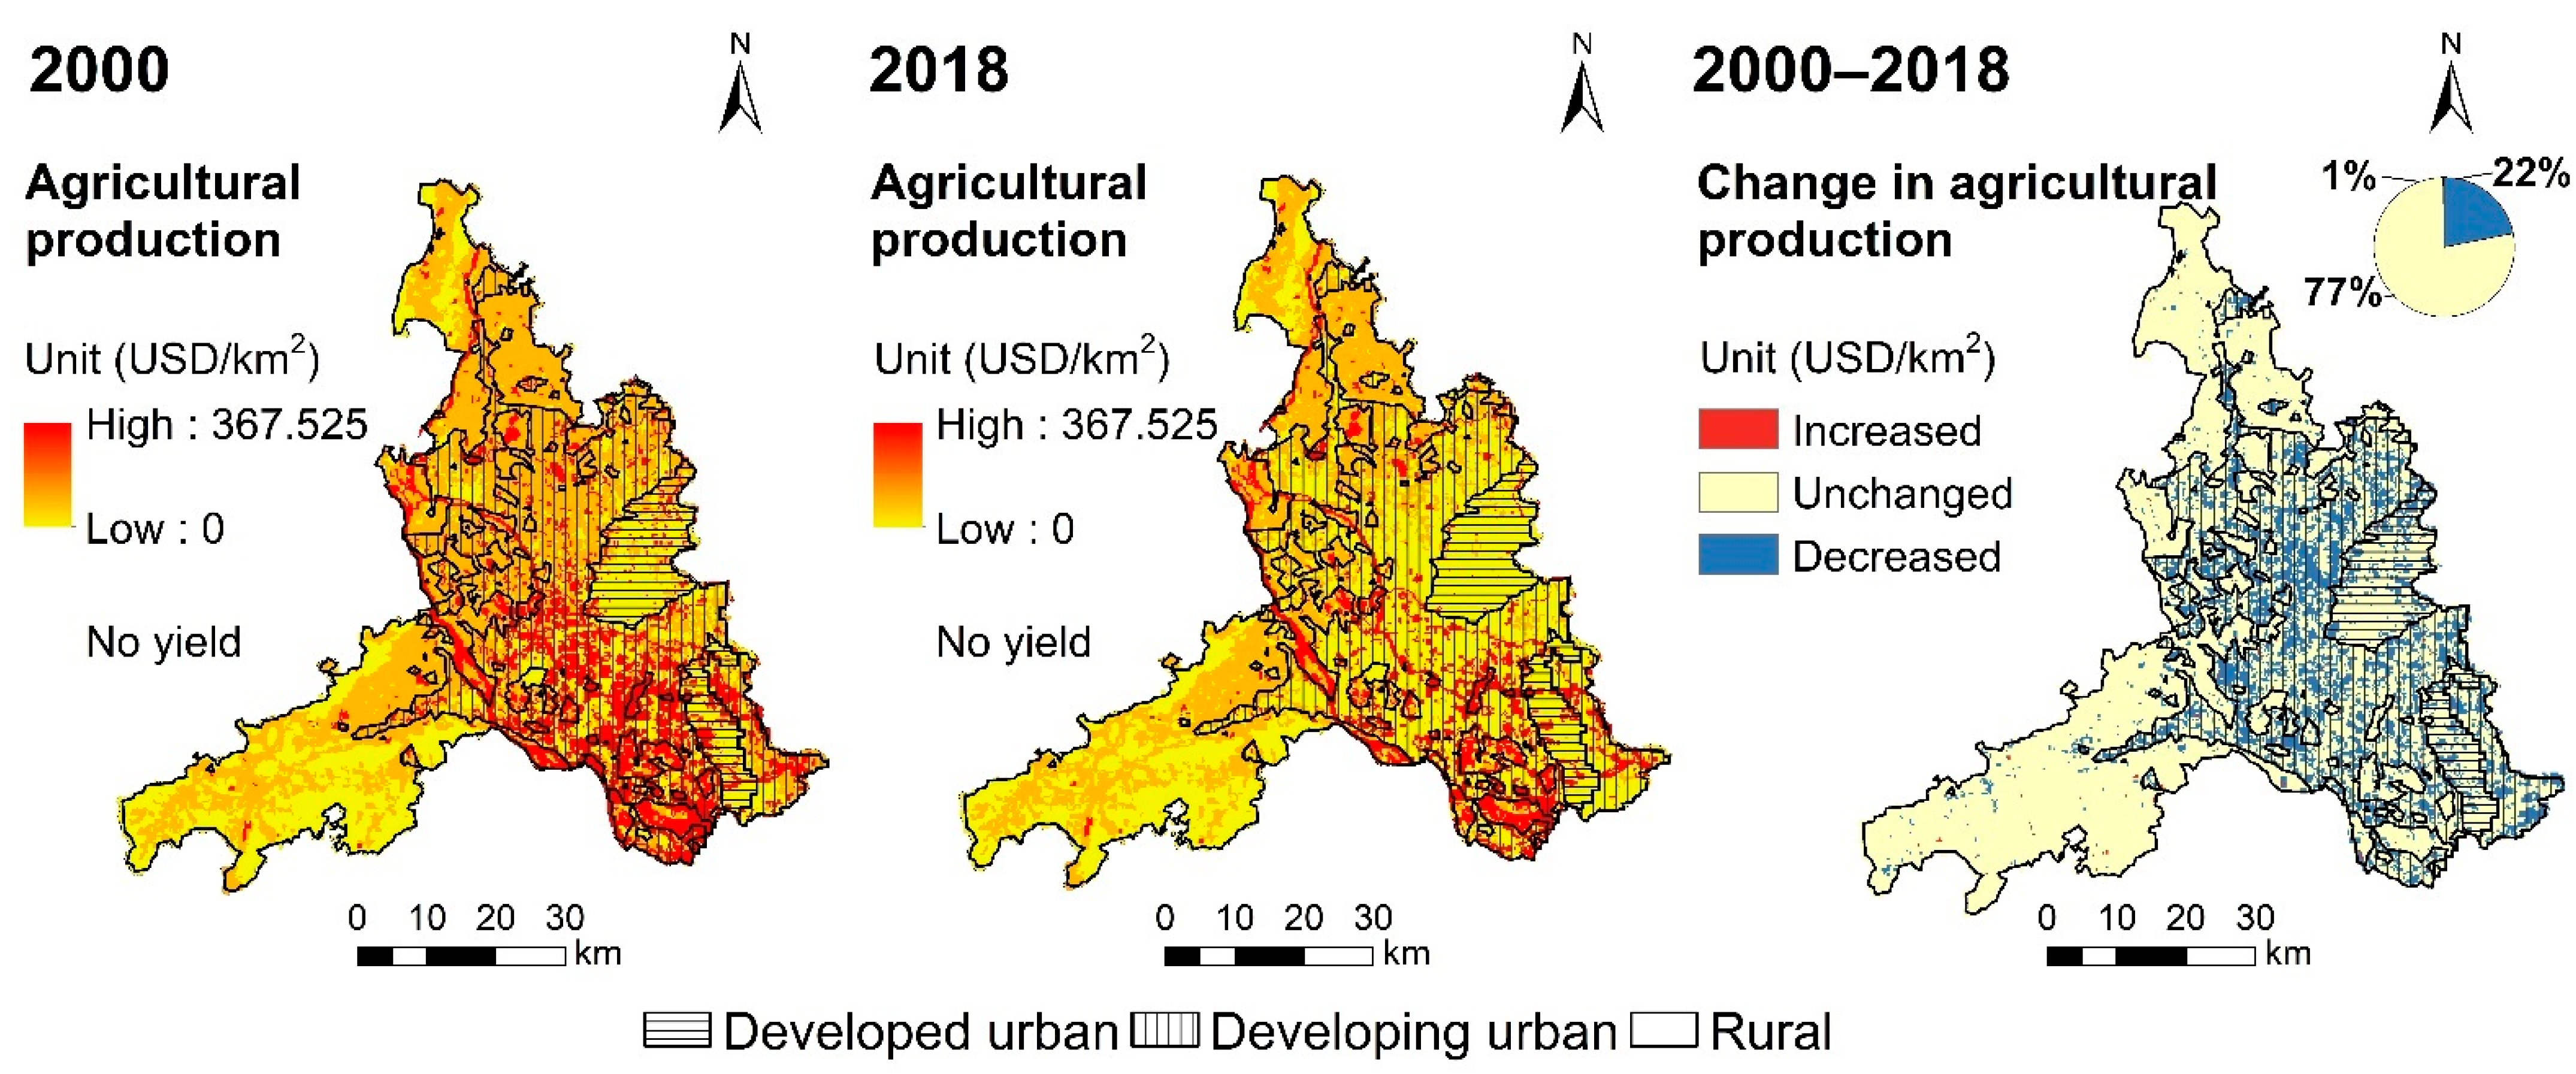
The changes in agricultural production services in Foshan from 2000 to 2018 are shown in Figure 7. The results show that the overall capacity of provisioning services dropped during this period. Areas with higher agricultural production were mainly distributed along the rivers and north-central rural areas. The gross output of agricultural production decreased by 1.20 million USD (based on the 2018 value of the USD) during this period (Table 4). The decline in agricultural production was mainly concentrated in developing urban areas, reduced by 963.1 × 10³ USD. However, the area with the largest relative decrease in agricultural production was located in developed urban areas, a decrease of 77%. The developed urban and rural areas reduced by 136.7 × 10³ and 103.0 × 10³ USD, respectively.

Figure 7.
Spatial patterns of agricultural production in Foshan from 2000 to 2018.
Table 4.
Changes in ecosystem services in areas with different urbanization levels in Foshan from 2000 to 2018.
3.2.2. Carbon Sequestration
The changes in carbon sequestration in Foshan from 2000 to 2018 are shown in Figure 8. The changes in carbon sequestration were concentrated in developing urban areas. The areas of high carbon sequestration were mainly distributed in the southwestern area covered with woodland. Carbon sequestration increased by 84.7 × 10³ MgC during 2000–2018 (Table 4). The rural areas had the highest carbon sequestration (17,850.6 × 103 MgC in 2000; 17,860.9 × 103 MgC in 2018). Regarding the overall rate of change in carbon sequestration, the developing and rural areas increased by 0.55% and 0.06%, respectively. In the developed area, the carbon sequestration decreased by 0.16%. The area where carbon sequestration had not changed accounted for 65% of the total area. The area with increased carbon sequestration was mainly in the developing and northern developed areas, accounting for 22% of the total area. The area with decreased sequestration was in the southern developed urban area, accounting for 13% of the total area.
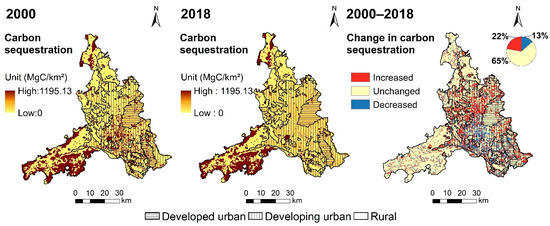
Figure 8.
Spatial patterns of carbon sequestration in Foshan from 2000 to 2018.
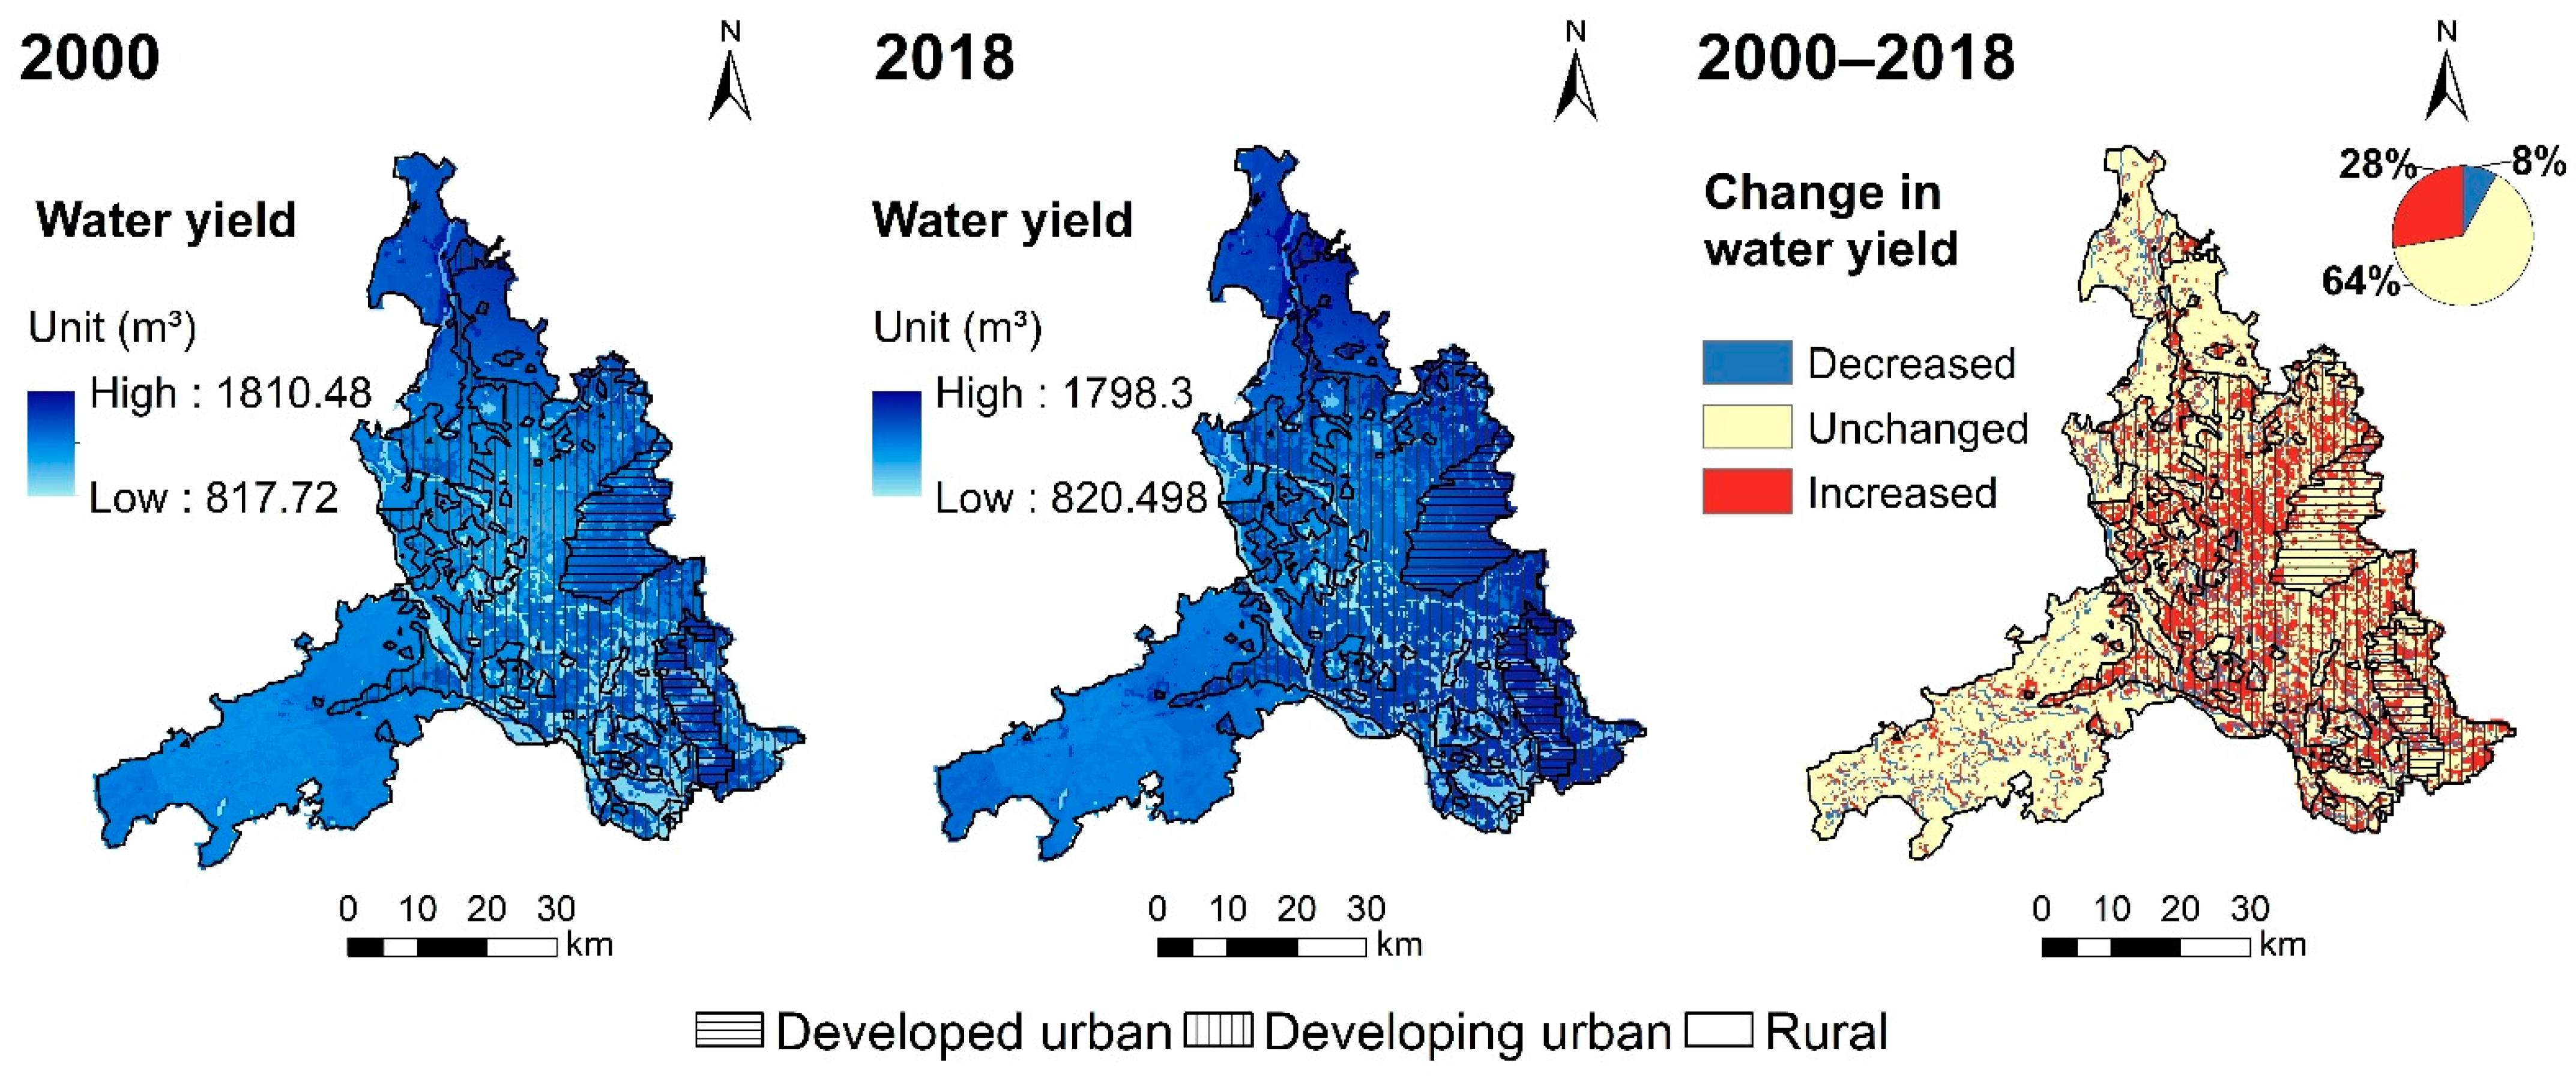
3.2.3. Water Yield
The changes in water yield in Foshan from 2000 to 2018 are shown in Figure 9. The results show that water yield increased in developed and developing urban areas. Higher values for water yield were observed in the eastern developed urban area. The water yield increased by 1504.7 × 103 m3 in Foshan from 2000 to 2018 (Table 4). In 2000, the developed, developing, and rural areas showed water yields of 556.51 × 10⁴ m3, 2408.49 × 104 m3, and 2621.68 × 104 m3, respectively. In 2018, the total water yield in the developed and developing urban areas increased by 4.96% and 3.04%, respectively. The changes in water yield showed that the area with increased yield accounted for 28% of the total area.

Figure 9.
Spatial patterns of water yield in Foshan from 2000 to 2018.
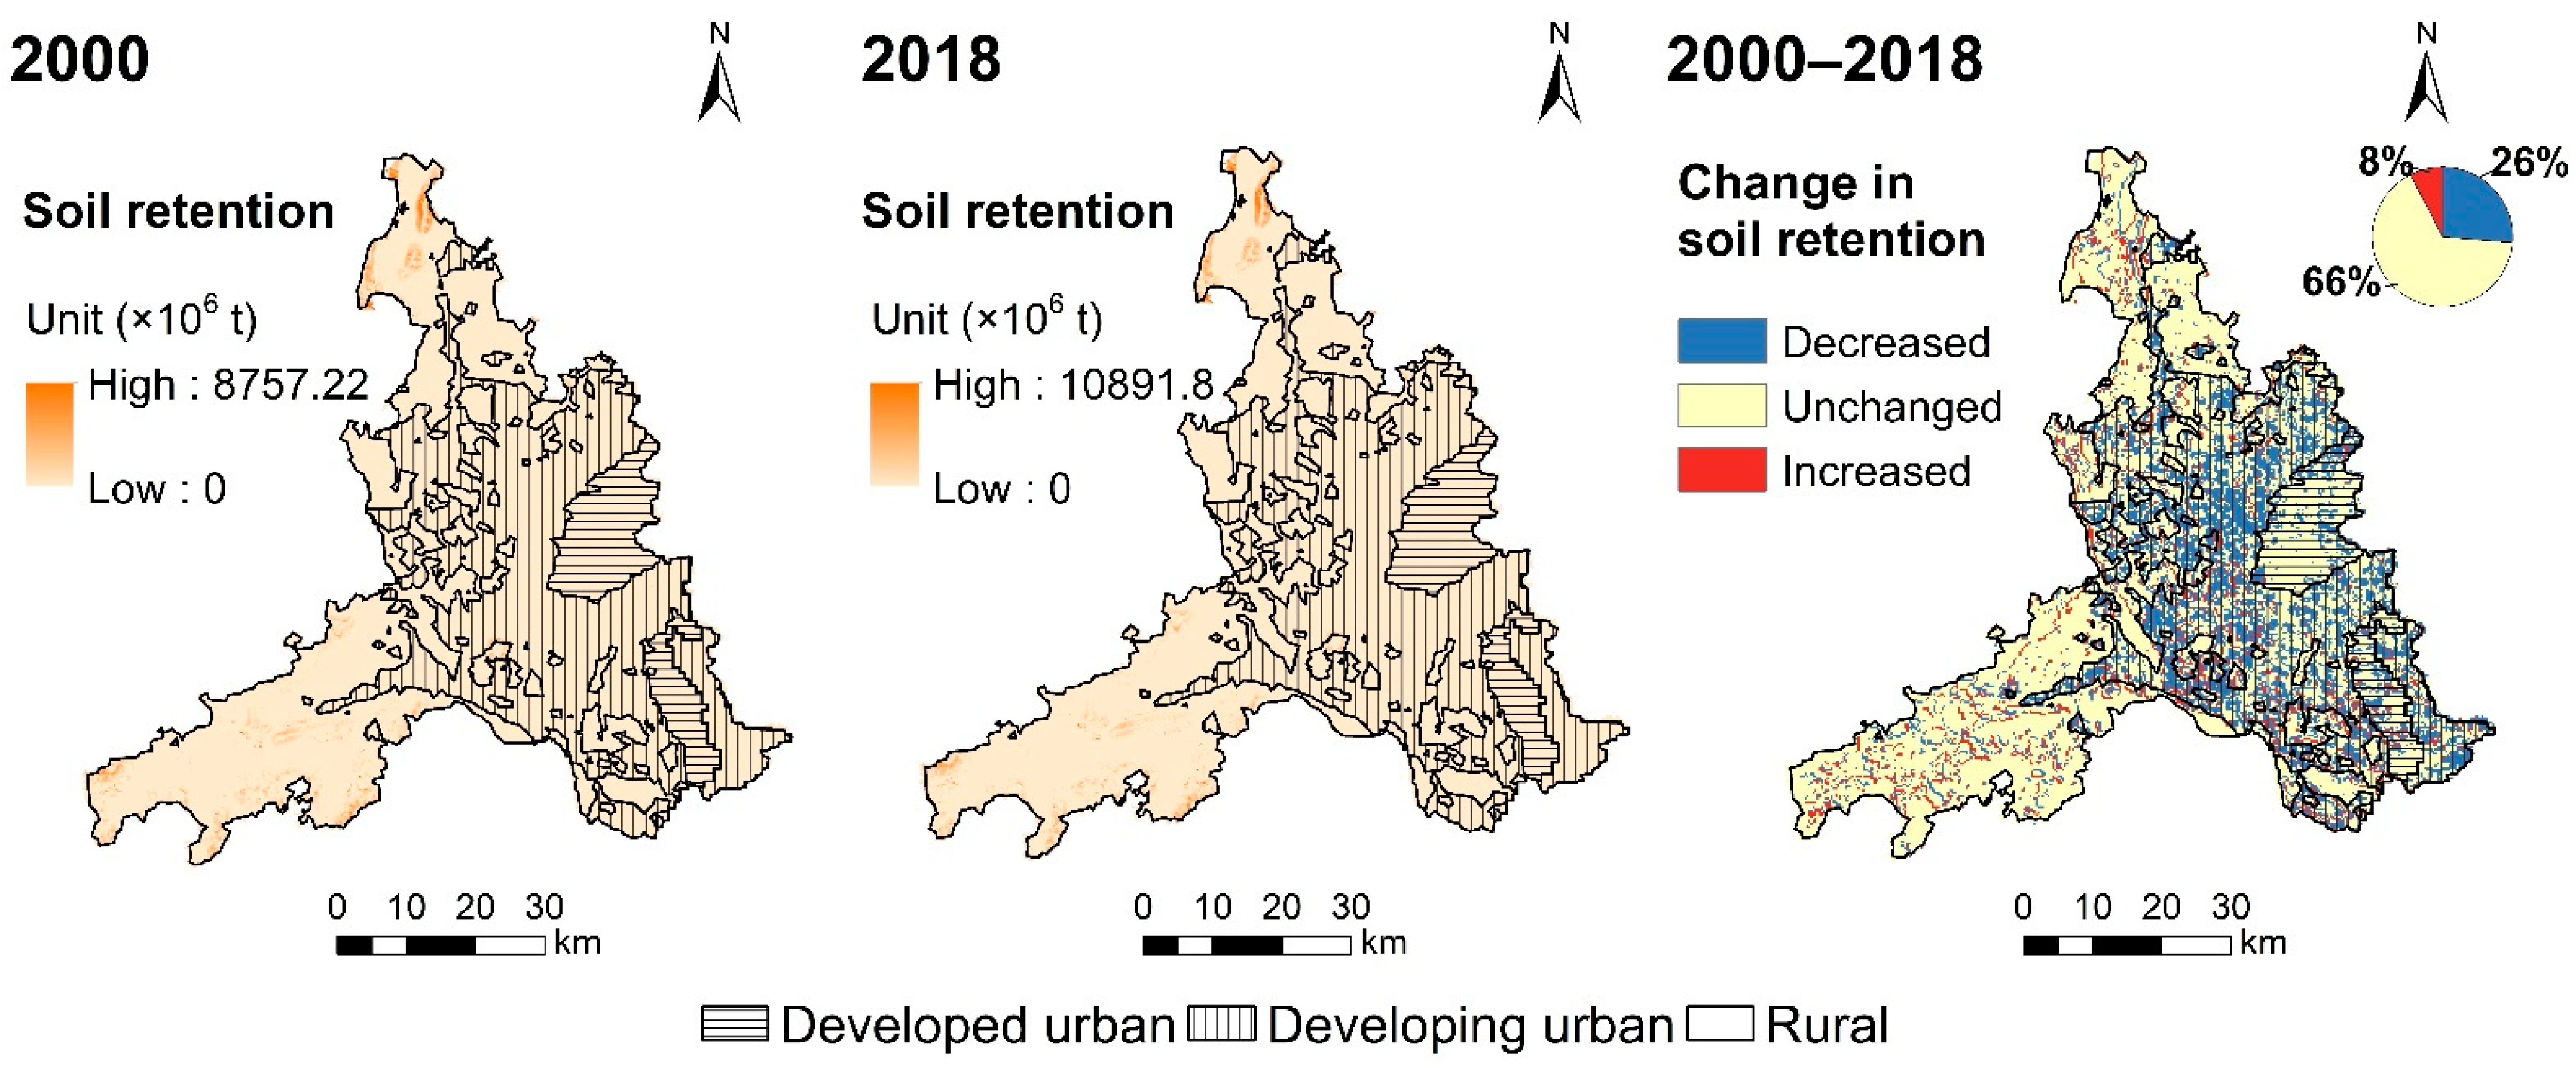
3.2.4. Soil Retention
The changes in soil retention in Foshan from 2000 to 2018 are shown in Figure 10. The results show a small change (0.15% decrease) in soil retention for the study area from 2000 to 2018 (Table 4). The decreased area was mainly distributed in developed and developing urban areas. Areas with higher values of soil retention were toward the southwest of the rural areas. The total amount of soil retention in Foshan was 139.07 × 10⁴ t in 2000 and 138.86 × 10⁴ t in 2018. The rural areas accounted for the largest share of soil retention. The developed and developing urban areas showed a 4.01% and 3.64% decrease in soil retention, respectively. Areas with decreased soil retention accounted for 26% of the total area.
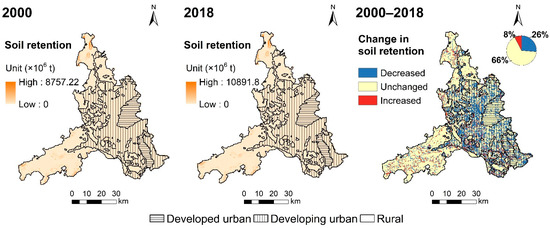
Figure 10.
Spatial patterns of soil retention in Foshan from 2000 to 2018.
3.2.5. Habitat Quality
The changes in the habitat quality index in Foshan from 2000 to 2018 are shown in Figure 11. The results show a trend of degraded habitat quality, especially in developing and developed urban areas. Areas with higher habitat quality indices were mainly found in the southwest of the study area. The lower value areas were distributed to the east, gradually expanding to the northwest during the study period. The habitat quality index apparently declined by 17.79% in developed urban areas and 21.63% in developing urban areas. However, the habitat quality in rural areas increased by 0.14% (Table 4). Areas with decreased habitat quality accounted for 48% of the total area.
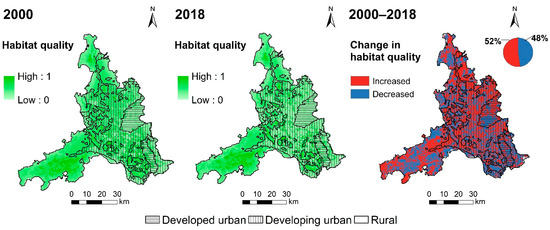
Figure 11.
Spatial patterns of habitat quality in Foshan from 2000 to 2018.
3.3. Spatial Response of ES Change with Respect to LULC
In Foshan, the spatial response of agricultural production (16.23%) was higher than that of other ES, followed by soil retention (5.75%), habitat quality (3.47%), water yield (2.38%), and carbon sequestration (0.05%).
In areas with different urbanization levels, the spatial response index differed for different ES (Figure 12). The sum of spatial response for the total ES in rural, developing, and developed areas was 14.15%, 22.50%, and 33.44%, respectively. The spatial response index of agricultural production was 4.05% in rural areas, 13.21% in developing urban areas, and 20.53% in developed urban areas. The spatial response of carbon sequestration in developing areas was higher than that in developed and rural areas. The spatial response of water yield changes was 4.24% in rural areas, 2.95% in developing urban areas, and 2.16% in developed urban areas. The highest soil retention spatial response was observed in rural areas (6.02%). The spatial response index of habitat quality was 0.09% in rural areas, 4.50% in developing urban areas, and 4.69% in developed urban areas.
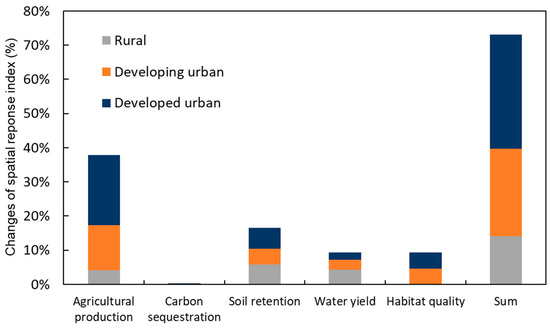
Figure 12.
Change in the spatial response index of ecosystem services (ES) with respect to land use and land cover change (LULC) in Foshan under different levels of urbanization from 2000 to 2018.
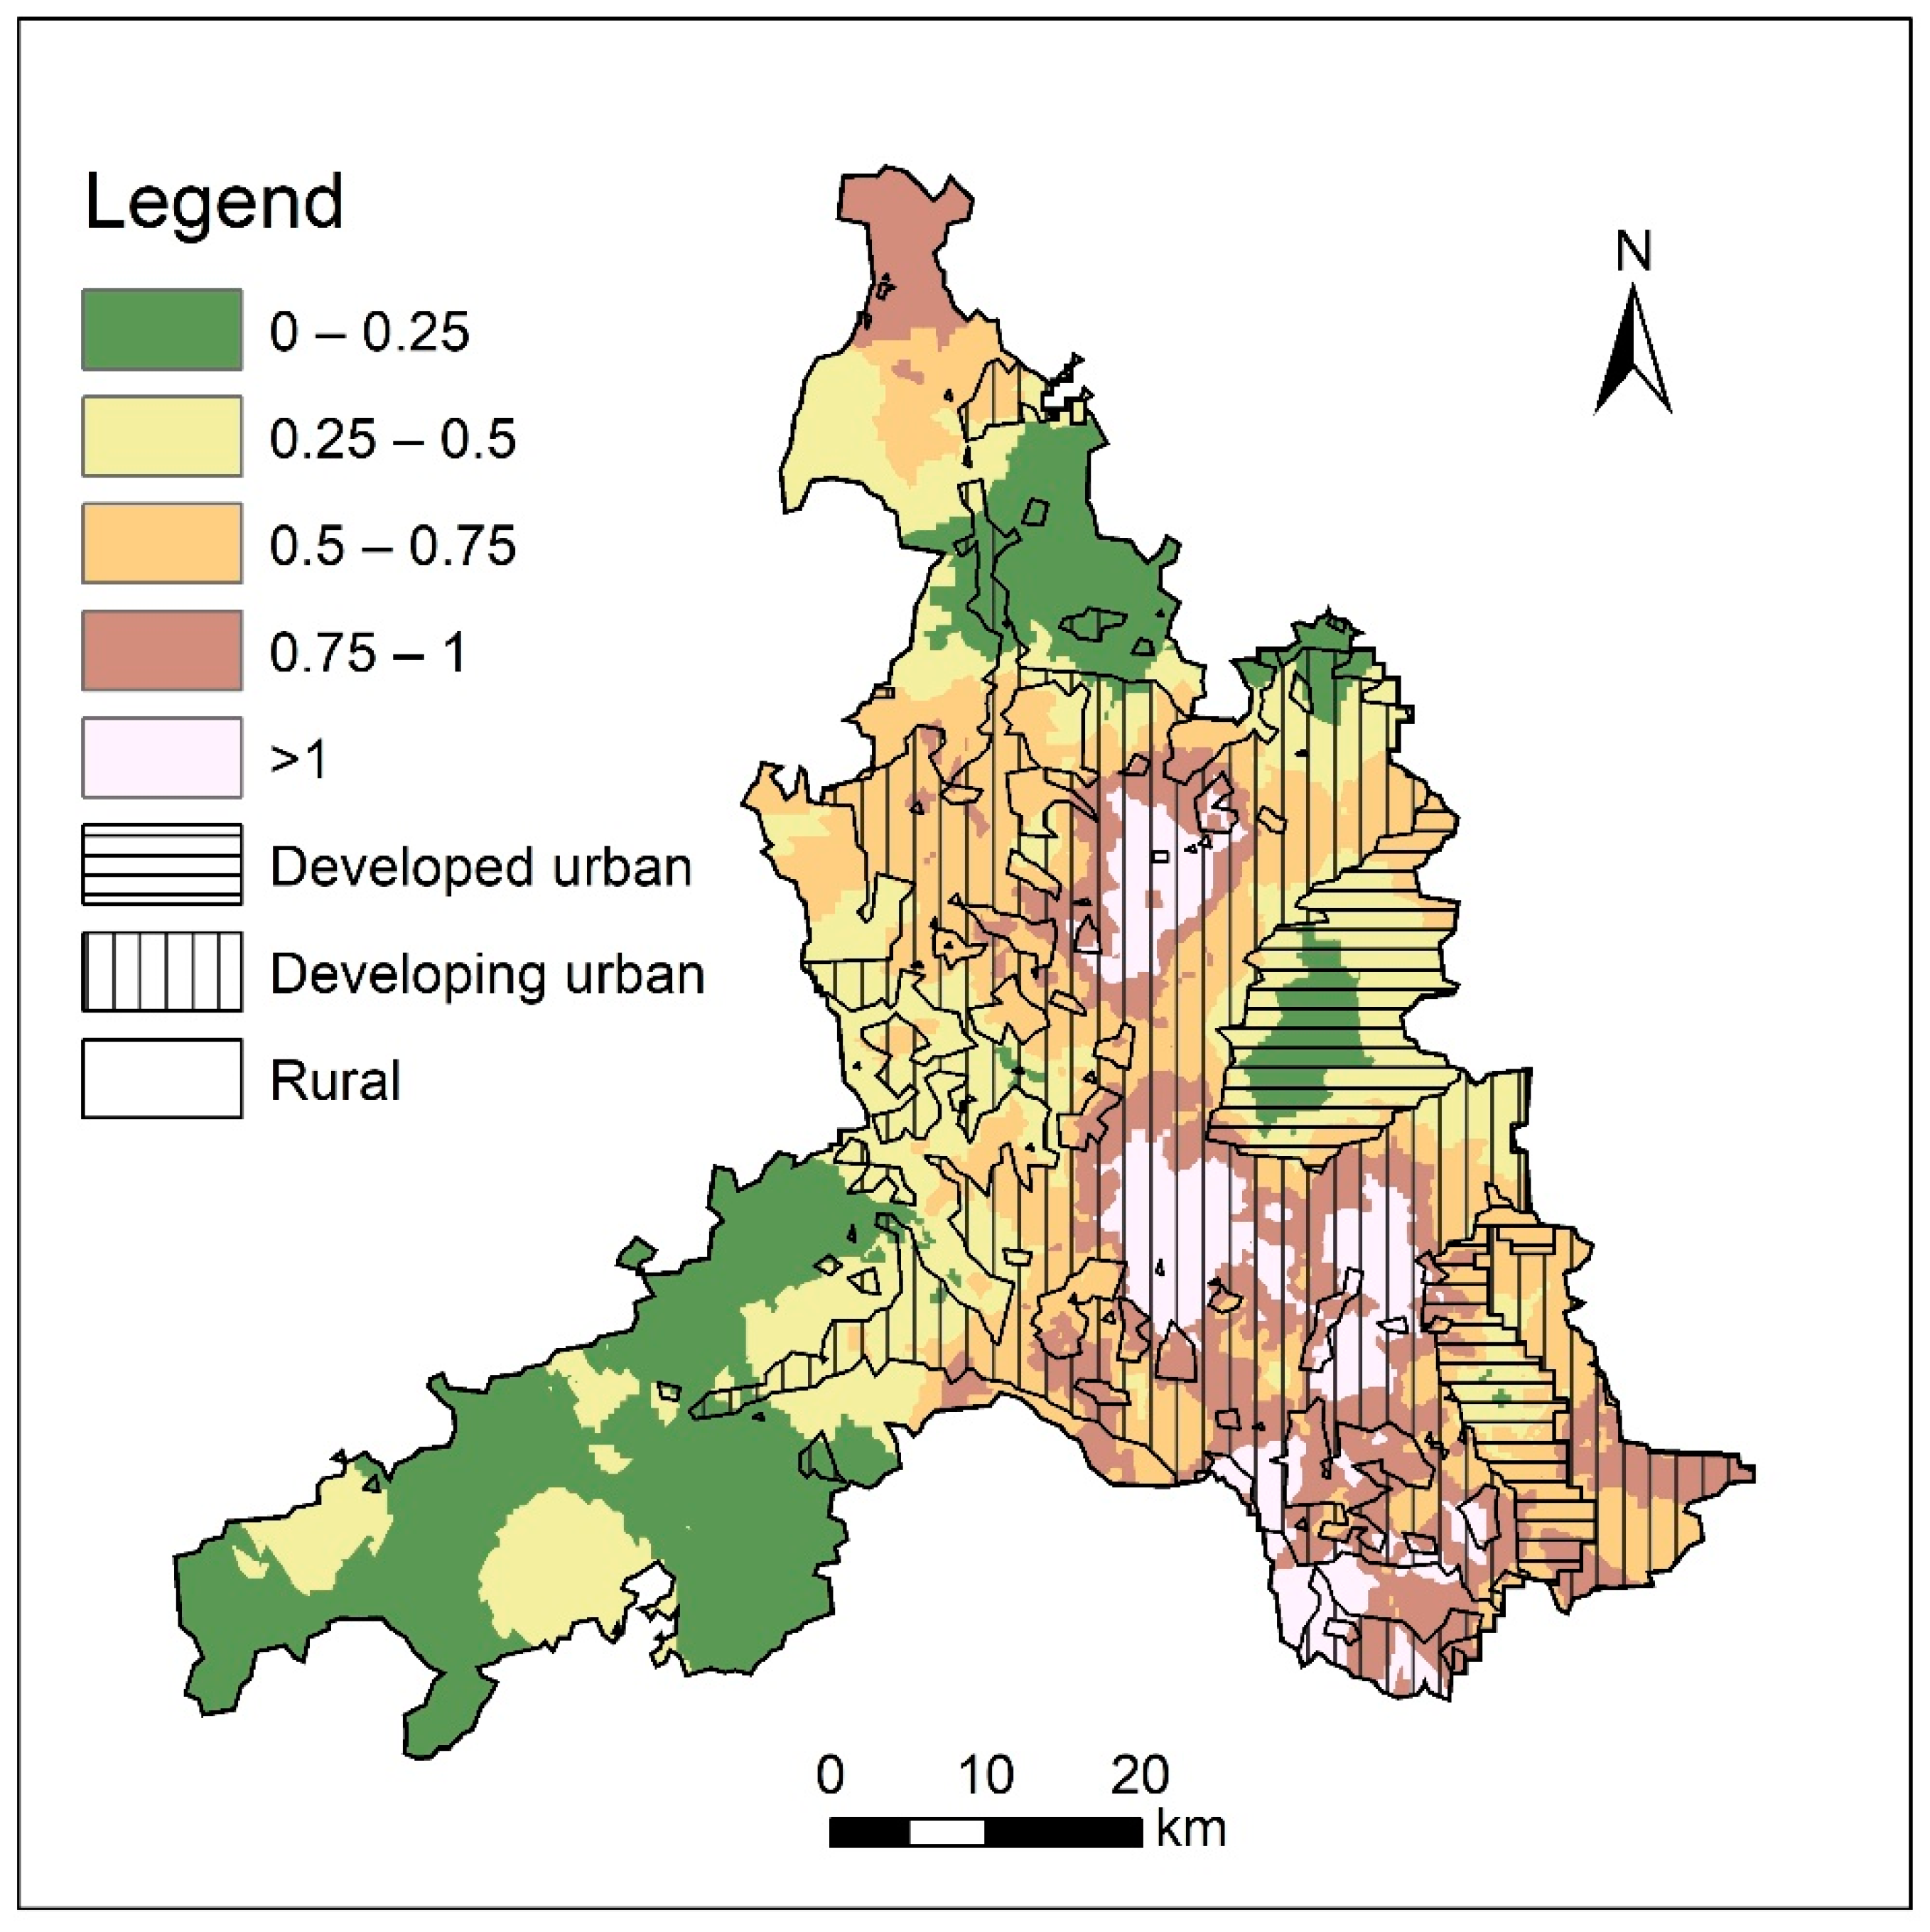
The spatial distribution of spatial response index derived from the total ES with respect to LULC is shown in Figure 13. The areas with higher values were more consistent with the distribution of water bodies. Four high-value accumulated areas were mainly distributed in the developing urban area. The spatial response index of the rural areas was lower. The average spatial response index in rural, developing, and developed urban areas was 0.39, 0.71, and 0.45, respectively.

Figure 13.
Spatial distribution and zoning of spatial response index.
4. Discussion
4.1. Influence of Urbanization on ES in Foshan
Our results showed that rapid urbanization and expansion of built-up land have led to a significant reduction in agricultural production. This reduction in provisioning services was also found in another study that focused on the changes in ES in Foshan [60]. The main reason for the decrease in agricultural production was a severe labor shortage in rural communities [3]. Many people have migrated to urban areas to engage in industrial and commercial activities in search of higher wages. Labor shortages and industrialization have hastened the considerable changes in traditional agricultural practices. This is a common problem in the Pearl River Delta region; decreases in agricultural production have also occurred in other cities in this region [61,62,63].
Interestingly, our results showed an increase in carbon sequestration, which may conflict with other published work [44]. This is because built-up land generally includes a certain proportion of artificial urban greening, which could have a higher carbon density than a semi-artificial cropland ecosystem [29,64]. In addition, a decrease in agricultural production indicates that the region needed to import resources from other regions, generating higher transport costs and transport-related emissions. This feedback of carbon emissions also brings more challenges to carbon sequestration.
The decrease in habitat quality was mainly due to the increase in built-up land and human activities. We treated the human-modified land types (e.g., cropland, built-up land, and unused land) as the sources of degradation. The concentration of population (based on nighttime light data) and the increase in built-up land (based on habitat accessibility and sensitivity) have reduced the habitat quality, especially in developed and developing urban areas. In addition, the increase in these threat sources could cause edge effects, with potential changes in the biological and physical conditions that occur at patch boundaries and within adjacent patches [65]. The decrease in habitat quality has also been reported by other studies. For example, Xiao et al. [66] proposed an ecological environment quality index based on non-construction land, and they also observed a loss of biodiversity conservation value in Foshan. Habitat loss has also been observed in surrounding cities with similar urbanization processes, such as Guangzhou [67], Shenzhen [68], and Dongguan [69].
The water yield increased slightly because several considerable measures have been undertaken to repair and restore abandoned fishponds and to build new fishponds, particularly since 2000 [67]. The increase in water yield under urbanization is consistent with that reported by other studies [70,71]. However, some studies reported that urbanization would lead to reduced water yield [72,73]. This conflict with our findings may be due to precipitation differences and reservoir rivers that may be affected by urbanization. The increase in impermeable pavements in urban built-up land may also contribute to evapotranspiration and surface runoff [74]. However, despite a slight increase in water yield, impermeable pavements are harmful to underground water sources, preventing aquifer recharge. Lowering the underground water table by preventing recharge may result in serious water shortages and disasters.
In terms of spatial variation, our results showed that the changes in ES were mainly concentrated in developed and developing urban areas. These results provide answers to our second research problem regarding the areas that had the greatest changes in ES under different urbanization levels. First, there was a reduction in agricultural production across Foshan. The developed and developing urban areas had a higher rate of change in agricultural production than rural areas (−77.98% and −66.33%, respectively) (Table 4). The main reason for this result was the rapid development of real estate and the remarkable changes that have taken place in farmers’ housing and lifestyle, especially in the Sanshui District. Second, the decrease in the habitat quality index (−21.63%) was mainly distributed in developing urban areas. This is due to the large increase in industrial land and population, leading to an increase in threat sources’ peri-urban area. In addition, the variation in other ES was also concentrated in developed and developing urban areas, such as north of Nanhai District. Industrial development and agglomeration, such as from metal industries, furniture manufacturing, and auto manufacturing, are important drivers of changes to land use and ES in this region. The spatial heterogeneity of ES also highlighted the changes in urban–rural inequality [75].
Based on the statistics, the unprecedented rate of urbanization from 75.06% to 95.00% from 2000 to 2018 has had a considerable effect on Foshan. Nighttime light data confirmed the process of expanding urbanization in Foshan. As the second-most urbanized city in China, Foshan is making great efforts to achieve China’s National New-type Urbanization Plan targets [4]. The plan covers almost every conceivable aspect of urbanization, such as sustainable development, institutional arrangements, and implementation. It sets key indicators, some with numerical goals, for urbanization level, public services, infrastructure, and resources and environment, as per the guiding principle emphasizing a sustainable and people-centered approach. Although Foshan’s indicators of urbanization have far exceeded national targets, our results show that rapid urbanization has an inevitable effect on the natural environment and ES, and these changes will feed back into the social system and become a key constraint of economic development [76,77].
4.2. Implications for Urbanization Development and Sustainable Planning
With the implementation of the development plan for the Guangdong–Hong Kong–Macao Greater Bay Area as part of the national strategy in 2019, Foshan plays an important role in the development of advanced manufacturing. To consider the ecological effects of urbanization, the local government will implement innovative solutions that balance economic growth and sustainable development [67]. Several sustainable measures and plans have been implemented in recent years, including “High-quality forest city construction planning in Foshan”, “Natural ecological civilization construction planning”, and the ecological restoration project for rivers in Foshan.
Our results have implications for urban development and sustainable planning. We believe that sustainable planning should consider the living environment of human settlements and the effects of the ecological environment. First, our results showed that rapid urbanization greatly affects ES in Foshan. Agricultural provisioning service transitions directly affect resource consumption in the city and are related to regional food provisioning security [1,78]. We recommend that urban development should not encroach on cropland and that priority should be given to increasing the intensive use of built-up areas. Our results showed that decreases in habitat quality are mainly distributed in developed urban areas. The threat sources have increased and intensified, altering habitat accessibility and sensitivity [67]. Thus, it is necessary to plan and construct urban ecological corridors, such as channel and urban green space connections, to improve landscape connectivity.
Second, areas with different levels of urbanization should respond to important ES changes and carry out corresponding ecological restoration measures. Our spatial response results showed the responsiveness of ES to changes in land use, indicating that the developed and developing urban areas were the most important areas for ES changes during 2000–2018. Agricultural production and habitat quality, which are closely related to human survival, are more sensitive to urbanization. However, water yield services did not pose a threat in our study. Rural areas may soon enter a critical state regarding the loss of provisioning services due to increased industrial demand in Foshan.
Although urbanization and industrialization have greatly changed the social economy, natural ecosystems and their services are still the cornerstone of social development. While paying attention to the changes in industry, economy, population, and land use, we should also understand the changes in the ecological environment and the spatial differences in supply and services. ES is important for land-use planning and urban sustainable development, which can help prevent the loss of natural ES from offsetting the benefits of urbanization to the people [3]. For example, in the construction and planning processes for new cities, the amount of urban forest and green space should be increased and integrated into the architecture of the urban landscape. River dredging projects should be completely integrated with regional water resource management strategies to improve ecological connectivity. We consider that our spatial response map can directly help with practical urban planning. The identification of spatial thresholds can help locate key areas and implement land-use improvement and preventive measures. In the future, challenges for managing natural resources in urban areas may involve improving land-use efficiency within a limited area. The protection and improvement of non-construction land (e.g., cropland, woodland, grassland, and water bodies) are effective ways to ensure ecological security.
Moreover, we should not only consider the change in ES provision and distribution but also pay attention to the improvement and protection of ES quality. Urbanization and land-use planning should consider the conservation of high-priority habitats and high-productivity cropland. Though some indicators and numerical targets have been proposed in China’s National New-type Urbanization Plan, such as the proportion of “green” buildings in new constructions in cities or meeting air-quality targets [4,79], these are not enough to ensure urbanization that is more comfortable, safer, and more harmonious with natural development. More ecological indicators and ES, such as air quality, recreation and tourism, and renewable energy, related to human well-being should be utilized in urban planning to reduce risk from a natural ecosystem perspective [80,81].
4.3. Limitations and Caveats
We used ArcGIS to combine the InVEST model with remote sensing data to quantify the effect of urbanization on ES. Some limitations and uncertainties exist in the physical assessment of ES. First, the model framework employs a relatively simple functional approach to assess ES. For example, the calculation of agricultural production by monetary value is a compromise between data source and data spatialization. More detailed agricultural-related spatial statistics, such as crop types and cultivation methods, are currently not available in this study. However, the monetary value of different agricultural industry statistics can realize the spatialization of agricultural production services. Although there are certain fluctuations in the prices of agricultural products, our results characterize the changes in production capacity and production levels over a period of time to a certain extent. The estimation of soil retention involved the RUSLE formula, which is based on a statistical relationship from many plot-scale experiments [82]. However, in practice, the slope has nonlinear effects on vegetation restoration and soil retention, which may overestimate the ES [83]. Meanwhile, the methods for assessing carbon sequestration and water yield were also the simplifications of complex ecological processes related to the carbon–water cycle [84]. The inter-annual variation of rainfall will also have an impact on regional water yield. Future research will consider collecting and averaging rainfall data over many years to reduce the impact of the volatility of data changes. Some changes in ecological processes do not consider the changes in species, age, and environmental factors over time [85].
Second, we only assessed provisioning, regulating, and supporting services and did not include cultural services [86]. This was because our goal was to identify the objective effects of different levels of urbanization on natural ecosystems, whereas subjective factors and a lack of material benefits may be considered when quantifying cultural services [87].
Finally, the spatial resolution contributed to the uncertainties in our findings. Land use has been identified as one of the most important drivers of the changes in ES provision [88,89,90]. We used LULC maps with a spatial resolution of 300 m in 2000 and 2018. Although higher-precision land-use data can improve the accuracy of ES assessment, the data we used were helpful for achieving the research objectives [91]. We paid more attention to the spatio-temporal variation rather than the improvement in absolute accuracy.
In addition, we revised the formula to determine the spatial response of ES changes with respect to LULC [6]. The spatial response indicator was revised to include a measure of the percentage change in ES due to a percentage change in LULC. Song and Deng [6] used the land-use dynamic index to calculate spatial response. However, this index represents the annual rate of land-use change, whereas the changes in ES were within a specific research period. Therefore, we removed the research period from the original LCD formula and calculated the land-use change dynamics within a specific period. We presume this revision better helped us to understand the relationship between ES changes and land-use changes. In summary, although there were some uncertainties in the simulation, we have certainty in our results. These methods are ultimately a trade-off between the complexity of ecosystem processes and the operability of model simulations.
5. Conclusions
In the present study, we proposed a research framework by integrating nighttime light data, the InVEST model, and spatial response. Based on multi-source data, we established the relationship between the nighttime light data index and the urbanization levels, and identified different urbanization areas. A spatial response index was defined, and its threshold was identified to characterize the response of ES to urbanization. We quantified and mapped the changes in land use along with five vital ES under three different urbanization levels in Foshan City between 2000 and 2018. Our results explain the effect of rapid urbanization on regional vital ES.
First, our results show that rapid urbanization greatly affected agricultural production and habitat quality services. Agricultural production reduced by 49.13% during 2000–2018 in Foshan, followed by a 10.13% reduction in habitat quality. Rapid urbanization had little effect on regulating services in which carbon sequestration and water yield had slightly improved, whereas soil retention had slightly decreased. Second, the changes in ES were mainly concentrated in developing urban areas. The spatial response index of agricultural production, habitat quality, soil retention, water yield, and carbon sequestration were 14.25%, 2.94%, 0.04%, 0.78%, and 0.07%, respectively. The average values of spatial response index in rural, developing, and developed urban areas were 39%, 71%, and 45%, respectively. We found that developing urban areas had the highest spatial response index, which indicates that the ES in this area are more sensitive to land-use change.
We consider that our research framework can help identify the key urbanization areas by identifying the threshold of nighttime light data. We recommend that areas with different levels of urbanization should respond to important ES changes and implement corresponding ecological conservation and restoration measures. In developed and developing urban areas, it is necessary to plan and construct urban ecological corridors, such as urban green space connections. In rural areas, cropland protection is important. Our results can further increase our understanding of the effect of urbanization on ES. Visualizing the spatial response and extracting the spatial threshold will be conducive to sustainable urban management and planning.
Author Contributions
Z.W. designed the framework and wrote the manuscript; R.Z. used the software and analyzed the data; Z.Z. carried out the validation and drew the maps. All authors have read and agreed to the published version of the manuscript.
Funding
This research was funded by the Forestry Science and Technology Innovation Project of Guangdong, grant number 2018KJCX013 and 2020KJCX006 and the National Natural Science Foundation of China, grant number 41801068.
Institutional Review Board Statement
Not applicable.
Informed Consent Statement
Not applicable.
Data Availability Statement
The data that were used in this study can be requested by contacting the corresponding author.
Conflicts of Interest
The authors declare no conflict of interest.
References
- Cumming, G.S.; Buerkert, A.; Hoffmann, E.M.; Schlecht, E.; von Cramon-Taubadel, S.; Tscharntke, T. Implications of agricultural transitions and urbanization for ecosystem services. Nature 2014, 515, 50–57. [Google Scholar] [CrossRef] [PubMed]
- Wang, H.; He, Q.; Liu, X.; Zhuang, Y.; Hong, S. Global urbanization research from 1991 to 2009: A systematic research review. Landsc. Urban Plan. 2012, 104, 299–309. [Google Scholar] [CrossRef]
- Yang, X.J. China’s rapid urbanization. Science 2013, 342, 310. [Google Scholar] [CrossRef] [PubMed]
- Bai, X.; Shi, P.; Liu, Y. Realizing China’s urban dream. Nature 2014, 509, 158–160. [Google Scholar] [CrossRef] [Green Version]
- Costanza, R.; de Groot, R.; Sutton, P.; van der Ploeg, S.; Anderson, S.J.; Kubiszewski, I.; Farber, S.; Turner, R.K. Changes in the global value of ecosystem services. Glob. Environ. Chang. 2014, 26, 152–158. [Google Scholar] [CrossRef]
- Song, W.; Deng, X. Land-use/land-cover change and ecosystem service provision in China. Sci. Total Environ. 2017, 576, 705–719. [Google Scholar] [CrossRef]
- Graefe, S.; Buerkert, A.; Schlecht, E. Trends and gaps in scholarly literature on urban and peri-urban agriculture. Nutr. Cycl. Agroecosyst. 2019, 115, 143–158. [Google Scholar] [CrossRef]
- Pribadi, D.O.; Pauleit, S. The dynamics of peri-urban agriculture during rapid urbanization of Jabodetabek Metropolitan Area. Land Use Pol. 2015, 48, 13–24. [Google Scholar] [CrossRef]
- BenDor, T.; Shoemaker, D.A.; Thill, J.-C.; Dorning, M.A.; Meentemeyer, R.K. A mixed-methods analysis of social-ecological feedbacks between urbanization and forest persistence. Ecol. Soc. 2014, 19, 3. [Google Scholar] [CrossRef] [Green Version]
- Lin, Y.; Qiu, R.; Yao, J.; Hu, X.; Lin, J. The effects of urbanization on China’s forest loss from 2000 to 2012: Evidence from a panel analysis. J. Clean Prod. 2019, 214, 270–278. [Google Scholar] [CrossRef]
- Li, Y.; Li, Y.; Wu, W. Threshold and resilience management of coupled urbanization and water environmental system in the rapidly changing coastal region. Environ. Pollut. 2016, 208, 87–95. [Google Scholar] [CrossRef] [PubMed]
- Zhang, K.; Shen, J.; He, R.; Fan, B.; Han, H. Dynamic Analysis of the Coupling Coordination Relationship between Urbanization and Water Resource Security and Its Obstacle Factor. Int. J. Environ. Res. Public. Health 2019, 16, 4765. [Google Scholar] [CrossRef] [PubMed] [Green Version]
- Bai, L.; Xiu, C.; Feng, X.; Liu, D. Influence of urbanization on regional habitat quality: A case study of Changchun City. Habitat Int. 2019, 93, 102042. [Google Scholar] [CrossRef]
- Enaruvbe, G.O.; Atafo, O.P. Land cover transition and fragmentation of River Ogba catchment in Benin City, Nigeria. Sust. Cities Soc. 2019, 45, 70–78. [Google Scholar] [CrossRef]
- Wu, J. Landscape sustainability science: Ecosystem services and human well-being in changing landscapes. Landsc. Ecol. 2013, 28, 999–1023. [Google Scholar] [CrossRef]
- Huang, Q.; Yang, X.; Gao, B.; Yang, Y.; Zhao, Y. Application of DMSP/OLS Nighttime Light Images: A Meta-Analysis and a Systematic Literature Review. Remote Sens. 2014, 6, 6844–6866. [Google Scholar] [CrossRef] [Green Version]
- Imhoff, M.L.; Lawrence, W.T.; Elvidge, C.D.; Paul, T.; Levine, E.; Privalsky, M.V.; Brown, V. Using nighttime DMSP/OLS images of city lights to estimate the impact of urban land use on soil resources in the United States. Remote Sens. Environ. 1997, 59, 105–117. [Google Scholar] [CrossRef]
- Ma, T.; Zhou, Y.; Zhou, C.; Haynie, S.; Pei, T.; Xu, T. Night-time light derived estimation of spatio-temporal characteristics of urbanization dynamics using DMSP/OLS satellite data. Remote Sens. Environ. 2015, 158, 453–464. [Google Scholar] [CrossRef]
- Peng, J.; Lin, H.; Chen, Y.; Blaschke, T.; Luo, L.; Xu, Z.; Hu, Y.N.; Zhao, M.; Wu, J. Spatiotemporal evolution of urban agglomerations in China during 2000–2012: A nighttime light approach. Landsc. Ecol. 2020, 35, 421–434. [Google Scholar] [CrossRef]
- Chang, S.; Wang, J.; Zhang, F.; Niu, L.; Wang, Y. A study of the impacts of urban expansion on vegetation primary productivity levels in the Jing-Jin-Ji region, based on nighttime light data. J. Clean Prod. 2020, 263, 121490. [Google Scholar] [CrossRef]
- He, C.; Liu, Z.; Tian, J.; Ma, Q. Urban expansion dynamics and natural habitat loss in China: A multiscale landscape perspective. Glob. Change Biol. 2014, 20, 2886–2902. [Google Scholar] [CrossRef]
- Li, B.; Chen, D.; Wu, S.; Zhou, S.; Wang, T.; Chen, H. Spatio-temporal assessment of urbanization impacts on ecosystem services: Case study of Nanjing City, China. Ecol. Indic. 2016, 71, 416–427. [Google Scholar] [CrossRef]
- Millennium Ecosystem Assessment. Ecosystems and Human Well-Being: Synthesis; Island Press: Washington, DC, USA, 2005. [Google Scholar]
- Costanza, R.; de Groot, R.; Braat, L.; Kubiszewski, I.; Fioramonti, L.; Sutton, P.; Farber, S.; Grasso, M. Twenty years of ecosystem services: How far have we come and how far do we still need to go? Ecosyst. Serv. 2017, 28, 1–16. [Google Scholar] [CrossRef]
- Haase, D.; Frantzeskaki, N.; Elmqvist, T. Ecosystem Services in Urban Landscapes: Practical Applications and Governance Implications. Ambio 2014, 43, 407–412. [Google Scholar] [CrossRef]
- Wang, Y.; Dai, E.; Yin, L.; Ma, L. Land use/land cover change and the effects on ecosystem services in the Hengduan Mountain region, China. Ecosyst. Serv. 2018, 34, 55–67. [Google Scholar] [CrossRef]
- Abson, D.J.; von Wehrden, H.; Baumgärtner, S.; Fischer, J.; Hanspach, J.; Härdtle, W.; Heinrichs, H.; Klein, A.M.; Lang, D.J.; Martens, P.; et al. Ecosystem services as a boundary object for sustainability. Ecol. Econ. 2014, 103, 29–37. [Google Scholar] [CrossRef]
- Bennett, E.M.; Cramer, W.; Begossi, A.; Cundill, G.; Díaz, S.; Egoh, B.N.; Geijzendorffer, I.R.; Krug, C.B.; Lavorel, S.; Lazos, E.; et al. Linking biodiversity, ecosystem services, and human well-being: Three challenges for designing research for sustainability. Curr. Opin. Environ. Sustain. 2015, 14, 76–85. [Google Scholar] [CrossRef]
- Zhou, R.; Lin, M.; Gong, J.; Wu, Z. Spatiotemporal heterogeneity and influencing mechanism of ecosystem services in the Pearl River Delta from the perspective of LUCC. J. Geogr. Sci. 2019, 29, 831–845. [Google Scholar] [CrossRef] [Green Version]
- Lyu, R.; Zhang, J.; Xu, M.; Li, J. Impacts of urbanization on ecosystem services and their temporal relations: A case study in Northern Ningxia, China. Land Use Pol. 2018, 77, 163–173. [Google Scholar] [CrossRef]
- Long, H.; Liu, Y.; Hou, X.; Li, T.; Li, Y. Effects of land use transitions due to rapid urbanization on ecosystem services: Implications for urban planning in the new developing area of China. Habitat Int. 2014, 44, 536–544. [Google Scholar] [CrossRef]
- Peng, J.; Tian, L.; Liu, Y.; Zhao, M.; Hu, Y.; Wu, J. Ecosystem services response to urbanization in metropolitan areas: Thresholds identification. Sci. Total Environ. 2017, 607–608, 706–714. [Google Scholar] [CrossRef] [PubMed]
- Liu, W.; Zhan, J.; Zhao, F.; Yan, H.; Zhang, F.; Wei, X. Impacts of urbanization-induced land-use changes on ecosystem services: A case study of the Pearl River Delta Metropolitan Region, China. Ecol. Indic. 2019, 98, 228–238. [Google Scholar] [CrossRef]
- Tan, J.; Duan, J.; Ma, Y.; He, K.; Cheng, Y.; Deng, S.X.; Huang, Y.L.; Si-Tu, S.P. Long-term trends of chemical characteristics and sources of fine particle in Foshan City, Pearl River Delta: 2008–2014. Sci. Total Environ. 2016, 565, 519–528. [Google Scholar] [CrossRef] [PubMed]
- Guo, S. The Research into the World Heritage Value and Tourism Development of Dike-Pond Agriculture in the Pearl River Delta. In Tourism and Hospitality Development between China and EU; Zeng, G., Ed.; Springer: Berlin/Heidelberg, Germany, 2015; pp. 111–127. [Google Scholar]
- Hui, E.C.M.; Li, X.; Chen, T.; Lang, W. Deciphering the spatial structure of China’s megacity region: A new bay area—The Guangdong-Hong Kong-Macao Greater Bay Area in the making. Cities 2018, 105, 102168. [Google Scholar] [CrossRef]
- Yu, Q. Study on the Guangdong-Hong Kong-Macao Greater Bay Area. Mod. Econ. 2019, 10, 586–599. [Google Scholar] [CrossRef] [Green Version]
- Statistics Bureau of Guangdong Province. Guangdong Statistical Yearbook 2013; China Statistics Press: Beijing, China, 2014. [Google Scholar]
- Ma, J.; Guo, J.; Ahmad, S.; Li, Z.; Hong, J. Constructing a New Inter-Calibration Method for DMSP-OLS and NPP-VIIRS Nighttime Light. Remote Sens. 2020, 12, 937. [Google Scholar] [CrossRef] [Green Version]
- Pandey, B.; Joshi, P.K.; Seto, K.C. Monitoring urbanization dynamics in India using DMSP/OLS night time lights and SPOT-VGT data. Int. J. Appl. Earth Obs. Geoinf. 2013, 23, 49–61. [Google Scholar] [CrossRef]
- Su, Y.; Chen, X.; Wang, C.; Zhang, H.; Liao, J.; Ye, Y.; Wang, C. A new method for extracting built-up urban areas using DMSP-OLS nighttime stable lights: A case study in the Pearl River Delta, southern China. GISci. Remote Sens. 2015, 52, 218–238. [Google Scholar] [CrossRef]
- Cao, X.; Chen, J.; Imura, H.; Higashi, O. A SVM-based method to extract urban areas from DMSP-OLS and SPOT VGT data. Remote Sens. Environ. 2009, 113, 2205–2209. [Google Scholar] [CrossRef]
- Dou, Y.; Liu, Z.; He, C.; Yue, H. Urban Land Extraction Using VIIRS Nighttime Light Data: An Evaluation of Three Popular Methods. Remote Sens. 2017, 9, 175. [Google Scholar] [CrossRef] [Green Version]
- He, C.; Zhang, D.; Huang, Q.; Zhao, Y. Assessing the potential impacts of urban expansion on regional carbon storage by linking the LUSD-urban and InVEST models. Environ. Modell. Softw. 2016, 75, 44–58. [Google Scholar] [CrossRef]
- Falkowski, P.; Scholes, R.J.; Boyle, E.; Canadell, J.; Canfield, D.; Elser, J.; Gruber, N.; Hibbard, K.; Högberg, P.; Linder, S.; et al. The Global Carbon Cycle: A Test of Our Knowledge of Earth as a System. Science 2000, 290, 291. [Google Scholar] [CrossRef] [PubMed] [Green Version]
- Lal, R. Carbon sequestration. Philos. Trans. R. Soc. Lond. B Biol. Sci. 2008, 363, 815–830. [Google Scholar] [CrossRef]
- Wu, P.; Liu, X.; Li, X.; Chen, Y. Impact of urban expansion on carbon storage in terrestrial ecosystems based on InVEST model an CA: A case study of Guangdong Province, China. Geogr. Geo-Inf. Sci. 2016, 32, 22–36. [Google Scholar] [CrossRef]
- Ye, J.; She, G. Forest carbon dynamics in Guangdong province. J. Nanjing For. Univ. (Nat. Sci. Ed.) 2010, 34, 7–12. [Google Scholar]
- Budyko, M.I. Clmiate and Life; Academic: San Diego, CA, USA, 1974. [Google Scholar]
- Sharp, R.; Tallis, H.T.; Ricketts, T.; Guerry, A.D.; Wood, S.A.; Chaplin-Kramer, R.; Nelson, E.; Ennaanay, D.W.S.; Olwero, N.; Vigerstol, K.; et al. InVEST Version 3.7 User’s Guide; The Natural Capital Project, Stanford University, University of Minnesota, The Nature Conservancy, and World Wildlife Fund: Arlington, VA, USA, 2016; Available online: https://storage.googleapis.com/releases.naturalcapitalproject.org/invest-userguide/latest/index.html (accessed on 8 May 2021).
- Renard, K.G.; Foster, G.R.; Weesies, G.A.; Porter, J.P. RUSLE: Revised universal soil loss equation. J. Soil Water Conserv. 1991, 46, 30. [Google Scholar]
- Wang, W.; Jiao, J.; Hao, X.; Zhang, X.; Lu, X.; Chen, F.; Wu, X. Study on rainfall erosivity in China. J. Soil Water Conserv. 1995, 4, 5–18. [Google Scholar]
- Jones, C.A.; Dyke, P.T.; Williams, J.R.; Kiniry, J.R.; Benson, V.W.; Griggs, R.H. EPIC—An operational model for evaluation of agricultural sustainability. Agric. Syst. 1991, 37, 341–350. [Google Scholar] [CrossRef]
- Grosso, S.D.; Parton, W.; Stohlgren, T. Global potential net primary production predicted from vegetation class, precipitation, and temperature: Reply. Ecology 2010, 91, 923–925. [Google Scholar] [CrossRef]
- Hall, L.S.; Krausman, P.R.; Morrison, M.L. The Habitat Concept and a Plea for Standard Terminology. Wildl. Soc. Bull. 1997, 25, 173–182. [Google Scholar]
- Forman, R.T.T. Some general principles of landscape and regional ecology. Landsc. Ecol. 1995, 10, 133–142. [Google Scholar] [CrossRef]
- Chu, L.; Sun, T.; Wang, T.; Li, Z.; Cai, C. Evolution and Prediction of Landscape Pattern and Habitat Quality Based on CA-Markov and InVEST Model in Hubei Section of Three Gorges Reservoir Area (TGRA). Sustainability 2018, 10, 3854. [Google Scholar] [CrossRef] [Green Version]
- Seabrook, L.; McAlpine, C.; Rhodes, J.; Baxter, G.; Bradley, A.; Lunney, D.; Thuiller, W. Determining range edges: Habitat quality, climate or climate extremes? Divers. Distrib. 2014, 20, 95–106. [Google Scholar] [CrossRef]
- Morris, M.D. Factorial Sampling Plans for Preliminary Computational Experiments. Technometrics 1991, 33, 161. [Google Scholar] [CrossRef]
- Ye, Y.; Zhang, J.E.; Bryan, B.A.; Gao, L.; Qin, Z.; Chen, L.; Yang, J. Impacts of rapid urbanization on ecosystem services along urban-rural gradients: A case study of the Guangzhou-Foshan Metropolitan Area, South China. Écoscience 2018, 25, 235–247. [Google Scholar] [CrossRef]
- Dai, E.; Wu, Z.; Du, X. A gradient analysis on urban sprawl and urban landscape pattern between 1985 and 2000 in the Pearl River Delta, China. Front. Earth Sci. 2017, 12, 791–807. [Google Scholar] [CrossRef]
- Seto, K.C.; Woodcock, C.E.; Song, C.; Huang, X.; Lu, J.; Kaufmann, R.K. Monitoring land-use change in the Pearl River Delta using Landsat TM. Int. J. Remote Sens. 2010, 23, 1985–2004. [Google Scholar] [CrossRef]
- Zhao, M.; Peng, J.; Liu, Y.; Li, T.; Wang, Y. Mapping Watershed-Level Ecosystem Service Bundles in the Pearl River Delta, China. Ecol. Econ. 2018, 152, 106–117. [Google Scholar] [CrossRef]
- Wei, Z.Q.; Wu, S.H.; Zhou, S.L.; Li, J.T.; Zhao, Q.G. Soil Organic Carbon Transformation and Related Properties in Urban Soil Under Impervious Surfaces. Pedosphere 2014, 24, 56–64. [Google Scholar] [CrossRef]
- McKinney, M.L. Influence of settlement time, human population, park shape and age, visitation and roads on the number of alien plant species in protected areas in the USA. Divers. Distrib. 2002, 8, 311–318. [Google Scholar] [CrossRef]
- Xiao, H.; Wang, M.; Sheng, S. Spatial evolution of URNCL and response of ecological security: A case study on Foshan City. Geol. Ecol. Landsc. 2017, 1, 190–196. [Google Scholar] [CrossRef] [Green Version]
- Ye, Y.; Bryan, B.A.; Zhang, J.E.; Connor, J.D.; Chen, L.; Qin, Z.; He, M. Changes in land-use and ecosystem services in the Guangzhou-Foshan Metropolitan Area, China from 1990 to 2010: Implications for sustainability under rapid urbanization. Ecol. Indic. 2018, 93, 930–941. [Google Scholar] [CrossRef]
- Xie, Y.J.; Ng, C.N. Exploring spatio-temporal variations of habitat loss and its causal factors in the Shenzhen River cross-border watershed. Appl. Geogr. 2013, 39, 140–150. [Google Scholar] [CrossRef]
- Lin, Q.; Mao, J.; Wu, J.; Li, W.; Yang, J. Ecological Security Pattern Analysis Based on InVEST and Least-Cost Path Model: A Case Study of Dongguan Water Village. Sustainability 2016, 8, 172. [Google Scholar] [CrossRef] [Green Version]
- Hoyer, R.; Chang, H. Assessment of freshwater ecosystem services in the Tualatin and Yamhill basins under climate change and urbanization. Appl. Geogr. 2014, 53, 402–416. [Google Scholar] [CrossRef]
- Pickard, B.R.; Van Berkel, D.; Petrasova, A.; Meentemeyer, R.K. Forecasts of urbanization scenarios reveal trade-offs between landscape change and ecosystem services. Landsc. Ecol. 2016, 32, 617–634. [Google Scholar] [CrossRef]
- Ali, R.; Kuriqi, A.; Abubaker, S.; Kisi, Q. Long-Term Trends and Seasonality Detection of the Observed Flow in Yangtze River Using Mann-Kendall and Sen’s Innovative Trend Method. Water 2019, 11, 1855. [Google Scholar] [CrossRef] [Green Version]
- Xu, Q.; Zheng, X.; Zheng, M. Do urban planning policies meet sustainable urbanization goals? A scenario-based study in Beijing, China. Sci. Total Environ. 2019, 670, 498–507. [Google Scholar] [CrossRef]
- Ramamurthy, P.; Bou-Zeid, E. Contribution of impervious surfaces to urban evaporation. Water Resour. Res. 2014, 50, 2889–2902. [Google Scholar] [CrossRef]
- Liu, Y.; Lu, S.; Chen, Y. Spatio-temporal change of urban–rural equalized development patterns in China and its driving factors. J. Rural Stud. 2013, 32, 320–330. [Google Scholar] [CrossRef]
- Tan, J.H.; Duan, J.C.; Ma, Y.L.; Yang, F.M.; Cheng, Y.; He, K.B.; Yu, Y.C.; Wang, J.W. Source of atmospheric heavy metals in winter in Foshan, China. Sci. Total Environ. 2014, 493, 262–270. [Google Scholar] [CrossRef]
- Zhang, H.; Ma, W.C.; Wang, X.R. Rapid Urbanization and Implications for Flood Risk Management in Hinterland of the Pearl River Delta, China: The Foshan Study. Sensors 2008, 8, 2223. [Google Scholar] [CrossRef] [Green Version]
- Smith, H.F.; Sullivan, C.A. Ecosystem services within agricultural landscapes—Farmers’ perceptions. Ecol. Econ. 2014, 98, 72–80. [Google Scholar] [CrossRef]
- Wang, X.R.; Hui, E.C.M.; Choguill, C.; Jia, S.H. The new urbanization policy in China: Which way forward? Habitat Int. 2015, 47, 279–284. [Google Scholar] [CrossRef]
- Ali, R.; Kuriqi, A.; Kisi, O. Human–Environment Natural Disasters Interconnection in China: A Review. Climate 2020, 8, 48. [Google Scholar] [CrossRef] [Green Version]
- Keith, H.; Vardon, M.; Stein, J.A.; Stein, J.L.; Lindenmayer, D. Ecosystem accounts define explicit and spatial trade-offs for managing natural resources. Nat. Ecol. Evol. 2017, 1, 1683–1692. [Google Scholar] [CrossRef]
- Marques, M.J.; Bienes, R.; Jimenez, L.; Perez-Rodriguez, R. Effect of vegetal cover on runoff and soil erosion under light intensity events. Rainfall simulation over USLE plots. Sci. Total Environ. 2007, 378, 161–165. [Google Scholar] [CrossRef]
- Jiang, C.; Li, D.; Wang, D.; Zhang, L. Quantification and assessment of changes in ecosystem service in the Three-River Headwaters Region, China as a result of climate variability and land cover change. Ecol. Indic. 2016, 66, 199–211. [Google Scholar] [CrossRef]
- Reichstein, M.; Bahn, M.; Ciais, P.; Frank, D.; Mahecha, M.D.; Seneviratne, S.I.; Zscheischler, J.; Beer, C.; Buchmann, N.; Frank, D.C.; et al. Climate extremes and the carbon cycle. Nature 2013, 500, 287. [Google Scholar] [CrossRef]
- Nor, A.N.M.; Corstanje, R.; Harris, J.A.; Brewer, T. Impact of rapid urban expansion on green space structure. Ecol. Indic. 2017, 81, 274–284. [Google Scholar] [CrossRef]
- La Notte, A.; D’Amato, D.; Makinen, H.; Paracchini, M.L.; Liquete, C.; Egoh, B.; Geneletti, D.; Crossman, N.D. Ecosystem services classification: A systems ecology perspective of the cascade framework. Ecol. Indic. 2017, 74, 392–402. [Google Scholar] [CrossRef] [PubMed]
- Small, N.; Munday, M.; Durance, I. The challenge of valuing ecosystem services that have no material benefits. Glob. Environ. Chang. 2017, 44, 57–67. [Google Scholar] [CrossRef]
- Blumstein, M.; Thompson, J.R.; Nally, R.M. Land-use impacts on the quantity and configuration of ecosystem service provisioning in Massachusetts, USA. J. Appl. Ecol. 2015, 52, 1009–1019. [Google Scholar] [CrossRef]
- Foley, J.A.; Defries, R.; Asner, G.P.; Barford, C.; Bonan, G.; Carpenter, S.R.; Chapin, F.S.; Coe, M.T.; Daily, G.C.; Gibbs, H.K.; et al. Global consequences of land use. Science 2005, 309, 570–574. [Google Scholar] [CrossRef] [PubMed] [Green Version]
- Lawler, J.J.; Lewis, D.J.; Nelson, E.; Plantinga, A.J.; Polasky, S.; Withey, J.C.; Helmers, D.P.; Martinuzzi, S.; Pennington, D.; Radeloff, V.C. Projected land-use change impacts on ecosystem services in the United States. Proc. Natl. Acad. Sci. USA 2014, 111, 7492–7497. [Google Scholar] [CrossRef] [Green Version]
- Rioux, J.-F.; Cimon-Morin, J.; Pellerin, S.; Alard, D.; Poulin, M. How Land Cover Spatial Resolution Affects Mapping of Urban Ecosystem Service Flows. Front. Environ. Sci. 2019, 7, 93. [Google Scholar] [CrossRef]


Publisher’s Note: MDPI stays neutral with regard to jurisdictional claims in published maps and institutional affiliations. |
© 2021 by the authors. Licensee MDPI, Basel, Switzerland. This article is an open access article distributed under the terms and conditions of the Creative Commons Attribution (CC BY) license (https://creativecommons.org/licenses/by/4.0/).