Article

Influences of Climate Change and Human Activities on NDVI Changes in China

1
China Institute of Water Resources and Hydropower Research, Beijing 100038, China
2
Research Center on Flood & Drought Disaster Reduction, The Ministry of Water Resources of China, Beijing 100038, China
*
Author to whom correspondence should be addressed.
Remote Sens. 2021, 13(21), 4326; https://doi.org/10.3390/rs13214326
Submission received: 15 October 2021 / Revised: 25 October 2021 / Accepted: 25 October 2021 / Published: 27 October 2021
(This article belongs to the Special Issue Remote Sensing in Natural Resource and Water Environment)

Abstract

:
The spatiotemporal evolution of vegetation and its influencing factors can be used to explore the relationships among vegetation, climate change, and human activities, which are of great importance for guiding scientific management of regional ecological environments. In recent years, remote sensing technology has been widely used in dynamic monitoring of vegetation. In this study, the normalized difference vegetation index (NDVI) and standardized precipitation–evapotranspiration index (SPEI) from 1998 to 2017 were used to study the spatiotemporal variation of NDVI in China. The influences of climate change and human activities on NDVI variation were investigated based on the Mann–Kendall test, correlation analysis, and other methods. The results show that the growth rate of NDVI in China was 0.003 year−1. Regions with improved and degraded vegetation accounted for 71.02% and 22.97% of the national territorial area, respectively. The SPEI decreased in 60.08% of the area and exhibited an insignificant drought trend overall. Human activities affected the vegetation cover in the directions of both destruction and restoration. As the elevation and slope increased, the correlation between NDVI and SPEI gradually increased, whereas the impact of human activities on vegetation decreased. Further studies should focus on vegetation changes in the Continental Basin, Southwest Rivers, and Liaohe River Basin.

1. Introduction

As the link between the atmosphere and the geosphere, vegetation is an important component of terrestrial ecosystems and plays important roles in the hydrological cycle, climate regulation, and land surface energy exchange [1]. Vegetation ecosystems are the result of long-term interactions between climate, human activities, and terrain [2,3,4]. In the context of global warming and intensified human activities, terrestrial vegetation ecosystems have undergone unprecedented changes [5]. Monitoring vegetation changes and their driving factors has become a hot and difficult topic in current research [6,7,8]. Since the beginning of the 21st century, rapid development of remote sensing technology [9] has allowed it to be used in many fields such as meteorological monitoring, soil reproduction, and urban research [10,11]. In addition, remote sensing images are widely used to monitor changes in vegetation coverage [12,13,14]. The normalized difference vegetation index (NDVI) has become the most popular index for assessment of vegetation dynamics owing to its universality and simple acquisition [15], as well as its strong correlations with net primary productivity, photosynthetic capacity, and leaf area index [16,17]. The number of papers reporting on the NDVI sharply increased from 795 in the 1990s to 3361 in the 2000s and to 12,618 in the 2010s [15].
In recent years, many scholars have studied vegetation changes under climate change based on NDVI time series [18,19,20]. Based on the global NDVI data set from 1982 to 2011, Eastman et al. [21] found that NDVI increased significantly in all continents except Oceania. Wu et al. [22] evaluated the spatiotemporal changes in global vegetation based on global NDVI data and concluded that this change was the result of global warming. With global warming, the frequency of extreme precipitation events is increasing [23,24]. Jiao et al. [25] studied the driving factors of NDVI changes on the Qinghai–Tibet Plateau, and the results showed that precipitation is the dominant factor driving vegetation changes, accounting for 39.7% of the survey region. Pei et al. [26] studied the sensitivity of vegetation activities in the Yangtze River Basin of China to changes in extreme precipitation events, and the results showed that there was a relationship between NDVI changes and extreme precipitation events; both showed an increasing trend, especially the maximum NDVI. However, it is difficult to comprehensively describe the dry–wet climate conditions using a single precipitation or temperature factor. The meteorological drought index combines these factors to represent the overall climate and the environment [27]. Serrano et al. [28] proposed a standardized precipitation evapotranspiration index (SPEI) to characterize meteorological drought. This index inherits the characteristics of the Palmer drought severity index (PDSI), which considers the temperature sensitivity of evapotranspiration, and the advantages of the standardized precipitation index (SPI), which is easy to calculate and provides a multi-time scale and multi-space comparison [29,30,31].
Moreover, with the intensification of human activities, many scholars have increasingly realized that human activities have an increasing impact on vegetation coverage. Therefore, human activities and vegetation changes have received extensive attention. Research results show that well-planned human activities can maximize the benefits of ecological restoration projects [32,33], and that reasonable vegetation restoration measures are conducive to reducing the vulnerability of vegetation and minimizing the impact of extreme weather [34,35]. Different vegetation types have different responses to human activities under different climatic conditions [36], and reforestation can effectively restore vegetation and increase the NDVI value [37]. However, with the increase in population and economic development, urbanization in China has increased, and vegetation in developed areas and their surroundings has tended to be destroyed to a certain extent [38]. Prior to 2000, forest areas in most regions of China were significantly reduced [39]. For this reason, the Chinese government launched six ecological restoration projects, including the Grain for Green Program, the Three-North Shelterbelt Project, and the Natural Forest Protect Project, which have had positive impacts on vegetation restoration [40,41].
Previous studies have investigated the effects of various factors on the temporal changes in NDVI, ignoring the influence of spatial heterogeneity of various factors that play an important role in the spatial distribution of NDVI [2]. However, many studies have shown that vegetation changes are related to the spatial distribution characteristics of topography, land use, and soil to a certain extent [42,43]. In addition, previous studies have mostly focused on the impact of a single factor on vegetation changes. In reality, vegetation evolution is a complex process under the combined effects of climate change and human activities and is affected by the combined effects of multiple factors. It is not sufficiently rigorous to study only the relationships between vegetation change and individual factors [44,45,46]. Hence, it is necessary to comprehensively consider the spatiotemporal changes in various factors and their effects on NDVI changes [47,48].
This research explored the impacts of climate change and human activity on vegetation changes in China. First, we analyzed the spatiotemporal changes in NDVI and SPEI from 1998–2017 and determined the correlation between NDVI and SPEI. Second, we explored the changing dynamics of NDVI and its correlation with the SPEI under different vegetation types. Finally, we discussed the impact of terrain on NDVI and its correlation with SPEI. The results assist in explaining the reasons for NDVI changes in China and improve our understanding of the ways in which climate change and human activities impact NDVI dynamics.

2. Materials and Methods
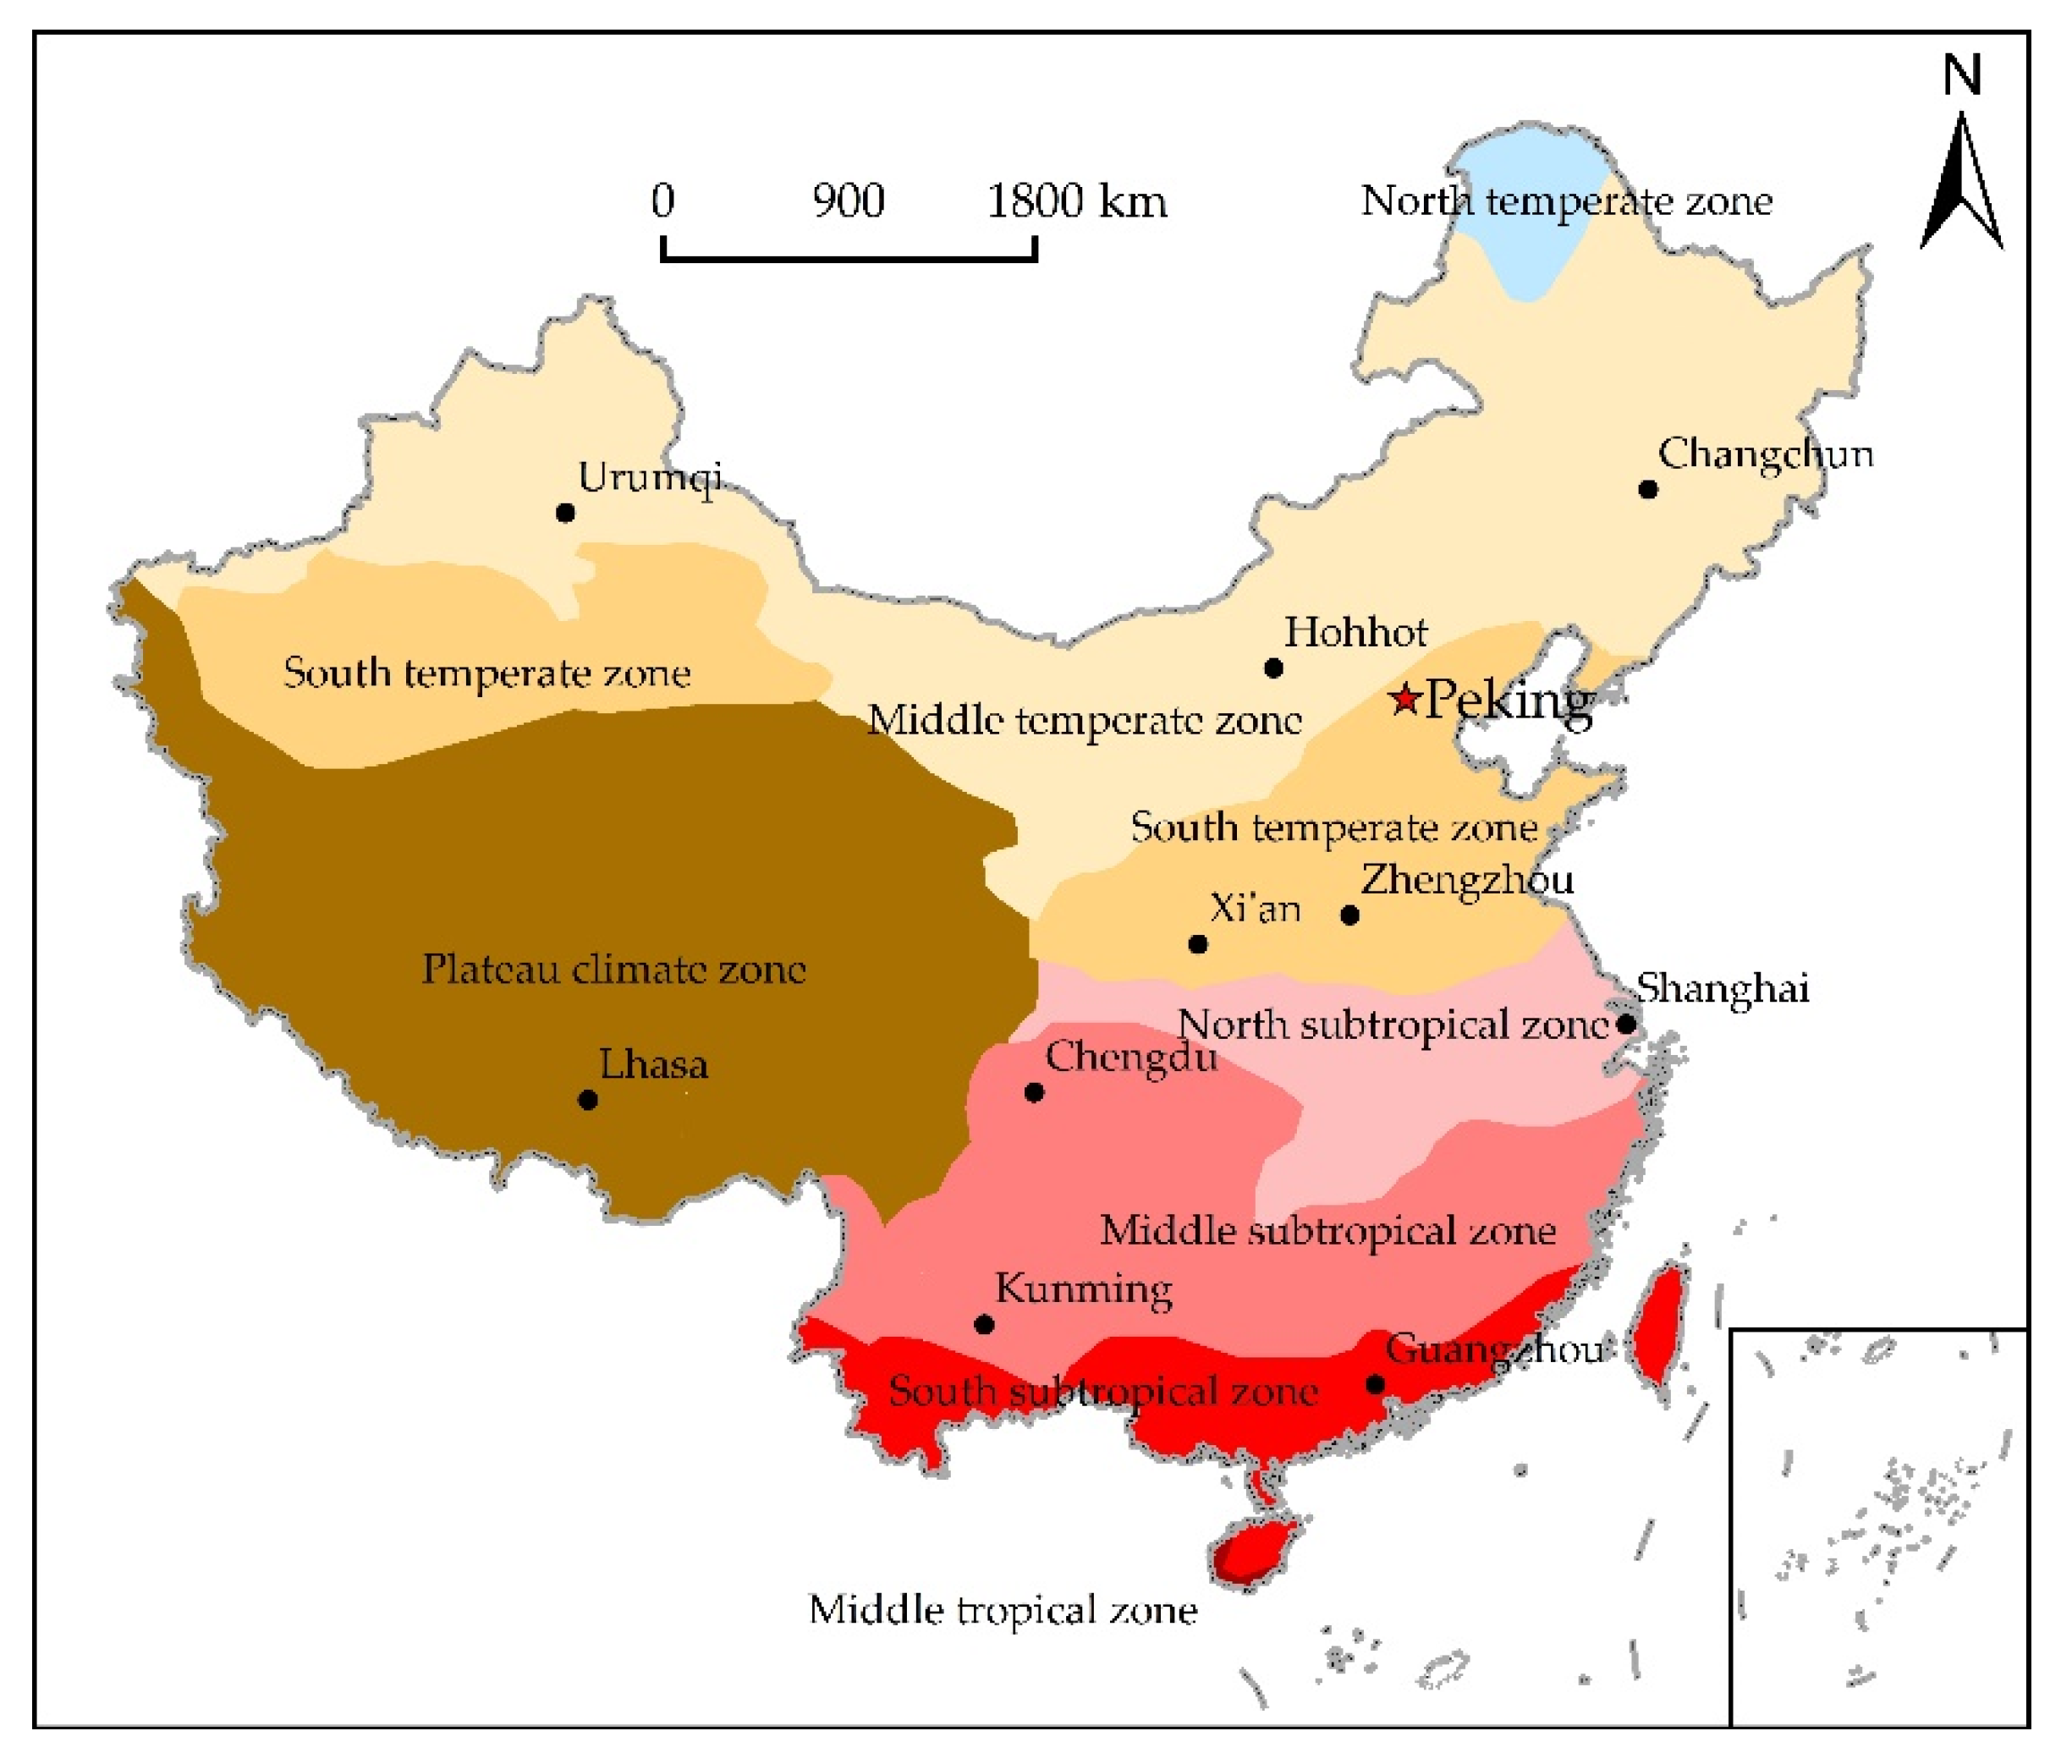
2.1. Study Area

China is located in eastern Asia (3°51′~53°33′N, 73°33′~135°05′E; Figure 1a). It is the third largest country in the world, with a land area of approximately 9,600,000 km2. The elevation is high in the west and low in the east. In the west, the Qinghai–Tibet Plateau is the highest plateau in the world, with a mean elevation of more than 4000 m, and is known as the Third Pole of the world (Figure 1c). China as a whole can be divided into nine major river basins: the Yangtze River Basin (YARB), Yellow River Basin (YRB), Pearl River Basin (PRB), Southwest Rivers (SWR), Southeast Rivers (SER), Haihe River Basin (HRB), Huaihe River Basin (HURB), Songhua and Liaohe River Basin (SLRB), and Continental Basin (CB). In the past 20 years, the climate in northern China has tended to be arid, whereas that of southwest China has tended to be humid (Figure 1b). Vegetation coverage is lower in northwest China and higher in southeast China. The land-use (LUCC) types are mainly grassland and forest, accounting for >55% of the total area (Figure 1e).

2.2. Data Sources

NDVI and LUCC data were obtained from the Resources and Environment Science and Data Center, Chinese Academy of Sciences (http://www.resdc.cn/ (accessed on 1 March 2021)) [49,50,51]. The 1 km × 1 km annual NDVI spatial distribution dataset used in this study was based on the SPOT/VEGETATION NDVI satellite remote sensing data. The dataset started in 1998 and was generated by the maximum value composites (MVC) method on the basis of monthly data, which can effectively reflect the distribution and changes of vegetation coverage on temporal and spatial scales in various regions of China [2]. LUCC was resampled to a resolution of 1 km × 1 km, and the Clarke-1866-Albers projection system was used. The classification standard for the LUCC type was referenced from the Multiperiod China LUCC and Land Cover Change Remote Sensing Monitoring Data Set (CNLUCC). According to the classification standard of CNLUCC, LUCC in China was divided into six categories: cropland, forest, grassland, water, urban land, and unused land.
The spatial distribution data of the digital elevation model (DEM) in China were derived from the Shuttle Radar Topography Mission (SRTM) digital elevation database of the USGS/NASA [52]. To ensure that the spatial resolution and projection system of the dataset were the same as those of the NDVI dataset, the dataset was resampled to a spatial resolution of 1 km × 1 km, and the Clarke-1866-Albers projection system was adopted. Elevation and slope data were calculated based on the DEM.
The SPEI dataset of China from 1998–2017 was derived from the global gridded dataset of the SPEI at 12 months (SPEI base v.2.6, http://hdl.handle.net/10261/202305 (accessed on 25 March 2021)) [53]. This dataset is based on the SPEI calculation method proposed by Vicente-Serrano et al. [28] in 2010 and used the SPEI package of the R language to calculate the global SPEI (http://cran.r-project.org/web/packages/SPEI (accessed on 27 March 2021)). To ensure that the spatial range, resolution, and projection system of the SPEI dataset were the same as those of NDVI, first, the dataset was tailored based on the Chinese vector range; second, the inverse distance weighting method was used to interpolate the dataset to a spatial resolution of 1 km × 1 km, and finally, the projection system of this dataset was transformed into Clarke_1866_Albers.

2.3. Methods

2.3.1. Linear Regression and Mann–Kendall (M–K) Test

We used the slope (S) of the linear regression between NDVI/SPEI (dependent variable) and year (independent variable) to quantify the NDVI and SPEI trends in the study area from 1998–2017 according to Lin et al. [7]:
S = n × i = 1 n ( i × x i ) i = 1 n i × i = 1 n x i n × i = 1 n i 2 ( i = 1 n i ) 2 ,
where n is the number of years (20) and xi is NDVI/SPEI in year i. T-tests were used to test whether the trend was statistically significant.
The M–K test is often used to analyze whether the trend associated with various factors is significant, and the t-test is used to evaluate the results [54,55]. The corresponding formulas are as follows.
Z = { S 1 n ( n 1 ) ( 2 n + 5 ) / 18 for   S > 0 0 for   S = 0 S + 1 n ( n 1 ) ( 2 n + 5 ) / 18 for   S < 0 ,
S = k = 1 n 1 j = k + 1 n sgn ( x j x k ) ,
sgn ( x j x k ) = { + 1 if   ( x j x k ) > 0 0 if   ( x j x k ) = 0 1 if   ( x j x k ) < 0 ,
Here, the Z value indicates the NDVI/SPEI trend. When |Z| > Zα, the null hypothesis of the trend is accepted. In this study, α = 0.01, α = 0.05, and α = 0.1 were defined as the given significance levels, and |Z|−α/2 was equal to 2.58, 1.96, and 1.64, respectively [47,56]. S is the Kendall sum statistic, and xj and xk are the parameter values at time j and k, respectively. Based on the NDVI and SPEI trends, they were further divided into nine levels, as detailed in Table 1.

2.3.2. Correlation Analysis Model

The correlation coefficient between the NDVI and SPEI was statistically significant. In this study, we determined whether there was a correlation between two variables in each pixel or in the magnitude of the correlation [7]. The corresponding formula is as follows:
R x y = i = 1 n [ ( x i x ¯ ) ( y i y ¯ ) ] i = 1 n ( x i x ¯ ) 2 i = 1 n ( y i y ¯ ) 2 ,
where Rxy represents the correlation coefficient between the SPEI variable and variable NDVI; xi is the value of the variable SPEI in year i; yi represents the value of the variable NDVI in year i; and x ¯ and y ¯ represent the mean value of the variable SPEI and the variable NDVI, respectively. The correlation test used a t-test to determine the significance, and the results were divided into four categories: extremely significant (p ≤ 0.01), significant (0.01 < p ≤ 0.05), weakly significant (0.05 < p ≤ 0.1), and insignificant (p > 0.1) grade.

2.3.3. SPEI

The SPEI is based on the climatic water balance, which is the difference between precipitation and potential evapotranspiration (PET, i.e., the amount of transpiration and evaporation under sufficient water). In this study, the Thornthwaite equation was used to calculate PET [57]. The calculated D values were aggregated at various time scales [58], according to the following formula:
D n k = i = 0 k 1 ( P n i P E T n i ) if   n k ,
where k (months) is the time scale of the aggregation and n is the calculation number.
According to Vicente-Serrano et al. [28], the log-logistic probability distribution function is fitted to other data because it is very suitable for all time scales. This research followed the classical approximation of Abramowitz and Stegun to calculate SPEI [59], which was calculated as follows:
S P E I = W C 0 + C 1 W + C 2 W 2 1 + d 1 W + d 2 W 2 + d 3 W 3 ,
where the constants are C0 = 2.516, C1 = 0.803, C2 = 0.010, d1 = 1.433, d2 = 0.189, and d3 = 0.001; and W is the soil–water balance.
According to the “Meteorological Drought Grades” issued by the National Climate Center of China in 2006, the SPEI value was divided into nine grades, as shown in Table 2.

3. Results

3.1. Response of NDVI Change to Climate Change

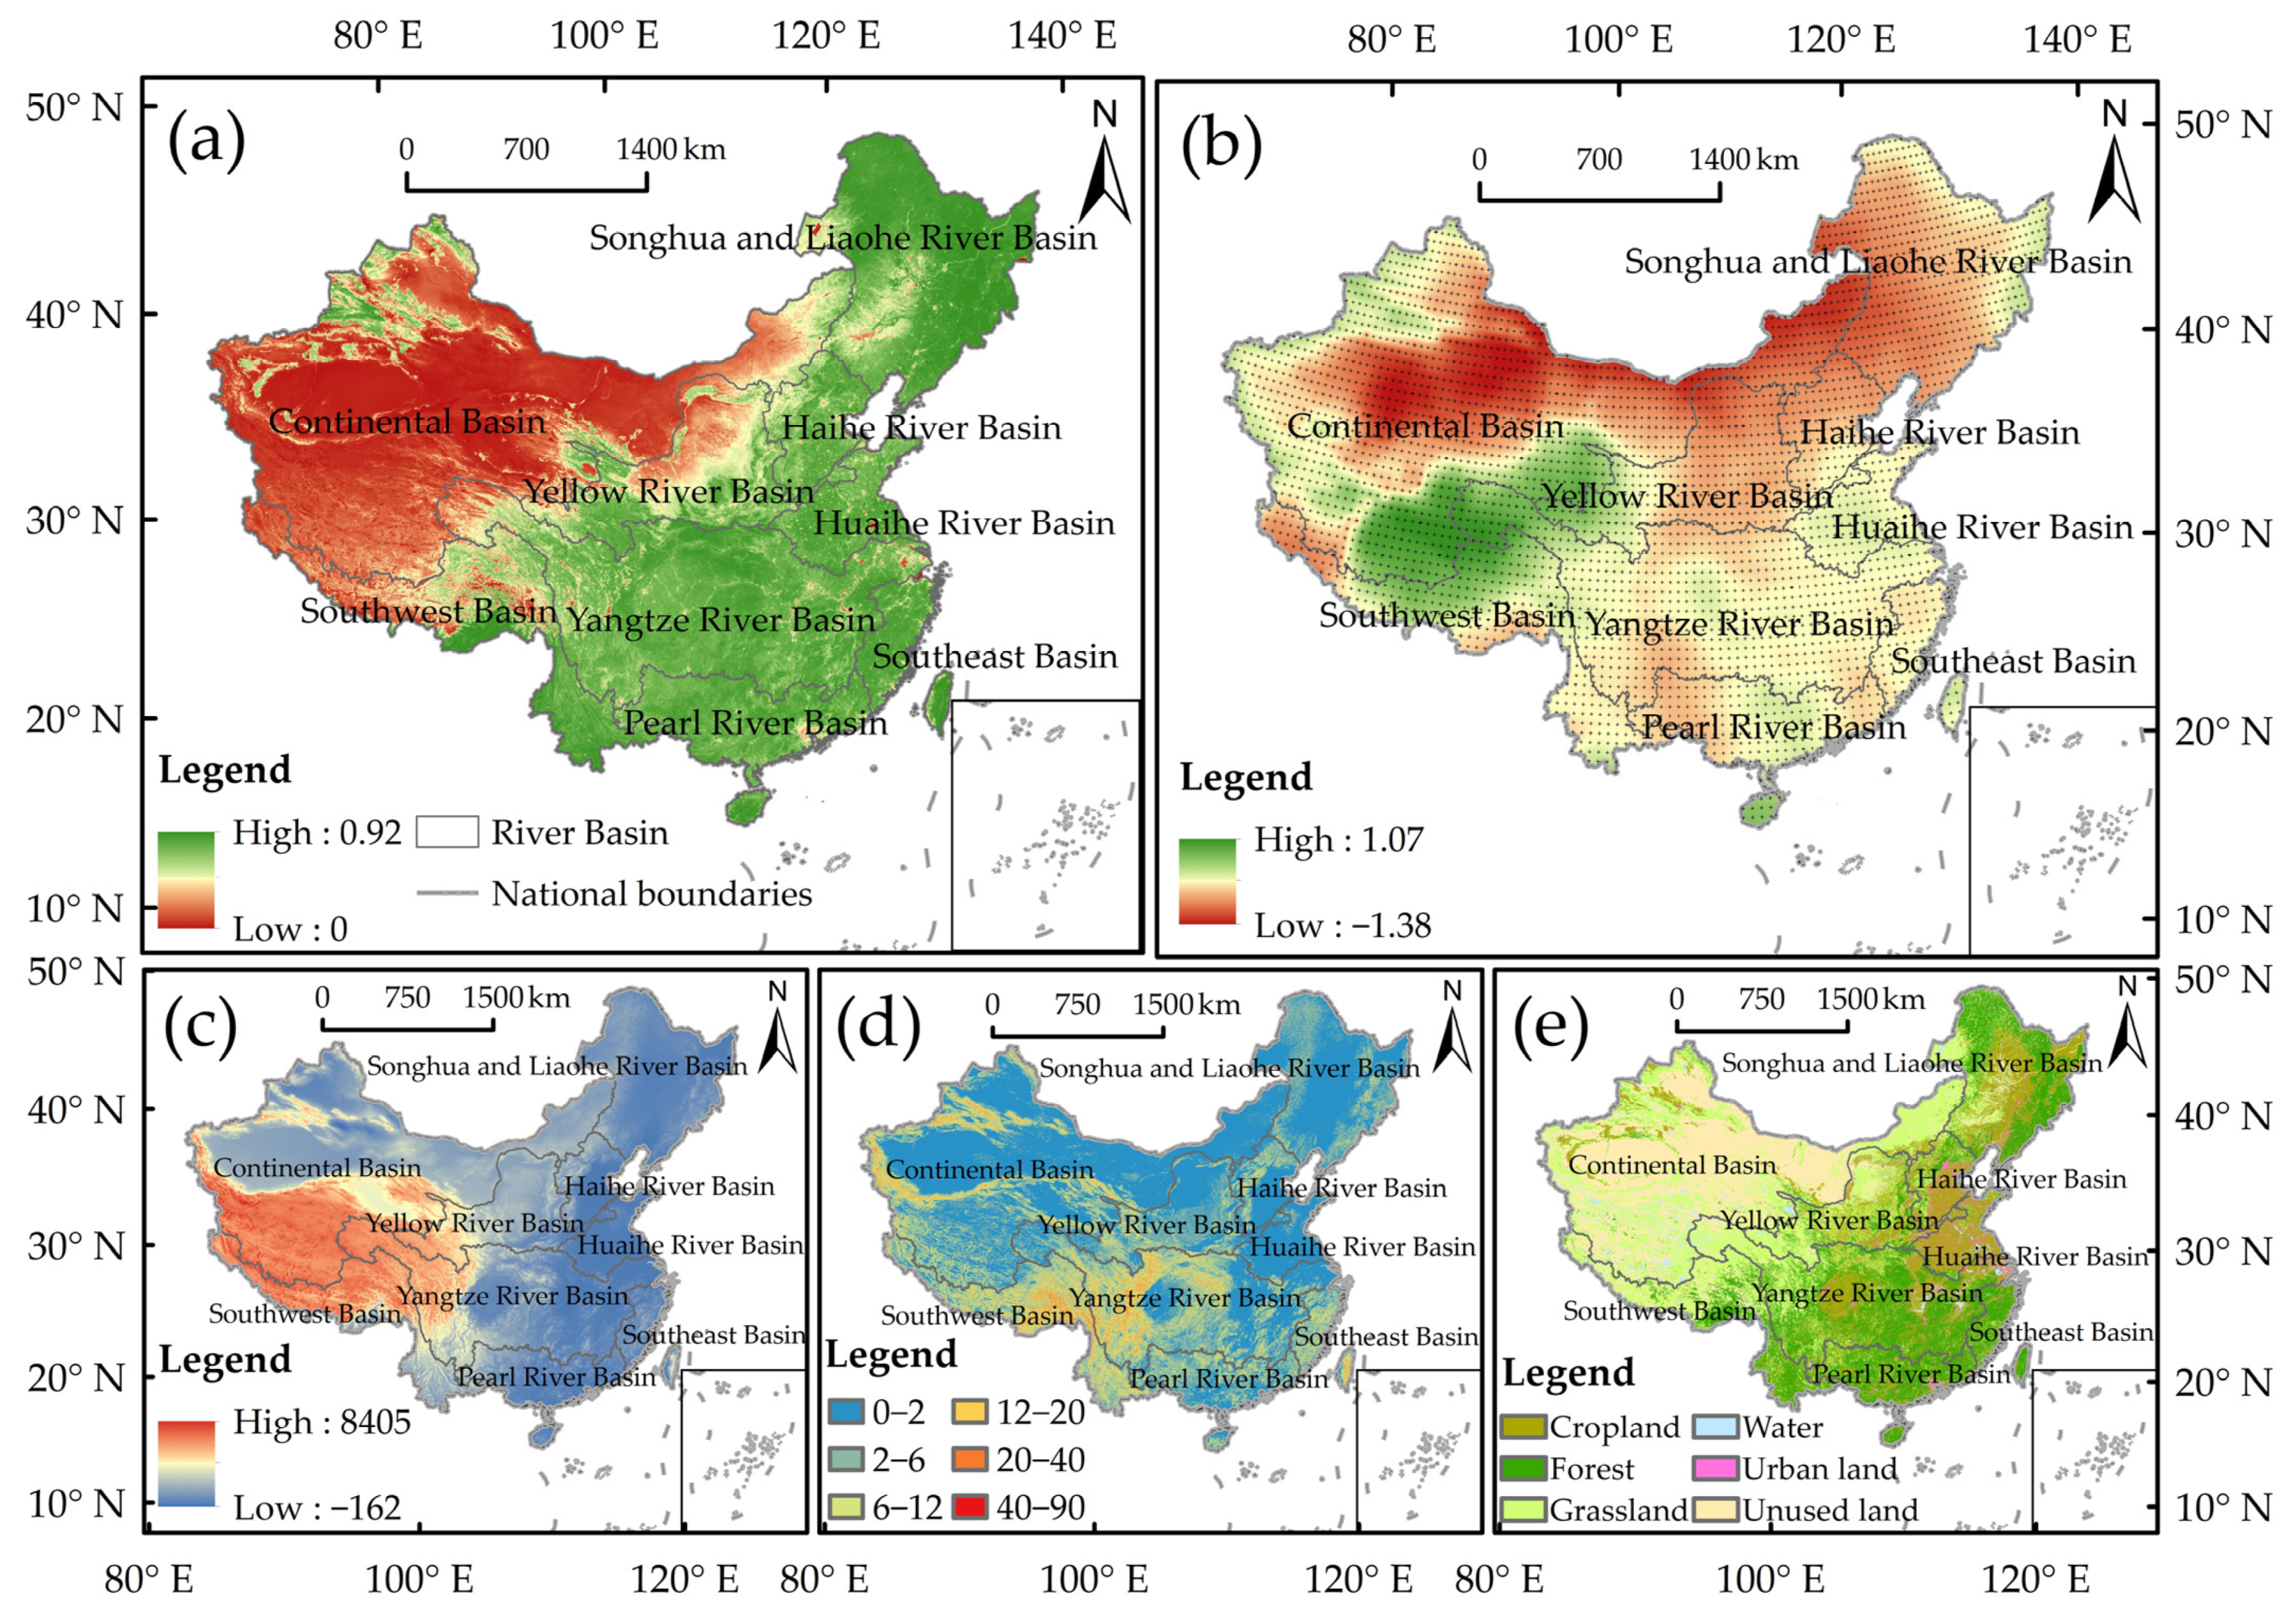
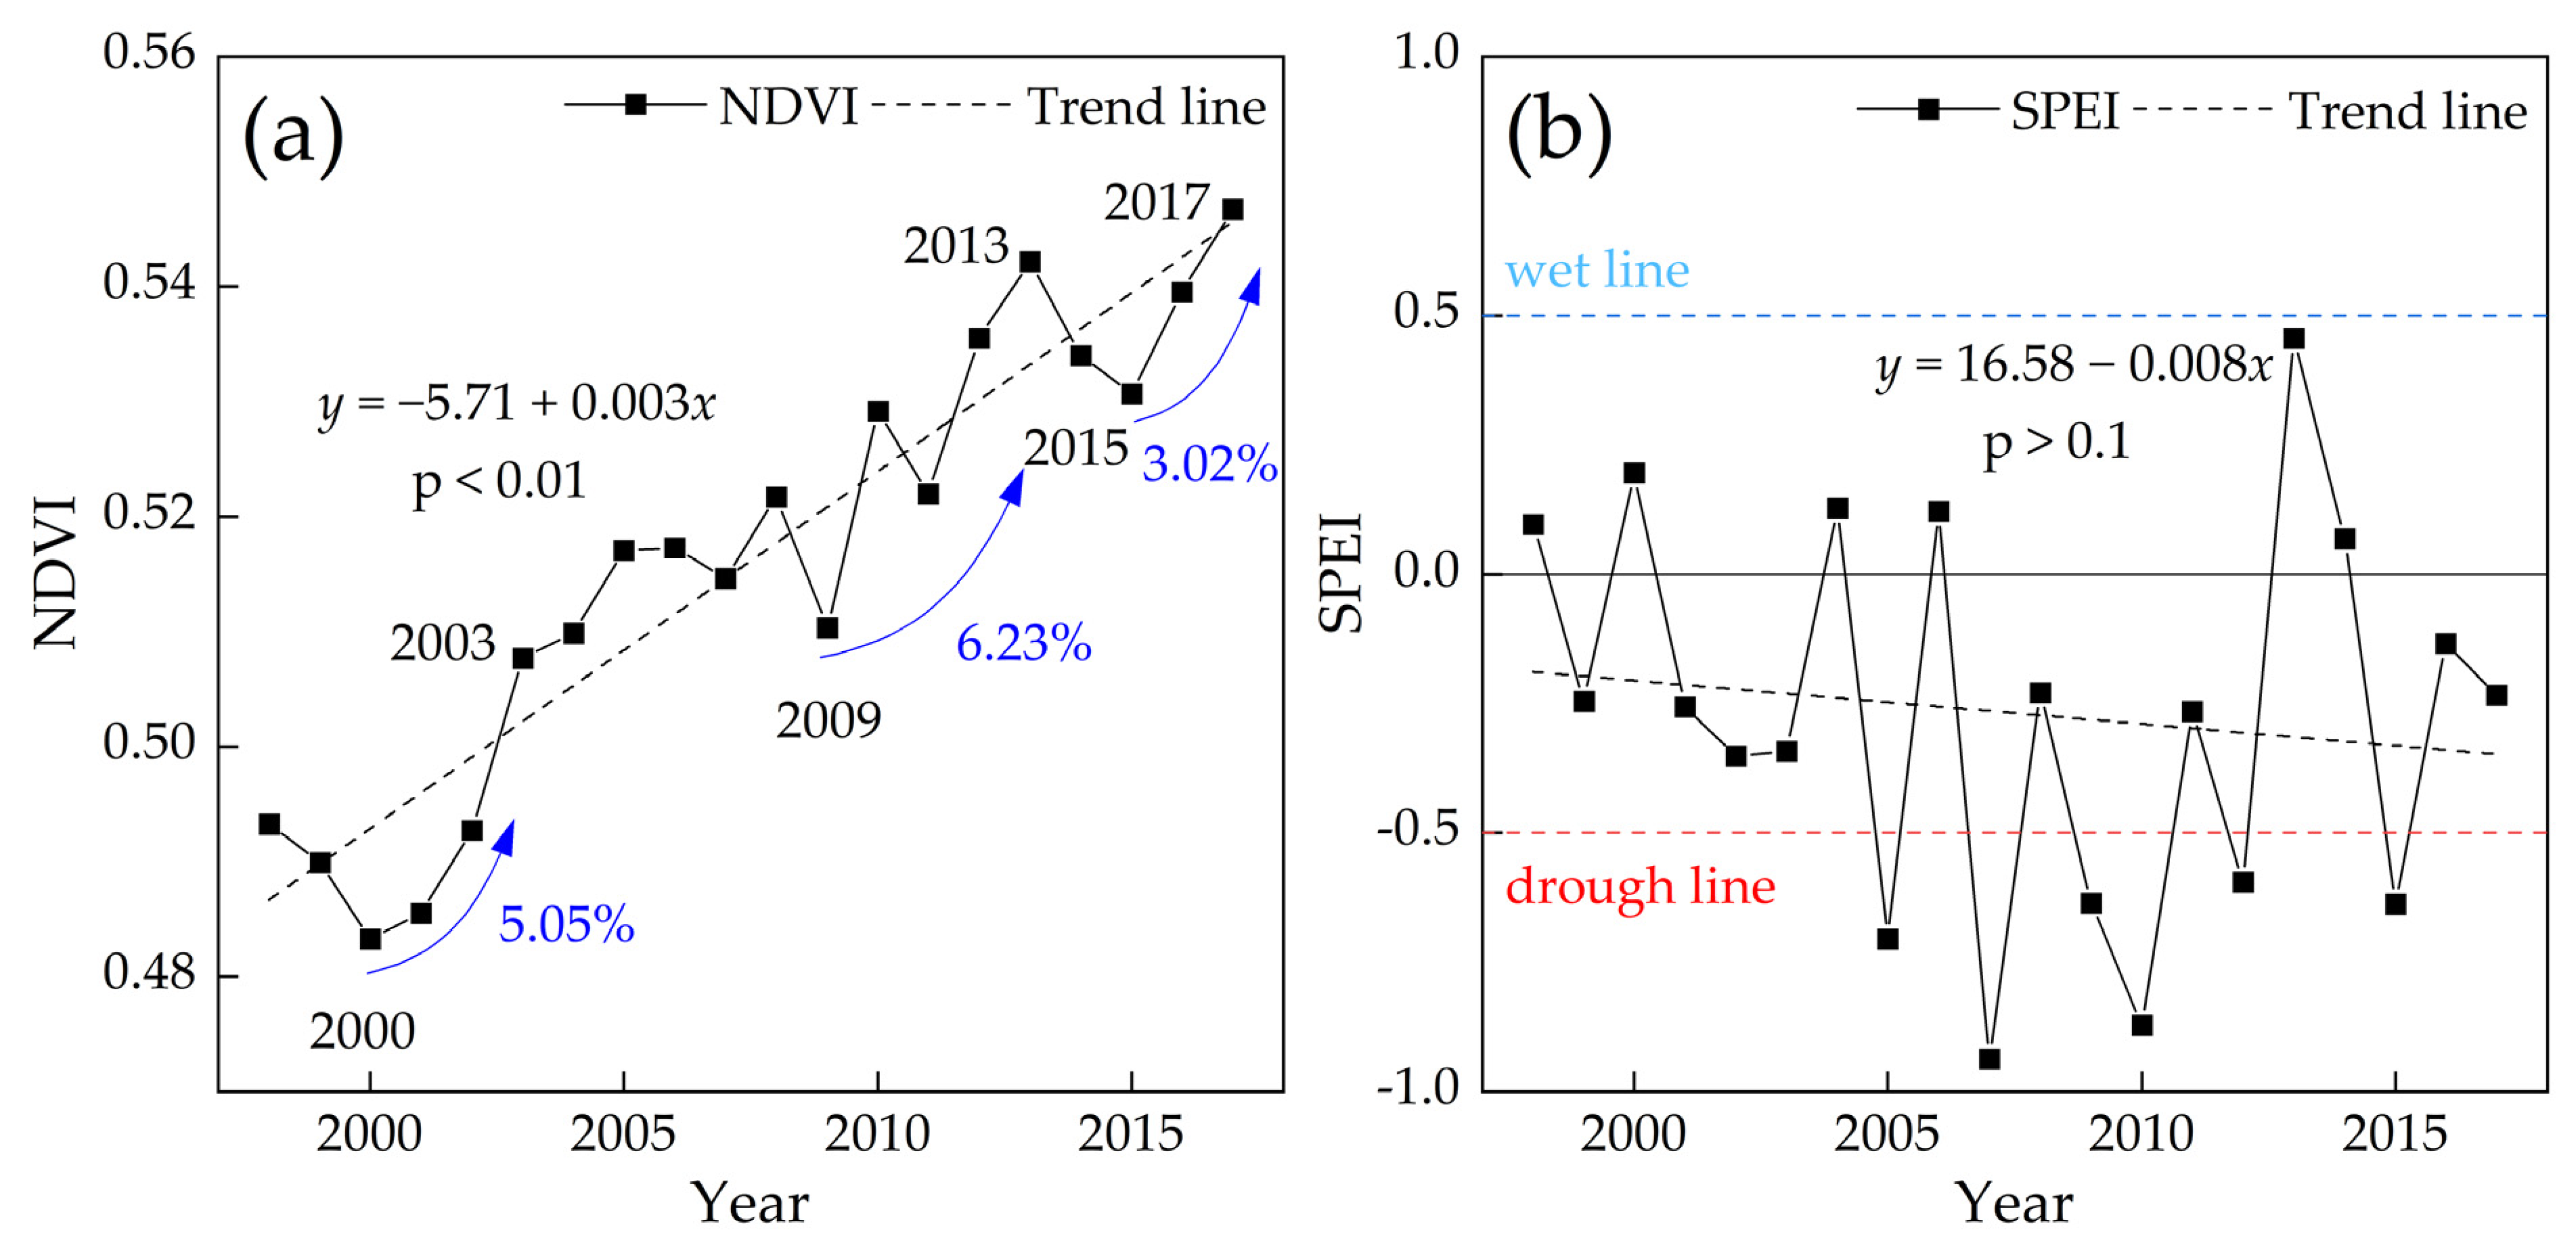
3.1.1. Spatiotemporal NDVI and SPEI Variations

During the period from 1998–2017, the mean annual NDVI across China ranged from 0.483–0.547 and increased significantly (p < 0.01) at a rate of 0.003 year−1 (Figure 2a). From 1998–2017, the interannual variation of NDVI showed three acceleration periods: 2000–2003, 2009–2013, and 2015–2017, with increase rates of 5.05%, 6.23%, and 3.02%, respectively. From 1998–2017, the NDVI declined in some years; however, the declines were relatively insignificant. For example, NDVI decreased by 2.03%, 2.18%, and 2.12% in 1998–2000, 2008–2009, and 2013–2015, respectively. These results indicate that the vegetation cover in China showed a very significant recovery trend from 1998–2017.
The mean annual SPEI for the whole of China fluctuated between −0.94 and 0.46 during 1998–2017 and decreased at a rate of 0.008 year−1 (Figure 2b). A given threshold level of ±0.5% was obtained according to the SPEI categorization standard, which was used to distinguish wet, drought, and normal conditions. From 1998–2017, 30% of the years had an SPEI of <−0.5, showing moderate drought. The drought period was mainly concentrated in 2005–2010, and most years had moderate conditions (66.67%); 2007 was the driest year in the past 20 years. These results suggest that China is developing toward aridification; however, the trend was not significant (p > 0.1).
From 1998–2017, the annual change trend of NDVI in China ranged from −0.47 to 0.52/10 years (Figure 3a), 71.02% of the regions showed an upward trend, and 22.97% (mainly distributed in densely populated coastal areas and CB) exhibited a downward trend. According to the significance test (Figure 3b), 55.96% of the regional annual NDVI in China showed a significant upward trend in the 90% confidence interval, and only 8.93% of the regional annual NDVI showed a significant decreasing trend (|Z| > 1.64), indicating that vegetation coverage in China improved significantly from 1998–2017.
From 1998–2017, the annual change trend of SPEI in China ranged from −1.22 to 1.47/10 years, with an increasing trend in 34.92% of the regions and a decreasing trend in 65.08% of the regions, indicating that the arid area in China was much larger than the humid area in 1998–2017 (Figure 3c). In China, 91.23% of the regions showed insignificant changes in SPEI, and regions with insignificant increases and decreases accounted for 31.34% and 59.89%, respectively (Figure 3d). This indicates that there was a trend of aridity in most areas of China over the past two decades; however, the overall trend was insignificant.
Comparison of NDVI changes in the nine river basins of China (Figure 4a) showed that the basins with the most obvious vegetation restoration decreased in the following order: PRB > SLRB > YRB > YARB > SER > HRB > SWR > HURB > CB. In the PRB, 93.13% of the regions showed an upward trend in NDVI, among which 78.08% showed a significant upward trend (|Z| > 2.58) and 6.45% showed an insignificant upward trend (|Z| < 1.64). In the SLRB, 91.76% of the regions showed an upward trend in NDVI, and 68.42%, 9.10%, 3.15%, and 11.09% showed an extremely significant, significant, weakly significant, and insignificant increase in NDVI, respectively. The CB had the lowest vegetation restoration (46.13%), and only 21.61% of the regions had a significant increasing trend (|Z| > 1.64). In addition, 13.77% of the NDVI had no change over the past two decades. These results indicate that there are some differences in the overall vegetation restoration in China. Vegetation restoration in the central and eastern regions showed a significant trend, among which the vegetation restoration in the HURB was relatively poor, with an increasing trend of NDVI in only 77.34% of the regions. Vegetation degradation in the northwest region showed an insignificant trend, especially in the CB.
According to the comparison of the changes in SPEI in the nine basins in China (Figure 4b), the SPEI in the SWR increased significantly in 21.85% of the regions (|Z| > 1.64) and decreased significantly in 12.12% of the regions, indicating that the whole basin was developing toward wetter conditions. In the CB and HURB, 50.04% and 52.74% of the regions showed a decreasing trend in SPEI, and an extremely significant increase was observed in <0.5% of the regions in the two basins, indicating minimal overall climate change in the basin. In the SLRB, YRB, HRB, PRB, SER, and YARB, there were 99.07%, 98.88%, 98.58%, 95.74%, 79.26%, and 64.04%, respectively, of the regional SPEI showing a decreasing trend. These results show that China as a whole is developing toward aridity; however, there are certain differences in wet–dry climate changes in different basins. For example, the southwest region is overall developing toward wetter conditions, especially in the SWR; in the northwest region, climate change is relatively small, especially in the CB; and in the central and eastern regions, the overall tendency is toward drought.

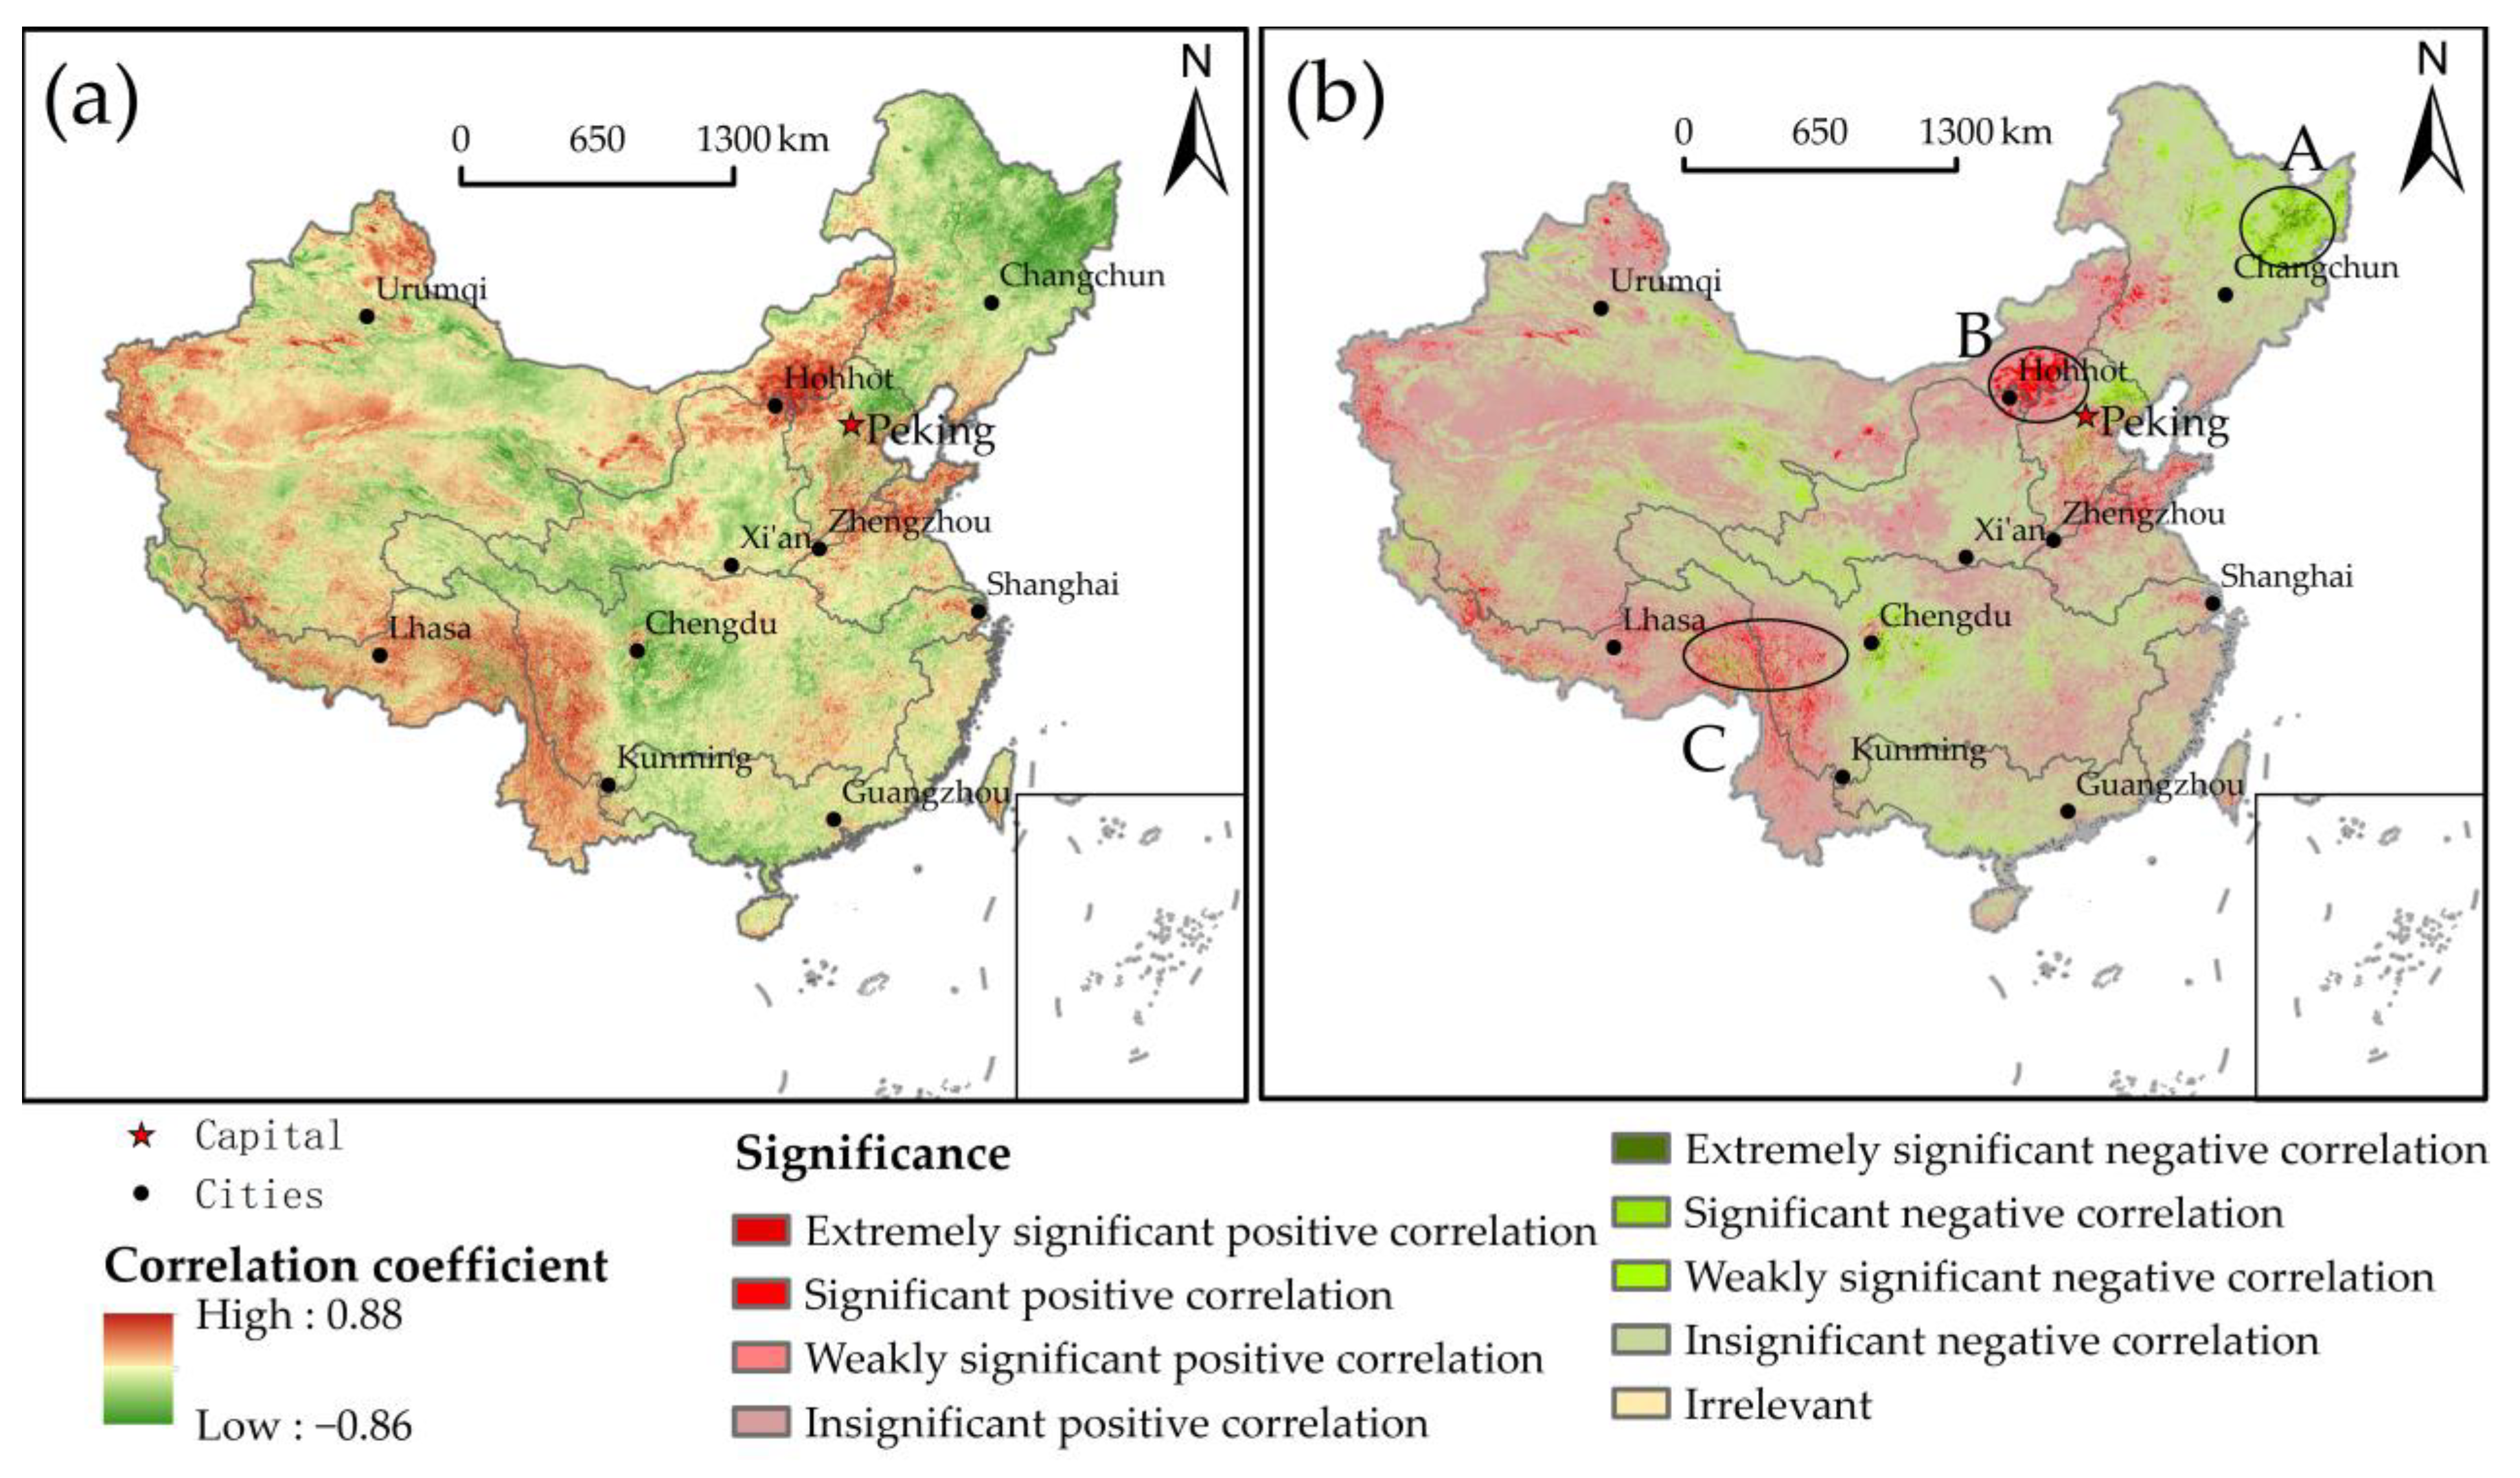
3.1.2. Correlation Analysis between NDVI and SPEI

The spatial distribution range of the correlation coefficient between the annual NDVI and annual SPEI in China was −0.86 to 0.88 (Figure 5a), and 47.17% and 52.83% of regions had positive and negative correlations, respectively (Figure 5b). Among them, the SWR, HURB, CB, and HRB were mainly positively correlated, and the area percentages were 71.37%, 59.07%, 55.36%, and 51.87%, respectively. The SLRB, PRB, YARB, YRB, and SER were mainly negatively correlated, and the area percentages were 77.15%, 70.24%, 58.05%, 57.29%, and 53.82%, respectively. In addition, 5.21% and 4.80% of regions had significant positive and negative correlations (p < 0.1), respectively, in China. Among them, the regions with significant positive correlation (p < 0.1) were mainly distributed in the SWR (14.19%), HRB (12.78%), and HURB (9.33%). The regions with significant negative correlation were mainly distributed in the SLRB (12.55%). In summary, in most areas of China in the past 20 years, SPEI has shown an insignificant decreasing trend with the increase in NDVI; however, the proportion of the area with a significant positive (p < 0.1) correlation between NDVI and SPEI was greater than the proportion of the area with a significant negative correlation. According to Figure 3, it can be considered that areas with good vegetation restoration or frequent human activities tended to develop toward aridification; i.e., SPEI showed a downward trend. In areas with degraded vegetation or complex terrain and higher elevations, SPEI tended to develop toward humidification; i.e., SPEI showed an upward trend. This indicates that vegetation restoration will aggravate drought in the study region to a certain extent.

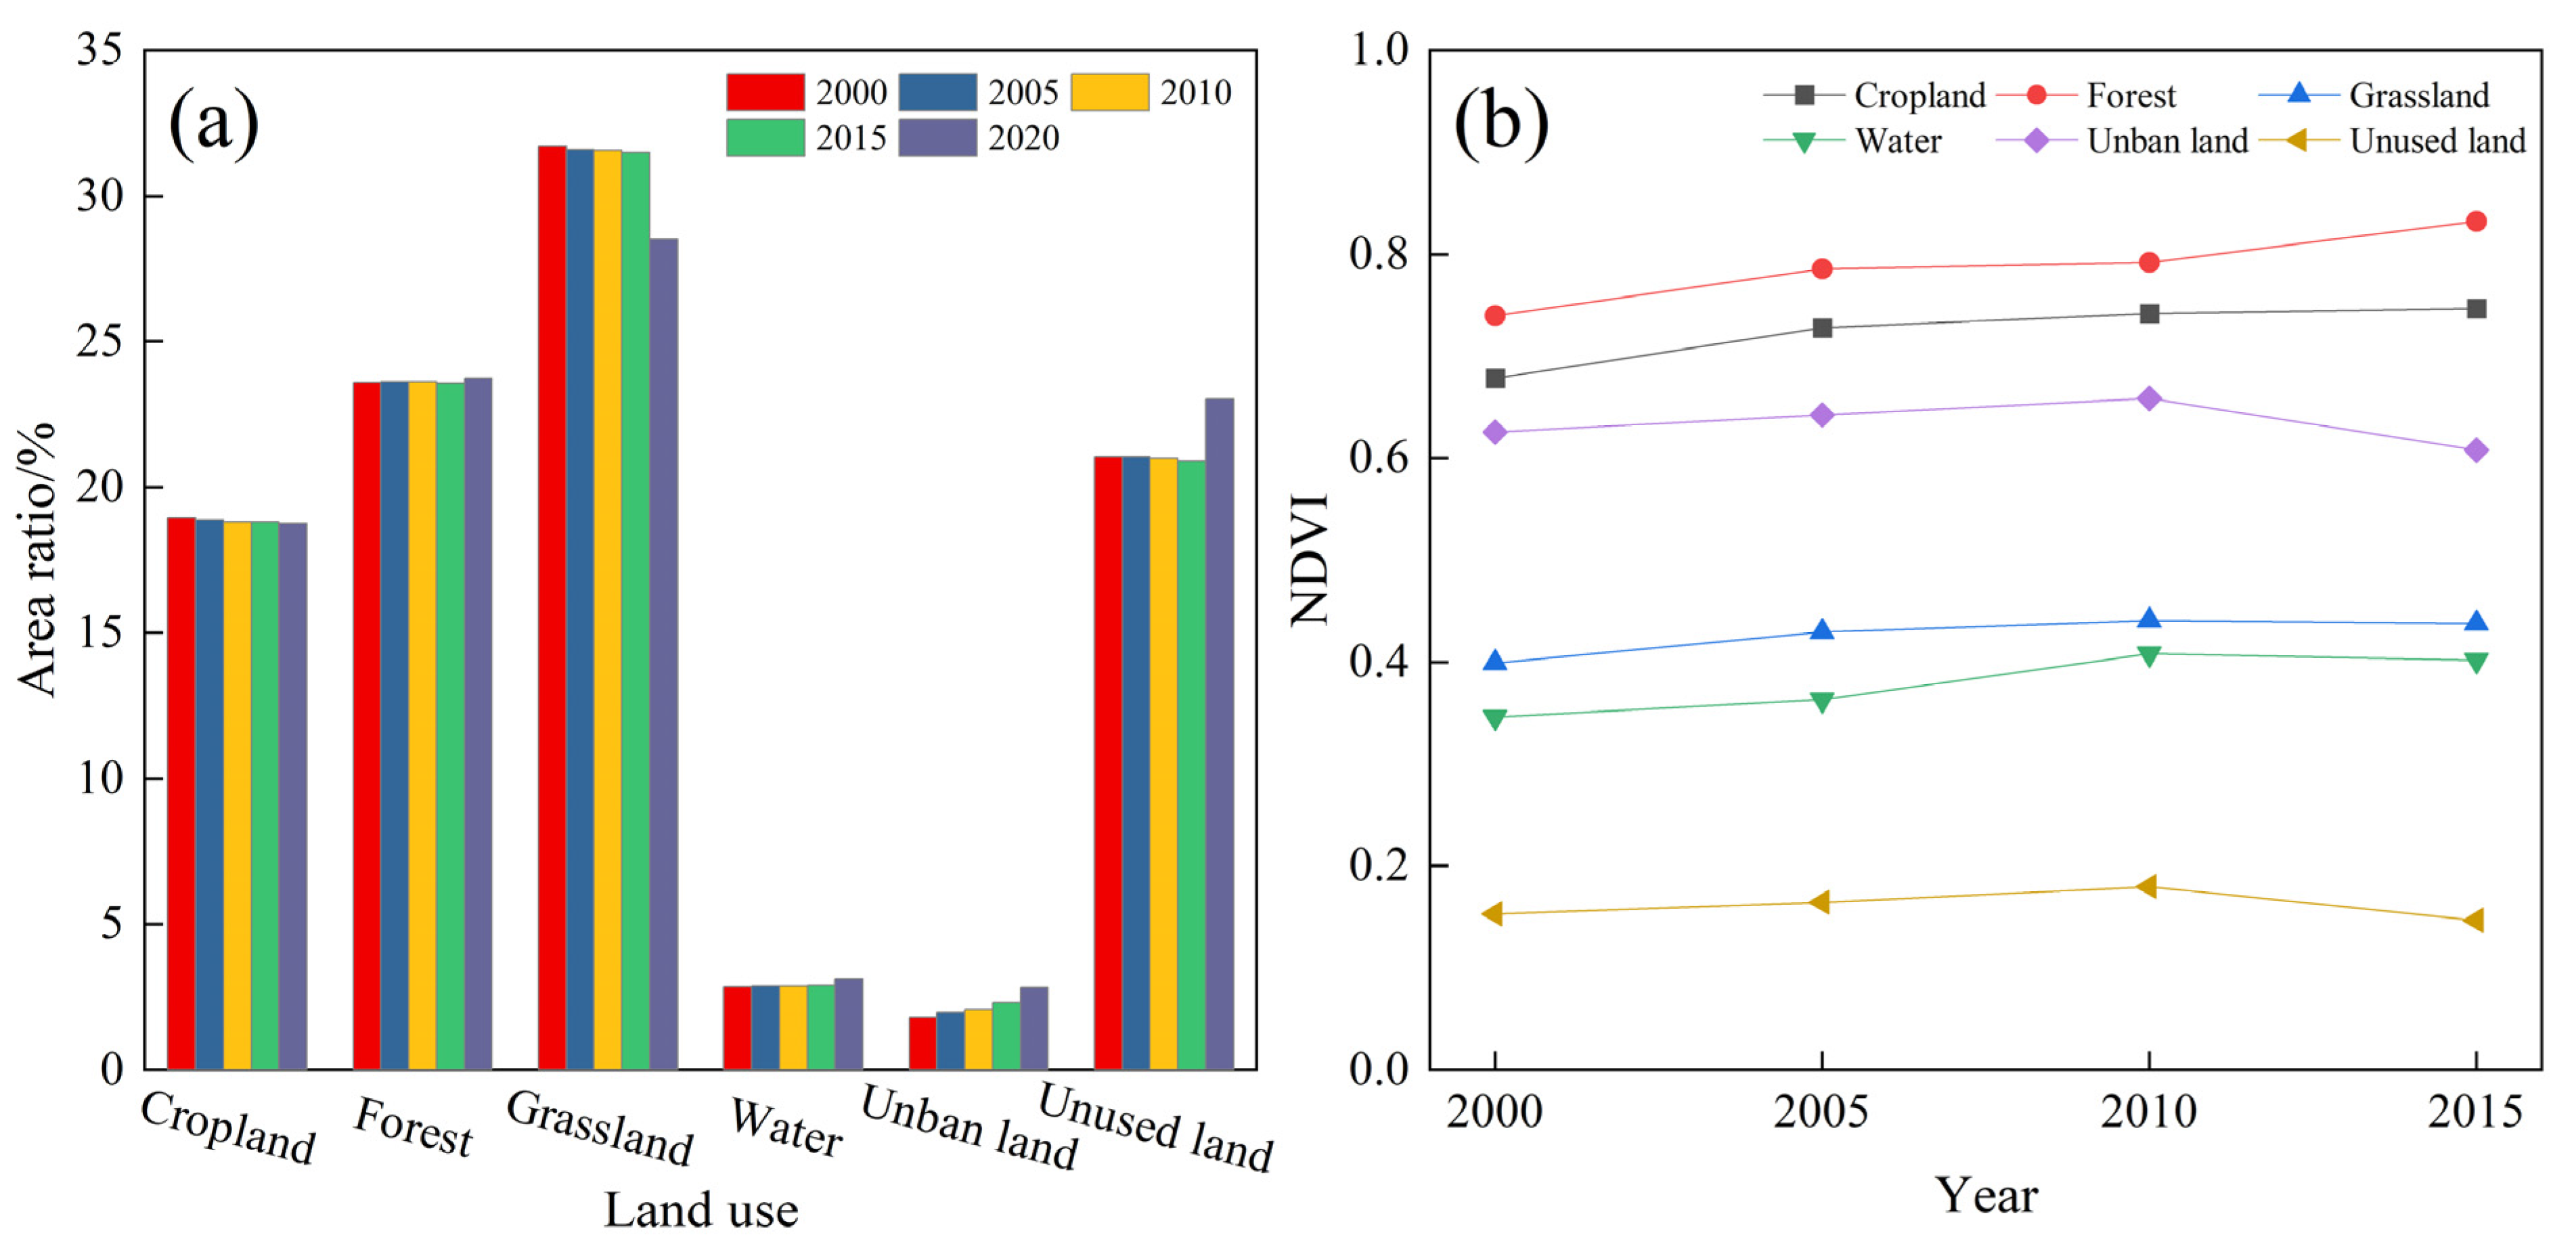
3.2. Impact of Human Activities on NDVI

From 2000–2020, LUCC in China underwent significant changes; the area of each LUCC type decreased in the following order: grassland > forest > unused land > cropland > water > urban land (Figure 6a). In the past two decades, the area of grassland and cropland in China decreased by 0.88% and 9.94%, respectively. Forest, water, urban land, and unused land areas increased by 0.87%, 9.41%, 56.55%, and 9.51%, respectively. As shown in Figure 6b, the mean annual NDVI values of each LUCC type in China decreased as forest (0.787) > cropland (0.724) > urban land (0.634) > grassland (0.427) > water (0.380) > unused land (0.161). Since 2000, the mean annual NDVI values of cropland, forest, grassland, and water increased to 0.068, 0.092, 0.038, and 0.056, respectively; however, the NDVI values of urban land and unused land decreased to 0.018 and 0.007, respectively. In addition, the NDVI values of cropland and forest showed increasing trends from 2000–2015. The NDVI values of grassland, water, urban land, and unused land all reached their maximum values (i.e., 0.441, 0.408, 0.659, and 0.180, respectively) in 2010.
In general, LUCC types in China have undergone major changes to a certain extent [60]. Human activities have affected vegetation cover in China in both directions (destruction and restoration). In the past two decades, the increase in the area of forest in China promoted vegetation restoration, resulting in a significant increase in the NDVI of these regions; however, the increase in the area of urban land and unused land hindered vegetation restoration [61], resulting in a decrease in the NDVI of these regions.
As shown in Figure 7, the fourth NDVI category (0.75–1) accounted for the largest proportions of cropland and forest (i.e., 54.73% and 79.87%, respectively), followed by the third NDVI category (0.5–0.75), which accounted for 38.70% and 17.88%, respectively. The first NDVI category (0–0.25) accounted for the largest proportions of grassland, water, and unused land (i.e., 35.05%, 46.85%, and 84.02%, respectively). In urban land, the third (0.5–0.75) and fourth (0.75–1) NDVI categories accounted for 78.29%; the fourth NDVI category accounted for the largest proportion (45.35%).
In addition, there were certain differences in the correlation between NDVI and SPEI for various LUCC types at different coverage levels. In terms of the correlation ranges between NDVI and SPEI, cropland, forest, grassland, water, urban land, and unused land all had the largest distribution ranges in the third NDVI category (0.5–0.75), which were −0.744 to 0.865, −0.739 to 0.817, −0.694 to 0.829, −0.777 to 0.821, −0.739 to 0.883, and −0.705 to 0.789, respectively. In terms of the proportions of correlated areas, cropland, forest, grassland, water, and urban land accounted for the largest proportions of positive correlations between NDVI and SPEI in the second NDVI category (0.25–0.5), which were 62.55%, 60.84%, 61.09%, 54.06%, and 63.58%, respectively. In the first NDVI category (0–0.25), unused land accounted for the largest proportion (i.e., 54.24%) of the positive correlation between NDVI and SPEI. Cropland, forest, grassland, water, urban land, and unused land accounted for the largest proportions of negatively correlated areas in the fourth NDVI category (0.5–0.75), which were 68.11%, 62.83%, 66.40%, 67.93%, 57.52%, and 84.92%, respectively (Figure 7).
In general, when the degree of vegetation coverage was low, NDVI and SPEI were positively correlated overall; i.e., humidification promoted vegetation growth. Based on the spatial relationship between the NDVI value of vegetation and precipitation in northern Xinjiang, Liu et al. [62] studied the response of low-coverage vegetation to the temporal distribution pattern of precipitation in this area, and the results show that when the amount of precipitation is low, the vegetation tends to degenerate. This result is somewhat similar to the results of this study. When the vegetation cover degree was high, NDVI and SPEI were negatively correlated; i.e., aridification promoted vegetation growth [63]. Guo et al. [64] studied the response of vegetation with high coverage to precipitation and temperature in China’s Qilian Mountain Nature Reserve, and the results show that there is a significant positive correlation between NDVI and temperature on an annual scale. This result is completely consistent with the results of this study on the NDVI of high-coverage vegetation with climate change.

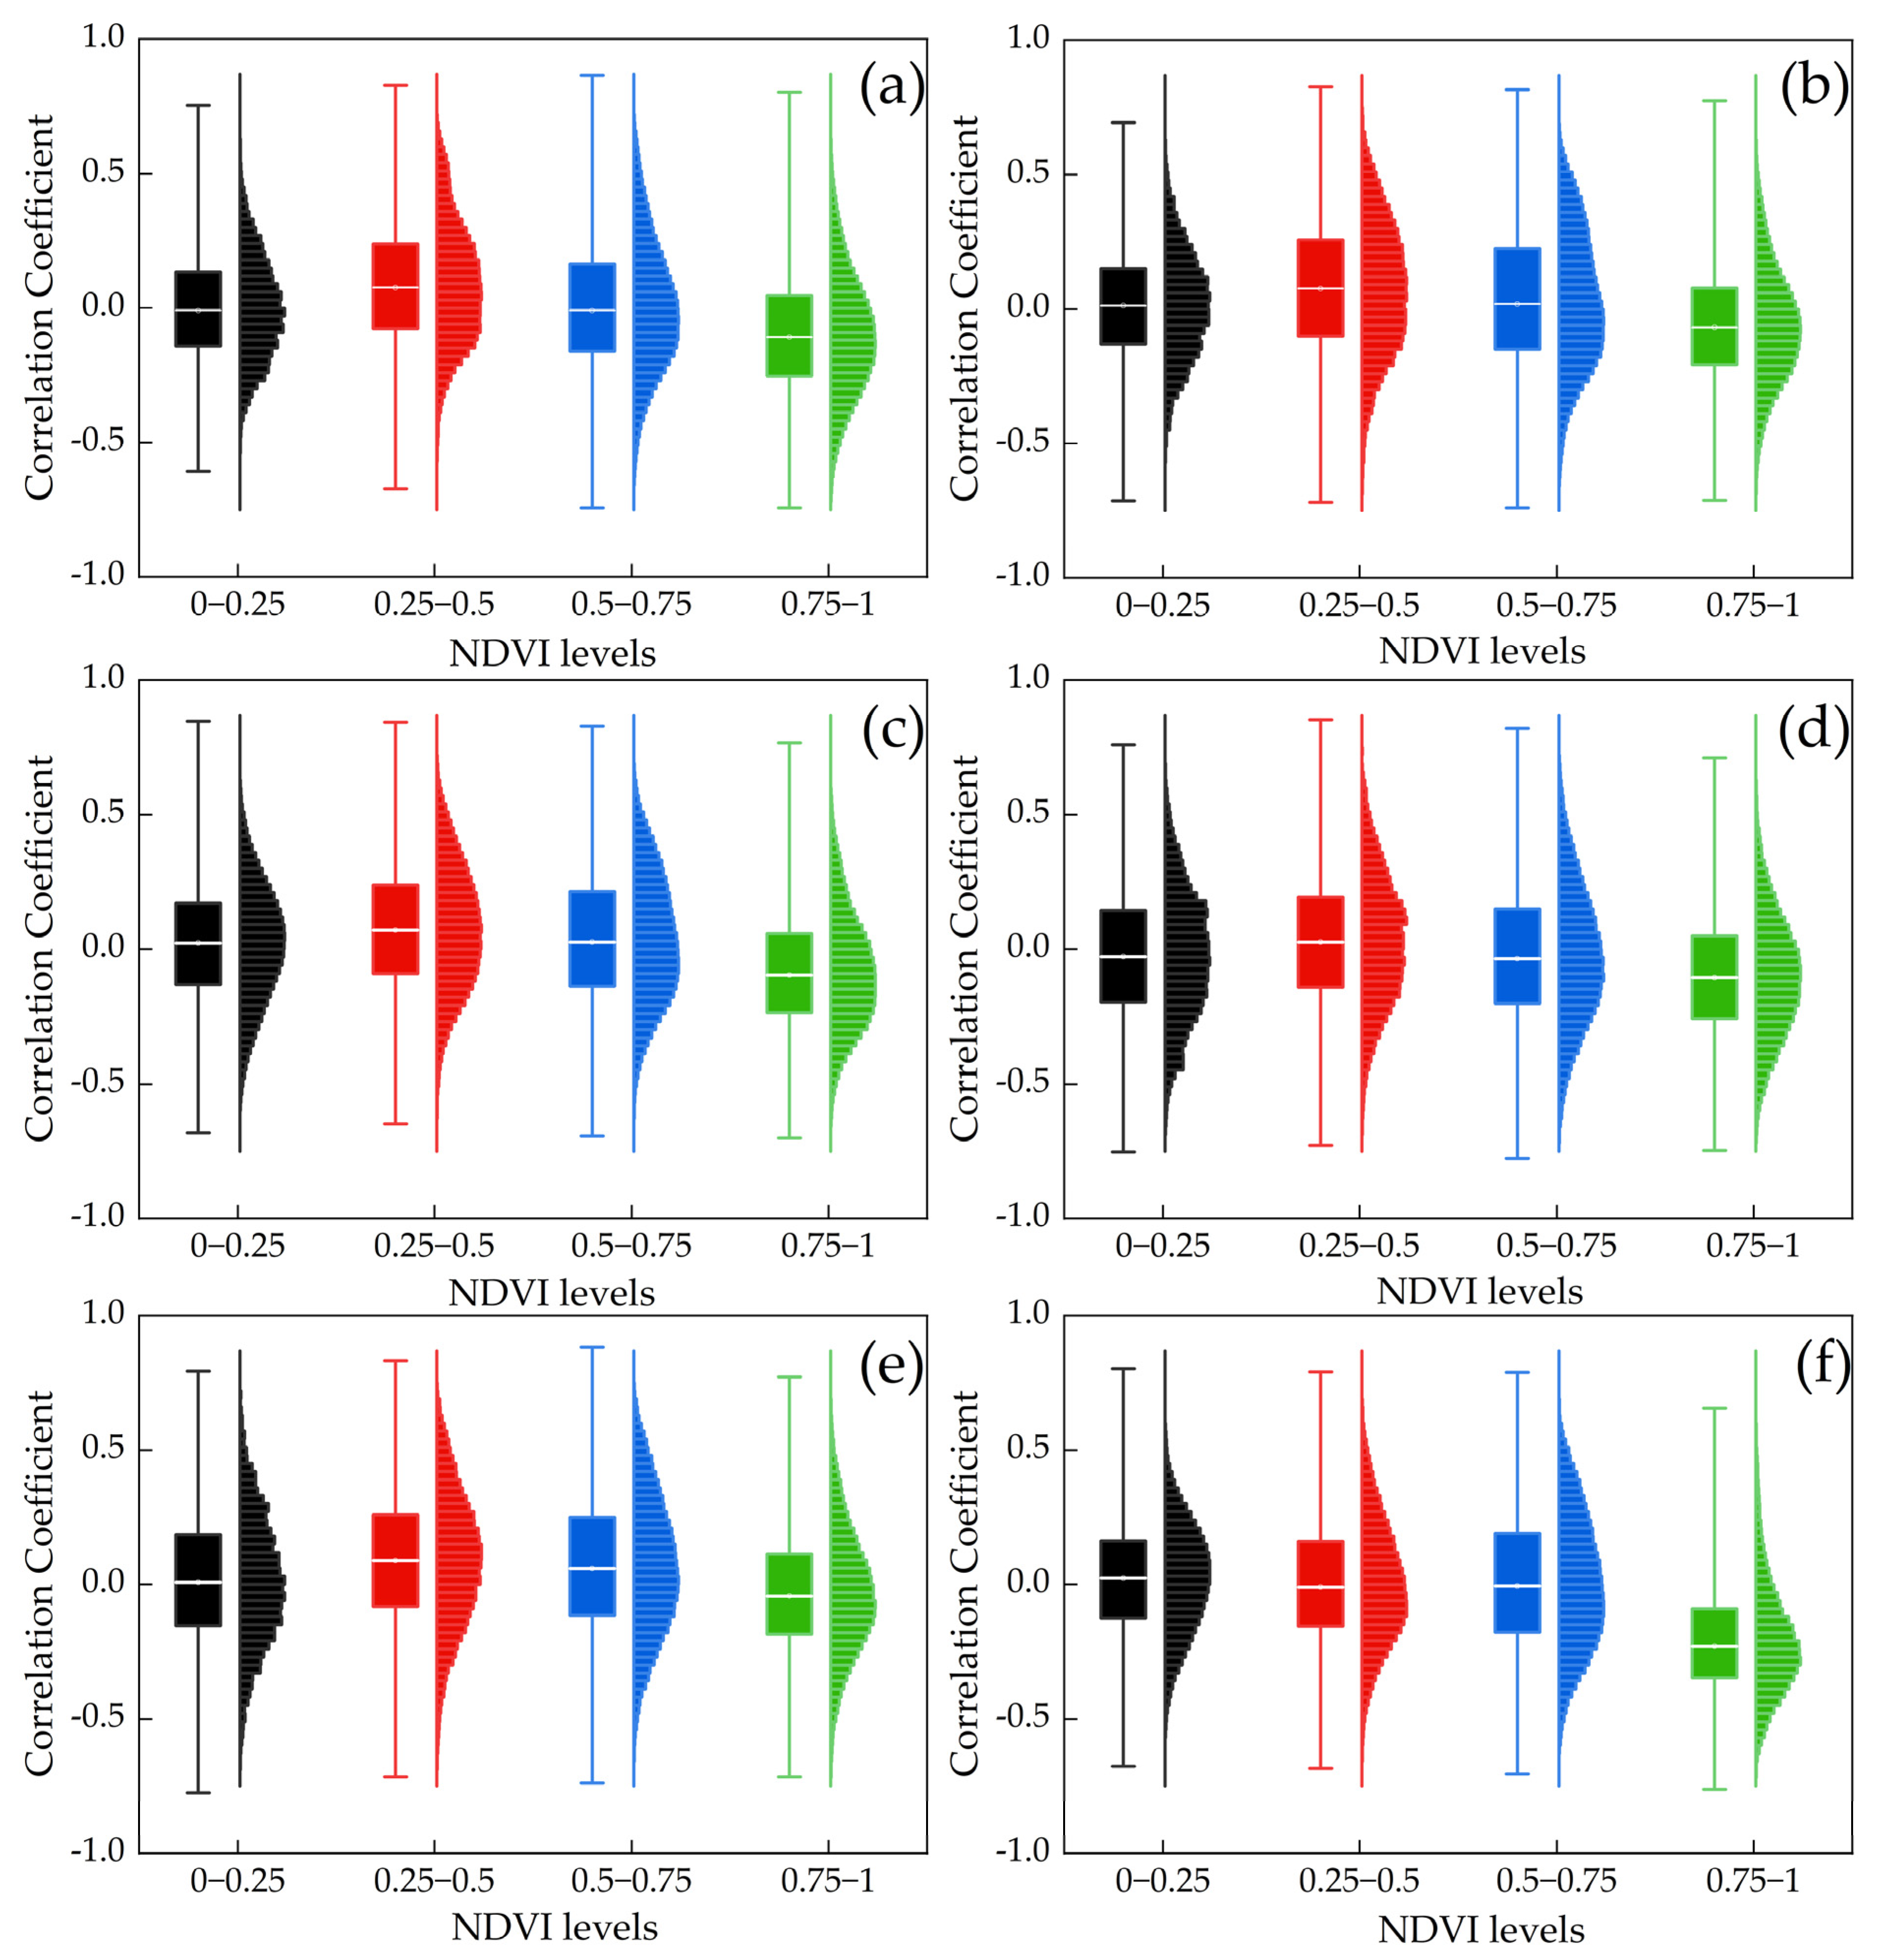
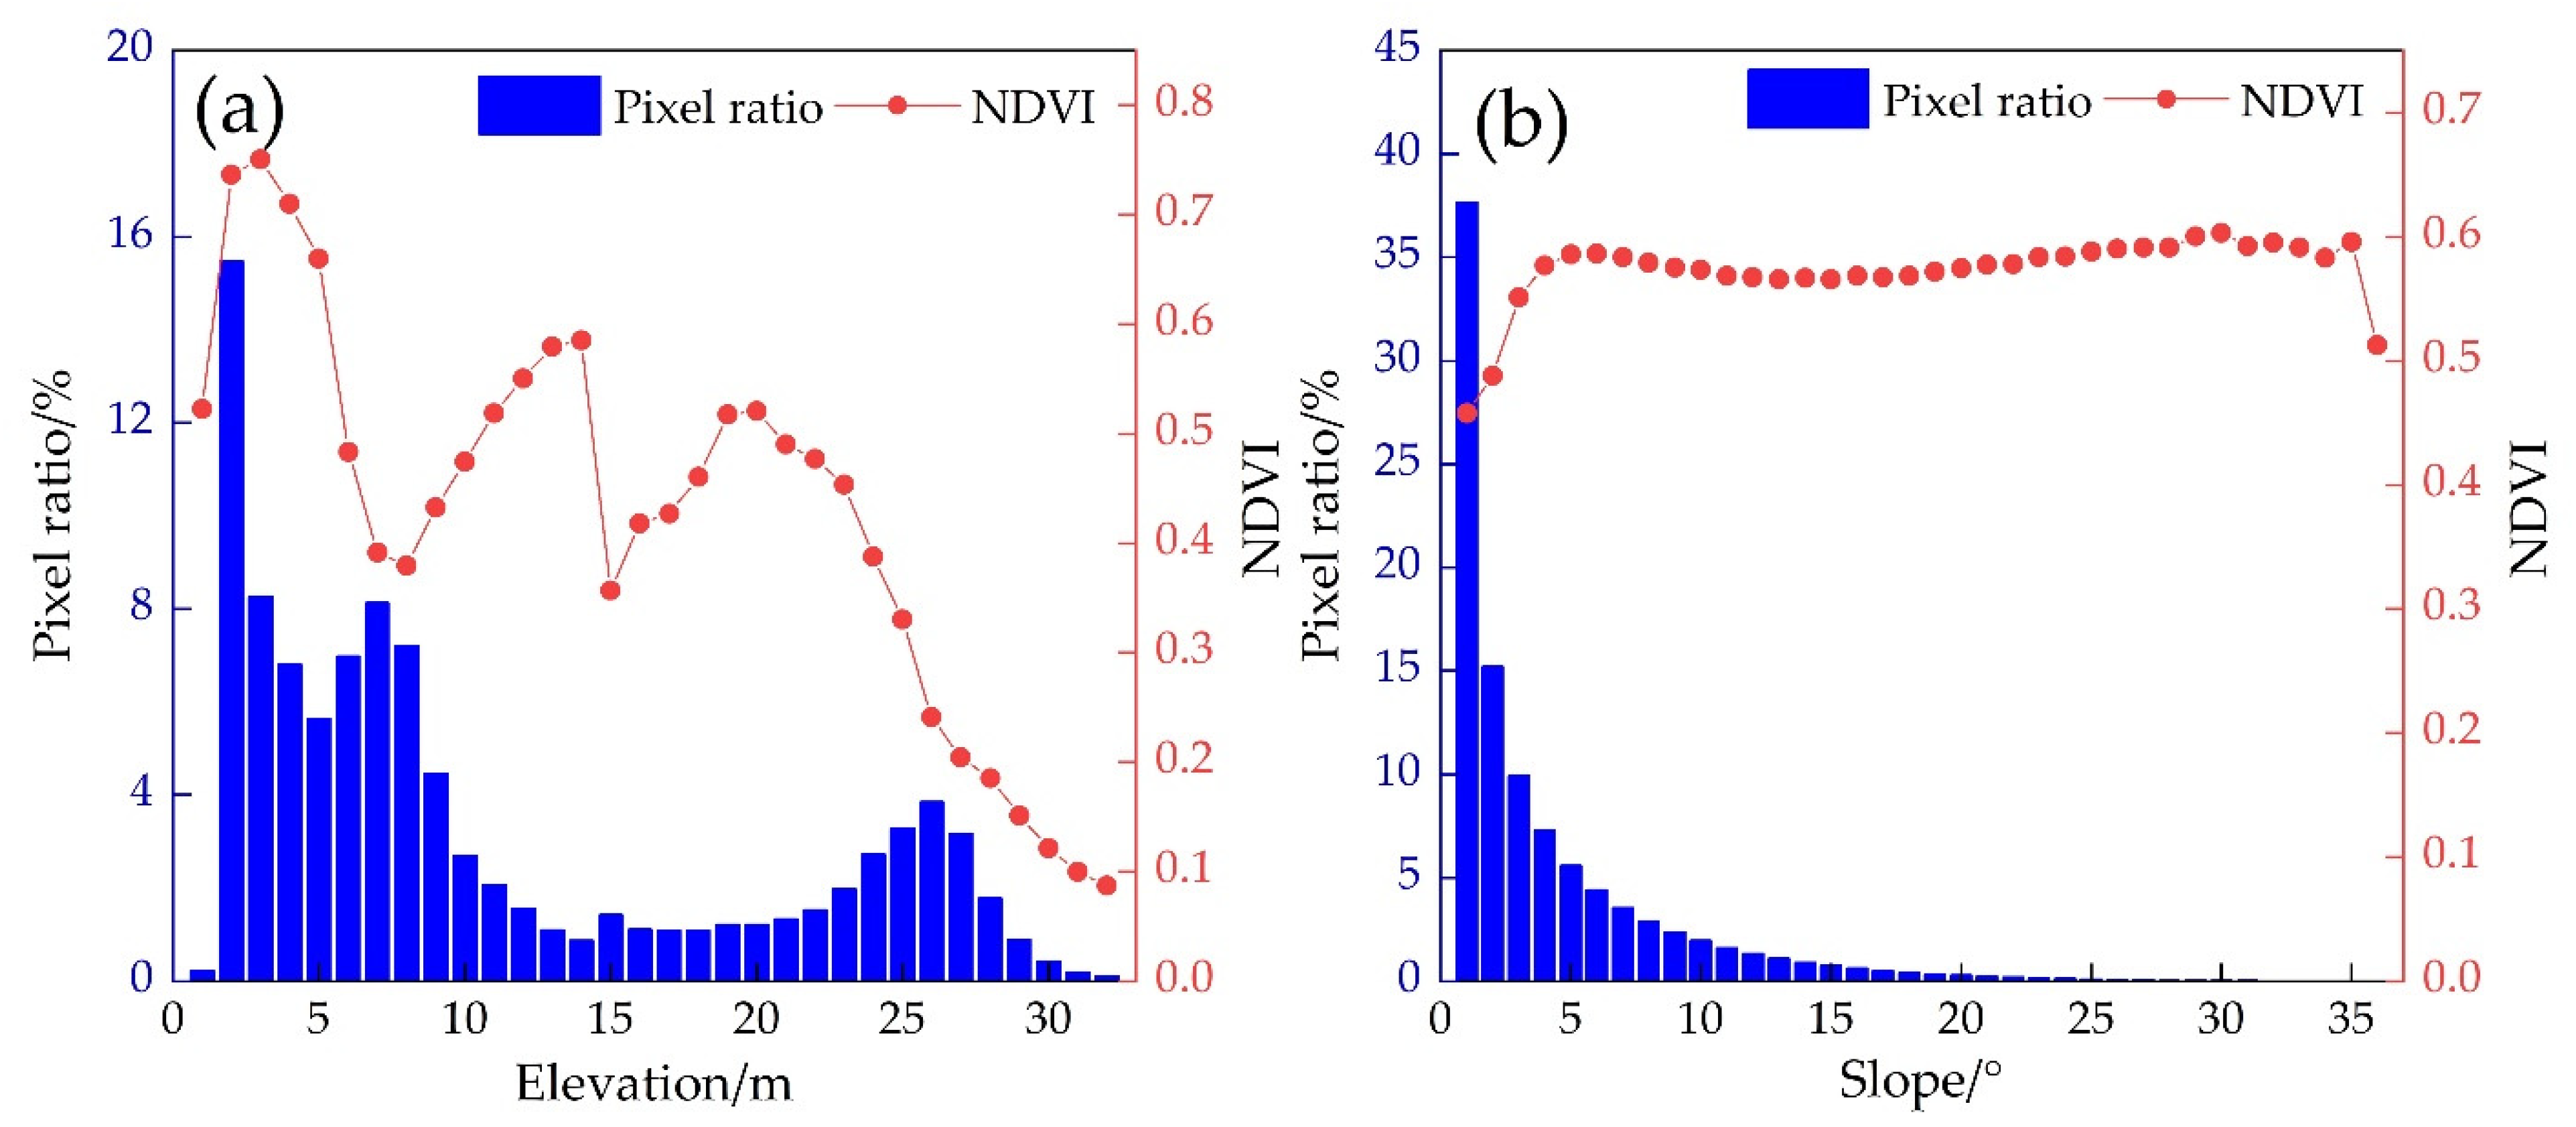
3.3. Effects of Topography on NDVI

The terrain in China is higher in the west and lower in the east, with the highest elevation reaching 8405 m. High-altitude areas are mainly distributed in the Qinghai–Tibet Plateau, and low-altitude areas are mainly distributed in the eastern coastal area (Figure 1c). The elevation is mainly from 0–2400 m, and the proportion of the area within this elevation range reaches 70.38% of the entire study area (Figure 8a). NDVI values varied with different elevation zones. At elevations < 400 m, NDVI values increased rapidly with the increase in elevation and reached a maximum of 0.75 at the 200–400 m elevation zone. With elevation between 400 and 1400 m, NDVI values showed a rapid downward trend, and the first minimum point of NDVI values was 0.75 (at the 1200–1400 m elevation zone). With elevation between 1400 and 3800 m, NDVI values fluctuated between 0.35 and 0.59, and the second minimum point of NDVI values was 0.36 (at elevations 2600–2800 m). At elevations > 3800 m, the NDVI values decreased rapidly with an increase in elevation, and when elevation exceeded 5800 m, the NDVI values were extremely small, i.e., close to 0.1.
The slope in China is dominated by areas < 10°, accounting for 90.92% of the total area, mainly in the north and middle east (Figure 1d). The NDVI value presents a bimodal curve with an increase in slope (Figure 8b). When the slope was between 0° and 6°, NDVI values increased rapidly with an increase in slope. In the 0°–1° slope zone, the minimum NDVI value was 0.458. In the 5°–6° slope zone, NDVI values reached a maximum value of 0.587. When the slope was between 6° and 30°, the NDVI values were from 0.566–0.603, showing a fluctuating and increasing trend. When the slope was >30°, the NDVI values gradually decreased with an increase in the slope, especially when the slope was >35°, and rapidly decreased to 0.513.
Through the grid, a scatter plot of the correlation between the NDVI and SPEI in China with elevation and slope from 1998–2017 was constructed (Figure 9). According to our research, when the elevation was <6000 m, the correlation coefficient between NDVI and SPEI fluctuated at a rate of 0.001 as the elevation increased. When the elevation was between 6000 and 8000 m, the correlation coefficient between NDVI and SPEI increased significantly (p < 0.01) with elevation at a rate of 0.034. When the elevation was >8000 m, the correlation coefficient between NDVI and SPEI decreased rapidly with increasing elevation (Figure 9a). The results comprehensively show that with the increase in elevation, the impact of human activities on vegetation gradually decreased, especially at elevations from 6000–8000 m. However, when the elevation exceeded 8000 m, the plateau and mountain areas were covered with snow and ice all year round, the climate was cold, and the vegetation coverage rate was low. Hence, short-term and small-scale climate change has had less impact on high-altitude vegetation.
When the slope was <30°, the correlation coefficient of NDVI and SPEI increased at a rate of 0.003 with an increase in the slope. When the slope was 30°–45°, the correlation coefficient of NDVI and SPEI increased significantly (p < 0.01) with the increase in the slope at a rate of 0.005; when the slope was >45°, the correlation coefficient between NDVI and SPEI decreased rapidly with the increase in the slope (Figure 9b). Combined with Figure 1d, in southwestern China (the Qinghai–Tibet Plateau and the middle reaches of the YARB), the correlation between NDVI and SPEI responded significantly to changes in slope. In the eastern coastal areas and northwestern regions (i.e., the CB, the HURB, and the SLRB), the correlations between NDVI and SPEI did not respond significantly to changes in slope.

4. Discussion

4.1. Impact of Climate Change on Vegetation Change

Based on grid cells, we analyzed the correlations between NDVI and SPEI in China and found that NDVI and SPEI were significantly correlated (p < 0.1) in only 10.01% of the regions (Figure 5). This result indicated that climate change has had minimal impact on vegetation changes in the past two decades, and that ecological restoration projects implemented by the Chinese government have played leading roles in vegetation changes. However, the regions where NDVI and SPEI were significantly related were mainly concentrated in the Changbai Mountain, central Inner Mongolia, and central Qinghai–Tibet Plateau (corresponding to A, B, and C, respectively, in Figure 5b). Hence, it is necessary to explore the reasons for this phenomenon. Regions A, B, and C are all mountainous terrains with relatively high altitudes, especially region C, which is located on the Qinghai–Tibet Plateau with a mean elevation of >4000 m. This is consistent with our findings that the correlation between NDVI and SPEI showed an overall increasing trend with increases in elevation and slope (Figure 9) and indicates that as the complexity of the terrain has increased, the influence of human activities on vegetation changes has decreased. Moreover, there were differences in the responses of regions A, B, and C to climate change (Figure 10). In region A, NDVI and SPEI had a very significant positive correlation as a whole; however, NDVI and SPEI in regions B and C had a very significant negative correlation as a whole. This was mainly determined by climatic conditions. Region A belongs to the northern temperate humid continental monsoon climate zone. The mean annual temperature in the region is between −1 and 8 °C, and annual precipitation is between 450 and 1100 mm. Precipitation in this region can meet the ecological water demand of vegetation, and aridification is conducive to promoting photosynthesis, increasing net productivity and accelerating the release of soil nutrients [65,66]. Region B is an inland arid and semi-arid natural environment; precipitation is relatively low with annual precipitation of 200–400 mm. Owing to low precipitation, the ecological water demand of vegetation is often not readily met. Humidification can increase precipitation or reduce evaporation in the region to a certain extent and ensure the ecological water demand of vegetation [67,68]. Region C belongs to the plateau climate zone. This area is characterized by strong radiation and abundant sunshine. Humidification is conducive to improving the absorption and transportation of soil nutrients [69,70].
The results of this study are consistent with those of previous studies. For example, Wang et al. [71] and Zhang et al. [72] analyzed the characteristics of vegetation and climate change in the Changbai Mountains, and the results showed that under the combined influence of temperature and precipitation changes, the climate in the Changbai Mountains developed toward warming and humidification, and vegetation increased significantly. Nanzad et al. [73] analyzed the sensitivity of vegetation changes to temperature and precipitation in Inner Mongolia, and the results showed that vegetation changes in this region were very sensitive to temperature and precipitation, and that increases in precipitation and decreases in temperature were more beneficial for vegetation restoration. Li et al. [74] studied the sensitivity of the vegetation on the Qinghai–Tibet Plateau to climate change, and the results showed that the alpine grassland on the Qinghai–Tibet Plateau is highly sensitive to climate change, and that the central region is mainly affected by the combined effects of radiation and temperature changes. Evidently, climate change has had an immense impact on the evolution of vegetation in high-altitude areas in China. However, the means by which to separate human activities and only consider the impact of climate change on vegetation change is a problem that needs to be resolved in future research.

4.2. Impact of Human Activities on Vegetation Changes

Human activities affected vegetation cover in China in the directions of both destruction and restoration. According to Figure 6, on the one hand, the ecological restoration project has greatly increased the forest area and increased the NDVI value of cropland, forest, grassland, and water. On the other hand, with the increase in population and economic development, urban and unused land increased significantly [75,76], and the NDVI values of these two LUCC types decreased. In addition, different vegetation types have different xylem structures, rooting habits, stomatal regulation, and water utilization strategies in different degrees of coverage; therefore, they exhibit different responses to climate change and human activities [77]. When the degree of vegetation coverage was low, there was a positive correlation between NDVI and SPEI overall; i.e., humidification can promote vegetation growth, indicating that low-coverage vegetation was more sensitive to drought. When the vegetation coverage degree was high, NDVI and SPEI were negatively correlated; i.e., aridification can promote vegetation growth, indicating that high-coverage vegetation has strong drought resistance (Figure 7). These findings provide a reference for future research in other areas of the world.
Vegetation is comprehensively affected by various meteorological factors, such as precipitation, evaporation, and temperature, and the sensitivity of various vegetation types to different meteorological factors differs. For example, the forests and alpine grasslands of the Qinghai–Tibet Plateau are more sensitive to temperature changes [74], and the desert vegetation in northern China has become more sensitive to precipitation [78]. However, the drought index only reflects the degree of the water deficit, and it is difficult to reflect the cause of the water deficit [79]. Hence, it is necessary to combine local hydrological, geological, and climatic conditions in future research to reveal the response mechanism of regional vegetation evolution, especially in small areas [77]. In general, for a large area, the correlation between NDVI and SPEI of different vegetation types revealed the response of vegetation changes to climate change and human activities. However, for small areas, actual local hydrogeological conditions should also be considered.

4.3. Suggestions for Vegetation Restoration

The Grain for Green Program is one of the most important engineering measures for vegetation restoration in China in recent years. However, in the context of global warming, China has been in a trend of aridification in the past two decades. The increase in the forest area will undoubtedly increase the ecological water demand of vegetation, which will bring great challenges to water resource allocation in China. Hence, the impact of vegetation on water resources requires further study. In addition, many studies have shown that large-scale reforestation may lead to reduced river runoff, reduced water storage capacity, and changes in local climate conditions [80,81]. Therefore, in the process of vegetation restoration, we should not only consider increasing the greening rate or vegetation coverage rate, but also consider the local climate environment, hydrological scenario, human activities, and other factors [77]. In addition to reforestation, rational utilization of cropland (such as rotation and intercropping) and enhancement of grassland protection (such as setting a reasonable livestock carrying capacity) can increase soil properties, protect soil from erosion [82], and increase the NDVI values of cropland and grassland [83,84].
Destruction of vegetation by human activities was mainly reflected in urban expansion and desertification. Accelerated urbanization has led to problems such as LUCC change [85], landscape fragmentation [86], and degradation of ecological services [87]. Further research is needed to determine the means by which damage to vegetation during the process of urbanization can be reduced. Numerous studies have shown that urban green spaces can meet the needs of residents for rest and recreation to the greatest extent, improve the quality of life of residents, and increase the coverage of urban vegetation, with strong ecosystem service functions [88,89], such as reducing noise and air pollution, regulating the urban climate system, and mitigating climate warming [90,91,92]. In addition, with global warming, the climate in China is gradually becoming arid, accelerating the desertification process. Research shows that desertification has become a major environmental problem that restricts the sustainable development of society [93,94]. More than 1 billion people and over 100 countries worldwide are facing the threat of desertification [95]. Inner Mongolia is located in arid and semi-arid regions, which are the most severely desertified regions in China. According to statistics, land desertification in Inner Mongolia has developed rapidly since the 1990s, with > 76% of the land in Inner Mongolia suffering from desertification to varying degrees by 2017 [72,96]. To better prevent and control land desertification, scholars have proposed a series of prevention and control measures. For example, in Inner Mongolia, where grassland is the main area, proper grazing should be advocated, and the grazing time should be adjusted to 15–20 d to alleviate grassland desertification [42]. In addition, the government should strengthen its guiding and supervisory role [97] and increase investment in desertification monitoring, especially desertification early warning monitoring [98].

5. Conclusions

This study analyzed the spatiotemporal variation of NDVI in China and its influencing factors and explored the impact of different influencing factors on NDVI variation. The overall vegetation coverage in China has improved significantly from 1998–2017, especially in the PRB. From 1998–2017, the NDVI in China increased significantly (p < 0.01) at a rate of 0.003 year−1, and NDVI change has experienced three acceleration periods (i.e., 2000–2003, 2009–2013, and 2015–2017), each with a growth rate >3%. In the past two decades, vegetation improved in 71.02% of the areas in China, and only 22.97% had the problem of vegetation degradation. Climate change in China showed an insignificant drought trend. In the past 20 years, the SPEI in China decreased at a rate of 0.008 year−1, and 30% of the years experienced mild drought. Spatially, 39.92% of China’s regional SPEI showed an upward trend, and 60.08% of its regional SPEI showed a downward trend. In addition, 52.83% of regional NDVI in China was negatively correlated with SPEI, especially in the SLRB (77.15%) and PRB (70.24%).
Human activities have affected vegetation cover in China in two ways: destruction and restoration. Destruction of vegetation by human activities is mainly reflected in urban expansion and desertification. In the past two decades, the area of urban and unused land increased by 56.55% and 9.51%, respectively. In addition, LUCC change in China promoted the restoration of vegetation as a whole; the forest area increased by approximately 20,000 km2 in the past two decades, and the NDVI values of cropland, forest, grassland, and water increased by 0.068, 0.092, 0.038, and 0.056, respectively.
Finally, this study comprehensively discussed the influence of topography (elevation and slope) on NDVI and its correlation with SPEI. With the increase in elevation, NDVI values first increased, then decreased overall, and reached a maximum at the 200–400 m elevation zone. NDVI values presented a bimodal curve with increasing slope, reaching a maximum (0.603) in the 29°–30° zone. In addition, as the elevation and slope increased, the impact of human activities on vegetation decreased, and the correlation between NDVI and SPEI gradually increased. Based on the results of this study, we provide suggestions for vegetation restoration in China.
This study qualitatively analyzed the influences of climate change and human activities on the spatiotemporal variation of NDVI vegetation and provided corresponding support for China to carry out reforestation projects according to local conditions. However, when studying the impact of human activities on NDVI, only LUCC was considered, and the impact of other factors such as urbanization and desertification was not specifically considered. This issue needs to be studied further in the future. In addition, methods to quantitatively analyze the contribution of climate change and human activities to NDVI change should be explored in the future.

Author Contributions

Conceptualization, Y.L., J.T. and R.L.; methodology, Y.L. and J.T.; software, R.L.; validation, J.T.; formal analysis, Y.L.; investigation, R.L.; resources, J.T. and R.L.; data curation, J.T. and L.D.; writing—original draft preparation, Y.L. and L.D.; writing—review and editing, Y.L. and J.T.; visualization, J.T.; supervision, J.T. and R.L.; project administration, J.T. and R.L.; funding acquisition, J.T. and R.L. All authors have read and agreed to the published version of the manuscript.

Funding

This research was funded by the National Key Research and Development Project of China (2018YFC1508105, 2019YFC1510605), the National Natural Science Foundation of China (51909274, 42001033), the IWHR Research & Development Support Program (JZ0199A022021), and the Fundamental Research Funds for the Central Universities, CHD (300102291507).

Institutional Review Board Statement

Not applicable.

Informed Consent Statement

Not applicable.

Data Availability Statement

Not applicable.

Acknowledgments

The authors gratefully acknowledge the China Institute of Water Resources and Hydropower Research and the Institute of Geographic Sciences and Natural Resources Research, CAS for providing support.

Conflicts of Interest

The authors declare no conflict of interest.

References

  1. Guo, E.L.; Wang, Y.F.; Wang, C.L.; Sun, Z.Y.; Bao, Y.L.; Naren, M.; Buren, J.; Bao, Y.H.; Li, H. NDVI Indicates Long-Term Dynamics of Vegetation and Its Driving Forces from Climatic and Anthropogenic Factors in Mongolian Plateau. Remote Sens. 2021, 13, 688. [Google Scholar] [CrossRef]
  2. Chen, T.; Xia, J.; Zou, L.; Hong, S. Quantifying the Influences of Natural Factors and Human Activities on NDVI Changes in the Hanjiang River Basin, China. Remote Sens. 2020, 12, 3780. [Google Scholar] [CrossRef]
  3. Ning, T.T.; Liu, W.Z.; Lin, W.; Song, X.Q.; Mischke, S. NDVI Variation and Its Responses to Climate Change on the Northern Loess Plateau of China from 1998 to 2012. Adv. Meteorol. 2015, 2015, 1–10. [Google Scholar] [CrossRef] [Green Version]
  4. Hu, Y.F.; Dao, R.N.; Hu, Y. Vegetation Change and Driving Factors: Contribution Analysis in the Loess Plateau of China during 2000–2015. Sustainability 2019, 11, 1320. [Google Scholar] [CrossRef] [Green Version]
  5. Huang, W.J.; Duan, W.L.; Chen, Y.N. Rapidly declining surface and terrestrial water resources in Central Asia driven by socio-economic and climatic changes. Sci. Total Environ. 2021, 784, 147193. [Google Scholar] [CrossRef] [PubMed]
  6. Camille, P.; Gary, Y. A globally coherent fingerprint of climate change impacts across natural systems. Nature 2003, 421, 37–42. [Google Scholar]
  7. Lin, X.N.; Niu, J.Z.; Ronny, B.; Yu, X.X.; Zhang, L.; Chen, X.W. NDVI Dynamics and Its Response to Climate Change and Reforestation in Northern China. Remote Sens. 2020, 12, 4138. [Google Scholar] [CrossRef]
  8. Li, B.; Chen, F.; Qin, Y.; Shirazi, Z. Shifting trends and probability distribution of vegetation conditions over China. Remote Sens. Lett. 2014, 5, 619–626. [Google Scholar] [CrossRef]
  9. Duan, W.; Maskey, S.; Chaffe, P.L.; Luo, P.; He, B.; Wu, Y.; Hou, J. Recent Advancement in Remote Sensing Technology for Hydrology Analysis and Water Resources Management. Remote Sens. 2021, 13, 1097. [Google Scholar] [CrossRef]
  10. Zha, X.B.; Luo, P.P.; Zhu, W.; Wang, S.T.; Lyu, J.Q.; Zhou, M.M.; Huo, A.D.; Wang, Z.H. A Bibliometric Analysis of the Research on Sponge City: Current Situation and Future Development Direction. Ecohydrology 2021, e2328. Available online: https://doi.org/10.1002/eco.2328 (accessed on 27 October 2021).
  11. Luo, P.P.; Xu, C.Y.; Kang, S.X.; Huo, A.D.; Lyu, J.Q.; Zhou, M.M.; Nover, D. Heavy metals in water and surface sediments of the Fenghe River Basin, China: Assessment and source analysis. Water Sci. Technol. 2021, wst2021335. Available online: https://doi.org/10.2166/wst.2021.335 (accessed on 27 October 2021). [CrossRef]
  12. Liu, B.Y.; Chen, J.; Chen, J.G.; Zhang, W.W. Land Cover Change Detection Using Multiple Shape Parameters of Spectral and NDVI Curves. Remote Sens. 2018, 10, 1251. [Google Scholar] [CrossRef] [Green Version]
  13. Azevedo, O.; Parker, T.C.; Siewert, M.B.; Subke, J.A. Predicting Soil Respiration from Plant Productivity (NDVI) in a Sub-Arctic Tundra Ecosystem. Remote Sens. 2021, 13, 2571. [Google Scholar] [CrossRef]
  14. Zhu, Y.H.; Luo, P.P.; Zhang, S.; Sun, B. Spatiotemporal Analysis of Hydrological Variations and Their Impacts on Vegetation in Semiarid Areas from Multiple Satellite Data. Remote Sens. 2020, 12, 4177. [Google Scholar] [CrossRef]
  15. Huang, S.; Tang, L.N.; Hupy, J.P.; Wang, Y.; Shao, G.F. A commentary review on the use of normalized difference vegetation index(NDVI) in the era of popular remote sensing. J. For. Res. 2021, 32, 1–6. [Google Scholar] [CrossRef]
  16. Mallick, J.; AlMesfer, M.K.; Singh, V.P.; Falqi, I.I.; Singh, C.K.; Alsubih, M.; Kahla, N.B. Evaluating the NDVI–Rainfall Relationship in Bisha Watershed, Saudi Arabia Using Non-Stationary Modeling Technique. Atmosphere 2021, 12, 593. [Google Scholar] [CrossRef]
  17. Chen, Y.; Sun, Q.; Hu, J. Quantitatively Estimating of InSAR Decorrelation Based on Landsat-Derived NDVI. Remote Sens. 2021, 13, 2440. [Google Scholar] [CrossRef]
  18. Peng, W.F.; Kuang, T.T.; Tao, S. Quantifying influences of natural factors on vegetation NDVI changes based on geographical detector in Sichuan, western China. J. Clean. Prod. 2019, 233, 353–367. [Google Scholar] [CrossRef]
  19. Linscheid, N.; Estupinan-Suarez, L.M.; Brenning, A.; Carvalhais, N.; Cremer, F.; Gans, F.; Rammig, A.; Reichstein, M.; Sierra, C.A.; Mahecha, M.D. Towards a global understanding of vegetation–climate dynamics at multiple timescales. Biogeosciences 2020, 17, 945–962. [Google Scholar] [CrossRef]
  20. Han, D.X.; Gao, C.Y.; Liu, H.X.; Yu, X.F.; Li, Y.H.; Cong, J.X.; Wang, G.P. Vegetation dynamics and its response to climate change during the past 2000 years along the Amur River Basin, Northeast China. Ecol. Indic. 2020, 117, 106577. [Google Scholar] [CrossRef]
  21. Eastman, J.; Sangermano, F.; Machado, E.; Rogan, J.; Anyamba, A. Global Trends in Seasonality of Normalized Difference Vegetation Index (NDVI), 1982–2011. Remote Sens. 2013, 5, 4799–4818. [Google Scholar] [CrossRef] [Green Version]
  22. Wu, D.H.; Wu, H.; Zhao, X.; Zhou, T.; Tang, B.J.; Zhao, W.Q.; Jia, K. Evaluation of Spatiotemporal Variations of Global Fractional Vegetation Cover Based on GIMMS NDVI Data from 1982 to 2011. Remote Sens. 2014, 6, 4217–4239. [Google Scholar] [CrossRef] [Green Version]
  23. Santo, F.E.; Ramos, A.M.; Lima, M.I.P.; Trigo, R.M. Seasonal changes in daily precipitation extremes in mainland Portugal from 1941 to 2007. Reg. Environ. Chang. 2014, 14, 1765–1788. [Google Scholar] [CrossRef]
  24. Davis, C.J.; Hanna, E.G. Seasonal temperature and rainfall extremes 1911–2017 for Northern Australian population centres: Challenges for human activity. Reg. Environ. Chang. 2020, 20, 128. [Google Scholar] [CrossRef]
  25. Jiao, K.W.; Gao, J.B.; Liu, Z.H. Precipitation Drives the NDVI Distribution on the Tibetan Plateau While High Warming Rates May Intensify Its Ecological Droughts. Remote Sens. 2021, 13, 1305. [Google Scholar] [CrossRef]
  26. Pei, F.S.; Zhou, Y.; Xia, Y. Application of Normalized Difference Vegetation Index (NDVI) for the Detection of Extreme Precipitation Change. Forests 2021, 12, 594. [Google Scholar] [CrossRef]
  27. Mishra, A.K.; Singh, V.P. A review of drought concepts. J. Hydrol. 2010, 391, 202–216. [Google Scholar] [CrossRef]
  28. Vicente-Serrano, S.M.; Beguería, S.; López-Moreno, J.I. A Multiscalar Drought Index Sensitive to Global Warming: The Standardized Precipitation Evapotranspiration Index. J. Clim. 2010, 23, 1696–1718. [Google Scholar] [CrossRef] [Green Version]
  29. Zhang, B.Q.; Long, B.; Wu, Z.Y.; Wang, Z.K. An Evaluation of the Performance and the Contribution of Different Modified Water Demand Estimates in Drought Modeling Over Water-stressed Regions. Land Degrad. Dev. 2017, 28, 1134–1151. [Google Scholar] [CrossRef]
  30. Ndehedehe, C.E.; Agutu, N.O.; Ferreira, V.G.; Getirana, A. Evolutionary drought patterns over the Sahel and their teleconnections with low frequency climate oscillations. Atmos. Res. 2020, 233, 104700. [Google Scholar] [CrossRef] [Green Version]
  31. Yao, N.; Li, L.C.; Feng, P.Y.; Feng, H.; Liu, D.L.; Liu, Y.; Jiang, K.T.; Hu, X.T.; Li, Y. Projections of drought characteristics in China based on a standardized precipitation and evapotranspiration index and multiple GCMs. Sci. Total Environ. 2020, 704, 135245. [Google Scholar] [CrossRef] [PubMed]
  32. Fang, W.; Huang, S.Z.; Huang, Q.; Huang, G.H.; Wang, H.; Leng, G.Y.; Wang, L.; Guo, Y. Probabilistic assessment of remote sensing-based terrestrial vegetation vulnerability to drought stress of the Loess Plateau in China. Remote Sens. Environ. 2019, 232, 111290. [Google Scholar] [CrossRef]
  33. Duan, W.L.; Zou, S.; Chen, Y.N.; Daniel, N.; Fang, G.H.; Wang, Y. Sustainable water management for cross-border resources: The Balkhash Lake Basin of Central Asia, 1931–2015. J. Clean. Prod. 2020, 263, 121614. [Google Scholar] [CrossRef]
  34. Ma, J.N.; Zhang, C.; Guo, H.; Chen, W.L.; Yun, W.J.; Gao, L.L.; Wang, H. Analyzing Ecological Vulnerability and Vegetation Phenology Response Using NDVI Time Series Data and the BFAST Algorithm. Remote Sens. 2020, 12, 3371. [Google Scholar] [CrossRef]
  35. Wang, H.; Liu, G.H.; Li, Z.S.; Ye, X.; Fu, B.J.; Lv, Y.H. Impacts of Drought and Human Activity on Vegetation Growth in the Grain for Green Program Region, China. Chin. Geogr. Sci. 2018, 28, 470–481. [Google Scholar] [CrossRef] [Green Version]
  36. Guillermo, G.; Julio, C.J.; Raúl, S.-S.; Navarro, C.R.M. Limited Growth Recovery after Drought-Induced Forest Dieback in Very Defoliated Trees of Two Pine Species. Front. Plant Sci. 2016, 7, 418. [Google Scholar]
  37. Wang, F.T.; An, P.L.; Huang, C.; Zhang, Z.; Hao, J.M. Is afforestation-induced land use change the main contributor to vegetation dynamics in the semiarid region of North China? Ecol. Indic. 2018, 88, 282–291. [Google Scholar] [CrossRef]
  38. Wang, X.; Du, P.J.; Chen, D.M.; Lin, C.; Zheng, H.R.; Guo, S.C. Characterizing urbanization-induced land surface phenology change from time-series remotely sensed images at fine spatio-temporal scale: A case study in Nanjing, China (2001–2018). J. Clean. Prod. 2020, 274, 122487. [Google Scholar] [CrossRef]
  39. Piao, S.L.; Yin, G.D.; Tan, J.G.; Cheng, L.; Huang, M.T.; Li, Y.; Liu, R.G.; Mao, J.F.; Myneni, R.B.; Peng, S.S.; et al. Detection and attribution of vegetation greening trend in China over the last 30 years. Glob. Chang. Biol. 2015, 21, 1601–1609. [Google Scholar]
  40. Lü, Y.H.; Zhang, L.W.; Feng, X.M.; Zeng, Y.; Fu, B.J.; Yao, X.L.; Li, J.R.; Wu, B.F. Recent ecological transitions in China: Greening, browning and influential factors. Sci. Rep. 2015, 5, 587–592. [Google Scholar] [CrossRef]
  41. Wu, J.J.; Zhao, L.; Zheng, Y.T.; Lü, A.F. Regional differences in the relationship between climatic factors, vegetation, land surface conditions, and dust weather in China’s Beijing-Tianjin Sand Source Region. Nat. Hazards 2012, 62, 31–44. [Google Scholar] [CrossRef]
  42. Ding, Y.B.; Xu, J.T.; Wang, X.W.; Peng, X.B.; Cai, H.J. Spatial and temporal effects of drought on Chinese vegetation under different coverage levels. Sci. Total Environ. 2020, 716, 137166. [Google Scholar] [CrossRef]
  43. Rojo, V.; Arzamendia, Y.; Pérez, C.; Baldo, J.; Vilá, B.L. Spatial and temporal variation of the vegetation of the semiarid Puna in a pastoral system in the Pozuelos Biosphere Reserve. Environ. Monit. Assess. 2019, 191, 635. [Google Scholar] [CrossRef]
  44. Wessels, K.J.; Prince, S.D.; Malherbe, J.; Small, J.; Frost, P.E.; VanZyl, D. Can human-induced land degradation be distinguished from the effects of rainfall variability? A case study in South Africa. J. Arid Environ. 2006, 68, 271–297. [Google Scholar] [CrossRef]
  45. Liu, L.B.; Wang, Y.; Wang, Z.; Li, D.L.; Zhang, Y.T.; Qin, D.; Li, S.C. Elevation-Dependent Decline in Vegetation Greening Rate Driven by Increasing Dryness Based on Three Satellite NDVI Datasets on the Tibetan Plateau; Elsevier: Amsterdam, The Netherlands, 2019; Volume 107, p. 105569. [Google Scholar]
  46. Liu, L.L.; Zhang, X.Y.; Donnelly, A.; Liu, X.J. Interannual variations in spring phenology and their response to climate change across the Tibetan Plateau from 1982 to 2013. Int. J. Biometeorol. 2016, 60, 1563–1575. [Google Scholar] [CrossRef]
  47. Meng, X.Y.; Gao, X.; Li, S.Y.; Lei, J.Q. Spatial and Temporal Characteristics of Vegetation NDVI Changes and the Driving Forces in Mongolia during 1982–2015. Remote Sens. 2020, 12, 603. [Google Scholar] [CrossRef] [Green Version]
  48. Du, J.Q.; Quan, Z.J.; Fang, S.F.; Liu, C.C.; Wu, J.H.; Fu, Q. Spatiotemporal changes in vegetation coverage and its causes in China since the Chinese economic reform. Environ. Sci. Pollut. Res. 2020, 27, 1144–1159. [Google Scholar] [CrossRef]
  49. Resources and Environment Data Cloud Platform of the Chinese Academy of Sciences. Available online: http://www.resdc.cn/ (accessed on 1 March 2021).
  50. Spatial Distribution Data Set of China Monthly V egetation Index (NDVI). Data Registration and Publication System of Chinese Academy of Sciences. Available online: http://www.resdc.cn/ (accessed on 25 March 2021).
  51. Remote Sensing Monitoring Data Set of Land Use and Land Cover in China in Multiple Periods (CNLUCC). Data Registration and Publication System of CHINESE Academy of Sciences. Available online: http://www.resdc.cn/DOI/ (accessed on 26 March 2021).
  52. Shuttle Radar Topography Mission (SRTM) Digital Elevation Database of the USGS/NASA. Available online: http://srtm.csi.cgiar.org/ (accessed on 24 March 2021).
  53. VICENTE-SERRANO, S.M.; Beguería, S.; López-Moreno, J.I.; Angulo, M.; Kenawy, A.E. A global 0.5° gridded dataset (1901–2006) of a multiscalar drought index considering the joint effects of precipitation and temperature. J. Hydrometeorol. 2010, 11, 1033–1043. [Google Scholar] [CrossRef] [Green Version]
  54. Alireza, K.; Mahmood, K.; Mohsen, H. Spatial–temporal analysis of net primary production (NPP) and its relationship with climatic factors in Iran. Environ. Monit. Assess. 2020, 192, 718. [Google Scholar]
  55. Güçlü, Y.S. Improved visualization for trend analysis by comparing with classical Mann-Kendall test and ITA. J. Hydrol. 2020, 584, 124674. [Google Scholar] [CrossRef]
  56. Hamed, K.H. Exact distribution of the Mann–Kendall trend test statistic for persistent data. J. Hydrol. 2008, 365, 86–94. [Google Scholar] [CrossRef]
  57. Yang, Q.; Ma, Z.G.; Zhang, Z.Y.; Duan, Y.W. Sensitivity of Potential Evapotranspiration Estimation to the Thornthwaite and Penman–Monteith Methods in the Study of Global Drylands. Adv. Atmos. Sci. 2017, 34, 1381–1394. [Google Scholar] [CrossRef]
  58. Pyrgou, A.; Santamouris, M.; Livada, I.; Cartalis, C. Retrospective Analysis of Summer Temperature Anomalies with the Use of Precipitation and Evapotranspiration Rates. Climate 2019, 7, 104. [Google Scholar] [CrossRef] [Green Version]
  59. Milton, A.; Stegun, I.A.; David, M. Handbook of Mathematical Functions With Formulas, Graphs and Mathematical Tables (National Bureau of Standards Applied Mathematics Series No. 55). J. Appl. Mech. 1965, 32, 239. [Google Scholar]
  60. Zhang, Y.Z.; Huang, C.C.; Tan, Z.H.; Chen, Y.L.; Qiu, H.J.; Huang, C.; Li, Y.Q.; Zhang, Y.X.; Li, X.G.; Shulmeister, J.; et al. Prehistoric and historic overbank floods in the Luoyang Basin along the Luohe River, middle Yellow River basin, China. Quat. Int. 2019, 521, 118–128. [Google Scholar] [CrossRef]
  61. Wei, X.D.; Wang, N.; Luo, P.P.; Yang, J.; Zhang, J.; Lin, K.L. Spatiotemporal Assessment of Land Marketization and Its Driving Forces for Sustainable Urban–Rural Development in Shaanxi Province in China. Sustainability 2021, 13, 7755. [Google Scholar] [CrossRef]
  62. Liu, C.; Yan, X.y.; Jiang, F.q. Desert vegetation responses to the temporal distribution patterns of precipitation across the northern Xinjiang, China. Catena 2021, 206, 105544. [Google Scholar] [CrossRef]
  63. Xie, D.N.; Duan, L.; Si, G.Y.; Liu, W.J.; Zhang, T.; Mulder, J. Long-Term 15N Balance After Single-Dose Input of 15N-Labeled NH4+ and NO3− in a Subtropical Forest Under Reducing N Deposition. Glob. Biogeochem. Cycles 2021, 35. Available online: https://doi.org/10.1029/2021GB006959 (accessed on 26 October 2021). [CrossRef]
  64. Gao, X.; Huang, X.X.; Kevin, L.; Dang, Q.W.; Wen, R.Y. Vegetation responses to climate change in the Qilian Mountain Nature Reserve, Northwest China. Glob. Ecol. Conserv. 2021, 28, e01698. [Google Scholar] [CrossRef]
  65. Huang, K.; Xia, J.Y. High ecosystem stability of evergreen broadleaf forests under severe droughts. Glob. Chang. Biol. 2019, 25, 3494–3503. [Google Scholar] [CrossRef]
  66. Schönbeck, L.; Li, M.H.; Lehmann, M.M.; Rigling, A.; Schaub, M.; Hoch, G.; Kahmen, A.; Gessler, A. Soil nutrient availability alters tree carbon allocation dynamics during drought. Tree Physiol. 2021, 41, 697–707. [Google Scholar] [CrossRef]
  67. Wagner, F.H.; Hérault, B.; Rossi, V.; Hilker, T.; Maeda, E.E.; Sanchez, A.; Lyapustin, A.I.; Galvão, L.S.; Wang, Y.; Aragão, L.E.O.C. Climate drivers of the Amazon forest greening. PLoS ONE 2017, 12, e0180932. [Google Scholar] [CrossRef] [PubMed] [Green Version]
  68. Zhang, Q.; Yang, J.H.; Wang, W.; Ma, P.L.; Lu, G.Y.; Liu, X.Y.; Yu, H.P.; Fang, F. Climatic Warming and Humidification in the Arid Region of Northwest China: Multi-Scale Characteristics and Impacts on Ecological Vegetation. J. Meteorol. Res. 2021, 35, 113–127. [Google Scholar] [CrossRef]
  69. Cui, L.F.; Wang, L.C.; Qu, S.; Deng, L.H.; Wang, Z.D. Influence of temperature, precipitation and human activity on vegetation NDVI in the Yangtze River Basin, China. Earth Sci. 2020, 45, 1905–1917. [Google Scholar]
  70. Dai, L.C.; Ke, X.; Guo, X.W.; Du, Y.G.; Zhang, F.W.; Li, Y.K.; Li, Q.; Lin, L.; Peng, C.J.; Shu, K.; et al. Responses of biomass allocation across two vegetation types to climate fluctuations in the northern Qinghaiâ—Tibet Plateau. Ecol. Evol. 2019, 9, 6105–6115. [Google Scholar] [CrossRef] [Green Version]
  71. Wang, H.Y.; Liu, J.J.; Song, C.Y.; Qi, J. Feature Analysis of Weather Changes in Recent 50 Years in the Area of Sanjiang-Changbai. Meteorol. Environ. Res. 2010, 1, 43–46. [Google Scholar]
  72. Liu, Y.Y.; Evans, J.P.; McCabe, M.F.; Jeu, R.A.M.d.; Dijk, A.I.J.M.v.; Dolman, A.J.; Saizen, I. Changing Climate and Overgrazing Are Decimating Mongolian Steppes. PLoS ONE 2013, 8, e57599. [Google Scholar] [CrossRef] [PubMed] [Green Version]
  73. Nanzad, L.; Zhang, J.H.; Tuvdendorj, B.; Nabil, M.; Zhang, S.; Bai, Y. NDVI anomaly for drought monitoring and its correlation with climate factors over Mongolia from 2000 to 2016. J. Arid Environ. 2019, 164, 69–77. [Google Scholar] [CrossRef]
  74. Li, L.H.; Zhang, Y.L.; Wu, J.S.; Li, S.C.; Zhang, B.H.; Zu, J.X.; Zhang, H.M.; Ding, M.J.; Basanta, P. Increasing sensitivity of alpine grasslands to climate variability along an elevational gradient on the Qinghai-Tibet Plateau. Sci. Total Environ. 2019, 678, 21–29. [Google Scholar] [CrossRef]
  75. Zhang, Y.; Luo, P.P.; Zhao, S.F.; Kang, S.X.; Wang, P.B.; Zhou, M.M.; Lyu, J.Q. Control and remediation methods for eutrophic lakes in the past 30 years. Water Sci. Technol. 2020, 81, 1099–1113. [Google Scholar] [CrossRef] [PubMed]
  76. Mu, D.R.; Luo, P.P.; Lyu, J.Q.; Zhou, M.M.; Huo, A.D.; Duan, W.; Nover, D.; He, B.; Zhao, X.L. Impact of temporal rainfall patterns on flash floods in Hue City, Vietnam. J. Flood Risk Manag. 2020, 14, e12668. [Google Scholar] [CrossRef]
  77. Xu, H.J.; Wang, X.P.; Zhao, C.Y.; Yang, X.M. Diverse responses of vegetation growth to meteorological drought across climate zones and land biomes in northern China from 1981 to 2014. Agric. For. Meteorol. 2018, 262, 1–13. [Google Scholar] [CrossRef]
  78. Zhu, Y.K.; Zhang, J.T.; Zhang, Y.Q.; Qin, S.G.; Shao, Y.Y.; Gao, Y. Responses of vegetation to climatic variations in the desert region of northern China. Catena 2019, 175, 27–36. [Google Scholar] [CrossRef]
  79. Zhou, Q.W.; Luo, Y.; Zhou, X.; Cai, M.Y.; Zhao, C.W. Response of vegetation to water balance conditions at different time scales across the karst area of southwestern China—A remote sensing approach. Sci. Total Environ. 2018, 645, 460–470. [Google Scholar] [CrossRef]
  80. Li, C.C.; Zhang, Y.Q.; Shen, Y.J.; Yu, Q. Decadal water storage decrease driven by vegetation changes in the Yellow River Basin. Sci. Bull. 2020, 65, 1154. [Google Scholar] [CrossRef]
  81. Nunes, S.; Gastauer, M.; Cavalcante, R.B.L.; Ramos, S.J.; Caldeira, C.F.; Silva, D.; Rodrigues, R.R.; Salomão, R.; Oliveira, M.; Souza-Filho, P.W.M.; et al. Challenges and opportunities for large-scale reforestation in the Eastern Amazon using native species. For. Ecol. Manag. 2020, 466, 118120. [Google Scholar] [CrossRef]
  82. Li, S.D.; Liu, X. Study on regional model of return of farmland to afforestation in Loess Plateau area and Xinjiang desert area. Prot. For. Sci. Technol. 2004, 4, 3–7. [Google Scholar]
  83. Gao, L.P.; Kinnucan, H.W.; Zhang, Y.Q.; Qiao, G.H. The effects of a subsidy for grassland protection on livestock numbers, grazing intensity, and herders’ income in inner Mongolia. Land Use Policy 2016, 54, 302–312. [Google Scholar] [CrossRef] [Green Version]
  84. Nandintsetseg, B.; Shinoda, M.; Erdenetsetseg, B. Contributions of multiple climate hazards and overgrazing to the 2009/2010 winter disaster in Mongolia. Nat. Hazards: J. Int. Soc. Prev. Mitig. Nat. Hazards 2018, 92, 109–126. [Google Scholar] [CrossRef]
  85. Xu, J.Y.; Chen, J.X.; Liu, Y.X.; Fan, F.F. Identification of the geographical factors influencing the relationships between ecosystem services in the Belt and Road region from 2010 to 2030. J. Clean. Prod. 2020, 275, 124153. [Google Scholar] [CrossRef]
  86. Kowe, P.; Mutanga, O.; Odindi, J.; Dube, T. A quantitative framework for analysing long term spatial clustering and vegetation fragmentation in an urban landscape using multi-temporal landsat data. Int. J. Appl. Earth Obs. Geoinf. 2020, 88, 102057. [Google Scholar] [CrossRef]
  87. Xu, J.Y.; Chen, J.X.; Liu, Y.X. Partitioned responses of ecosystem services and their tradeoffs to human activities in the Belt and Road region. J. Clean. Prod. 2020, 276, 123205. [Google Scholar]
  88. Xu, L.Y.; You, H.; Li, D.H.; Yu, K.J. Urban green spaces, their spatial pattern, and ecosystem service value: The case of Beijing. Habitat Int. 2016, 56, 84–95. [Google Scholar] [CrossRef]
  89. Song, Y.; Jagannath, A.; Tan, L.C.; Jin, L.; Gao, Z.H.; Wang, Y.Q. Comparison of changes in vegetation and land cover types between Shenzhen and Bangkok. Land Degrad. Dev. 2020, 32, 1192–1204. [Google Scholar] [CrossRef]
  90. Prăvălie, R. Major perturbations in the Earth’s forest ecosystems. Possible implications for global warming. Earth Sci. Rev. 2018, 185, 544–571. [Google Scholar] [CrossRef]
  91. You, H.Y. Characterizing the inequalities in urban public green space provision in Shenzhen, China. Habitat Int. 2016, 56, 176–180. [Google Scholar] [CrossRef]
  92. Hong, W.Y.; Guo, R.Z. Indicators for quantitative evaluation of the social services function of urban greenbelt systems: A case study of shenzhen, China. Ecol. Indic. 2017, 75, 259–267. [Google Scholar] [CrossRef]
  93. Xue, Z.J.; Qin, Z.D.; Cheng, F.Q.; Ding, G.W.; Yan, J.X. Quantitative characterization of climate change and its impact on aeolian desertification: A case study in northwest Shanxi of China. Environ. Earth Sci. 2021, 80, 242. [Google Scholar] [CrossRef]
  94. Wang, X.M.; Cai, D.W.; Chen, S.Y.; Lou, J.P.; Liu, F.; Jiao, L.L.; Cheng, H.; Zhang, C.X.; Hua, T.; Che, H.Z. Spatio-temporal trends of dust emissions triggered by desertification in China. Catena 2021, 200, 105160. [Google Scholar] [CrossRef]
  95. Zhao, Y.Y.; Gao, G.L.; Qin, S.G.; Yu, M.H.; Ding, G.D. Desertification detection and the evaluation indicators: A review. J. Arid Land Resour. Environ. 2019, 33, 81–87. [Google Scholar]
  96. Wang, J.L.; Wei, H.S.; Cheng, K.; Ochir, A.; Davaasuren, D.; Li, P.F.; Chan, F.K.S.; Nasanbat, E. Spatio-Temporal Pattern of Land Degradation from 1990 to 2015 in Mongolia. Environ. Dev. 2020, 34, 100497. [Google Scholar] [CrossRef]
  97. Liang, X.Y.; Li, P.F.; Wang, J.L.; Ka, S.C.F.; Chuluun, T.; Altansukh, O.; Davaadorj, D. Research Progress of Desertification and Its Prevention in Mongolia. Sustainability 2021, 13, 6861. [Google Scholar] [CrossRef]
  98. Kéfi, S.; Guttal, V.; Brock, W.A.; Carpenter, S.R.; Ellison, A.M.; Livina, V.N.; Seekell, D.A.; Scheffer, M.; Nes, E.H.v.; Dakos, V. Early Warning Signals of Ecological Transitions: Methods for Spatial Patterns. PLoS ONE 2014, 9, e92097. [Google Scholar] [CrossRef] [PubMed]
Figure 1. Main environmental characteristics of China: (a) Mean annual normalized difference vegetation index (NDVI) in nine river basins from 1998–2017; (b) mean annual standardized precipitation–evapotranspiration index (SPEI) and its grid point position from 1998–2017; (c) elevation; (d) slope; and (e) LUCC.
Remotesensing 13 04326 g001
Figure 2. Variations in the (a) NDVI and (b) SPEI in China from 1997–2017.
Remotesensing 13 04326 g002
Figure 3. (a) Spatial distribution of the trend in the NDVI in China during 1998–2017; (b) spatial distribution of significant changes in the NDVI in China from 1998–2017; (c) spatial distribution of the trend in the SPEI in China during 1998–2017; and (d) spatial distribution of significant changes in the SPEI in China from 1998–2017.
Remotesensing 13 04326 g003
Figure 4. Significance analysis of changes in the (a) NDVI and (b) SPEI in China and its nine river basins from 1998–2017. YARB—Yangtze River Basin, YRB—Yellow River Basin, PRB—Pearl River Basin, SWR—Southwest Rivers, SER—Southeast Rivers, HRB—Haihe River Basin, HURB—Huaihe River Basin, SLRB—Songhua and Liaohe River Basin, CB—Continental Basin.
Remotesensing 13 04326 g004
Figure 5. (a) Spatial distribution of the correlation between the NDVI and SPEI in China from 1998–2017; and (b) spatial distribution of significant correlations between NDVI and SPEI in China from 1998–2017.
Remotesensing 13 04326 g005
Figure 6. Effects of LUCC on NDVI: (a) five phases of LUCC change (in 2000, 2005, 2010, 2015, and 2020) and (b) trend of NDVI change corresponding to different LUCC types (in 2000, 2005, 2010, and 2015).
Remotesensing 13 04326 g006
Figure 7. Correlations between different NDVI levels and SPEI under different vegetation types: (a) cropland; (b) forest; (c) grassland; (d) water; (e) urban land; and (f) unused land.
Remotesensing 13 04326 g007
Figure 8. (a) Relationship between NDVI and elevation in China (1–31 represent elevation zones of −200–0 m, 0–200 m, 200–400 m, …, 5800–6000 m, respectively; 32 indicates that the elevation is > 6000 m); and (b) relationship between NDVI and slope in China (1–35 represent the slope zones 0°–1°, 1°–2°, 2°–3°, …, 34°–35°, respectively; 36 denotes a slope > 35°).
Remotesensing 13 04326 g008
Figure 9. Correlation between NDVI and SPEI at different elevations and slopes: (a) elevation (1 indicates that the elevation is <200 m; 2–40 represent the elevation zones of 200–400 m, 400–600 m, 600–800 m, …, 8000–8200 m, respectively; 41 denotes elevation of >8200 m); (b) slope (1–45 represent slope zones of 0°–1°, 1°–2°, 2°–3°, …, 44°–45°, respectively; 46 denotes a slope > 45°).
Remotesensing 13 04326 g009
Figure 10. Climatic regionalization of China.
Remotesensing 13 04326 g010
Table 1. Index classification.
Data TypeClassDescriptionS|Z|
NDVI/SPEI1Extremely significant improvement/Extremely significant wetting>0>2.58
2Significant improvement/Significant wetting>1.96
3Weakly significant improvement/Weakly significant wetting>1.64
4Insignificant improvement/Insignificant wetting≤1.64
5Extremely significant degradation/Extremely significant drought<0>2.58
6Significant degradation/Significant drought>1.96
7Weakly significant degradation/Weakly significant drought>1.64
8Insignificant degradation/Insignificant drought≤1.64
9Unchanged=0-
Table 2. Categorization according to the SPEI values.
SPEI ValueCategorySPEI ValueCategorySPEI ValueCategory
>2.0Extremely wet0.5 to 1.0Lightly wet−1.5 to −1.0Moderate drought
1.5 to 2.0Severely wet−0.5 to 0.5Normal−2.0 to −1.5Severe drought
1.0 to 1.5Moderately wet−1.0 to −0.5Light drought<−2.0Extreme drought
Publisher’s Note: MDPI stays neutral with regard to jurisdictional claims in published maps and institutional affiliations.

