Article

Quantifying Soil Moisture Impacts on Water Use Efficiency in Terrestrial Ecosystems of China

1
State Key Laboratory of Desert and Oasis Ecology, Xinjiang Institute of Ecology and Geography, Chinese Academy of Sciences, 818 South Beijing Road, Urumqi 830011, China
2
Akesu National Station of Observation and Research for Oasis Agro-Ecosystem, Akesu 843017, China
3
School of Chemistry and Chemical Engineering, University of Chinese Academy of Sciences, Beijing 100049, China
4
College of Life Sciences, Xinjiang Normal University, Urumqi 830054, China
*
Author to whom correspondence should be addressed.
Remote Sens. 2021, 13(21), 4257; https://doi.org/10.3390/rs13214257
Submission received: 23 August 2021 / Revised: 9 October 2021 / Accepted: 21 October 2021 / Published: 22 October 2021
(This article belongs to the Special Issue Earth Observation in Support of Sustainable Soils Development)

Abstract

:
Soil moisture (SM) significantly affects the exchange of land surface energy and the stability of terrestrial ecosystems. Although some conclusions have been drawn about the effects of SM on the ecosystem water use efficiency (WUE), the influence mechanism and the quantitative assessment framework of SM on WUE are still unclear. This study provides an analysis framework for the feedback relationship between SM and WUE based on the dependence of the evaporation fraction on SM and output datasets from remote sensing and the Global Land Data Assimilation System. The results show that the range of WUE of terrestrial ecosystems of China was 0.02–19.26 g C/kg H2O in the growing season with an average value of 1.05 g C/kg H2O. They also show a downward trend in 43.99% of the total area. In the evapotranspiration (ET) pathway, SM negatively affected WUE, and the sensitivity coefficient ranged from −18.49 to −0.04. In the net primary production (NPP) pathway, the sensitivity coefficient ranged from −68.66 to 43.19. Under the dual effects of the ET and NPP pathways, the influence of SM on WUE was negative in 84.62% of the area. Variation in SM led to significant WUE variability. Generally, the percentage change in WUEWUE) ranged from 0% to 190.86%, with an average value of 28.02%. The maximum ΔWUE ranged from 0% to 758.78%, with an average value of 109.29%. The WUE of forest ecosystems showed strong resistance to SM variation, whereas that of non-forest vegetation was more sensitive to SM variation. This analytical framework provides a new perspective on the feedback relationship between WUE and SM in terrestrial ecosystems.

Graphical Abstract

1. Introduction

The water use efficiency (WUE) of an ecosystem is the ratio of carbon sequestration to water consumption, which couples the terrestrial carbon and water cycles and closely links photosynthesis and evapotranspiration (ET) processes in the ecosystem [1,2]. Although there are many ways to express the WUE of an ecosystem, the ratio of the net primary production (NPP) to ET is widely used [3]. The variation of WUE controlled by both biotic and abiotic factors [4,5] and recent research showed that a vapor pressure deficit (VPD) and canopy conductance are two dominant factors of WUE in response to drought [6]. On the global scale, WUE is positively related with drought in the majority of regions [7]. In China, most forest ecosystems exhibit strong drought resistance by improving their WUE [8]. Under the influence of the negative feedback relationship between ET and air temperature [9,10], the variation in WUE is usually positively correlated with air temperature [11]. Many studies have shown that, in the past 30 years, the vegetation cover, gross primary productivity (GPP) and ET in western China have been low, and the demand for evaporation has been high [12]. In the context of climate change, many studies focus on the response process and mechanism of WUE to the constraints of drought or water conditions [7,13,14]. On a global scale, WUE generally decreases with an increase in drought or geographic latitude [15]. However, studies have shown that WUE generally has a positive relationship with the drought degree. Drought events can slightly increase the WUE in the majority of forest, grassland, and shrub ecosystems [16,17]. In addition, the response of the WUE to drought has spatial heterogeneity at different spatial scales and in different ecosystems. ET has been shown to control the WUE response to drought in semi-arid and high-latitude regions, and GPP dominated the response WUE to drought in tropical forest regions [7]. Thus, a quantitative study of WUE and its spatial variation along drought gradients is essential for understanding the regional environmental and physiological functions of heterogeneous landscapes [16,18].
As an important indicator of drought, soil moisture (SM) often plays a vital role in the ecosystem carbon–water relationship [19,20,21,22]. Studies have shown that SM can indirectly affect the WUE of terrestrial ecosystems by controlling the NPP and ET processes [21]. Soil water loss in sub-humid, semi-arid, and arid regions can reduce the total primary productivity by 40% [23]. Granier et al. showed that when the soil relative extractable water (REW) was below 0.4, the GPP decreased significantly and the total ecosystem respiration did not decrease until the REW continued to decrease to 0.2 [24]. However, another study showed that because water stress has less limitation on carbon assimilation than ET, ET decreases especially on cloudy days, thereby resulting in a significant increase in WUE [25]. In the global forest ecosystem, the variations in ecosystem WUE, GPP, and ET are correlated with SM, and the sensitivities of the WUE to the soil water content significantly increase with the increase in the vapor pressure deficit [26]. The seasonal fluctuation of SM caused by local rainfall is the main factor determining the GPP/ET relationship in the tropical Amazon rainforest [27,28].Given the above results, some studies think that soil water use efficiency is an adequate representative and indicator of WUE [15,29]. Therefore, studying the influence mechanism of SM on WUE is of great significance to the evolution of terrestrial ecosystems and the response to climate change.
Many studies have shown that a decrease in soil moisture or an increase in drought severity usually increases the WUE [7,25,30,31]. A recent study showed that SM, rather than VPD, dominates dryness stress on ecosystem production globally [32]. Considering SM can better reflect the ET rate at a large regional scale [33,34], ET often dominates the WUE variability in arid and semi-arid regions [7]. Therefore, whether from NPP or ET pathways, SM should be the dominant factor affecting WUE. However, the influencing mechanism by which SM variability affects WUE is still unclear. Soil water variation has a dual effect on the WUE by affecting both NPP and ET. However, current research on the quantitative analysis of this complex process is insufficient. Thus, this study focuses on three questions: (1) What were the spatiotemporal variation characteristics of WUE in the terrestrial ecosystems of China over the past 30 years (1985–2014)? (2) What is the cause and effect mechanism by which SM influences WUE and how can it be quantitatively evaluated? (3) To what extent does the variation of SM affect WUE?

2. Materials and Methods
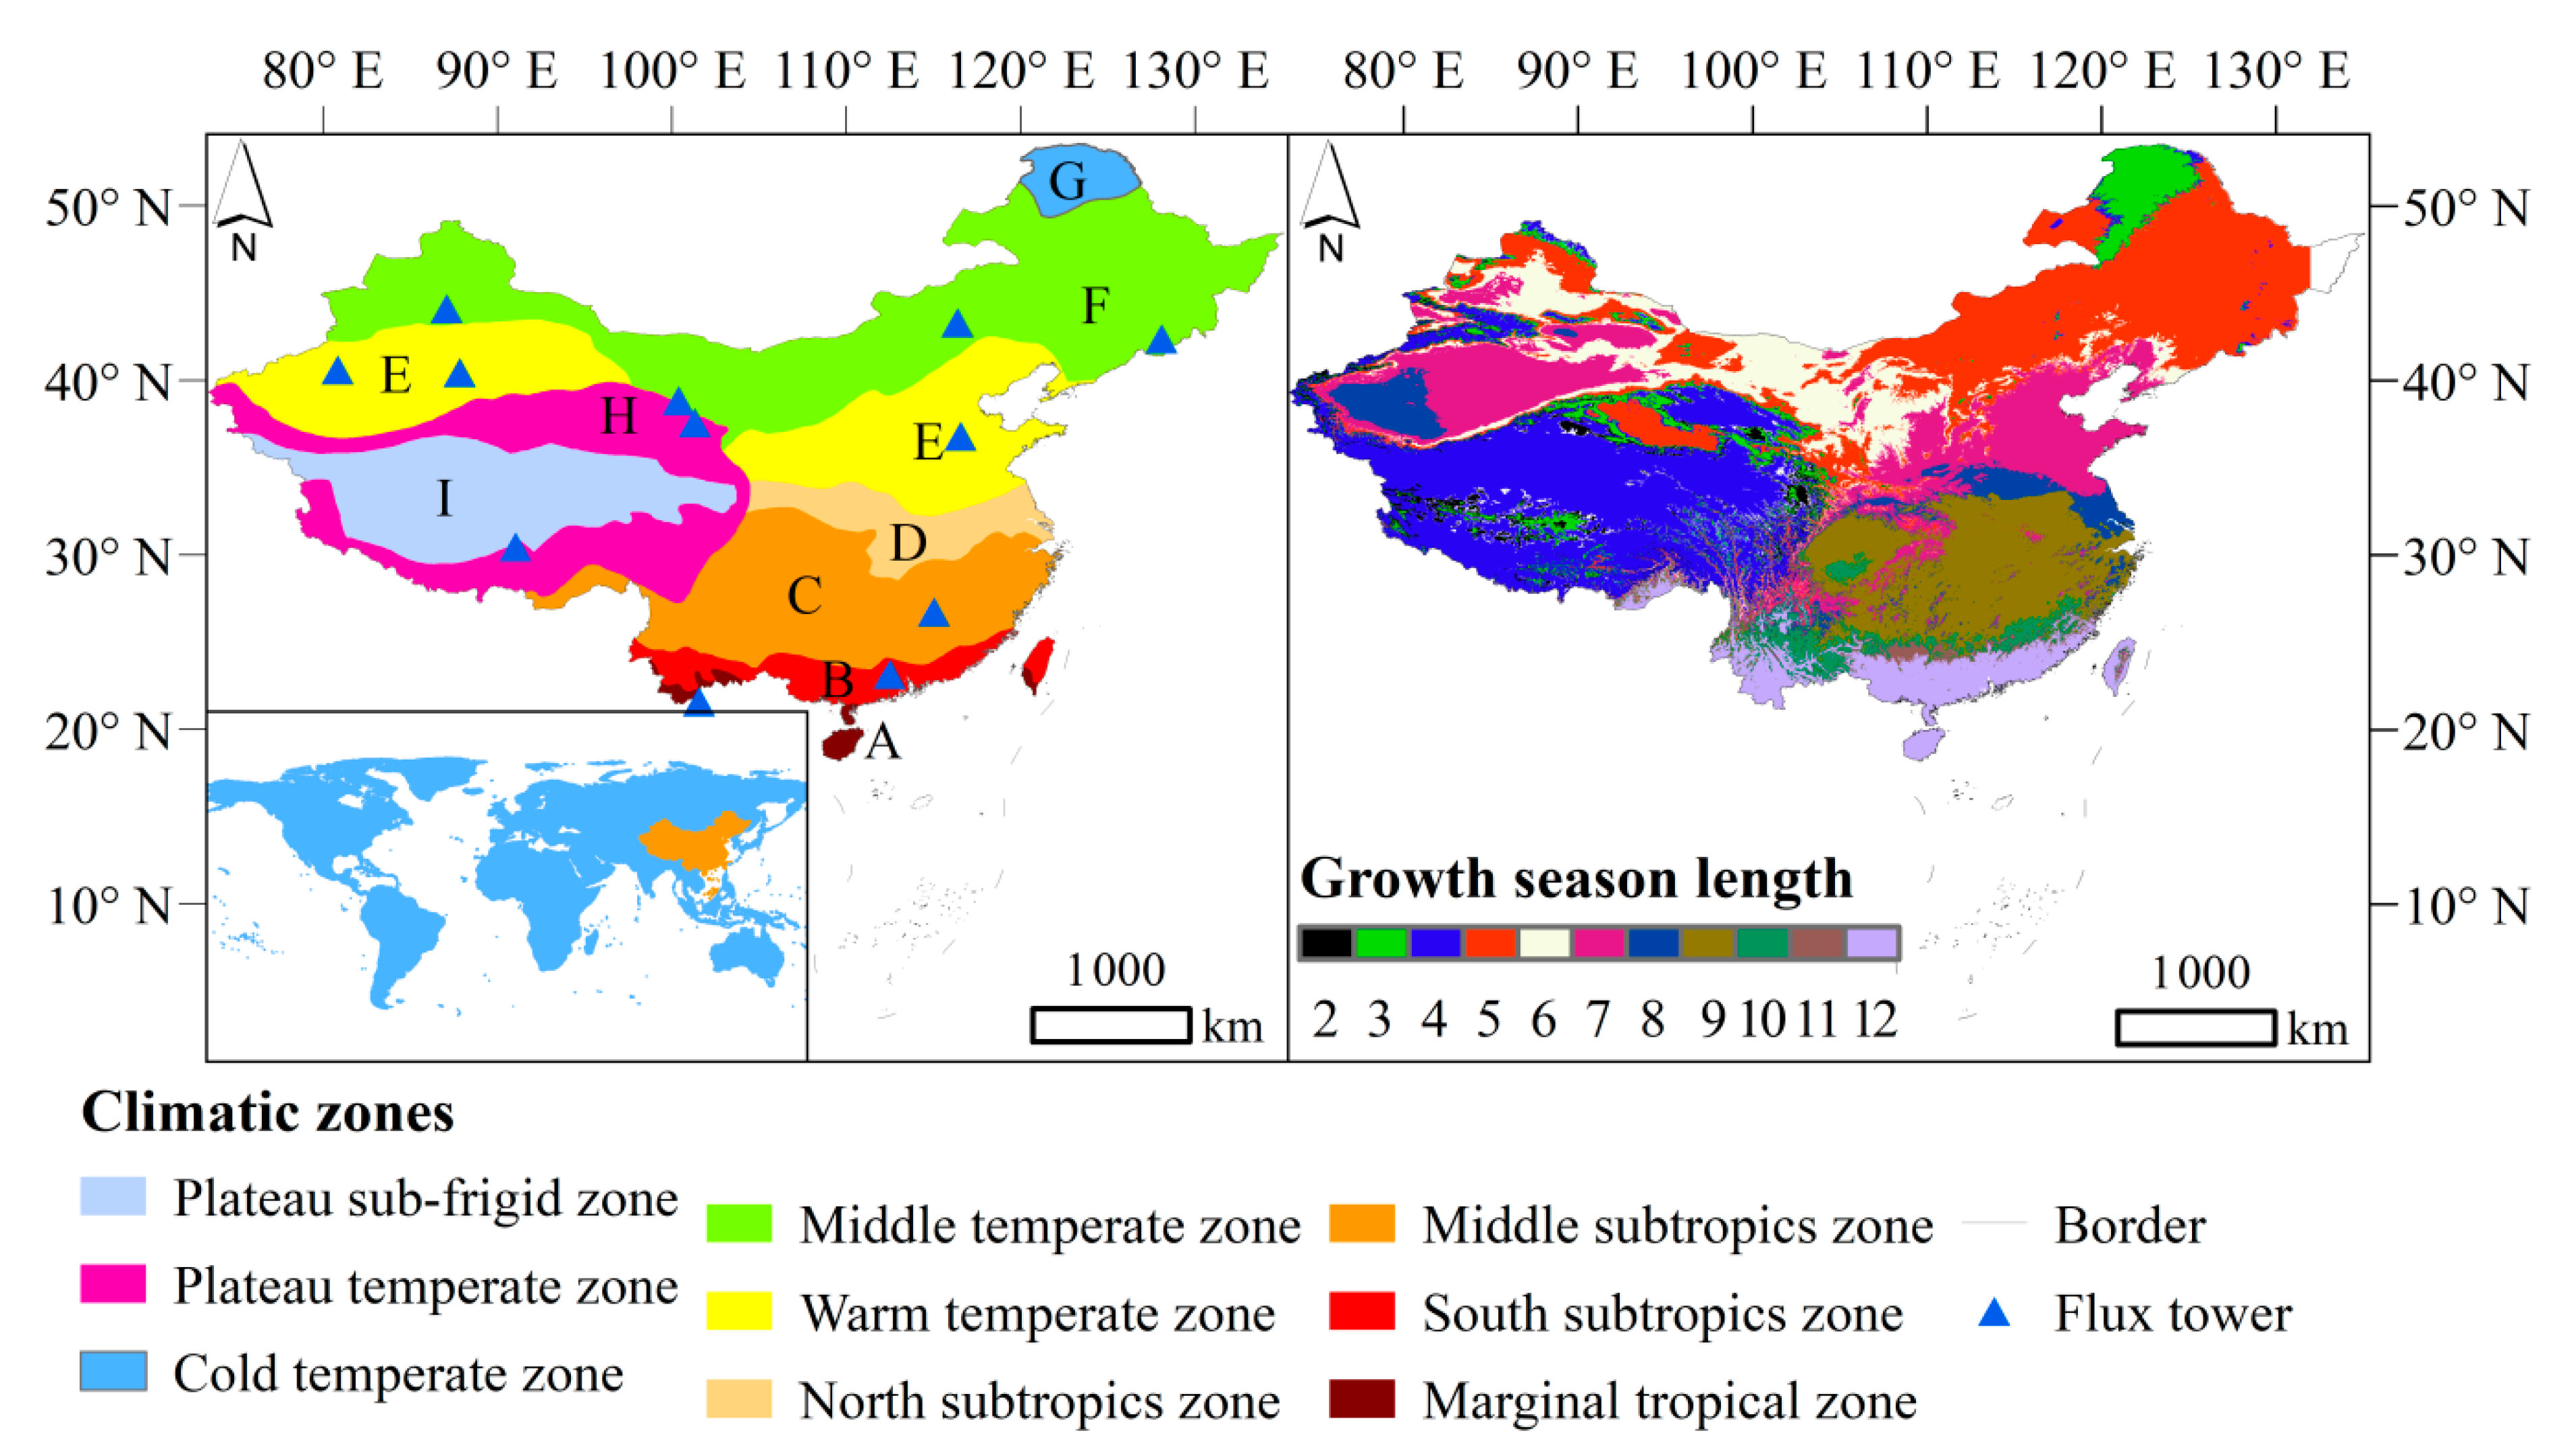
2.1. Study Area

China has a land area of approximately 9.6 × 10⁶ km2 and diverse ecosystems. According to the vegetation map of China (1:1,000,000), grassland ecosystems account for the largest proportion of terrestrial ecosystems, covering 29.88% of the total land area, followed by forest ecosystems, which cover for 23.96% of the total land area. In addition, farmland, desert, wetland, and other ecosystems accounted for 18.82%, 13.53%, 3.92%, and 7.55% of the total land area, respectively.
This study mainly discussed the variation in WUE and SM in different climate zones of the terrestrial ecosystem. The terrestrial ecosystem in China has eight climatic zones, namely, the marginal tropical zone (A), south subtropics zone (B), middle subtropics zone (C), north subtropics zone (D), warm temperate zone (E), middle temperate zone (F), cold temperate zone (G), temperate zone in Qinghai–Tibet Plateau (H), and sub-frigid zone in Qinghai–Tibet Plateau (I) (Figure 1). As the terrestrial ecosystems of China span multiple climatic zones, its climatic growth seasons also have significant spatial differences, ranging from the shortest two-month growth season to the longest twelve-month growth season (Figure 1).

2.2. Data

Monthly latent heat flux (LE), sensible heat flux (H) and ground heat flux (G), ET, surface net radiation (Rn), and SM (four layers: 0–10, 10–40, 40–100, 100–200 cm) datasets were obtained from the NASA Global Land Data Assimilation System (GLDAS) Noah model (GLDAS_NOAH025_M_2.0). We used the dataset from 1985 to 2014 with a spatial resolution of 0.25° × 0.25° (downloaded from https://disc.gsfc.nasa.gov/datasets, accessed on 10 October 2020). In this study, SM in the 0–100 cm soil layer was regarded as the SM of root zone based on previous research [35,36]. The monthly NPP dataset (spatial resolution of 1 km × 1 km) of China’s terrestrial ecosystems north of 18°N from 1985 to 2014 was obtained from the Global Change Research Data Publishing & Repository of China. The NPP data were calculated using the Carnegie–Ames–Stanford Approach (CASA) model based on the monthly meteorological data of China’s land from 1985 to 2015, national soil texture data, and land cover and vegetation index data from the Moderate Resolution Imaging Spectroradiometer (MODIS) and the Advanced Very High Resolution Radiometer (AVHRR) remote sensing images. CASA model is a process-based remote sensing model for estimating NPP of terrestrial ecosystem, which is driven by grid datasets of climate, radiation, soil, and remote sensing vegetation index [37]. A comparative analysis with the measured and simulated data from previous studies [38,39,40,41,42] showed that the NPP dataset used in this study hadgood accuracy [43].
To verify the NPP and ET (GLDAS) data, this study collected the monthly observation data from eight flux towers in China from 2003 to 2010, which were provided by ChinaFLUX (http://www.cnern.org.cn/, accessed on 15 September 2021). In addition, this study also collected the monthly observation flux data from the other four flux towers from the stations, and the collected data length of these four stations was 2004–2006, 2011–2014, 2008–2011, and 2013–2014, respectively. This study also used SM data based on microwave remote sensing in China from 2002 to 2011 (provided by the National Tibetan Plateau Data Center (TPDC) of China; http://data.tpdc.ac.cn, accessed on 2 August 2021) to verify the SM data from GLDAS. The spatial and temporal resolutions of the SM dataset (from the TPDC) were 0.25° and monthly, respectively. The dataset was calculated based on the high spatial and temporal resolution surface meteorological dataset and an improved land surface assimilation system to drive the Simple Biosphere model (SiB2) and assimilate the brightness temperature observed by the Advanced Microwave Scanning Radiometer Earth Observing System sensor (AMSR-E) satellite [44,45]. The verifications showed that the RMSE of this SM dataset (from the TPDC) was approximately 5% volumetric soil water content [45,46].
The soil texture dataset was obtained from the TPDC of China (http://data.tpdc.ac.cn, accessed on 13 May 2020). The dataset was calculated based on the 1:1,000,000 scale soil map and 8595 soil profiles of China’s second national soil survey and the regional land and climate simulation standard of the U.S. Department of Agriculture (soil texture classification standard is shown in Table 1). This study also used the data of soil hydraulic properties in China, which were provided by the National Cryosphere Desert Data Center of China (http://www.crensed.ac.cn/portal/, accessed on 21 August 2020).
This study extracted the growing season by using the base temperature threshold of 10 °C (≥10 °C) [47] based on the multi-year monthly average air temperature. The required grid data of monthly average temperature in China (1985–2014) were downloaded from the “National Tibetan Plateau Data Center” of China (http://data.tpdc.ac.cn, accessed on 13 May 2020). However, in the Qinghai Tibet Plateau, the maximum monthly average temperature in most areas is usually lower than 10 °C. Therefore, according to the local actual situation and previous studies [48,49], the growth season was defined as June to September.

2.3. Methods

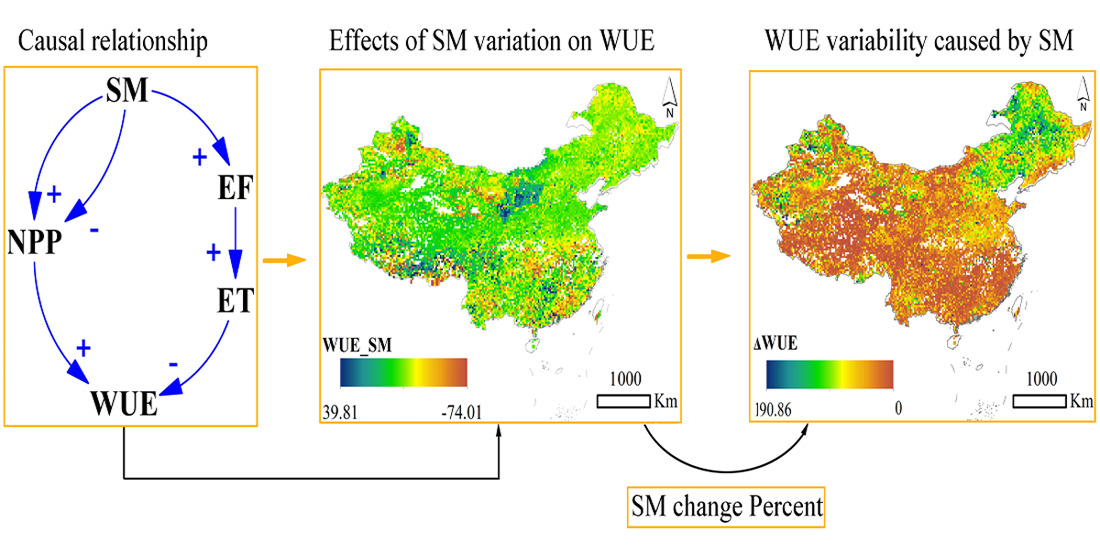
2.3.1. Mathematical Expression between SM and EF

Previous studies have proposed an effective analysis method for the functional relationship between the evaporation fraction (EF) and SM [50,51]. This method expressed the dependence of EF on SM (θ) as follows:
E F ( θ ) { 0 , if   θ < θ r E F max θ θ r θ c θ r , if   θ r θ θ s E F max , if   θ > θ s
where θ is volumetric soil moisture content (m3/m3), θc is the soil moisture at the critical point, and θr is the soil wilting coefficient. EF is the evaporative fraction, which is calculated as follows:
E F = L E R n
where LE is the latent heat flux and Rn is the surface net radiation. When θ < θr, EF is not always zero owing to the presence of hygroscopic SM [52]. Therefore, EFmin is defined as the EF value corresponding to a cumulative frequency percentage of 5%. In addition, when θ > θc, energy rather than SM became the dominant limiting factor for ET. Thus, the study similarly defined EFmax as the EF value corresponding to 95% of the cumulative frequency percentage. Because this study only focused on the functional relationship between SM and EF in the range of EFminEFEFmax, Equation (1) could be expressed as follows:
θ = E F E F max ( θ c θ r ) + θ r
This study estimated the raster map of θr using soil hydraulic parameters and soil texture datasets [53]. Although the fitting between EF and θ could obtain the parameter θc, it could result in great uncertainty. Thus, this study used the soil field capacity (θf) to replace θc and introduced a dimensionless parameter A into the calculation scheme for correction. Finally, Equation (3) was deformed as follows:
θ = E F E F max A ( θ f θ r ) + θ r
The gridded θ f value was also calculated using soil hydraulic parameters and soil texture datasets [53]. First, we used the monthly SM and EF data from 1985 to 2000 to fit the multi-year average monthly (January to December) parameter A. Then, the monthly SM from 2001 to 2014 was estimated using the EF data during the same period and the fitted parameter A. The GLDAS SM data finally verified the estimated soil moisture data during 2001–2014.

2.3.2. The Response of WUE to SM Variation

Generally, WUE is calculated as follows:
W U E = N P P E T
Based on Equation (2), ET could be expressed as follows:
E T = R n × E F L
where L is the latent heat of vaporization, which is the ratio of LE to ET. Thus, the elasticity of WUE to the variation of SM could be divided into two contributions based on Equations (4) to (6), as follows:
WUE θ = WUE ET ET θ + WUE NPP NPP θ
The first term on the right side of the equation describes the impact of SM variation on the ET process and the further influence on the WUE. This term was calculated based on Equations (3), (5) and (6). The second term on the right of the equation is the sensitivity of WUE to SM variation via the NPP pathway, which was estimated based on Equation (5) and the following statistical method:
ε = median [ ( N P P i N P P ¯ ) / N P P ¯ ( θ i θ ¯ ) / θ ¯ ]
where ε is the sensitivity coefficient; N P P ¯ and θ ¯ are the long-term average values of the NPP and SM in growing season of a pixel; NPPi and θi are the growing season values of NPP and SM in each year, respectively.
Thus, the following formula could be used to evaluate the average impact of SM variation on WUE in the past 30 years:
Δ W U E = | W U E θ | Δ θ
where Δ θ is the percentage change in SM in the growing season from 1985 to 2014. Thus, ∆WUE was the average influence (change percentage) of SM variation on WUE. Similarly, the impact of the maximum variation of SM on WUE was calculated as follows:
Δ W U E max = | W U E θ | Δ θ max
where Δ θ max is the maximum rate of change in SM during the growing season from 1985 to 2014, which was calculated as the difference between the maximum and minimum values of SM during the period. Δ W U E max is the maximum possible impact of SM variation on WUE during the growing season in past 30 years.

3. Results

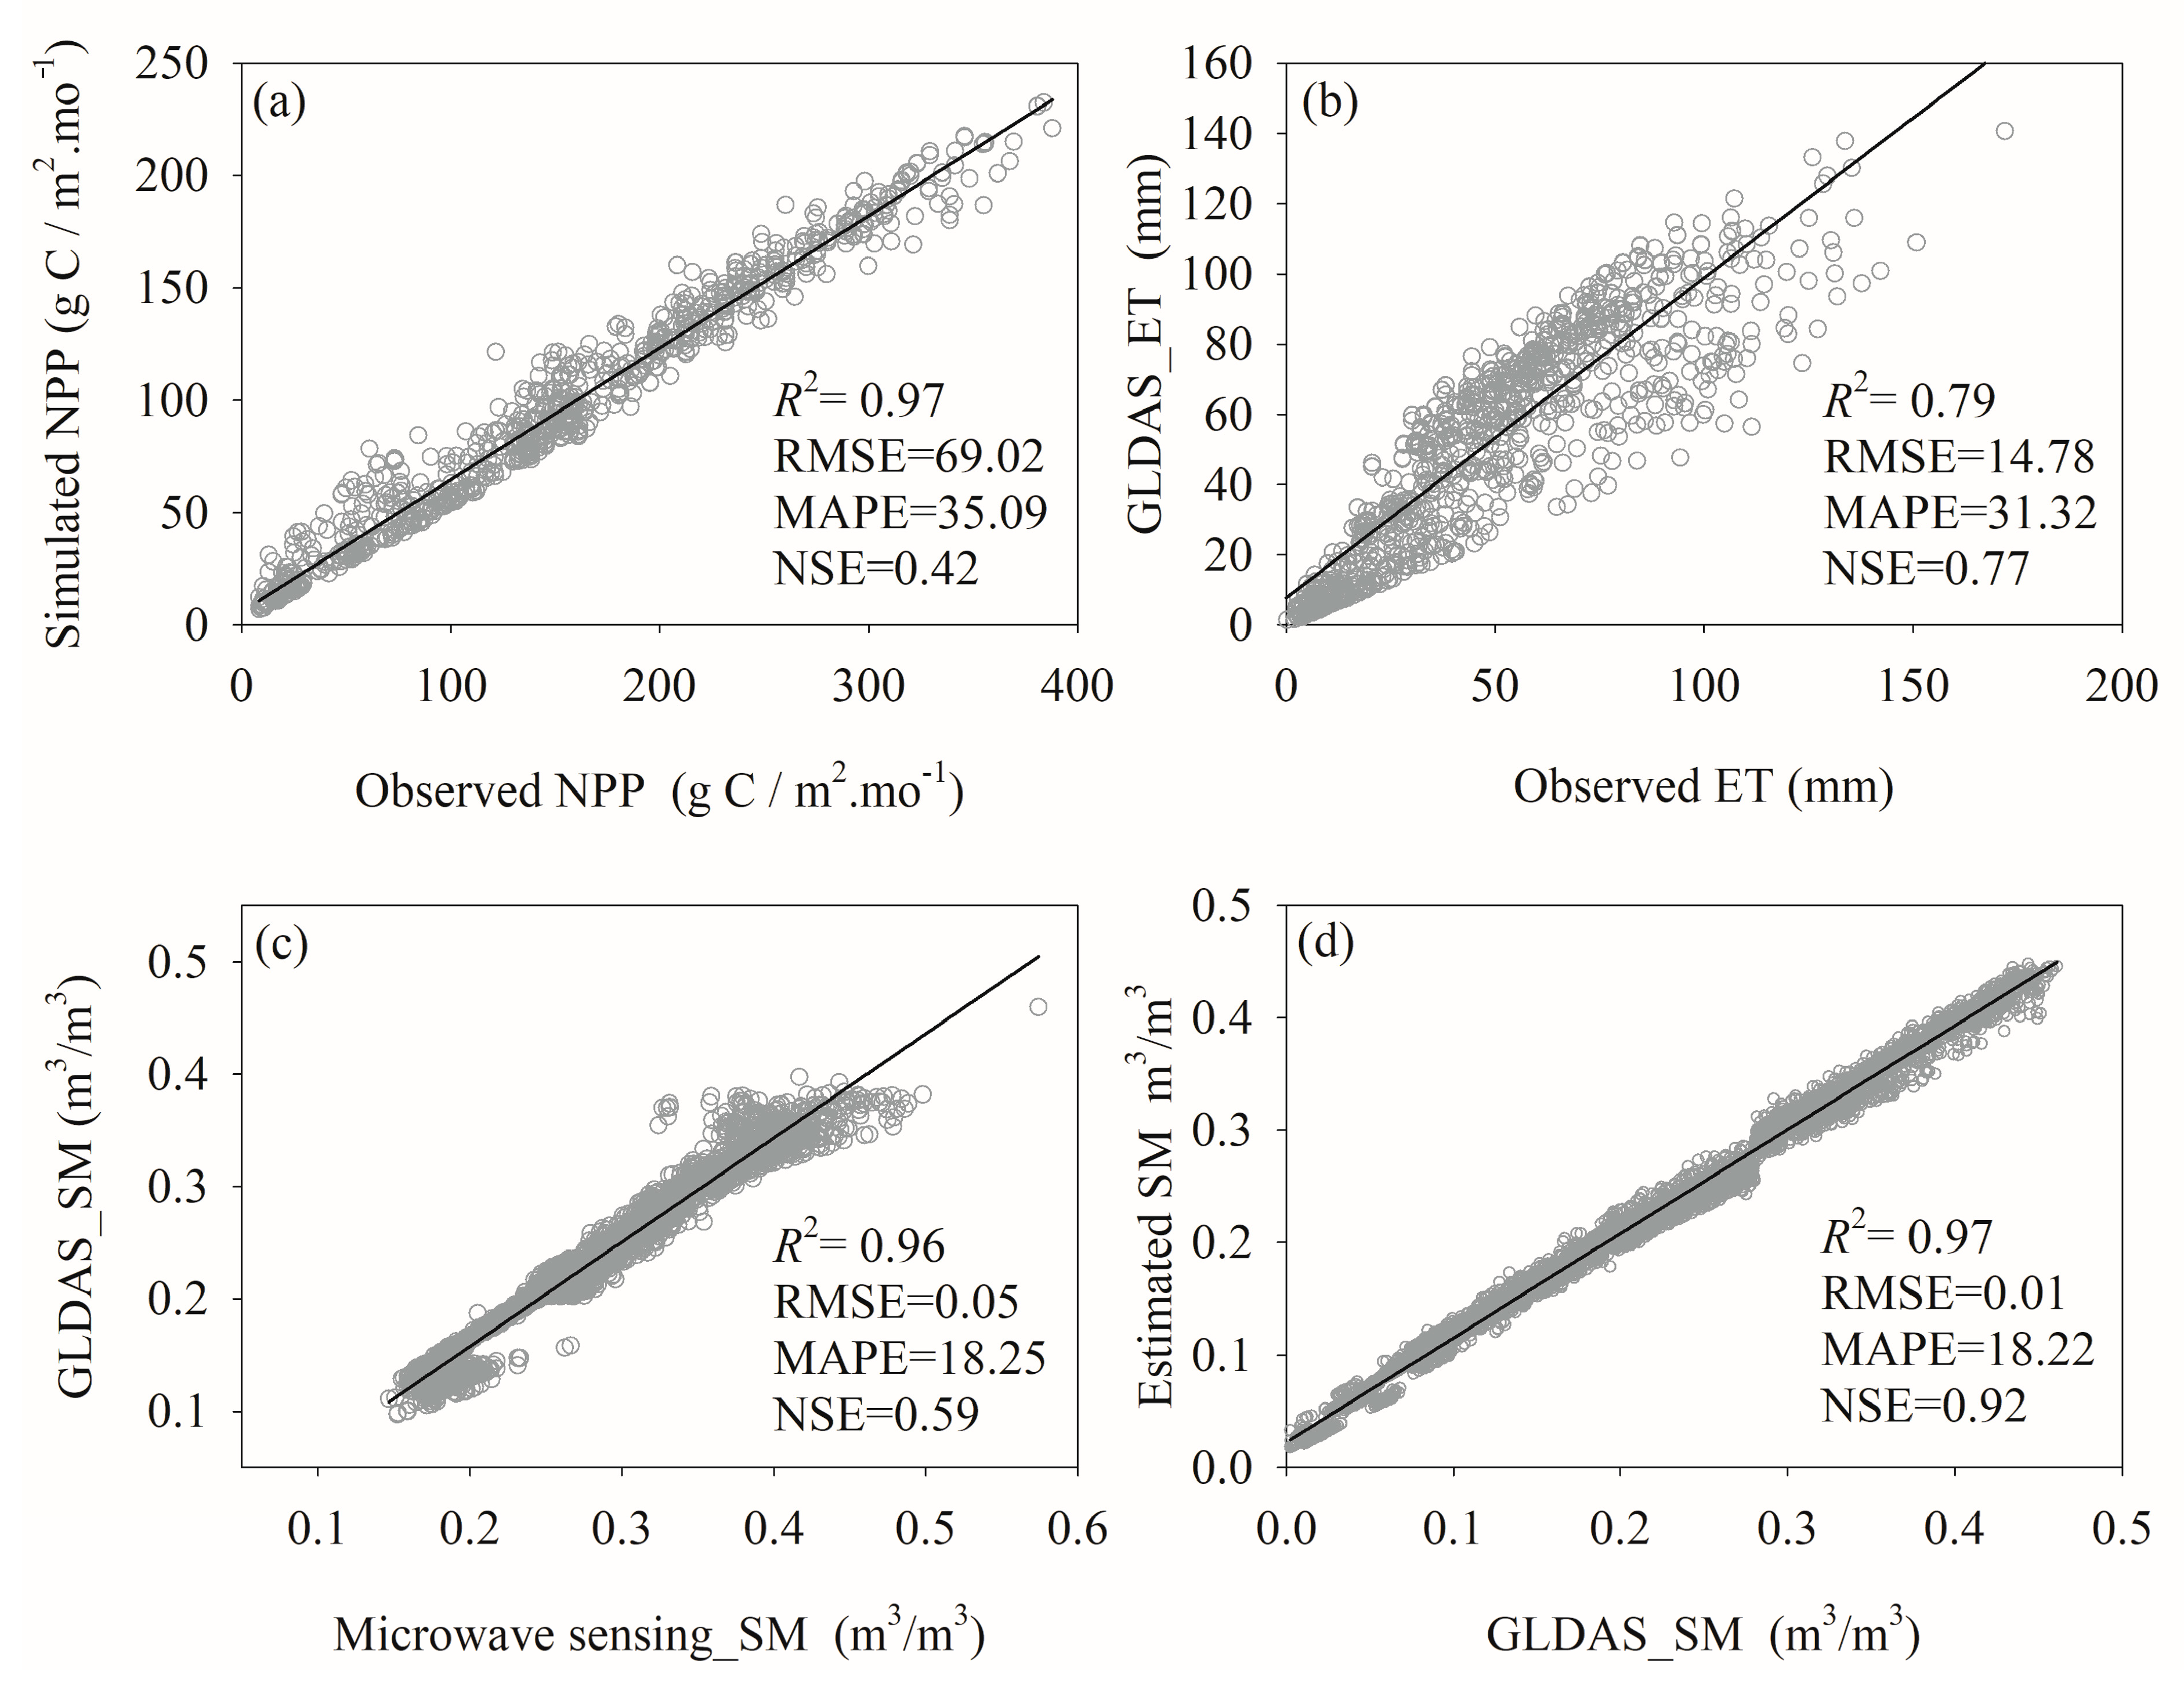
3.1. Data Verification

The analysis of this study was based on the output datasets of the climate model and remote sensing model, including the ET and SM datasets from GLDAS, and the NPP dataset from the Global Change Research Data Publishing & Repository of China. The verification results showed that the monthly ET of the GLDAS dataset and the observed ET data in 12 flux towers in China had a good consistence (Figure 2b). The determination coefficient (R2), root mean square error (RMSE), mean absolute percent error (MAPE), and Nash–Sutcliffe efficiency coefficient (NSE) between the simulated and measured ET values were 0.79, 14.78 mm, 31.32%, and 0.77, respectively. In addition, the verification results of NPP data showed that, although the estimated monthly NPP data used in this study underestimated the actual NPP, the R2, RMSE, MAPE, and NSE between the estimations and observations were 0.97, 69.02 g C·m−2·mo−1, 35.09%, and 0.42, respectively, which indicated that the NPP dataset used in this study was also consistent with the observations (Figure 2a). This study compared the SM data based on microwave remote sensing data assimilation in China (2002–2011) with GLDAS SM data (Figure 2c), owing to the lack of measured SM data. The results showed a good consistency, and the R2, RMSE, MAPE, and NSE values were 0.96, 0.05 m3·m−3, 18.25%, and 0.59, respectively. Furthermore, The monthly SM from 2001 to 2014 was estimated using Equation (4) and then verified using SM data of GLDAS. The overall trend of change in estimated SM was close to the GLDAS SM data, and the determination coefficient (R2) was 0.97 (Figure 2d). Meanwhile, the RMSE, MAPE, and NSE of this simulation were 0.01 m3·m−3, 18%, and 0.92, respectively. The fitting error was primarily due to the overestimation of SM, especially when the SM was low. This study may have overestimated SM in some arid regions or during dry seasons. Although there were still some simulation errors, the datasets used in this study were generally reliable and could ensure the accuracy of the results.

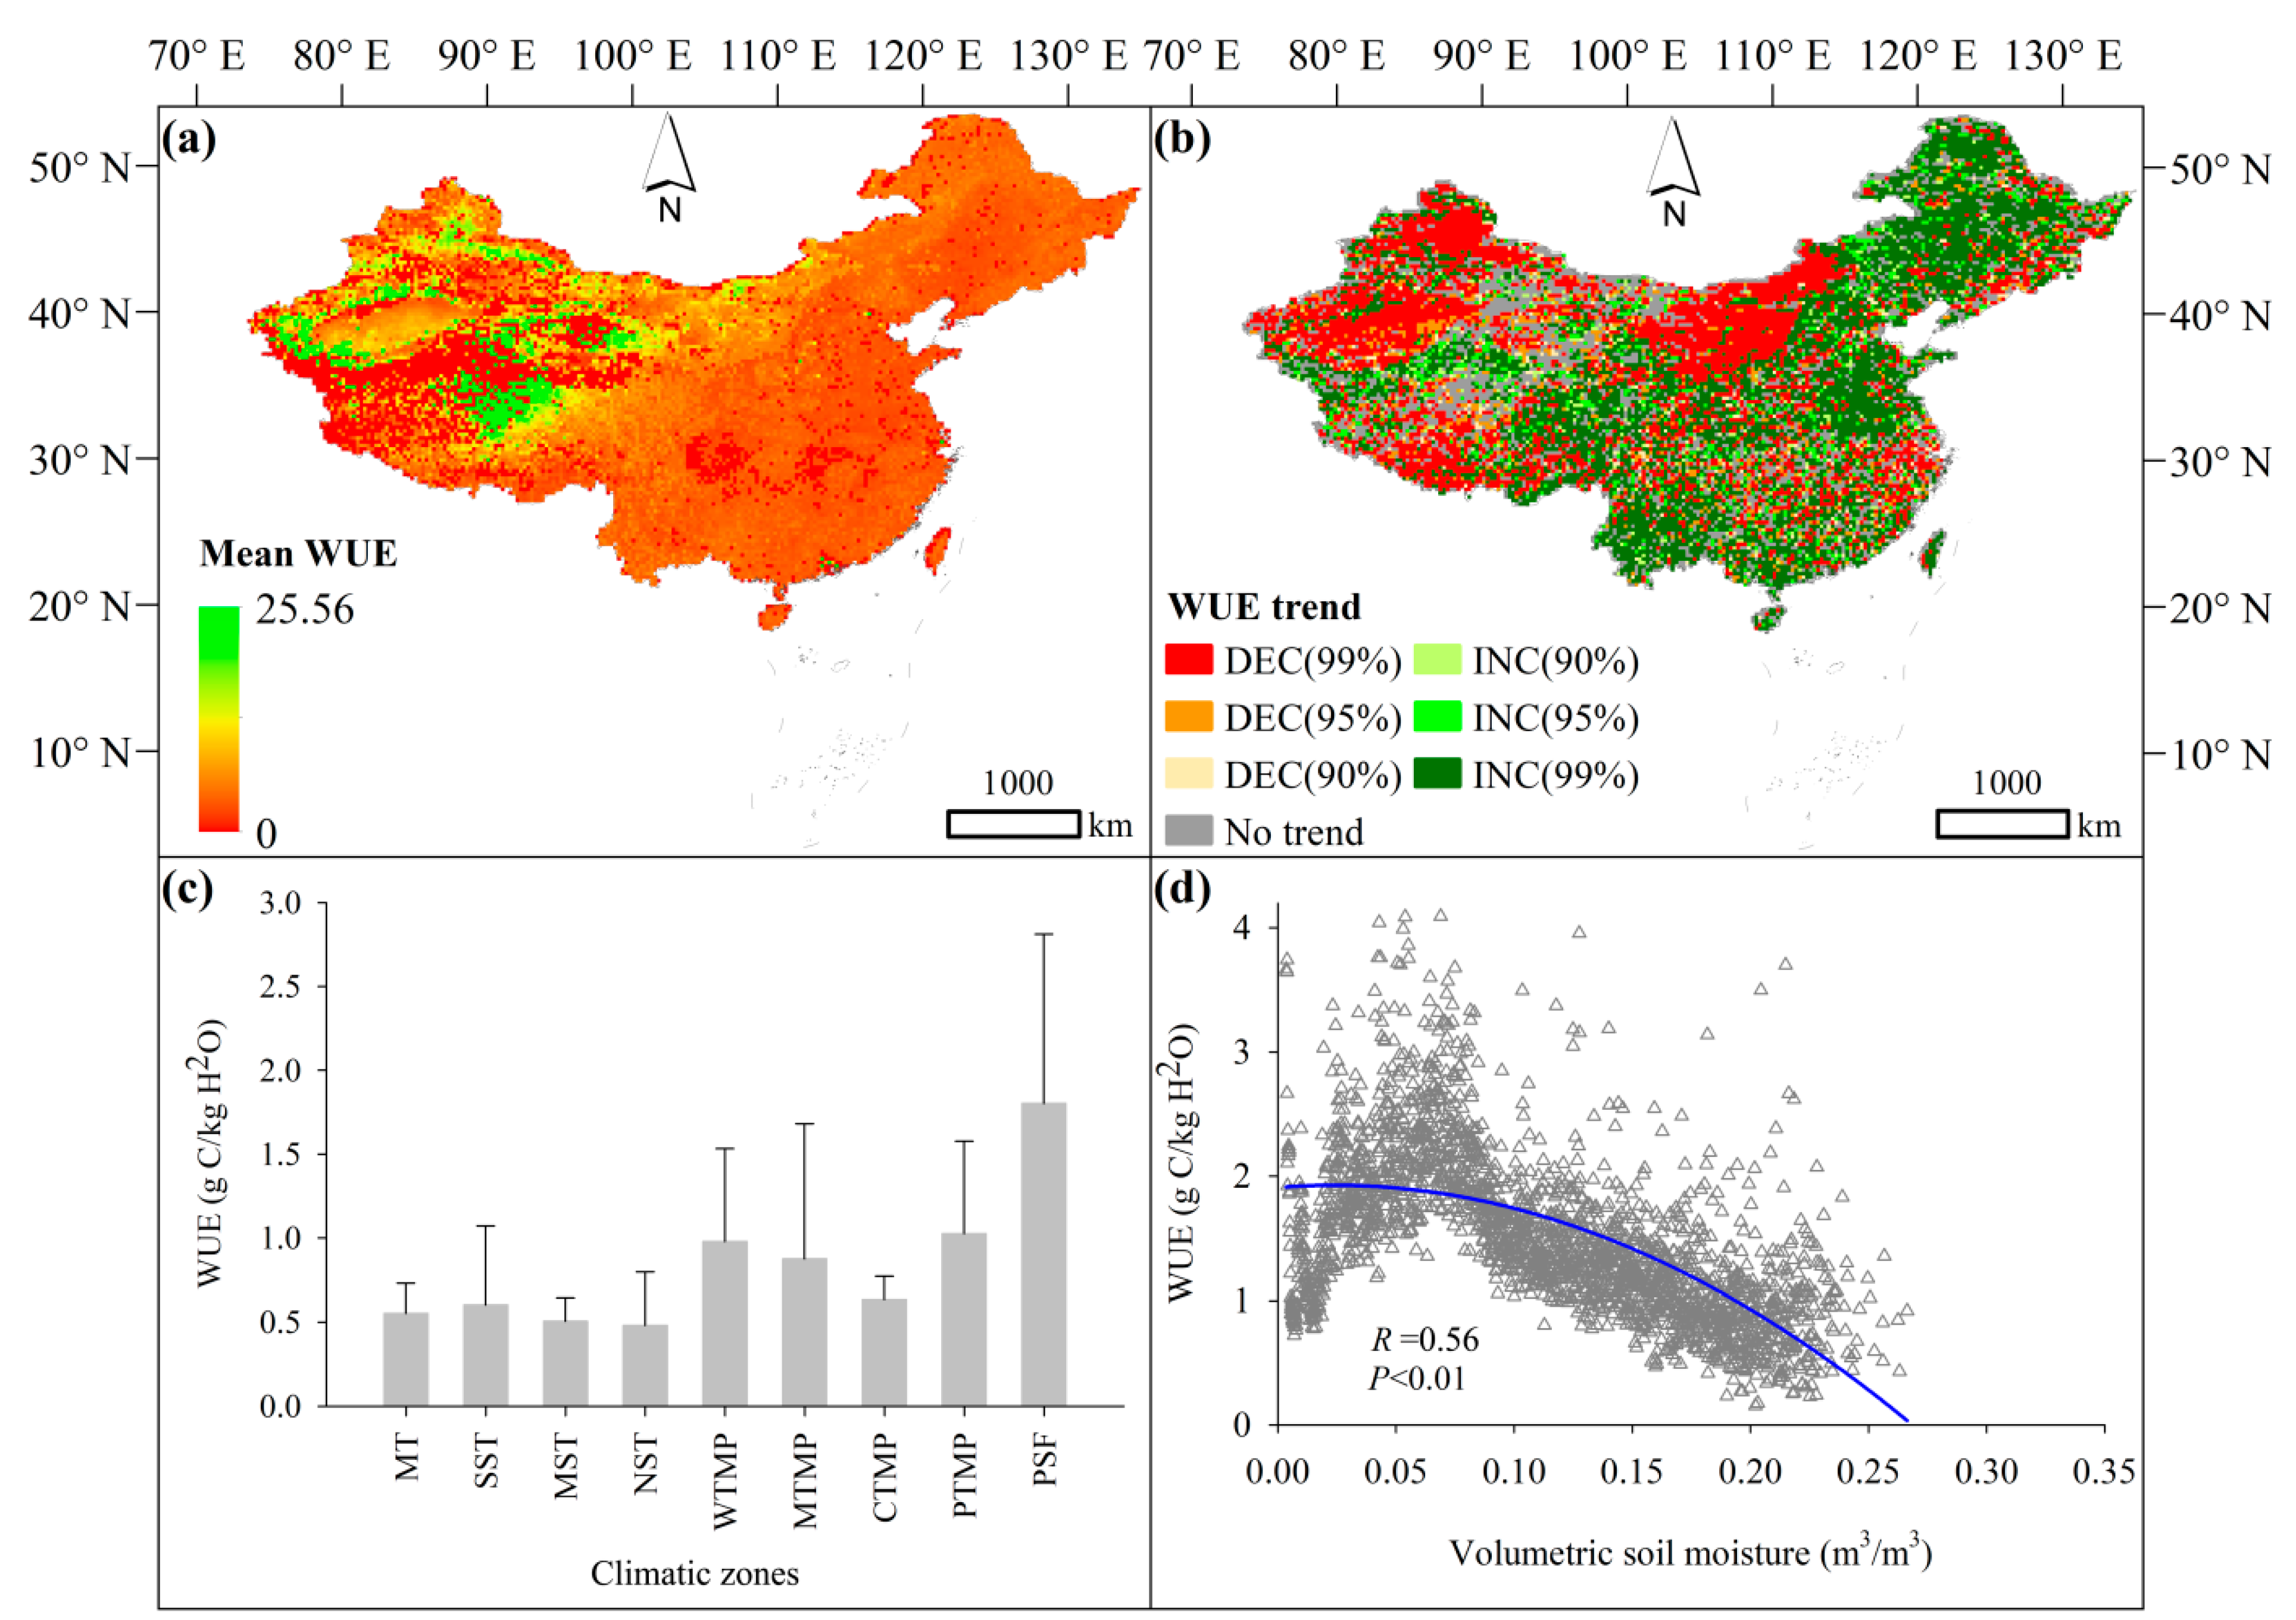
3.2. Spatiotemporal Variation of WUE

In terms of the growing season, the range of WUE in all terrestrial ecosystems was 0.02–19.26 g C/Kg H2O, with an average value of 1.05 g C/Kg H2O and a standard deviation of 1.45 g C/Kg H2O. Furthermore, the high-value areas of WUE were mainly located in the arid regions of Northwest China (Figure 3a). The spatial variation in WUE in the different climatic zone was also distinct (Figure 3c). The sub-frigid zone in the Qinghai–Tibet Plateau(PSF) and the temperate zone in the Qinghai–Tibet Plateau (PTMP) had the highest WUE, with maximum values of 1.80 g C/Kg H2O and 1.03 g C/Kg H2O, respectively. The north subtropics (NST) had the lowest WUE with a value of 0.48 g C/Kg H2O. The WUE in the warm temperate zone (WTMP), middle temperate zone (MTMP), cold temperate zone (CTMP), south subtropics zone (SST),marginal tropical(MT) zone, and middle subtropics zone (MST) was0.98, 0.87, 0.64, 0.60, 0.55, and 0.51 g C/Kg H2O, respectively. In general, the change in WUE was correlated with the SM (coefficient of determination: R = 0.56), and a higher SM usually led to a lower WUE (Figure 3d).
During the growing season, WUE showed a downward trend in 43.99% of the total area. Among these areas, WUE showed extremely significant (Sig = 0.99), significant (Sig = 0.95), and insignificant (Sig = 0.90) downward trends in 35.03%, 6.11%, and 2.58% of the total terrestrial ecosystem area, respectively. In contrast, WUE also showed an increasing trend in 34.91% of the total area of the terrestrial ecosystem. Among these areas, the percentage with extremely significant, significant, and insignificant increases in WUE was 28.07%, 4.94% and 1.91%, respectively. Thus, in the past 30 years, the WUE of the terrestrial ecosystem has generally shown a downward trend, especially in the arid areas of Northwest China, the Mongolian Plateau, and the southern Qinghai–Tibet Plateau. WUE also showed a significant downward trend in some areas of the monsoon region of China (Figure 3b).

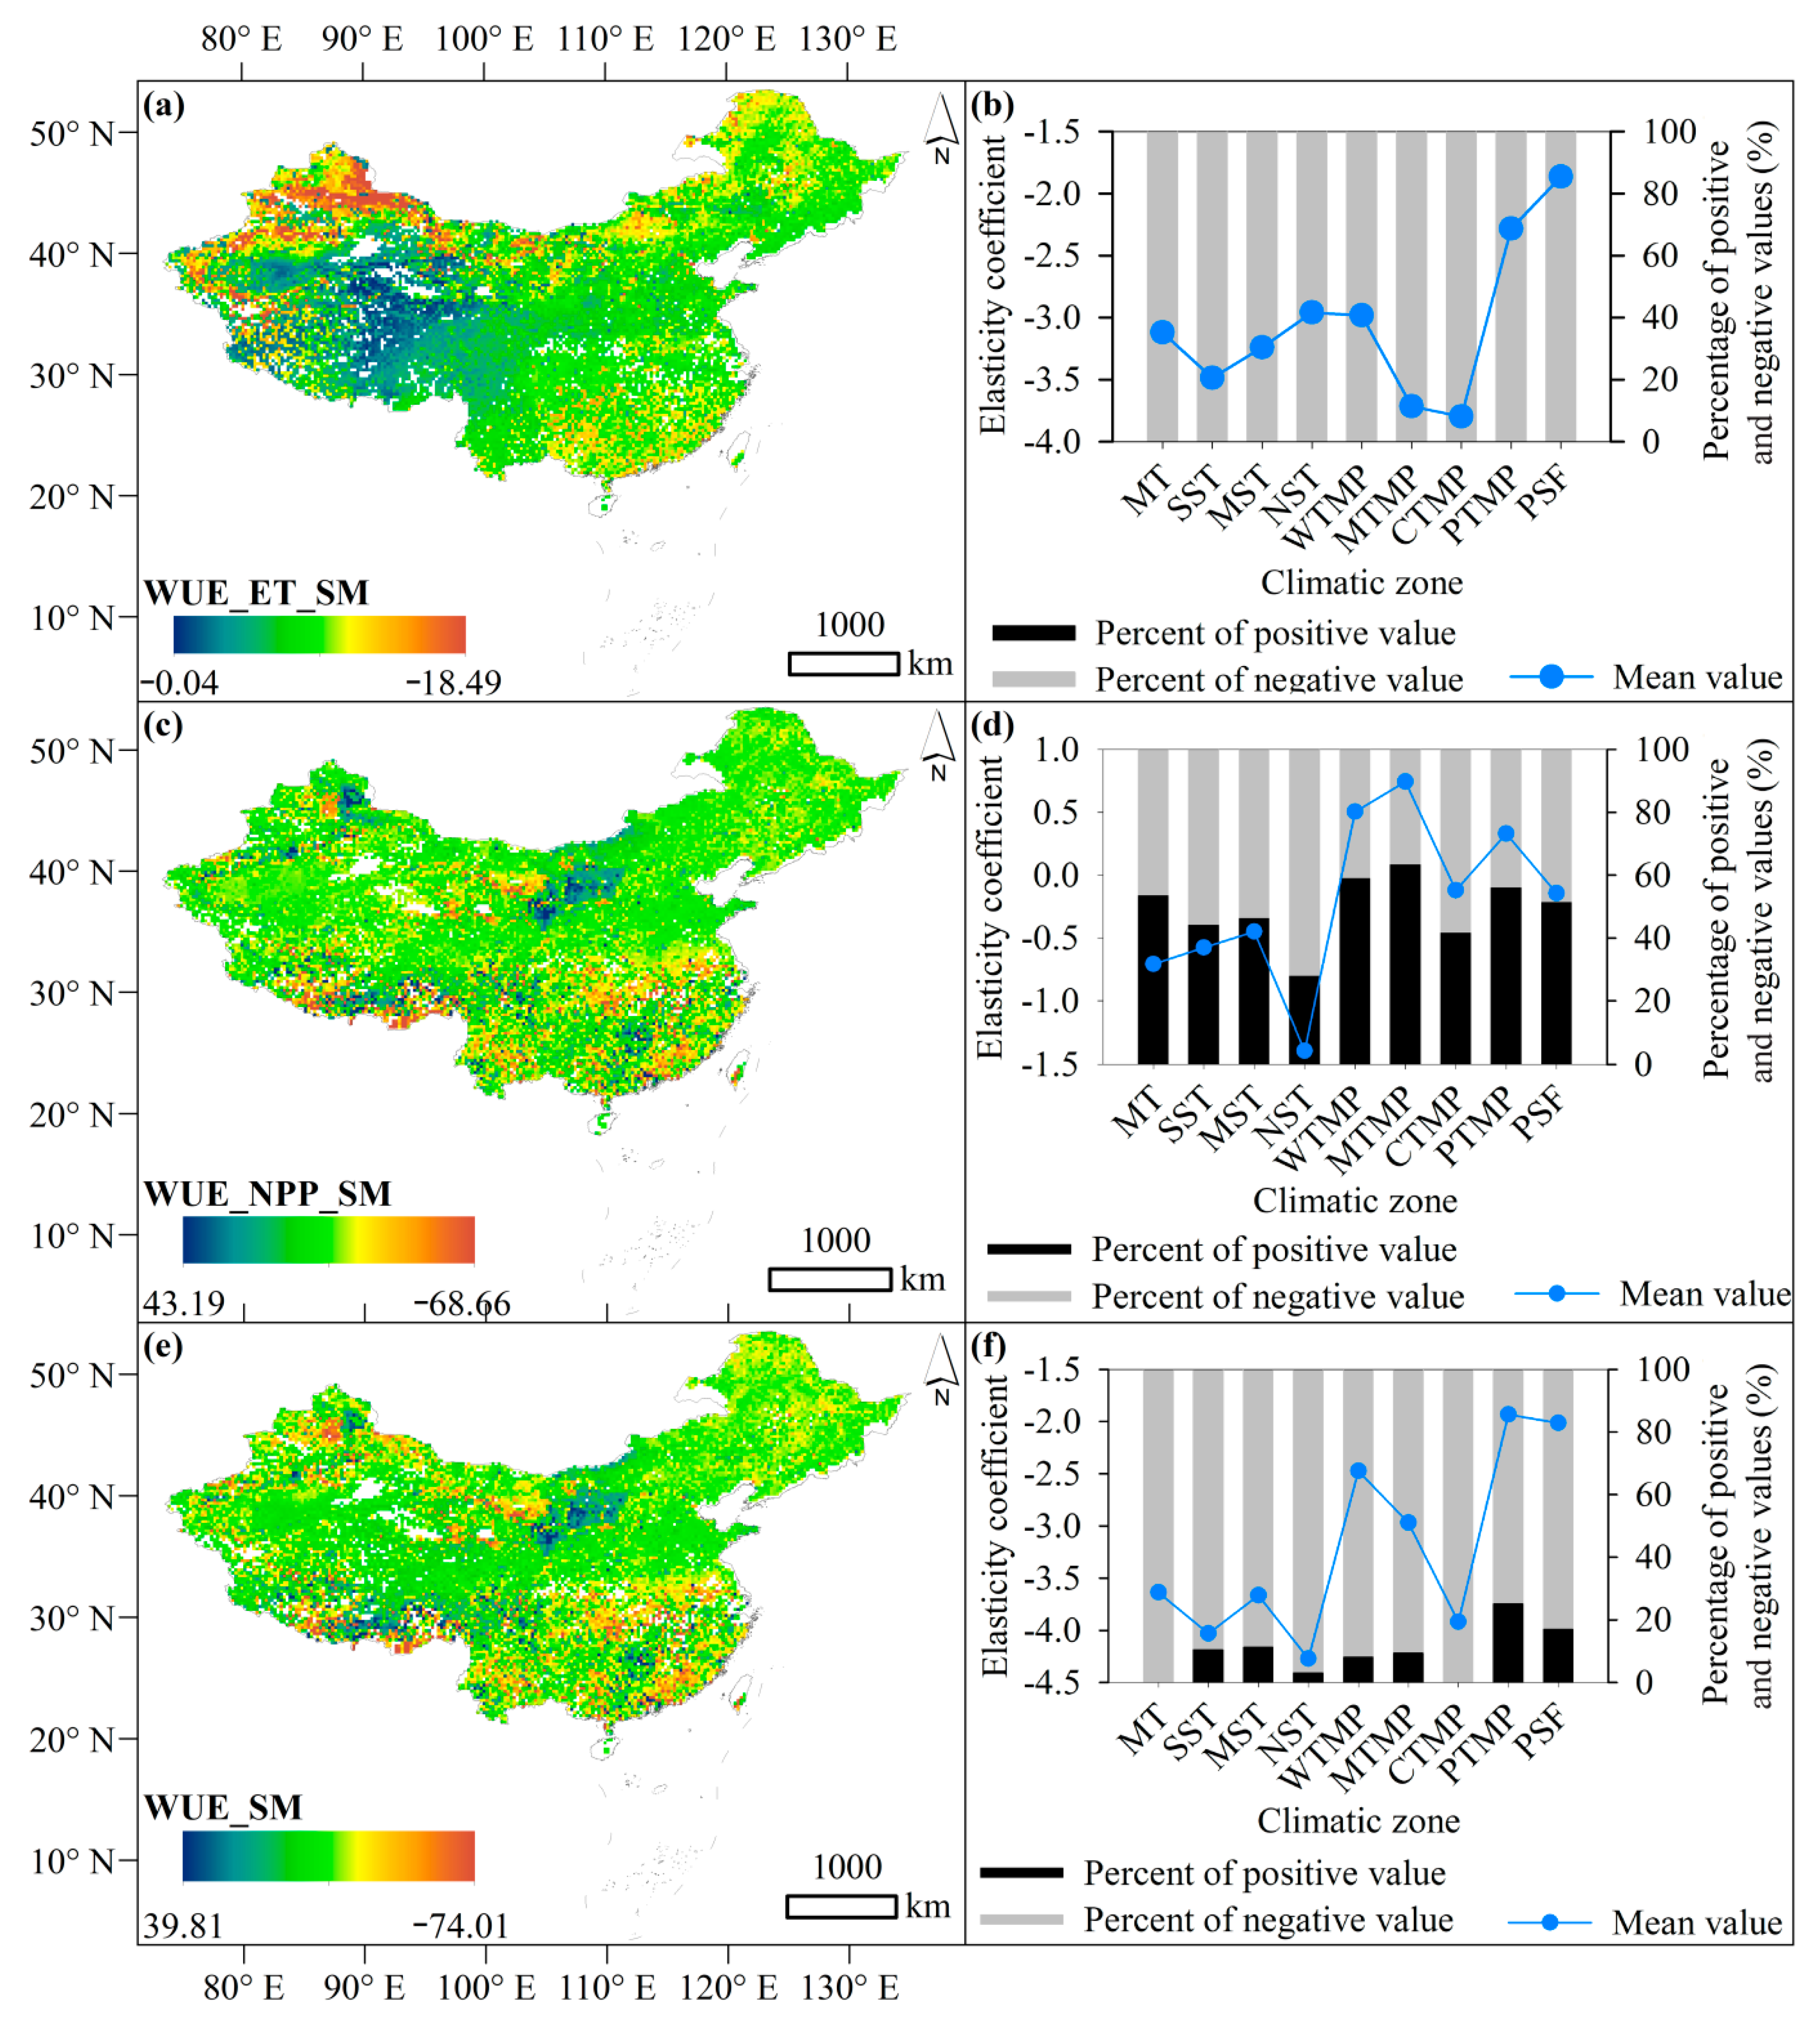
3.3. Elasticity of WUE to SM

The variation in SM can, simultaneously, directly affect the NPP and ET, which, ultimately, leads to the changes in WUE. On the ET pathway, the sensitivity coefficient of the WUE to SM ( W U E E T E T θ ) at the growing season scale ranged from −18.49 to −0.04, with an average of −3.02 (Figure 4a). Generally, the negative impact of SM on WUE via the ET pathway in the arid region of northwestern China was the most significant, followed by that in the southeast monsoon region. The impact in the central China region was relatively insignificant. This negative effect (Figure 4b) was mainly due to the negative feedback relationship between the WUE and ET (EF). In different climatic zones, the negative impact of SM on WUE via the ET pathway was the lowest in the PSF, and the average value of the elasticity coefficient was −1.87. The impact was the most significant in the CTMP, with an average elasticity coefficient being−3.80. In other zones, the adverse effects of SM on WUE via the ET pathway were in the order of MTMP, SST, MST, MT, WTMP, NST, and PTMP, with average elasticity coefficients of −3.72, −3.49, −3.24, −3.12, −2.98, −2.96, and −2.29, respectively (Figure 4b).
In the NPP pathway, the sensitivity coefficient of WUE to SM ( WUE NPP NPP θ ) had a more apparent spatial variation, and the value ranged from −68.66 to 43.19 with an average of 0.13 (Figure 4c). Thus, SM via the NPP pathway positively affected WUE in 55.71% of the area, whereas it showed a negative influence in the remaining 44.29% of the area. In addition, SM via the NPP pathway often had a more significant impact (larger absolute value) on WUE in the southeast monsoon region and northwestern arid region of China. In different climatic zones (Figure 4d), the impact of SM on WUE via the NPP pathway showed a positive effect in MTMP, WTMP, and PTMP, with elasticity coefficients of 0.74, 0.50, and 0.33, respectively. In contrast, the impacts of SM on WUE via the NPP pathway were negative in the other climatic zones, and the elasticity coefficients ranged from −1.39 to −0.12. Generally, the area percentage of the region in which SM had a positive effect on WUE via the NPP pathway ranged from 28.10% to 63.44% in different climatic zones.
Under the dual effects of ET and NPP pathways, the final SM significantly impacted WUE. The elasticity coefficient of WUE to SM ranged from −74.01 to 39.81, with an average value of −2.87 (Figure 4e). Because the impact of SM on WUE via the ET pathway was completely negative, the comprehensive influence of SM on WUE also showed a more remarkable negative effect. In the terrestrial ecosystem, SM negatively and positively impacted WUE in 84.62% and 15.38% of the total area, respectively. For each climatic zone, the average value of the effect of SM on WUE was also negative, and the negative effect was the most significant in the NST, which had an average elasticity coefficient of −4.27. The average value was the lowest in PTMP, which had an average elasticity coefficient of −1.93. For the other climatic zones, the elasticity coefficient of WUE to SM ranged from −4.03 to −2.01. Generally, the NPP pathway mainly determined the trend of change in WUE in different climatic zones, which was because the correlation coefficient between W U E θ and W U E N P P N P P θ (R = 0.84) was more significant than that between W U E θ and W U E E T E T θ (R = 0.69). In contrast, the ET pathway mostly dominated the influence level (absolute value of the elasticity coefficient of WUE to SM) of SM on the WUE (Figure 4b,d,f).

3.4. WUE Variability Caused by SM

In this study, the absolute value of the percentage change in the WUEWUE) was used as an index to analyze the WUE variability. Figure 5a shows that the variation of SM led to significant WUE variability, especially in northeast and northwest China. At the growing season scale, the average ΔWUE due to the variation in SM ranged from 0% to 190.86%, with an average value of 28.02% (Figure 5a). For different climatic zones (Figure 5c), SM in the CTMP had the most significant effect on WUE, causing an average variation in WUE of approximately 53.90%. In contrast, SM in the PTMP had the least impact on WUE, causing only, approximately, a 11.96% variability in WUE. For the other climatic zones, ΔWUE caused by SM variation in MTMP, WTMP, NST, MT, SST, MST, and PSF were 38.93%, 27.75%, 23.04%, 18.39%, 14.78%, 12.84%, and 12.30%, respectively. The spatial trend of the maximum WUE variability (ΔWUEmax) was similar to the variability of the ΔWUE (Figure 5b). It also had the greatest change in northeast and northwest China. Furthermore, the ΔWUEmax ranged from 0% to 758.78%, with an average value of 109.29%. These results indicated that the maximum change in SM over the past 30 years doubled the variability in WUE. In different climatic zones, the trend of change in ΔWUEmax was the same as that for ΔWUE, but the value of ΔWUEmax was larger than that of ΔWUE. ΔWUEmax was generally 3.7–4.4 times greater than ΔWUE (Figure 5c).
The feedback relationship between SM and WUE was affected by the climatic factors and vegetation cover. The ratio of vegetation cover between forest and non-forest was also an essential factor affecting the feedback relationship between WUE and SM (Figure 5d). The lower the forest cover, the more significant the change in WUE caused by changes in SM. As the forest cover increased, the variability of WUE caused by changes in SM rapidly decreased. When the cover ratio of forest to non-forest vegetation was higher than one, the variability of the WUE caused by changes in the SM tended to stabilize. The WUE of the forest ecosystem had strong resistance to variation in soil water. In contrast, the WUE of non-forest vegetation was more sensitive to the changes in SM.

4. Discussion

4.1. The Reliability of Evaluation Results

In most cases, SM dominates ET, especially in water-limited regions [54,55]. To explore the coupling relationship between SM and ET, researchers proposed a simple parameterization schematic, in which the SM and ET of a forest presented a linear relationship [56]. Recently, studies have proposed a conceptual framework for the dependence of the evaporative fraction (EF) on SM. It is suitable to analyze the soil moisture control on energy partitioning [50,51]. Based on this coupling relationship between SM and EF, this study established an evaluation framework for the feedback relationship between the WUE and SM. The uncertainty of this evaluating framework mainly originated from two aspects: (1) the reliability of the datasets used and (2) the uncertainty of the parameterized expression of EF and SM.
Previous studies have shown that evaporation, LE, H, and SM data in the GLDAS dataset have good applicability in China [57,58]. Our verification results (Figure 2) also showed that the datasets used in this study were, overall, reliable, despite some overestimation or underestimation. The analysis method for the coupling relationship between EF and SM has already been applied [51]; however, this framework needs to fit two parameters (namely, θc and θr), which may cause uncertainty. Given this, the study directly used two determined parameters, namely, θf, and θr, provided by the dataset of soil hydraulic parameters in China (http://data.tpdc.ac.cn, accessed on 13 May 2020). This study also introduced a dimensionless parameter A. Thus, this study only fit one parameter (A), which could avoid the uncertainty caused by the need to fit two parameters in the original equation and eliminate the error caused by possible overfitting. This study used the monthly SM and EF data from 1985 to 2000 to fit the multi-year average monthly parameter A. The monthly SM from 2001 to 2014 was estimated using Equation (4) and then verified using SM data of GLDAS (Figure 2d). The overall trend of change in estimated SM was close to the GLDAS SM data, and the R2, RMSE, MAPE, and NSE of this simulation were 0.99, 0.01 m3·m−3, 18%, and 0.98, respectively. Although there were still some simulation errors, the estimation was generally reliable. Furthermore, the trend of change in the estimated value was consistent with the GLDAS SM data; thus, the functional relationship between SM and EF was credible overall.

4.2. The Coupling Relationship between Soil Moisture and WUE

Studies have shown that WUE is sensitive to changing environments [59]. Generally, many factors, such as the CO2 concentration, nitrogen deposition, climatic factors, vegetation, human drivers, and SM, significantly influence WUE [6,60,61,62]. SM is one of the critical factors affecting WUE [21,63]. However, most studies have not thoroughly explored the mechanisms and accurate quantification of the effects of SM on WUE. Our results showed that SM had a completely negative influence on WUE via the ET pathway. However, SM also directly influenced WUE via the NPP pathway, which included negative (44.29% of the total areas) and positive effects (55.71% of the total areas); the overall positive effect was dominant. The areas in which SM had a negative impact on WUE via NPP were mainly distributed in the extremely arid desert areas of Northwest China, the cold temperate areas in Northeast China, and humid areas in Southeast China, which might have been caused by the negative impact of SM on NPP [64].
Under the dual effects of SM, there was a clear negative feedback relationship between WUE and SM, which was generally consistent with existing research [7,31]. The increase in SM often led to a decrease in WUE in most areas. The strength of the feedback relation between SM and WUE may have partly depended on the hydrothermal conditions of the local environment. However, the most significant feature of the spatial variability of the WUE in this study was that WUE showed a downward trend in the arid area of northwestern China. In contrast, there was an upward trend in the humid eastern region of China. Therefore, China’s terrestrial ecosystem WUE may be more dominated by ET than by NPP [21]. Because the NPP of tropical and subtropical vegetational zones is higher, it is generally approximately 8–10 times that of an arid desert and alpine vegetation areas in northwest China [65]. However, the WUE in the tropical and subtropical vegetation zones was smaller than that of the desert and alpine vegetation areas, which may have been due to excessive ET reducing the WUE. Furthermore, studies have shown that whether the effect of SM on WUE is positive or negative depends primarily on whether the ET or NPP process dominates the WUE process [21]. This study used the absolute value of WUE ET ET θ and WUE NPP NPP θ to determine which pathway of ET or NPP dominated the feedback relationship between SM and WUE. The results showed that the ET pathway dominated the feedback relationship between SM and WUE in 72% of the total area. The region in which the NPP pathway determined the feedback relationship only accounted for approximately 28% of the total area, especially in the Qinghai–Tibet Plateau. Therefore, terrestrial ecosystems can partially offset the influences of soil dryness by improving WUE. In addition, this adjustment should be more remarkable in areas where ET controls the WUE process, such as in the arid regions of the northwest.

4.3. Plausible Changing Trend and Adjustment of WUE

Under the background of climate change, especially with the increase in temperature and drought, the trend of change in WUE is uncertain. Studies have shown that a temperature rise would increase the NPP of global terrestrial ecosystems [66,67] However, the continuous temperature rise may eventually lead to a significant decrease in NPP [51], mainly owing to the limitation of the optimum temperature for plant growth [68,69]. Thus, WUE may show two completely different changes in future scenarios of a continuous temperature rise. First, the temperature rise in the early stage could result in a general increase in NPP. Meanwhile, the temperature rise in arid areas (water-limited areas) might not contribute much to ET, but may cause a linear increase in humid areas [65,66]. Therefore, under the early warming scenario, WUE in the arid region of northwestern China could tend to increase significantly. In the humid area, WUE may only slightly change. In contrast, in the late warming period, WUE in the arid northwestern region may become smaller, owing to the decrease in NPP. Correspondingly, the WUE in the humid eastern area may decline because of the possible continued increase in ET. In addition, future climate changes may lead to an increase in the frequency, intensity, and duration of drought events [70,71]. Therefore, drought will cause a decrease in SM, which will affect the trend of change in WUE.
Although studies have shown that an ecosystem can respond to increased drought by increasing WUE [7,8], this issue may not be straightforward. Because the WUE of different vegetation types has various responses to drought, the WUE may be positively or negatively correlated with drought and show a quadratic function relationships [59]. In the arid region, the decrease in SM caused by drought could lead to a much greater decline in ET compared with the change in NPP (increasing or decreasing trend) (Figure 4). Finally, a drought may lead to an increase in WUE in most areas of the arid region. In humid areas, the energy conditions mainly determine the evaporation process. Therefore, the decline in SM in the early drought stage might not cause a significant change in ET. At this time, the trend of change in WUE might mainly depend on the changing in NPP, which could show an upward or downward trend. With the aggravation of drought, SM could decrease significantly, which could cause a decline in ET. As a result, in the humid area, the original upward trend of WUE may be strengthened, and the original downward trend of WUE may be stabilized or even reversed in some cases.
To enhance the adaptability of ecosystems to future climate change or mitigate the adverse effects of climate change, it may be necessary to introduce the following suggestions:(1) In arid regions, the existing desert vegetation and grassland should be prevented from shrinking or degrading owing to intense human factors because these vegetation have a high ecosystem resilience [72]. (2) In arid areas with sparse vegetation, greening should be achieved by expanding grassland areas rather than artificial afforestation. C4 plants, which are usually dominated by herbaceous plants, have a higher internal WUE and can better adapt to the natural conditions of limited water and sufficient energy [73]. With the possible aggravation of drought in humid areas, expanding the C4 vegetation area can also be considered.

5. Conclusions

This study developed an analysis framework to quantitatively assess the influence of SM on WUE. Based on the analysis framework, this paper found that:
(1)
SM had an overall negative effect on the WUE in the terrestrial ecosystems during the last 30 years. In the NPP pathway, SM significantly affected WUE, and the sensitivity coefficient ranged from −68.66 to 43.19. However, in the ET pathway, SM completely negatively affected WUE. Under the dual effects of ET and NPP pathways, SM negatively affected WUE in 84.62% of the area, whereas it showed a positive influence on WUE in the remaining 15.38% of the area. Thus, although SM had a positive effect on the WUE of individual regions, it still had an overall negative effect on the WUE of each climatic zone.
(2)
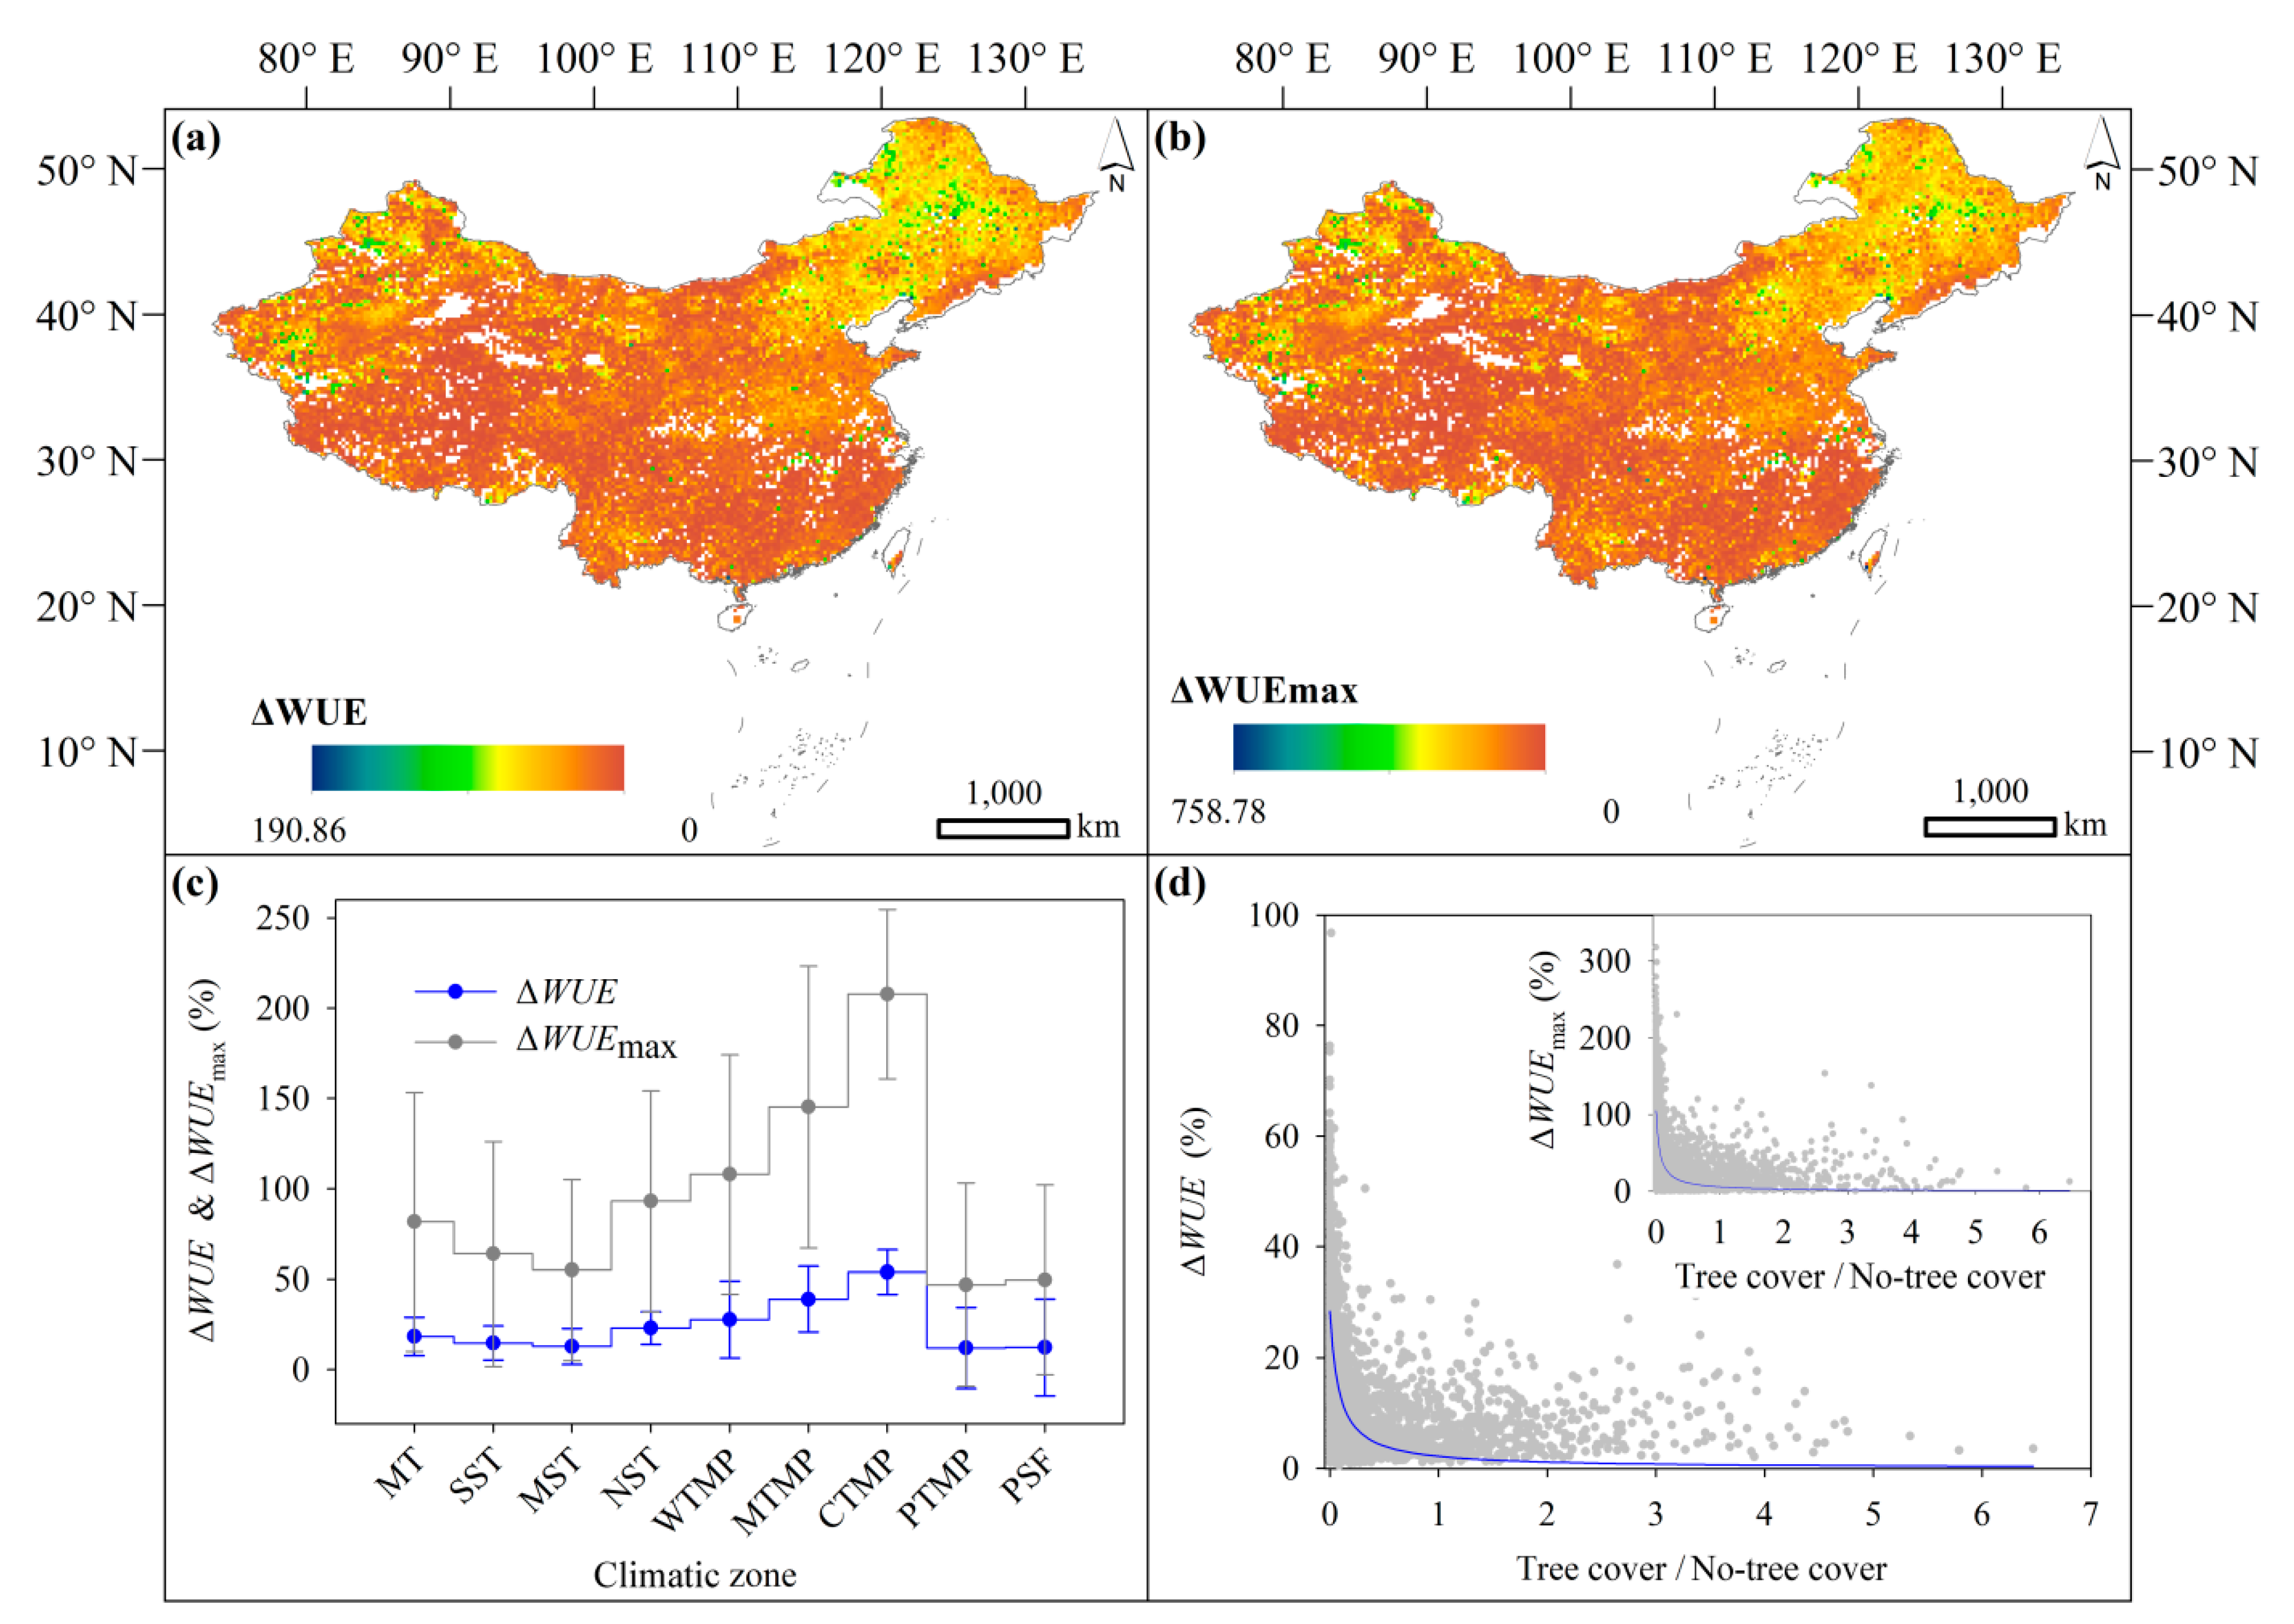
The variation in SM could lead to a significant WUE variability, especially in Northeast and Northwest China. During the growing season in the past 30 years, the average and maximum variability of WUE caused by variation in SM were 28.02% and 109.29%, respectively. Regarding different climatic zones, SM in CTMP had the greatest effect on WUE, whereas it had the least impact on WUE in PTMP. In addition, the lower the forest covers, the higher the variability of WUE caused by changes in SM. The WUE of forest ecosystems is more resistant to changes in SM, whereas the WUE of non-forest vegetation is more sensitive to changes in SM.
These findings deepened our understanding of WUE changes and their underlying mechanisms, thereby offering important insight for predicting the response of ecosystems to climate change.

Author Contributions

All authors contributed greatly to this work. Conceptualization, X.H.; methodology, X.H.; software, J.Z.; writing—original draft preparation, J.Z. and X.F.; validation, H.H.; formal analysis, X.F. and Y.L.; writing—review and editing, X.H.; project administration, X.H.; funding acquisition, X.H. All authors have read and agreed to the published version of the manuscript.

Funding

This research was supported by the National Natural Science Foundation of China (U1903114) and the Cross Team Project of the “Light of West China” Program of CAS (no: E0284101).

Institutional Review Board Statement

Not applicable.

Informed Consent Statement

Not applicable.

Data Availability Statement

The GLDAS dataset was obtained from the NASA Global Land Data Assimilation System (GLDAS) Noah model (GLDAS_NOAH025_M_2.0, https://disc.gsfc.nasa.gov/datasets, accessed on 10 October 2020). The monthly net primary productivity (NPP) dataset of China’s terrestrial ecosystems in the north of 18°N was obtained from the Global Change Research Data Publishing & Repository of China (http://www.geodoi.ac.cn/WebEn/CategoryList.aspx, accessed on 24 September 2020). The classification dataset of the soil texture (sand, silt, and clay content in 0–100 cm soil depth) and the soil moisture data based on the microwave remote sensing in China during 2002 and2011wereprovided by the “National Tibetan Plateau Data Center” of China (http://data.tpdc.ac.cn, accessed on 13 May 2020). The dataset of soil hydraulic parameters in China was provided by the “National Cryosphere Desert Data Center of China” (http://www.crensed.ac.cn/portal/, accessed on 21 August 2020). The observed ET and NPP (NEE) data in eight flux towers of China were provided by ChinaFLUX (http://www.cnern.org.cn/, accessed on 15 September 2021). The MODIS Land Cover Dynamics Product (MCD12Q2) was obtained from the National Aeronautics and Space Administration (http://modis.gsfc.nasa.gov/, accessed on 16 August 2020).

Conflicts of Interest

The authors declare no conflict of interest.

References

  1. Yu, G.; Song, X.; Wang, Q.; Liu, Y.; Guan, D.; Yan, J.; Sun, X.; Zhang, L.; Wen, X. Water-use efficiency of forest ecosystems in eastern China and its relations to climatic variables. New Phytol. 2008, 177, 927–937. [Google Scholar] [CrossRef]
  2. Aguilos, M.; Stahl, C.; Burban, B.; Hérault, B.; Bonal, D. Interannual and Seasonal Variations in Ecosystem Transpiration and Water Use Efficiency in a Tropical Rainforest. Forests 2018, 10, 14. [Google Scholar] [CrossRef] [Green Version]
  3. Malone, S.L.; Tulbure, M.G.; Pérez Luque, A.J.; Assal, T.J.; Bremer, L.L.; Drucker, D.P.; Hillis, V.; Varela, S.; Goulden, M.L. Drought resistance across California ecosystems: Evaluating changes in carbon dynamics using satellite imagery. Ecosphere 2016, 7, e01561. [Google Scholar] [CrossRef]
  4. Wang, L.; Li, M.; Wang, J.; Li, X. An analytical reductionist framework to separate the effects of climate change and human activities on variation in water use efficiency. Sci. Total Environ. 2020, 727, 138306. [Google Scholar] [CrossRef]
  5. Lavergne, A.; Graven, H.; De Kauwe, M.G.; Keenan, T.F.; Medlyn, B.E.; Prentice, I.C. Observed and modelled historical trends in the water-use efficiency of plants and ecosystems. Glob. Chang. Biol. 2019, 25, 2242–2257. [Google Scholar] [CrossRef] [PubMed] [Green Version]
  6. Zhao, J.X.; Feng, H.Z.; Xu, T.R.; Xiao, J.F.; Gueerieri, R.; Liu, S.M.; Wu, X.C.; He, X.L.; He, X.P. Physiological and environmental control on ecosystem water use efficiency in response to drought across the northern hemisphere. Sci. Total Environ. 2020, 758, 143599. [Google Scholar] [CrossRef]
  7. Yang, S.; Zhang, J.; Han, J.; Wang, J.; Ron, Y. Evaluating global ecosystem water use efficiency response to drought based on multi-model analysis. Sci. Total Environ. 2021, 778, 146356. [Google Scholar] [CrossRef] [PubMed]
  8. Guo, L.; Sun, F.; Liu, W.; Zhang, Y.; Wang, H.; Cui, H.; Wang, H.; Zhang, J.; Du, B. Response of Ecosystem Water Use Efficiency to Drought over China during 1982 2015: Spatiotemporal Variability and Resilience. Forests 2019, 10, 598. [Google Scholar] [CrossRef] [Green Version]
  9. Hao, X.; Hao, H.; Zhang, J. Soil moisture influenced the variability of air temperature and oasis effect in a large inland basin of an arid region. Hydrol. Process. 2021, 35, e14246. [Google Scholar] [CrossRef]
  10. Yin, D.; Roderick, M.L.; Leech, G.; Sun, F.; Huang, Y. The contribution of reduction in evaporative cooling to higher surface air temperatures during drought. Geophys. Res. Lett. 2014, 41, 7891–7897. [Google Scholar] [CrossRef] [Green Version]
  11. Zheng, H.; Lin, H.; Zhou, W.; Bao, H.; Zhu, X.; Jin, Z.; Song, Y.; Wang, Y.; Liu, W.; Tang, Y. Revegetation has increased ecosystem water-use efficiency during 2000–2014 in the Chinese Loess Plateau: Evidence from satellite data. Ecol. Indic. 2019, 102, 507–518. [Google Scholar] [CrossRef]
  12. Liu, W.; Sun, F.; Sun, S.; Guo, L.; Wang, H.; Cui, H. Multi-scale assessment of eco-hydrological resilience to drought in China over the last three decades. Sci. Total Environ. 2019, 672, 201–211. [Google Scholar] [CrossRef]
  13. Zou, J.; Ding, J.L.; Welp, M.; Huang, S.; Liu, B.H. Assessing the Response of Ecosystem Water Use Efficiency to Drought During and after Drought Events across Central Asia. Sensors 2020, 20, 581. [Google Scholar] [CrossRef] [Green Version]
  14. Mokhtar, A.; He, H.; Alsafadi, K.; Mohammed, S.; He, W.; Li, Y.; Zhao, H.; Abdullahi, N.M.; Gyasi-Agyei, Y. Ecosystem Water Use Efficiency Response to Drought over Southwest China. Ecohydrology 2021, e2317. [Google Scholar] [CrossRef]
  15. He, B.; Wang, H.; Huang, L.; Liu, J.; Chen, Z. A new indicator of ecosystem water use efficiency based on surface soil moisture retrieved from remote sensing. Ecol. Indic. 2017, 75, 10–16. [Google Scholar] [CrossRef] [Green Version]
  16. Bai, Y.; Zha, T.; Bourque, C.P.A.; Jia, X.; Ma, J.; Liu, P.; Yang, R.; Li, C.; Du, T.; Wu, Y. Variation in ecosystem water use efficiency along a southwest-to-northeast aridity gradient in China. Ecol. Indic. 2020, 110, 105932. [Google Scholar] [CrossRef]
  17. Zhao, J.; Xu, T.; Xiao, J.; Liu, S.; Mao, K.; Song, L.; Yao, Y.; He, X.; Feng, H. Responses of Water Use Efficiency to Drought in Southwest China. Remote Sens. 2020, 12, 199. [Google Scholar] [CrossRef] [Green Version]
  18. Huang, L.; He, B.; Han, L.; Liu, J.; Wang, H.; Chen, Z. A global examination of the response of ecosystem water-use efficiency to drought based on MODIS data. Sci. Total Environ. 2017, 601–602, 1097–1107. [Google Scholar] [CrossRef] [PubMed]
  19. Jung, M.; Reichstein, M.; Ciais, P.; Seneviratne, S.I.; Sheffield, J.; Goulden, M.L.; Bonan, G.; Cescatti, A.; Chen, J.; de Jeu, R.; et al. Recent decline in the global land evapotranspiration trend due to limited moisture supply. Nature 2010, 467, 951–954. [Google Scholar] [CrossRef]
  20. van der Molen, M.K.; Dolman, A.J.; Ciais, P.; Eglin, T.; Gobron, N.; Law, B.E.; Meir, P.; Peters, W.; Phillips, O.L.; Reichstein, M.; et al. Drought and ecosystem carbon cycling. Agric. For. Meteorol. 2011, 151, 765–773. [Google Scholar] [CrossRef]
  21. Liu, X.; Feng, X.; Fu, B. Changes in global terrestrial ecosystem water use efficiency are closely related to soil moisture. Sci. Total Environ. 2020, 698, 134165. [Google Scholar] [CrossRef] [PubMed]
  22. Wang, C.; Fu, B.; Zhang, L.; Xu, Z. Soil moisture plant interactions: An ecohydrological review. J. Soils Sediments 2019, 19, 1–9. [Google Scholar] [CrossRef]
  23. Stocker, B.D.; Zscheischler, J.; Keenan, T.F.; Prentice, I.C.; Pe Uelas, J.; Seneviratne, S.I. Quantifying soil moisture impacts on light use efficiency across biomes. New Phytol. 2018, 218, 1430–1449. [Google Scholar] [CrossRef] [PubMed] [Green Version]
  24. Granier, A.; Reichstein, M.; Bréda, N.; Janssens, I.A.; Falge, E.; Ciais, P.; Grünwald, T.; Aubinet, M.; Berbigier, P.; Bernhofer, C.; et al. Evidence for soil water control on carbon and water dynamics in European forests during the extremely dry year: 2003. Agric. For. Meteorol. 2007, 143, 123–145. [Google Scholar] [CrossRef]
  25. Tong, X.; Mu, Y.; Zhang, J.; Meng, P.; Li, J. Water stress controls on carbon flux and water use efficiency in a warm-temperate mixed plantation. J. Hydrol. 2019, 571, 669–678. [Google Scholar] [CrossRef]
  26. Nie, C.; Huang, Y.; Zhang, S.; Yang, Y.; Zhou, S.; Lin, C.; Wang, G. Effects of soil water content on forest ecosystem water use efficiency through changes in transpiration/evapotranspiration ratio. Agric. For. Meteorol. 2021, 308–309, 108605. [Google Scholar] [CrossRef]
  27. Boese, S.; Jung, M.; Carvalhais, N.; Reichstein, M. The importance of radiation for semiempirical water-use efficiency models. Biogeosciences 2017, 14, 3015–3026. [Google Scholar] [CrossRef] [Green Version]
  28. Aguilos, M.; Hérault, B.; Burban, B.; Wagner, F.; Bonal, D. What drives long-term variations in carbon flux and balance in a tropical rainforest in French Guiana? Agric. For. Meteorol. 2018, 253, 114–123. [Google Scholar] [CrossRef]
  29. Qi, H.; Huang, F.; Zhai, H. Monitoring Spatio-Temporal Changes of Terrestrial Ecosystem Soil Water Use Efficiency in Northeast China Using Time Series Remote Sensing Data. Sensors 2019, 19, 1481. [Google Scholar] [CrossRef] [Green Version]
  30. Begum, F.A.; Paul, N.K. Influence of Soil Moisture on Growth, Water Use and Yield of Mustard. J. Agron. Crop Sci. 2010, 170, 136–141. [Google Scholar] [CrossRef]
  31. Ahmadi, B.; Ahmadalipour, A.; Tootle, G.; Moradkhani, H. Remote Sensing of Water Use Efficiency and Terrestrial Drought Recovery across the Contiguous United States. Remote Sens. 2019, 11, 731. [Google Scholar] [CrossRef] [Green Version]
  32. Liu, L.; Gudmundsson, L.; Hauser, M.; Qin, D.; Seneviratne, S.I. Soil moisture dominates dryness stress on ecosystem production globally. Nat. Commun. 2020, 11, 1234567890. [Google Scholar] [CrossRef]
  33. Joiner, J.; Yoshida, Y.; Anderson, M.; Holmes, T.; Hain, C.; Reichle, R.; Koster, R.; Middleton, E.; Zeng, F.-W. Global relationships among traditional reflectance vegetation indices (NDVI and NDII), evapotranspiration (ET), and soil moisture variability on weekly timescales. Remote Sens. Environ. 2018, 219, 339–352. [Google Scholar] [CrossRef] [PubMed] [Green Version]
  34. Talsma, C.J.; Good, S.P.; Jimenez, C.; Martens, B.; Fisher, J.B.; Miralles, D.G.; McCabe, M.F.; Purdy, A.J. Partitioning of evapotranspiration in remote sensing-based models. Agric. For. Meteorol. 2018, 260–261, 131–143. [Google Scholar] [CrossRef]
  35. Li, X.D.; Shao, M.A.; Zhao, C.L.; Liu, T.; Ma, C.K. Regional spatial variability of root-zone soil moisture in arid regions and the driving factors—A case study of Xinjiang, China. Can. J. Soil Sci. 2019, 99, 277–291. [Google Scholar] [CrossRef]
  36. Peterson, A.M.; Helgason, W.H.; Ireson, A.M. How spatial patterns of soil moisture dynamics can explain field-scale soil moisture variability: Observations from a sodic landscape. Water Resour. Res. 2019, 55, 4410–4426. [Google Scholar] [CrossRef]
  37. Potter, C.S.; Randerson, J.T.; Field, C.B.; Matson, P.A.; Klooster, S.A. Terrestrial Ecosystem Production: A Process Model Based on Global Satellite and Surface Data. Glob. Biogeochem. Cycles 1993, 7, 811–841. [Google Scholar] [CrossRef]
  38. Piao, S.L.; Fang, J.Y.; Guo, Q.H. Application of casa model to the estimation of Chinese terrestrial net primary productivity. Chin. J. Plant Ecol. 2001, 025, 603–608. [Google Scholar]
  39. Fang, J.Y.; Piao, S.L.; Field, C.B.; Pan, Y.D.; Guo, Q.H.; Zhou, L.M.; Peng, C.H.; Tao, S. Increasing net primary production in China from 1982 to 1999. Ecol. Environ. 2003, 1, 293–297. [Google Scholar] [CrossRef]
  40. Feng, X.; Liu, G.; Chen, J.M.; Chen, M.; Liu, J.; Ju, W.M.; Sun, R.; Zhou, W. Net primary productivity of China’s terrestrial ecosystems from a process model driven by remote sensing. J. Environ. Manag. 2007, 85, 563–573. [Google Scholar] [CrossRef]
  41. Pei, F.; Li, X.; Liu, X.; Lao, C. Assessing the impacts of droughts on net primary productivity in China. J. Environ. Manag. 2013, 114, 362–371. [Google Scholar] [CrossRef]
  42. Liang, W.; Yang, Y.; Fan, D.; Guan, H.; Zhang, T.; Long, D.; Zhou, Y.; Bai, D. Analysis of spatial and temporal patterns of net primary production and their climate controls in China from 1982 to 2010. Agric. For. Meteorol. 2015, 204, 22–36. [Google Scholar] [CrossRef]
  43. Chen, P.F. Monthly NPP Dataset Covering China’s Terrestrial Ecosystems at North of 18°N (1985–2015). J. Glob. Chang. Data Discov. 2019, 3, 34–41. [Google Scholar]
  44. Yang, K.; Watanabe, T.; Koike, T.; Li, X.; Fuji, H.; Tamagawa, K.; Ma, Y.M.; Ishikawa, H. Auto-calibration system developed to assimilate AMSR-E data into a land surface model for estimating soil moisture and the surface energy budget. J. Meteorol. Soc. Jpn. 2007, 85A, 229–242. [Google Scholar] [CrossRef] [Green Version]
  45. Yang, K.; Chen, Y.; He, J.; Zhao, L.; Lu, H.; Qin, J.; Zheng, D.; Li, X. Development of a daily soil moisture product for the period of 2002–2011 in Chinese mainland. Sci. China Earth Sci. 2020, 63, 1113–1125. [Google Scholar] [CrossRef]
  46. Yang, K.; Zhu, L.; Chen, Y.; Zhao, L.; Qin, J.; Lu, H.; Tang, W.; Han, M.; Ding, B.; Fang, N. Land surface model calibration through microwave data assimilation for improving soil moisture simulations. J. Hydrol. 2016, 533, 266–276. [Google Scholar] [CrossRef]
  47. Liu, B.; Henderson, M.; Zhang, Y.; Ming, X. Spatiotemporal change in China’s climatic growing season: 1955–2000. Clim. Chang. 2010, 99, 93–118. [Google Scholar] [CrossRef]
  48. Li, P.; Hu, Z.; Liu, Y. Shift in the trend of browning in Southwestern Tibetan Plateau in the past two decades. Agric. For. Meteorol. 2020, 287, 107950. [Google Scholar] [CrossRef]
  49. Wang, J.F.; Wang, G.X.; Wang, Y.B.; Li, Y.S. Influences of the degradation of swamp and alpine meadows on CO2 emission during growing season on the Qinghai-Tibet Plateau. Chin. Sci. Bull. 2007, 52, 2565–2574. [Google Scholar] [CrossRef]
  50. Schwingshackl, C.; Hirschi, M.; Seneviratne, S.I. Quantifying Spatiotemporal Variations of Soil Moisture Control on Surface Energy Balance and Near-Surface Air Temperature. J. Clim. 2017, 30, 7105–7124. [Google Scholar] [CrossRef]
  51. Seneviratne, S.I.; Corti, T.; Davin, E.L.; Hirschi, M.; Jaeger, E.B.; Lehner, I.; Orlowsky, B.; Teuling, A.J. Investigating soil moisture–climate interactions in a changing climate: A review. Earth Sci. Rev. 2010, 99, 125–161. [Google Scholar] [CrossRef]
  52. Nishat, S.; Guo, Y.; Baetz, B.W. Development of a simplified continuous simulation model for investigating long-term soil moisture fluctuations. Agric. Water Manag. 2007, 92, 53–63. [Google Scholar] [CrossRef]
  53. Wang, B.; Huang, J.; Gong, X. Grid Soil Moisture Constants Estimation based on HWSD over Basin. J. China Hydrol. 2015, 35, 8–11. [Google Scholar]
  54. Purdy, A.J.; Fisher, J.B.; Goulden, M.L.; Colliander, A.; Halverson, G.; Tu, K.; Famiglietti, J.S. SMAP soil moisture improves global evapotranspiration. Remote Sens. Environ. 2018, 219, 1–14. [Google Scholar] [CrossRef]
  55. Walker, E.; García, G.A.; Venturini, V.; Carrasco, A. Regional evapotranspiration estimates using the relative soil moisture ratio derived from SMAP products. Agric. Water Manag. 2019, 216, 254–263. [Google Scholar] [CrossRef]
  56. Brandes, D.; Wilcox, B.P. Evapotranspiration and soil moisture dynamics on a semiarid ponderosa pine hillslope. Jawra J. Am. Water Resour. Assoc. 2000, 36, 965–974. [Google Scholar] [CrossRef]
  57. Xue, B.L.; Wang, L.; Li, X.P.; Yang, K.; Chen, D.L.; Sun, L.T. Evaluation of evapotranspiration estimates for two river basins on the Tibetan Plateau by a water balance method. J. Hydrol. 2013, 492, 290–297. [Google Scholar] [CrossRef]
  58. Syed, T.H.; Fa Miglietti, J.S.; Rodell, M.; Chen, J.; Wilson, C.R. Analysis of terrestrial water storage changes from GRACE and GLDAS. Water Resour. Res. 2008, 44, W02433. [Google Scholar] [CrossRef]
  59. Hao, X.; Ma, H.; Hua, D.; Qin, J.; Zhang, Y. Response of ecosystem water use efficiency to climate change in the Tianshan Mountains, Central Asia. Environ. Monit. Assess. 2019, 191, 561. [Google Scholar] [CrossRef] [PubMed]
  60. Huang, M.; Piao, S.; Zeng, Z.; Peng, S.; Ciais, P.; Cheng, L.; Mao, J.; Poulter, B.; Shi, X.; Yao, Y. Seasonal responses of terrestrial ecosystem water-use efficiency to climate change. Glob. Chang. Biol. 2016, 22, 2165–2177. [Google Scholar] [CrossRef] [PubMed]
  61. Hu, Z.; Yu, G.; Fu, Y.; Sun, X.; Li, Y.; Shi, P.; Wangw, Y.; Zheng, Z. Effects of vegetation control on ecosystem water use efficiency within and among four grassland ecosystems in China. Glob. Chang. Biol. 2010, 14, 1609–1619. [Google Scholar] [CrossRef]
  62. Li, B.; Huang, F.; Chang, S.; Sun, N. The Variations of Satellite-Based Ecosystem Water Use and Carbon Use Efficiency and Their Linkages with Climate and Human Drivers in the Songnen Plain, China. Adv. Meteorol. 2019, 2019, 8659138. [Google Scholar] [CrossRef] [Green Version]
  63. Garcia, A.; Guerra, L.C.; Hoogenboom, G. Water use and water use efficiency of sweet corn under different weather conditions and soil moisture regimes. Agric. Water Manag. 2009, 96, 1369–1376. [Google Scholar] [CrossRef]
  64. Su, B.; Shangguan, Z. Decline in soil moisture due to vegetation restoration on the Loess Plateau of China. Land Degrad. Dev. 2018, 30, 290–299. [Google Scholar] [CrossRef]
  65. Chen, F.; Shen, Y.; Qian, L.; Ying, G.; Xu, L. Spatio-temporal variation analysis of Ecological system NPP in China In past 30 years. Sci. Geogr. Sin. 2011, 31, 1409–1414. [Google Scholar]
  66. Yu, M.; Wang, G.; Parr, D.; Ahmed, K.F. Future changes of the terrestrial ecosystem based on a dynamic vegetation model driven with RCP8.5 climate projections from 19 GCMs. Clim. Chang. 2014, 127, 257–271. [Google Scholar] [CrossRef]
  67. Yu, L.; Gu, F.; Huang, M.; Tao, B.; Hao, M.; Wang, Z. Impacts of 1.5 °C and 2 °C Global Warming on Net Primary Productivity and Carbon Balance in China’s Terrestrial Ecosystems. Sustainability 2020, 12, 2849. [Google Scholar] [CrossRef] [Green Version]
  68. Lüdeke, M.K.B.; Dönges, S.; Otto, R.D.; Kindermann, J.; Badeck, F.W.; Ramge, P.; Jäkel, U.; Kohlmaier, G.H. Responses in NPP and carbon stores of the northern biomes to a CO2-induced climatic change, as evaluated by the Frankfurt biosphere model (FBM). Tellus 2010, 47, 191–205. [Google Scholar] [CrossRef] [Green Version]
  69. Pei, Y.; Huang, J.; Wang, L.; Chi, H.; Zhao, Y. An improved phenology-based CASA model for estimating net primary production of forest in central China based on Landsat images. Int. J. Remote Sens. 2018, 39, 7664–7692. [Google Scholar] [CrossRef]
  70. Sun, C.X.; Huang, G.H.; Fan, Y.; Zhou, X.; Lu, C.; Wang, X.Q. Drought Occurring with Hot Extremes: Changes under Future Climate Change on Loess Plateau, China. Earth’s Future 2019, 7, 587–604. [Google Scholar] [CrossRef] [Green Version]
  71. Waseem, M.; Ajmal, M.; Ahmad, I.; Khan, N.M.; Azam, M.; Sarwar, M.K. Projected drought pattern under climate change scenario using multivariate analysis. Arab. J. Geosci. 2021, 14, 1–13. [Google Scholar] [CrossRef]
  72. Fan, X.; Hao, X.; Hao, H.; Zhang, J.; Li, Y. Comprehensive Assessment Indicator of Ecosystem Resilience in Central Asia. Water 2021, 13, 124. [Google Scholar] [CrossRef]
  73. Zhang, D.S.; Li, A.L.; Lam, S.K.; Li, P.; Zong, Y.Z.; Gao, Z.Q.; Hao, X.Y. Increased carbon uptake under elevated CO2 concentration enhances water-use efficiency of C4 broomcorn millet under drought. Agric. Water Manag. 2021, 245, 106631. [Google Scholar] [CrossRef]
Figure 1. Sketch map of climatic zones (left)and the length of growing seasons (right) in the terrestrial ecosystemsof China.
Remotesensing 13 04257 g001
Figure 2. Accuracy verification of net primary production (NPP), evapotranspiration (ET), and soil moisture data used in this study. (a) Scatter plot between the estimated and measured monthly NPP from 12 flux towers from 2003 to 2010; (b) scatter plot between the monthly ET data from the Global Land Data Assimilation System (GLDAS) dataset and the measured monthly ET data from 12 flux towers from 2003 to 2010; (c) scatter plot between the monthly volumetric soil moisture in the root zone (0–100 cm soil layer) from the GLDAS dataset and the SM dataset based on microwave sensing from 2002 to 2011; (d) scatter plot between the estimated (in this study) and GLDAS soil moisture data in the root zone (0–100 cm soil layer) of the study area.
Remotesensing 13 04257 g002
Figure 3. Temporal and spatial variation characteristics of water use efficiency (WUE) in the terrestrial ecosystems of China during the growing season from 1985 to 2014. (a) Multi-year average WUE in the growing season; (b) Mann–Kendall test of the WUE change trend (“DEC” is the decrease trend and “INC” is the increase trend) in the growing season; (c) multi-year average WUE in the growing season in different climatic zones, whiskers indicate standard deviation; (d) scatter plot between WUE and SM in the growing season, and the blue solid line is the change trend of fitted by quadratic curve. The abbreviations of MT, SST, MST, NST, WTMP, MTMP, CTMP, PTMP, and PSF represent the marginal tropical zone, south subtropics zone, middle subtropics zone, north subtropics zone, warm temperate zone, middle temperate zone, cold temperate zone, temperate zone in Qinghai–Tibet Plateau, and the sub-frigid zone in Qinghai–Tibet Plateau (PSF), respectively.
Remotesensing 13 04257 g003
Figure 4. Spatial characteristics of the elasticity coefficient of water use efficiency (WUE) to soil moisture (SM) change in the growing season of the terrestrial ecosystem in China during 1985–2014. Panels (a,c,e) show the raster map of the sensitivity of WUE to SM variation via the evapotranspiration (ET) and net primary production (NPP) pathways and the final effects of both pathways, respectively. Panels (b,d,f) show the sensitivity of WUE to SM variation via the ET pathway and NPP pathway and the final effects of both pathways in different climatic zones, respectively. The abbreviations of MT, SST, MST, NST, WTMP, MTMP, CTMP, PTMP, and PSF represent the marginal tropical zone, south subtropics zone, middle subtropics zone, north subtropics zone, warm temperate zone, middle temperate zone, cold temperate zone, temperate zone in Qinghai–Tibet Plateau and the sub-frigid zone in Qinghai–Tibet Plateau (PSF), respectively.
Remotesensing 13 04257 g004
Figure 5. Percentage change in water use efficiency (ΔWUE) caused by soil moisture variation in the terrestrial ecosystem in the growing season. Panels (a,b) represent the spatial variation characteristics of the ΔWUE and ∆WUEmax of the entire terrestrial ecosystem, respectively. Panel (c) represents ΔWUE and ∆WUEmax in different climatic zones. Panel (d) shows the scatter plot between the variation in WUE and the ratio of tree cover to no-tree vegetation cover. The abbreviations of MT, SST, MST, NST, WTMP, MTMP, CTMP, PTMP, and PSF represent Marginal tropical zone, south subtropics zone, middle subtropics zone, north subtropics zone, warm temperate zone, middle temperate zone, cold temperate zone, temperate zone in Qinghai–Tibet Plateau and the sub-frigid zone in Qinghai–Tibet Plateau (PSF), respectively.
Remotesensing 13 04257 g005
Table 1. Soil texture classification standard of soil texture dataset.
Soil Diameter (mm)
>33~22~11~0.50.5~0.250.25~0.10.1~0.050.05~0.002<0.002
rockgravelsandsiltclay
very coarse sandcoarse sandmedium sandfine sandvery fine sand
Publisher’s Note: MDPI stays neutral with regard to jurisdictional claims in published maps and institutional affiliations.

