Article

Ecogeomorphological Transformations of Aeolian Form—The Case of a Parabolic Dune, Poland

by
Roksana Zarychta
1,
Adrian Zarychta
2,* and
Katarzyna Bzdęga
2
1
Institute of Geography, Faculty of Exact and Natural Sciences, Pedagogical University of Krakow, Podchorążych 2, 30-084 Kraków, Poland
2
Institute of Biology, Biotechnology and Environmental Protection, Faculty of Natural Sciences, University of Silesia, Jagiellońska 28, 40-032 Katowice, Poland
*
Author to whom correspondence should be addressed.
Remote Sens. 2021, 13(19), 3937; https://doi.org/10.3390/rs13193937
Submission received: 6 August 2021 / Revised: 29 September 2021 / Accepted: 29 September 2021 / Published: 1 October 2021
(This article belongs to the Special Issue Ecogeomorphological Research Using Satellite Images)

Abstract

:
The range of natural environmental degradation caused by anthropogenic activity may include geomorphological forms such as dunes resulting from the build-up activity of the wind. In effect, such environmental transformation affects changes connected not only with their relief, but also with the presence and health of diverse plant and animal inhabitants. The subject of the survey was a parabolic dune with asymmetric shape, the sand of which was subjected to exploitation over many years. Terrain data acquired by means of GNSS (Global Navigation Satellite Systems) served to elaborate the present relief of the surveyed dune and to reconstruct its primary relief. These were mainly places where the impacts of human activities were recorded. For this purpose, ordinary kriging (OK) estimation was performed. Simultaneously, satellite data and UAV (Unmanned Aerial Vehicle) imaging were acquired, and subjected to image fusion in order to acquire near infrared bands (NIR), red, green, blue in high spatial resolution. These in turn were applied so as to estimate the condition of the vegetation overplanting the dune and surrounding terrain. The correctness of the modelling was verified by cross-validation (CV), which disclosed low error values. Such values in present and primary relief were, respectively, mean error (ME) at −0.009 and −0.014, root mean square error (RMSE) at 0.564 and 0.304 and root mean square standardised error (RMSSE) at 0.999 and 1.077. Image fusion, with use of pansharpening allowed a colour-infrared composition (CIR) and a Modified Chlorophyll Absorption in Reflectance Index 1 (MCARI1) to be obtained. Their analysis disclosed that vegetation on the dune is characterised by worse health condition as compared with the surrounding area thereof. The proposed approach enabled the environmental condition of the surveyed dune to be analysed, and thereby it allows for a determination of the consequences of further uncontrolled sand recovery without taking into account the historical cartographic materials customarily considered to be the main source of information.

Graphical Abstract

1. Introduction

Human economic activities, and especially mineral raw material recovery, have caused great changes in the natural environment [1,2,3]. Soil degradation and disturbance of water relations are frequently the sources of the permanent modifications of these areas and result in serious transformations, e.g., in landscape and species composition of flora and fauna [4,5,6,7,8,9,10]. Simultaneously, strong changes take place in the relief [11,12,13,14,15,16]. These activate a series of geomorphological processes such as slope, aeolian, erosion processes, etc. [5].
Increasingly, with regard to mineral raw material grabbing, such operations are often illegal or unmonitored as they take place in underdeveloped or developing countries. Such grabbing includes sand which, together with gravel, constitutes the important natural aggregates used in the building trades. The problem concerns areas where uncontrolled and irrational raw material management contributes to their significant depletion [4,17,18]. However, rational exploitation of these raw materials may have a benefit, e.g., new habitats for plants and animals [6,19]. In the developed world, terrains from which they are recovered usually undergo intrinsic regeneration. Consequently, this leads to the appearance of new plant and animal species with different ecological and habitat requirements, as compared with the species preferences present in their strict vicinity. Therefore, knowledge of the present relief-shaping resulting from raw material exploitation, as well as the primary relief seems important for the purpose of reconstructing the original geomorphological and habitat conditions. Such understanding will enable the indication of places strongly transformed wherein a specific microclimate is developing [20,21], and will allow potential future ecogeomorphological changes to be indicated. Of note, present and primary relief can be estimated on the basis of data acquired from Terrestrial Laser Scanning (TLS) [22,23], Airborne Laser Scanning (ALS) [16,24], and on the basis of UAV (Unmanned Aerial Vehicle) missions [25,26] and satellite images [27,28].
There are many sandy areas in the world where aeolian processes occur [29,30,31,32,33]. Despite the temperate climate dominance, such areas can also be found in Europe [34,35,36,37,38]. The development of aeolian processes in this region is associated with the immediate post-glacial period, when loose sediments in periglacial zones were subject to blowout [39]. As a result, aeolian accumulation forms were created, among others, in the form of roller dunes, barchans (arch shape, arms protruding in the direction of the wind) and parabolic dunes (arch shape, arms directed against the wind) [40,41,42]. Another cause of the aeolian processes is human activity, such as deforestation or sand exploitation [43,44]. In Poland, the aeolian forms developed mainly in the form of coastal dunes along the edge of the Baltic Sea [45], e.g., in the area of Słowiński National Park [46]. Middle Poland also deserves attention, mainly the Łódź voivodship, due to the presence of a great number of aeolian forms, both singular and in groups [47]. This came about because of the specific feature of the region in which there is a balance between processes of degradation and aggradation. As their mutual interaction does not cause great changes in the relief, this area remains almost unchanged historically [48].
The main purpose of the survey was to establish the present relief and reconstruct the primary relief (before sand exploitation) in places of human activities and to assess the vegetation condition of a parabolic dune with adjacent terrains located in central Poland. The means of doing so is by applying geostatistical and remote sensing tools.
The subject of reconstruction, particularly natural forms using mathematic modelling, is rarely discussed in publications in natural sciences. Therefore, this study aims to fill this gap in reconstructing objects and places where the impact of human activities was recorded.

2. Object of the Survey

The object of the survey was a parabolic dune together with its neighboring terrains. The parabolic dune is an accumulative aeolian form with its elongated arms directed to the windward direction that is usually stabilised by vegetation, and is mainly found in areas with a semi-dry climate or along seacoasts [40,49]. The object of this survey was formed in the central part of Poland and is situated in the village of Dudki, in the Kobiele Wielkie commune, Radomsko county, Łódź voivodship. The site of the surveyed geomorphological form arose due to the morpho-shaping action of wind, and is determined by the following geographical coordinates: 50.994875°N, 19.648821°E (Figure 1). Over the years, the surveyed dune has been subjected to continuous transformations by the forces of human activity (Figure 2), directed at the exploitation of the Quaternary aeolian sands that had formed on Pleistocene sands, and of the fluvio-glacial gravels from the mid-Poland maximum glaciation stadial. North and northeast from the surveyed object, Holocene peats can be found, as well as peaty silts on the sands and muds of the fluvial floodplain terraces [50]. Available cartographic material analysis, including reference to historical maps (among other items), show [51] that the dune’s degradation began most probably about 100 years ago. The recovered sand was and still is utilised mainly for building purposes.

3. Data and Methods

3.1. Cartographic and Remote Sensing Data

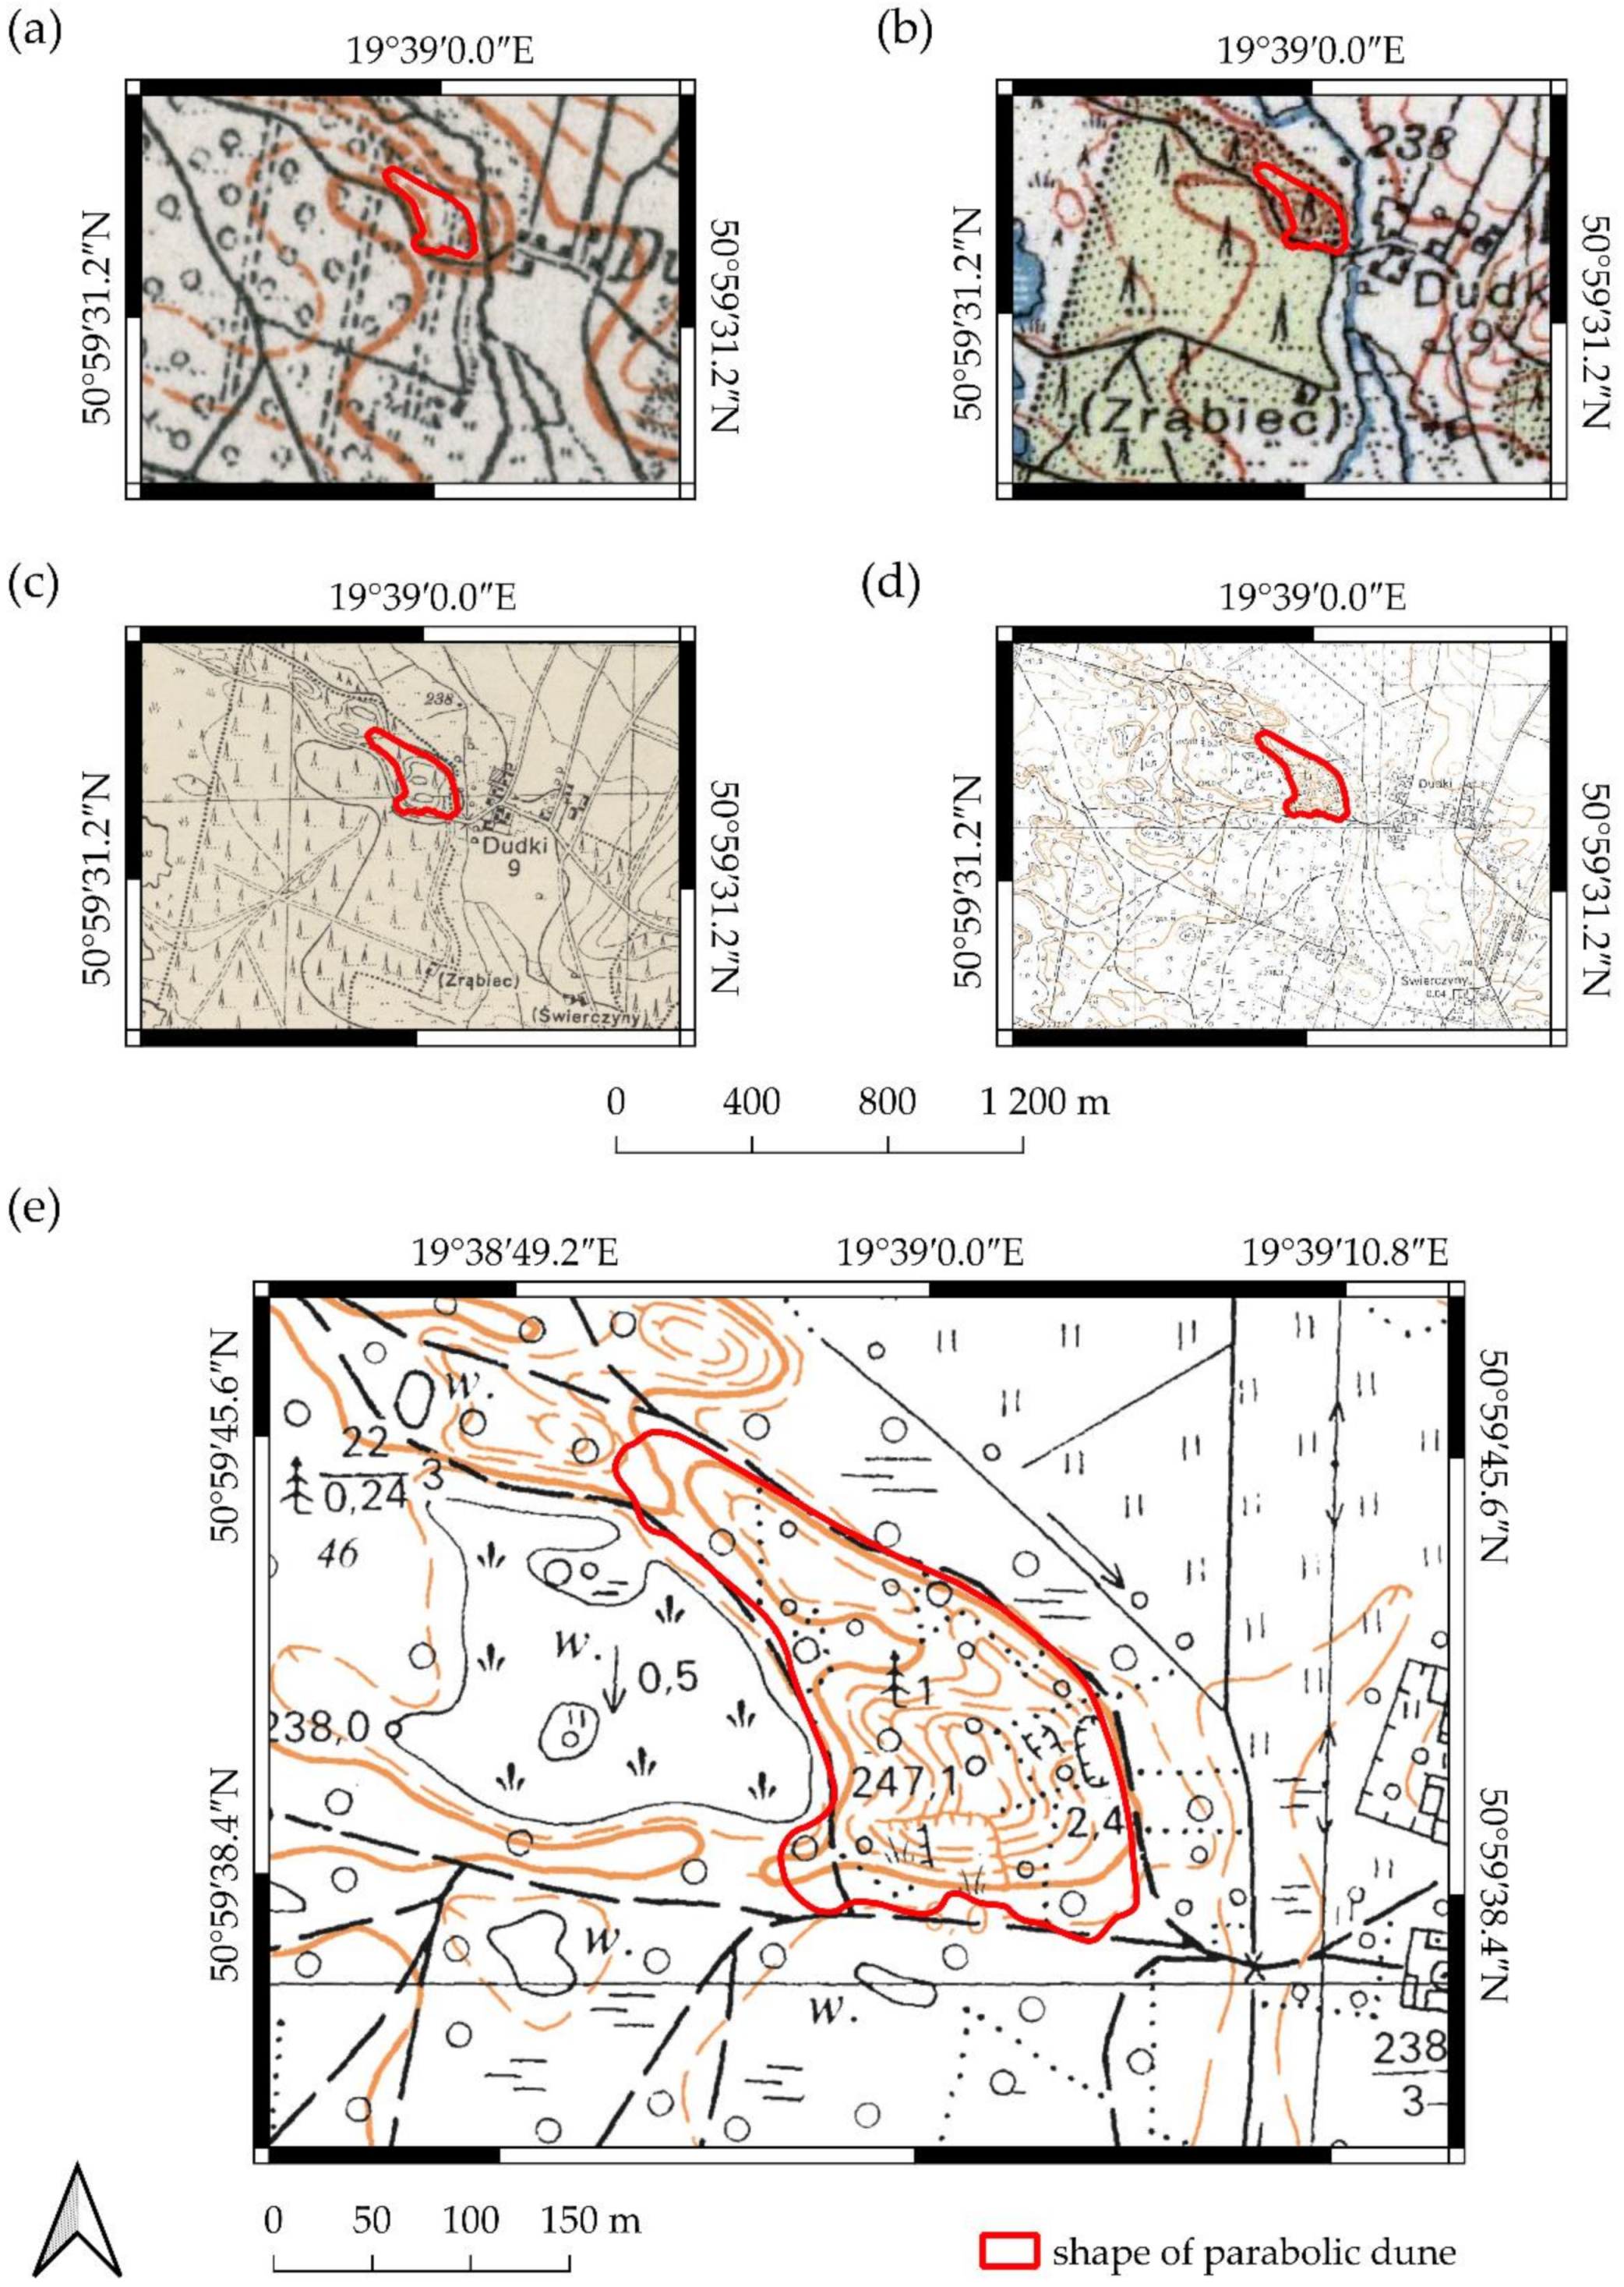
The analysis of source materials included historical and contemporary cartographic materials about the study area [51,53,54,55]. Due to the lack of historical remote sensing data (aerial imagery) covering the study area, contemporary remote sensing materials (orthophotomap and satellite imagery) were analysed and evaluated. These provided an important additional source of data for acquired historical maps, mainly in terms of the scale of transformations in the study area. Three Tactical Maps of Poland at various scales were analysed: 1:100,000 [53,54], 1:25,000 [55] and the Topographic Map of Poland 1:10,000 [51] (Figure 3). Landforms are depicted on these maps as contour lines. Due to the inappropriate scale of the historical maps, none were used to obtain the spatial data necessary for the reconstruction of the primary relief of the studied dune. Appropriately processed spatial data acquired in the field with a GNSS receiver (Section 3.2), were used to reconstruct the primary relief. The reference standard was the Topographic Map of Poland 1:10,000 from 1986 [51] (Figure 3e) because of its appropriate scale.

3.2. GNSS Measurements

In June 2020, topographic mapping of the surveyed aeolian form and the surrounding terrain was performed utilising geodetic equipment that included a GNSS receiver (Spectra Precision SP20) with access to real time kinematic correction (RTK) from reference stations ASG-EUPOS, as well as a precision single frequency antenna (Ashtech ASH111660). Application of the precision antenna allowed the performed measurement accuracy to be increased, especially under the tree canopies of the closed forest area where satellite access was obstructed. GNSS measurements were performed in the coordinate system ETRS89/Poland CS92, with code EPSG: 2180, including quasigeoid model PL-geoid-2011 and height system PL-KRON86-NH. Satellite levelling of the GNSS measurements to the currently valid geoid was performed by means of the following Formula (1):
H o r t h = H e l l i p s e N
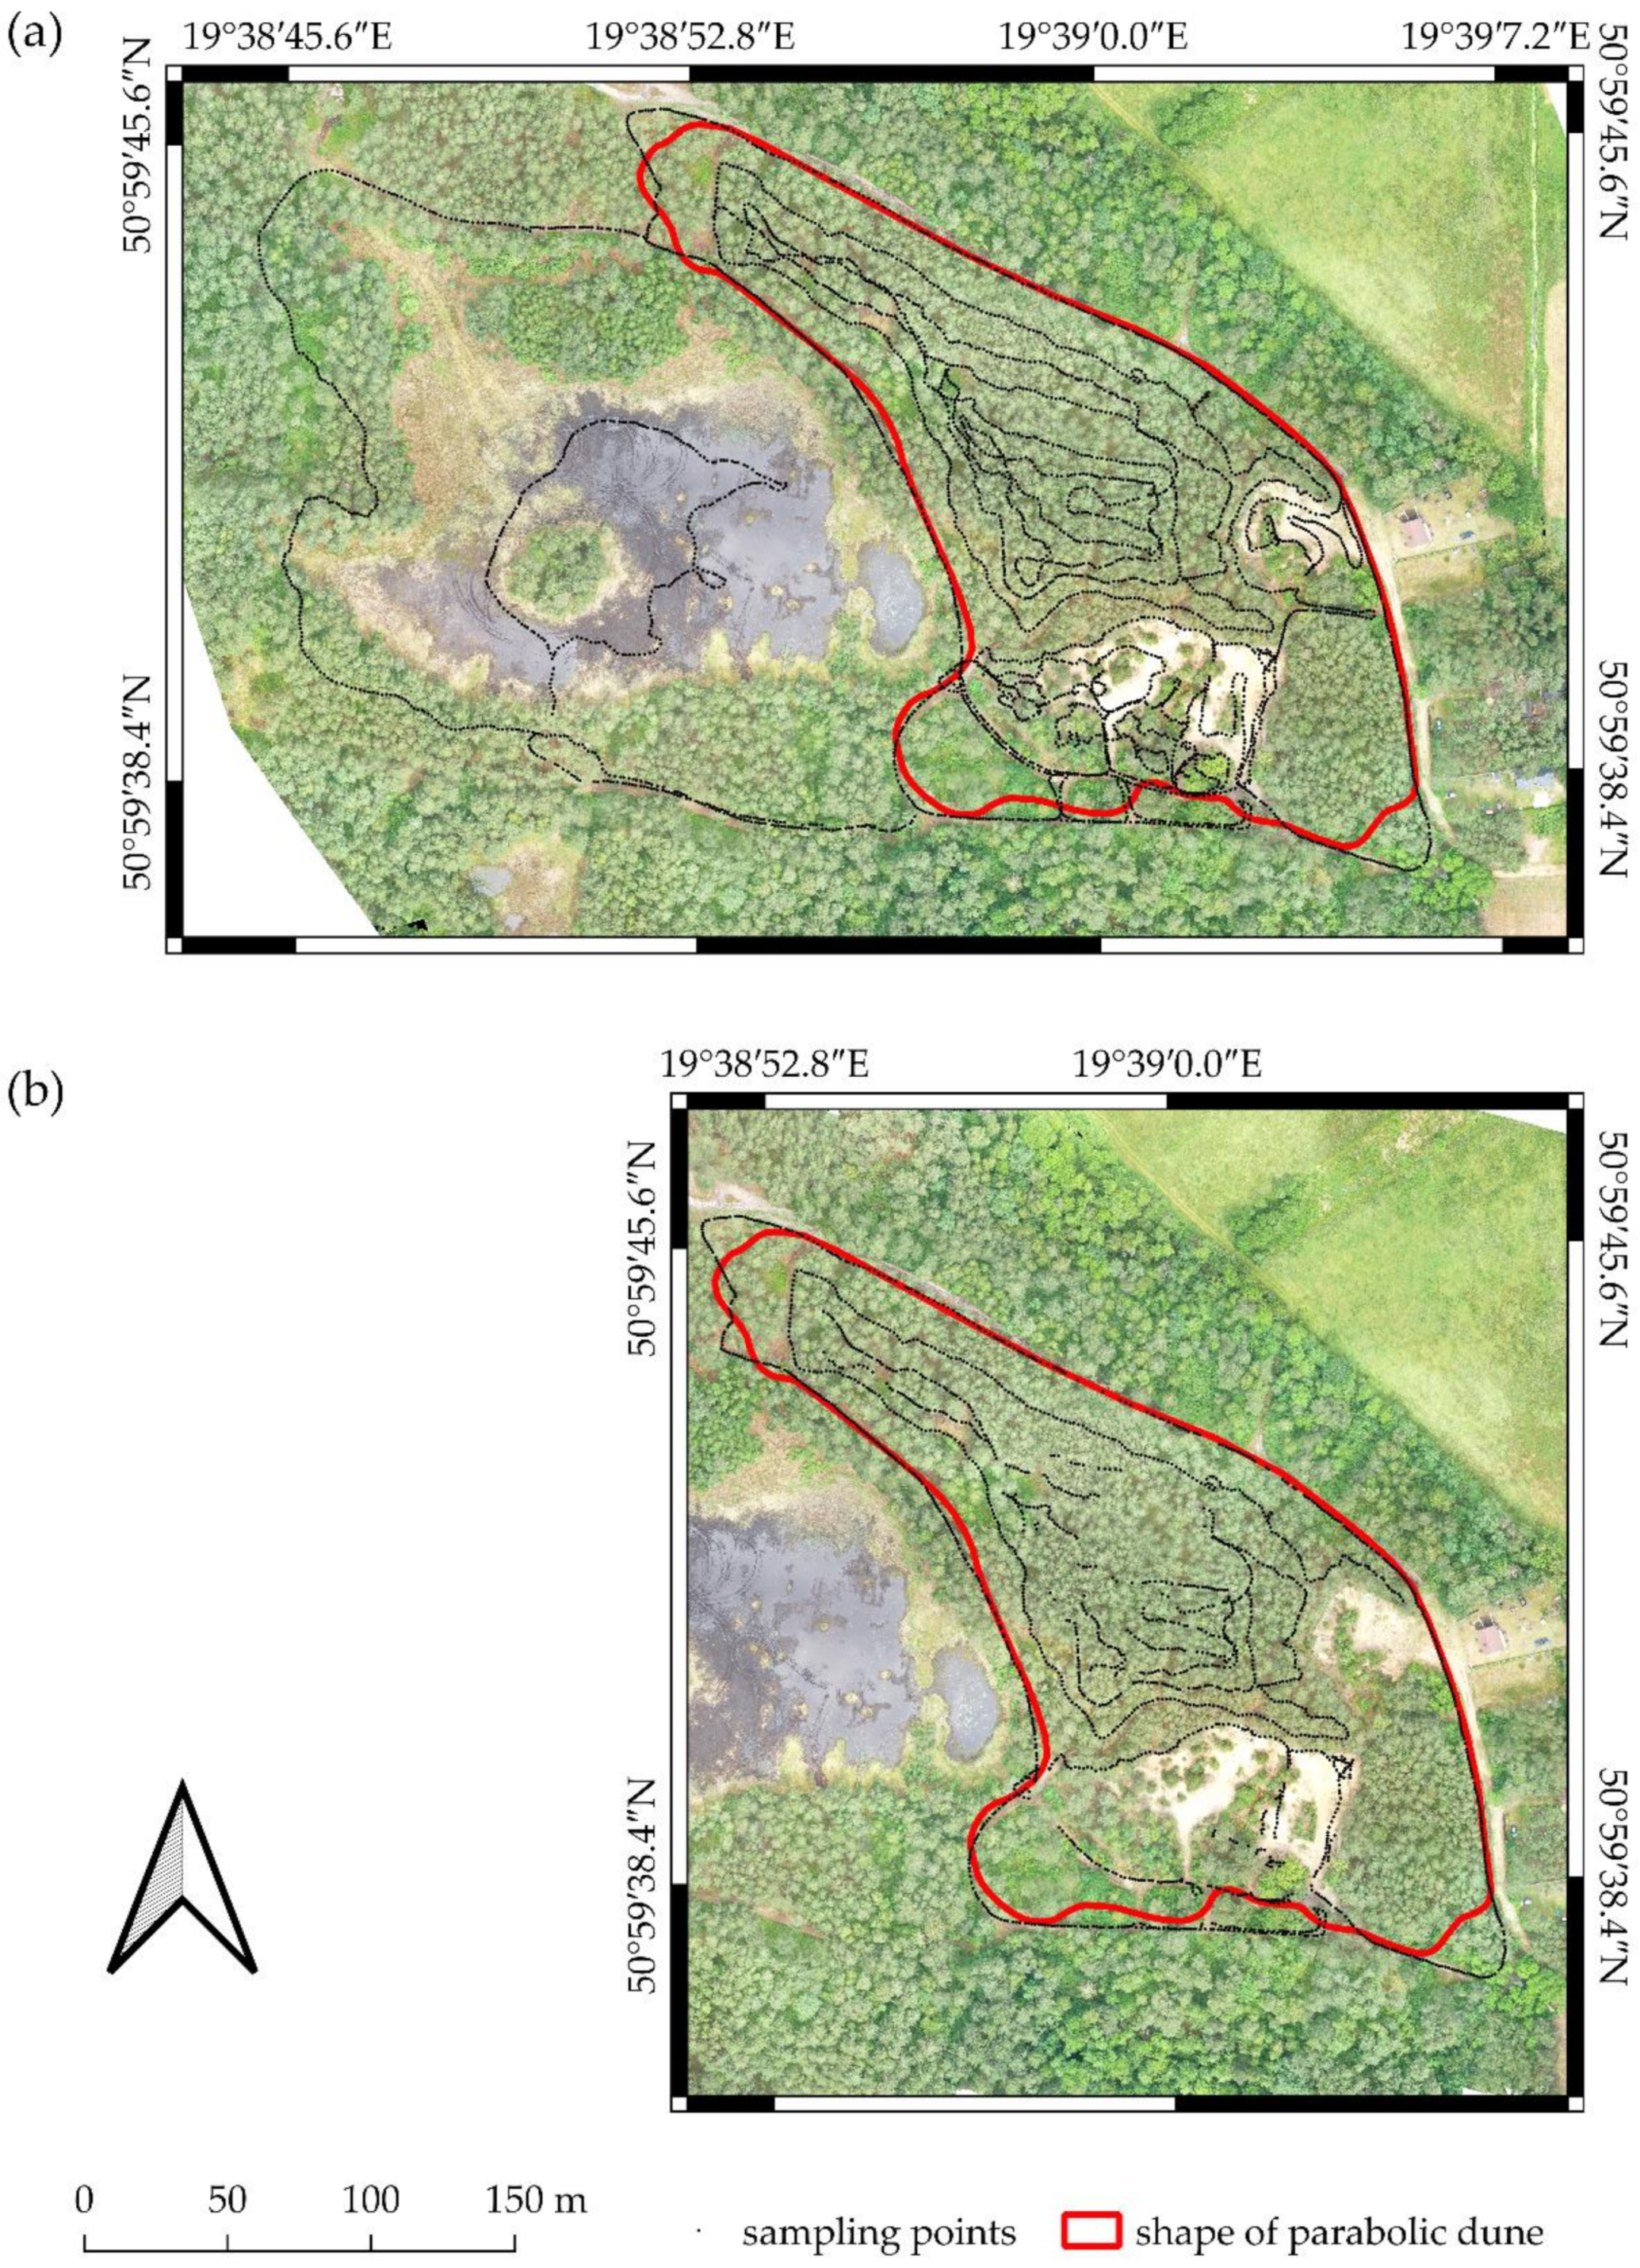
where H o r t h is the orthometric height (the height over the defined geoid determined through Earth gravitation and mean sea level (MSL)), H e l l i p s e is the GPS height above the reference ellipsoid, and N is the geoid height. As a result, 4045 measurement points were obtained (Figure 4a). These provided the source of the necessary input data for further advanced geostatistical analysis. The points included all changes in dune morphology, both natural and human activity. This approach made it possible to conduct an accurate reconstruction of the present state of the studied dune, particularly in places of sand mining activity. Due to the dry period in which the measurement was conducted, the blowout was not filled with water. Therefore, its partial mapping was performed so as to provide a near-complete view of the present study area.
On the basis of the collected terrain data, a hypsometric map and a digital elevation model (DEM) with a resolution of 1 m were generated. To conduct relief reconstruction from the period before sand exploitation began, the points referring to the fragments transformed anthropogenically, and the blowout located to the west, were removed from the acquired data set. These indicated weak spatial autocorrelation (Section 4.1). Thus, the total number of points used in the reconstruction was equal to 1999 (Figure 4b).

3.3. UAV Mission

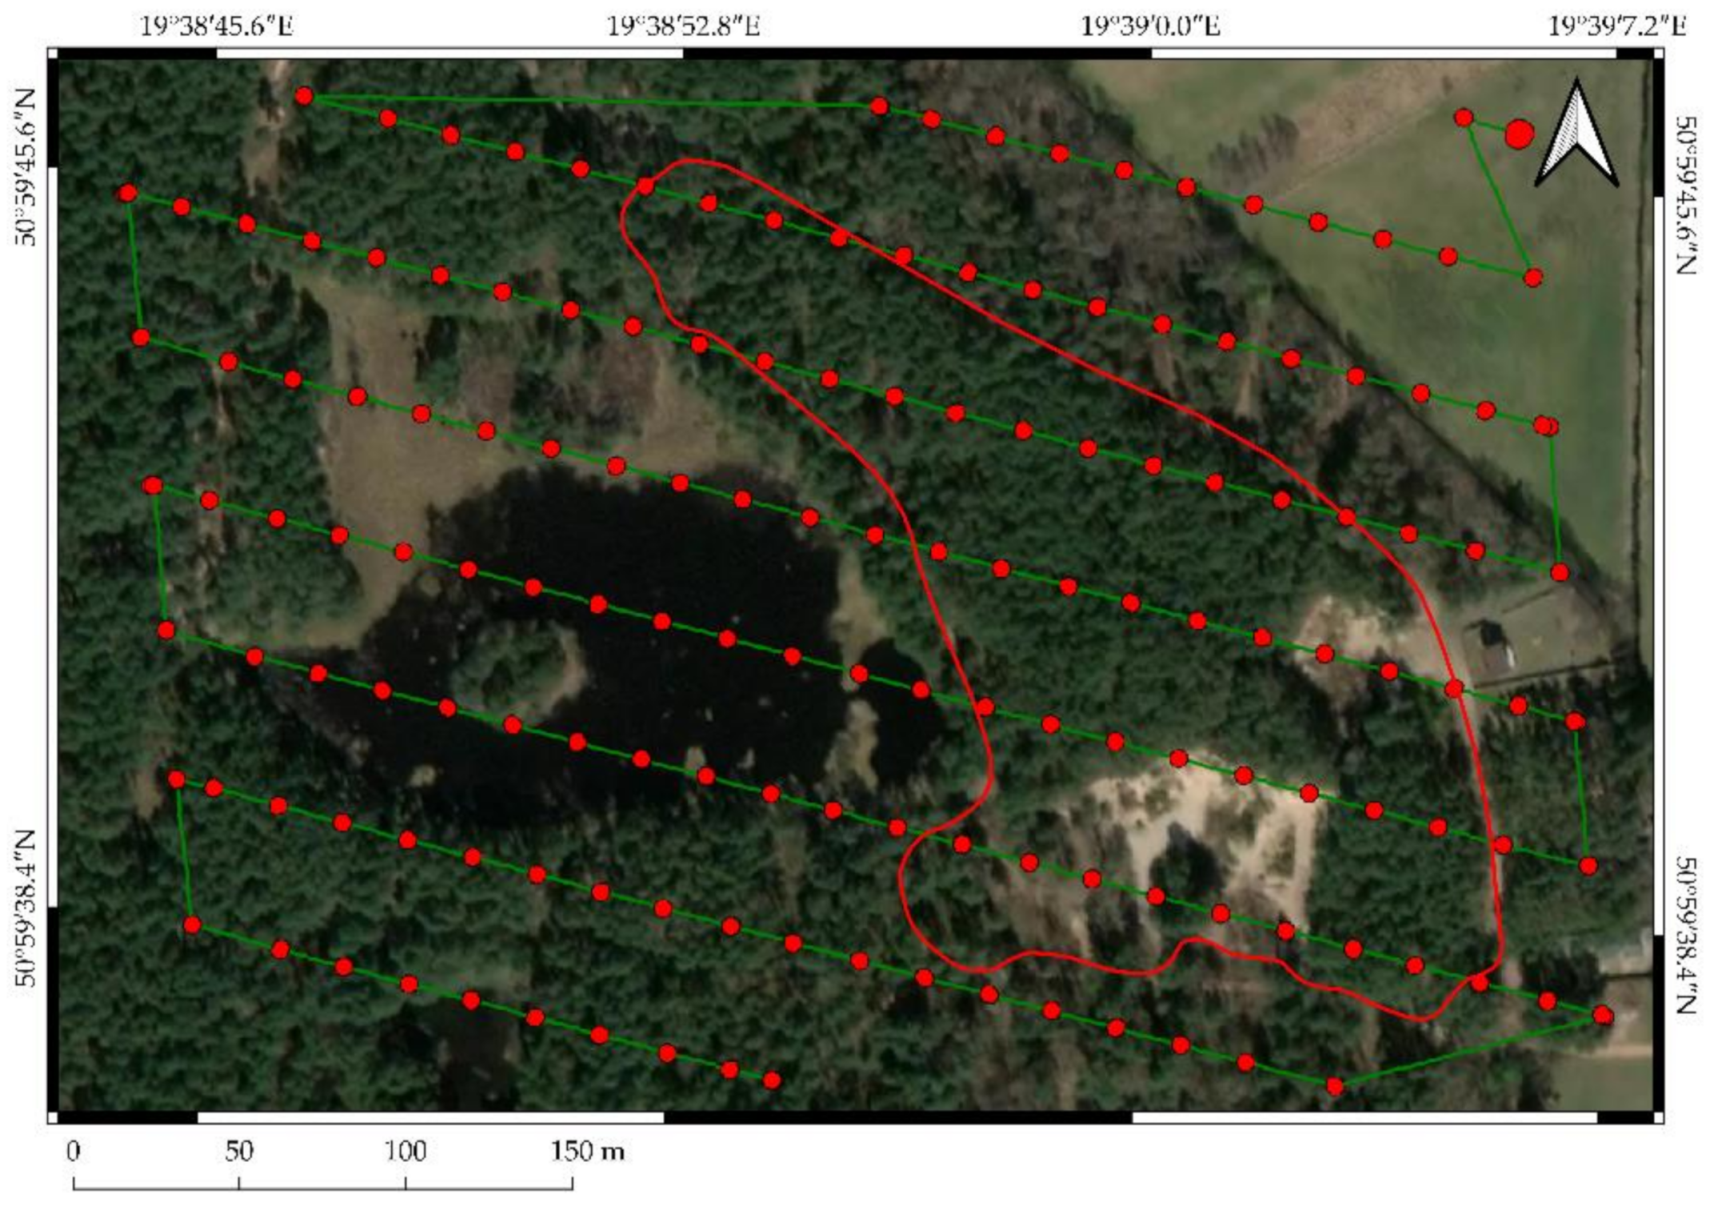
A polygon mission for 2D mapping using an UAV (Unmanned Aerial Vehicle) was performed on 21 June 2020. This time was also optimal for collecting field data corresponding to the summer period of the growing season (Section 3.6). In order to obtain the current orthophotomap, the flight of a DJI Mavic 2 Pro unmanned aerial vehicle was undertaken at the height of 100 m above the terrain within the limits of the surveyed dune. During this flight, 160 photos with approximated Ground Sampling Distance (GSD) of 2.34 cm/pixel were registered (Figure 5). The generation of an orthomosaic of the surveyed object and adjacent terrains was the selected task. Table 1 presents the detailed mission parameters.

3.4. Geostatistic Analysis

The present and primary relief of the surveyed parabolic dune and terrain situated in its surrounding area was elaborated by applying the ordinary kriging (OK) method according to the protocol of Zarychta et al. [16]. An experimental semivariogram was used to describe the spatial pattern of the variable under study (elevation). This was defined as half of the variance between two locations z u α and z u α + h , distant by vector h [16,56,57] (2):
γ h = 1 2 N h α = 1 N h z u α z u α + h 2
where N h is the number of the pairs of points.
In order to describe the spatial variability of the present and primary relief, a Gaussian model with a practical range a [57] was used as a theoretical model. This was adjusted to the experimental semivariogram obtained from terrain data (3):
γ h = c 0 + c 1 e x p 3 h 2 a 2  
where c 0 is the spatial uncorrelated variance (“nugget effect”), c is the spatial correlated variance (“partial sill”).
The OK method provides an estimate of the variable at unmeasured locations with known values of the measured variable [57] (4):
Z O K * u = α = 1 n u λ α O K u Z u α   with   α = 1 n u λ α O K u = 1 ,
where λ α O K is the weight assigned to n u random variables Z u α .
The correctness of each of the conducted modellings was verified by cross-validation (CV). It consisted of removing the value of each sampling location in the dataset one by one and predicting the removed values to compare theirs with the measured value. The following errors were calculated: mean error (ME), root mean square error (RMSE), root mean square standardised error (RMSSE).
The geostatistical modelling was performed in commercial software ArcGIS 10.7.1 (ESRI, Redlands, CA, USA) and Surfer 20 (Golden Software, Golden, CO, USA).

3.5. Data Processing from Sentinel-2A and UAV Image Fusion

In order to complete the data and increase analysis range, satellite images from Sentinel-2A, level L1C from 1 July 2020 were acquired (data were obtained from the EarthExplorer website through the courtesy of the U.S. Geological Survey). This was subjected to radiometric correction in order to eliminate the disadvantageous impact of aerosols (among other issues) on the value of the electromagnetic radiation reaching the Earth’s surface. The products of the L2A level were thereby obtained. The lack of accessible atmospheric window caused by cloudy weather was the reason of divergence in terms of imaging acquisition from Sentinel-2A in relation to the UAV mission. The scene acquired from Sentinel-2A was then used in the condition analysis of the vegetation planted on the dune and throughout its surroundings. Due to the insignificant size of the terrain surface, 10 m band resolution: 8 (NIR—near infrared), 4 (RED), 3 (GREEN), 2 (BLUE), proved to be too low, and precise analysis execution was impossible. Therefore, Sentinel-2A and UAV image fusion was undertaken using pansharpening. In effect, resolution of the selected 8, 4, 3, 2 bands from Sentinel-2A scene was increased up to 1 m on the basis of the data acquired from the UAV. The procedure was conducted in accordance with the assumptions adopted by Zhao et al. [58] and Jenerowicz and Woroszkiewicz [59] with minor modification. It relied on the selection of only four bands (8, 4, 3, 2) from Sentinel-2A. Hence, there was no necessity to conduct the Gram– Schmidt transformation for Sentinel-2A-derived data. In addition, the imaging resolution from UAV was downscaled to 1 m in order to eliminate artefacts that occurred during the flight execution and further stages of the photogrammetric processing. The UAV panchromatic band (PANUAV) was calculated by averaging the red, green, and blue bands [60]. For Sentinel-2A, the panchromatic band (PANSEN) was calculated as the average of channels 8, 4, 3, 2 [61]. The mean and standard deviation were then calculated for PANUAV and selected bands (8, 4, 3, 2) from Sentinel-2A. PANUAV was then stretched so that its mean and standard deviation matched PANSEN. The PANUAV band was swapped with PANSEN using a Gram–Schmidt transformation where the data were transformed into higher resolution multispectral bands [58].

3.6. Analysis of the Vegetation Condition

In 2020, during the growing season, botanical data about the occurrence (presence/absence) of trees, shrubs, herbaceous plants, mosses and lichens were also acquired in the study area. Analysis of the condition of the vegetation currently growing upon the dune and in its surroundings was performed on the base of a created composition of false colours with the use of near infrared (CIR—colour-infrared), bands 8 (NIR), 4 (RED), 3 (GREEN) and Modified Chlorophyll Absorption in Reflectance Index 1 (MCARI1) calculated according to the following Formula (5) [62]:
M C A R I 1 = 1.2 2.5 N I R R E D 1.3 N I R G R E E N
where N I R —near infrared band, R E D —red band, G R E E N —green band.
The MCARI1 was selected due to its resistance to pigment changes and reactivity to changes in leaf area index (LAI) [62]. Calculation of CIR and MCARI1 was preceded by satellite and UAV image fusion for enlarging the spatial and spectral range of the data obtained from the UAV. This allowed the earlier acquired orthophotomap and satellite imaging from Sentinel-2A to be combined.
The UAV mission was performed in the Pix4DCapture application, whereas the UAV imaging was processed in Pix4DMapper (Pix4D S.A., Switzerland). The pansharpening procedure was performed in QGIS 3.16.4 (QGIS Geographic Information System. QGIS Association. http://www.qgis.org, accessed on 25 February 2021) and ENVI (Broomfield, CO, USA).

4. Results

4.1. Present and Primary Relief

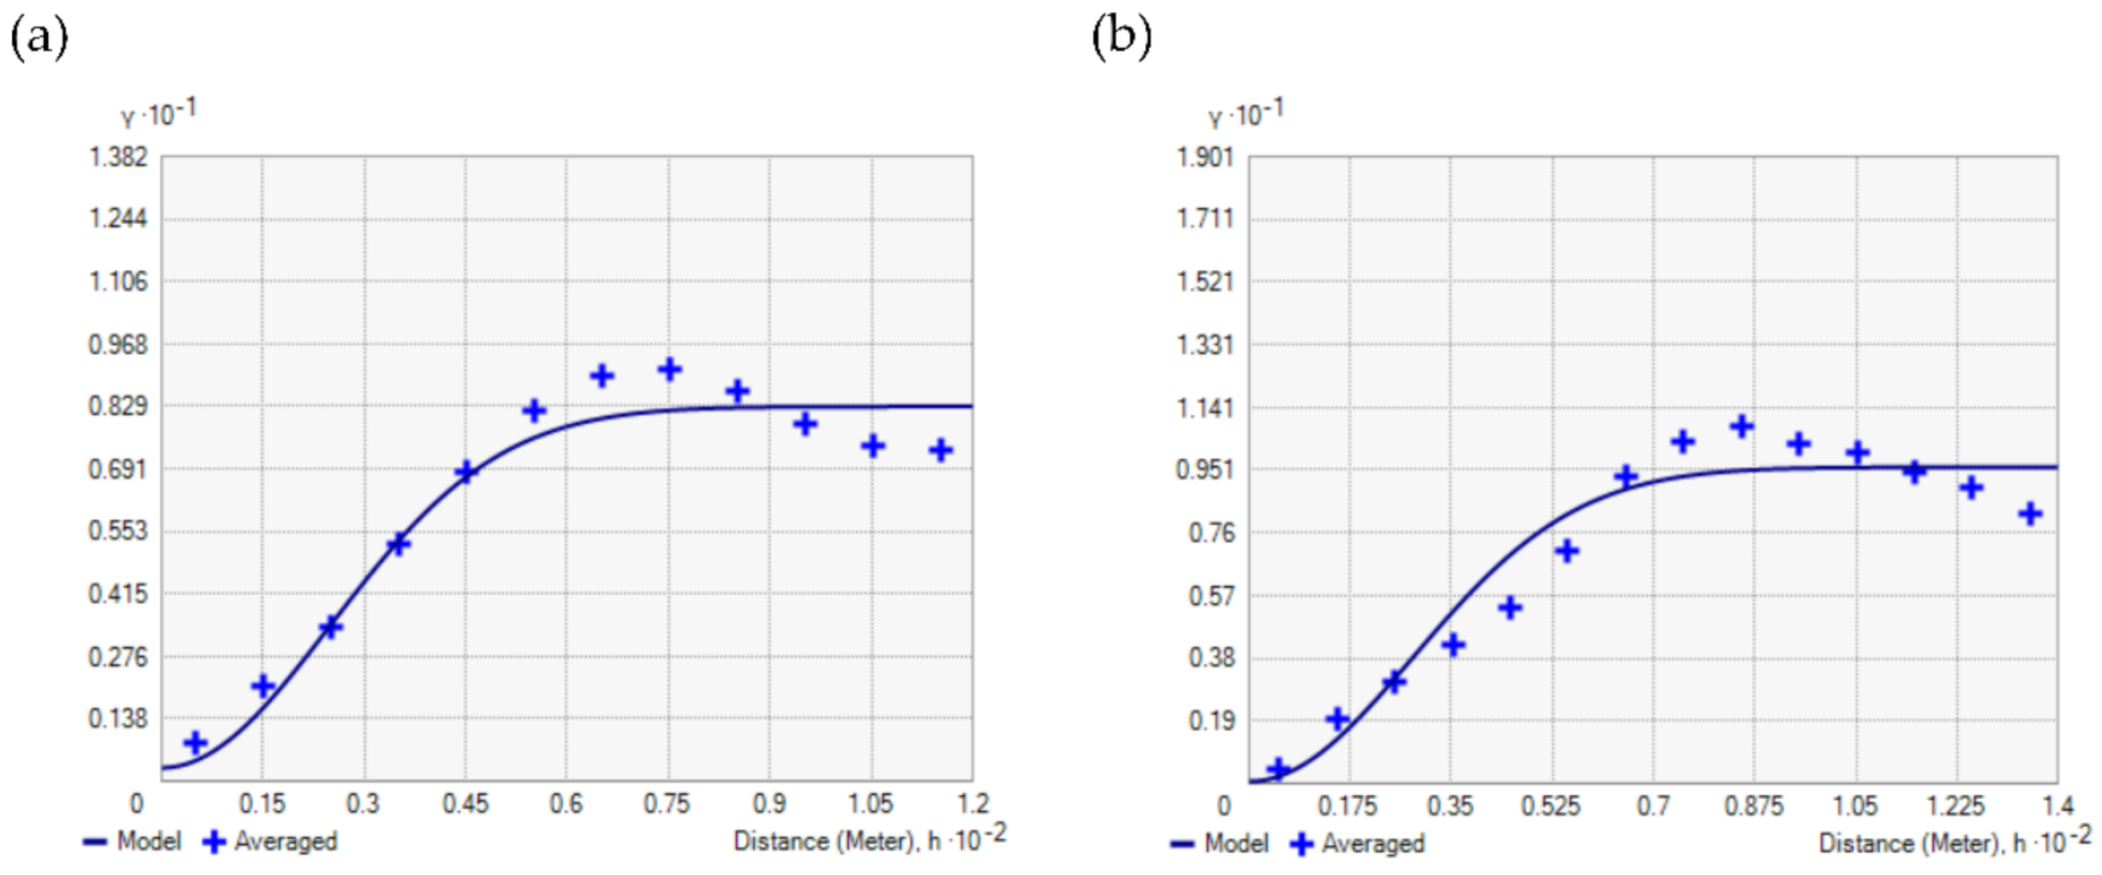
The use of advanced mathematical modelling, combined with GNSS data, enabled a complete relief reconstruction of the parabolic dune under study. The present relief of the surveyed aeolian form was established, taking into account the surrounding terrain. In contrast, the primary relief included only the dune due to the lack of detailed spatial information on the relief of the surrounding area. This resulted from the weak spatial autocorrelation for the GNSS-derived dataset prepared to perform the primary relief reconstruction of the parabolic dune. Considering that the description of the spatial variations would be incomplete for the surrounding area, it was limited. Hypsometric maps and DEMs presenting relief of the selected dune were elaborated with the terrain data obtained from GNSS (Section 3.2) using ordinary kriging (OK) (Section 3.4). The OK procedure was performed by modelling the spatial variability described with the help of the semivariogram. The matching of the Gaussian model to the experimental semivariogram calculated from the GNSS data (Figure 6) was checked by cross-validation. The model parameters are presented in Table 2, and the cross-validation errors are presented in Table 3.
Using the ordinary kriging estimator, its standard deviation (SDOK) was calculated. The following SDOK values were obtained for the present relief: 0.251 m, and the primary relief: 0.196 m, respectively. Hence, the SDOK values were taken into account for the analysed estimated elevation values.
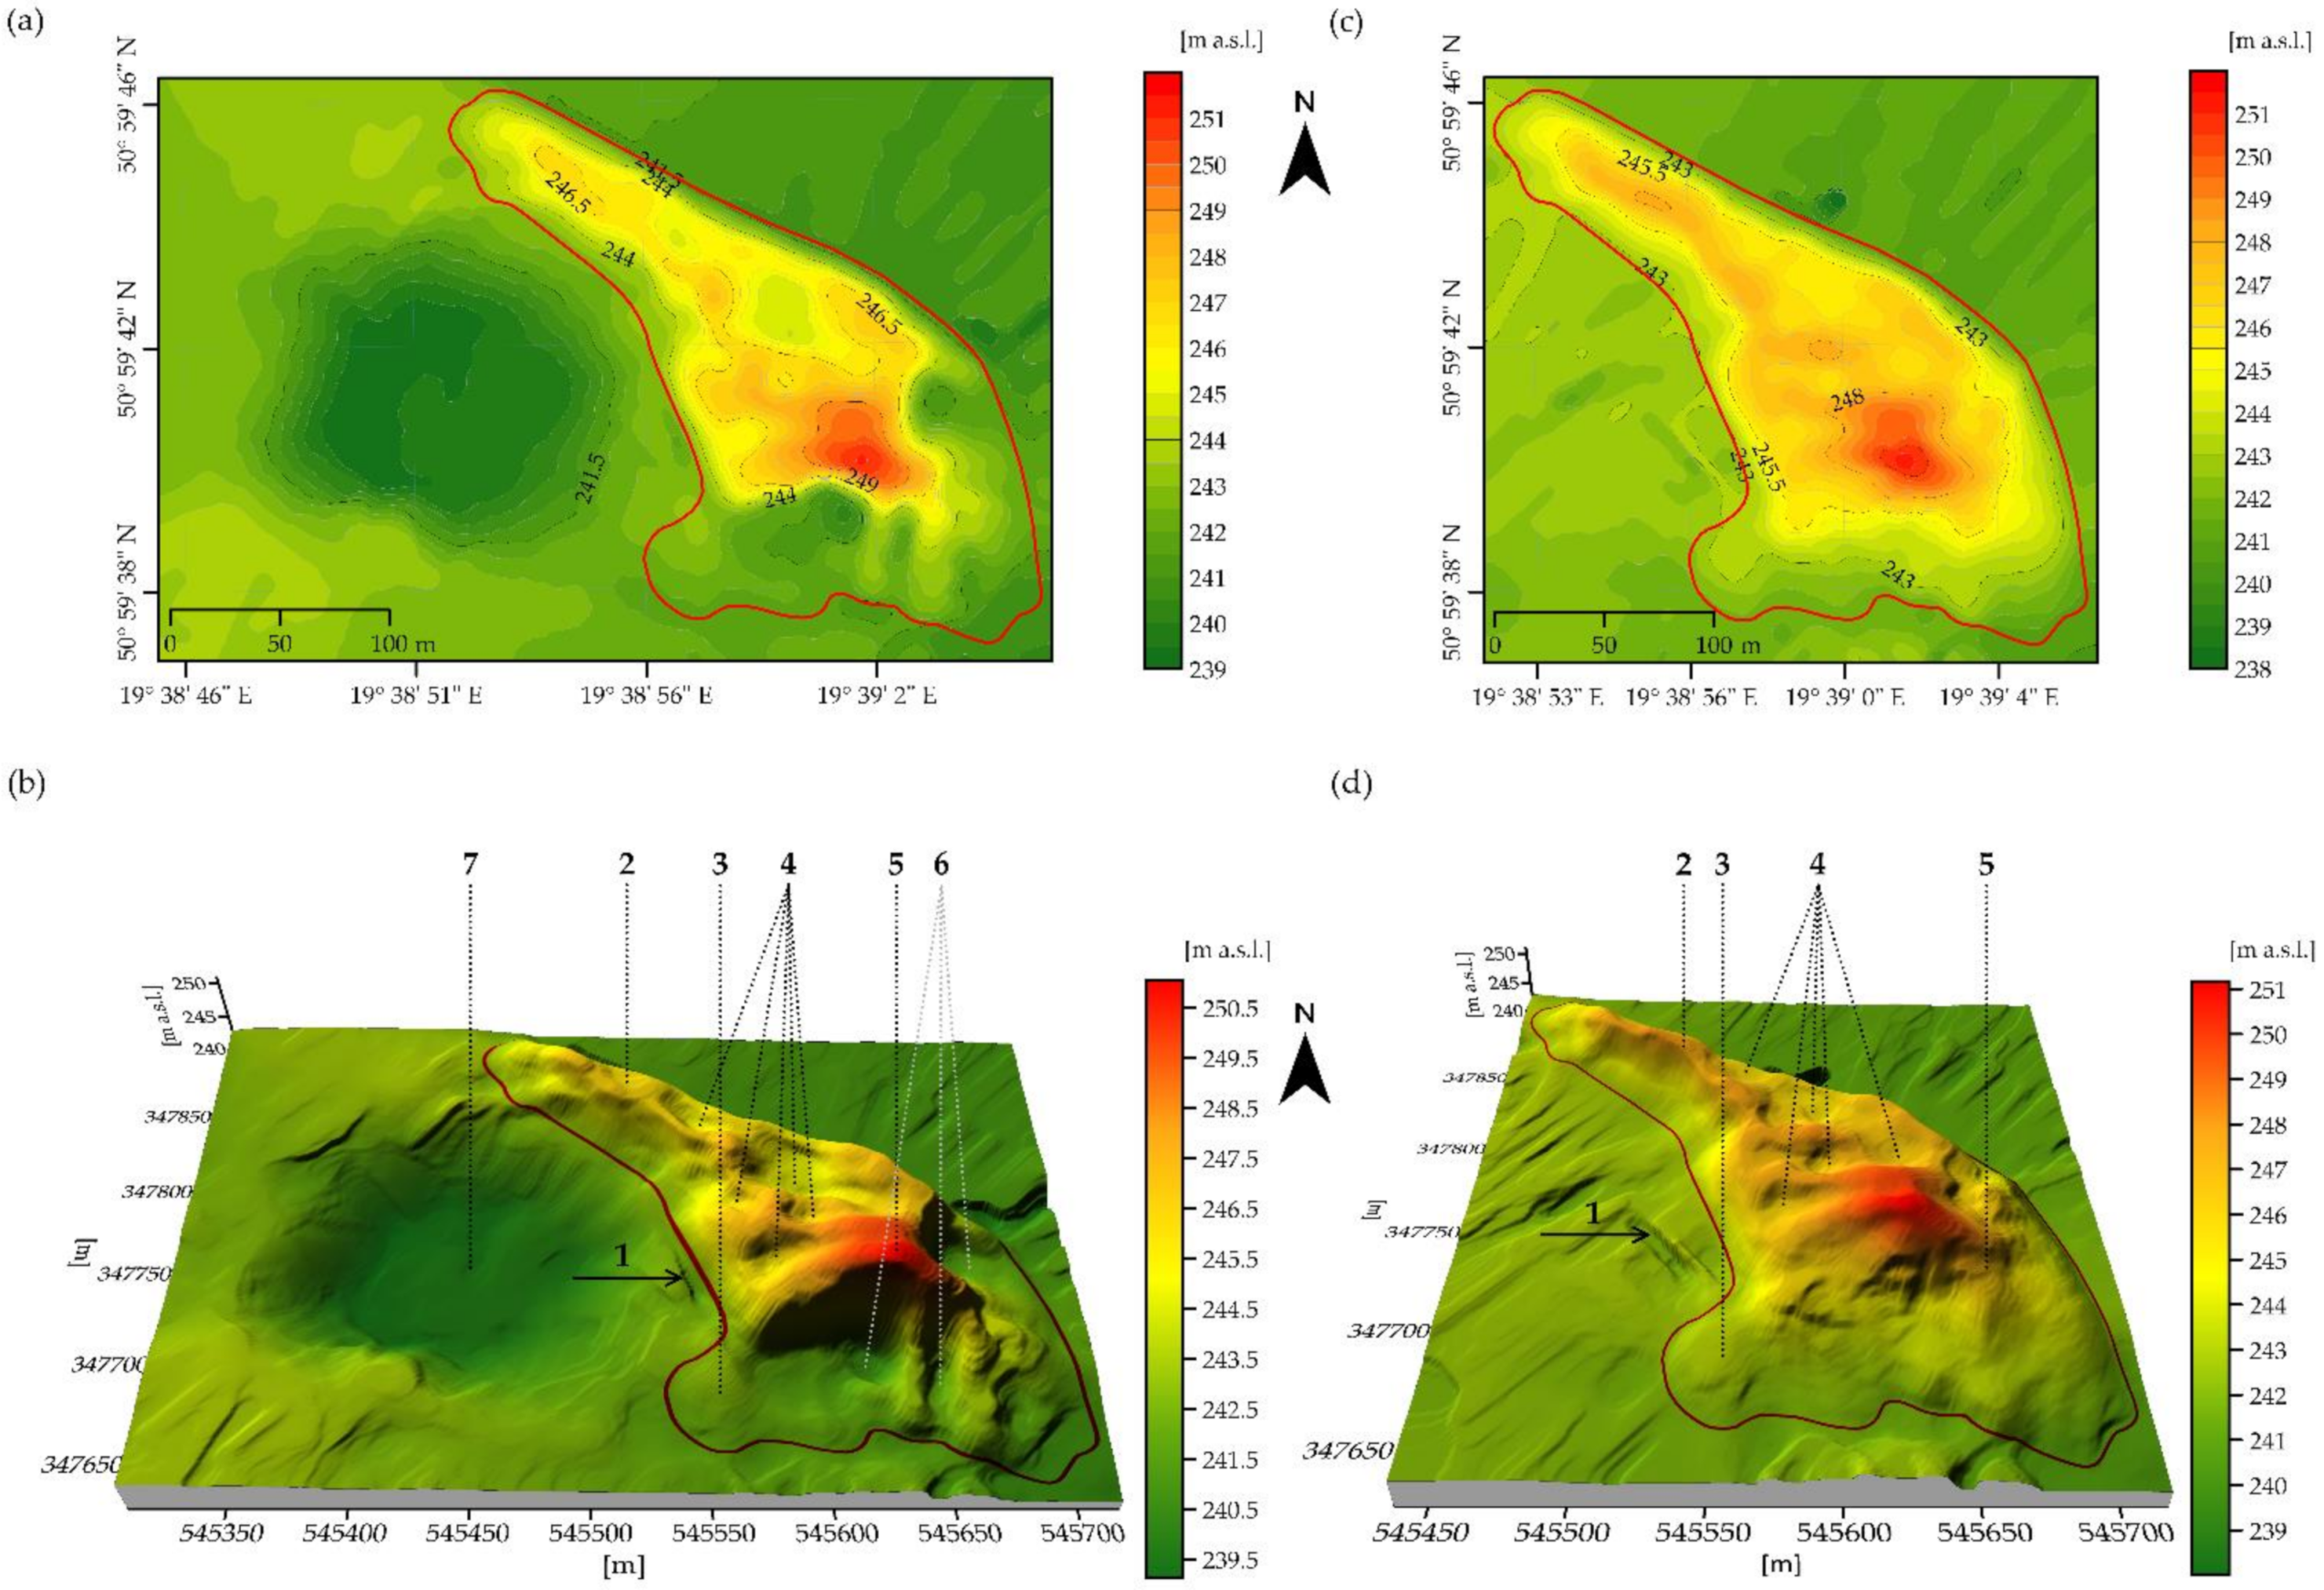
On the basis of the results (Figure 7a,b), it was concluded that the current crest of the dune reaches approximately 240.4–251.1 m a.s.l. and that the maximum relative height in its uppermost portion reaches 10.6 m. In addition, the crest is the most deformed fragment of the dune, within which the three degraded portions are indicated clearly: the eastern one (A) of surface area 794.9 m2, and two southern ones: (B) of surface area 285.8 m2, and (C) of surface area 2779.5 m2 (Table 4). Portions A and C are not being exploited, in contrast to portion B from which sand for building purposes is currently being recovered (Figure 1). In every portion of the depleted dune portion, in its upper portions, the presence of slightly concave, almost vertical fragments of the youth slope was noted (Figure 2). The surveyed parabolic dune possesses two arms, a well-developed northern arm and a poorly preserved southern arm, both of which are smoothly bent in a northwest and southwest direction. The northern arm rises to a height of 244.9–246.9 m a.s.l., and resembles by its shape a clear irregular levee of a maximum width of 55.4 m, whereas the southern arm reaches the height of 243.1 m a.s.l., is slightly undulant and is characterised by a more regular shape. However, it is poorly visible on the map and DEM, and in the terrain reaches a height of approximately 1.4 m and a width of 34.7 m. Between the dune arms at the height of 242.5–242.1 m a.s.l., there is large trough of quite regular shape. Its mean depth is approximately 3.4 m, and its surface area is 22,000 m2. The ridge portion of the dune is clearly fragmented and presents the occurrence of five trough-like depressions. The largest of the troughs reaches a surface area of about 1263.5 m2 and a depth equal to 1.3 m. The main axis of the ridge portion runs in a northwest to southeast direction. The remaining terrain portion surrounding the dune is monotonous. The northeastern and southeastern portions are grassland situated at the height of 240.9–241.1 m a.s.l. (Figure 7a,b).
The primary relief (Figure 7c,d) analysis of the surveyed dune allows one to conclude that it was relatively well-developed before the beginning of the sand exploitation for building purposes and distinguished by the regular shape characteristic of a typical aeolian form. The exception was the southern arm in its embryonic stage of development. The crest portion was well-developed and rose to the height of 251.2 m a.s.l. (Table 4). It dropped rather smoothly in the southern-eastern direction where it reached the height of 241.7 m a.s.l. More clearly so than is the case currently, the shorter arm was well-distinguished, situated at the height of 234.3 m a.s.l. and had reached the width of 38.4 m. The northern arm was also well-developed and had the shape of a regular levee and rose to the height of 248.1–245.8 m a.s.l. and had reached the width of 55.4 m. In turn, the ridge portion had been slightly fragmented and within its range, five trough-like depressions at an early stage of development were indicated. The biggest of these was situated at the junction of the ridge and northern arm portions and had reached a surface area of approximately 1035.7 m2 (Figure 7c,d).
The reconstructed primary relief of the surveyed parabolic dune is similar to that shown on the three Tactical Maps of Poland [53,54,55] and Topographic Map of Poland [51] (Figure 3). The arms of the dune—north and south—are clearly visible only on the Topographic Map of Poland 1:10,000 [51], due to the large scale. The crest and the ridge portion are similarly so and the direction of this is consistent with that obtained from the reconstruction. Although the map does not show the relief from before the start of mining, rather only that from the period of its duration, traces of its degradation related to sand exploitation are noticeable on the eastern and southern sides (Figure 3e). The other maps are too small in scale to make a detailed comparative analysis of the different parts of the surveyed dune. On these, only the crest and the ridge of the studied object are distinguishable [53,54,55] (Figure 3a–c).

4.2. Vegetation Condition on the Dune and Its Surrounding

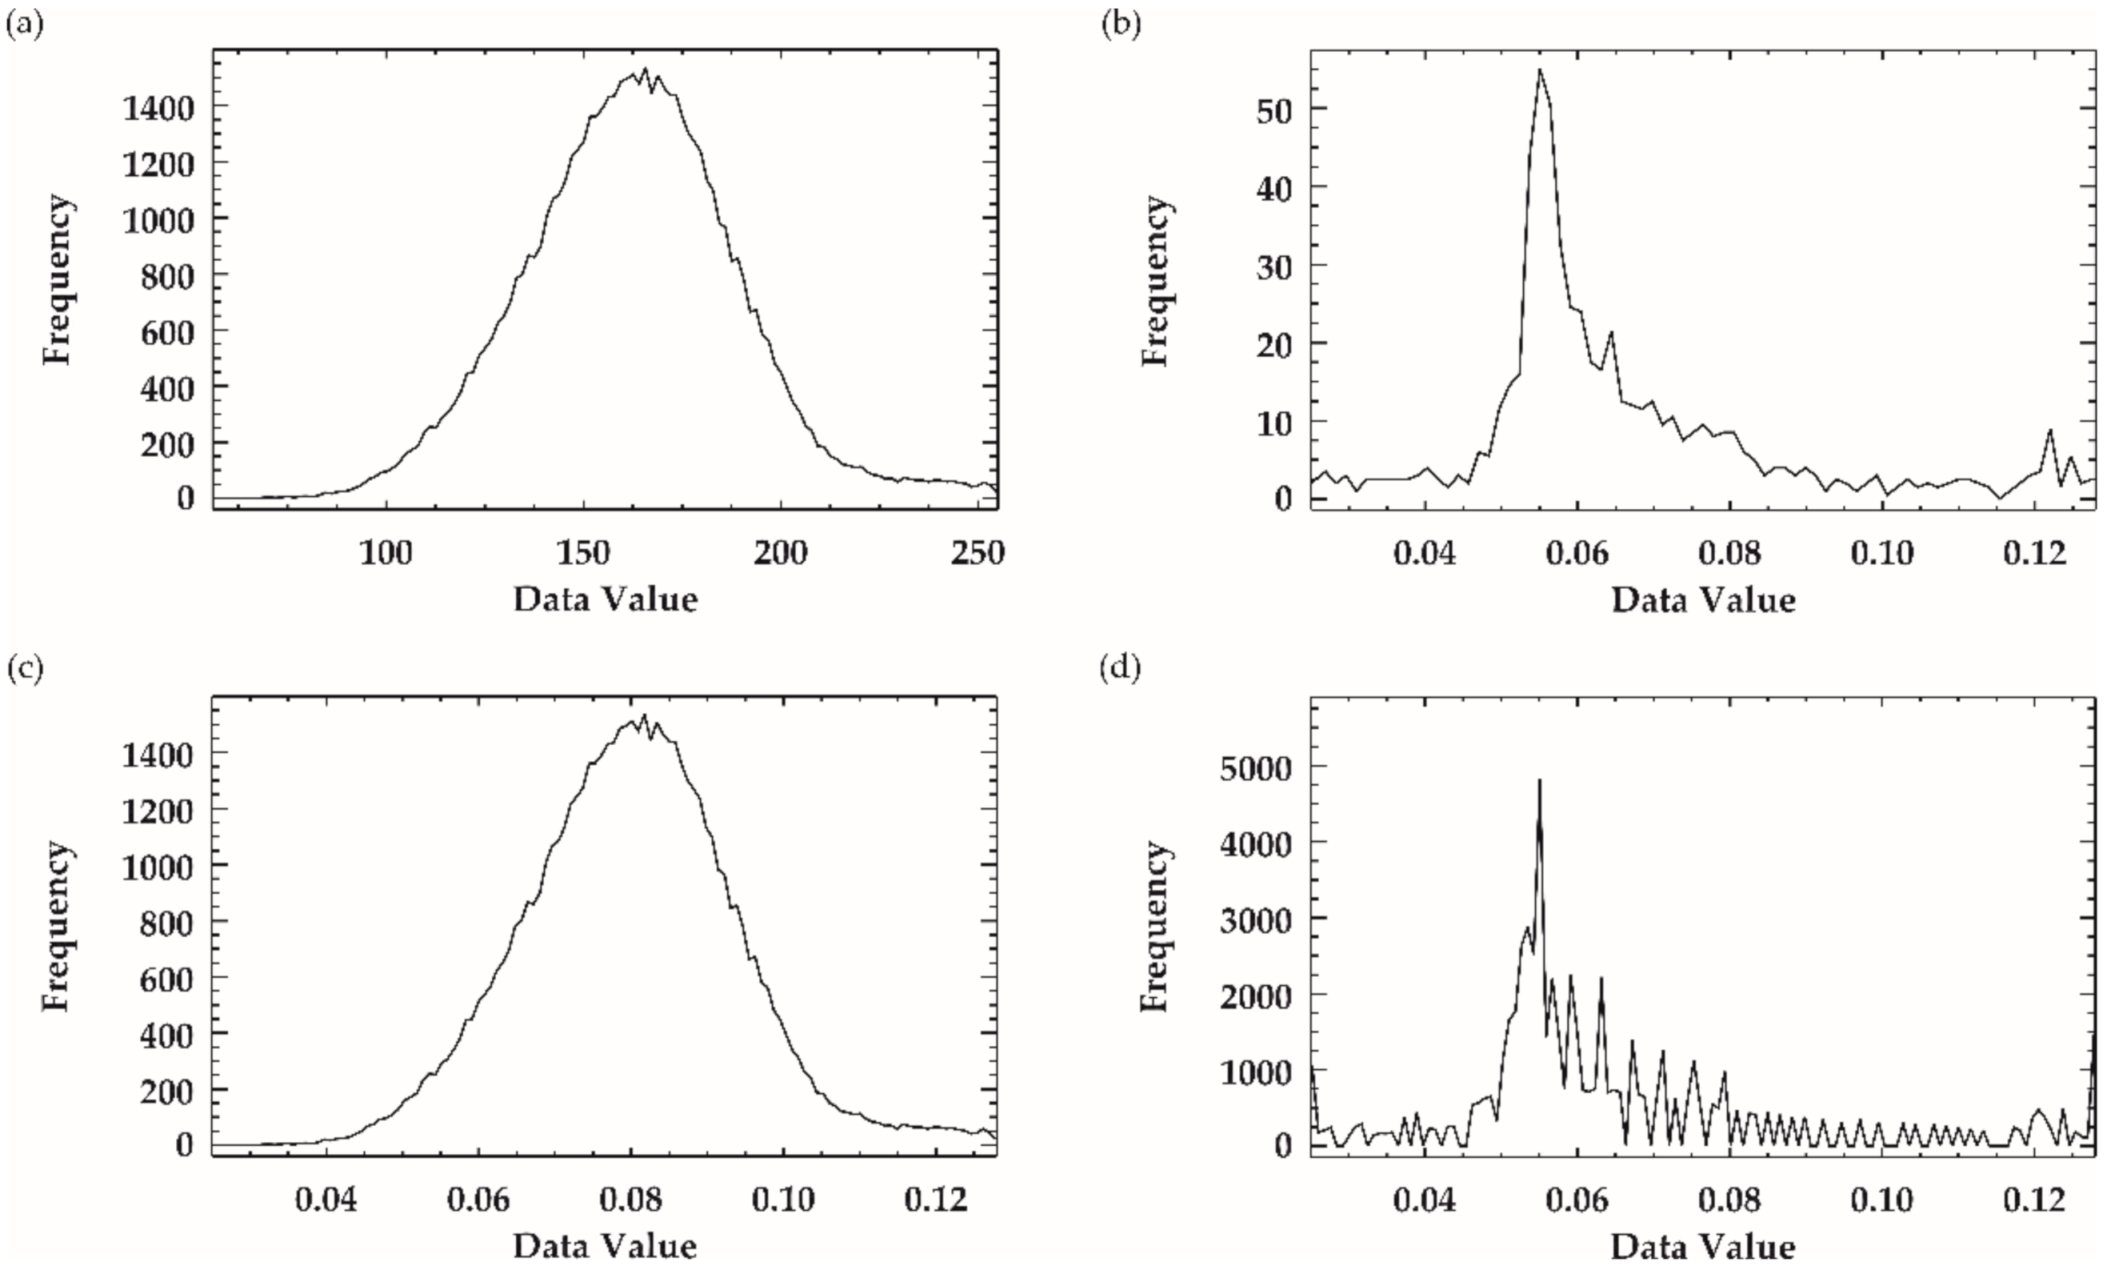
During image fusion, the mean and standard deviation were calculated for the acquired panchromatic band from the UAV (PANUAV) and for the panchromatic band from Sentinal-2A (PANSEN) (Table 5). The calculated statistics allowed the PANUAV histogram to be appropriately stretched to PANSEN (Figure 8). Consequently, the high-resolution multispectral images were achieved by applying the Gram–Schmidt transformation process. It was also possible to create colour-infrared (CIR) compositions and calculate Modified Chlorophyll Absorption in Reflectance Index 1 (MCARI1).
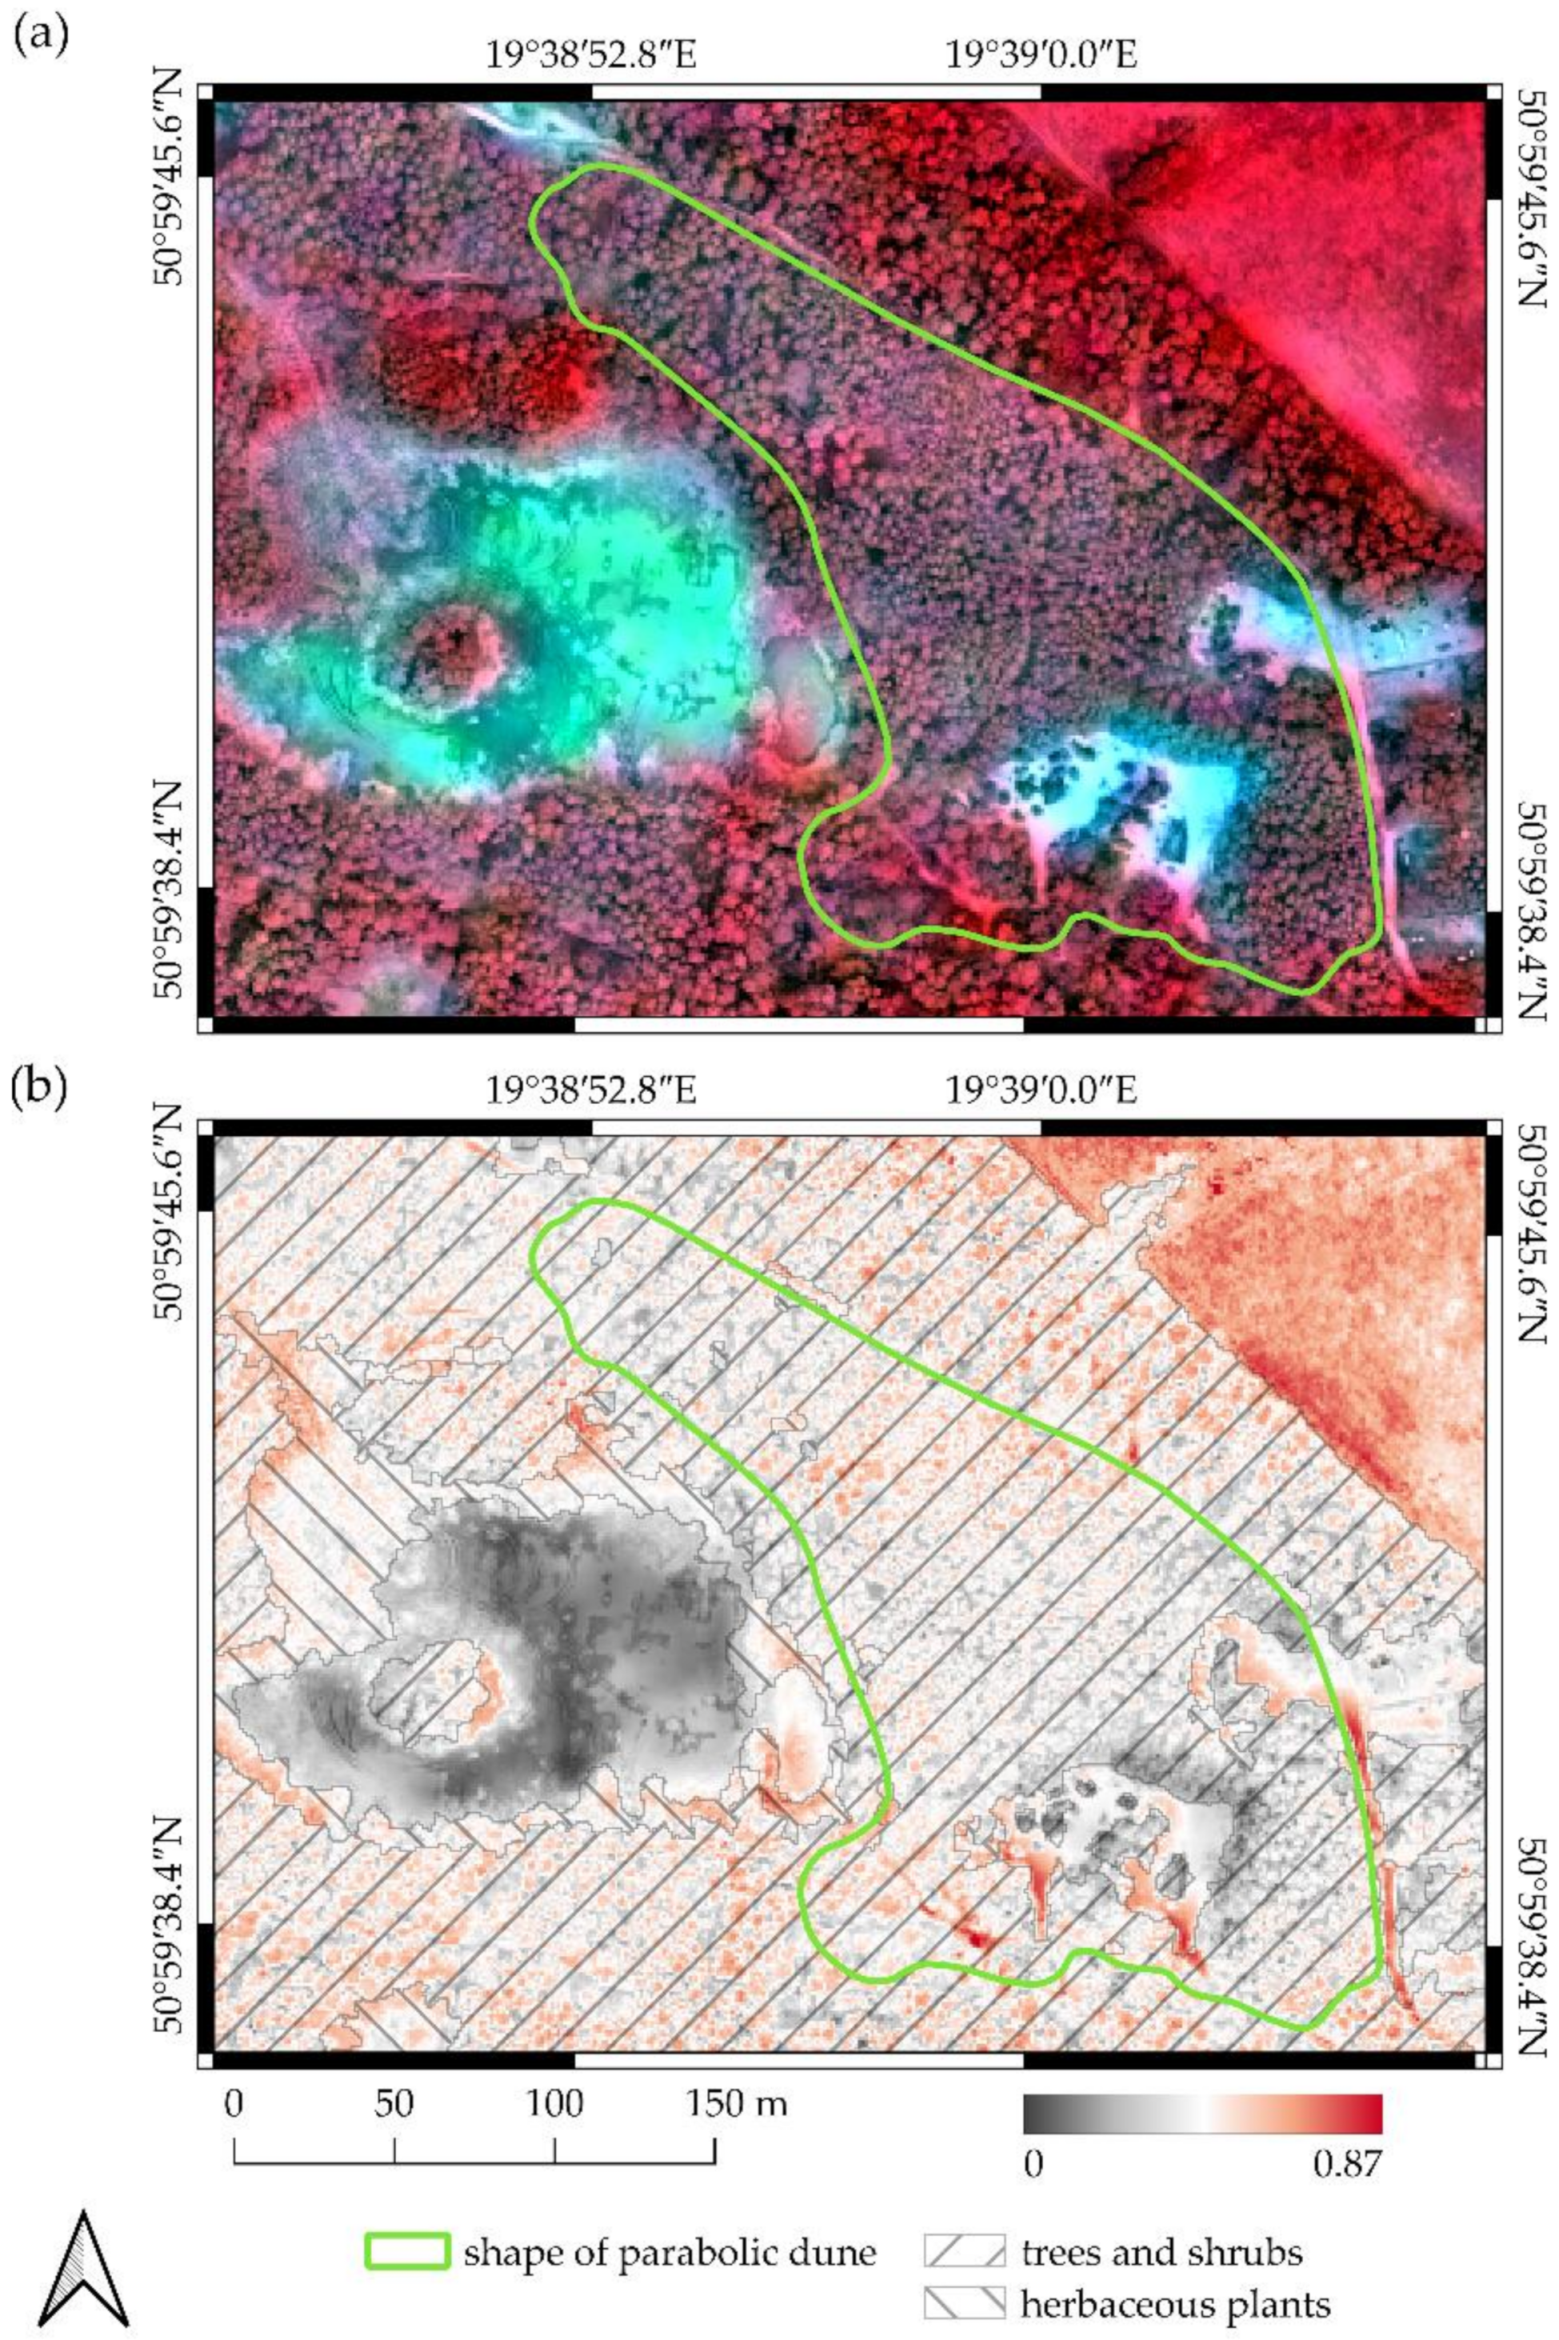
The colour-infrared (CIR) composition indicated the vegetation occurrence with differentiated habitat requirements within the dune range, including its depleted portions and the adjacent terrains. In this range, the exception was a blowout periodically filled with water situated to the west of the surveyed object where species composition was connected especially with the hydrophytes (Figure 2 and Figure 9a).
The calculated Modified Chlorophyll Absorption in Reflectance Index 1 (MCARI1) points to low chlorophyll content (0–0.42) in the leaves of the plants overgrowing the depleted dune fragments (A, B, C). This is vegetation that is in the initial growth stadium. Higher MCARI1 values were noted in the ridge dune portions where pine monoculture occurs. In the blowout to the west, the MCARI1 took its lowest values (0–0.22) where a small number of plant species were found, including, among others, species from the genera Juncus and Typha. In turn, the highest index values (>0.81) were noted for the grassland situated to the northeast from the surveyed object, which confirmed the very good health condition of the vegetation in this region (Figure 2 and Figure 9b).
Results from CIR and MCARI1 were confirmed by the field observations that were performed in June 2020. Currently, the facial portion of the dune, including its arms, has been overplanted by evenly aged sections of Scots pine (Pinus sylvestris) production monocultures. The mean age of the trees is approximately 35–40 years. Moreover, in these dry and poor habitats, natural Scots pine renewals, young specimens of the silver birch (Betula pendula) from natural seeding, and a predominating share of common heather (Calluna vulgaris) and lingonberry (Vaccinium vitis-idaea) were found, whereas the slopes were covered primarily with grey hair grass (Corynephorus canescens), as well as wood small-reed (Calamagrostis epigejos). Operation measures leading to the stabilisation of volatile sands through pine monoculture planting probably took place around the year 1980. The role given to the artificial pine forest stand was the prevention of the wind-blown dispersal of aeolian material onto the nearby grassland in areas to the northeast of the dune. In turn, in the blowout periodically filled with water because of low groundwater level, among other plant life noted was a marked predominance of compact rush (Juncus conglomeratus), sweet flag (Acorus calamus), common reed (Phragmites communis), and white water-lily (Nymphaea alba) (Figure 2). Within non-forested parts of the dune, the presence of mosses and lichens growing on the ground or the litter layer was also recorded.

5. Discussion

A geostatistical approach was used in the performed survey. This allowed the reconstruction of the most probable shape and relief of the surveyed aeolian form, particularly the exploited parts, and to elaborate its present relief. In both cases, the Gaussian model was applied to describe the spatial variability. A theoretical semivariogram of this type effectively describes the topographic elevation of gently undulating hills [57]. Therefore, in the present case it was deemed to be appropriate for use on the surveyed aeolian form. The results of the cross-validation (CV), where mean error (ME), root mean square error (RMSE), and root mean square standardised error (RMSSE) were calculated (Table 3), confirm the degree of the appropriate adjustment of the model.
For the present relief and primary relief, the values of the errors obtained were appropriate. The values of ME and RMSE were close to zero and were −0.009 and 0.564 for the present relief and −0.014 and 0.304 for the primary relief, respectively. Moreover, the values of RMSSE were close to one and were 0.999 for the present relief and 1.077 for the primary relief, respectively. The same theoretical Gaussian model was used by Zarychta et al. [16], who obtained similar results of the CV in the survey relating to the reconstruction of the Liban Quarry in Cracow. In this case, the error values reached ME 0.004, RMSE 0.28 and RMSSE 0.98, respectively. Bzdęga et al. [63] obtained similar results of the CV for spherical models and exponential model in modelling the occurrence of the invasive plant species Sosnowsky’s hogweed (Heracleum sosnowskyi) and knotweeds (Fallopia spp.) These are recognised as the most troublesome alien invasive species in Poland [64] and pose a threat to native biodiversity. Their spread also affects the economy and human health. In this work, the obtained error values were ME 0.002–0.013, RMSSE 0.213–0.509, and RMSSE 0.991–1.164, respectively. As a result, the correct variogram structural analysis allowed for obtaining predicted probabilities of occurrence with quantified adequacy of the underpinning models for the targeted species. Fubelli et al. [65] achieved slightly worse results than those found in our research. In the geostatistical reconstruction of the PaleoFarfa River alluvial plain, they found higher CV error values with a higher density of sampling points. In the case of reconstructing top surfaces of the Gelasian fluvial to deltaic deposits, the values for ME of 0.085, RMSE of 4.085, and RMSSE of 0.595 were achieved, while the values in the reconstruction of basal surfaces of the Gelasian fluvial to deltaic deposits reached ME −0.006, RMSE 3.433, and RMSSE 0.421, respectively. Simultaneously the obtained RMSSE values were different from one, indicating a poor fit of the used semivariograms and underestimating of the variability in predictions. Furthermore, RMSE values were 3.521 higher for the reconstruction of top surfaces of the Gelasian fluvial to deltaic deposits and 3.129 higher for the reconstruction of basal surfaces of the Gelasian fluvial to deltaic deposits in relation to those obtained in the reconstruction of the parabolic dune. Similarly, higher RMSE values were found by Cvijetinović et al. [66] by comparing different interpolation methods in terrain reconstruction. For the ordinary kriging method, the obtained RMSE value of 2.35 was 2.046 higher than in the parabolic dune relief reconstruction.
The geostatistical modelling performed allowed the use of ordinary kriging (OK), which in the case of the analysed dune, best represented elevation where point data were missing. Overall, according to Cvijetinović et al. [66], better results may be obtained from applying the OK and multiquadratic methods. However, as the authors noted, geostatistical methods allowed the possibility of calculating the most probable terrain surfaces. This is also confirmed by the studies conducted by Zeng et al. [67], who used ordinary kriging for modelling the correlation structures of column-averaged CO2 dry air mole fractions (Xco2), considering that the selected estimator was relevant.
In our study, the obtained kriging standard deviation (SDok) is prediction dependent and represents the error predicted by the model in the location of the point measurement [68]. Hence, the calculated SDok values were similar to those obtained by Zeng et al. [67], but much lower than those achieved by Cvijetinović et al. [66]. The SDok values herein were 0.251 m for the present relief and 0.196 m for the primary relief, respectively, while in the study of Zeng et al. [67], SDok values for the Xco2 variable ranged from 1.87 to 2.36 ppm. In contrast, Cvijetinović et al. [66] obtained SDok of 2.28 m. This was 2.029–2.084 higher than that found for the parabolic dune reconstruction. The obtained SDok values are considered to be prediction dependent and to indicate a slight change in elevation due to the use of the ordinary kriging (OK) estimator compared to performed predictions.
The reconstruction of the primary relief of the dune surveyed in the form of a hypsometric map and digital elevation model (DEM) was obtained as a result of processing points from field measurements. Their credibility, apart from the CV, was also confirmed by the analysed cartographic materials (historical), i.e., the Topographic Map of Poland 1:10,000 (1986) [51]. Its comparison with the developed hypsometric map and digital elevation model (DEM) revealed that these correctly predict elevation values to a very large extent. Although there are no measurement points within the exploited parts of the dune, the obtained contour lines are analogous to those contained in the 1986 map [51] due to the determination of the spatial variability of the examined variable (elevation) and the application of ordinary kriging. The results of the research on the surveyed dune relief were completed with a health condition analysis of the vegetation occurring within its range and on the surrounding terrain. This was conducted on the basis of the field observations and on that of the colour-infrared (CIR) analysis and Modified Chlorophyll Absorption in Reflectance Index 1 (MCARI1) that were preceded by satellite Sentinel-2A and UAV image fusion. Application of the image fusion allowed imaging of significantly higher spatial resolution to be obtained, with a simultaneous preservation of the spectral resolution [59]. The proposed approach emerged as the better solution during the CIR composition and the MCARI1 calculation as compared to the use of only satellite images with high resolution. Such an outcome was confirmed by the research results by Zhao et al. [58], who used image fusion for improving cultivation classification quality in the finer spatial scale. The MCARI1 values depend on the relative abundance of chlorophyll. Thus, the MCARI1 and CIR obtained in our survey disclosed that definitely better habitat conditions for vegetation prevail on the terrains surrounding the dune than within the dune area. Furthermore, many factors affect this, including dune topography and the availability of water and plant nutrients. The analogical impact of topography on the condition and growth of vegetation on an inland dune in Toruń was also shown by Sewerniak and Jankowski [21].
On the basis of the performed analyses, it was concluded that the surveyed aeolian form is located on flatland approximately 15 m from a no-outflow terrain depression that is periodically filled with water. This shallow depression is a blowout that consists primarily of a flat surface built from loose, fine-grain material prone to wind movement and transportation. Hence, it was eroded and transported by winds from the west and deposited onto the nearby terrains, and was accumulated there. Consequently, a small aeolian form was built with a clearly extended crest portion and two declining arms that are faced against the wind, which was gradually stabilised by the vegetation that took root there. The windward slope was smooth as compared to the leeward slope that constituted the zone of the prevailing sand material deposition. In geomorphological terms, the surveyed object is an inactive inland parabolic dune, and this is suggested by the bending arc of its ridge portion, which in turn can be related with the direction of the prevailing winds. These results were confirmed by Yan and Baas [69] and Hesp [70], who presented and explained the exact course of the mentioned dune processes covering the formation of aeolian forms, dynamics, and sediment transport, and their evolution. Dunes of this type were formed in Central Poland, especially in the Łódź voivodship where terrains prone to aeolian processes are found [48]. The surveyed parabolic dune primarily had a well-formed northern arm, a more poorly formed southern arm, and asymmetric slopes. It was an active form, which is suggested by its crest portion displacement. In order to stop the aeolian processes and limit the spread of the sand onto the nearby grassland, pine monocultures were introduced on the ridge portions of the dune, as occurs very frequently on inland dunes in Europe [21]. In Poland, similar actions were undertaken in the case, among others, of dunes in Poręby and Ogrodzisko [48].
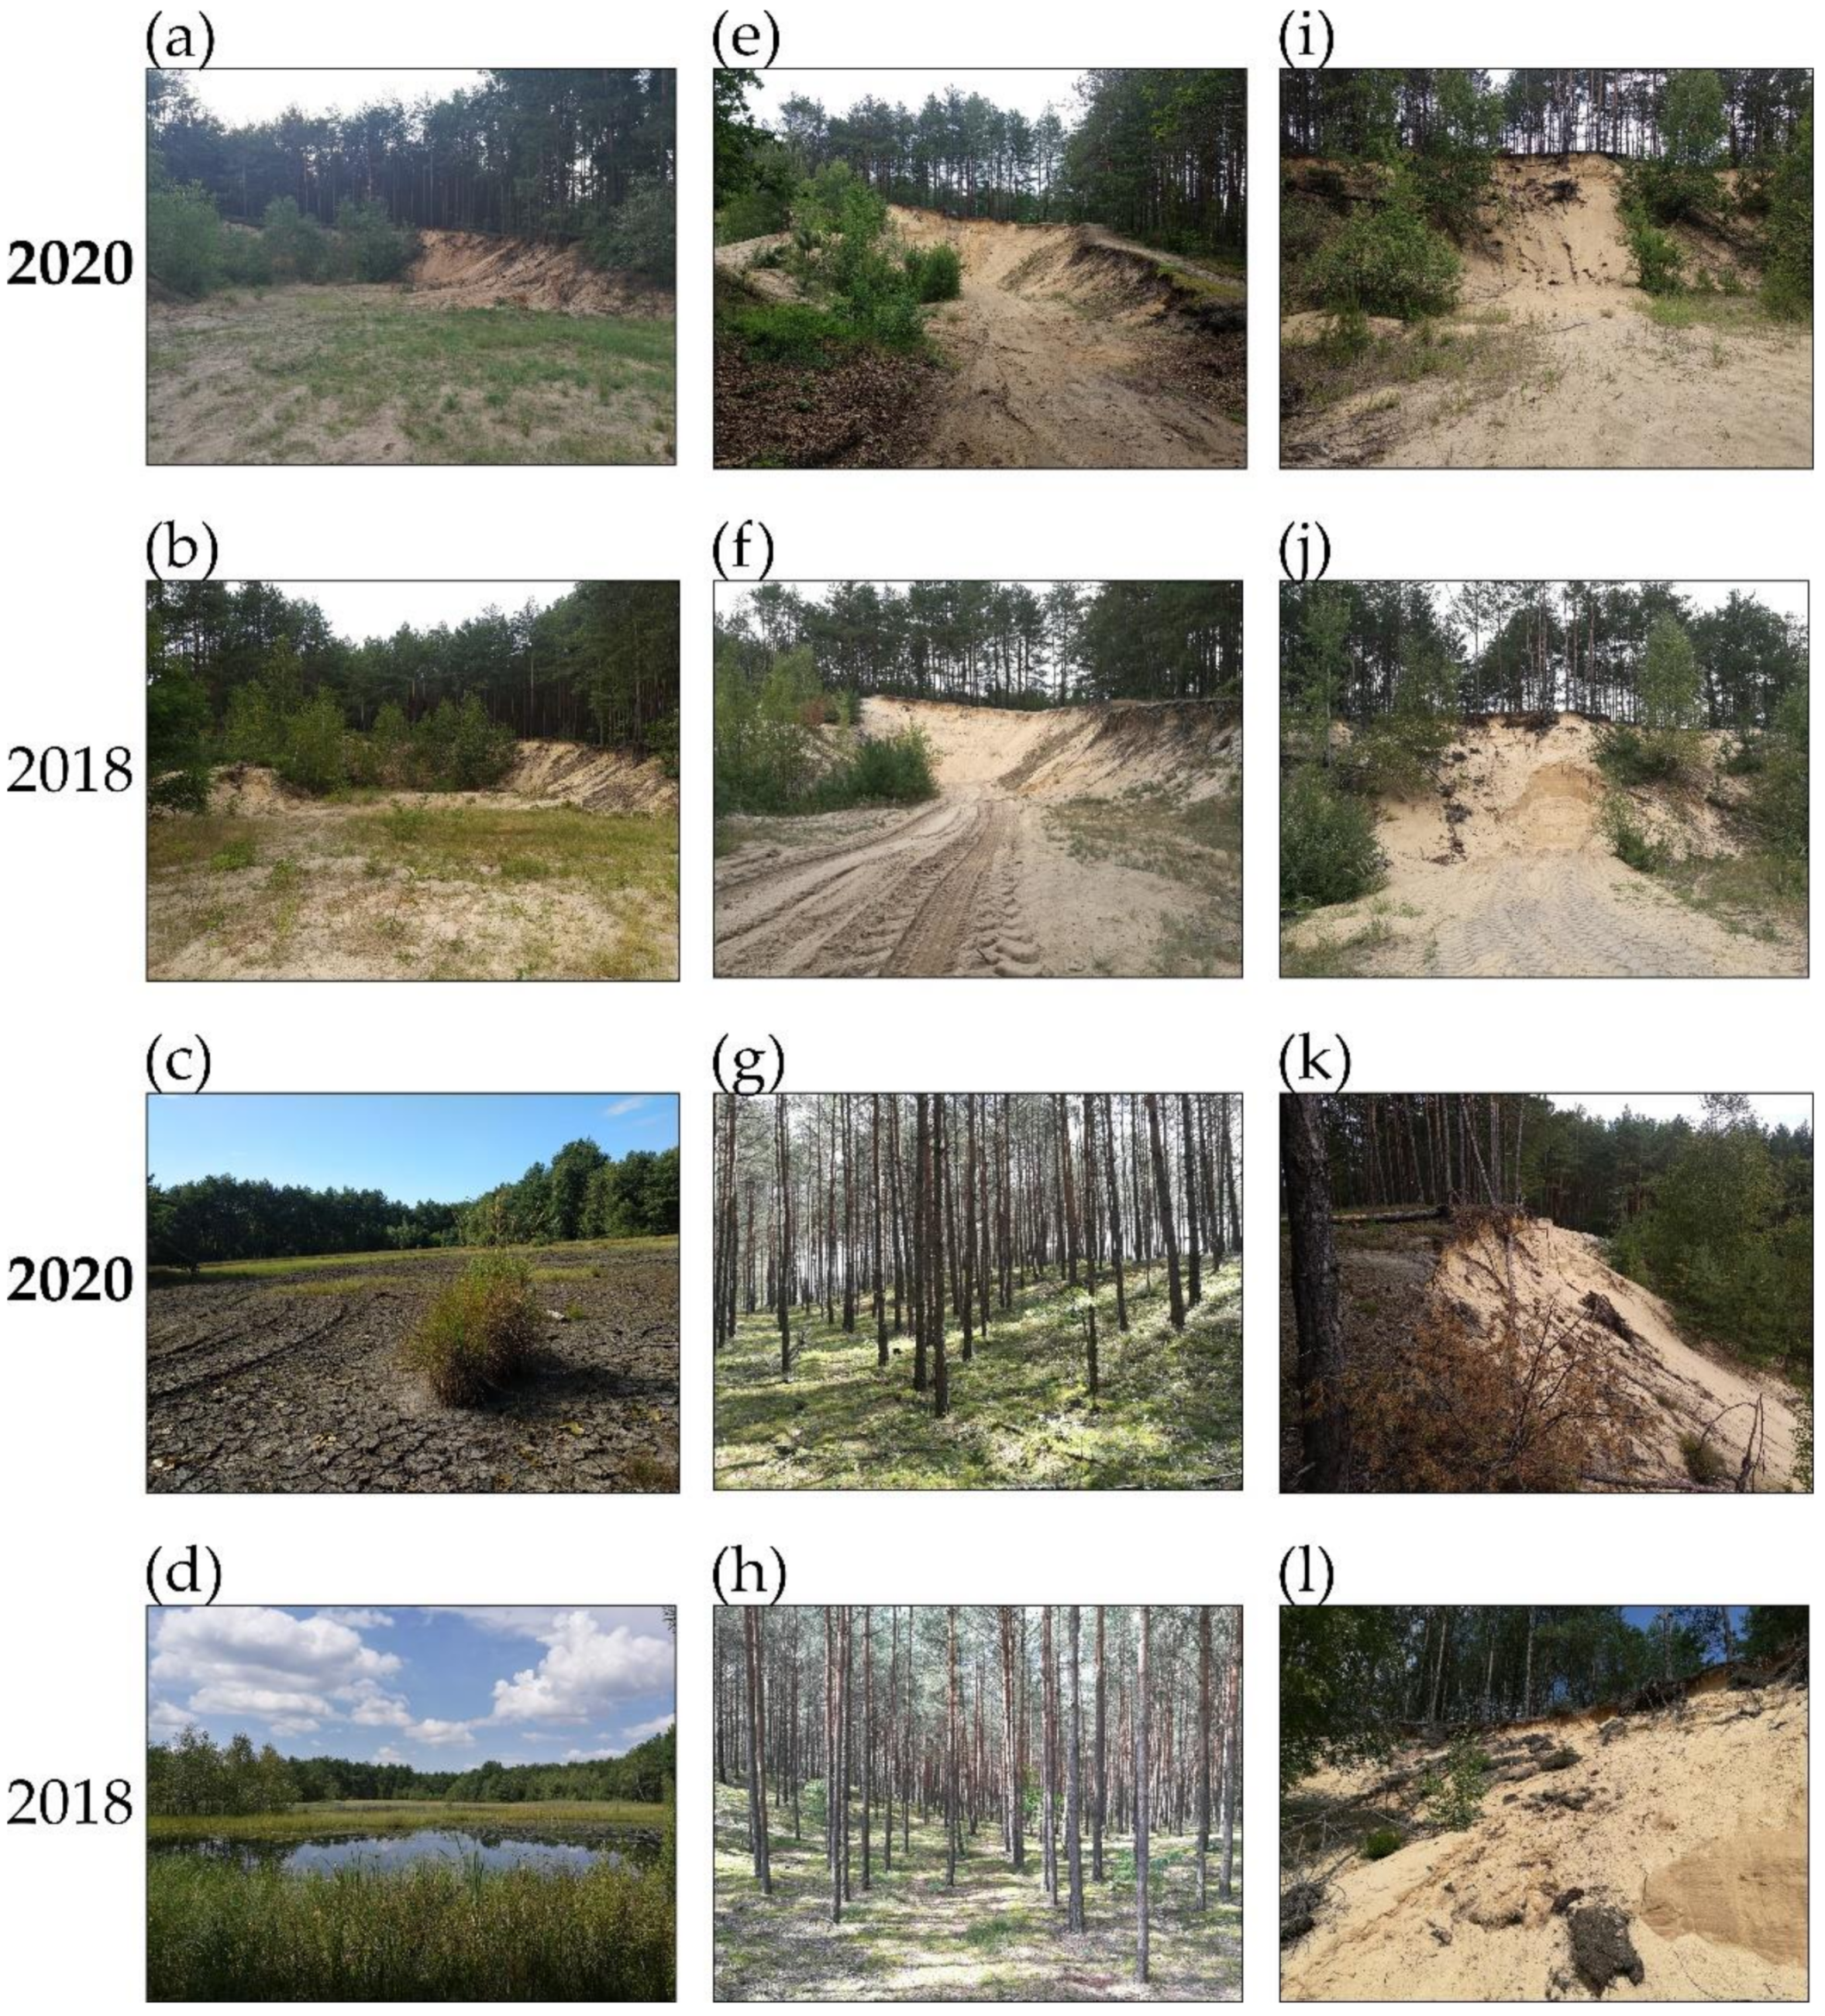
The sand exploitation from portions A, B, and C of the surveyed dune (Figure 2a,b,e,f,i–l and Figure 7) contributed to its structure and relief disturbance. In the mining process, steep walls were created that are characteristic of open pit minings (among others—sand pits). These activated the slope processes and simultaneously initiated the process of slope retreat. The standing non-exploited dune portion A is distinguished by its slope. At the foot of this are slump features in the form of soil heaps. In turn, in the remaining dune portions B and C, regular fragments of the crest break off from top portions of the slopes, which cause trees and bushes to fall over and tumble down the slope, transporting them toward the foot of the dune.
Inappropriate and uncontrolled natural resource exploitation precipitates subsequent geomorphological processes that involve irreversible changes in the relief of the surveyed aeolian form which was also emphasised by Goudie [40] in the case of the parabolic dunes. The lack of action connected with sand recovery abandonment will, in a short time, lead to the complete destruction of the dune, as was observed in the case of a majority of the Holocene dunes formed in the Toruń area [71].
The terrain within which the surveyed aeolian was formed is subject to intrinsic regeneration due to ecological succession as takes place, among others, in the Mojave and Sonoran Deserts (United States of America, USA) [72], the Tengger Desert (China) [73], refuse dumps at the Heidaigou opencast coal mine (China) [74], in gravel-sand pits (Czech Republic) [75], and at Pustynia Błędowska (Poland) [76]. However, if on the terrain covered by the survey, anthropogenic activity continues apace and intensifies in regard to the uncontrolled exploitation of sand and the excessive uprooting of trees from the dune terrain and its surroundings, the aeolian processes will re-activate, producing a natural imbalance on this terrain, entailing considerable economic and material losses.
Our research is innovative because in the proposed solution, the detailed reconstruction of the primary relief and significantly depleted sites was performed without taking into account the historical cartographic materials customarily considered to be the main source of information. Generally, the analysis of geomorphological forms with their application may be difficult or almost impossible, especially because they often present the historical topographic condition in a highly simplified manner.
The proposed solution in the shape of reconstructing the aeolian form with the use of data derived from a GNSS receiver is a low-cost solution and may find application, among others, in the construction of artificial coastal dunes that would constitute a protective barrier against waves and storm surges [45,77,78]. The issue of the reconstruction of the primary dune relief may be useful in practices relating to the consolidation of dunes [21], as well as in environmental management and the formulation of recultivation plans.

6. Conclusions

Human economic activity contributes to great changes in the landscape. Uncontrolled mineral raw material exploitation is one of the many aspects of such activity. This may affect the various geomorphological forms that are frequently the potential source of the raw material recovered for various economic purposes. The parabolic dunes found in Central Poland are an example of such forms, the crest portions of which have been subjected to significant transformations due to excessive and uncontrolled sand exploitation for building purposes. The performed modelling of the present and primary dune relief allowed the undertaking of the assessment of the changes that have occurred over the years due to human intervention. The surveys confirmed that anthropogenic activity has contributed to the activation of the aeolian and slope processes. Within the surveyed form, vegetation of varied habitat requirements was grown. Currently, the ridge portion of the dune is overplanted with pine monoculture that was introduced to prevent the sand from being wind-blown on the nearby grassland.
The significant achievement of our study, despite insufficient data on the former morphology of the area, but with the help of appropriate and advanced geostatistical tools, was reconstructing the relief of the studied area, including the parabolic dune with its adjacent areas, as hypsometric maps and as digital elevation models (DEMs) based on a set of point data obtained from GNSS receiver.
In conclusion, it should be emphasised that the present elaboration is the first research in which methodical solutions in reference to the relief changes of the accumulative aeolian forms was proposed. This utilises geostatistical modelling for full reconstruction of an accumulative aeolian form relief in an anthropogenically transformed area, and includes assessment of vegetation condition. It constitutes a valuable source of information for institutional bodies involved in the management and protection of the objects of this type that are situated not only on inland terrains, but on coastal terrains as well.

Author Contributions

Conceptualisation, R.Z., A.Z. and K.B.; methodology, R.Z., A.Z. and K.B.; software, R.Z. and A.Z.; validation, R.Z. and A.Z.; formal analysis, R.Z. and A.Z.; investigation, R.Z. and A.Z.; resources, R.Z. and A.Z.; data curation, R.Z. and A.Z.; writing—original draft preparation, R.Z., A.Z. and K.B.; writing—review and editing, R.Z., A.Z. and K.B.; visualisation, R.Z. and A.Z.; supervision, R.Z.; project administration, R.Z. All authors have read and agreed to the published version of the manuscript.

Funding

This research received no external funding.

Data Availability Statement

Not applicable.

Acknowledgments

We would like to thank the anonymous native speaker who had carefully read and checked our manuscript. We thank the three anonymous reviewers whose comments and suggestions helped improve and clarify this manuscript.

Conflicts of Interest

The authors declare no conflict of interest.

References

  1. Goudie, A. The Human Impact on the Natural Environment: Past, Present and Future, 7th ed.; John Wiley & Sons: Hoboken, NJ, USA, 2018; ISBN 9781405127042. [Google Scholar]
  2. Omotehinse, A.O.; Ako, B.D. The environmental implications of the exploration and exploitation of solid minerals in Nigeria with a special focus on Tin in Jos and Coal in Enugu. J. Sustain. Min. 2019, 18, 18–24. [Google Scholar] [CrossRef]
  3. Sobczyk, W.; Kowalska, A.; Sobczyk, J. Exploitation of Mineral Resources for Sustainable Development on the Example of Poland. J. Educ. Technol. Comput. Sci. 2020, 31, 49–52. [Google Scholar] [CrossRef]
  4. Gavriletea, M. Environmental Impacts of Sand Exploitation. Analysis of Sand Market. Sustainability 2017, 9, 1118. [Google Scholar] [CrossRef] [Green Version]
  5. Govorushko, S.M. Mining and Mineral Processing. In Natural Processes and Human Impacts. Interactions between Humanity and the Environment; Springer: Dordrecht, The Netherlands, 2011; pp. 485–511. ISBN 978-94-007-1423-6. [Google Scholar]
  6. Kowalska, A.; Sobczyk, W. Negative and positive effects of the exploitation of gravel-sand. Inz. Miner. 2014, 15, 105–109. [Google Scholar]
  7. Mkpuma, R.O.; Okeke, O.C.; Abraham, E.M. Environmental Problems of Surface and Underground Mining: A review. Int. J. Eng. Sci. 2015, 4, 12–20. [Google Scholar]
  8. Navarro, A.; Collado, D.; Carbonell, M.; Sanchez, J.A. Impact of mining activities on soils in a semi-arid environment: Sierra Almagrera district, SE Spain. Environ. Geochem. Health 2004, 26, 383–393. [Google Scholar] [CrossRef]
  9. Unanaonwi, O.E.; Amonum, J.I. Effect of Mining Activities on Vegetation Composition and nutrient status of Forest Soil in Benue Cement Company, Benue State, Nigeria. Int. J. Environ. Agric. Biotechnol. 2017, 2, 297–305. [Google Scholar] [CrossRef]
  10. Warhate, S.R.; Yenkie, M.K.N.; Pokale, W.K. Impacts of mining on water and soil. J. Environ. Sci. Eng. 2007, 49, 143–152. [Google Scholar]
  11. Boengiu, S.; Ionuş, O.; Marinescu, E. Man-made Changes of the Relief Due to the Mining Activities within Husnicioara Open Pit (Mehedinţi County, Romania). Procedia Environ. Sci. 2016, 32, 256–263. [Google Scholar] [CrossRef] [Green Version]
  12. Jaskulski, M.; Nowak, T. Transformations of Landscape Topography of the Bełchatów Coal Mine (Central Poland) and the Surrounding Area Based on DEM Analysis. ISPRS Int. J. Geo-Inf. 2019, 8, 403. [Google Scholar] [CrossRef] [Green Version]
  13. Riquelme, A.; Del Soldato, M.; Tomás, R.; Cano, M.; Jordá Bordehore, L.; Moretti, S. Digital landform reconstruction using old and recent open access digital aerial photos. Geomorphology 2019, 329, 206–223. [Google Scholar] [CrossRef]
  14. Rossi, P.; Mancini, F.; Dubbini, M.; Mazzone, F.; Capra, A. Combining nadir and oblique UAV imagery to reconstruct quarry topography: Methodology and feasibility analysis. Eur. J. Remote Sens. 2017, 50, 211–221. [Google Scholar] [CrossRef] [Green Version]
  15. Zarychta, R. Krajobraz poeksploatacyjny kamieniołomu Liban w Krakowie. Przegląd Geol. 2019, 67, 1002–1011. [Google Scholar] [CrossRef]
  16. Zarychta, R.; Zarychta, A.; Bzdęga, K. Progress in the Reconstruction of Terrain Relief Before Extraction of Rock Materials—The Case of Liban Quarry, Poland. Remote Sens. 2020, 12, 1548. [Google Scholar] [CrossRef]
  17. Chaussard, E.; Kerosky, S. Characterization of Black Sand Mining Activities and Their Environmental Impacts in the Philippines Using Remote Sensing. Remote Sens. 2016, 8, 100. [Google Scholar] [CrossRef] [Green Version]
  18. Twerefou, D.K. Mineral Exploitation, Environmental Sustainability and Sustainable Development in EAC, SADC, and ECOWAS Regions; African Trade Policy Centre, Economic Commission for Africa: Addis Ababa, Ethiopia, 2009. [Google Scholar]
  19. Macdonald, S.E.; Landhäusser, S.M.; Skousen, J.; Franklin, J.; Frouz, J.; Hall, S.; Jacobs, D.F.; Quideau, S. Forest restoration following surface mining disturbance: Challenges and solutions. New For. 2015, 46, 703–732. [Google Scholar] [CrossRef] [Green Version]
  20. Loksa, G. Variations in microclimate modified by open-cast mining: Case studies from Hungary. Geogr. Fis. E Din. Quat. 2007, 30, 215–218. [Google Scholar]
  21. Sewerniak, P.; Jankowski, M. Topographically-controlled site conditions drive vegetation pattern on inland dunes in Poland. Acta Oecologica 2017, 82, 52–60. [Google Scholar] [CrossRef]
  22. Medjkane, M.; Maquaire, O.; Costa, S.; Roulland, T.; Letortu, P.; Fauchard, C.; Antoine, R.; Davidson, R. High-resolution monitoring of complex coastal morphology changes: Cross-efficiency of SfM and TLS-based survey (Vaches-Noires cliffs, Normandy, France). Landslides 2018, 15, 1097–1108. [Google Scholar] [CrossRef]
  23. Zhou, X.; Wang, G.; Bao, Y.; Xiong, L.; Guzman, V.; Kearns, T.J. Delineating Beach and Dune Morphology from Massive Terrestrial Laser-Scanning Data Using Generic Mapping Tools. J. Surv. Eng. 2017, 143, 04017008. [Google Scholar] [CrossRef]
  24. Łajczak, A.; Zarychta, R.; Wałek, G. Changes in the topography of Krakow city centre, Poland, during the last millennium. J. Maps 2020, 1–8. [Google Scholar] [CrossRef]
  25. Casella, E.; Drechsel, J.; Winter, C.; Benninghoff, M.; Rovere, A. Accuracy of sand beach topography surveying by drones and photogrammetry. Geo-Mar. Lett. 2020, 40, 255–268. [Google Scholar] [CrossRef] [Green Version]
  26. Ren, H.; Zhao, Y.; Xiao, W.; Hu, Z. A review of UAV monitoring in mining areas: Current status and future perspectives. Int. J. Coal Sci. Technol. 2019, 6, 320–333. [Google Scholar] [CrossRef] [Green Version]
  27. Pandey, A.C.; Kumar, A. Analysing topographical changes in open cast coal-mining region of Patratu, Jharkhand using CARTOSAT-I Stereopair satellite images. Geocarto Int. 2014, 29, 731–744. [Google Scholar] [CrossRef]
  28. Rishikeshan, C.A.; Ramesh, H. A novel mathematical morphology based algorithm for shoreline extraction from satellite images. Geo-Spat. Inf. Sci. 2017, 20, 345–352. [Google Scholar] [CrossRef] [Green Version]
  29. Tan, L.; Zhang, W.; Qu, J.; Zhang, K.; An, Z.; Wang, X. Aeolian sand transport over gobi with different gravel coverages under limited sand supply: A mobile wind tunnel investigation. Aeolian Res. 2013, 11, 67–74. [Google Scholar] [CrossRef]
  30. Mayaud, J.R.; Bailey, R.M.; Wiggs, G.F.S. Modelled responses of the Kalahari Desert to 21st century climate and land use change. Sci. Rep. 2017, 7, 3887. [Google Scholar] [CrossRef] [PubMed] [Green Version]
  31. Goudie, A.S.; Middleton, N.J. Saharan dust storms: Nature and consequences. Earth-Sci. Rev. 2001, 56, 179–204. [Google Scholar] [CrossRef]
  32. Hu, Q.; Wang, H.; Goloub, P.; Li, Z.; Veselovskii, I.; Podvin, T.; Li, K.; Korenskiy, M. The characterization of Taklamakan dust properties using a multiwavelength Raman polarization lidar in Kashi, China. Atmos. Chem. Phys. 2020, 20, 13817–13834. [Google Scholar] [CrossRef]
  33. Garzanti, E.; Ghassemi, M.R.; Limonta, M.; Resentini, A. Provenance of karakum desert sand (Turkmenistan): Lithic-rich orogenic signature of central Asian dune fields. Riv. Ital. Di Paleontol. E Stratigr. 2019, 125, 77–89. [Google Scholar] [CrossRef]
  34. Hernández, L.; Alonso, I.; Sánchez-Pérez, I.; Alcántara-Carrió, J.; Montesdeoca, I. Shortage of Sediments in the Maspalomas Dune Field (Gran Canaria, Canary Islands) Deduced from Analysis of Aerial Photographs, Foraminiferal Content, and Sediment Transport Trends. J. Coast. Res. 2007, 234, 993–999. [Google Scholar] [CrossRef]
  35. Morkūnait, R.; Radžiūnien, J.; Navickas, K.; Gudynienė, V.; Bautrnas, A. Assessment of degradation of white and grey dune habitats in the Curonian Spit: A case study of Parnidis Dune (Nida environs, Lithuania). Z. Für Geomorphol. 2016, 60, 75–87. [Google Scholar] [CrossRef] [Green Version]
  36. Povilanskas, R.; Satkūnas, J.; Taminskas, J. Results of cartometric investigations of dune morphodynamics on the Curonian Spit. Geologija 2006, 53, 22–27. [Google Scholar]
  37. Bertran, P.; Andrieux, E.; Bateman, M.D.; Fuchs, M.; Klinge, M.; Marembert, F. Mapping and chronology of coversands and dunes from the Aquitaine basin, southwest France. Aeolian Res. 2020, 47, 100628. [Google Scholar] [CrossRef]
  38. Sánchez-Pérez, I.; Alonso, I.; Usera, J. Determination of the sediment inputs from the upper shelf towards the beaches and dunes of Maspalomas (Gran Canaria) by foraminifera analysis. J. Coast. Res. 2005, 46–51. [Google Scholar]
  39. Derbyshire, E.; Owen, L.A. Glacioaeolian Processes, Sediments, and Landforms. In Past Glacial Environments; Elsevier: Amsterdam, The Netherlands, 2018; pp. 273–308. ISBN 9780081005248. [Google Scholar]
  40. Goudie, A.S. Parabolic Dunes: Distribution, Form, Morphology and Change. Ann. Arid. Zone 2011, 50, 1–7. [Google Scholar]
  41. Hanoch, G.; Yizhaq, H.; Ashkenazy, Y. Modeling the bistability of barchan and parabolic dunes. Aeolian Res. 2018, 35, 9–18. [Google Scholar] [CrossRef]
  42. Alvarez, C.A.; Franklin, E.M. Shape evolution of numerically obtained subaqueous barchan dunes. Phys. Rev. E 2020, 101, 012905. [Google Scholar] [CrossRef] [Green Version]
  43. Filho, W.L.; Hunt, J.; Lingos, A.; Platje, J.; Vieira, L.W.; Will, M.; Gavriletea, M.D. The unsustainable use of sand: Reporting on a global problem. Sustainability 2021, 13, 3356. [Google Scholar] [CrossRef]
  44. Strandberg, G.; Kjellström, E. Climate impacts from afforestation and deforestation in Europe. Earth Interact. 2019, 23, 1–27. [Google Scholar] [CrossRef]
  45. Łabuz, T.A. The methods of field research in the analysis of accumulative foredunes development on the Polish coast. Landf. Anal. 2015, 28, 45–60. [Google Scholar] [CrossRef]
  46. Koprowski, M.; Winchester, V.; Zielski, A. Tree reactions and dune movements: Slowinski National Park, Poland. Catena 2010, 81, 55–65. [Google Scholar] [CrossRef]
  47. Pełka-Gościniak, J.; Zatoński, J. Dunes in the neighborhood of Gidle and Pławno (NW part of the Włoszczowa Basin)—Initial remarks. In Selected Issues of Aeolian Geomorphology: Monography Dedicated to dr hab. Bogdana Izmaiłow on the 44. Anniversary of Scientific Work; Święchowicz, J., Michno, A., Eds.; Stitute of Geography and Spatial Management of Jagiellonian University in Cracow: Kraków, Poland, 2017; pp. 265–277. [Google Scholar]
  48. Twardy, J. Transformation of selected relief landforms of the łódź voivodeship in the last century. Acta Geogr. Lodz. 2019, 109, 11–28. [Google Scholar] [CrossRef] [Green Version]
  49. Mycielska-Dowgiałło, E.; Korokaj-Kokoszczyńska, M.; Smolska, E.; Rutkowski, J. Dynamic and Applied Geomorphology; Department of Geography and Regional Studies of Warsaw University: Warsaw, Poland, 2001; ISBN 83-85785-91-4. [Google Scholar]
  50. Hermańska, A.; Smyka, R. Detailed Geological Map of Poland; 1:50,000, Sheet 811-Żytno; Wydawnictwa Geologiczne: Warsaw, Poland, 1990. [Google Scholar]
  51. Tactical Map of Poland; 1:10,000, M-34-40-A-b-1; WIG: Warsaw, Poland, 1986.
  52. “Europe”. Carlos Efraín Porto Tapiquén. Orogénesis Soluciones Geográficas. Porlamar, Venezuela 2015. Based on Shapes from Enviromental Systems Research Institute (ESRI). Free Distribuition. Available online: http://tapiquen-sig.jimdo.com (accessed on 3 March 2021).
  53. Tactical Map of Poland; 1:100,000, Sheet e38 Koniecpol, a 45 b 29; WIG: Warsaw, Poland, 1926.
  54. Tactical Map of Poland; 1:100,000, Sheet Koniecpol, LINE 45 COLUMN 29; WIG: Warsaw, Poland, 1935.
  55. Tactical Map of Poland; 1:25,000, Sheet Żytno, LINE 45 COLUMN 29-B; WIG: Warsaw, Poland, 1937.
  56. Clark, I. Practical Geostatistics; Applied Science Publishers: London, UK, 1979; Volume 3. [Google Scholar]
  57. Goovaerts, P. Geostatistics for Natural Resources Evaluation; Oxford University Press: New York, NY, USA, 1997. [Google Scholar]
  58. Zhao, L.; Shi, Y.; Liu, B.; Hovis, C.; Duan, Y.; Shi, Z. Finer Classification of Crops by Fusing UAV Images and Sentinel-2A Data. Remote Sens. 2019, 11, 3012. [Google Scholar] [CrossRef] [Green Version]
  59. Jenerowicz, A.; Woroszkiewicz, M. The pan-sharpening of satellite and UAV imagery for agricultural applications. Remote Sens. Agric. Ecosyst. Hydrol. XVIII 2016, 9998, 99981S. [Google Scholar] [CrossRef]
  60. Yilmaz, V.; Gungor, O. Fusion of very high-resolution UAV images with criteria-based image fusion algorithm. Arab. J. Geosci. 2016, 9, 59. [Google Scholar] [CrossRef]
  61. Kaplan, G. Sentinel-2 Pan Sharpening—Comparative Analysis. Proceedings 2018, 2, 345. [Google Scholar] [CrossRef] [Green Version]
  62. Haboudane, D. Hyperspectral vegetation indices and novel algorithms for predicting green LAI of crop canopies: Modeling and validation in the context of precision agriculture. Remote Sens. Environ. 2004, 90, 337–352. [Google Scholar] [CrossRef]
  63. Bzdęga, K.; Zarychta, A.; Urbisz, A.; Szporak-Wasilewska, S.; Ludynia, M.; Fojcik, B.; Tokarska-Guzik, B. Geostatistical models with the use of hyperspectral data and seasonal variation – A new approach for evaluating the risk posed by invasive plants. Ecol. Indic. 2021, 121, 107204. [Google Scholar] [CrossRef]
  64. Lowe, S.; Browne, M.; Boudjelas, S.; De Poorter, M. 100 of the World’s Worst Invasive Alien Species: A Selection from the Global Invasive Species Database; Invasive Species Specialist Group: Auckland, North Island, New Zealand, 2000; Volume 12. [Google Scholar]
  65. Fubelli, G.; Della Seta, M.; Amato, G. Drainage system adjustment in response to the opening of the Rieti intermontane basin (Central Italy): Geostatistical reconstruction of the PaleoFarfa River alluvial plain. Rend. Lincei 2014, 25, 167–176. [Google Scholar] [CrossRef]
  66. Cvijetinović, Ž.; Mihajlović, D.; Vojinović, M.; Mitrović, M.; Milenković, M. Procedures and Software for High Quality TIN Based Surface Reconstruction. Int. Arch. Photogramm. Remote Sens. Spat. Inf. Sci. 2008, 37, 629–634. [Google Scholar]
  67. Zeng, Z.; Lei, L.; Hou, S.; Ru, F.; Guan, X.; Zhang, B. A Regional Gap-Filling Method Based on Spatiotemporal Variogram Model of CO2 Columns. IEEE Trans. Geosci. Remote Sens. 2014, 52, 3594–3603. [Google Scholar] [CrossRef]
  68. Wackernagel, H. Multivariate Geostatistics: An Introduction with Applications; Springer Science & Business Media: Berlin/Heidelberg, Germany, 2013; ISBN 3662052946. [Google Scholar]
  69. Yan, N.; Baas, A.C.W. Parabolic dunes and their transformations under environmental and climatic changes: Towards a conceptual framework for understanding and prediction. Glob. Planet. Chang. 2015, 124, 123–148. [Google Scholar] [CrossRef] [Green Version]
  70. Hesp, P. Foredunes and blowouts: Initiation, geomorphology and dynamics. Geomorphology 2002, 48, 245–268. [Google Scholar] [CrossRef]
  71. Molewski, P. Anthropogenic degradation of dunes within a city: A disappearing feature of the cultural landscape of Toruń (Poland). J. Maps 2020, 5647, 1–8. [Google Scholar] [CrossRef] [Green Version]
  72. Abella, S.R. Disturbance and Plant Succession in the Mojave and Sonoran Deserts of the American Southwest. Int. J. Environ. Res. Public Health 2010, 7, 1248–1284. [Google Scholar] [CrossRef]
  73. Li, X.; Zhang, Z.; Tan, H.; Gao, Y.; Liu, L.; Wang, X. Ecological restoration and recovery in the wind-blown sand hazard areas of northern China: Relationship between soil water and carrying capacity for vegetation in the Tengger Desert. Sci. China Life Sci. 2014, 57, 539–548. [Google Scholar] [CrossRef] [Green Version]
  74. Huang, L.; Zhang, P.; Hu, Y.; Zhao, Y. Vegetation succession and soil infiltration characteristics under different aged refuse dumps at the Heidaigou opencast coal mine. Glob. Ecol. Conserv. 2015, 4, 255–263. [Google Scholar] [CrossRef] [Green Version]
  75. Řehounková, K.; Prach, K. Spontaneous Vegetation Succession in Gravel–Sand Pits: A Potential for Restoration. Restor. Ecol. 2008, 16, 305–312. [Google Scholar] [CrossRef]
  76. Rahmonov, O.; Kin, N. Role of allochthonous substance in initial stage succession. Acta Geogr. Silesiana 2007, 1, 53–60. [Google Scholar]
  77. Cabrera-Vega, L.L.; Cruz-Avero, N.; Hernández-Calvento, L.; Hernández-Cordero, A.I.; Fernández-Cabrera, E. Morphological changes in dunes as an indicator of anthropogenic interferences in arid dune fields. J. Coast. Res. 2013, 165, 1271–1276. [Google Scholar] [CrossRef]
  78. Lin, T.-Y.; Liou, J.-Y. A Field Experiment for Coastal Dune Reconstruction. 2008, pp. 27–34. Available online: https://www.researchgate.net/profile/Tsung-Yi-Lin/publication/239528296_A_Field_Experiment_for_Coastal_Dune_Reconstruction/links/5c823ffa92851c695060ce04/A-Field-Experiment-for-Coastal-Dune-Reconstruction.pdf (accessed on 15 July 2021).
Figure 1. The parabolic dune and its surroundings, as located against the background of Poland and Europe; human activity related to sand exploitation: side views and overhand views: A—eastern slope; B, C—southern slope [52].
Remotesensing 13 03937 g001
Figure 2. View of the selected portions of the surveyed dune and neighboring terrains in the years of 2020 and 2018: (a,b) portion A of the dune—displaying a lack of human activity and the slow encroachment of vegetation; (e,f) portion B of the dune—exhibiting low-level human activity in the last year; (i,j) portion C of the dune—evidencing low-level human activity in the last year and the progressive succession of vegetation; (c,d) blowout temporarily filled with water; (g,h) pine monoculture overgrowing the dune; (k,l) slope processes on the dune caused by human activity.
Remotesensing 13 03937 g002
Figure 3. Cartographic materials displaying the parabolic dune and its surroundings areas: (a) part of the Tactical Map of Poland with scale of 1:100,000 from the year 1926 [53]; (b) part of the Tactical Map of Poland with scale of 1:100,000 from the year 1935 [54]; (c) Tactical Map of Poland with scale of 1:25,000 from the year 1937 [55]; (d,e) part of the Topographic Map of Poland with a scale of 1:10,000 from the year 1986 [51].
Remotesensing 13 03937 g003
Figure 4. Arrangement of the GNSS receiver-sourced measurement points on a UAV—generated orthophotomap: (a)—all measurement points; (b)—measurement points excluding the anthropogenically transformed fragments and blowout located towards the west.
Remotesensing 13 03937 g004
Figure 5. Top view of the initial image position capture from the UAV. The green line follows the position of the images in time, starting from the large red dot, and indicates the wind direction. The red line indicates the shape of the parabolic dune.
Remotesensing 13 03937 g005
Figure 6. Experimental variograms and fitted theoretical models in relief modelling for the variable used (elevation): (a) present relief; (b) primary relief. Blue crosses and lines are experimental semivariograms and theoretical Gaussian models, respectively.
Remotesensing 13 03937 g006
Figure 7. The reconstructed relief of the parabolic dune. Hypsometric map: (a) present relief; (c) primary relief; DEM with marked morphological elements of the dune: 1—dune migration/wind direction, 2—northern arm, 3—southern arm, 4—trough-like depressions, 5—crest, 6—anthropogenic pit (see also places marked in Figure 1 with the symbols A, B, and C), 7—blowout: (b) present relief, (d) primary relief.
Remotesensing 13 03937 g007
Figure 8. Stages of stretching the UAV panchromatic band (PANUAV) histogram: (a) PANUAV histogram obtained after computing the panchromatic band; (b) PANSEN histogram obtained after computing the panchromatic band (c) changing the data range for PANUAV to make the range match that of PANSEN; (d) stretching the histogram from PANUAV to PANSEN and matching them.
Remotesensing 13 03937 g008
Figure 9. Assessing vegetation condition by (a) CIR imagery and (b) MCARI1 indices. In CIR, intensity tones of red colour represent areas of better vegetation condition, the blue colour shows a lack of vegetation.
Remotesensing 13 03937 g009
Table 1. UAV flight mission parameters.
Parameter NameParameter Specification
DroneMavic 2 Pro
Date21 June 2020
Time11:54:29 AM
TypePolygon
Location50.994875°, 19.648821°
Dimensions466 m × 305 m
GSD2.34 cm/px
Overlap75%
Camera Angle90°
Altitude100 m
Images160
Path3915 m
Table 2. Parameters of theoretical semivariogram models.
Semivariogram ParametersPresent ReliefPrimary Relief
SemivariogramModelGaussianGaussian
Nugget effect0.30.07
Major Range6169.202
Partial Sill7.9989.525
Anisotropynot availablenot available
Anisotropy factor11
Search ellipseMaximum neighbors105
Minimum neighbors22
Sector type4 sectors with 45° offset4 sectors with 45° offset
Angle00
Major semiaxis6169.202
Minor semiaxis6169.202
Table 3. Cross-validation (CV) error values.
Type of ErrorsCodePresent ReliefPrimary Relief
Mean ErrorME−0.009−0.014
Root Mean Square ErrorRMSE0.5640.304
Root Mean Square Standardised ErrorRMSSE0.9991.077
Table 4. The parabolic dune parameters.
ParameterUnitPresent ReliefPrimary Relief
Area[ha]2.53.1
Perimeter[m]1044.5869.3
Volume[m3]125,145.5139,758.1
Altitude maximum[m]251.1251.2
Altitude minimum[m]240.4240.6
Table 5. Mean and standard deviation for the panchromatic band from UAV (PANUAV) and Sentinel-2A (PANSEN).
ParameterMeanStandard Deviation
PANUAV162.57326.785
PANUAV 10.0800.013
PANUAV 20.0650.022
PANSEN0.0670.023
1 Change of data value range for PANUAV; 2 Stretched UAVPAN to PANSEN.
Publisher’s Note: MDPI stays neutral with regard to jurisdictional claims in published maps and institutional affiliations.