Landscape Structure and Seasonality: Effects on Wildlife Species Richness and Occupancy in a Fragmented Dry Forest in Coastal Ecuador
Abstract
:1. Introduction
2. Materials and Methods
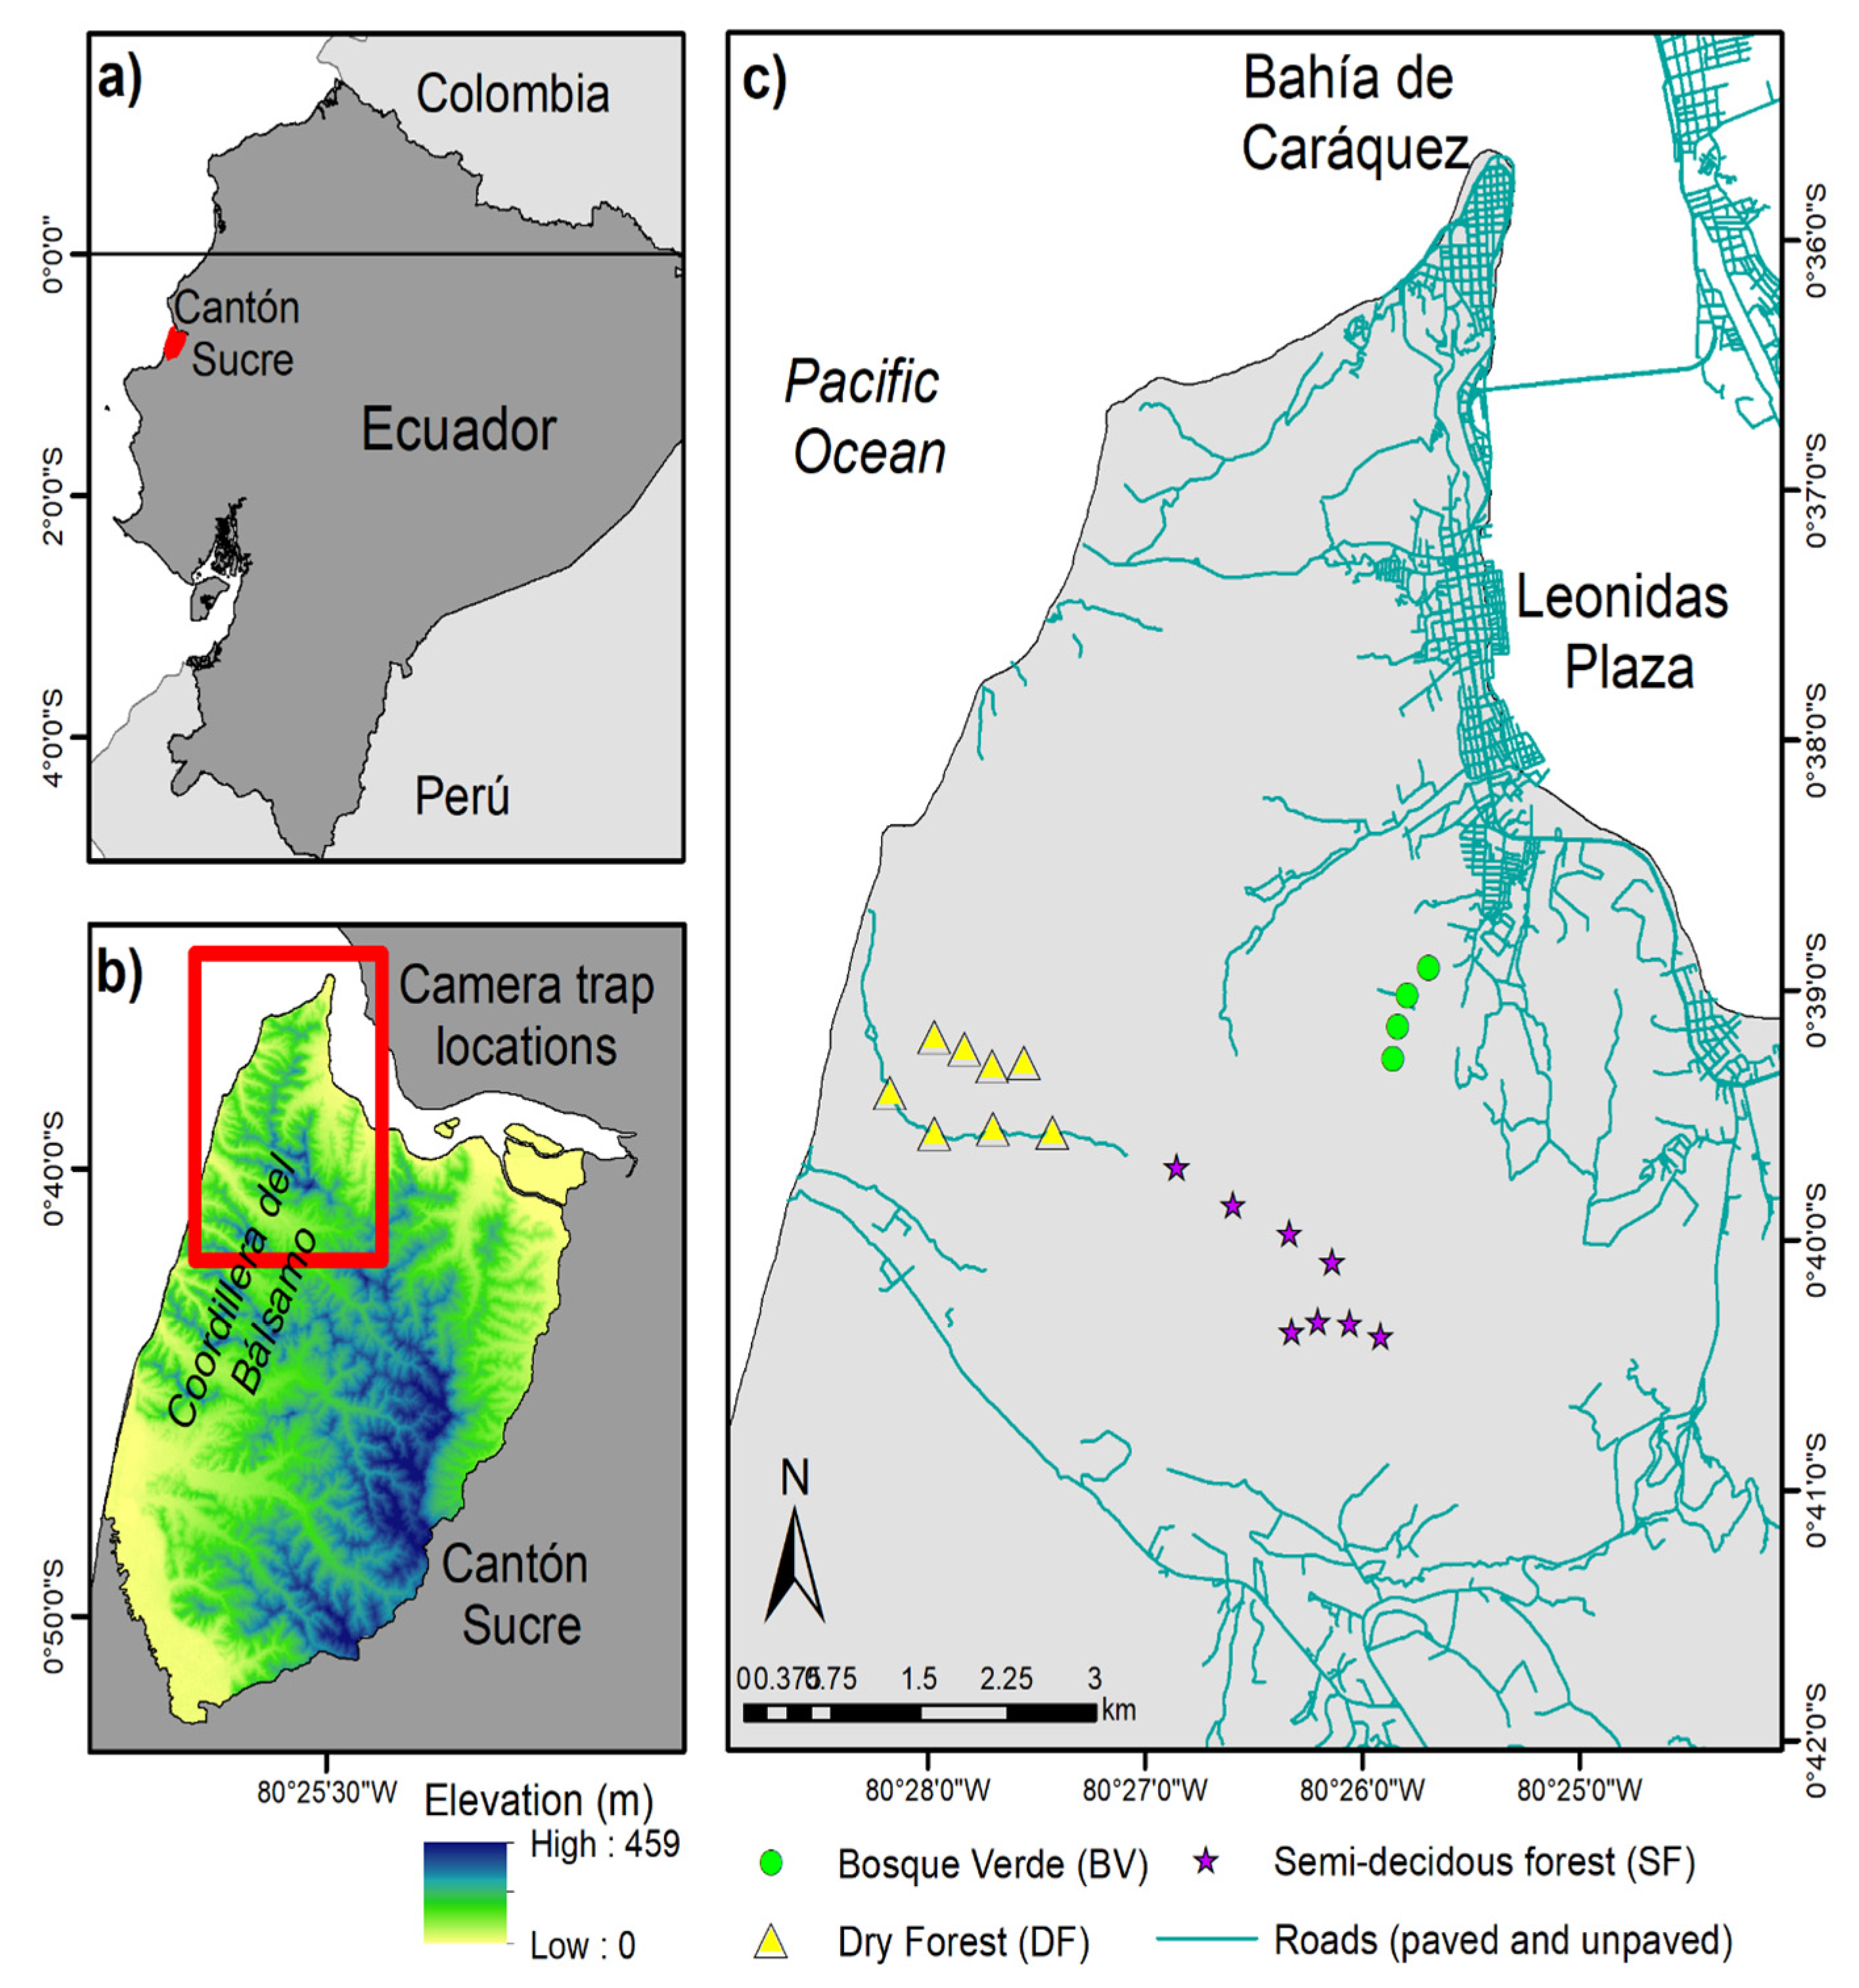
2.1. Study Area
2.2. Camera Trapping
2.3. Landscape Characteristics
2.3.1. Land-Cover
2.3.2. Forest Structure and Seasonality
2.3.3. Topography
2.4. Camera Trap Data Analysis
2.4.1. Model Predictors
2.4.2. Multispecies Occupancy Modeling
2.4.3. Analysis of Species Richness
3. Results
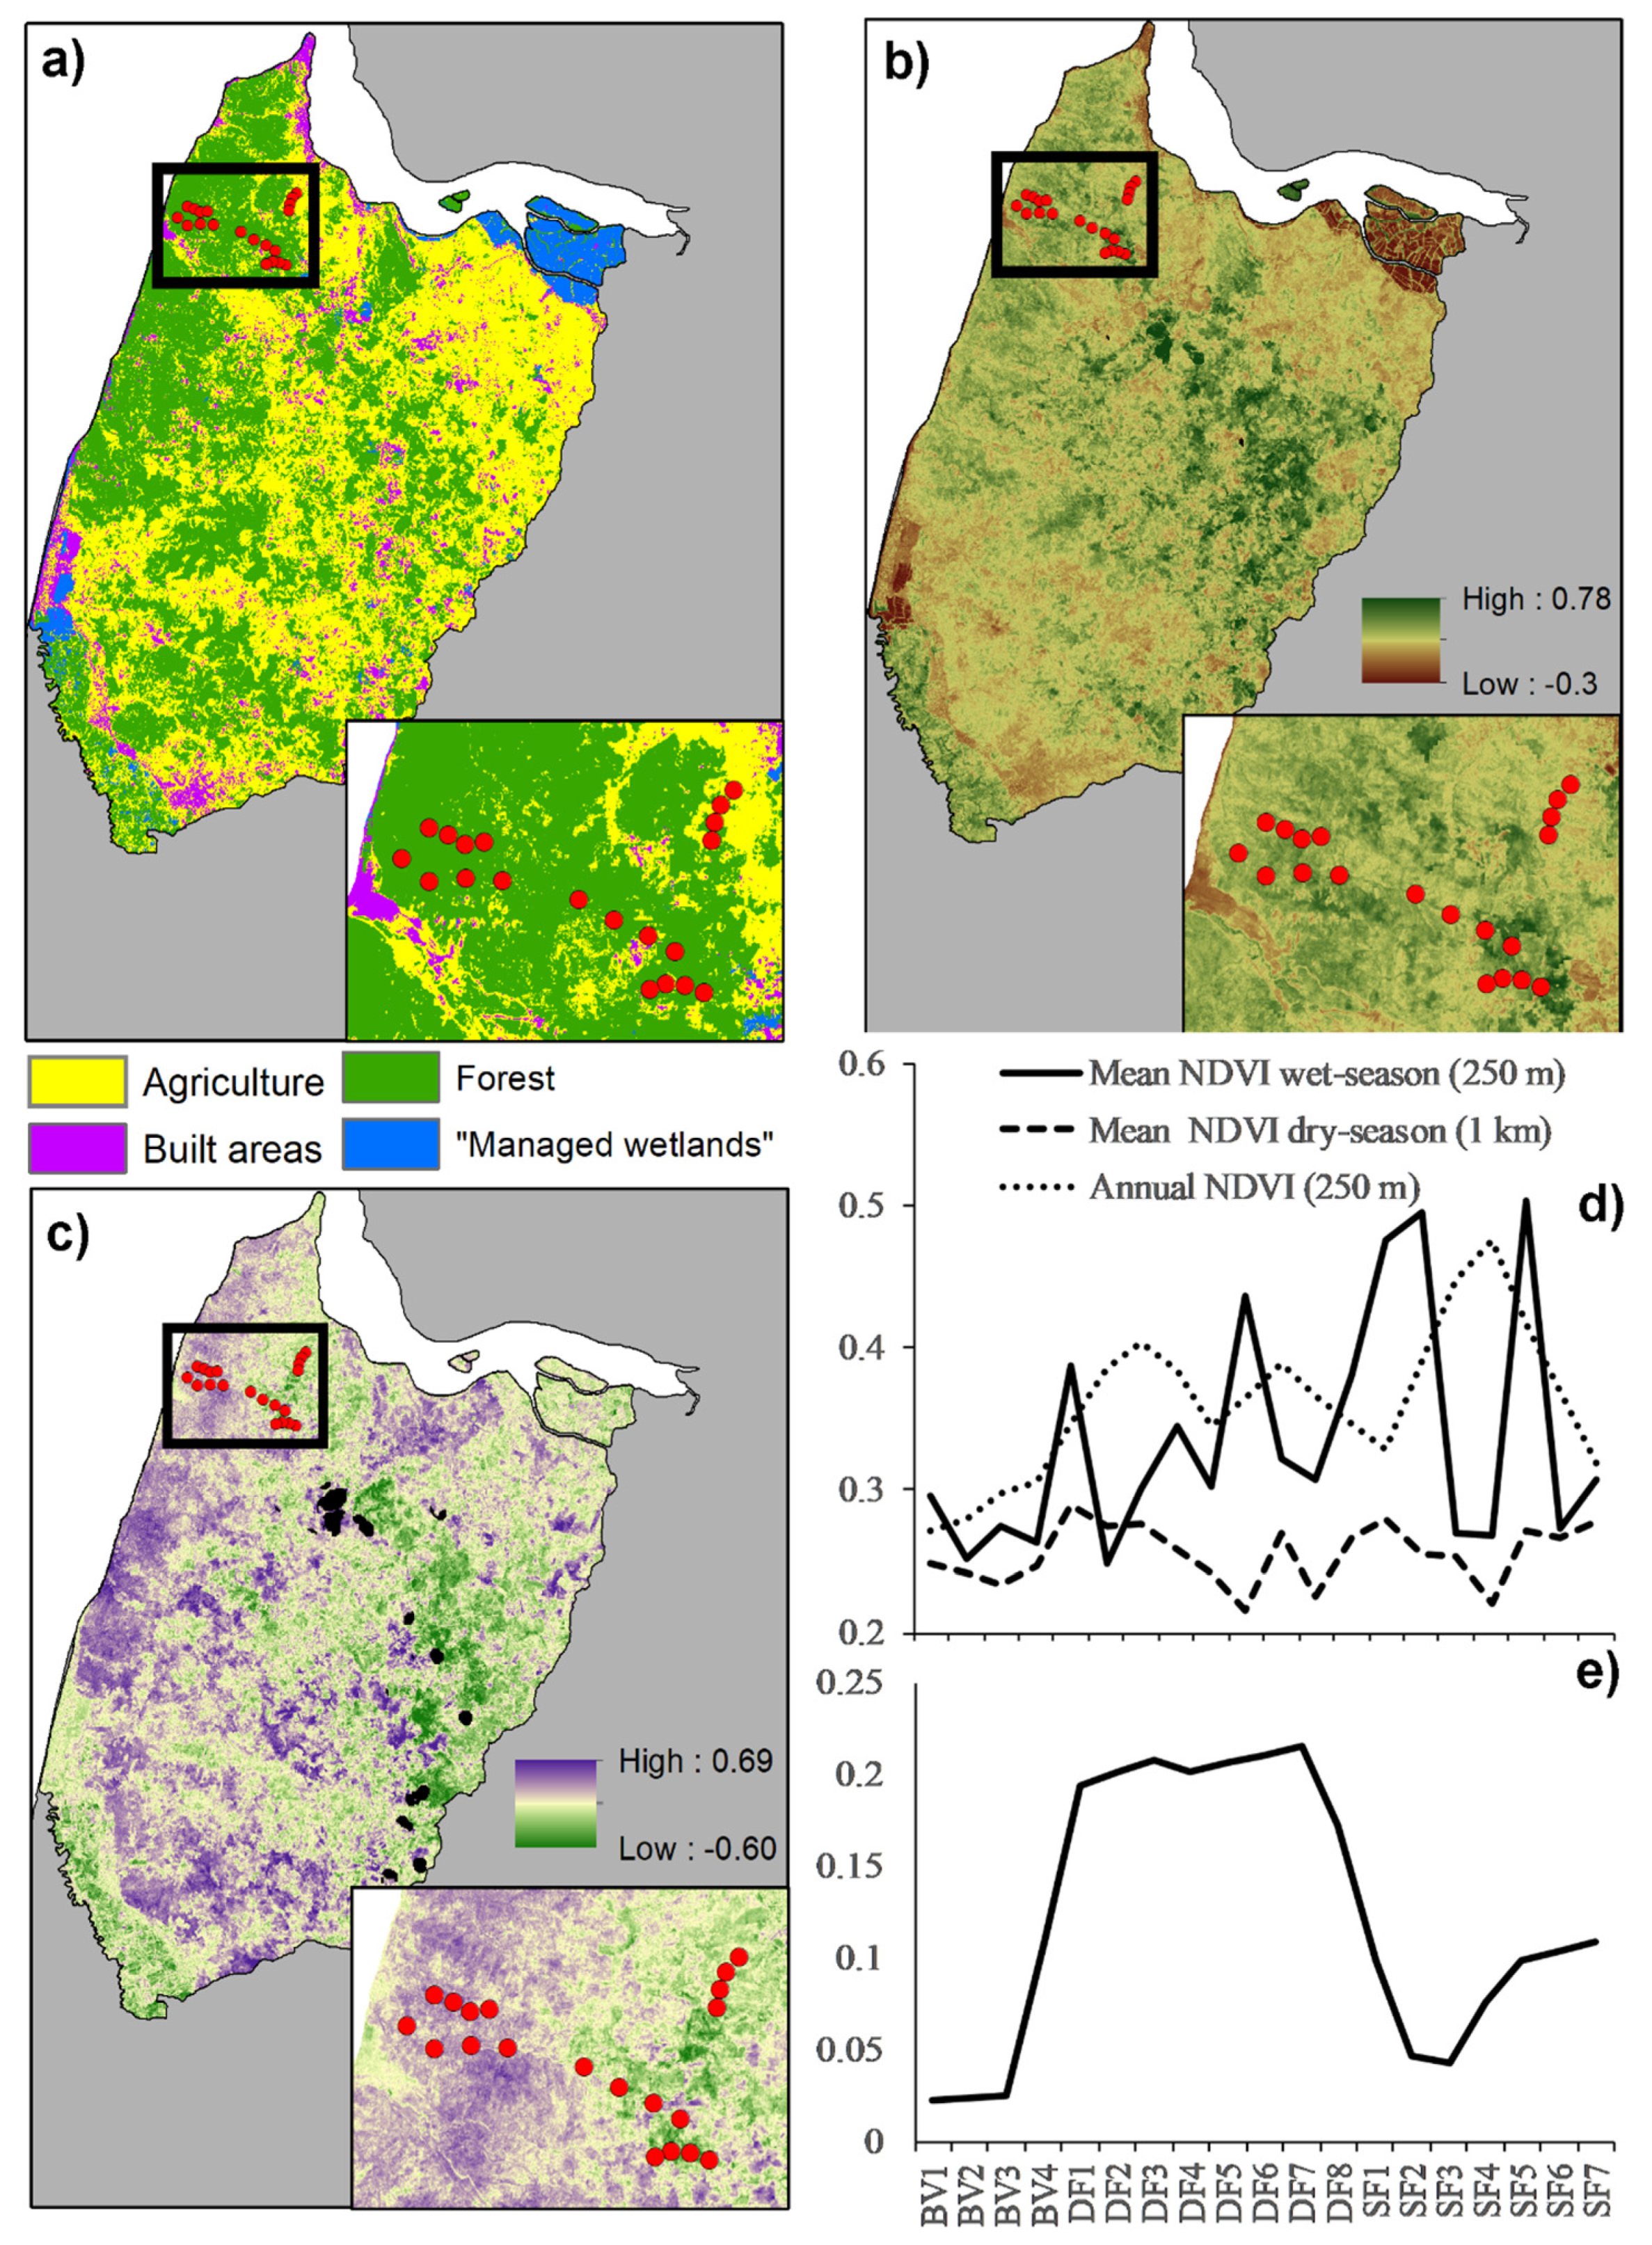
3.1. Landscape Structure and Seasonality
3.2. Wildlife Records
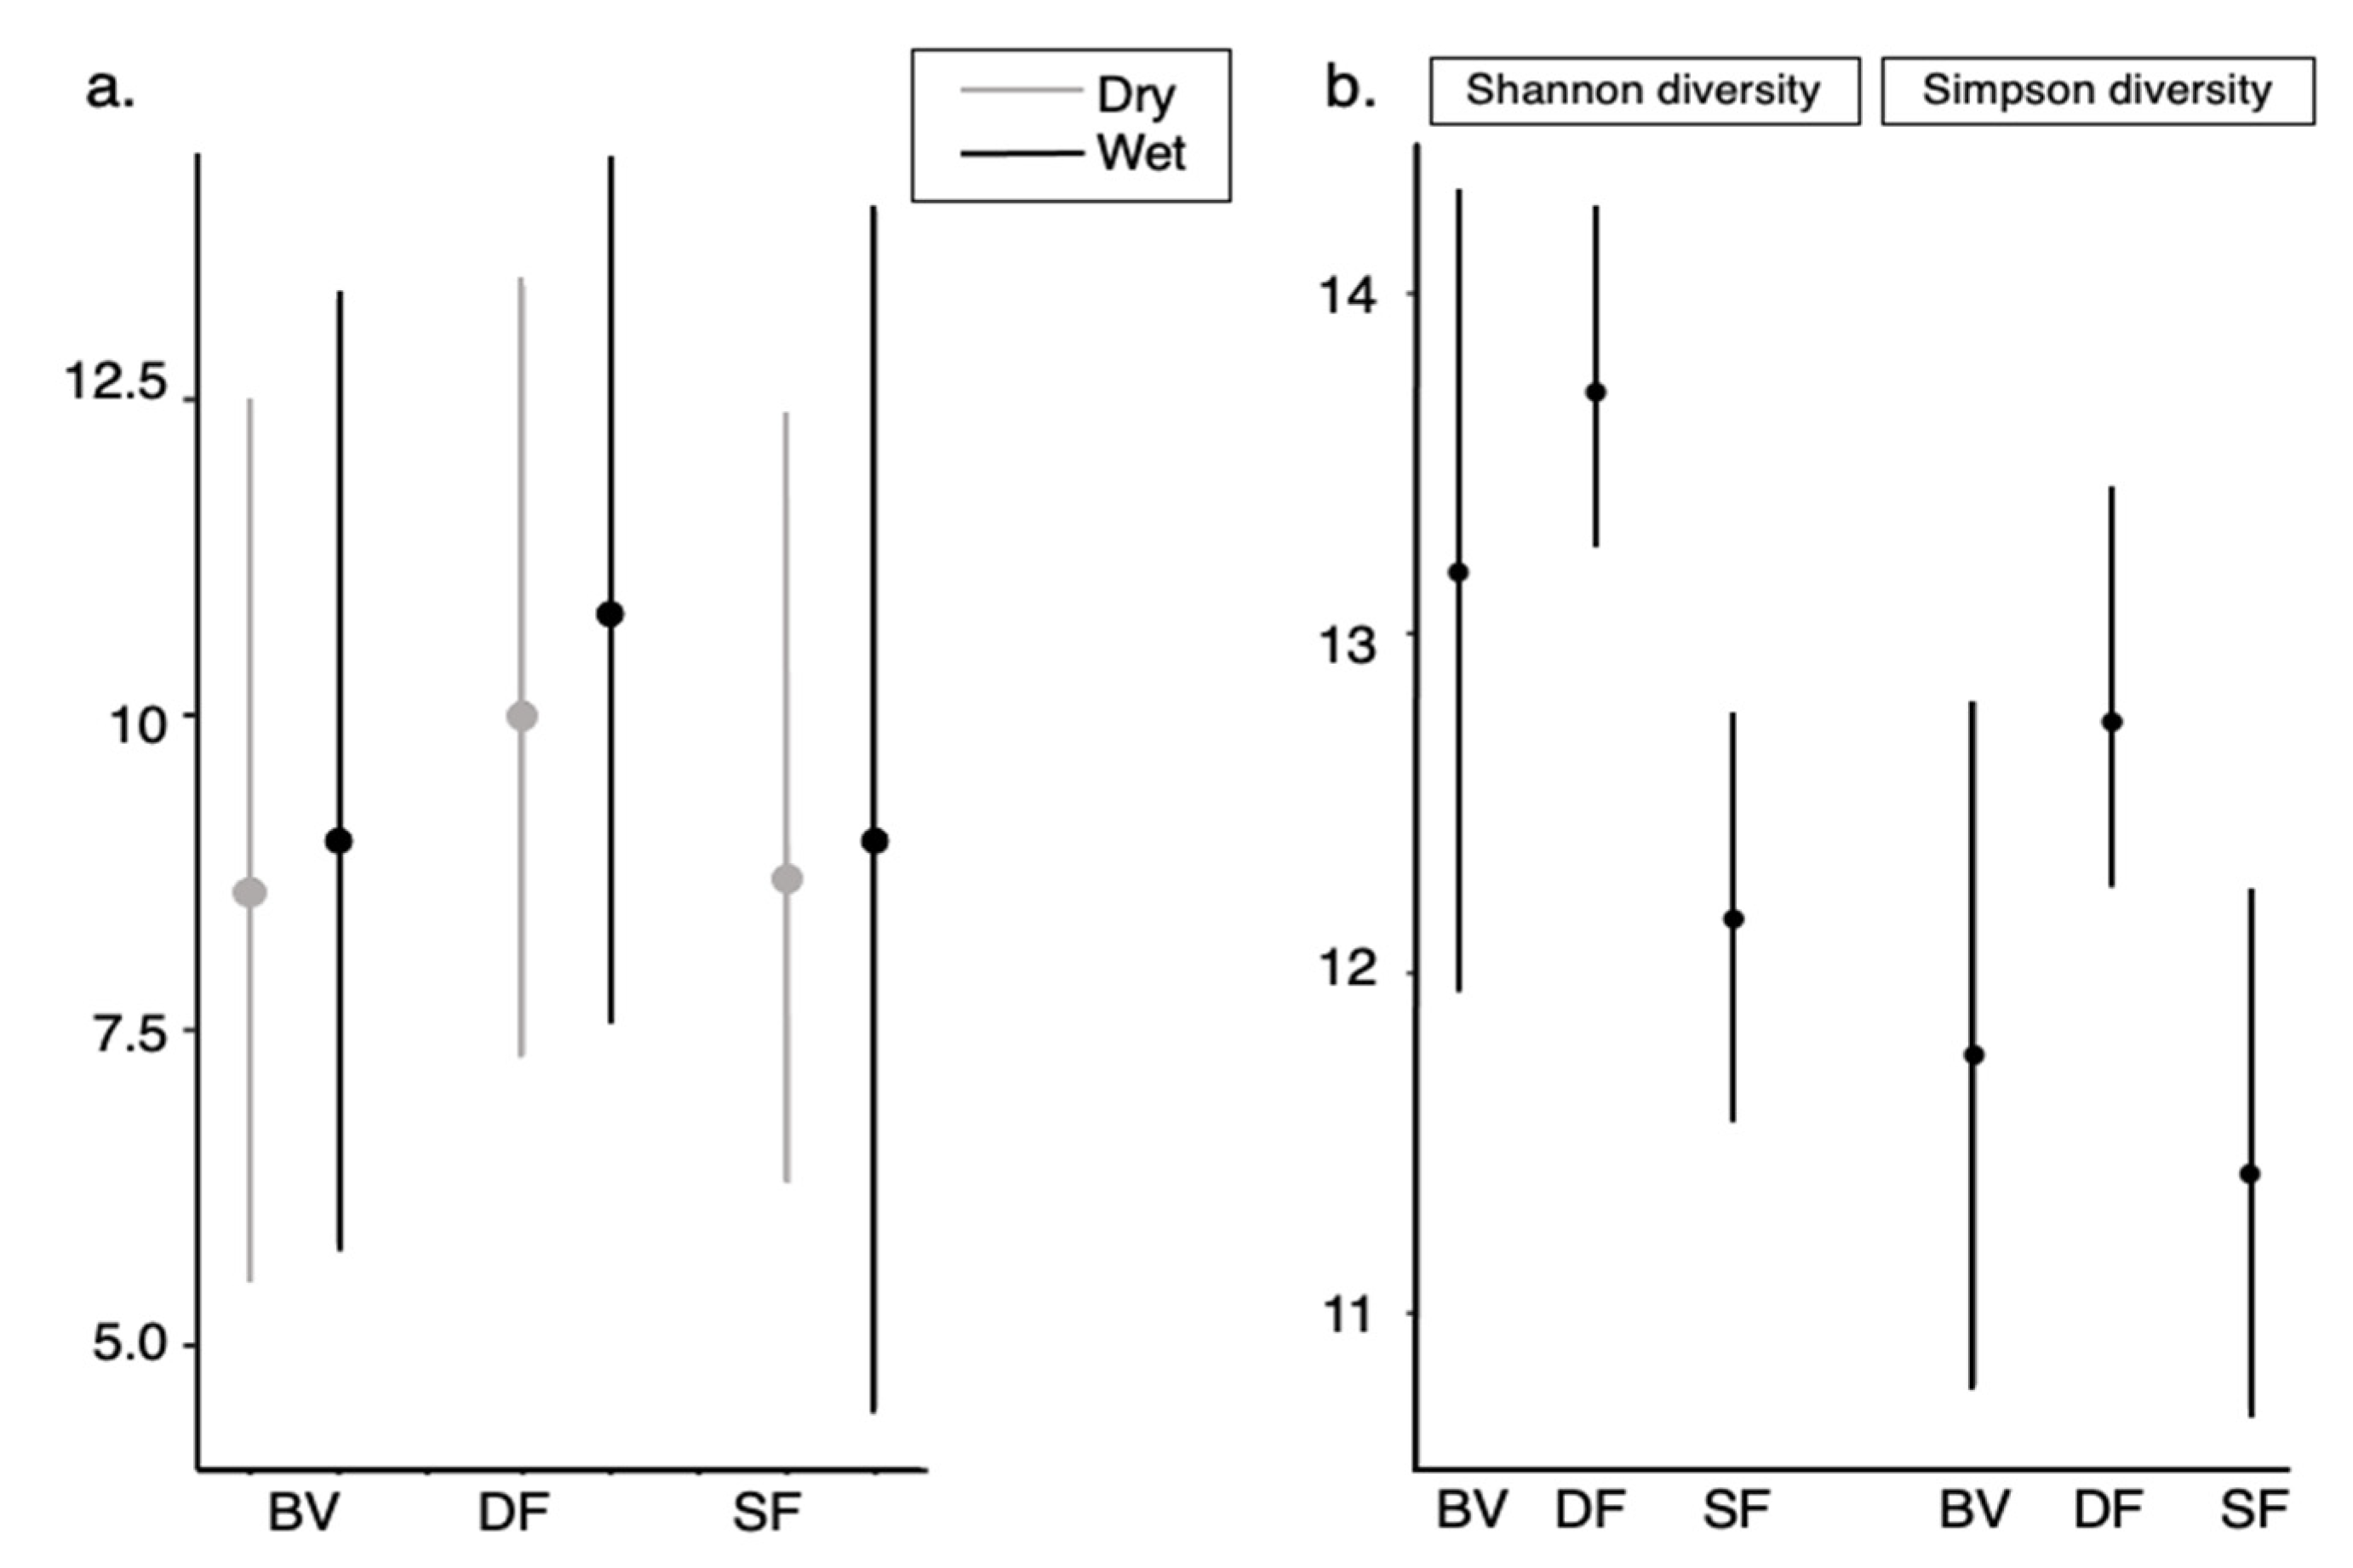
3.3. Species Occupancy and Richness
4. Discussion
5. Conclusions
Author Contributions
Funding
Institutional Review Board Statement
Informed Consent Statement
Data Availability Statement
Acknowledgments
Conflicts of Interest
Appendix A
| Variable | Description/Formula |
|---|---|
| Sentinel-2 bands | |
| Blue | B2 (490 nm) |
| Green | B3 (560 nm) |
| Red | B4 (665 nm) |
| NIR | B8 (842 nm) |
| SWIR1 | B11 (1610 nm) |
| SWIR2 | B12 (2190 nm) |
| Simple ratios | |
| NIR/Red | NIR/Red |
| SWIR 1/Red | SWIR1/Red |
| SWIR 1/NIR | SWIR1/NIR |
| SWIR 1/SWIR 2 | SWIR1/SWIR2 |
| Vegetation indices | |
| NDVI | (NIR-Red)/(NIR+Red) |
| SAVI a | ((NIR-Red)/(NIR+Red+L))(1+L) |
| Image transformations | |
| VIS123 | Blue + Green + Red |
| MID57 | SWIR1 + SWIR2 |
| TCT 1 b | K1 × Blue + K2 × Green + K3 × Red + K4 × NIR + K5 × SWIR1 + K6 × SWIR2 |
| TCT 2 b | K7 × Blue + K8 × Green + K9 × Red + K10 × NIR + K11 × SWIR1 + K12 × SWIR2 |
| TCT 3 b | K13 × Blue + K14 × Green + K15 × Red + K16 × NIR + K17 × SWIR1 + K18 × SWIR2 |
| Variable | 1 | 2 | 3 | 4 | 5 | 6 | 7 | 8 | 9 | 10 | 11 | 12 | 13 | 14 | 15 | 16 | 17 |
|---|---|---|---|---|---|---|---|---|---|---|---|---|---|---|---|---|---|
| 1. Distance to roads | 1 | 0.40 | 0.44 | −0.12 | −0.28 | 0.52 | 0.33 | −0.24 | −0.35 | −0.15 | −0.30 | 0.20 | −0.19 | 0.52 | 0.15 | 0.71 | 0.75 |
| 2. Annual NDVI (250 m) | 0.40 | 1 | 0.51 | 0.18 | −0.03 | 0.64 | 0.02 | 0.34 | 0.36 | −0.62 | 0.05 | 0.58 | −0.65 | 0.15 | 0.64 | 0.57 | 0.45 |
| 3. Mean NDVI—dry (250 m) | 0.44 | 0.51 | 1 | 0.05 | −0.35 | 0.56 | 0.17 | 0.07 | 0.03 | −0.30 | −0.22 | 0.34 | −0.37 | −0.09 | 0.38 | 0.52 | 0.18 |
| 4. Mean NDVI—wet (250 m) | −0.12 | 0.18 | 0.05 | 1 | 0.92 | 0.31 | 0.23 | 0.50 | 0.47 | −0.53 | 0.05 | 0.51 | −0.45 | −0.26 | 0.47 | 0.13 | −0.15 |
| 5. Difference wet and dry NDVI (250 m) | −0.28 | −0.03 | −0.35 | 0.92 | 1 | 0.07 | 0.15 | 0.44 | 0.43 | −0.37 | 0.13 | 0.35 | −0.28 | −0.21 | 0.29 | −0.09 | −0.21 |
| 6. Annual NDVI (1 km) | 0.52 | 0.64 | 0.56 | 0.31 | 0.07 | 1 | 0.68 | 0.60 | 0.45 | −0.74 | −0.46 | 0.83 | −0.69 | 0.18 | 0.67 | 0.77 | 0.48 |
| 7. Mean NDVI—dry (1 km) | 0.33 | 0.02 | 0.17 | 0.23 | 0.15 | 0.68 | 1 | 0.37 | 0.12 | −0.34 | −0.71 | 0.51 | −0.28 | 0.21 | 0.26 | 0.60 | 0.25 |
| 8. Mean NDVI—wet (1 km) | −0.24 | 0.34 | 0.07 | 0.50 | 0.44 | 0.60 | 0.37 | 1 | 0.97 | −0.85 | −0.02 | 0.86 | −0.75 | −0.19 | 0.75 | 0.17 | −0.01 |
| 9. Difference wet and dry NDVI (1 km) | −0.35 | 0.36 | 0.03 | 0.47 | 0.43 | 0.45 | 0.12 | 0.97 | 1 | −0.82 | 0.17 | 0.78 | −0.72 | −0.26 | 0.73 | 0.02 | −0.08 |
| 10. Percent Agriculture (1 km) | −0.15 | −0.62 | −0.30 | −0.53 | −0.37 | −0.74 | −0.34 | −0.85 | −0.82 | 1 | −0.10 | −0.98 | 0.94 | −0.03 | −0.93 | −0.52 | −0.31 |
| 11. Percent Built (1 km) | −0.30 | 0.05 | −0.22 | 0.05 | 0.13 | −0.46 | −0.71 | −0.02 | 0.17 | −0.10 | 1 | −0.12 | −0.15 | −0.06 | 0.15 | −0.24 | −0.13 |
| 12. Percent Forest (1 km) | 0.20 | 0.58 | 0.34 | 0.51 | 0.35 | 0.83 | 0.51 | 0.86 | 0.78 | −0.98 | −0.12 | 1 | −0.90 | 0.04 | 0.89 | 0.57 | 0.33 |
| 13. Percent Agriculture (250 m) | −0.19 | −0.65 | −0.37 | −0.45 | −0.28 | −0.69 | −0.28 | −0.75 | −0.72 | 0.94 | −0.15 | −0.90 | 1 | 0.09 | −1.00 | −0.59 | −0.38 |
| 14. Percent Built (250 m) | 0.52 | 0.15 | −0.09 | −0.26 | −0.21 | 0.18 | 0.21 | −0.19 | −0.26 | −0.03 | −0.06 | 0.04 | 0.09 | 1 | −0.15 | 0.40 | 0.46 |
| 15. Percent Forest (250 m) | 0.15 | 0.64 | 0.38 | 0.47 | 0.29 | 0.67 | 0.26 | 0.75 | 0.73 | −0.93 | 0.15 | 0.89 | −1.00 | −0.15 | 1 | 0.56 | 0.35 |
| 16. Mean Slope (1 km) | 0.71 | 0.57 | 0.52 | 0.13 | −0.09 | 0.77 | 0.60 | 0.17 | 0.02 | −0.52 | −0.24 | 0.57 | −0.59 | 0.40 | 0.56 | 1 | 0.66 |
| 17. Mean Slope (250 m) | 0.75 | 0.45 | 0.18 | −0.15 | −0.21 | 0.48 | 0.25 | −0.01 | −0.08 | −0.31 | −0.13 | 0.33 | −0.38 | 0.46 | 0.35 | 0.66 | 1 |
| Reference Data | ||||||
|---|---|---|---|---|---|---|
| Agriculture | Built | Forest | M. Wetland | TOTAL | User. Acc. | |
| Agriculture | 44 | 2 | 11 | 0 | 57 | 77.19 |
| Built | 3 | 23 | 0 | 0 | 26 | 88.46 |
| Forest | 8 | 2 | 51 | 0 | 61 | 83.61 |
| M. Wetland | 1 | 1 | 1 | 20 | 23 | 86.96 |
| TOTAL | 56 | 28 | 63 | 20 | 167 | |
| Prod. Acc. | 78.57 | 82.14 | 80.95 | 100.00 | ||
| Overall Accuracy: 0.826 | ||||||
| Kappa: 0.753 | ||||||
References
- Daskalova, G.N.; Myers-Smith, I.H.; Bjorkman, A.D.; Blowes, S.A.; Supp, S.R.; Magurran, A.E.; Dornelas, M. Landscape-Scale Forest Loss as a Catalyst of Population and Biodiversity Change. Science 2020, 368, 1341–1347. [Google Scholar] [CrossRef] [PubMed]
- Intergovernmental Science-Policy Platform on Biodiversity and Ecosystem Services. IPBES Summary for Policymakers of the Global Assessment Report on Biodiversity and Ecosystem Services; Zenodo: Geneva, Switzerland, 2019. [Google Scholar]
- Newbold, T.; Hudson, L.N.; Hill, S.L.L.; Contu, S.; Lysenko, I.; Senior, R.A.; Börger, L.; Bennett, D.J.; Choimes, A.; Collen, B.; et al. Global Effects of Land Use on Local Terrestrial Biodiversity. Nature 2015, 520, 45–50. [Google Scholar] [CrossRef] [PubMed] [Green Version]
- Janzen, D.H. Management of Habitat Fragments in a Tropical Dry Forest: Growth. Ann. Mo. Bot. Gard. 1988, 75, 105. [Google Scholar] [CrossRef]
- Miles, L.; Newton, A.C.; DeFries, R.S.; Ravilious, C.; May, I.; Blyth, S.; Kapos, V.; Gordon, J.E. A Global Overview of the Conservation Status of Tropical Dry Forests. J. Biogeogr. 2006, 33, 491–505. [Google Scholar] [CrossRef]
- Portillo-Quintero, C.A.; Sánchez-Azofeifa, G.A. Extent and Conservation of Tropical Dry Forests in the Americas. Biol. Conserv. 2010, 143, 144–155. [Google Scholar] [CrossRef]
- Rivas, C.A.; Navarro-Cerillo, R.M.; Johnston, J.C.; Guerrero-Casado, J. Dry Forest Is More Threatened but Less Protected than Evergreen Forest in Ecuador’s Coastal Region. Environ. Conserv. 2020, 47, 79–83. [Google Scholar] [CrossRef]
- Dirzo, R.; Young, H.S.; Galetti, M.; Ceballos, G.; Isaac, N.J.B.; Collen, B. Defaunation in the Anthropocene. Science 2014, 345, 401–406. [Google Scholar] [CrossRef]
- Daily, G.C.; Ceballos, G.; Pacheco, J.; Suzán, G.; Sánchez-Azofeifa, A. Countryside Biogeography of Neotropical Mammals: Conservation Opportunities in Agricultural Landscapes of Costa Rica. Conserv. Biol. 2003, 17, 1814–1826. [Google Scholar] [CrossRef]
- Laurance, W.F.; Vasconcelos, H.L.; Lovejoy, T.E. Forest Loss and Fragmentation in the Amazon: Implications for Wildlife Conservation. Oryx 2000, 34, 39–45. [Google Scholar] [CrossRef]
- Lino, A.; Fonseca, C.; Rojas, D.; Fischer, E.; Ramos Pereira, M.J. A Meta-Analysis of the Effects of Habitat Loss and Fragmentation on Genetic Diversity in Mammals. Mamm. Biol. 2019, 94, 69–76. [Google Scholar] [CrossRef]
- Cuaron, A.D. A Global Perspective on Habitat Disturbance and Tropical Rainforest Mammals. Conserv. Biol. 2000, 14, 1574–1579. [Google Scholar]
- Cuarón, A.D. Effects of Land-Cover Changes on Mammals in a Neotropical Region: A Modeling Approach. Conserv. Biol. 2000, 14, 1676–1692. [Google Scholar] [CrossRef]
- Sierra, R. Patrones y Factores de Deforestación en el Ecuador Continental, 1990′2010. Y un Acercamiento a Los Próximos 10 Años; Conservation International Ecuador & Forest Trends: Quito, Ecuador, 2013; p. 44. [Google Scholar]
- Dodson, C.H.; Gentry, A.H. Biological Extinction in Western Ecuador. Ann. Mo. Bot. Gard. 1991, 78, 273. [Google Scholar] [CrossRef]
- Cervera, L.; Lizcano, D.J.; Parés-Jiménez, V.; Espinoza, S.; Poaquiza, D.; De la Montaña, E.; Griffith, D.M. A Camera Trap Assessment of Terrestrial Mammals in Machalilla National Park, Western Ecuador. Check List 2016, 12, 1868. [Google Scholar] [CrossRef]
- Lizcano, D.J.; Cervera, L.; Espinoza-Moreira, S.; Poaquiza-Alava, D.; Parés-Jiménez, V.; Ramírez-Barajas, P.J. Medium and large mammal richness from the marine and coastal wildlife refuge of Pacoche, Ecuador. Therya 2016, 7, 135–145. [Google Scholar] [CrossRef]
- Escribano-Avila, G.; Cervera, L.; Ordóñez-Delgado, L.; Jara-Guerrero, A.; Amador, L.; Paladines, B.; Briceño, J.; Parés-Jiménez, V.; Lizcano, D.J.; Duncan, D.H.; et al. Biodiversity Patterns and Ecological Processes in Neotropical Dry Forest: The Need to Connect Research and Management for Long-Term Conservation. Neotrop. Biodivers. 2017, 3, 107–116. [Google Scholar] [CrossRef] [Green Version]
- Espinosa, C.I.; De La Cruz, M.; Luzuriaga, A.L.; Escudero, A. Bosques tropicales secos de la región Pacífico Ecuatorial: Diversidad, estructura, funcionamiento e implicaciones para la conservación. Ecosistemas 2012, 21, 167–179. [Google Scholar]
- Gómez-Ruiz, D.A.; Sánchez-Giraldo, C.; Parra, J.L.; Solari, S. Understanding the Ecology of Medium-Sized Carnivores (Mammalia: Carnivora) from a Tropical Dry Forest in Colombian Caribbean. Bcnaturais 2020, 15, 701–716. [Google Scholar] [CrossRef]
- Solórzano, C.B.; Intriago-Alcívar, L.; Guerrero-Casado, J. Comparison between Terrestrial Mammals in Evergreen Forests and in Seasonal Dry Forests in Western Ecuador: Should Efforts Be Focused on Dry Forests? Mammalia 2021, 85, 306–314. [Google Scholar] [CrossRef]
- Pineda-Cendales, S.; Hernández-Rolong, E.; Carvajal-Cogollo, J.E. Medium and Large-Sized Mammals in Dry Forests of the Colombian Caribbean. Univ. Sci. 2020, 25, 27. [Google Scholar]
- Stoner, K.E.; Timm, R.M. Seasonally Dry Tropical Forest Mammals: Adaptations and Seasonal Patterns. In Seasonally Dry Tropical Forests: Ecology and Conservation; Dirzo, R., Young, H.S., Mooney, H.A., Ceballos, G., Eds.; Island Press/Center for Resource Economics: Washington, DC, USA, 2011; pp. 85–106. ISBN 978-1-61091-021-7. [Google Scholar]
- O’Connell, A.F.; Talancy, N.W.; Bailey, L.L.; Sauer, J.R.; Cook, R.; Gilbert, A.T. Estimating Site Occupancy and Detection Probability Parameters for Meso- And Large Mammals in a Coastal Ecosystem. J. Wildl. Manag. 2006, 70, 1625–1633. [Google Scholar] [CrossRef]
- Tobler, M.W.; Zúñiga Hartley, A.; Carrillo-Percastegui, S.E.; Powell, G.V.N. Spatiotemporal Hierarchical Modelling of Species Richness and Occupancy Using Camera Trap Data. J. Appl. Ecol. 2015, 52, 413–421. [Google Scholar] [CrossRef]
- Rovero, F.; Martin, E.; Rosa, M.; Ahumada, J.A.; Spitale, D. Estimating Species Richness and Modelling Habitat Preferences of Tropical Forest Mammals from Camera Trap Data. PLoS ONE 2014, 9, e103300. [Google Scholar] [CrossRef]
- Dorazio, R.M.; Royle, J.A. Estimating Size and Composition of Biological Communities by Modeling the Occurrence of Species. J. Am. Stat. Assoc. 2005, 100, 389–398. [Google Scholar] [CrossRef]
- Kéry, M.; Schaub, M. Bayesian Population Analysis Using WinBUGS: A Hierarchical Perspective, 1st ed.; Academic Press: Boston, MA, USA, 2012; ISBN 978-0-12-387020-9. [Google Scholar]
- Dorazio, R.M.; Royle, J.A.; Söderström, B.; Glimskär, A. Estimating Species Richness and Accumulation by Modeling Species Occurrence and Detectability. Ecology 2006, 87, 842–854. [Google Scholar] [CrossRef] [Green Version]
- Semper-Pascual, A.; Decarre, J.; Baumann, M.; Camino, M.; Di Blanco, Y.; Gómez-Valencia, B.; Kuemmerle, T. Using Occupancy Models to Assess the Direct and Indirect Impacts of Agricultural Expansion on Species’ Populations. Biodivers. Conserv. 2020, 29, 3669–3688. [Google Scholar] [CrossRef]
- McDermid, G.J.; Hall, R.J.; Sanchez-Azofeifa, G.A.; Franklin, S.E.; Stenhouse, G.B.; Kobliuk, T.; LeDrew, E.F. Remote Sensing and Forest Inventory for Wildlife Habitat Assessment. For. Ecol. Manag. 2009, 257, 2262–2269. [Google Scholar] [CrossRef]
- Pettorelli, N.; Ryan, S.; Mueller, T.; Bunnefeld, N.; Jedrzejewska, B.; Lima, M.; Kausrud, K. The Normalized Difference Vegetation Index (NDVI): Unforeseen Successes in Animal Ecology. Clim. Res. 2011, 46, 15–27. [Google Scholar] [CrossRef]
- Stephenson, P. Integrating Remote Sensing into Wildlife Monitoring for Conservation. Environ. Conserv. 2019, 46, 181–183. [Google Scholar] [CrossRef]
- Raab, C.; Riesch, F.; Tonn, B.; Barrett, B.; Meißner, M.; Balkenhol, N.; Isselstein, J. Target-oriented Habitat and Wildlife Management: Estimating Forage Quantity and Quality of Semi-natural Grasslands with Sentinel-1 and Sentinel-2 Data. Remote Sens. Ecol. Conserv. 2020, 6, 381–398. [Google Scholar] [CrossRef]
- Haro-Carrión, X.; Southworth, J. Understanding Land Cover Change in a Fragmented Forest Landscape in a Biodiversity Hotspot of Coastal Ecuador. Remote Sens. 2018, 10, 1980. [Google Scholar] [CrossRef] [Green Version]
- Cedeño Reinoso, J.E.C. Creación de la Ruta Ancestra Turística en la Coordillera del Bálsamo en el Cantón Sucre, Provincia de Manabí, Universidad Laica Eloy Alfaro de Manabí: Bahía de Caráquez. Ph.D. Thesis, Bahía de Caráquez, Manabí, Ecuador, 1 February 2019. [Google Scholar]
- Myers, N.; Mittermeier, R.A.; Mittermeier, C.G.; Da Fonseca, G.A.; Kent, J. Biodiversity Hotspots for Conservation Priorities. Nature 2000, 403, 853. [Google Scholar] [CrossRef]
- Diego, T. A Field Guide to the Mammals of Ecuador: Including the Galapagos Islands and the Ecuadorian Antarctic Zone; Asociación Ecuatoriana de Mastozoología: Quito, Ecuador, 2017; ISBN 978-9942-28-674-1. [Google Scholar]
- Tirira, D. Mamíferos Del Ecuador: Lista Actualizada de Especies/Mammals of Ecuador: Updated Species Check List. Version 2016, 2016. [Google Scholar] [CrossRef]
- Tirira, D. Libro Rojo de Los Mamíferos Del Ecuador, 2nd ed.; Fundación Mamíferos y Conservación: Quito, Ecuador, 2011. [Google Scholar]
- Breiman, L. Random Forests. Mach. Learn. 2001, 45, 5–32. [Google Scholar] [CrossRef] [Green Version]
- Fagan, M.; DeFries, R.; Sesnie, S.; Arroyo-Mora, J.; Soto, C.; Singh, A.; Townsend, P.; Chazdon, R. Mapping Species Composition of Forests and Tree Plantations in Northeastern Costa Rica with an Integration of Hyperspectral and Multitemporal Landsat Imagery. Remote Sens. 2015, 7, 5660. [Google Scholar] [CrossRef] [Green Version]
- Sesnie, S.E.; Finegan, B.; Gessler, P.E.; Thessler, S.; Ramos Bendana, Z.; Smith, A.M.S. The Multispectral Separability of Costa Rican Rainforest Types with Support Vector Machines and Random Forest Decision Trees. Int. J. Remote Sens. 2010, 31, 2885–2909. [Google Scholar] [CrossRef]
- Farr, T.G.; Rosen, P.A.; Caro, E.; Crippen, R.; Duren, R.; Hensley, S.; Kobrick, M.; Paller, M.; Rodriguez, E.; Roth, L.; et al. The Shuttle Radar Topography Mission. Rev. Geophys. 2007, 45, RG2004. [Google Scholar] [CrossRef] [Green Version]
- Estevo, C.A.; Nagy-Reis, M.B.; Nichols, J.D. When Habitat Matters: Habitat Preferences Can Modulate Co-Occurrence Patterns of Similar Sympatric Species. PLoS ONE 2017, 12, e0179489. [Google Scholar] [CrossRef] [Green Version]
- Thornton, D.H.; Branch, L.C.; Sunquist, M.E. The Relative Influence of Habitat Loss and Fragmentation: Do Tropical Mammals Meet the Temperate Paradigm? Ecol. Appl. 2011, 21, 2324–2333. [Google Scholar] [CrossRef] [Green Version]
- Zipkin, E.F.; DeWan, A.; Royle, J.A. Impacts of Forest Fragmentation on Species Richness: A Hierarchical Approach to Community Modelling. J. Appl. Ecol. 2009, 46, 815–822. [Google Scholar] [CrossRef]
- Plummer, M. JAGS: A Program for Analysis of Bayesian Graphical Models Using Gibbs Sampling. In Proceedings of the 3rd International Workshop on Distributed Statistical Computing (DSC 2003), Vienna, Austria, 20–22 March 2003. [Google Scholar]
- Brooks, S.; Gelman, A. General Methods for Monitoring Convergence of Iterative Simulations. J. Comput. Graphi. Stat. 1998, 7, 434–455. [Google Scholar] [CrossRef] [Green Version]
- Hsieh, T.C.; Ma, K.H.; Chao, A. INEXT: An R Package for Rarefaction and Extrapolation of Species Diversity (H Ill Numbers). Methods Ecol. Evol. 2016, 7, 1451–1456. [Google Scholar] [CrossRef]
- IUCN The IUCN Red List of Threatened Species. Available online: https://www.iucnredlist.org/en (accessed on 8 July 2021).
- Ruedas, L.A.; Silva, S.M.; French, J.H.; Platt, R.N.; Salazar-Bravo, J.; Mora, J.M.; Thompson, C.W. Taxonomy of the Sylvilagus Brasiliensis Complex in Central and South America (Lagomorpha: Leporidae). J. Mammal. 2019, 100, 1599–1630. [Google Scholar] [CrossRef]
- Vallejo, A.F. Procyon cancrivorus. In Mamíferos del Ecuador; Brito, J., Camacho, M.A., Romero, V., Vallejo, A.F., Eds.; Museo de Zoología, Pontificia Universidad Católica del Ecuador: Quito, Ecuador, 2018. [Google Scholar]
- Guerrero-Casado, J.; Cedeño, R.I.; Johnston, J.C.; Gunther, M.S. New Records of the Critically Endangered Ecuadorian White-Fronted Capuchin (Cebus Aequatorialis) Detected by Remote Cameras. Primates 2020, 61, 175–179. [Google Scholar] [CrossRef]
- Box, E.O.; Holben, B.N.; Kalb, V. Accuracy of the AVHRR Vegetation Index as a Predictor of Biomass, Primary Productivity and Net CO2 Flux. Vegetatio 1989, 80, 71–89. [Google Scholar] [CrossRef]
- Nedkov, R. Orthogonal Transformation of Segmented Images from the Satellite Sentinel-2. Comptes Rendus L’académie Bulg. Sci. 2017, 70, 637–692. [Google Scholar]
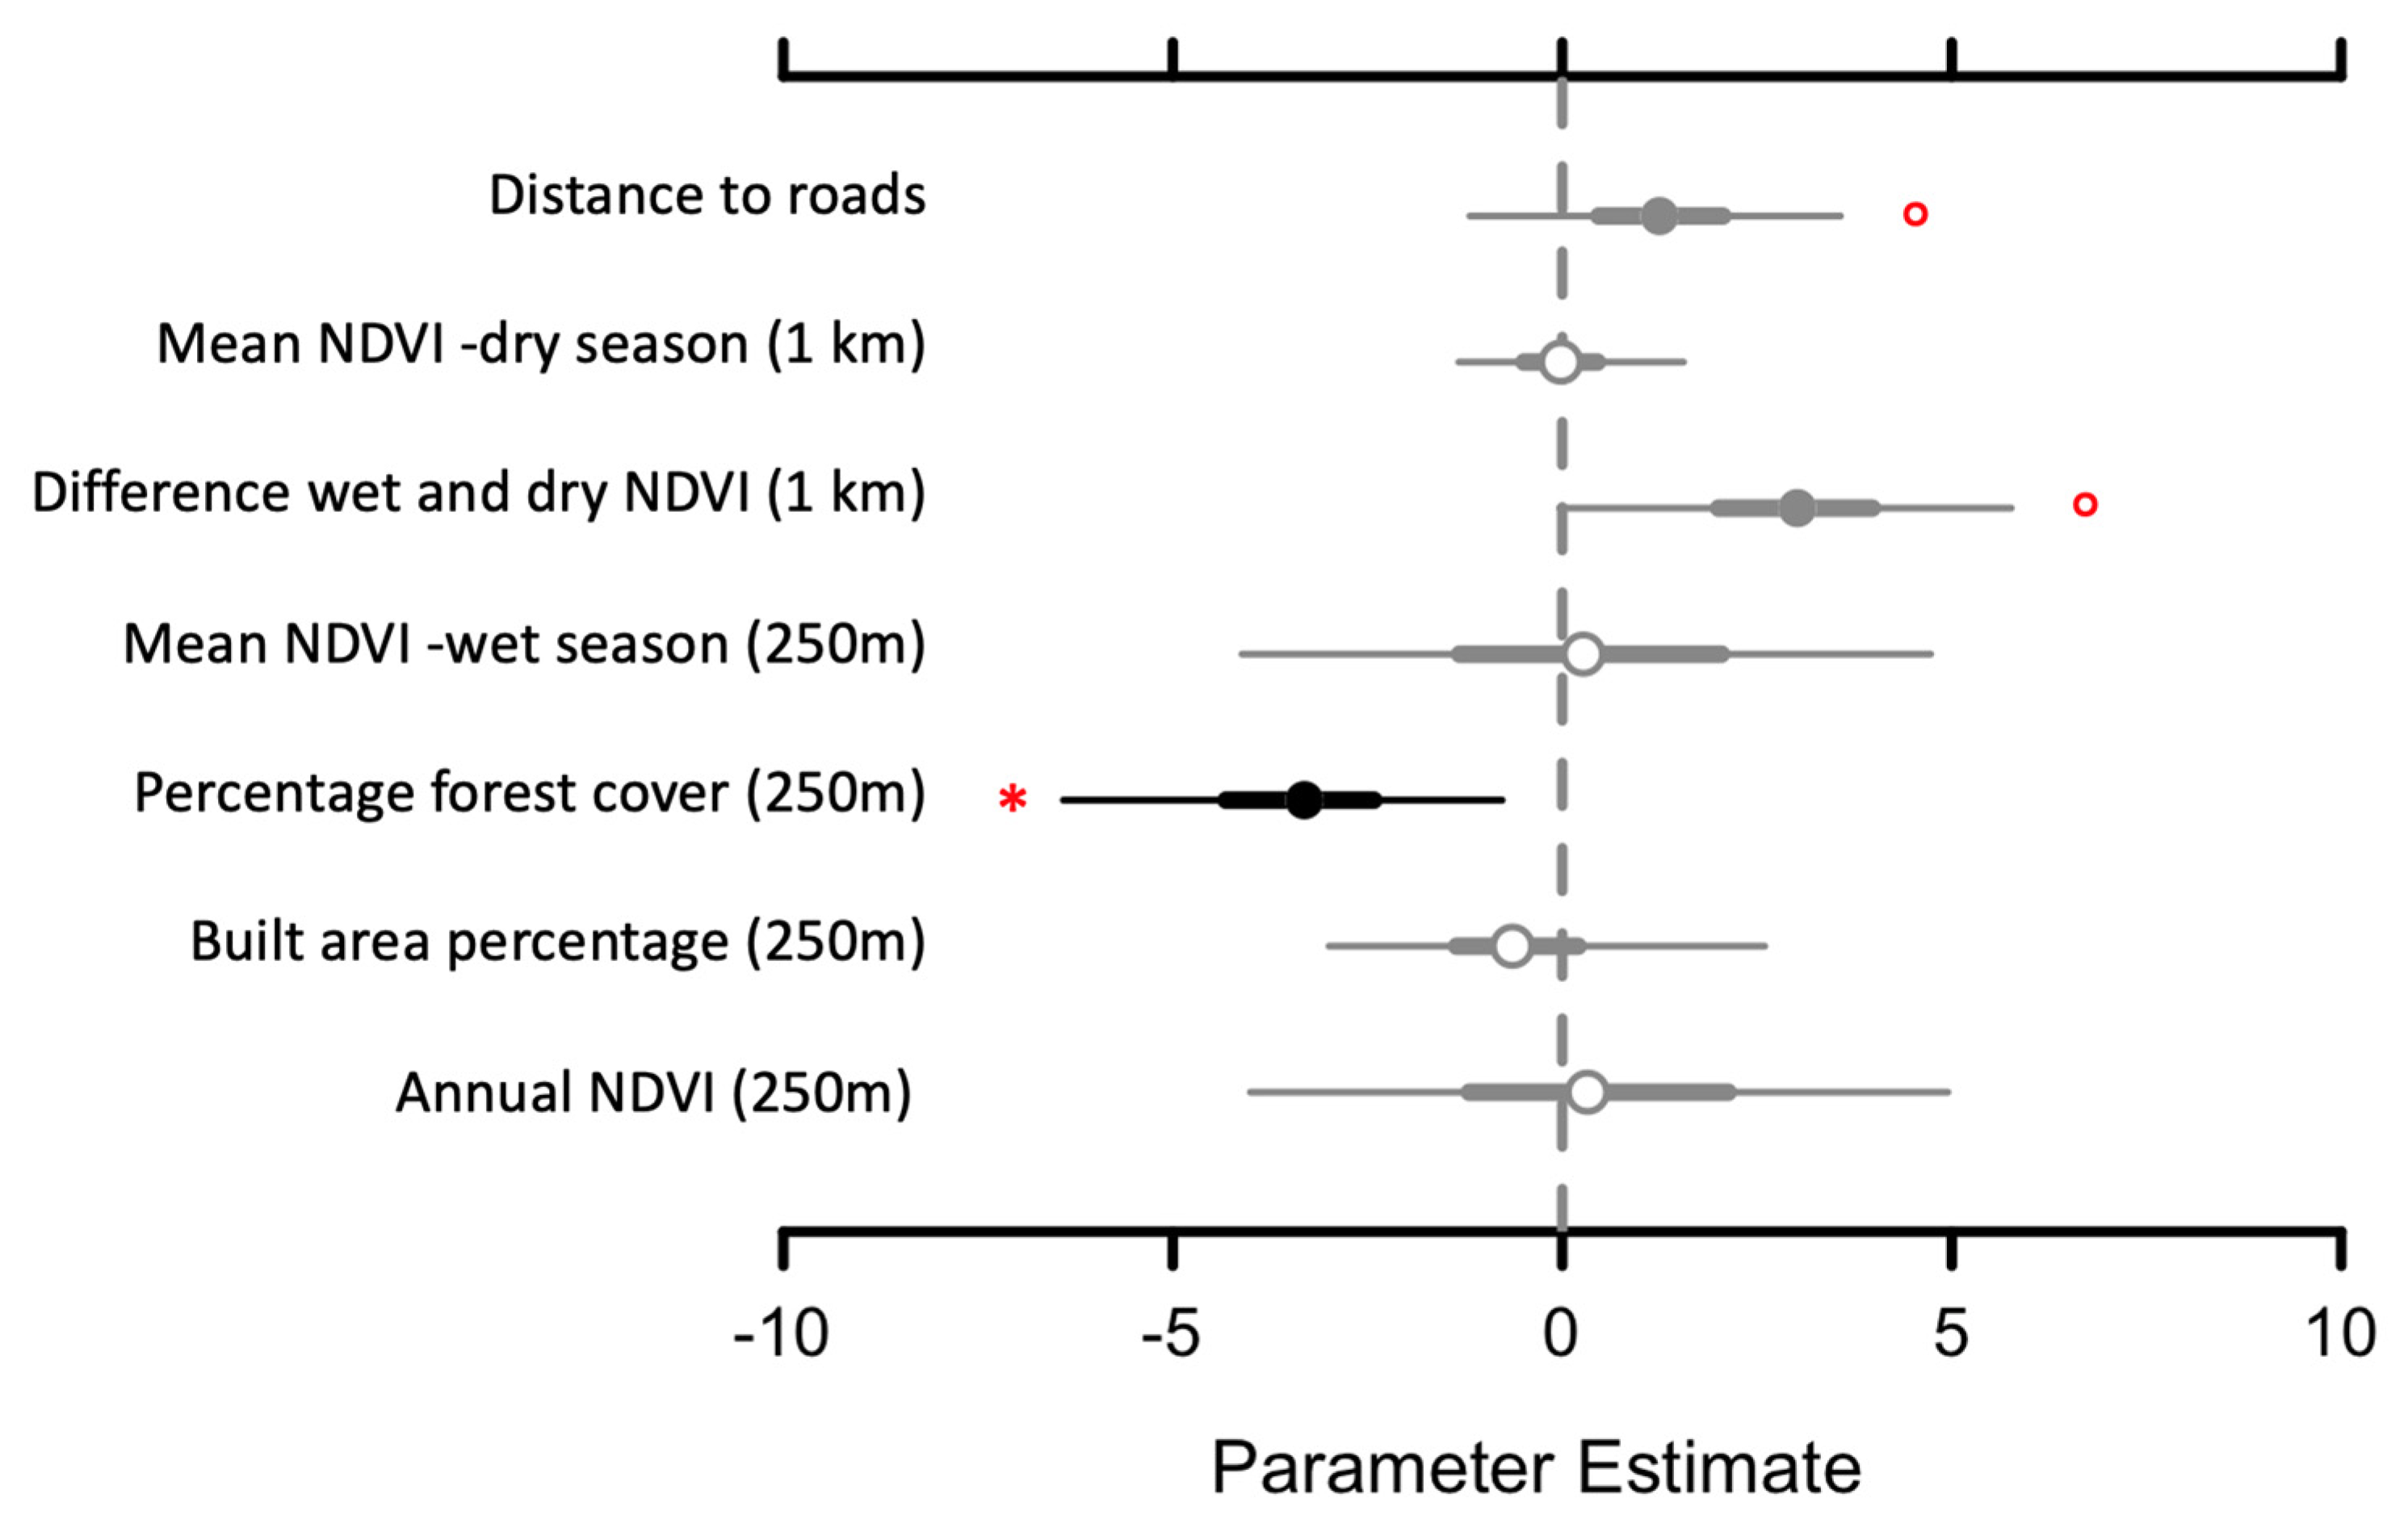
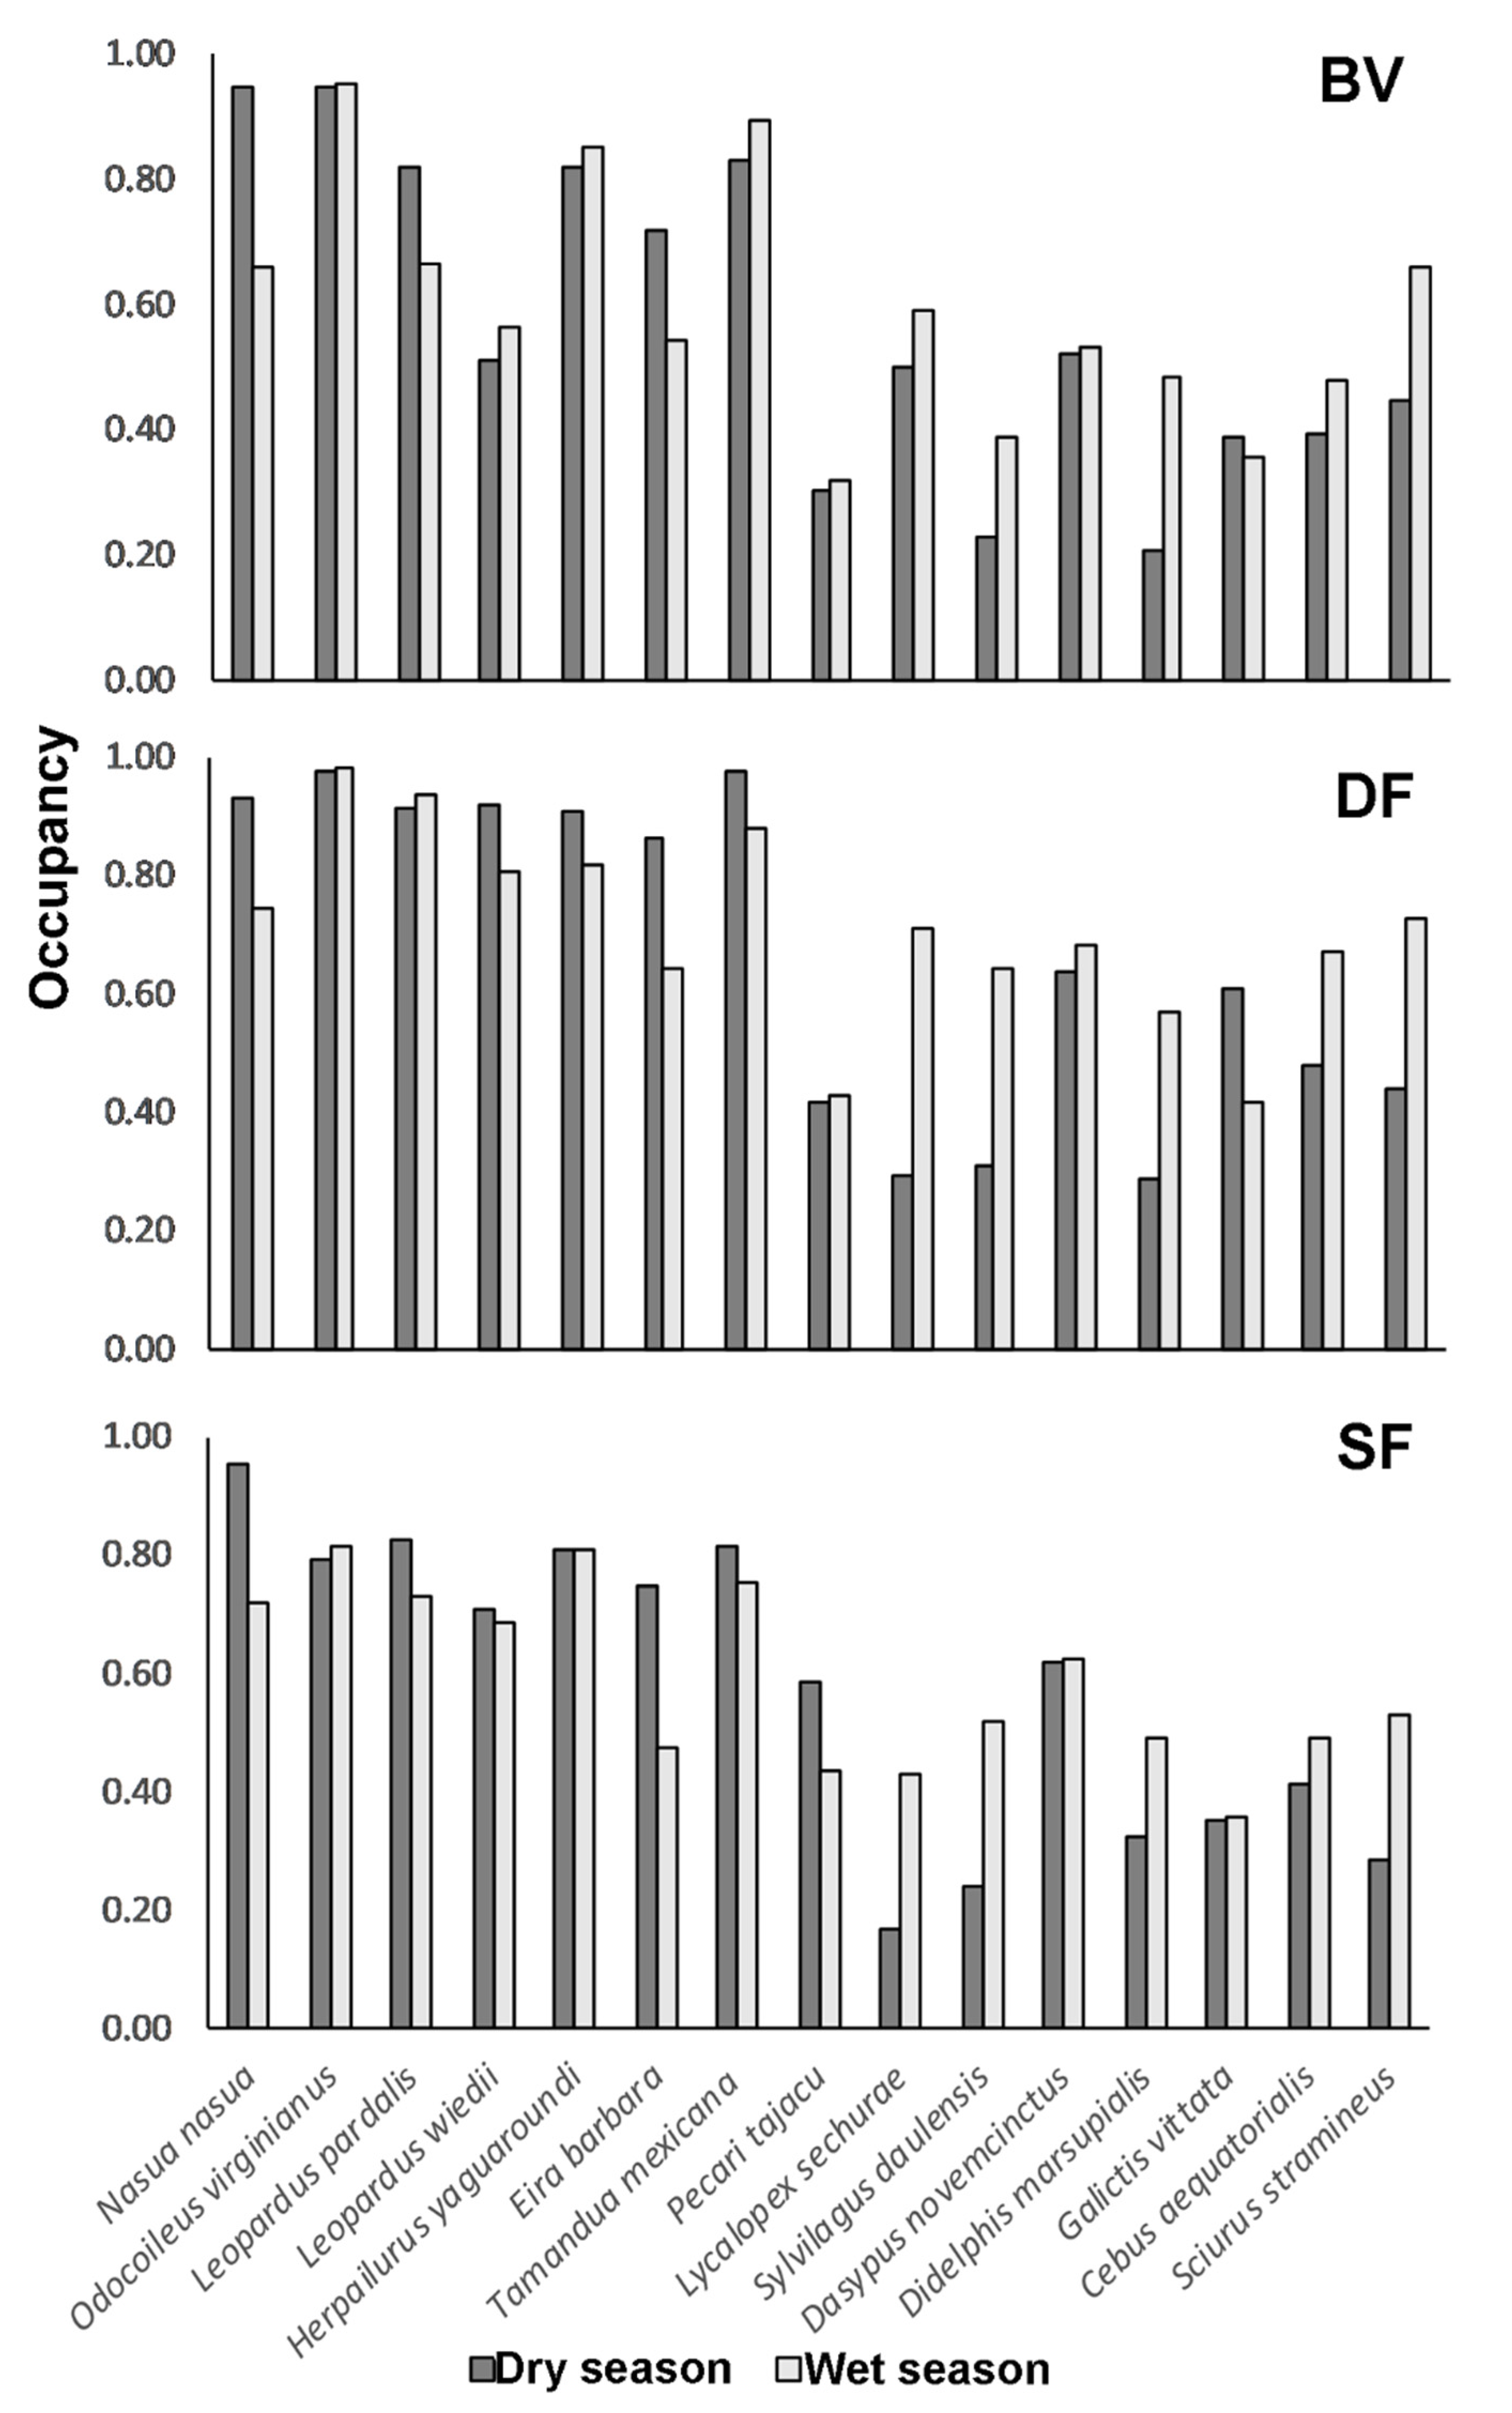
| Name | Description | BV | SF | DF |
|---|---|---|---|---|
| Covariates for occupancy (ψ) | ||||
| Percent forest cover (250 m) | Percent of pixels classfied as forest in 250 m buffers around each sampling site. This variable indicates habitat extent for mammal species and is inversly proporcional to percent agrigulture. | 40 ± 20 | 98 ± 2 | 88 ± 10 |
| Built area percentage (250 m) | Percent of pixels classfied as built in 250 m buffers around each sampling site. This variable indicates direct human activity. | 0 | 0 | 1.3 ± 2.4 |
| Annual NDVI (250 m) | Average Normalized Difference Vegetation Index (NDVI) in 250 m buffers around each sampling site. This variable indicates overall vegetation greenness is taken to be a good estimator of forest quality in the study landscape. | 0.29 ± 0.01 | 0.39 ± 0.05 | 0.37 ± 0.02 |
| Mean NDVI—wet season (250 m) | Average Normalized Difference Vegetation Index (NDVI) from the wet season in 250 m buffers around each sampling site. This variable indicates vegetation greenness during the wet season is taken to be a good indicator of forest type and habitat quality. | 0.27 ± 0.02 | 0.37 ± 0.1 | 0.33 ± 0.05 |
| Mean NDVI—dry season (1 km) | Average Normalized Difference Vegetation Index (NDVI) from the dry season in 1 km buffers around each sampling site. This variable indicates vegetation greenness during the dry season is taken to be a good indicator of forest type and habitat quality. | 0.24 ± 0.01 | 0.26 ± 0.02 | 0.26 ± 0.02 |
| Difference wet and dry NDVI (1 km) | Average Normalized Difference Vegetation Index (NDVI) from the wet season minus average NDVI from the dry season in 1 km buffers around each sampling site. Indicator of forest and vegetation seasonality. High values of this variable indicate high seasonality and vice versa. | 0.02 ± 0.0 | 0.09 ± 0.04 | 0.2 ± 0.03 |
| Distance to roads | Distance (in m) to paved or unpaved roads. This variable indicates direct and indirect human activity. | 237 ± 140 | 1114 ± 330 | 263 ± 264 |
| Covariates for detection (p) | ||||
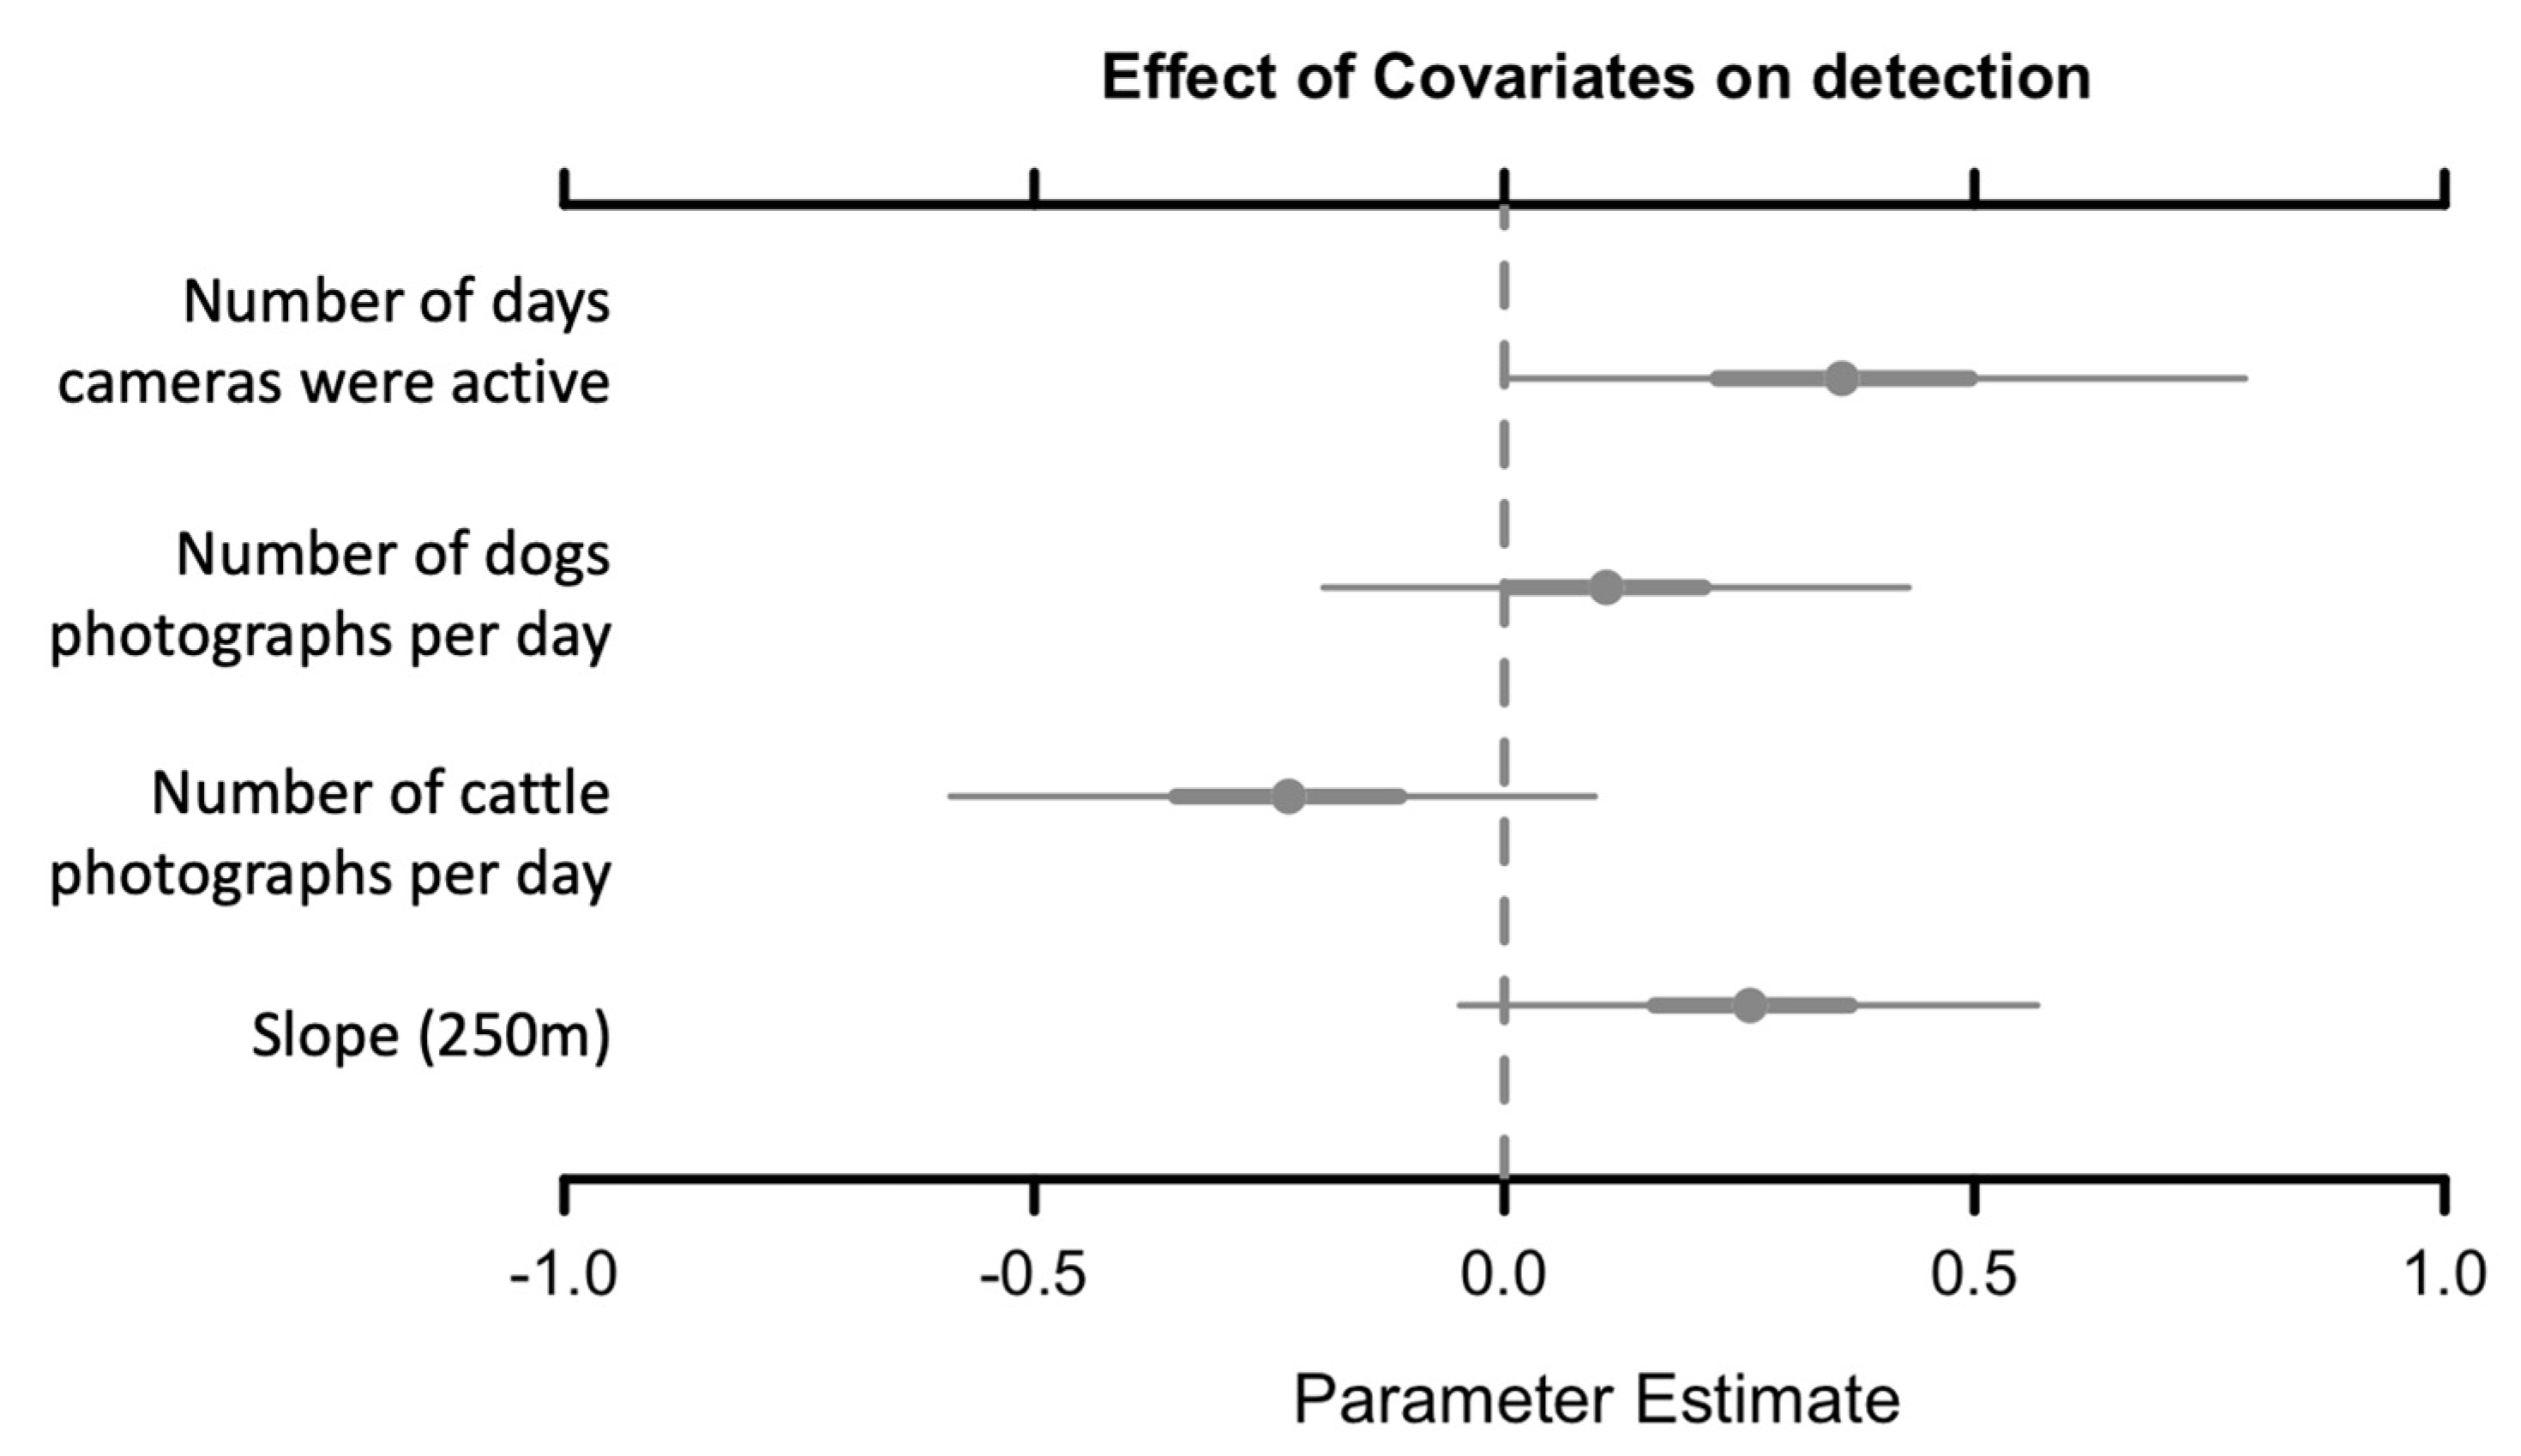
| Number of days | Number of days each camera was active. | 1420 ± 32 | 1603 ± 74 | 2444 ± 45 |
| Dogs presence | Number of dog photographs per day in each camera. Indicator of human activity. | 8 ± 2.5 | 5 ± 1.2 | 42 ± 3.7 |
| Cattle | Number of photographs detecting cattle per day in each camera. Indicator of human activity. | 7 ± 2.3 | 0 | 0 |
| Slope (250 m) | The mean slope in 250 m buffers around each sampling site. Indicator of topography. | 10.1 ± 0.3 | 8.9 ± 0.5 | 8.9 ± 0.5 |
| Scientific Name | English Name | IUCN Status | National Status * 1 | Altitudinal Range | Independent Records (1-day) | ||
|---|---|---|---|---|---|---|---|
| DF | SF | BV | |||||
| Canidae | |||||||
| Lycalopex sechurae | Sechuran fox | NT | NT | 0–2000 | 11 | 0 | 32 |
| Cervidae | |||||||
| Odocoileus virginianus ssp. peruvianus | Peruvian White-tailed deer | -- | EN | 0–5000 | 121 | 35 | 32 |
| Dasypodidae | |||||||
| Dasypus novemcinctus | Nine-banded armadillo | LC | LC | 0–2000 | 6 | 20 | 0 |
| Didelphidae | |||||||
| Didelphis marsupialis | Lowland opossum | LC | LC | 0–2000 | 6 | 0 | 5 |
| Felidae | |||||||
| Leopardus pardalis | Ocelot | LC | NT | 0–3000 | 59 | 55 | 11 |
| Leopardus wiedii | Margay | NT | VU | 0–3000 | 75 | 49 | 5 |
| Herpailurus yagouaroundi | Jaguarundi | LC | NT | 0–3200 | 12 | 15 | 8 |
| Mustelidae | |||||||
| Eira barbara | Tayra | LC | LC | 0–2400 | 25 | 13 | 4 |
| Galictis vittata | Greater Grison | LC | DD | 0–1200 | 4 | 1 | 0 |
| Myrmecophagidae | |||||||
| Tamandua mexicana | Northern tamandua | LC | VU | 0–2000 | 47 | 11 | 6 |
| Procyonidae | |||||||
| Nasua nasua | South American coati | LC | LC | 0–2500 | 61 | 100 | 33 |
| Sciuridae | |||||||
| Simosciurus stramineus | Guayaquil squirrel | -- | LC | 4 | 0 | 5 | |
| Tayassuidae | |||||||
| Pecari tajacu | Collared peccary | LC | NT | 0–3000 | 2 | 26 | 0 |
| Leporidae | |||||||
| Sylvilagus daulensis | Daule tapeti | -- | NE * 2 | 0–3400 | 16 | 7 | 0 |
| Cebidae | |||||||
| Cebus aequatorialis | Ecuadorian white-fronted capuchin | CR | CR | 0–2000 | 8 | 0 | 0 |
Publisher’s Note: MDPI stays neutral with regard to jurisdictional claims in published maps and institutional affiliations. |
© 2021 by the authors. Licensee MDPI, Basel, Switzerland. This article is an open access article distributed under the terms and conditions of the Creative Commons Attribution (CC BY) license (https://creativecommons.org/licenses/by/4.0/).
Share and Cite
Haro-Carrión, X.; Johnston, J.; Bedoya-Durán, M.J. Landscape Structure and Seasonality: Effects on Wildlife Species Richness and Occupancy in a Fragmented Dry Forest in Coastal Ecuador. Remote Sens. 2021, 13, 3762. https://doi.org/10.3390/rs13183762
Haro-Carrión X, Johnston J, Bedoya-Durán MJ. Landscape Structure and Seasonality: Effects on Wildlife Species Richness and Occupancy in a Fragmented Dry Forest in Coastal Ecuador. Remote Sensing. 2021; 13(18):3762. https://doi.org/10.3390/rs13183762
Chicago/Turabian StyleHaro-Carrión, Xavier, Jon Johnston, and María Juliana Bedoya-Durán. 2021. "Landscape Structure and Seasonality: Effects on Wildlife Species Richness and Occupancy in a Fragmented Dry Forest in Coastal Ecuador" Remote Sensing 13, no. 18: 3762. https://doi.org/10.3390/rs13183762
APA StyleHaro-Carrión, X., Johnston, J., & Bedoya-Durán, M. J. (2021). Landscape Structure and Seasonality: Effects on Wildlife Species Richness and Occupancy in a Fragmented Dry Forest in Coastal Ecuador. Remote Sensing, 13(18), 3762. https://doi.org/10.3390/rs13183762


