
Optimized Estimation of Leaf Mass per Area with a 3D Matrix of Vegetation Indices


 ,
, 


Abstract
:1. Introduction
2. Materials and Methods
2.1. Data Description
2.1.1. PROSPECT Model
2.1.2. Description of the Synthetic Datasets
2.1.3. Description of the Experimental Datasets
2.2. 3D Matrix Approach for Estimating LMA
2.2.1. VIs for Building the 3D Matrices
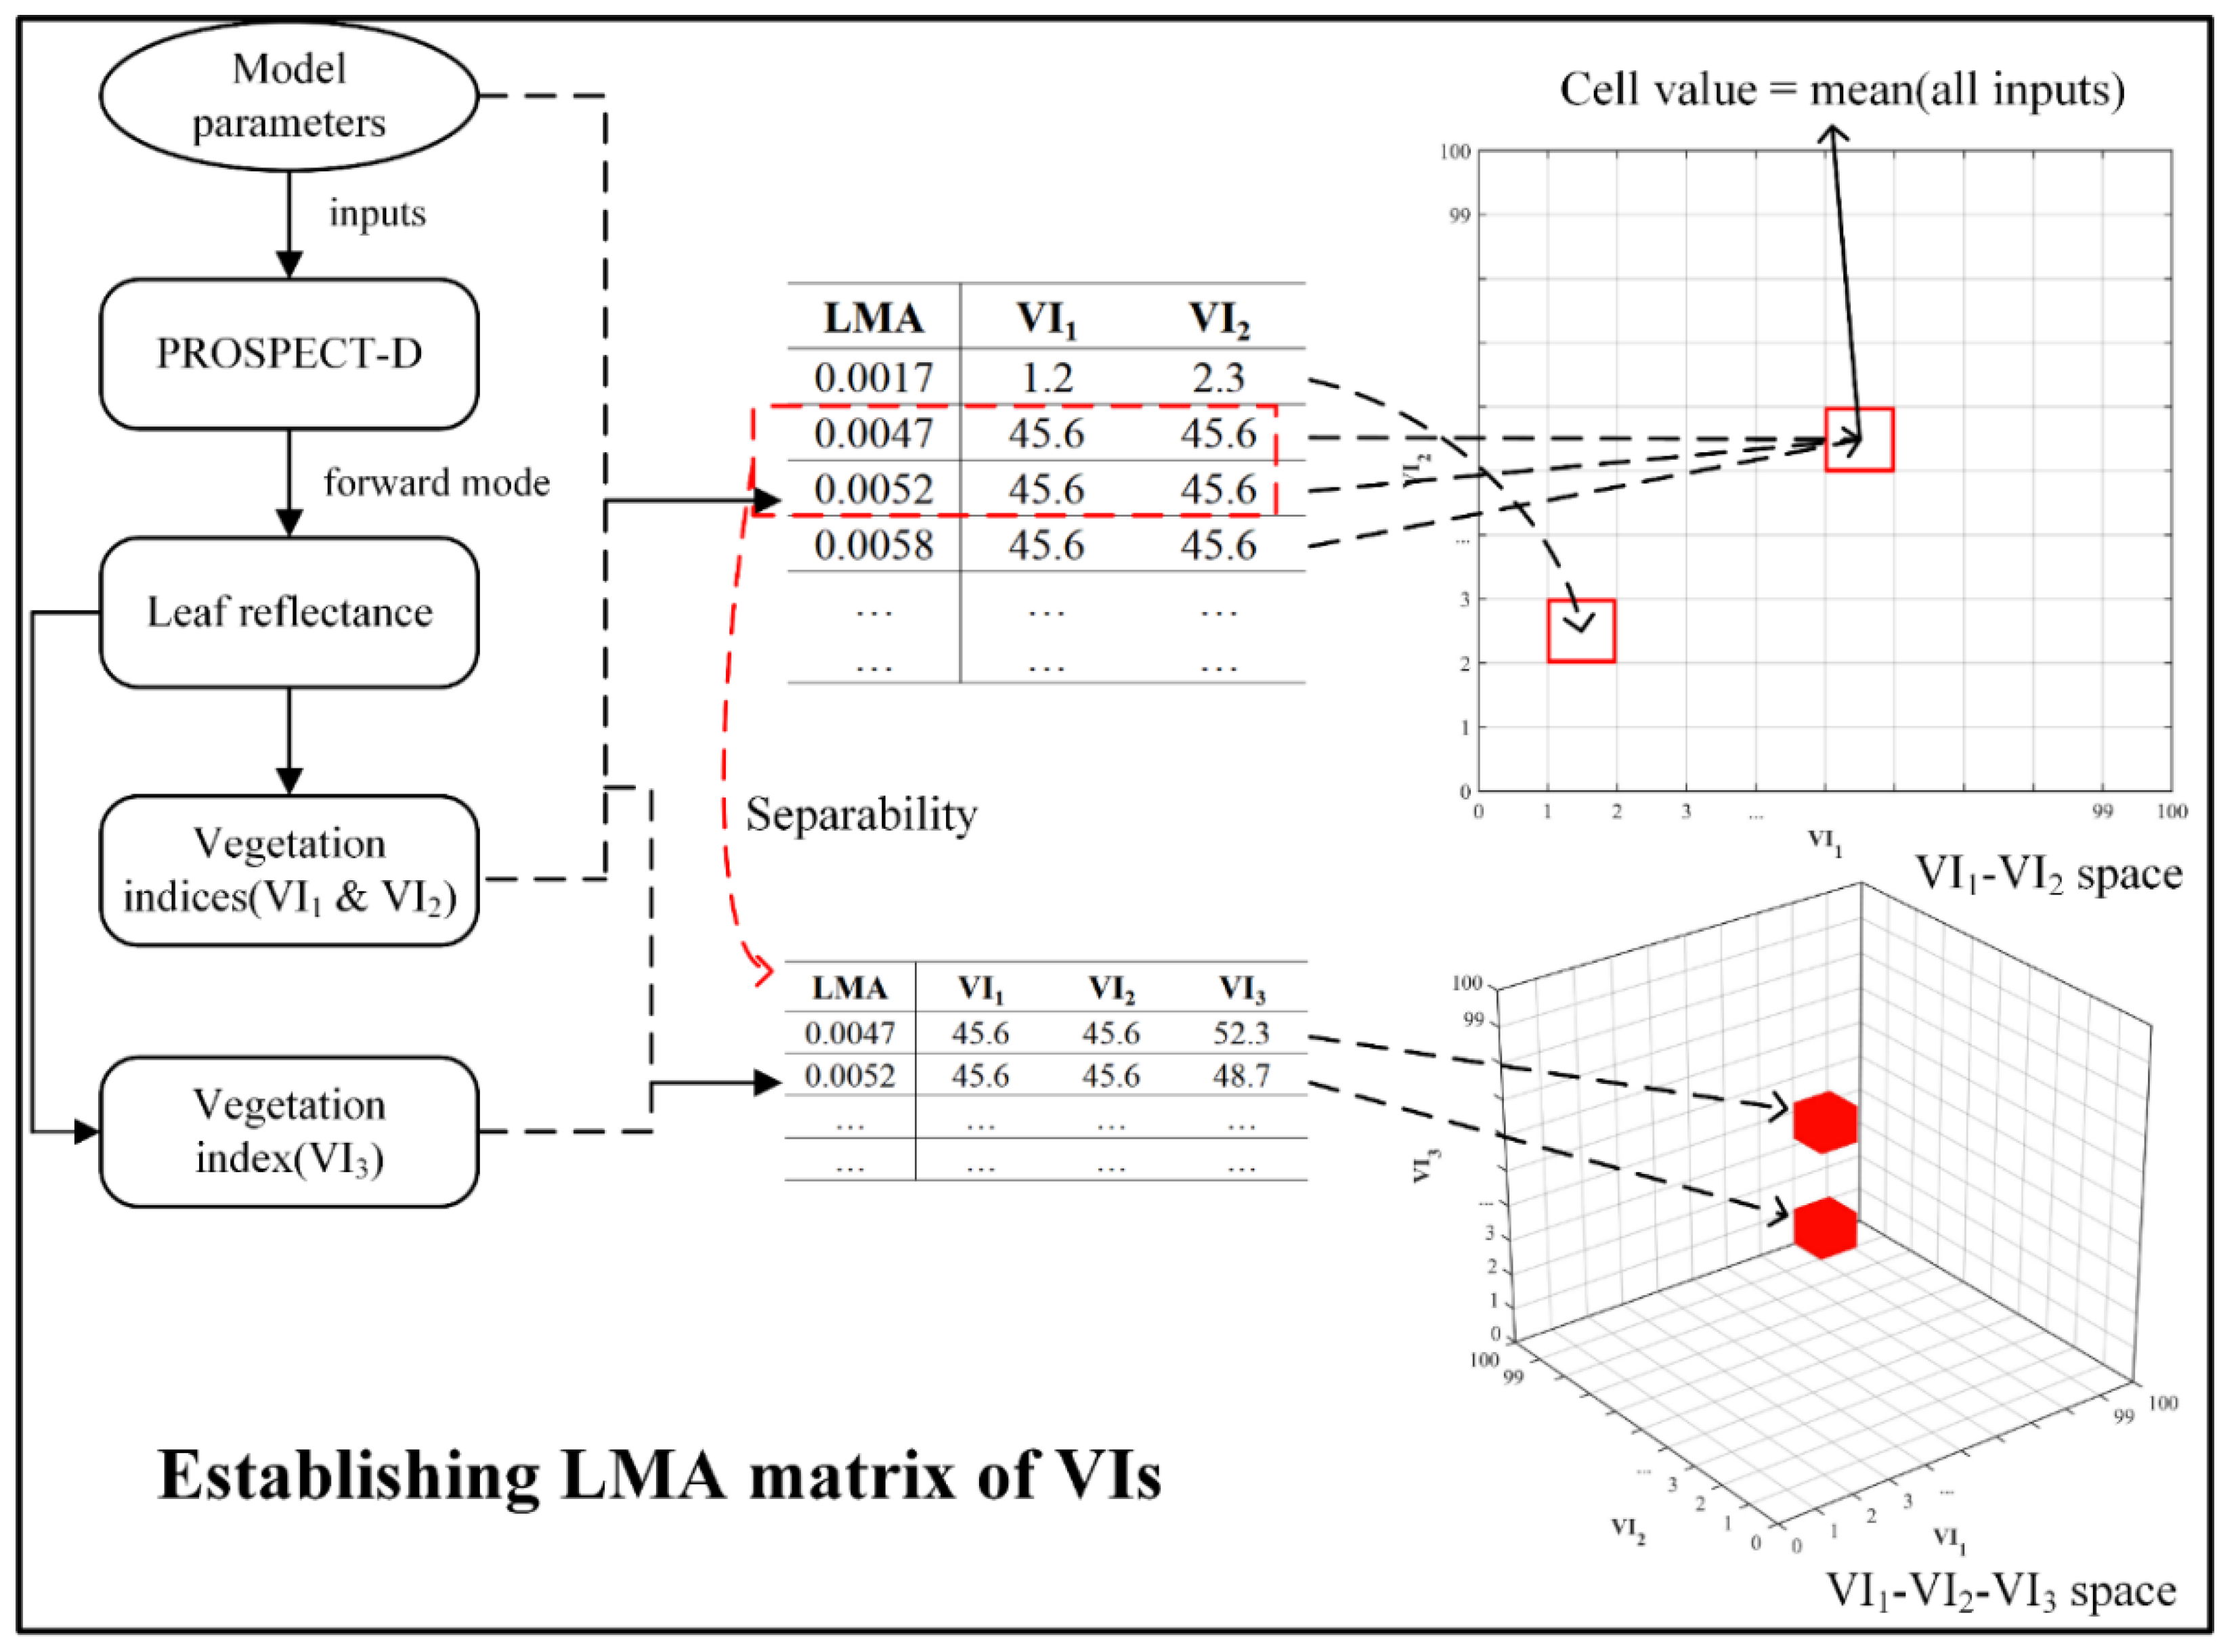
2.2.2. Establishment of the 3D Matrices
2.2.3. Estimation of the LMA
2.3. Estimation of LMA through ML Algorithms
2.4. Accuracy Evaluation
3. Results
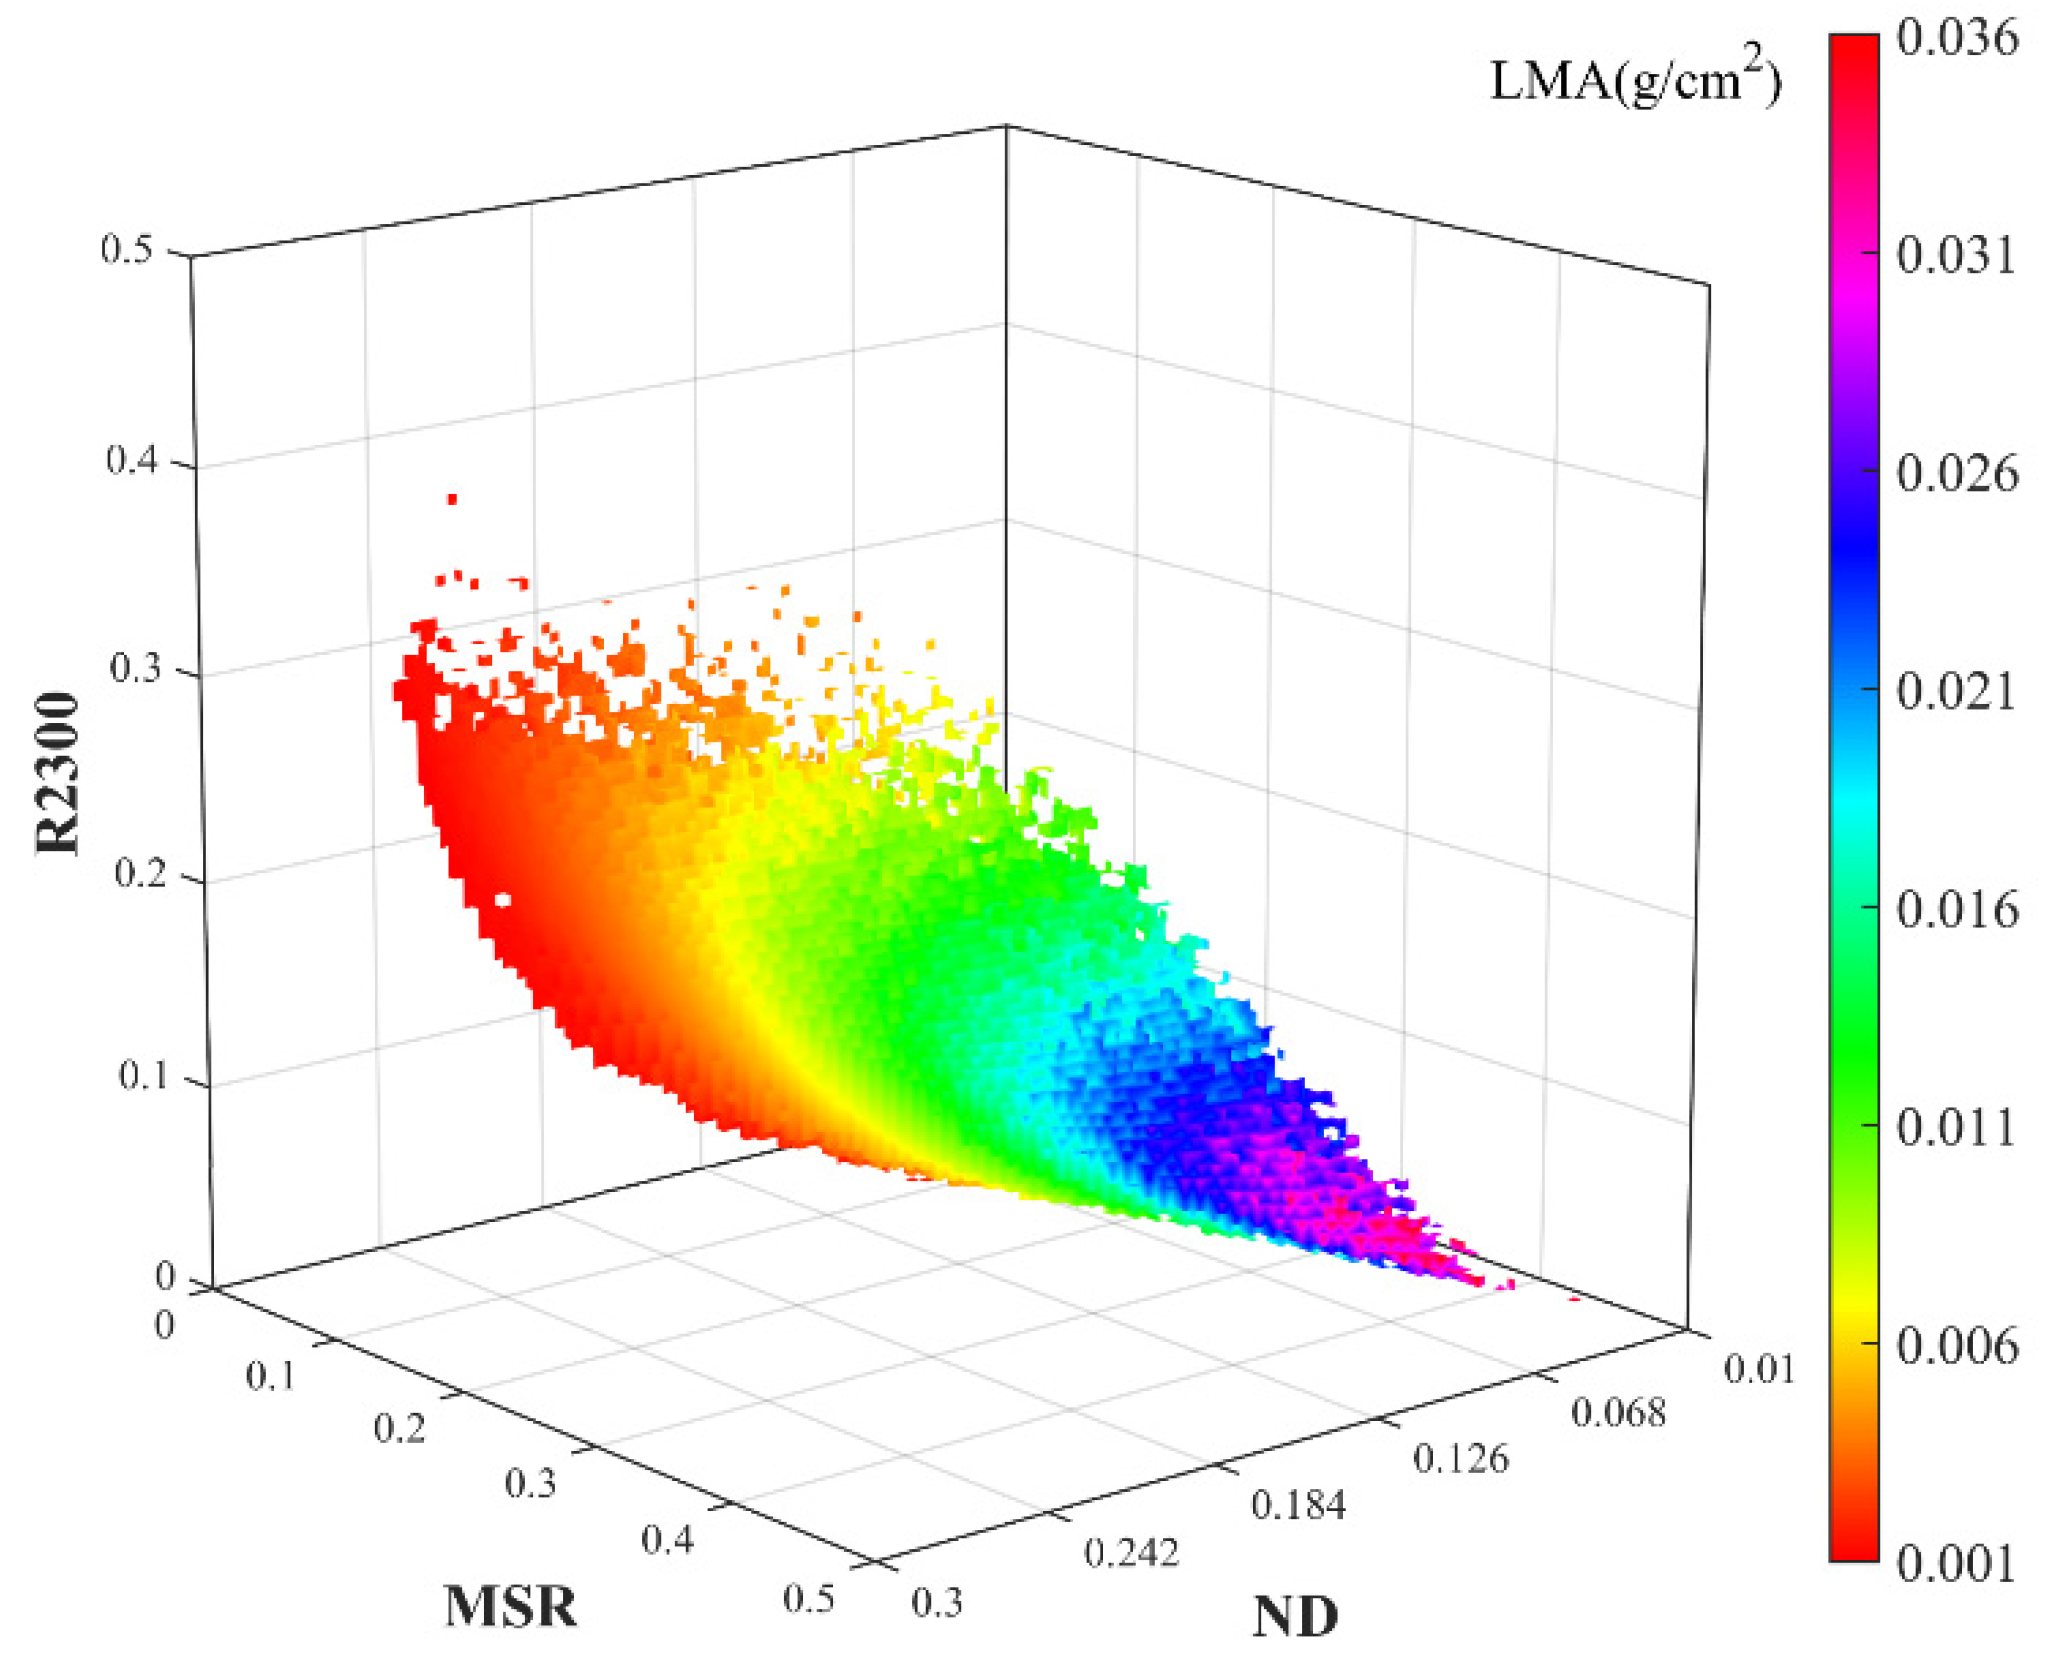
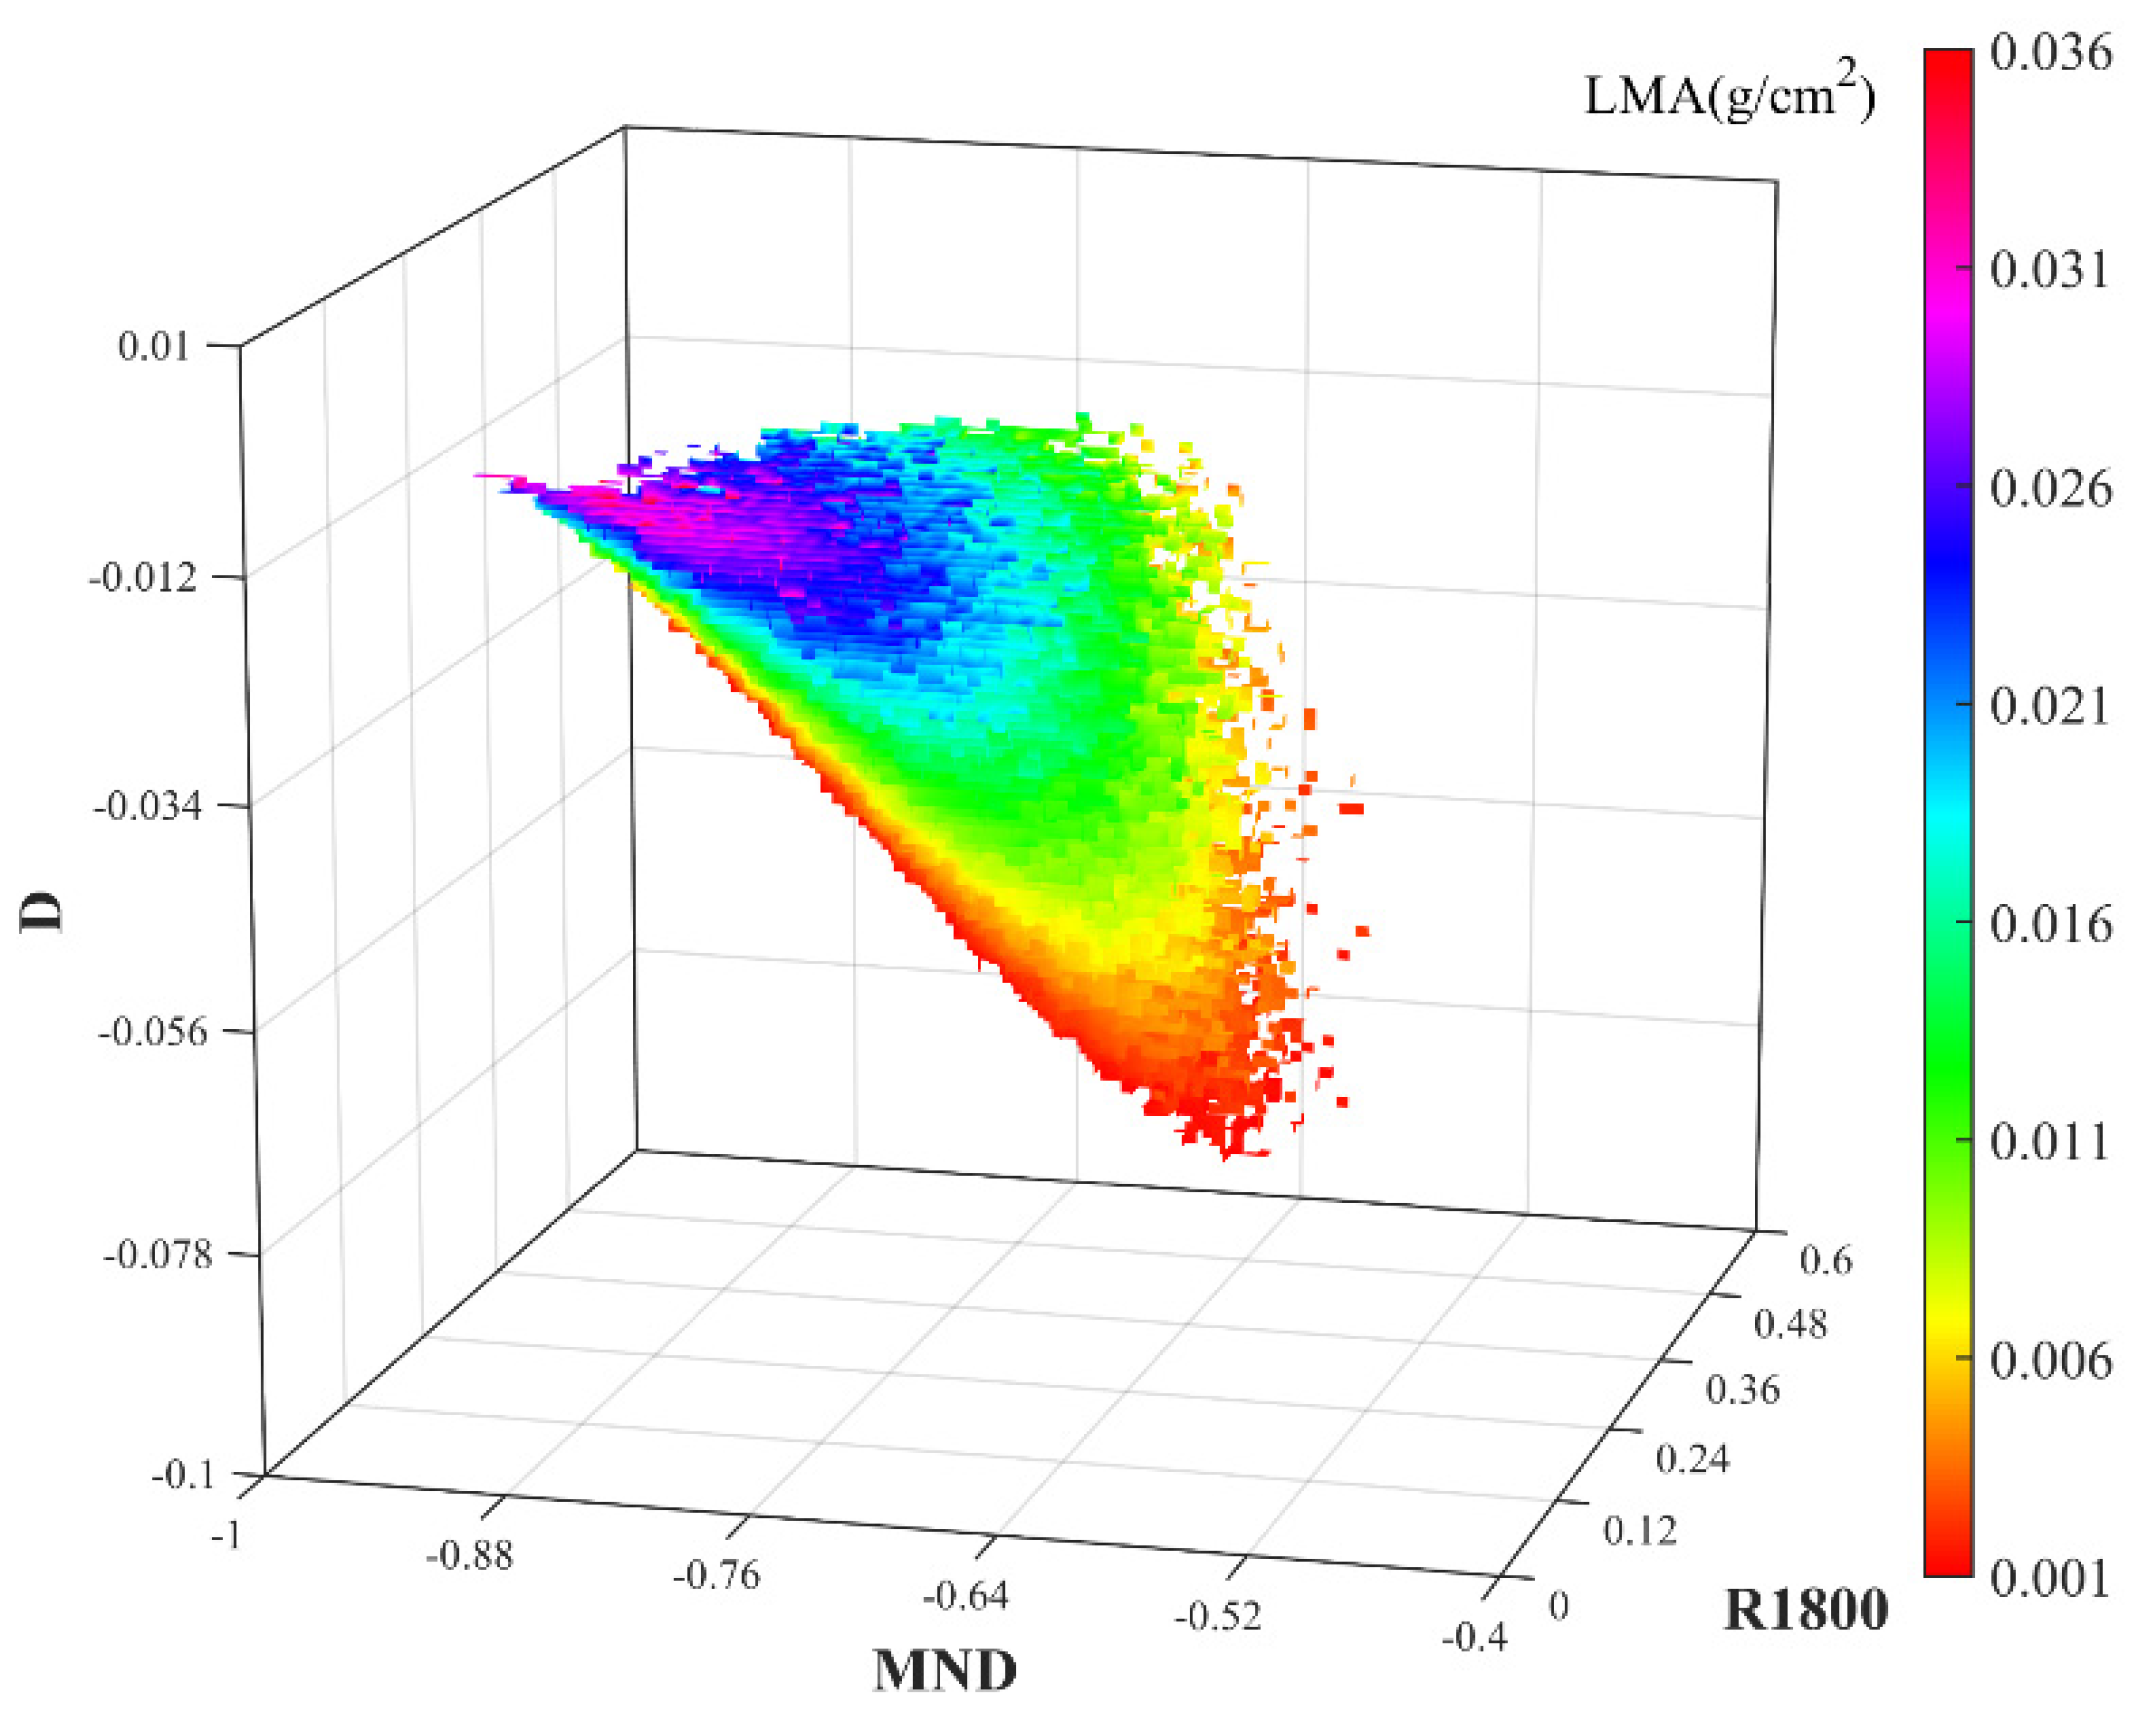
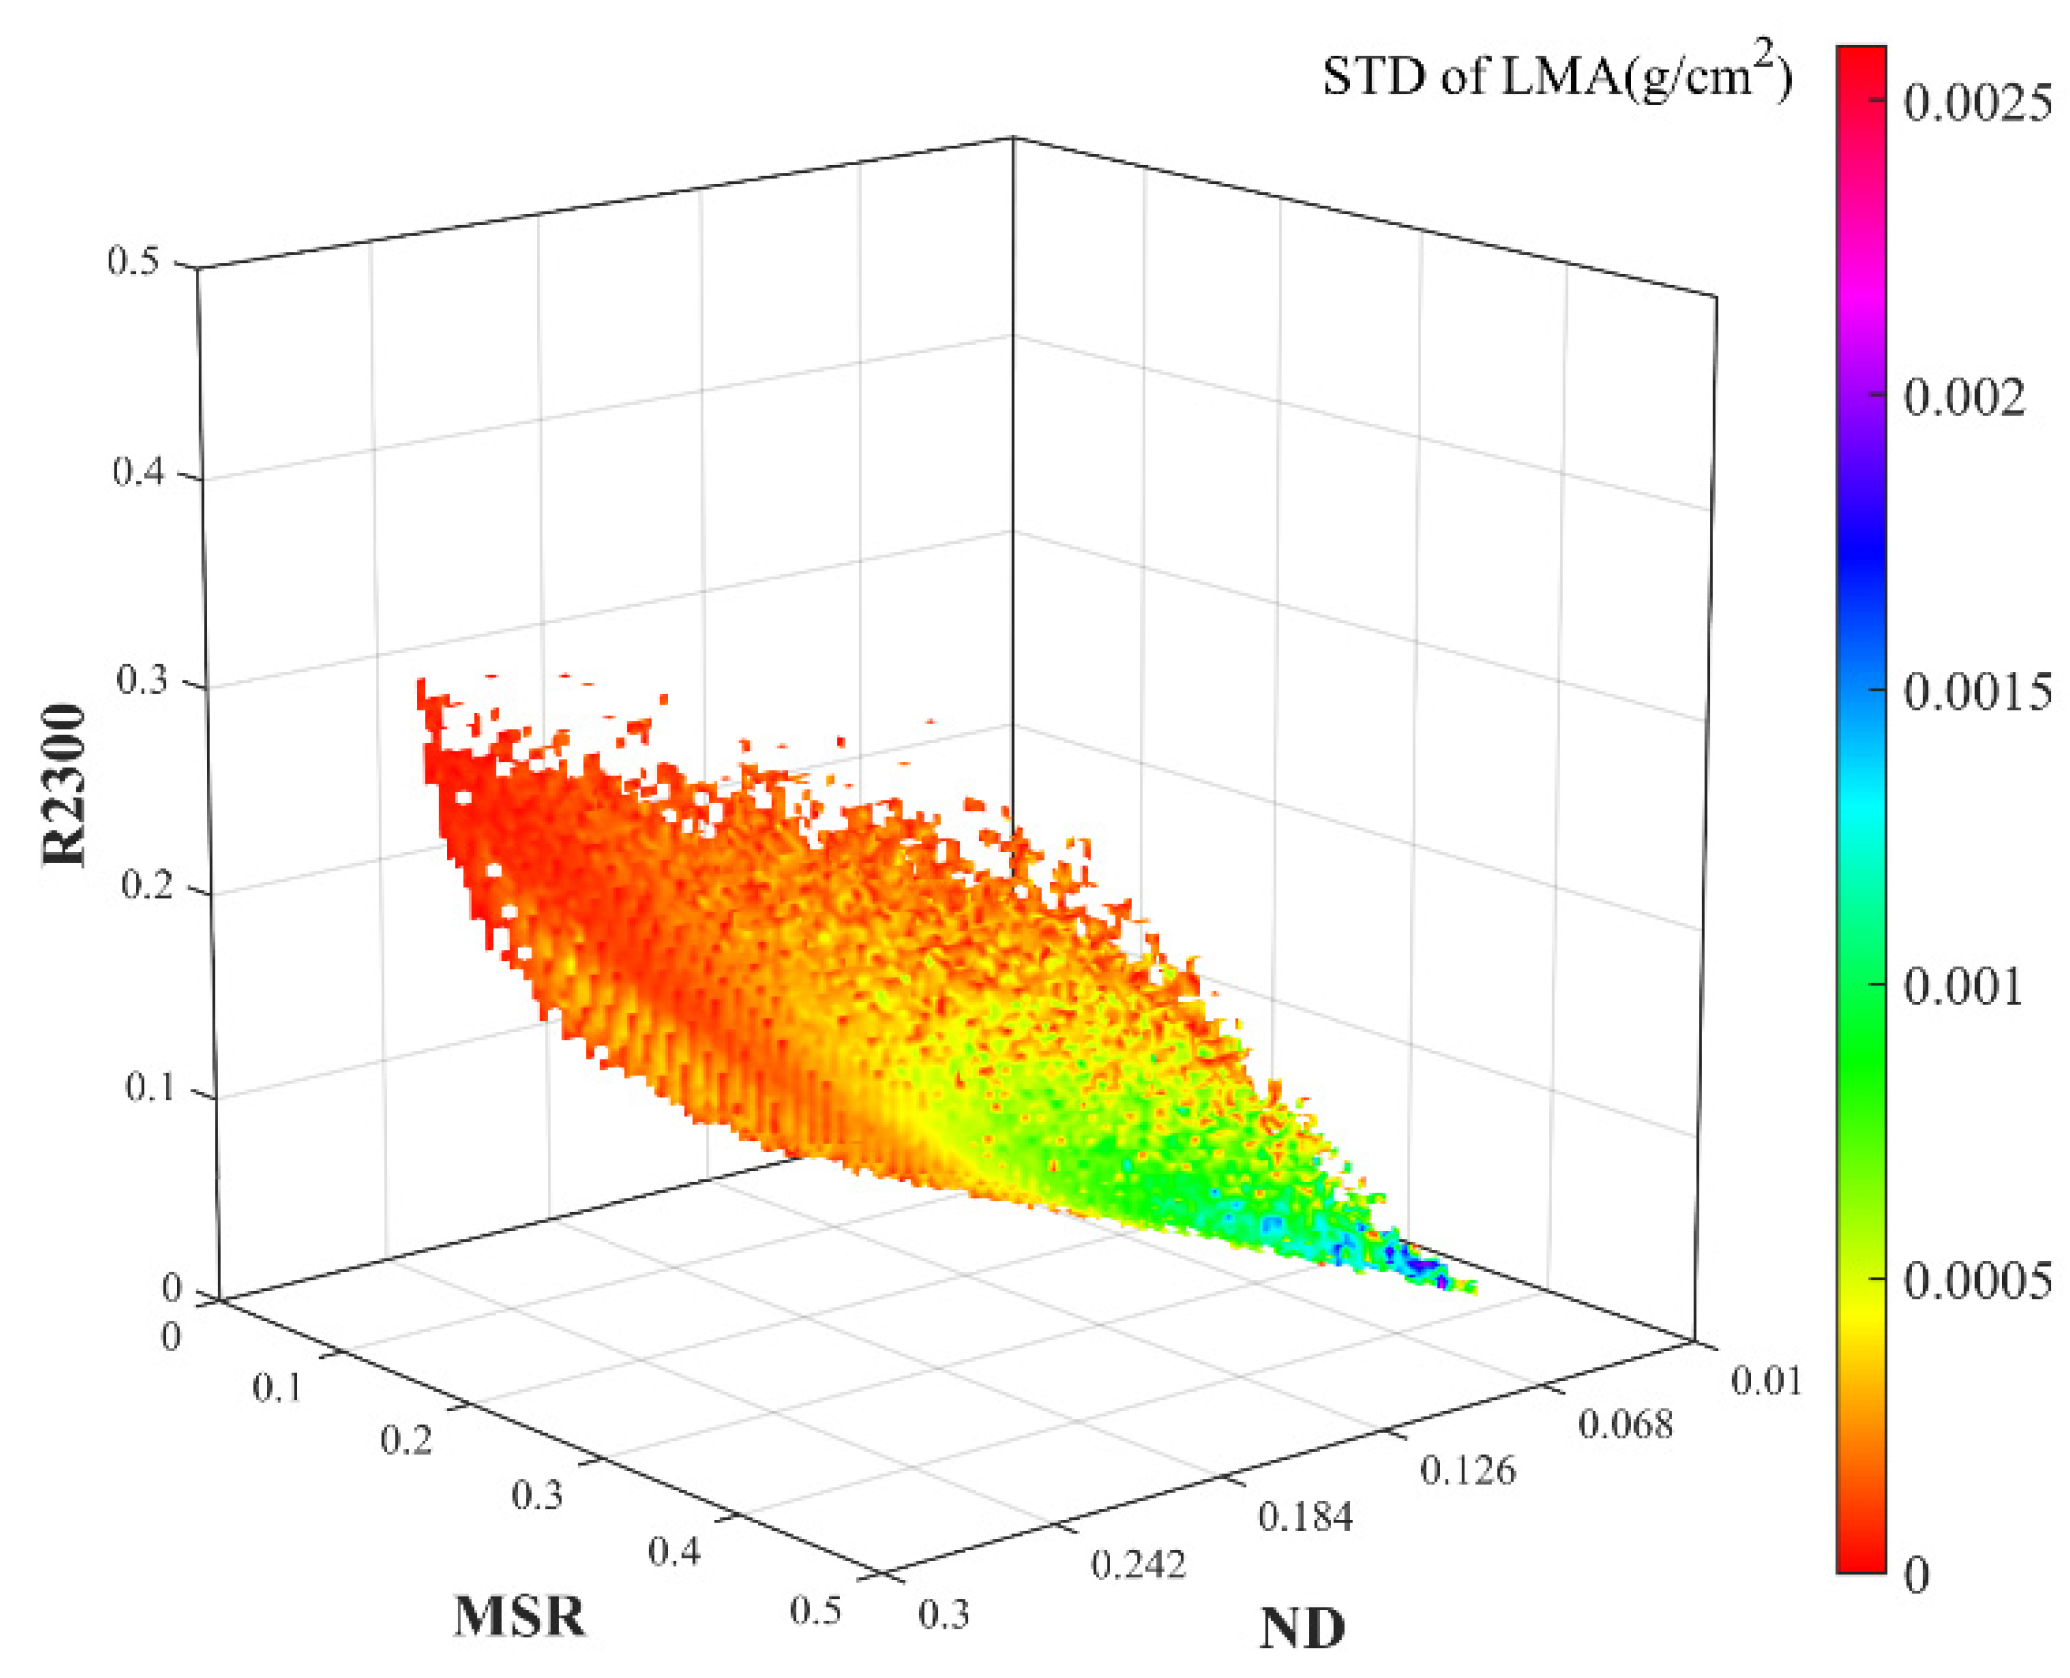
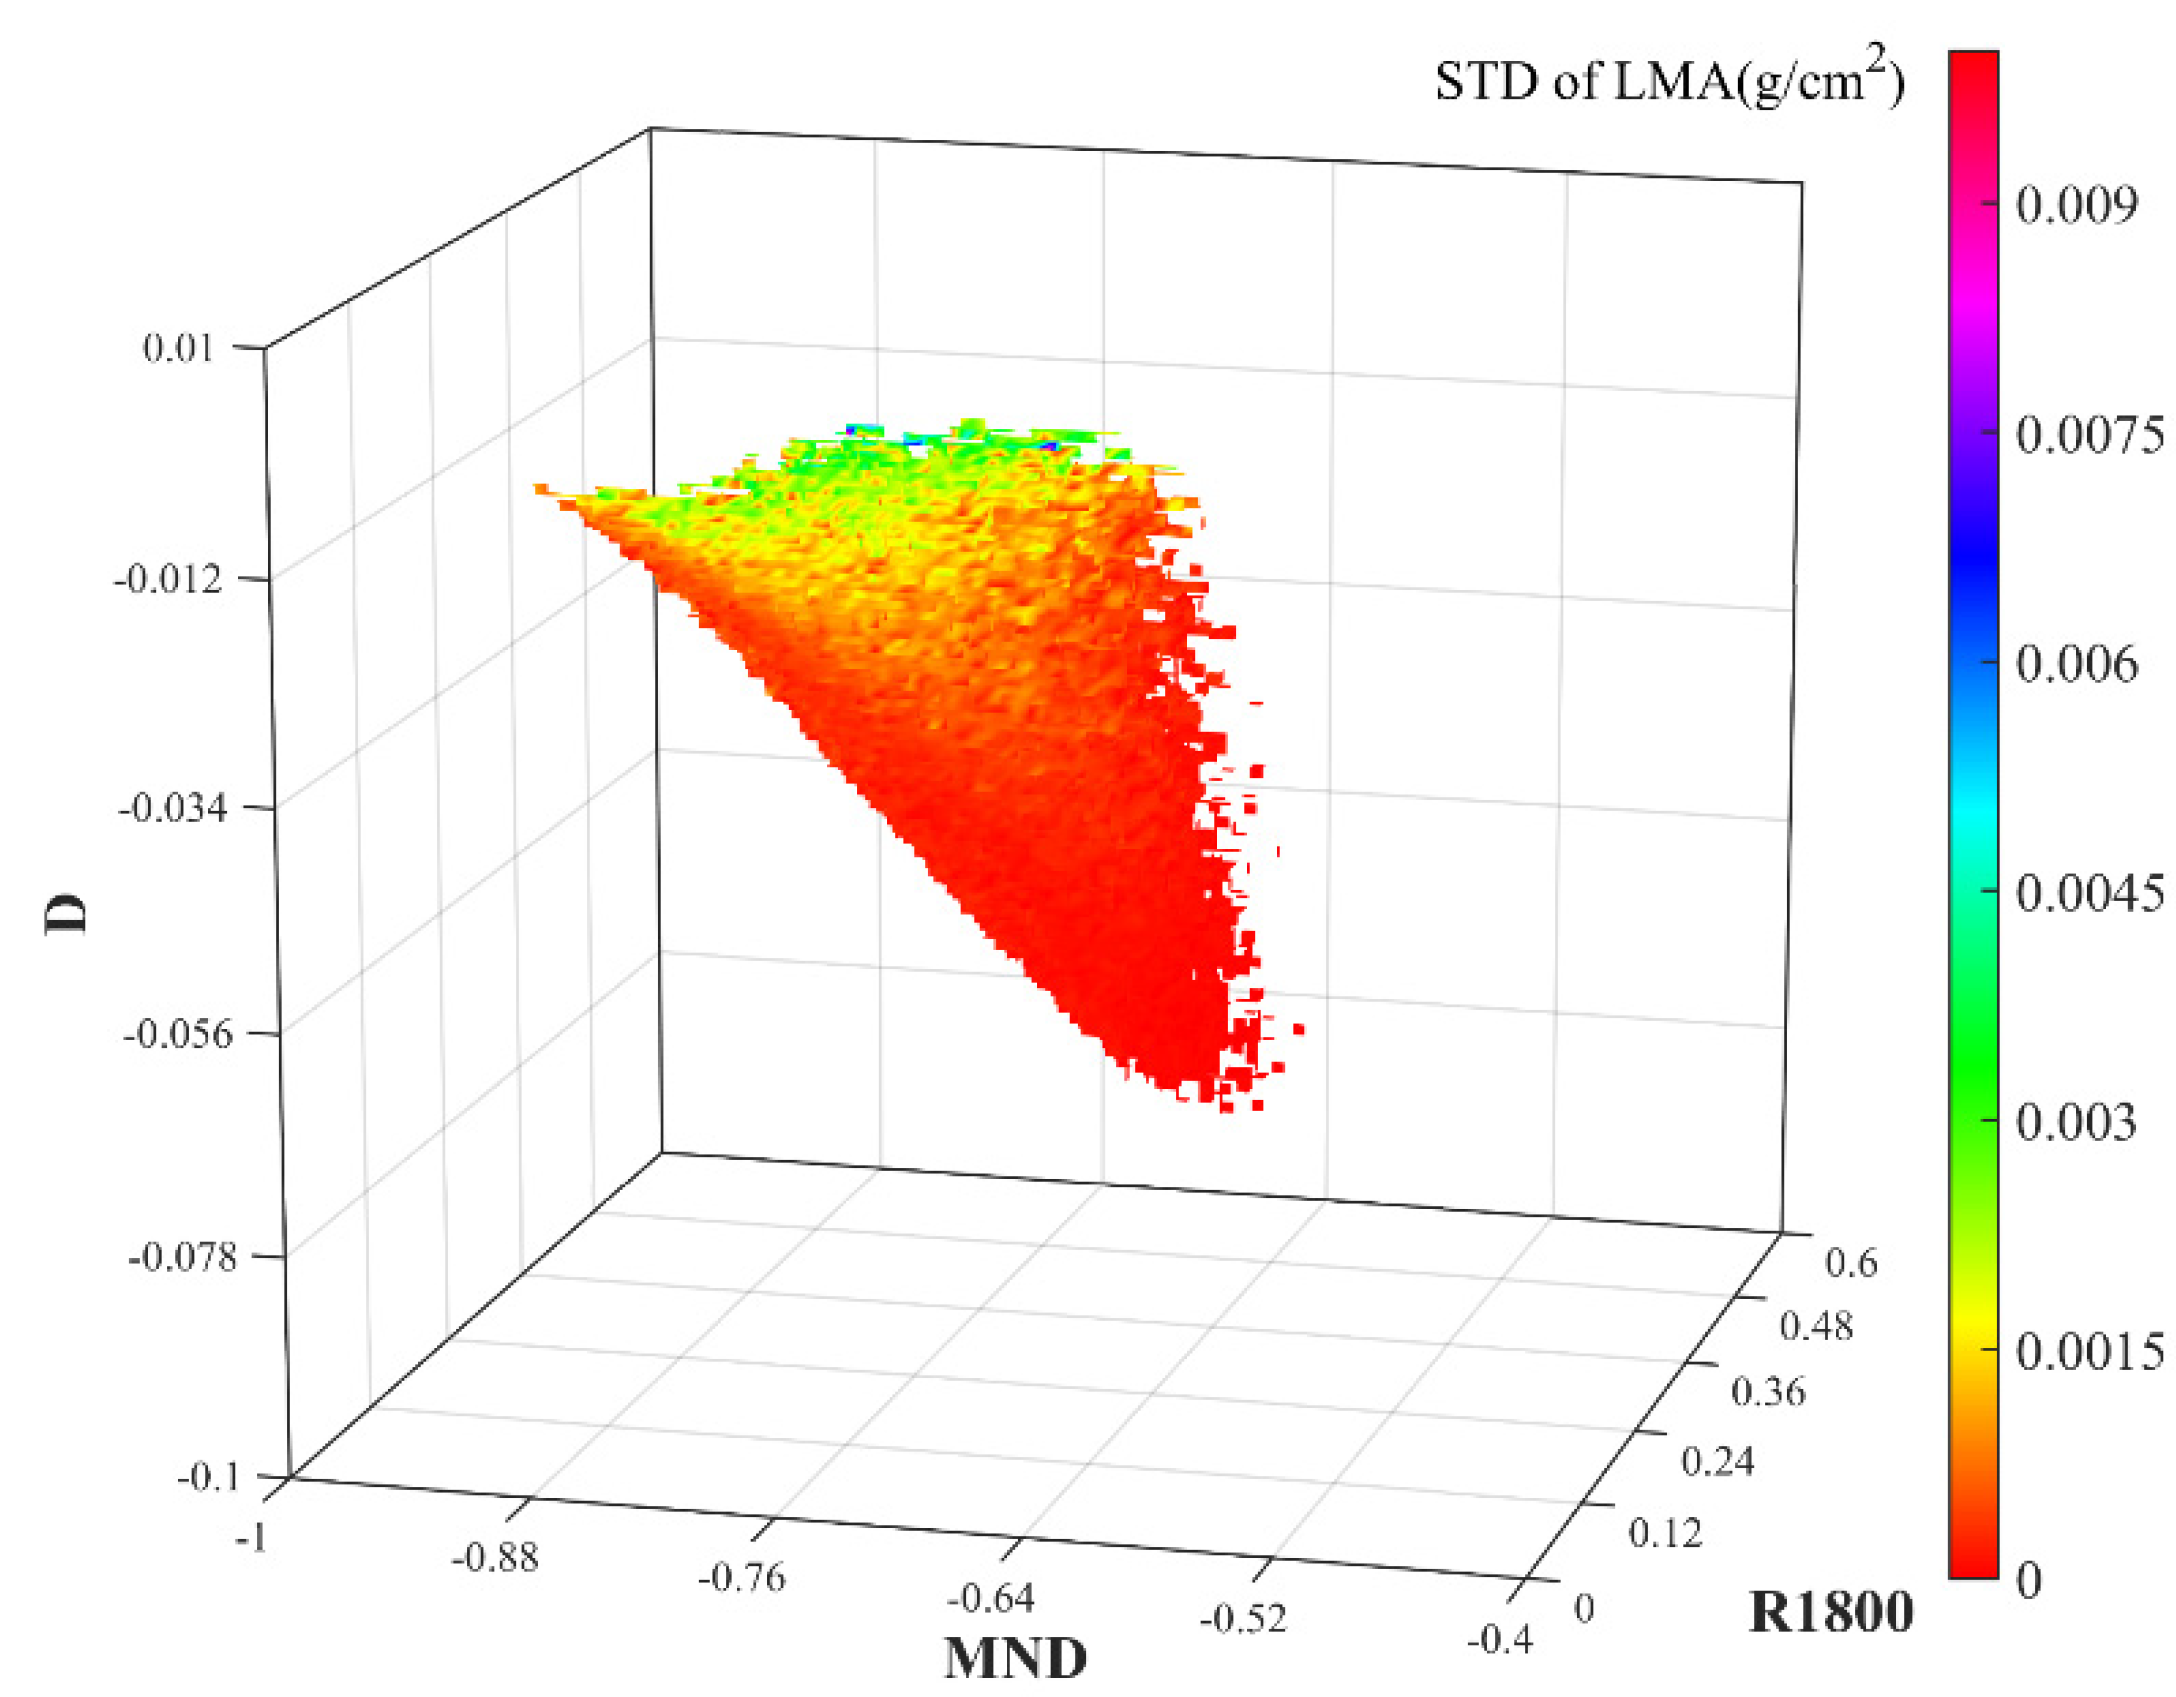
3.1. 3D Matrices of VIs for LMA
3.2. Evaluation of the LMA Matrices
3.2.1. Evaluation against Synthetic Data
3.2.2. Evaluation against the Experimental Datasets
4. Discussion
4.1. Improvements over Traditional VIs
4.2. Impact of VI Selection in 3D Matrix Construction
4.3. Sources of Error and Further Development of the 3D Matrix Approach
5. Conclusions
Author Contributions
Funding
Data Availability Statement
Acknowledgments
Conflicts of Interest
References
- Asner, G.P.; Martin, R.E. Spectranomics: Emerging science and conservation opportunities at the interface of biodiversity and remote sensing. Glob. Ecol. Conserv. 2016, 8, 212–219. [Google Scholar] [CrossRef] [Green Version]
- Schimel, D.; Pavlick, R.; Fisher, J.; Asner, G.P.; Saatchi, S.; Townsend, P.; Miller, C.; Frankenberg, C.; Hibbard, K.; Cox, P. Observing terrestrial ecosystems and the carbon cycle from space. Glob. Chang. Biol. 2015, 21, 1762–1776. [Google Scholar] [CrossRef]
- Zhang, Y.; Migliavacca, M.; Penuelas, J.; Ju, W. Advances in hyperspectral remote sensing of vegetation traits and functions. Remote Sens. Environ. 2020, 252, 112121. [Google Scholar] [CrossRef]
- Qiu, F.; Chen, J.M.; Ju, W.; Wang, J.; Zhang, Q.; Fang, M. Improving the PROSPECT Model. to Consider Anisotropic Scattering of Leaf Internal Materials and Its Use for Retrieving Leaf Biomass in Fresh Leaves. IEEE Trans. Geosci. Remote Sens. 2018, 56, 3119–3136. [Google Scholar] [CrossRef]
- Westoby, M. A leaf-height-seed (LHS) plant ecology strategy scheme. Plant Soil 1998, 199, 213–227. [Google Scholar] [CrossRef]
- Wright, I.J.; Reich, P.; Westoby, M.; Ackerly, D.D.; Baruch, Z.; Bongers, F.; Cavender-Bares, J.; Chapin, T.; Cornelissen, J.H.; Diemer, M. The worldwide leaf economics spectrum. Nature 2004, 428, 821–827. [Google Scholar] [CrossRef]
- Violle, C.; Navas, M.-L.; Vile, D.; Kazakou, E.; Fortunel, C.; Hummel, I.; Garnier, E. Let the concept of trait be functional! Oikos 2007, 116, 882–892. [Google Scholar] [CrossRef]
- Adler, P.B.; Salguero-Gomez, R.; Compagnoni, A.; Hsu, J.S.; Ray-Mukherjee, J.; Mbeau-Ache, C.; Franco, M. Functional traits explain variation in plant life history strategies. Proc. Natl. Acad. Sci. USA 2014, 111, 740–745. [Google Scholar] [CrossRef] [Green Version]
- John, G.P.; Scoffoni, C.; Buckley, T.N.; Villar, R.; Poorter, H.; Sack, L. The anatomical and compositional basis of leaf mass per area. Ecol. Lett. 2017, 20, 412–425. [Google Scholar] [CrossRef] [Green Version]
- Reich, P.B.; Cornelissen, H. The world-wide ‘fast-slow’ plant economics spectrum: A traits manifesto. J. Ecol. 2014, 102, 275–301. [Google Scholar] [CrossRef]
- Feilhauer, H.; Schmid, T.; Faude, U.; Sánchez-Carrillo, S.; Cirujano, S. Are remotely sensed traits suitable for ecological analysis? A case study of long-term drought effects on leaf mass per area of wetland vegetation. Ecol. Indic. 2018, 88, 232–240. [Google Scholar] [CrossRef]
- Poorter, H.; Niinemets, U.; Poorter, L.; Wright, I.J.; Villar, R. Causes and consequences of variation in leaf mass per area (LMA): A meta-analysis. New Phytol. 2009, 182, 565–588. [Google Scholar] [CrossRef]
- Weiss, M.; Jacob, F.; Duveiller, G. Remote sensing for agricultural applications: A meta-review. Remote Sens. Environ. 2019, 236, 111402. [Google Scholar] [CrossRef]
- Houborg, R.; Fisher, J.; Skidmore, A. Advances in remote sensing of vegetation function and traits. Int. J. Appl. Earth Obs. Geoinf. 2015, 43, 1–6. [Google Scholar] [CrossRef] [Green Version]
- Moreno-Martínez, Á.; Camps-Valls, G.; Kattge, J.; Robinson, N.; Reichstein, M.; van Bodegom, P.; Kramer, K.; Cornelissen, J.H.C.; Reich, P.; Bahn, M.; et al. A methodology to derive global maps of leaf traits using remote sensing and climate data. Remote Sens. Environ. 2018, 218, 69–88. [Google Scholar] [CrossRef] [Green Version]
- Asner, G.P.; Martin, R.E.; Tupayachi, R.; Emerson, R.; Martinez, P.; Sinca, F.; Powell, G.V.; Wright, S.J.; Lugo, A.E. Taxonomy and remote sensing of leaf mass per area (LMA) in humid tropical forests. Ecol. Appl. 2011, 21, 85–98. [Google Scholar] [CrossRef]
- Colombo, R.; Meroni, M.; Marchesi, A.; Busetto, L.; Rossini, M.; Giardino, C.; Panigada, C. Estimation of leaf and canopy water content in poplar plantations by means of hyperspectral indices and inverse modeling. Remote Sens. Environ. 2008, 112, 1820–1834. [Google Scholar] [CrossRef]
- Feilhauer, H.; Asner, G.P.; Martin, R.E. Multi-method ensemble selection of spectral bands related to leaf biochemistry. Remote Sens. Environ. 2015, 164, 57–65. [Google Scholar] [CrossRef]
- Hinojo-Hinojo, C.; Goulden, M.L. Plant Traits Help Explain the Tight Relationship between Vegetation Indices and Gross Primary Production. Remote Sens. 2020, 12, 1405. [Google Scholar] [CrossRef]
- Sun, J.; Shi, S.; Yang, J.; Gong, W.; Qiu, F.; Wang, L.; Du, L.; Chen, B. Wavelength selection of the multispectral lidar system for estimating leaf chlorophyll and water contents through the PROSPECT model. Agric. For. Meteorol. 2019, 266, 43–52. [Google Scholar] [CrossRef]
- Yang, B.; He, Y.; Chen, W. A simple method for estimation of leaf dry matter content in fresh leaves using leaf scattering albedo. Glob. Ecol. Conserv. 2020, 23, e01201. [Google Scholar] [CrossRef]
- Conejo, E.; Frangi, J.-P.; De Rosny, G. Neural network implementation for a reversal procedure for water and dry matter estimation on plant leaves using selected LED wavelengths. Appl. Opt. 2015, 54, 5453–5460. [Google Scholar] [CrossRef]
- Curran, P.J.; Dungan, J.L.; Peterson, D.L. Estimating the foliar biochemical concentration of leaves with reflectance spectrometry: Testing the Kokaly and Clark methodologies. Remote Sens. Environ. 2001, 76, 349–359. [Google Scholar] [CrossRef]
- Jacquemoud, S.; Ustin, S.; Verdebout, J.; Schmuck, G.; Andreoli, G.; Hosgood, B. Estimating leaf biochemistry using the PROSPECT leaf optical properties model. Remote Sens. Environ. 1996, 56, 194–202. [Google Scholar] [CrossRef]
- Féret, J.-B.; le Maire, G.; Jay, S.; Berveiller, D.; Bendoula, R.; Hmimina, G.; Cheraiet, A.; Oliveira, J.C.; Ponzoni, F.J.; Solanki, T.; et al. Estimating leaf mass per area and equivalent water thickness based on leaf optical properties: Potential and limitations of physical modeling and machine learning. Remote Sens. Environ. 2018, 231, 110959. [Google Scholar] [CrossRef]
- Quan, X.; He, B.; Yebra, M.; Yin, C.; Liao, Z.; Li, X. Retrieval of forest fuel moisture content using a coupled radiative transfer model. Environ. Model. Softw. 2017, 95, 290–302. [Google Scholar] [CrossRef]
- Féret, J.-B.; François, C.; Gitelson, A.; Asner, G.P.; Barry, K.M.; Panigada, C.; Richardson, A.D.; Jacquemoud, S. Optimizing spectral indices and chemometric analysis of leaf chemical properties using radiative transfer modeling. Remote Sens. Environ. 2011, 115, 2742–2750. [Google Scholar] [CrossRef] [Green Version]
- Le Maire, G.; François, C.; Soudani, K.; Berveiller, D.; Pontailler, J.; Breda, N.; Genet, H.; Davi, H.; Dufrene, E. Calibration and validation of hyperspectral indices for the estimation of broadleaved forest leaf chlorophyll content, leaf mass per area, leaf area index and leaf canopy biomass. Remote Sens. Environ. 2008, 112, 3846–3864. [Google Scholar] [CrossRef]
- Wang, Q.; Li, P. Hyperspectral indices for estimating leaf biochemical properties in temperate deciduous forests: Comparison of simulated and measured reflectance data sets. Ecol. Indic. 2012, 14, 56–65. [Google Scholar] [CrossRef]
- Gitelson, A.A.; Keydan, G.P.; Merzlyak, M.N. Threeband model for noninvasive estimation of chlorophyll, carotenoids, and anthocyanin contents in higher plant leaves. Geophys. Res. Lett. 2006, 33. [Google Scholar] [CrossRef] [Green Version]
- Main, R.; Cho, M.A.; Mathieu, R.; O’Kennedy, M.M.; Ramoelo, A.; Koch, S. An investigation into robust spectral indices for leaf chlorophyll estimation. ISPRS J. Photogramm. Remote Sens. 2011, 66, 751–761. [Google Scholar] [CrossRef]
- Serbin, S.P.; Wu, J.; Ely, K.S.; Kruger, E.L.; Townsend, P.A.; Meng, R.; Wolfe, B.T.; Chlus, A.; Wang, Z.; Rogers, A. From the Arctic to the tropics: Multibiome prediction of leaf mass per area using leaf reflectance. New Phytol. 2019, 224, 1557–1568. [Google Scholar] [CrossRef]
- Allen, W.A.; Gausman, H.W.; Richardson, A.J.; Thomas, J.R. Interaction of Isotropic Light with a Compact Plant Leaf. J. Opt. Soc. Am. 1969, 59, 1376–1379. [Google Scholar] [CrossRef]
- Jacquemoud, S.; Baret, F. PROSPECT: A model of leaf optical properties spectra. Remote Sens. Environ. 1990, 34, 75–91. [Google Scholar] [CrossRef]
- Féret, J.-B.; Gitelson, A.; Noble, S.; Jacquemoud, S. PROSPECT-D: Towards modeling leaf optical properties through a complete lifecycle. Remote Sens. Environ. 2017, 193, 204–215. [Google Scholar] [CrossRef] [Green Version]
- Yang, J.; Yang, S.; Zhang, Y.; Shi, S.; Du, L. Improving characteristic band selection in leaf biochemical property estimation considering interrelations among biochemical parameters based on the PROSPECT-D model. Opt. Express 2021, 29, 400–414. [Google Scholar] [CrossRef] [PubMed]
- Hosgood, B.; Jacquemoud, S.; Andreoli, G.; Verdebout, J.; Pedrini, G.; Schmuck, G. Leaf Optical Properties Experiment 93 (LOPEX93); Report EUR 16095; Joint Research Centre, Institute for Remote Sensing Applications: Ispra, Italy, 1995. [Google Scholar]
- Chlus, A. Ecological Spectral Information System. Leaf Level Spectra and LMA for a Set of Trees, Forbs, Vines and Grasses Collected in Madison, WI. Data Set. 2016. Available online: http://ecosis.org (accessed on 1 January 2019).
- Cheng, T.; Rivard, B.; Sánchez-Azofeifa, A.G.; Féret, J.-B.; Jacquemoud, S.; Ustin, S.L. Deriving leaf mass per area (LMA) from foliar reflectance across a variety of plant species using continuous wavelet analysis. ISPRS J. Photogramm. Remote Sens. 2014, 87, 28–38. [Google Scholar] [CrossRef]
- Sims, D.A.; Gamon, J.A. Relationships between leaf pigment content and spectral reflectance across a wide range of species, leaf structures and developmental stages. Remote Sens. Environ. 2002, 81, 337–354. [Google Scholar] [CrossRef]
- Le Maire, G.; François, C.; Dufrêne, E. Towards universal broad leaf chlorophyll indices using PROSPECT simulated database and hyperspectral reflectance measurements. Remote Sens. Environ. 2004, 89, 1–28. [Google Scholar] [CrossRef]
- Cortes, C.; Vapnik, V. Support-vector networks. Mach. Learn. 1995, 20, 273–297. [Google Scholar] [CrossRef]
- Sun, J.; Yang, J.; Shi, S.; Chen, B.; Du, L.; Gong, W.; Song, S. Estimating Rice Leaf Nitrogen Concentration: Influence of Regression Algorithms Based on Passive and Active Leaf Reflectance. Remote Sens. 2017, 9, 951. [Google Scholar] [CrossRef] [Green Version]
- Geladi, P.; Kowalski, B.R. Partial least-squares regression: A tutorial. Anal. Chim. Acta 1986, 185, 1–17. [Google Scholar] [CrossRef]
- Koirala, B.; Zahiri, Z.; Scheunders, P. A Machine Learning Framework for Estimating Leaf Biochemical Parameters From Its Spectral Reflectance and Transmission Measurements. IEEE Trans. Geosci. Remote Sens. 2020, 58, 7393–7405. [Google Scholar] [CrossRef]
- Sun, J.; Shi, S.; Yang, J.; Du, L.; Gong, W.; Chen, B.; Song, S. Analyzing the performance of PROSPECT model inversion based on different spectral information for leaf biochemical properties retrieval. ISPRS J. Photogramm. Remote Sens. 2018, 135, 74–83. [Google Scholar] [CrossRef]
- Kattge, J.; Diaz, S.; Lavorel, S.; Prentice, I.C.; Leadley, P.; Bönisch, G.; Garnier, E.; Westoby, M.; Reich, P.B.; Wright, I.J. TRY—A global database of plant traits. Glob. Chang. Biol. 2011, 17, 2905–2935. [Google Scholar] [CrossRef]
- Paula, S.; Pausas, J.G. Leaf traits and resprouting ability in the Mediterranean basin. Funct. Ecol. 2006, 20, 941–947. [Google Scholar] [CrossRef]
- Wu, S.; Zeng, Y.; Hao, D.; Liu, Q.; Li, J.; Chen, X.; Asrar, G.R.; Yin, G.; Wen, J.; Yang, B.; et al. Quantifying leaf optical properties with spectral invariants theory. Remote Sens. Environ. 2020, 253, 112131. [Google Scholar] [CrossRef]
- Xu, M.; Liu, R.; Chen, J.M.; Liu, Y.; Shang, R.; Ju, W.; Wu, C.; Huang, W. Retrieving leaf chlorophyll content using a matrix-based vegetation index combination approach. Remote Sens. Environ. 2019, 224, 60–73. [Google Scholar] [CrossRef]
- Sun, J.; Xu, F.; Cervone, G.; Gervais, M.; Wauthier, C.; Salvador, M. Automatic atmospheric correction for shortwave hyperspectral remote sensing data using a time-dependent deep neural network. ISPRS J. Photogramm. Remote Sens. 2021, 174, 117–131. [Google Scholar] [CrossRef]
- Gao, B.-C.; Davis, C.; Goetz, A. A review of atmospheric correction techniques for hyperspectral remote sensing of land surfaces and ocean color. IEEE Int. Symp. Geosci. Remote Sens. 2006, 1979–1981. [Google Scholar] [CrossRef]
- Ali, A.M.; Darvishzadeh, R.; Skidmore, A.; Duren, I.v. Effects of Canopy Structural Variables on Retrieval of Leaf Dry Matter Content and Specific Leaf Area From Remotely Sensed Data. IEEE J. Sel. Top. Appl. Earth Obs. Remote Sens. 2016, 9, 898–909. [Google Scholar] [CrossRef]
- Cheng, T.; Song, R.; Li, D.; Zhou, K.; Zheng, H.; Yao, X.; Tian, Y.; Cao, W.; Zhu, Y. Spectroscopic Estimation of Biomass in Canopy Components of Paddy Rice Using Dry Matter and Chlorophyll Indices. Remote Sens. 2017, 9, 319. [Google Scholar] [CrossRef] [Green Version]


| Title 1 | Min | Max | Mean | STD |
|---|---|---|---|---|
| N | 1 | 3.5 | 1.6 | 0.3 |
| Cab (μg/cm2) | 0 | 110 | 32.81 | 18.87 |
| Car (μg/cm2) | 0 | 30 | 8.51 | 3.92 |
| EWT (g/cm2) | 0 | 0.07 | 0.0115 | 0.007 |
| LMA (g/cm2) | 0.001 | 0.04 | 0.01 | 0.07 |
| Index | Index ID | Formula | Reference |
|---|---|---|---|
| Modified simple ratio-type index | MSR | [28,40] | |
| Normalized difference-type index | ND | [27,39] | |
| Single reflectivity-type index | R2300 | [28] |
| Index | Index ID | Formula | Reference |
|---|---|---|---|
| Difference-type index | D | [28] | |
| Modified normalized difference-type index | MND | [28,41] | |
| Single reflectivity-type index | R1800 | [32] |
| VI or Matrix | Synthetic Dataset E | ||
|---|---|---|---|
| R2 | RMSE (g/cm2) | NRMSE (%) | |
| MSR | 0.71 | 0.0040 | 13.2 |
| ND | 0.85 | 0.0022 | 7.3 |
| R2300 | 0.39 | 0.0044 | 14.6 |
| MSR-ND | 0.91 | 0.0017 | 5.6 |
| MSR-R2300 | 0.93 | 0.0015 | 5.0 |
| ND-R2300 | 0.98 | 0.0008 | 2.6 |
| MSR-ND-R2300 | 0.99 | 0.0005 | 1.7 |
| VI or Matrix | Synthetic Dataset E | ||
|---|---|---|---|
| R2 | RMSE (g/cm2) | NRMSE (%) | |
| R1800 | 0.20 | 0.0051 | 16.9 |
| MND | 0.69 | 0.0032 | 10.6 |
| D | 0.57 | 0.0037 | 12.3 |
| R1800-MND | 0.91 | 0.0017 | 5.6 |
| R1800-D | 0.82 | 0.0024 | 7.9 |
| MND-D | 0.95 | 0.0013 | 4.3 |
| R1800-MND-D | 0.99 | 0.0006 | 2.0 |
| VI or Matrix or ML | MA | LOPEX | POOLED | ||||||
|---|---|---|---|---|---|---|---|---|---|
| R2 | RMSE | NRMSE | R2 | RMSE | NRMSE | R2 | RMSE | NRMSE | |
| MSR | 0.69 | 0.0030 | 20.1 | 0.45 | 0.0025 | 17.9 | 0.59 | 0.0029 | 17.9 |
| ND | 0.79 | 0.0019 | 12.8 | 0.56 | 0.0025 | 17.9 | 0.68 | 0.0020 | 12.3 |
| R2300 | 0.36 | 0.0024 | 16.1 | 0.14 | 0.0040 | 28.6 | 0.26 | 0.0028 | 17.3 |
| MSR-ND | 0.49 | 0.0030 | 20.1 | 0.41 | 0.0024 | 17.1 | 0.45 | 0.0029 | 17.9 |
| MSR-R2300 | 0.70 | 0.0021 | 14.1 | 0.48 | 0.0019 | 13.6 | 0.62 | 0.0021 | 13.0 |
| ND-R2300 | 0.84 | 0.0023 | 15.4 | 0.73 | 0.0026 | 18.6 | 0.76 | 0.0024 | 14.8 |
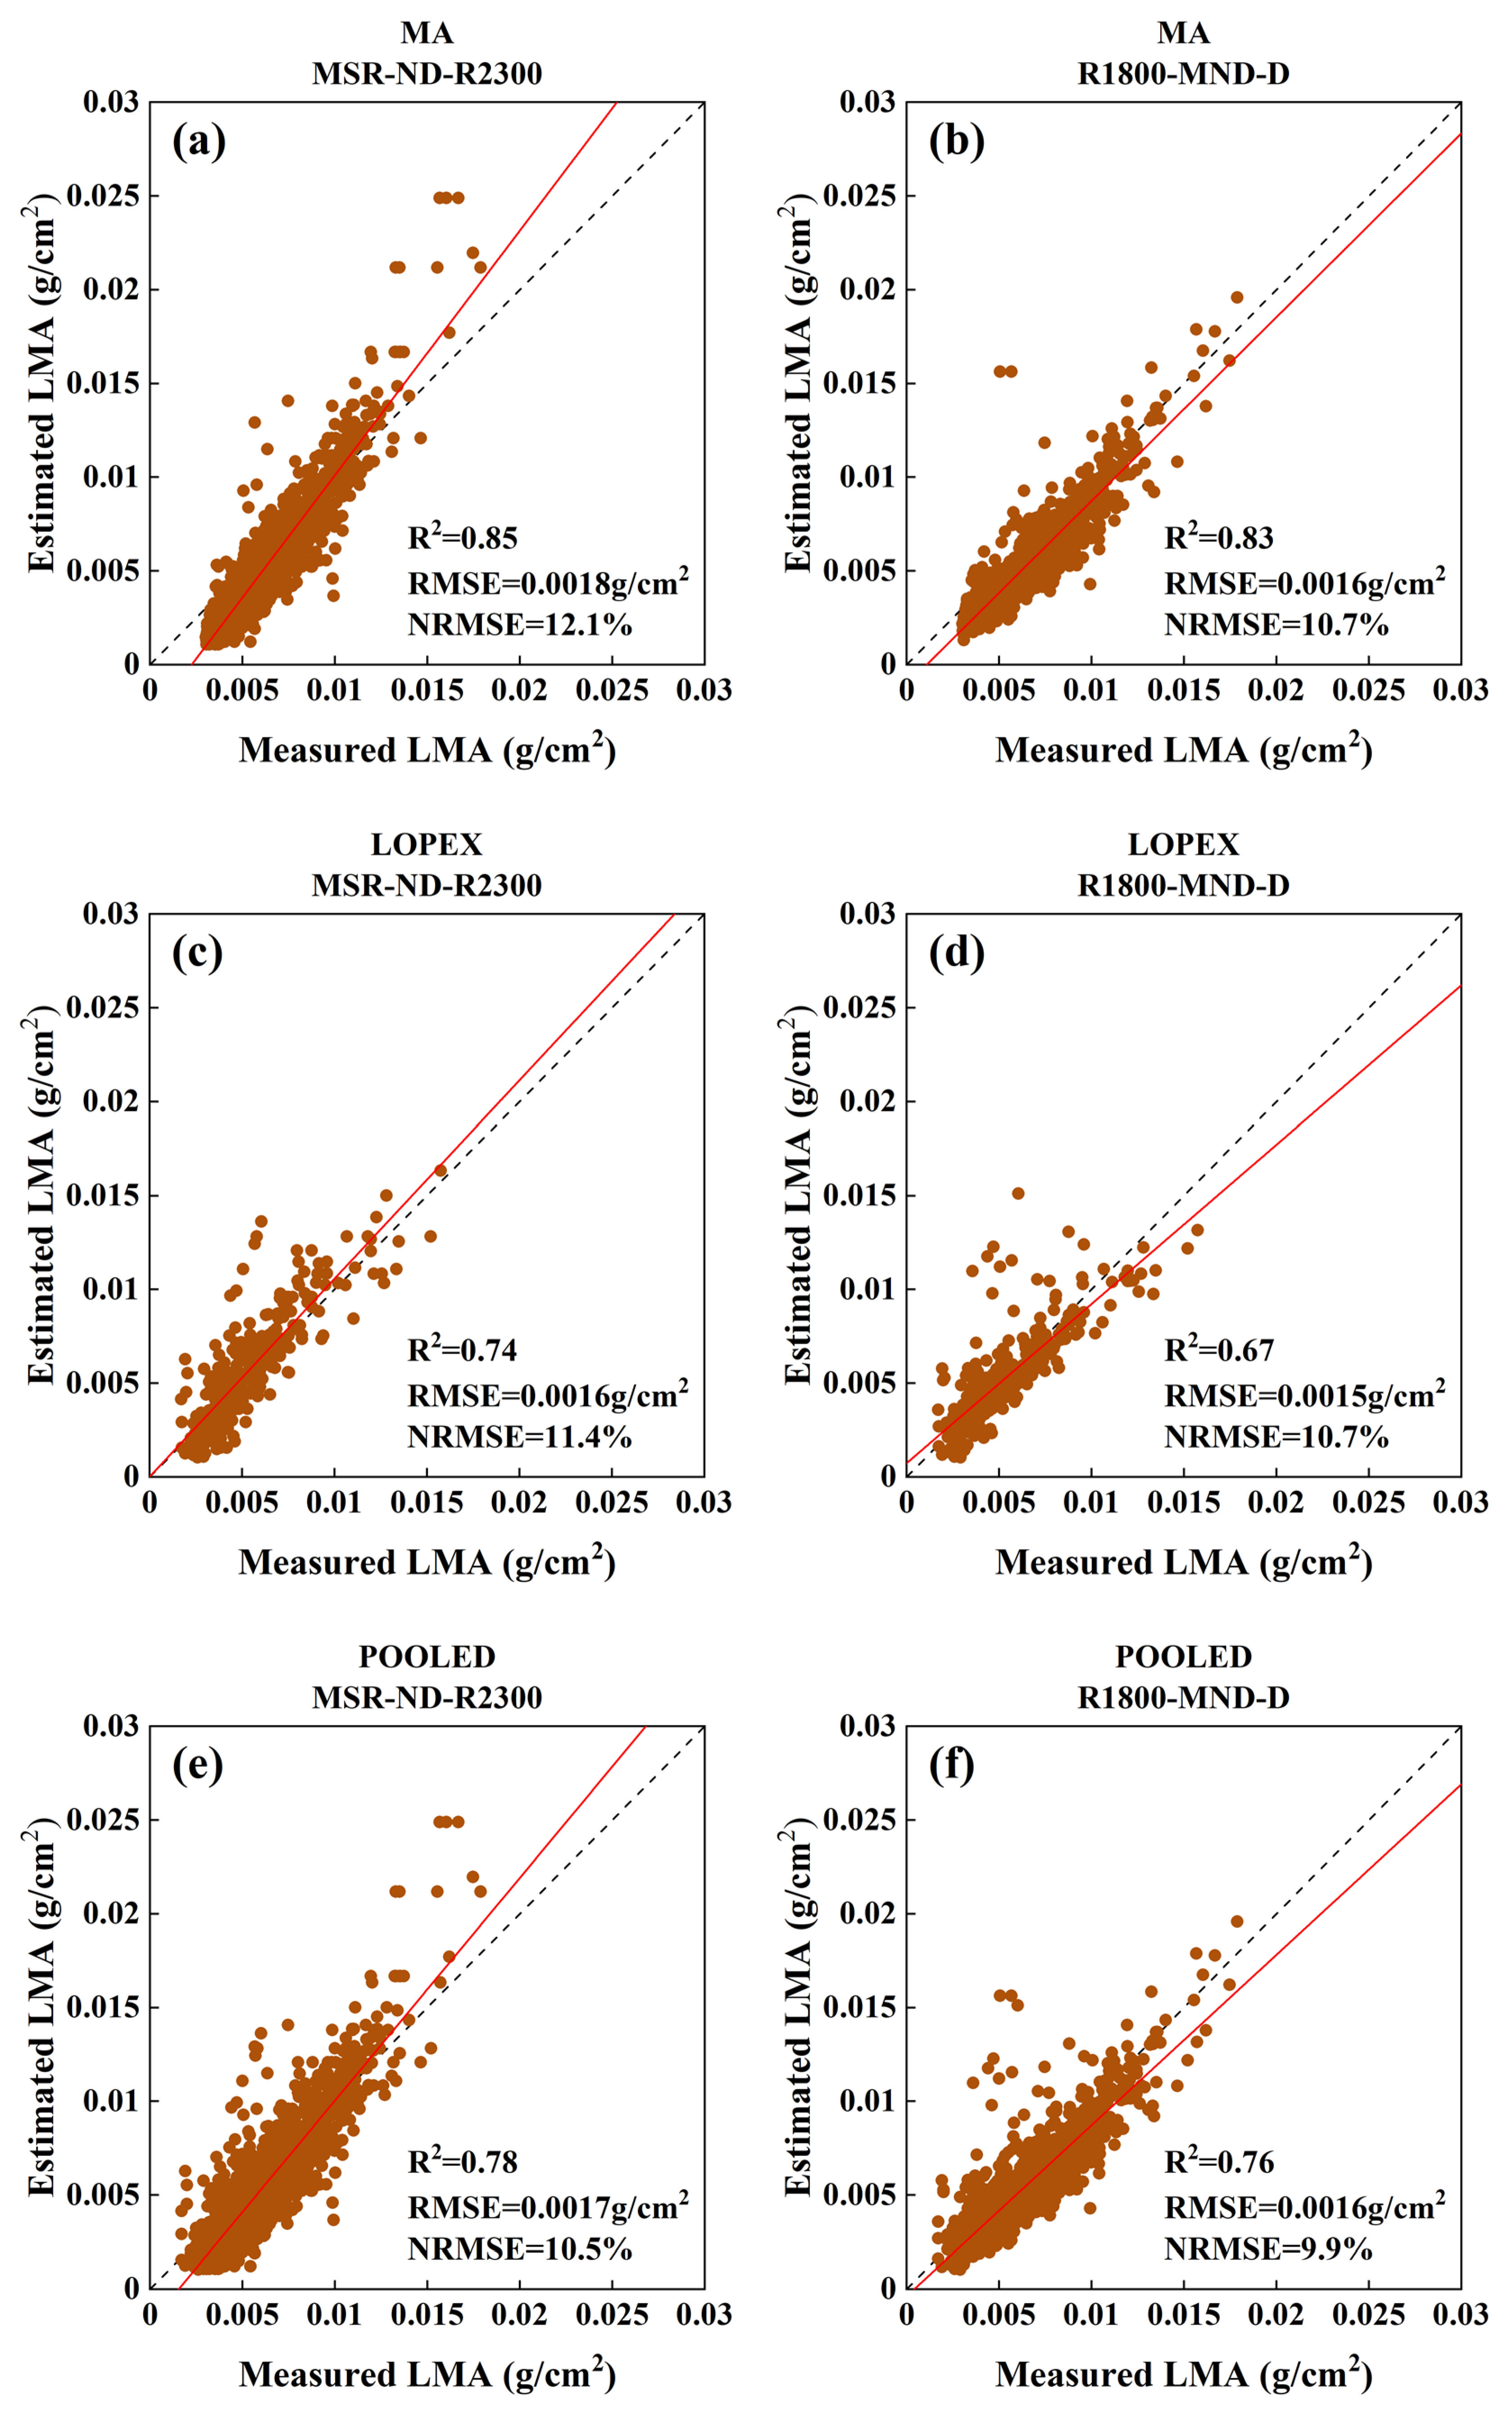
| MSR-ND-R2300 | 0.85 | 0.0018 | 12.1 | 0.74 | 0.0016 | 11.4 | 0.78 | 0.0017 | 10.5 |
| SVM | 0.81 | 0.0022 | 14.8 | 0.69 | 0.0023 | 16.4 | 0.73 | 0.0022 | 13.6 |
| PLSR | 0.82 | 0.0020 | 13.5 | 0.69 | 0.0022 | 15.7 | 0.74 | 0.0021 | 13.0 |
| VI or Matrix or ML | MA | LOPEX | POOLED | ||||||
|---|---|---|---|---|---|---|---|---|---|
| R2 | RMSE | NRMSE | R2 | RMSE | NRMSE | R2 | RMSE | NRMSE | |
| R1800 | 0.09 | 0.0041 | 27.5 | 0.03 | 0.0054 | 38.6 | 0.07 | 0.0044 | 27.2 |
| MND | 0.72 | 0.0021 | 14.1 | 0.47 | 0.0022 | 15.7 | 0.62 | 0.0021 | 13.0 |
| D | 0.40 | 0.0019 | 12.8 | 0.28 | 0.0024 | 17.1 | 0.36 | 0.0020 | 12.3 |
| R1800-MND | 0.81 | 0.0019 | 12.8 | 0.61 | 0.0017 | 12.1 | 0.73 | 0.0018 | 11.1 |
| R1800-D | 0.51 | 0.0017 | 11.4 | 0.41 | 0.0020 | 14.3 | 0.48 | 0.0018 | 11.1 |
| MND-D | 0.65 | 0.0022 | 14.8 | 0.46 | 0.0022 | 15.7 | 0.57 | 0.0022 | 13.6 |
| R1800-MND-D | 0.83 | 0.0016 | 10.7 | 0.67 | 0.0015 | 10.7 | 0.76 | 0.0016 | 9.9 |
| SVM | 0.68 | 0.0036 | 24.1 | 0.39 | 0.0038 | 27.1 | 0.57 | 0.0036 | 22.3 |
| PLSR | 0.66 | 0.0031 | 20.7 | 0.37 | 0.0036 | 25.7 | 0.55 | 0.0032 | 19.8 |
Publisher’s Note: MDPI stays neutral with regard to jurisdictional claims in published maps and institutional affiliations. |
© 2021 by the authors. Licensee MDPI, Basel, Switzerland. This article is an open access article distributed under the terms and conditions of the Creative Commons Attribution (CC BY) license (https://creativecommons.org/licenses/by/4.0/).
Share and Cite
Chen, Y.; Sun, J.; Wang, L.; Shi, S.; Gong, W.; Wang, S.; Tagesson, T. Optimized Estimation of Leaf Mass per Area with a 3D Matrix of Vegetation Indices. Remote Sens. 2021, 13, 3761. https://doi.org/10.3390/rs13183761
Chen Y, Sun J, Wang L, Shi S, Gong W, Wang S, Tagesson T. Optimized Estimation of Leaf Mass per Area with a 3D Matrix of Vegetation Indices. Remote Sensing. 2021; 13(18):3761. https://doi.org/10.3390/rs13183761
Chicago/Turabian StyleChen, Yuwen, Jia Sun, Lunche Wang, Shuo Shi, Wei Gong, Shaoqiang Wang, and Torbern Tagesson. 2021. "Optimized Estimation of Leaf Mass per Area with a 3D Matrix of Vegetation Indices" Remote Sensing 13, no. 18: 3761. https://doi.org/10.3390/rs13183761
APA StyleChen, Y., Sun, J., Wang, L., Shi, S., Gong, W., Wang, S., & Tagesson, T. (2021). Optimized Estimation of Leaf Mass per Area with a 3D Matrix of Vegetation Indices. Remote Sensing, 13(18), 3761. https://doi.org/10.3390/rs13183761