1. Introduction
With the development of modern remote sensing technology, a large number of remote sensing images with higher spatial resolution and richer content have been produced [
1,
2,
3,
4]. Object detection in remote sensing images has broad application prospects in many fields, such as environmental monitoring [
5,
6,
7], disaster control [
8,
9], infrared detection [
10,
11], and the military. Benefiting from deep convolutional neural networks, considerable results have been achieved for the object detection task in natural images. However, due to the complex background, variable object scales, arbitrary orientations and shooting angles, object detection in aerial images is still a hot topic in the field of computer vision [
12,
13,
14,
15,
16].
Compared with natural image datasets [
17,
18], remote sensing image detection mainly faces the following differences and challenges (Illustrated in
Figure 1):
Low overlap and Densely arranged. Remote sensing images are usually captured by satellite, radar, and so on, from a vertical view. Unlike object detection for natural images, where overlap between objects is typically present, the rotated objects in remote sensing images have a low probability of overlapping each other, especially for objects in the same category. Furthermore, objects usually appear in densely arranged forms in some categories, such as ships and vehicles, which leads to difficulties for the detector to distinguish between adjacent objects;
Arbitrary orientations. Objects usually appear in the image with various directions. Compared to the widely used horizontal bounding boxes (HBBs) in natural image detection, oriented bounding boxes (OBBs) can better depict objects with arbitrary orientations and aspect ratios than horizontal bounding boxes in remote sensing images. This not only requires the detector to correctly locate and classify the object of interest, but also to accurately predict its direction;
Complex background and Drastic scale changes. Compared to natural images, remote sensing images have higher resolution, with more complex and variable backgrounds. A lot of objects to be detected are easily submerged in the background, which requires the detector to be effectively focused on areas of interest. Meanwhile, the scales of objects vary drastically in remote sensing images; for example, some vehicles and bridges are only within a few pixels, while soccer fields can comprise thousands of pixels in aerial images.
The above difficulties make remote sensing image detection more challenging and attractive, while requiring natural image object detection methods to be adapted to rotated objects. However, most rotated object detectors place multiple anchors per location to get a higher IoU between pre-set anchors and object bounding boxes. Dense anchors ensure the performance of the rotation detectors while having a higher computational burden. Can these anchors be discarded in the rotated object detection process, in order to improve the computational efficiency and simplify the design of the model? We find that one major difference between remote sensing images and natural images is the small probability of overlap between objects having the same category. So, the large overlap between adjacent objects per location is rare in this situation, especially when using oriented bounding boxes to represent the rotated objects. Therefore, we hope the network could directly predict the classification and regression information of the rotated object from the corresponding position, such as an object center, which can improve the overall efficiency of the detector and avoid the need for manual designs of the anchors. Meanwhile, the networks need to have robust feature extraction capabilities for objects with drastic scale changes and accurately predict the orientation of rotated objects.
To discard anchors in the detection process, we convert the rotation object detection problem into a center point prediction problem. First, we represent an oriented object by the center of its oriented bounding box. The network learns a center probability map to localize the object’s center through use of a modulated focal loss. Then, inspired by [
19], we use the circular smooth label to learn the object’s direction, in order to accurately predict the angle of an object and avoid regression errors due to angular periodicity at the boundary. A parallel bounding-box height and width prediction branch is used to predict the object’s size in a multi-task learning manner. Therefore, we can detect the oriented objects in an anchor-free way.
Further, to accurately localize the object center under drastic scale changes and various object orientations, a deformable feature pyramid network (Deformable-FPN) is proposed, in order to further fuse the multi-level features. Specifically, deformable convolution [
20,
21] is used to reduce the feature channels and project the features simultaneously. After mixing the adjacent-level features using an add operation, we perform another deformable convolution to reduce the aliasing effect of the add operation. By constructing the FPN in a deformable manner, the convolution kernel can be adaptively adjusted, according to the scale and direction of the object. Experiments show that our Deformable-FPN can bring significant improvements to detecting objects in remote sensing images, compared to FPN.
In summary, the main contributions of this paper are as follows:
We analyze that one major difference between remote sensing images and natural images is the small probability of overlap between objects with the same category and, based on the analysis, propose a center point-based arbitrary-oriented object detector without pre-set anchors;
We design a deformable feature pyramid network to fuse the multi-level features for rotated objects, which can get a better feature representation for accurately localizing the object center;
We carry out experiments on two remote sensing benchmarks—the DOTA and HRSC2016 datasets—to demonstrate the effectiveness of our approach. Specifically, our center point-based arbitrary-oriented object detector achieves 74.75% mAP on DOTA and 96.59% on HRSC2016 with a single-stage model, single-scale training, and testing.
The remainder of this paper is organized as follows.
Section 2 first describes the related works.
Section 3 provides a detailed description of the proposed method, including center-point based arbitrary-oriented object detector and Deformable-FPN. The experiment results and settings are provided in
Section 4 and discussed in
Section 5. Finally,
Section 6 summarizes this paper and presents our conclusions.
2. Related Work
2.1. Object Detection in Natural Images
In recent years, horizontal object detection algorithms in natural image datasets, such as MSCOCO [
17] and PASCAL VOC [
18], have achieved promising progress. We classify them as follows:
Anchor-based Horizontal Object Detectors: Most region-based two-stage methods [
22,
23,
24,
25,
26] first generate category-agnostic region proposals from the original image, then use category-specific classifiers and regressors to classify and localize the objects from the proposals. Considering their efficiency, single-stage detectors have drawn more and more attention from researchers. Single-stage methods perform bounding box (bbox) regression and classification simultaneously, such as SSD [
27], YOLO [
28,
29,
30], RetinaNet [
31], and so on [
32,
33,
34,
35]. The above methods densely place a series of prior boxes (Anchors) with different scales and aspect ratios on the image. Multiple anchors per location are needed to cover the objects as much as possible, and classification and location refinement are performed based on these pre-set anchors.
Anchor-free Horizontal Object Detectors: Researchers have also designed some comparable detectors without complex pre-set anchors, which are inspiring to the detection process. CornerNet [
36] detects an object bounding box as a pair of keypoints, demonstrating the effectiveness of anchor-free object detection. Further, CenterNet [
37] models an object as a single point, then regresses the bbox parameters from this point. Based on RetinaNet [
31], FCOS [
38] abandoned the pre-set anchors and directly predicts the distance from a reference point to four bbox boundaries. All of these methods have achieved great performance and have avoided the use of hyper-parameters related to anchor boxes, as well as complicated calculations such as intersection over union (IoU) between bboxes during training.
2.2. Object Detection in Remote Sensing Images
Object detection also has a wide range of applications in remote sensing images. Reggiannini et al. [
5] designed a sea surveillance system to detect and identify illegal maritime traffic. Almulihi et al. [
7] propose a statistical framework based on gamma distributions and demonstrate the effectiveness for oil spill detection in SAR images. Zhang et al. [
8] analyze the frequency properties of motions to detect living people in disaster areas. In [
10], a difference maximum loss function is used to guide the learning directions of the networks for infrared and visible image object detection.
Based on the fact that rotation detectors are needed for remote sensing images, many excellent rotated object detectors [
19,
39,
40,
41,
42,
43,
44,
45,
46] have been developed from horizontal detection methods. RRPN [
39] sets rotating anchors to obtain better region proposals. R-DFPN [
47] propose a rotation dense feature pyramid network to solve the narrow width problems of the ship, which can effectively detect ships in different scenes. Yang et al. [
19] converted an angle regression problem to a classification problem and handled the periodicity of the angle by using circular smooth label (CSL). Due to the complex background, drastic scale changes, and various object orientations problems, multi-stage rotation detectors [
41,
42,
43] have been widely used.
3. Method
In this section, we first introduce the overall architecture of our proposed center point-based arbitrary-oriented object detector. Then, we detail how to localize the object’s center and predict the corresponding angle and size. Finally, the detailed structure of Deformable-FPN is introduced.
3.1. Overall Architecture
The overall architecture of our methods, based on [
37], is illustrated in
Figure 2. ResNet [
48] is used as our backbone, in order to extract multi-level feature maps (denoted as
). Then, these features are sent to deformable feature pyramid networks to obtain a high-resolution, strong semantic feature map,
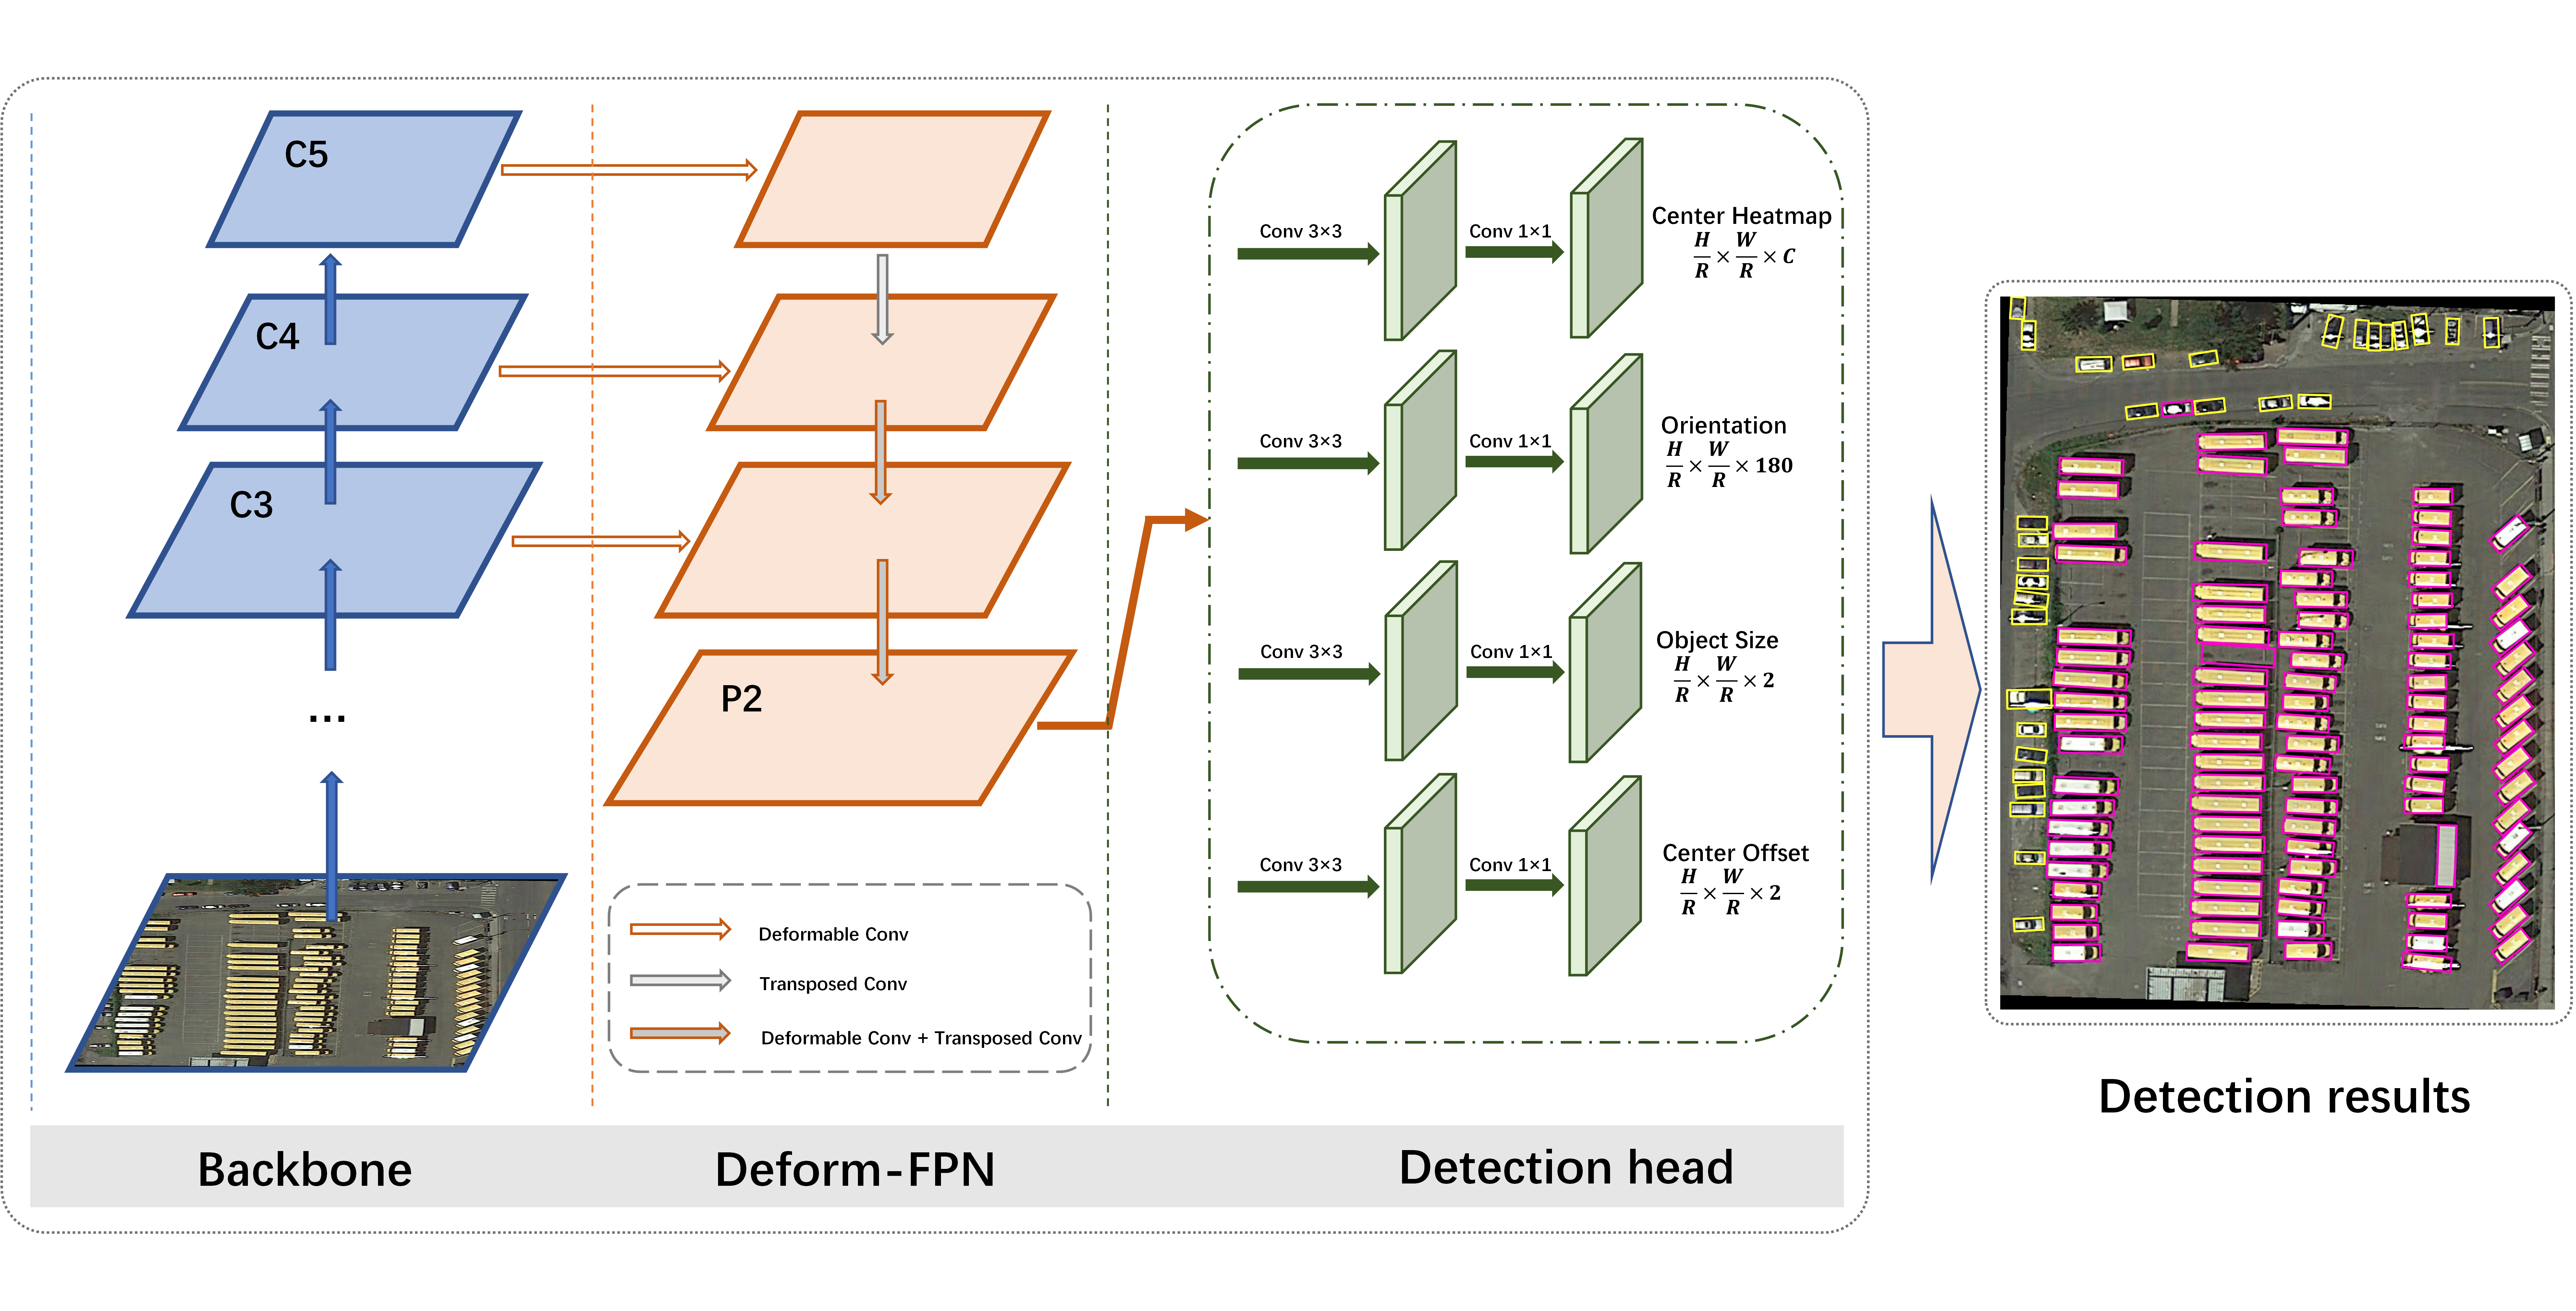
, which is responsible for the following detection task. Finally, four parallel sub-networks are used to predict the relevant parameters of the oriented bounding boxes. Specifically, the Center Heatmap branch is used to predict the center probability, for localizing the object’s center. A refined position of the center is obtained from the Center offset branch. The Orientation branch is responsible for predicting the object’s direction by using the Circular Smooth Label, and the corresponding height and width are obtained from the Object size branch.
3.2. Detecting Arbitrary-Oriented Object by Its Center Point
3.2.1. Center Point Localization
Let
W and
H be the width and height of the input image. We aim to let the network predict a category-specific center point heatmap
, based on the features extracted from the backbone, where
R is the stride between the input and feature
(as shown in
Figure 2), and
C is the number of object categories (
in DOTA, 1 in HRSC2016).
R was set to four, following [
37]. The predicted value
denotes a detected center point of the object, while
denotes background.
We followed [
36,
37] to train the center prediction networks. Specifically, for each object’s center
of class
c, a ground-truth positive location
is responsible for predicting it, and all other locations are negative. During training, equally penalizing negative locations can severely degrade the performance of the network; this is because, if a negative location is close to the corresponding ground-truth positive location, it can still represent the center of the object within a certain error range. Thus, simply dividing it as a negative sample will increase the difficulty of learning object centers. So, we alleviated the penalty for negative locations within a radius of the positive location. This radius,
r, is determined by the object size in an adaptive manner: a pair of diagonal points within the radius can generate a bounding box exceeding a certain Intersection over Union (IoU) with the ground-truth box; the IoU threshold is set to 0.5 in this work. Finally, the ground-truth heatmap
used to reduce the penalty is generated as follows: We split all ground truth center points into
Y and pass them through the Gaussian kernel
:
We use the element-wise maximum operation if two Gaussians of the same class overlap. The loss function for center point prediction is a variant of focal loss [
31], formulized as:
where
N is the total number of objects in the image, and
and
are the hyperparameters controlling the contribution of each point (
and
, by default, following [
37]).
As the predicted
has a stride of
R with the input image, the center point position obtained by
will inevitably have quantization error. Thus, a Center offset branch was introduced to eliminate this error. The model predicts
, in order to refine the object’s center. For each object’s center
, smooth L1 loss [
26] is used during training:
Then, combining and , we can accurately locate the object’s center.
3.2.2. Angle Prediction for Oriented Objects
In this section, we first introduce the five-parameter long side-based representation for oriented objects and analyze the angular boundary discontinuity problem. Then, we detail the circular smooth label, in order to solve the boundary discontinuity problem and predict the angles of oriented objects.
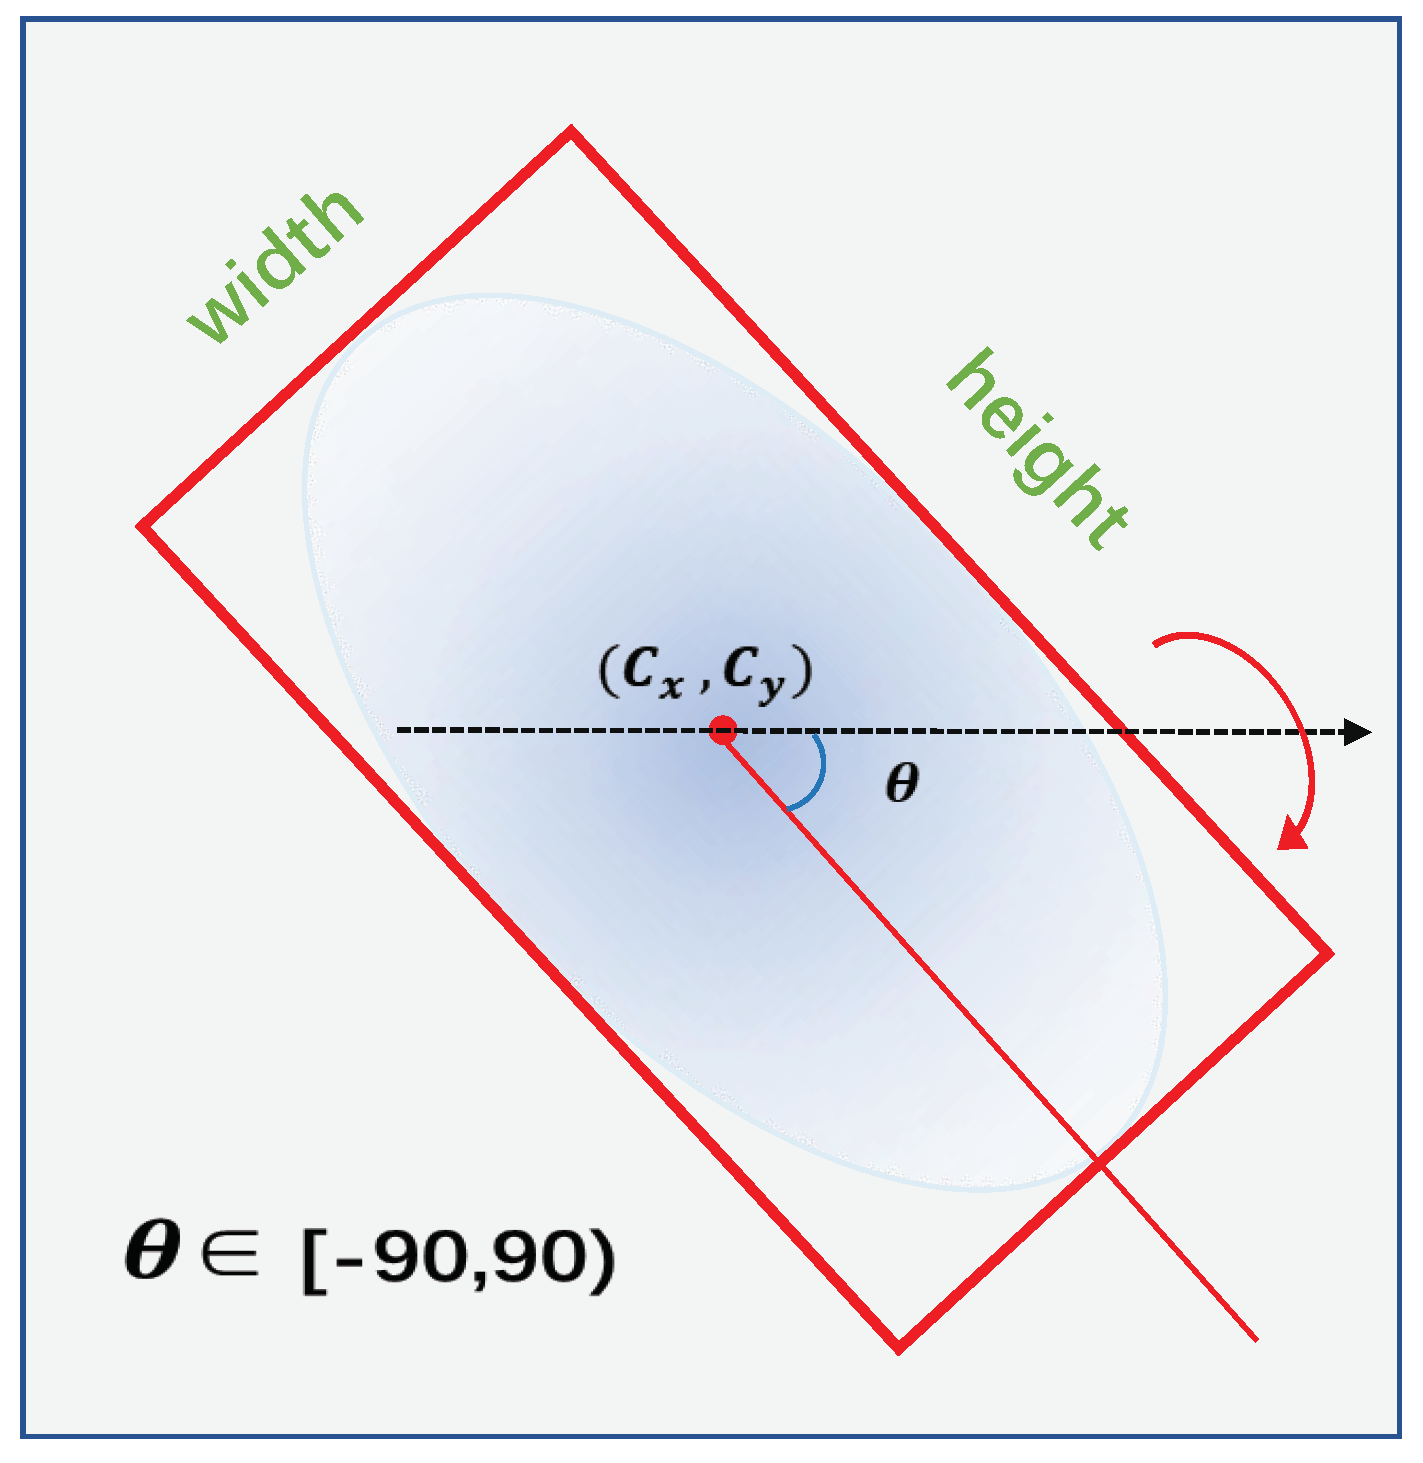
Representations for Oriented Objects. As we discussed in
Section 1, the use of oriented bounding boxes can better depict objects in remote sensing images. We use five-parameter long side-based methods to represent the oriented objects. As shown in
Figure 3, five parameters
were used to represent an OBB, where
h represents the long side of the bounding box, the other side is referred to as
w, and
is the angle between the long side and x-axis, with a
range. Compared to the HBB, OBB needs an extra parameter,
, to represent the direction information.
As there are generally various angles of an object in remote sensing images, accurately predicting the direction is important, especially for objects with large aspect ratios. Due to the periodicity of the angle, directly regressing the angle
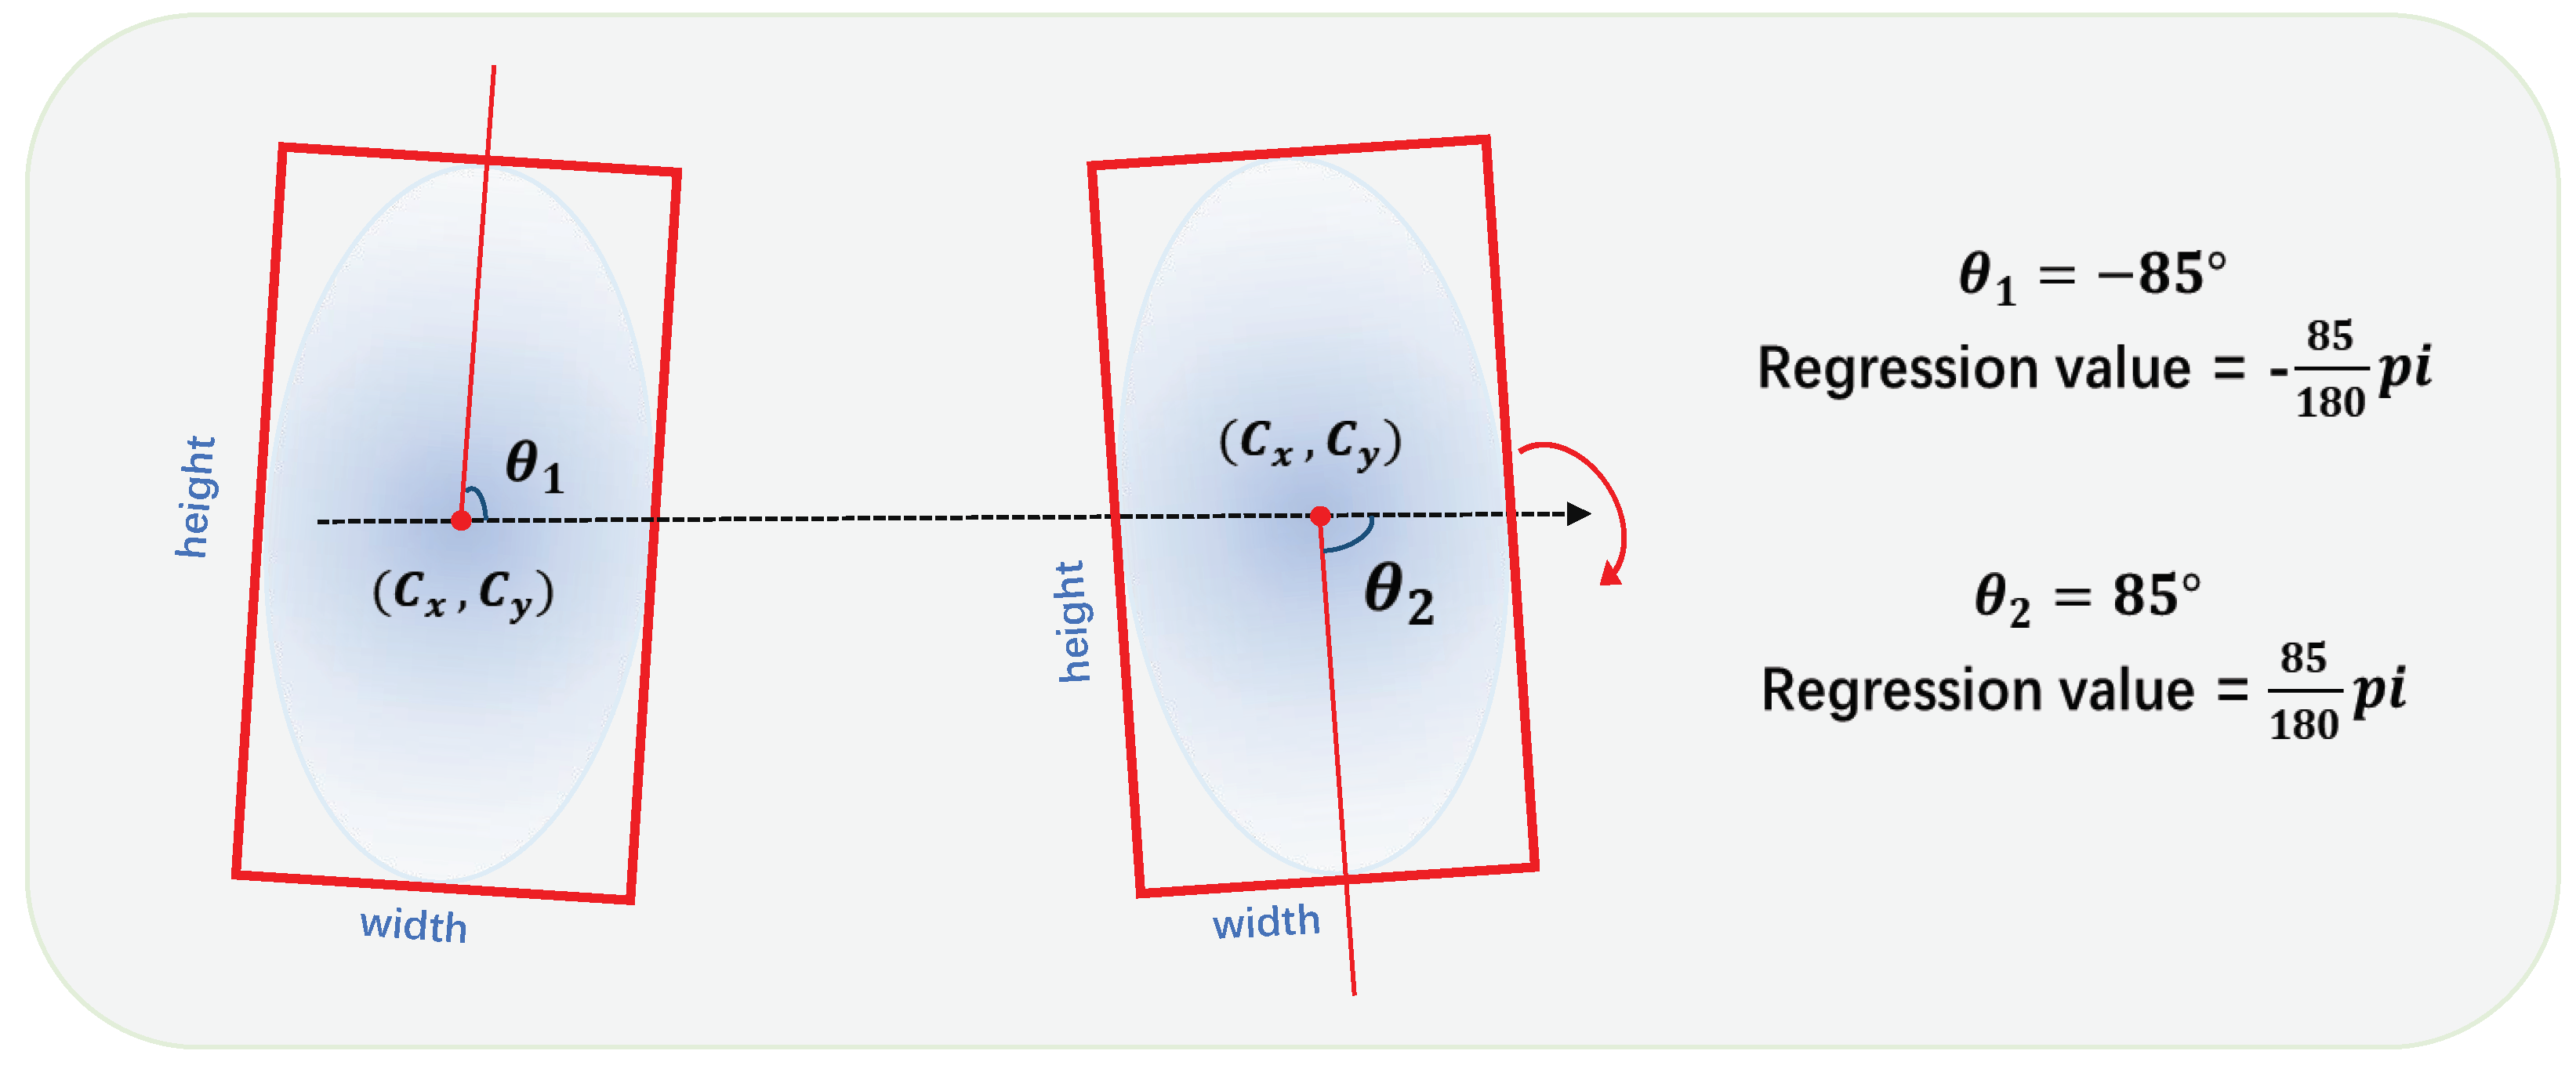
may lead to the boundary discontinuity problem, resulting in a large loss value during training. As illustrated in
Figure 4, two oriented objects can have relatively similar directions while crossing the angular boundary, resulting in a large difference between regression values. This discontinuous boundary can interfere with the network’s learning of the object direction and, thus, degrade the model’s performance.
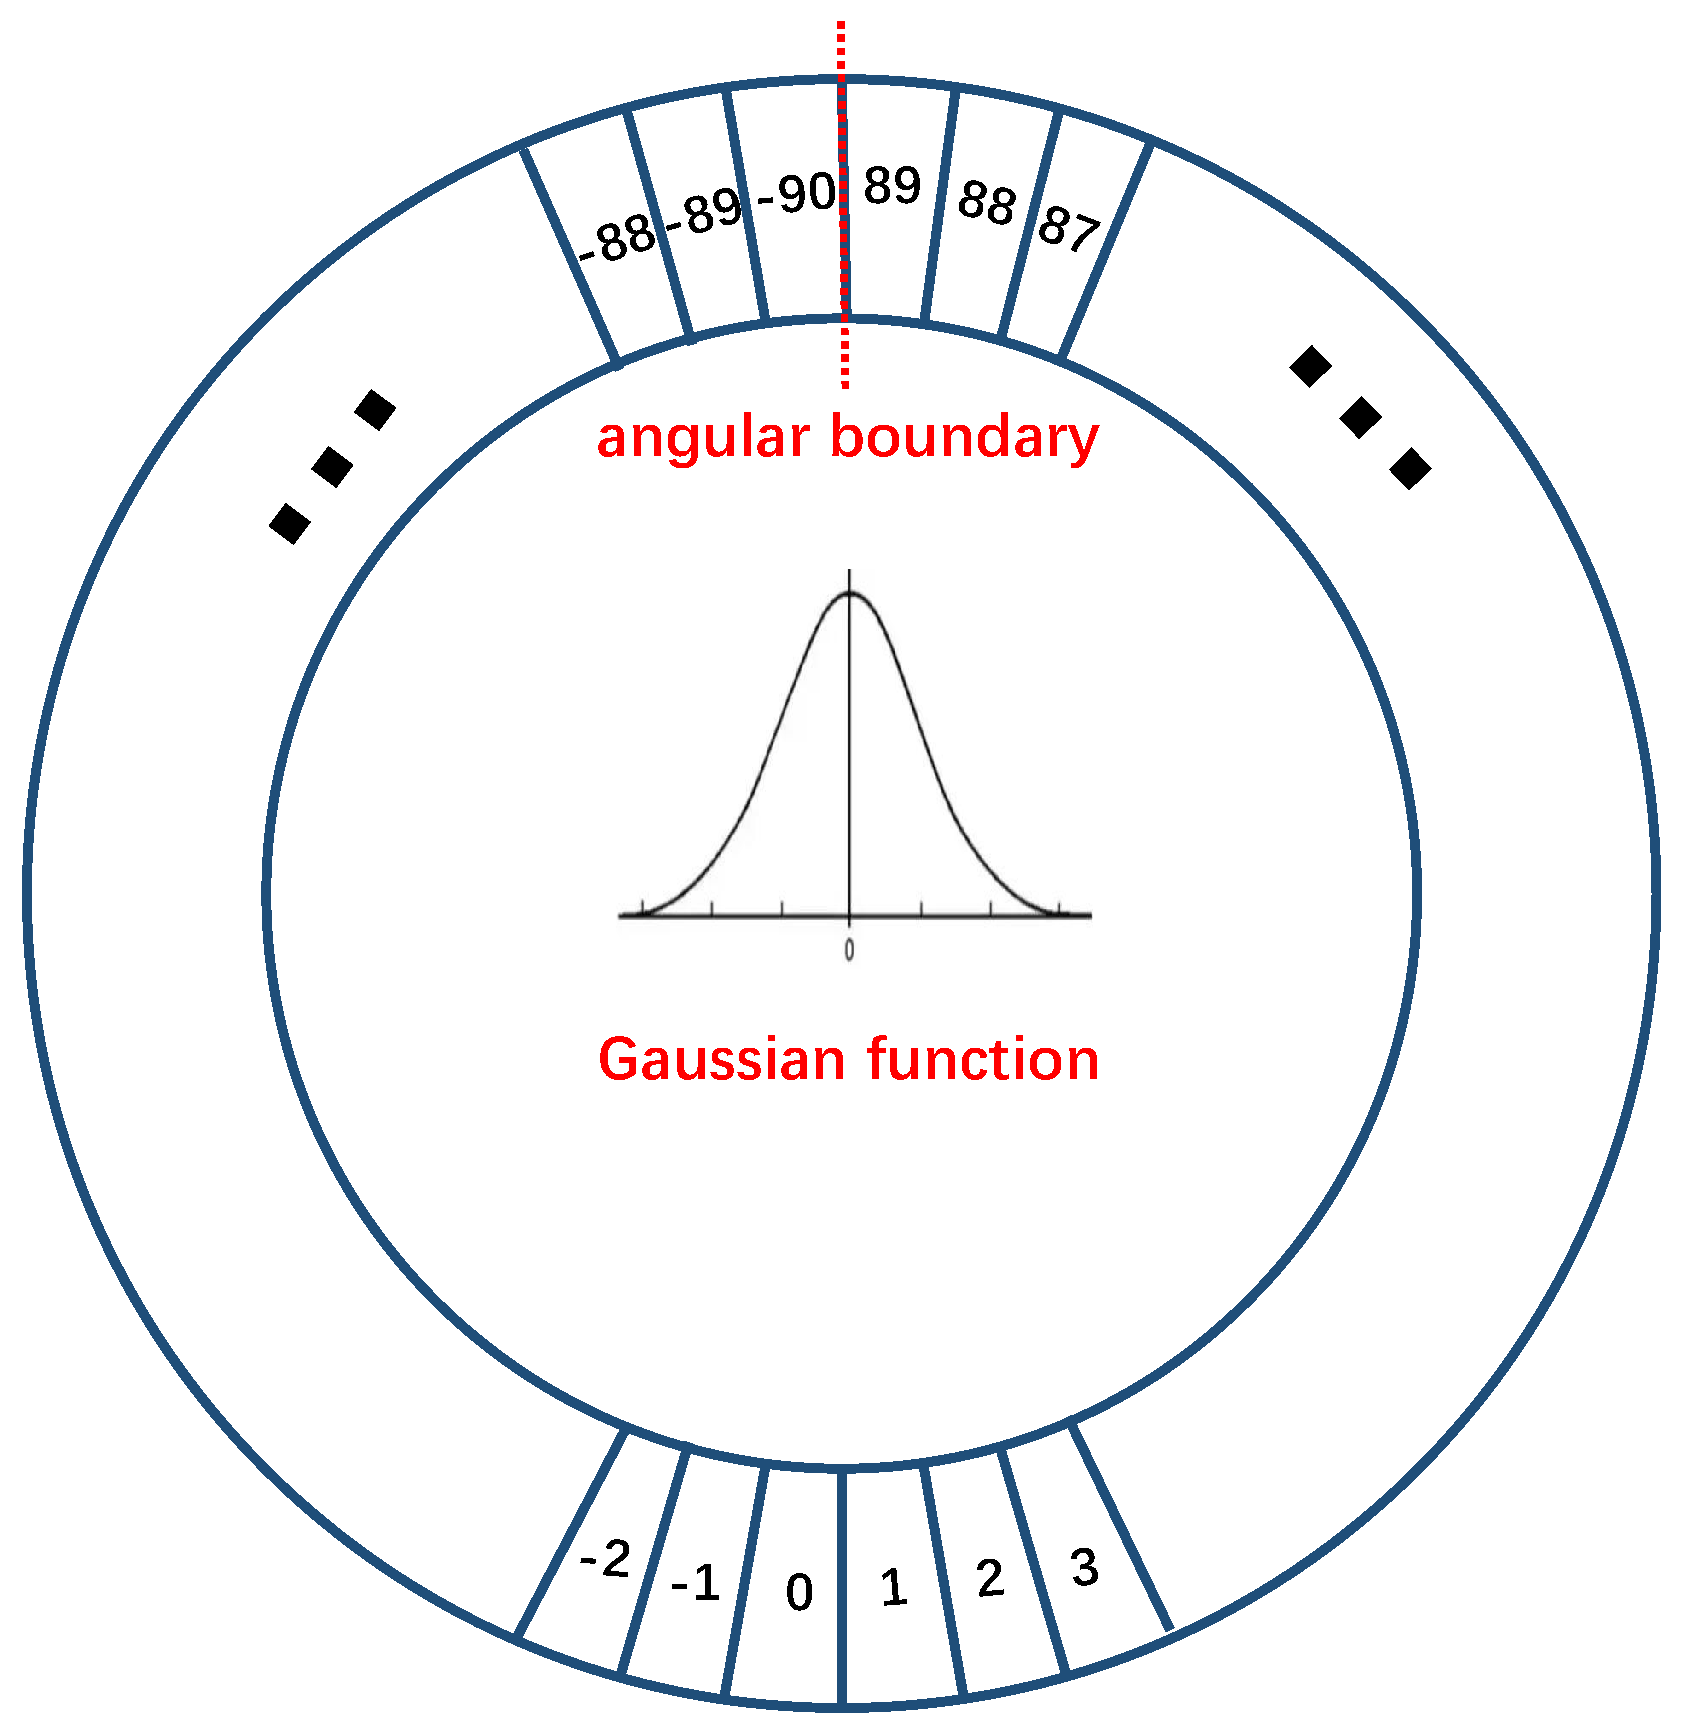
Circular Smooth Label. Following [
19], we convert the angle regression problem into a classification problem. As the five-parameter long side-based representation has
angle range, each
degree interval is referred to a category, which results in 180 categories in total. Then, the one-hot angle label passes through a periodic function, followed by a Gaussian function to smooth the label, formulized as:
where
is the Gaussian function, which satisfies
; and
is the radius of the Gaussian function, which controls the smoothing degree of the angle label. For example, when
, the Gaussian function becomes to pulse function and the CSL degrades into the one-hot label. We illustrate the CSL in
Figure 5.
The loss function for the CSL is not the commonly used Softmax Cross-Entropy loss; as we use a smooth label, Sigmoid Binary Cross-Entropy is used to train the angle prediction network. Specifically, the model predicts
for an input image, and the loss function is:
where
is the circular smooth label for object
p in the image.
3.2.3. Prediction of Object Size
We have that
represents the OBBs, using the center location and direction of each object obtained in
Section 3.2.1 and
Section 3.2.2. The rest (i.e., the long side
h and short side
w) are predicted through the Object size branch shown in
Figure 2. The model outputs
for the object size. For each object
p, with corresponding size label
, smooth L1 loss is used:
Note that the smooth L1 loss used in this paper is (
by default):
The overall training objective for our arbitrary-oriented object detector is:
where
,
, and
are used to balance the weighting between different tasks. In this paper,
,
, and
are set to 0.5, 1, and 1, respectively.
3.3. Feature Enhancement by Deformable FPN
We aim to better localize the object’s center and corresponding direction by building a pyramidal feature hierarchy on the network’s output features. The feature maps extracted by the backbone are referred to as
,
, and
, shown in
Figure 2. These feature maps have different spatial resolutions and large semantic gaps. Low-resolution maps have strong semantic information, which has great representational capacity for object detection, especially for large objects (e.g., Soccer fields) in aerial images, while high resolution maps have relatively low-level features but can provide more detailed information, which is very important for detecting small objects. Due to the various orientations and large scale differences of objects in remote sensing images, the standard FPN [
25] used to fuse these feature maps may not work well in this situation. The standard convolution kernel appears in a regular rectangular manner, which has the characteristic of translation invariance. Meanwhile, the resolutions of these feature maps differ, and the semantic information of objects is not strictly aligned to these feature maps. Therefore, using standard convolution to project these features before the add operation may harm the representation ability of oriented objects, which is essential to accurately localize the object’s center and direction. However, Deformable convolution (DConv) can learn the position of convolution kernels adaptively, which can better project the features of oriented objects in the feature pyramid network. We detail the structure of Deformable FPN in the following, and demonstrate its effectiveness in
Section 4.
3.3.1. Structure of Deformable FPN
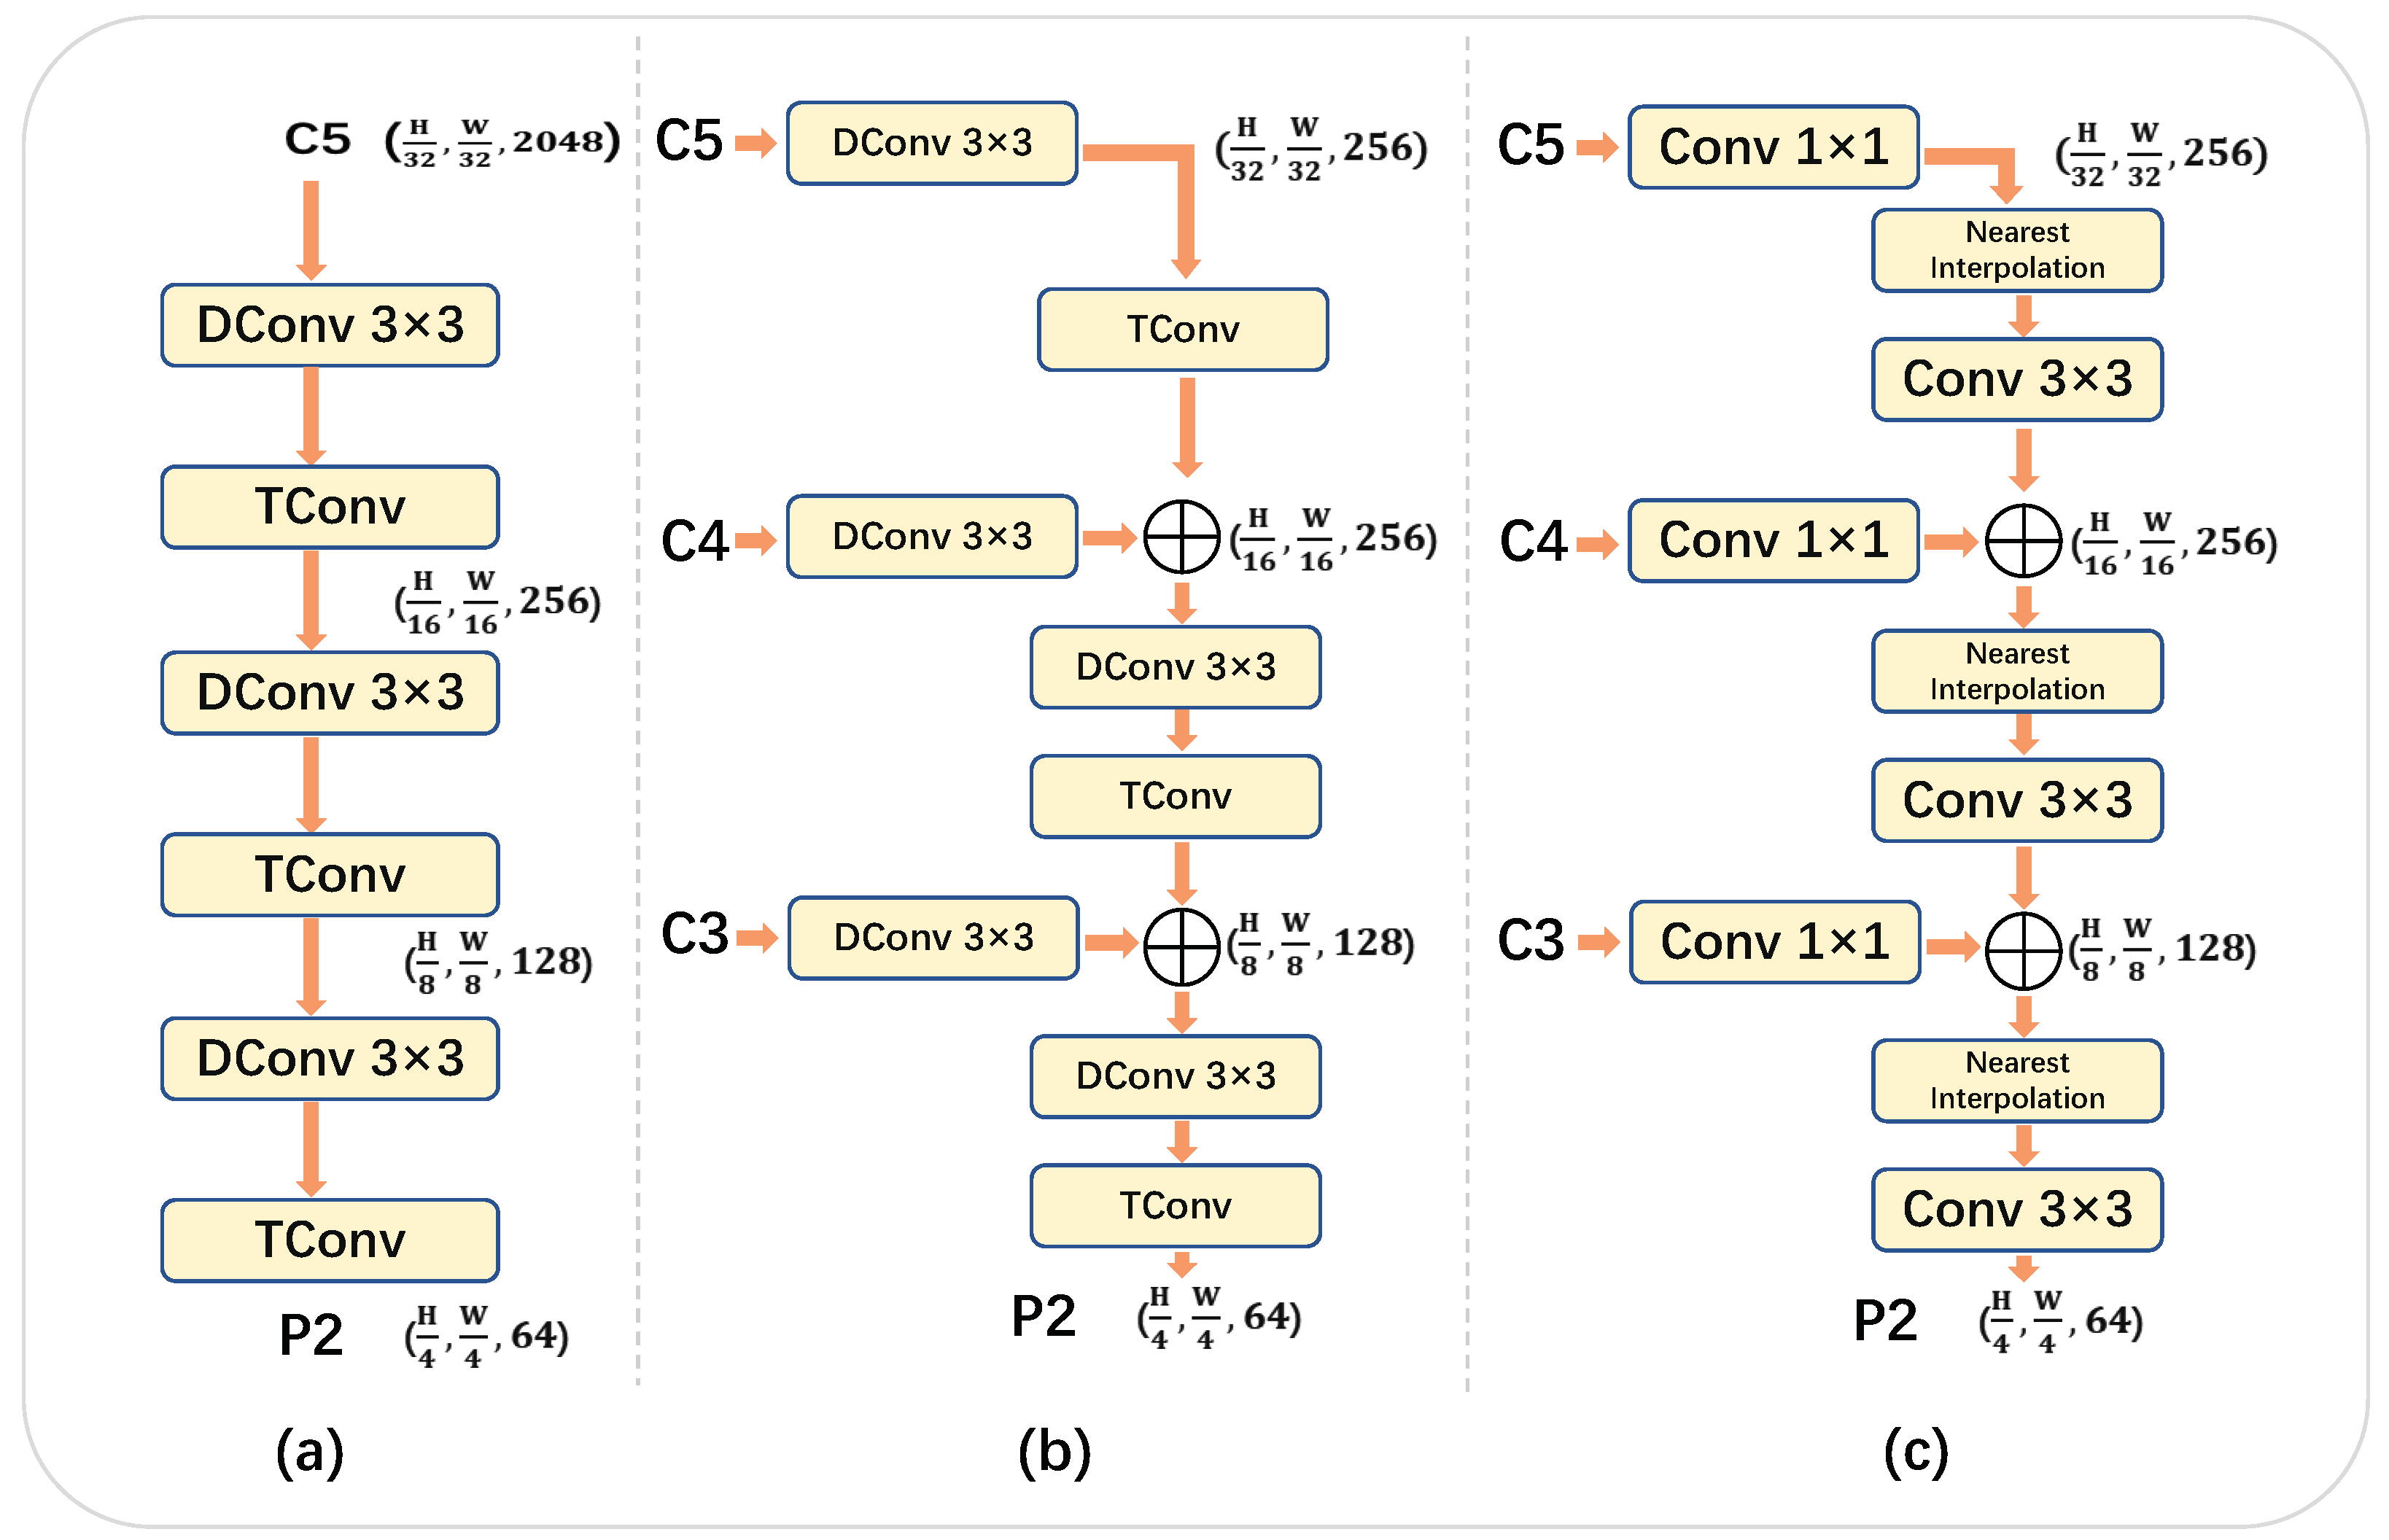
To verify the effectiveness of our method, we introduce three kinds of necks, including our Deformable FPN, to process backbone features to
, which are subsequently sent to the detection head.
Figure 6 shows detailed architectures of the three necks, using ResNet50 [
48] as a backbone. A direct Top-down pathway is constructed without building the feature pyramid structure (
Figure 6) but, instead, using deformable convolutions, as originally used by [
37] for ResNet. Our proposed Deformable FPN is shown in
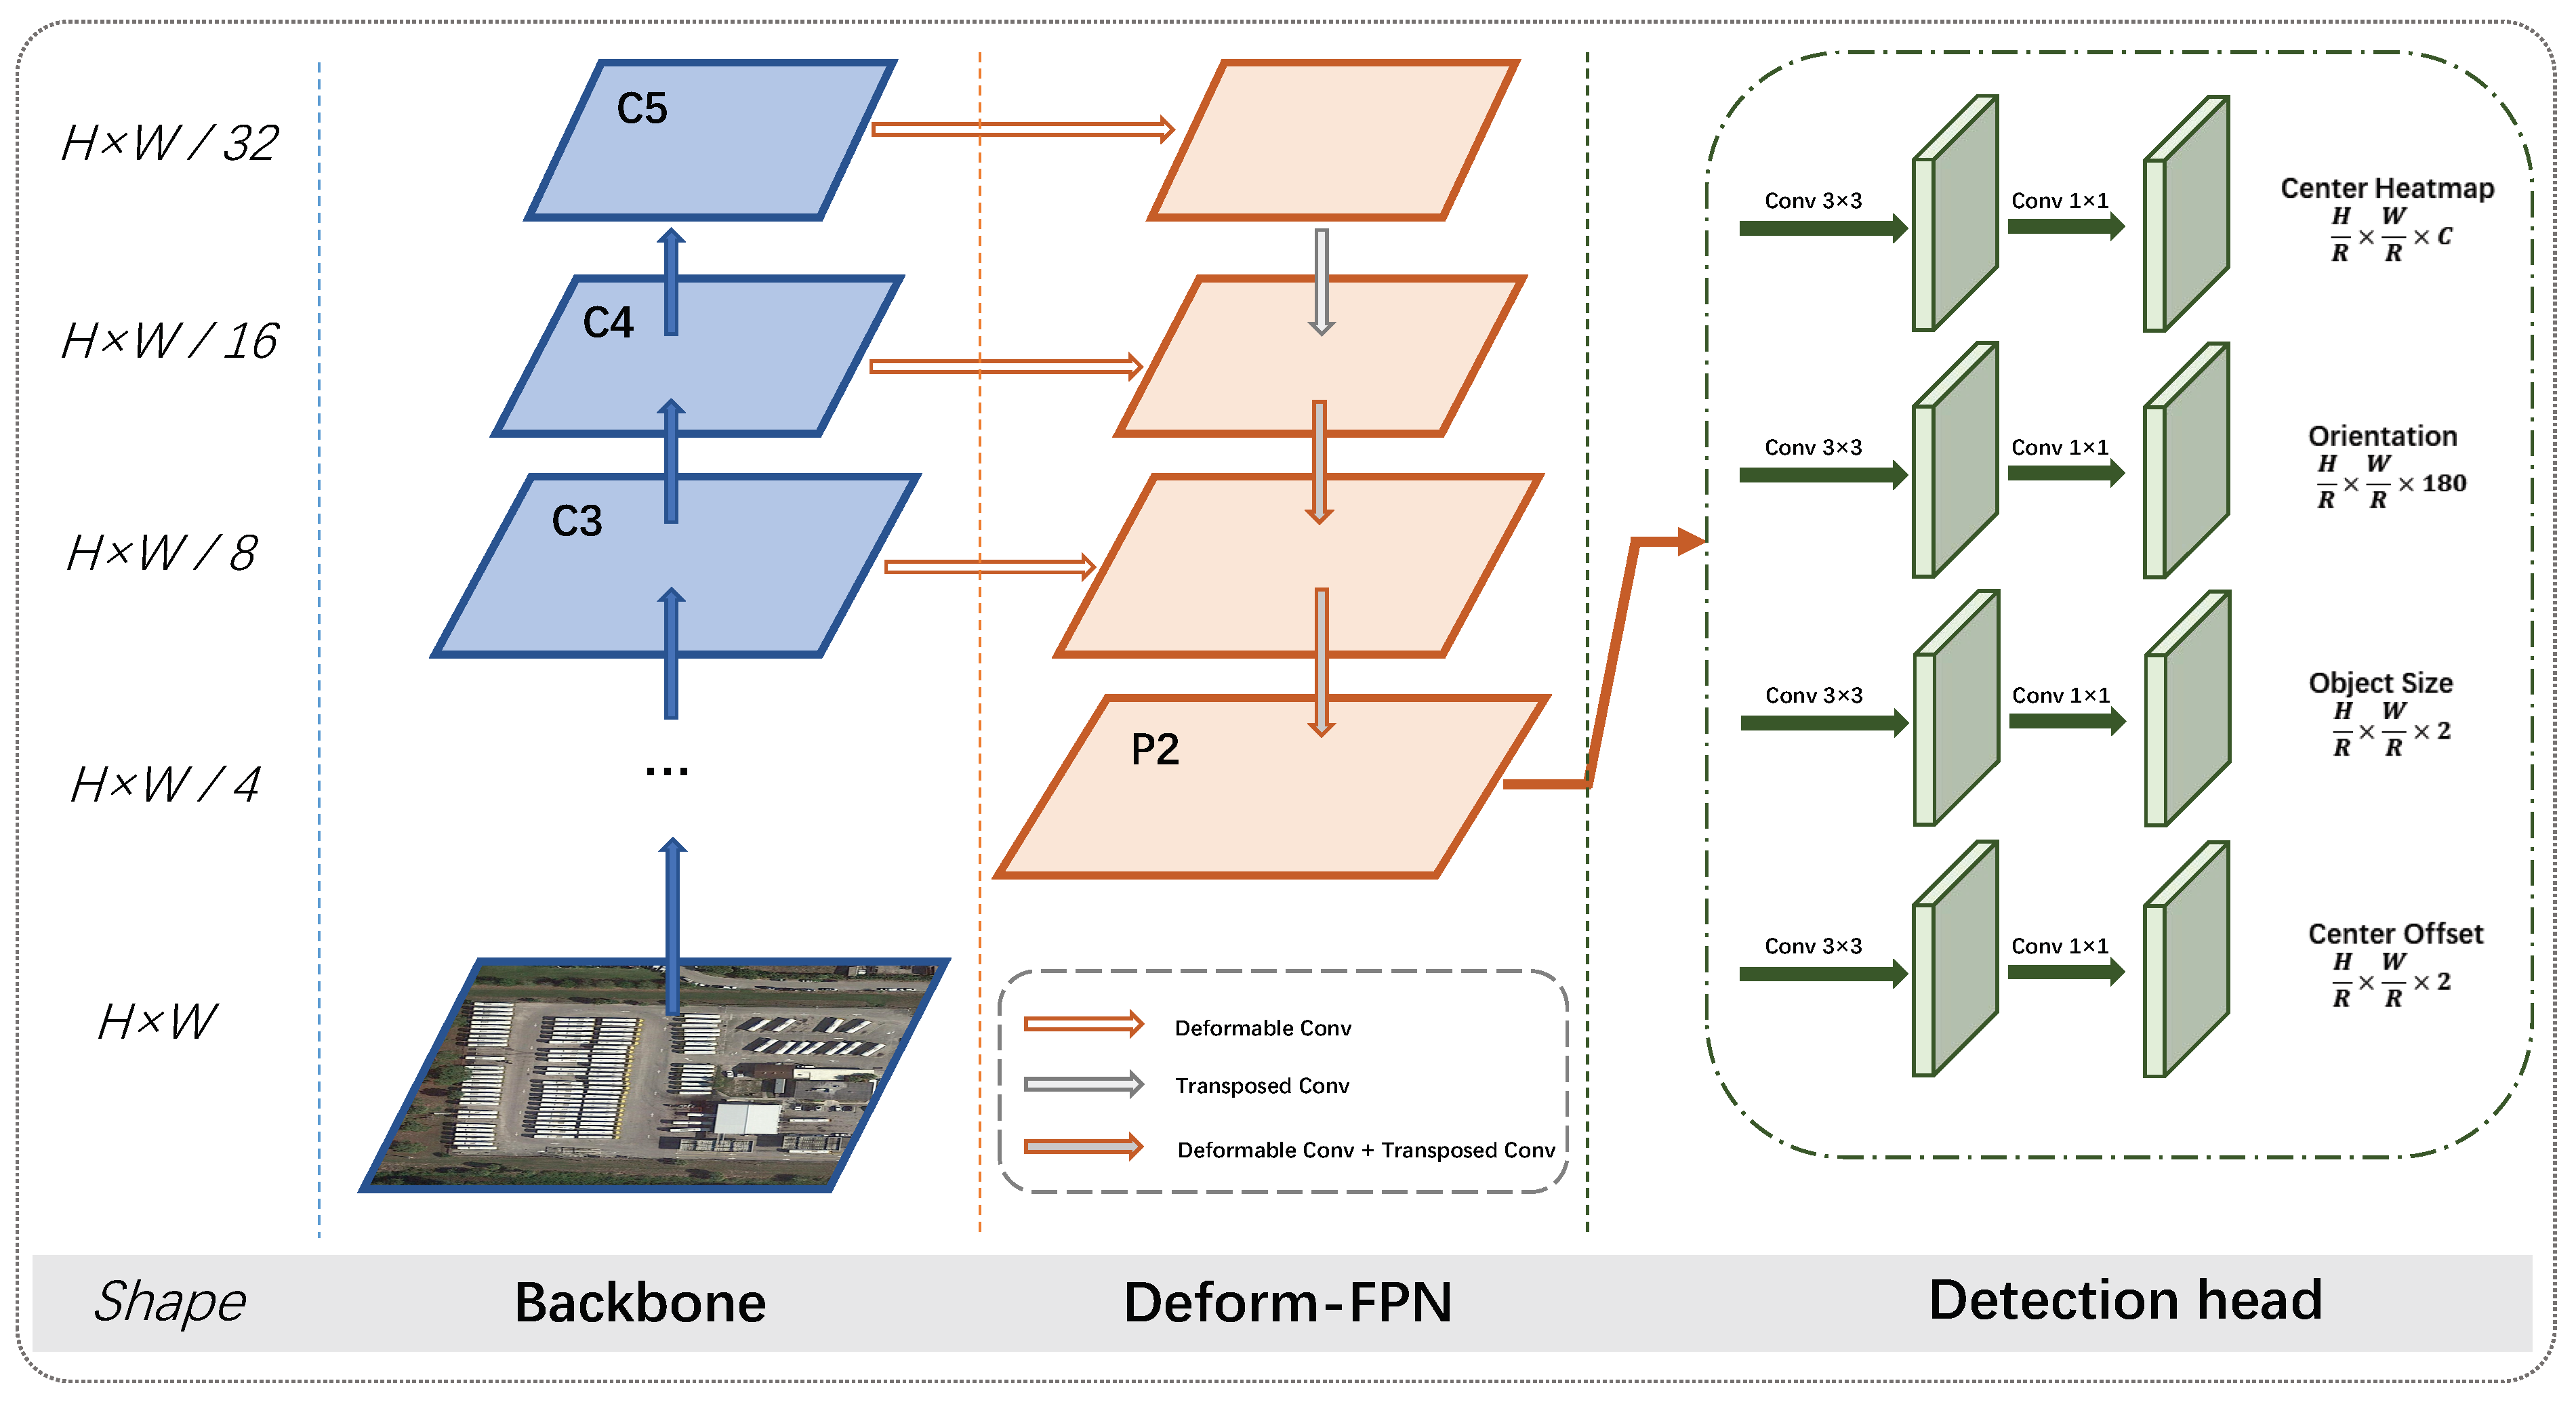
Figure 6, while a commonly used FPN structure is shown in
Figure 6. We keep the same channels of features in each stage, which are 256, 128, and 64 for features with stride 16, 8, and 4, respectively.
Direct Top-down pathway As shown in
Figure 6, we only use the backbone feature
from the last stage of ResNet to generate
. A direct Top-down pathway was used, without constructing a feature pyramid structure on it. Deformable convolution is used to change the channels, and transposed convolution is used to up-sample the feature map. We refer to this Direct Top-down Structure as DTS, for simplicity.
Deformable FPN Directly using
to generate
for oriented object detection may result in the loss of some detailed information, which is essential for small object detection and the accurate localization of object centers. As the feature
has a relatively large stride (of 32) and a large receptive field in the input image, we construct the Deformable FPN as follows: we use DConv 3 × 3 to reduce the channels and project the backbone features
,
, and
. Transposed convolution is used to up-sample the spatial resolution of features by a factor of two. Then, the up-sampled feature map is merged with the projected feature from the backbone of same resolution, by using an element-wise add operation. After merging the features from the adjacent stage, another deformable convolution is used to further align the merged feature and reduce its channel simultaneously. We illustrate this process in
Figure 6b.
FPN A commonly used feature pyramid structure is shown in
Figure 6c. Conv 1 × 1 is used to reduce the channel for
,
, and
, and nearest neighbor interpolation is used to up-sample the spatial resolution. Note that there are two differences from [
25], in order to align the architecture with our Deformable FPN. First, the feature channels are reduced along with their spatial resolution. Specifically, the channels of features in each stage are 256, 128, and 64 for features with a stride of 16, 8, and 4, respectively, while [
25] consistently set the channels to 256. Second, we added an extra Conv 3 × 3 after the added feature map, in order to further fuse them.
Comparing our Deformable FPN with DTS, we reuse the shallow, high-resolution features of the backbone, which provide more detailed texture information to better localize the object center and detect small objects, such as vehicles and bridges, in remote sensing images. Compared with FPN, by using deformable convolution—which adaptively learns the position of convolution kernels—it can better project the features of oriented objects. Moreover, applying transposed convolution, rather than nearest neighbor interpolation, to up-sample the features can help to better localize the centers.
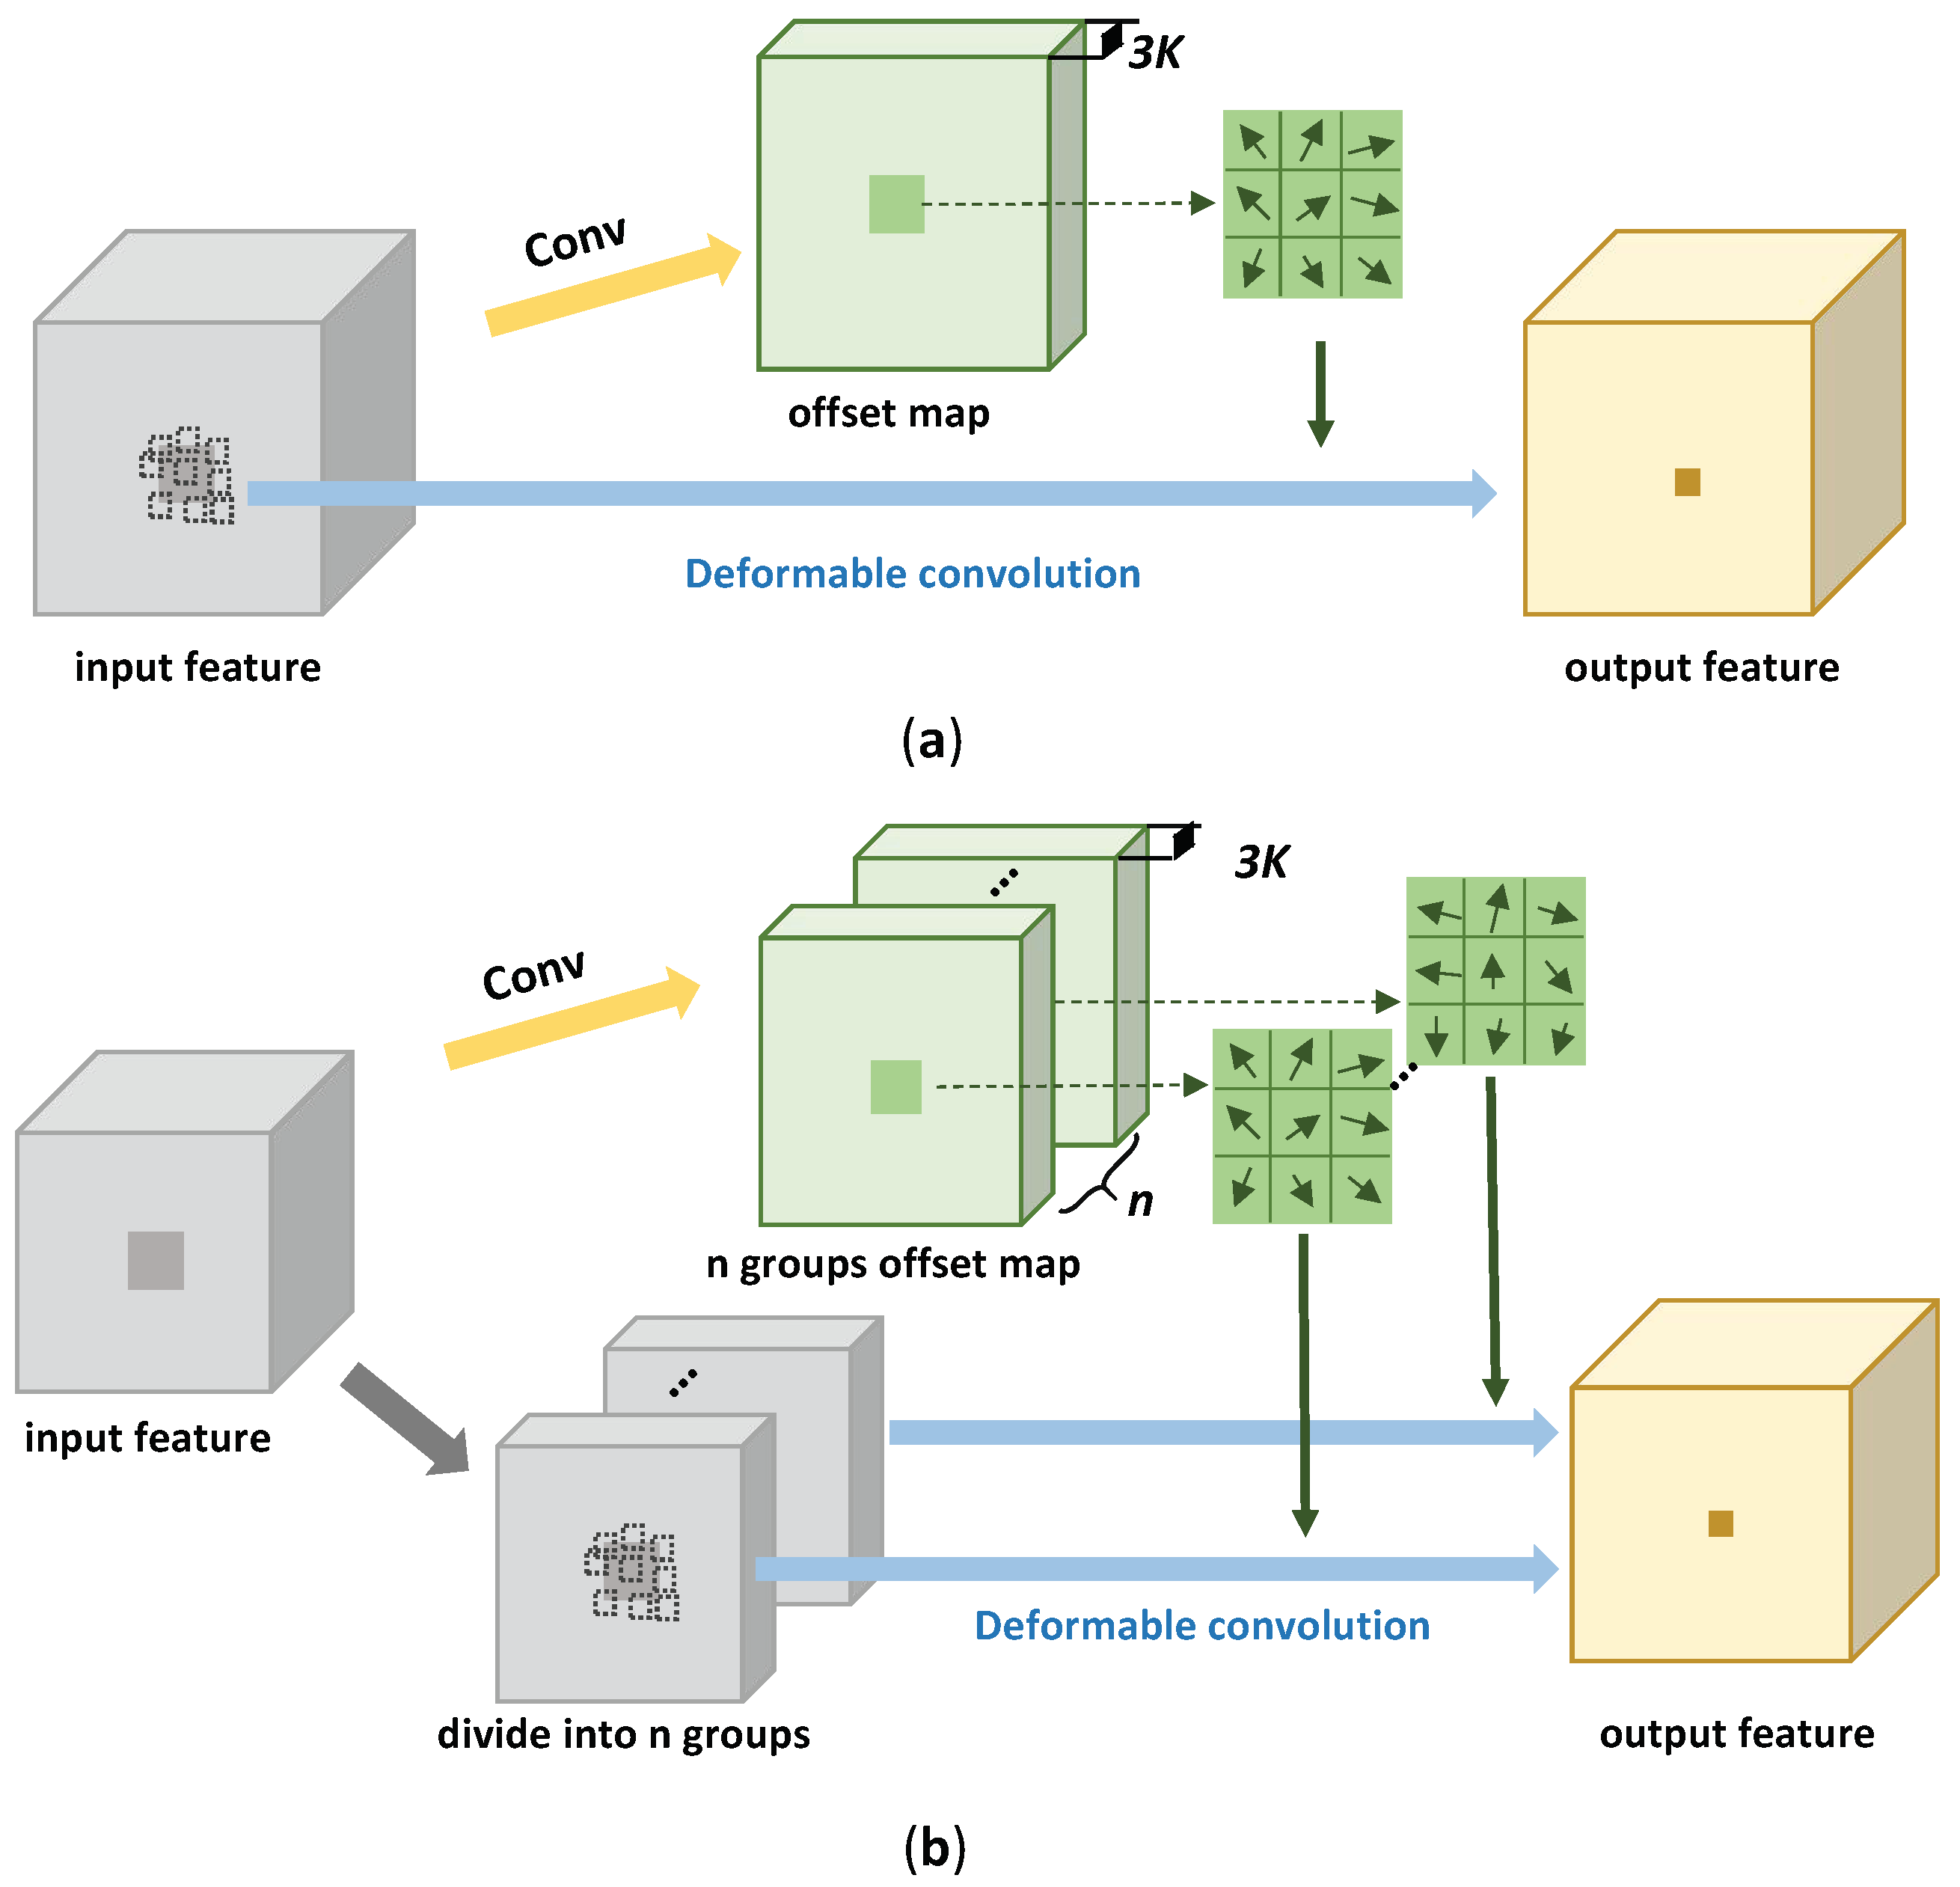
3.3.2. Deformable Groups
As we use deformable convolution in the feature pyramid structure, we discuss how larger Deformable groups in DConv can further enhance the representation power of the network in this section.
The deformable convolution used in this paper is DCNv2 [
21]. For a convolutional kernel and
K sampling locations, the deformable convolution operation can be formulized as follows:
where
and
denote the feature at location
p on input feature map
x and output feature map
y, respectively; the pre-set convolution kernel location is denoted as
and
is the kernel weight; and
and
are the learnable kernel offset and scalar weight based on input feature, respectively. Take a 3 × 3 deformable convolutional kernel as an example: there are
sampling locations. For each location
k, a two-dimensional vector(
) is used to determine the offsets in the x- and y-axes, and a one-dimensional tensor is used for the scalar weight (
). So, the network first predicts offset maps, which have
channels based on the input features, then uses the predicted offsets to find
K convolution locations at each point
p. Finally, Equation (
10) is used to calculate the output feature maps. We illustrate this process in
Figure 7a.
Note that all channels in the input feature maps share one group of offsets when the number of deformable groups is set to 1 (as shown in
Figure 7a). Input features share these common offsets to perform the deformable convolution. When the number of deformable groups is
n (
), the networks first output
-channel offset maps, the input feature (
C channels) is divided into
n groups, where each group of features has
channels, and the corresponding
-channel offset maps are used to calculate the kernel offsets (as shown in
Figure 7b). Finally, the output feature will be obtained by deformable convolution on the input feature. Different from the groups in the standard convolutional operation, each channel in the output features will be calculated on the entire input features only, with different kernel offsets. Increasing the number of deformable groups can enhance the representation ability of DConv, as different groups of input channels use different kernel offsets, and the network can generate a unique offset for each group of features, according to the characteristics of the input features.
4. Experiments
4.1. Data Sets and Evaluation Metrics
4.1.1. DOTA
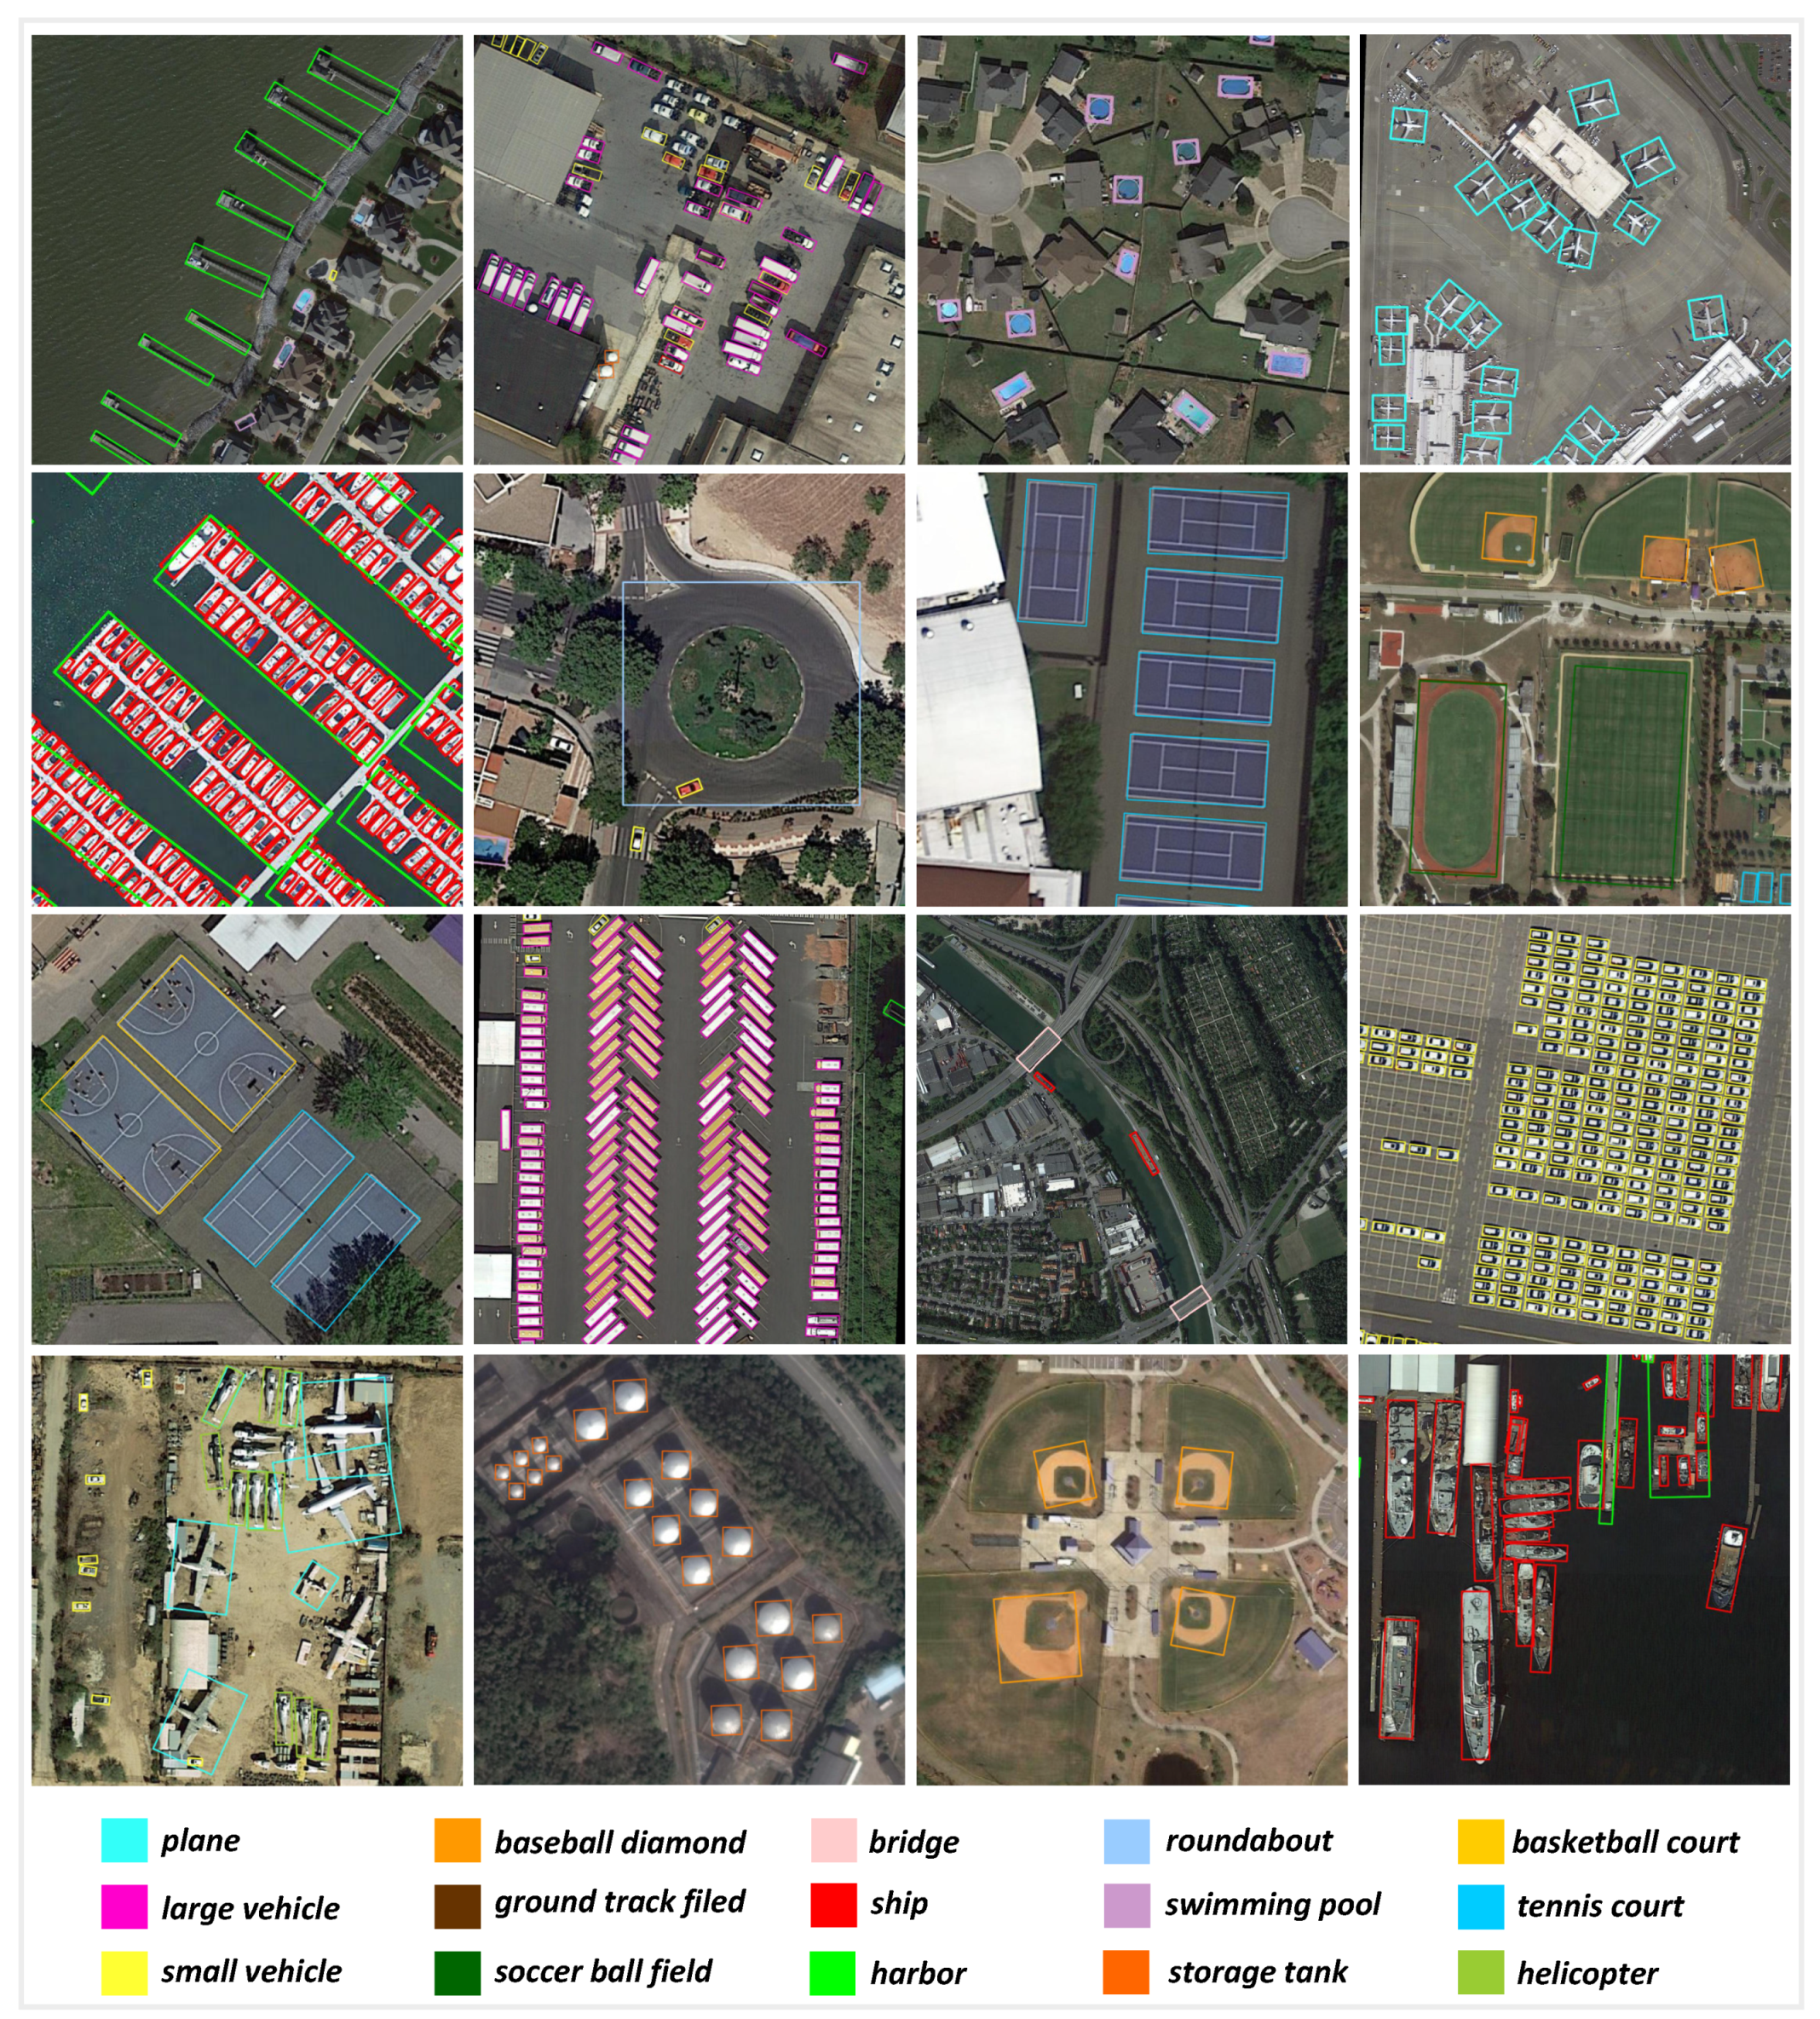
DOTA is a large-scale dataset for object detection in remote sensing images. The images are collected from different sensors and platforms. There are 2806 images, with scales from 800 × 800 to 4000 × 4000 pixels. The proportions of the training set, validation set, and testing set in DOTA are , , and , respectively. The DOTA dataset contains 15 common categories, with 188,282 instances in total. The full names (short names) for the categories are: Plane (PL), Baseball diamond (BD), Bridge (BR), Ground track field (GTF), Small vehicle (SV), Large vehicle (LV), Ship (SH), Tennis court (TC), Basketball court (BC), Storage tank (ST), Soccer-ball field (SBF), Roundabout (RA), Harbor (HA), Swimming pool (SP), and Helicopter (HC).
4.1.2. HRSC2016
HRSC2016 is a dataset for ship detection in aerial images. The HRSC2016 dataset contains images of two scenarios, including ships at sea and ships inshore at six famous harbors. There are 436, 181, and 444 images for training, validation and testing, respectively. The ground sample distances of images are between 2 m and 0.4 m, and the image resolutions range from 300 × 300 to 1500 × 900.
4.1.3. Evaluation Metrics
The Mean Average Precision (mAP) is commonly used to evaluate the performance of object detectors, where the AP is the area under the precision–recall curve for a specific category, which ranges from
. It is formulized as:
where
C is the number of categories, and
,
, and
represent the numbers of correctly detected objects, incorrectly detected objects, and mis-detected objects, respectively.
4.2. Implementation Details
4.2.1. Image Pre-Processing
The images in the DOTA dataset always have a high resolution. Directly training on the original high-resolution images does not reconcile with the hardware, due to limited GPU memory. Therefore, we cropped the images into sub-images of size 1024 × 1024, with an overlap of 256 pixels, and obtained 14,560 labeled images for training. We introduce two methods for testing in this paper. In the first method, we crop the testing images using the same size as used in the training stage (1024 × 1024 pixels) and, after inference on all sub-images, the final detection results are obtained by splicing all sub-image results. This method is commonly used for inference on the test images in the DOTA dataset; however, it may generate some false results at the cutting edge, leading to poor performance especially for some categories with large sizes (e.g., Ground field track and Soccer field). The second method involves cropping the testing images with a relatively high resolution (3200 pixels i this paper) during inference. We simply padded the images if the size of the original image is smaller than the crop size. By cropping the testing images at a relatively high resolution, a large number of images will not be cut and, so, the model can detect objects based on the complete instance, thus obtaining a more accurate evaluation result. Note that the only difference between the two methods is the crop size used for testing.
For the HRSC2016 dataset, we resized the long side of images to 640 pixels and kept the same aspect ratio as the original images. Thus, the short side of each image was different and smaller than 640 pixels. Then, we uniformly padded the resized images to 640 × 640 pixels, both for training and testing.
4.2.2. Experimental Settings
All experiments were implemented in PyTorch. ImageNet [
49]-pretrained ResNets were used as our default backbone. We used the Adam [
50] optimizer to optimize the overall networks for 140 epochs. We set a batch size of 12 for DOTA and 32 for HRSC2016. The initial learning rates were
and
for DOTA and HRSC2016, with the learning rate dropped by 10 × at 100 and 130 epochs. We used a single-scale training strategy with input resolution of 1024 for DOTA and 640 for HRSC2016, as mentioned before, and the stride
R was set to 4. The Gaussian radii
for CSL were set to 4 and 6 for DOTA and HRSC2016, respectively. Our data augmentation methods included random horizontal and vertical flipping, random graying, and random rotation. We did not use multi-scale training and testing augmentations in our experiments.
4.3. Results
4.3.1. Effectiveness of Deformable FPN
Due to the wide variety of object scales, orientations and shapes, we chose DOTA as our main dataset for validation. We implemented a standard feature pyramid network (FPN), a direct Top-down structure (DTS), and our proposed Deformable FPN (De-FPN) as necks to process features from the ResNet50 backbone.
Results are shown in
Table 1. We give the average precision of each category and total mAP. HRT denotes the high resolution testing discussed in
Section 4.2.1. The building detector from FPN achieved 69.68% mAP, which is already a good performance for the DOTA dataset. However, the direct Top-down structure had 1.2% higher mAP than the FPN structure. Note that the DTS does not build a feature hierarchical structure inside the network, but had a better performance than FPN, indicating that the deformable convolution can better project features for rotating objects. Furthermore, the interpolation operation used to up-sample the features may harm the representation power for predicting object centers exactly.
Our Deformable FPN achieved a remarkable improvement of 1.23% higher mAP, compared with DTS, which indicates that Deformable FPN can better fuse the multi-level features and help the detector to accurately localize the rotating objects. Compared with FPN, the advantages of building a feature hierarchical structure in our way are evident. The improvement of up to 2.43% higher mAP was obtained through use of deformable convolution and transposed convolution within the FPN structure. Further, by using original high-resolution images during testing, our detector could obtain a more accurate evaluation result. Specifically, the high-resolution test boosted the mAP by 1.79%, 2.39%, and 1.65% for FPN, DTS, and De-FPN, respectively.
4.3.2. Results on DOTA
We compared our results with other state-of-the-art methods in the DOTA dataset. We used ResNet50, ResNet101, and ResNet152 as backbones to construct our Arbitrary-oriented anchor-free based object detector, denoted as CenterRot. The results are shown in
Table 2. The DOTA dataset contains complex scenes, wherein object scales change drastically. Two-stage methods are commonly used in DOTA, in order to handle the imbalance between foregrounds and backgrounds in these complex scenes, such as ROI Transformer [
42] and CAD-Net [
51], which have achieved 69.59% and 69.90% mAP, respectively, when using ResNet101 as a backbone. Meanwhile, extremely large and small objects can appear in one image (as shown in
Figure 1), such that multi-scale training and testing technologies are used to obtain a better performance, such as FADet [
52], which obtained 73.28% mAP using ResNet101, and MFIAR-Net [
53], which obtained 73.49% mAP using ResNet152 as the backbone. However, multi-scale settings need to infer one image multiple times at different sizes and merge all results after testing, which leads to a larger computational burden during inference.
Our CenterRot converts the oriented object detection problem to a center point localization problem. Based on the fact that remote sensing images have less probability of overlap between objects with the same category, directly detecting the oriented object from its center can lead to a comparable performance with oriented anchor-based methods. Specifically, CenterRot achieved 73.76% and 74.00% mAP on the OBB task of DOTA, when using ResNet50 and ResNet101 as the backbone, respectively. Due to the strong representation ability of our Deformable FPN for rotated objects, CenterRot, equipped with larger deformable groups (
in Deformable FPN), achieved the best performance (74.75% mAP) when using ResNet152 as the backbone, surpassing all published single-stage methods with single-scale training and testing. Detailed results for each category and method are provided in
Table 2.
4.3.3. Results on HRSC2016
The HRSC2016 dataset has only one category—ship—where some of them have large aspect ratios and various orientations. Therefore, it is still a challenge to detect ships in this dataset. The results are shown in
Table 3, from which it can be seen that our CenterRot achieved state-of-the-art performance consistently, without the use of a more complicated architecture, compared with the other methods. Specifically, CenterRot achieved 90.20% and 96.59% for mAP 07 and 12, respectively, where mAP 07 denotes using the 2007 evaluation metric, while mAP 12 denotes using the 2012 evaluation metric.
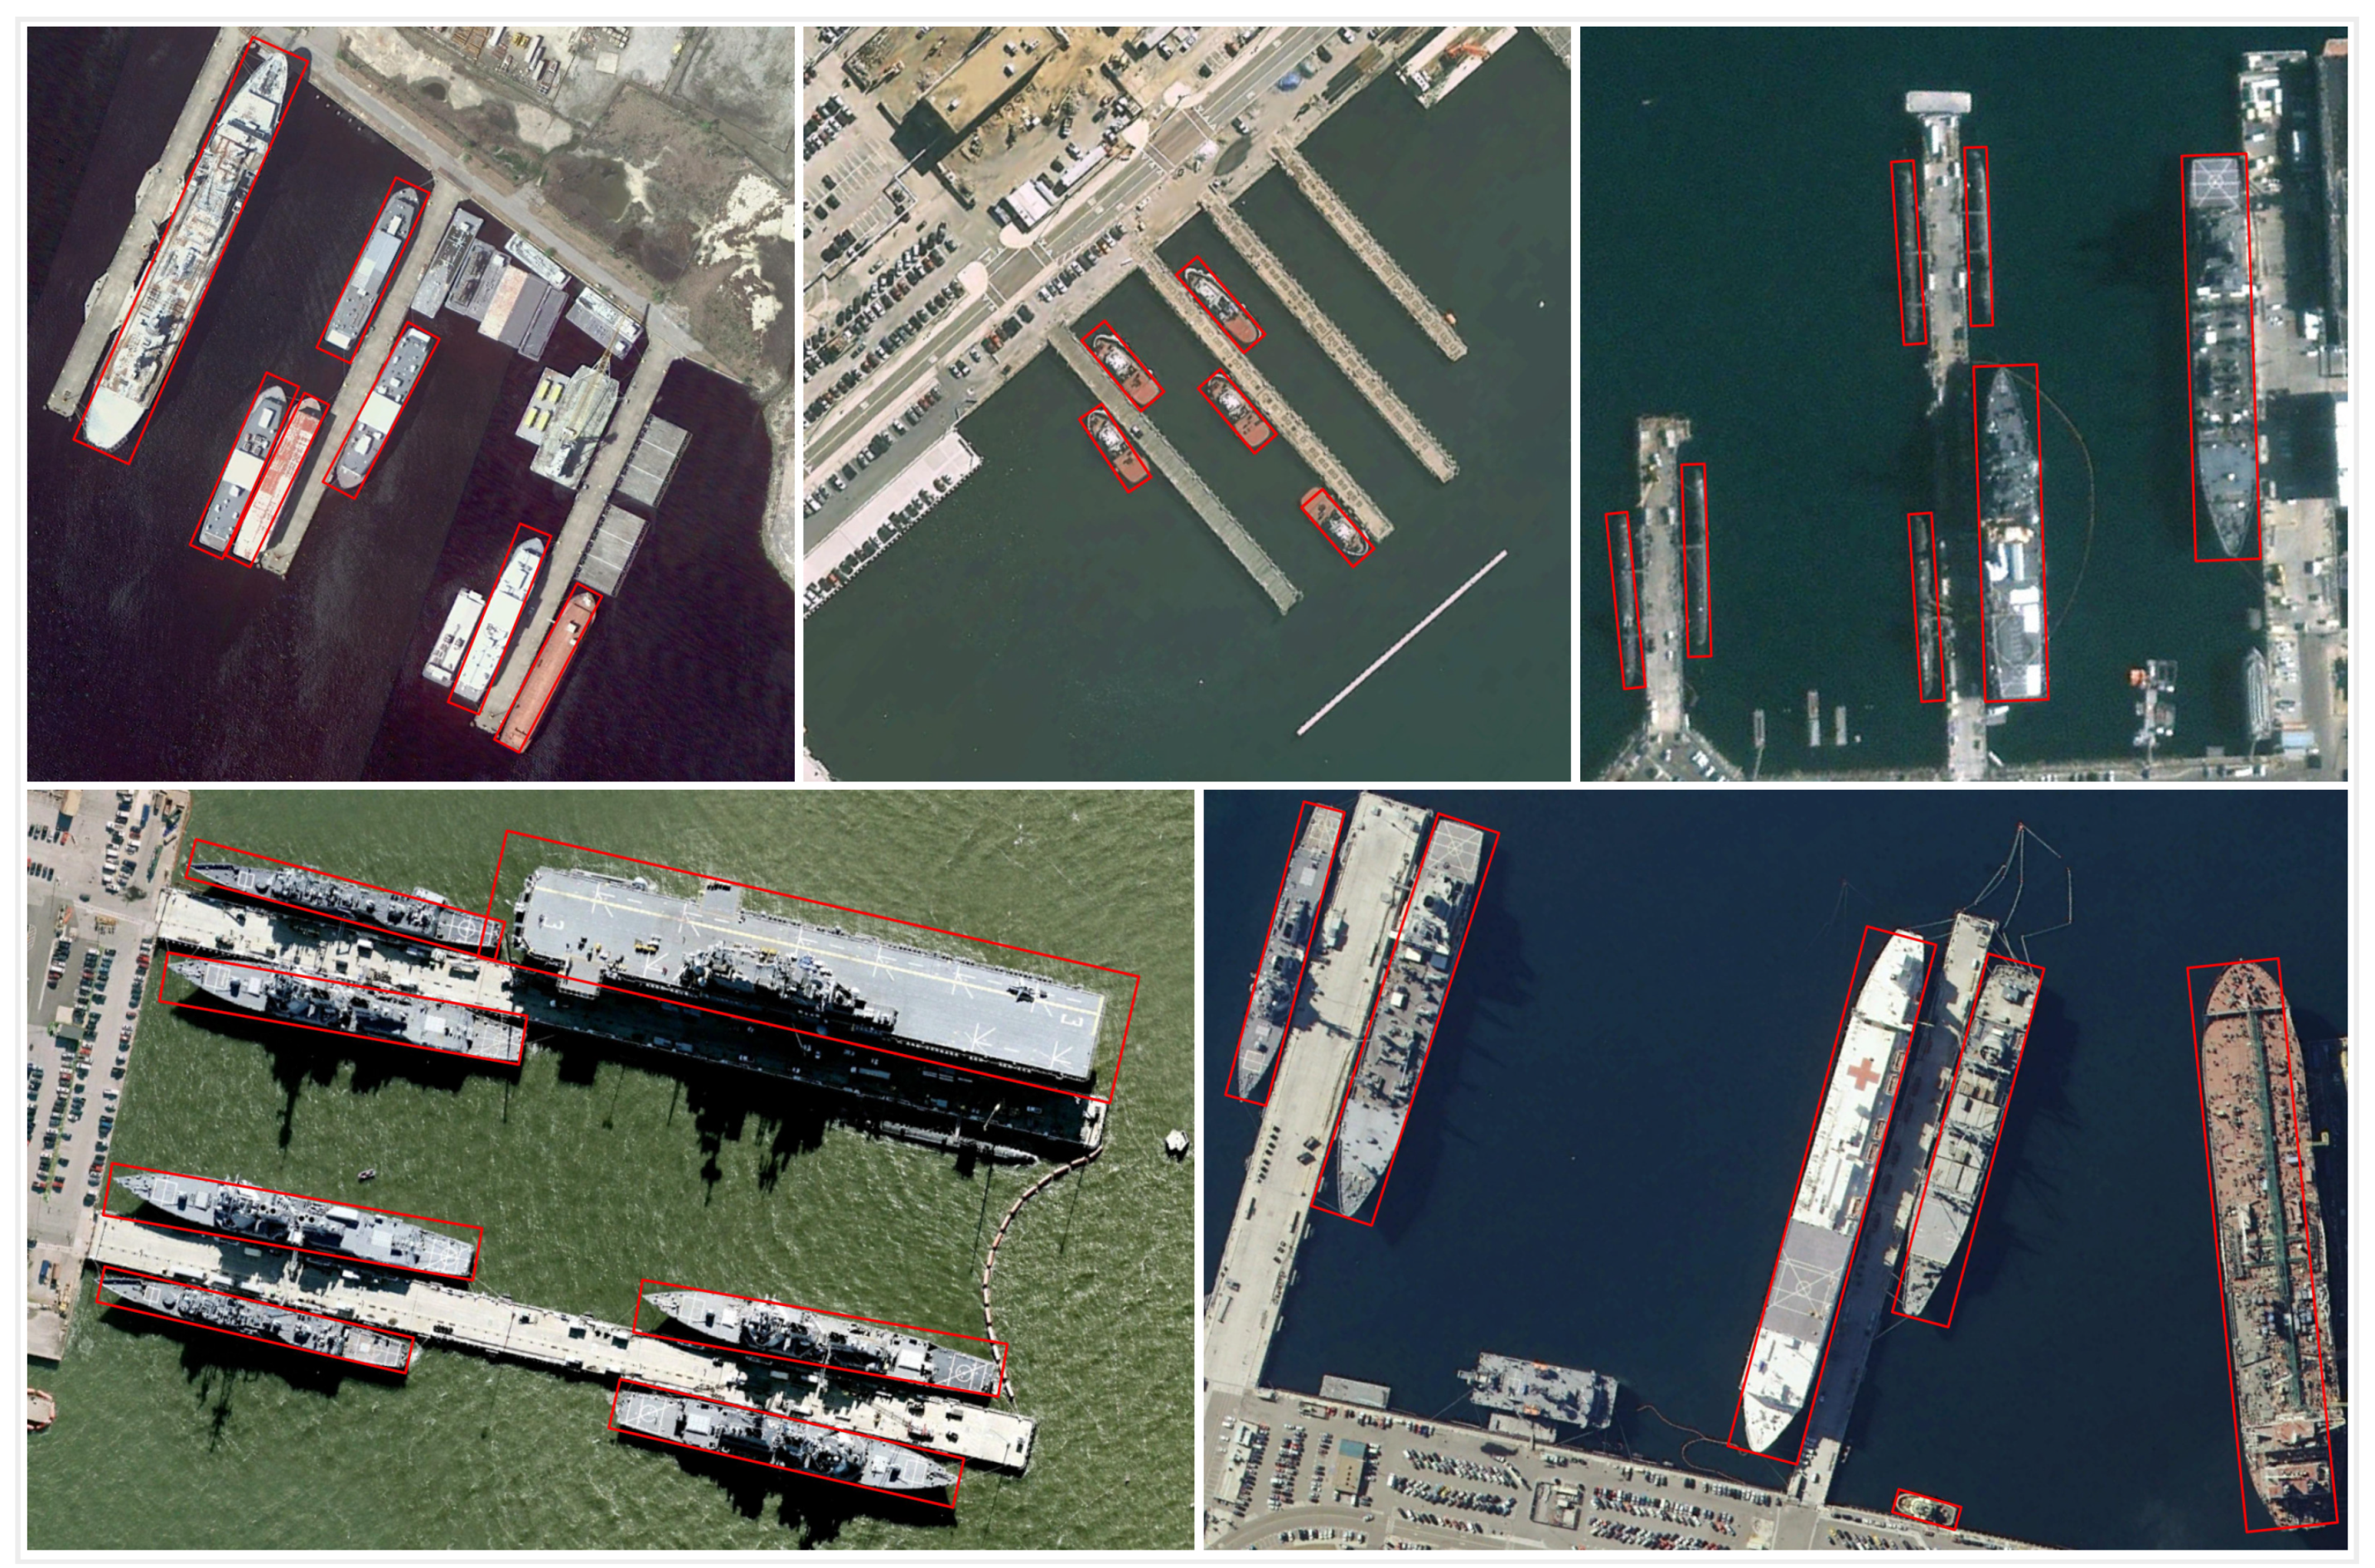
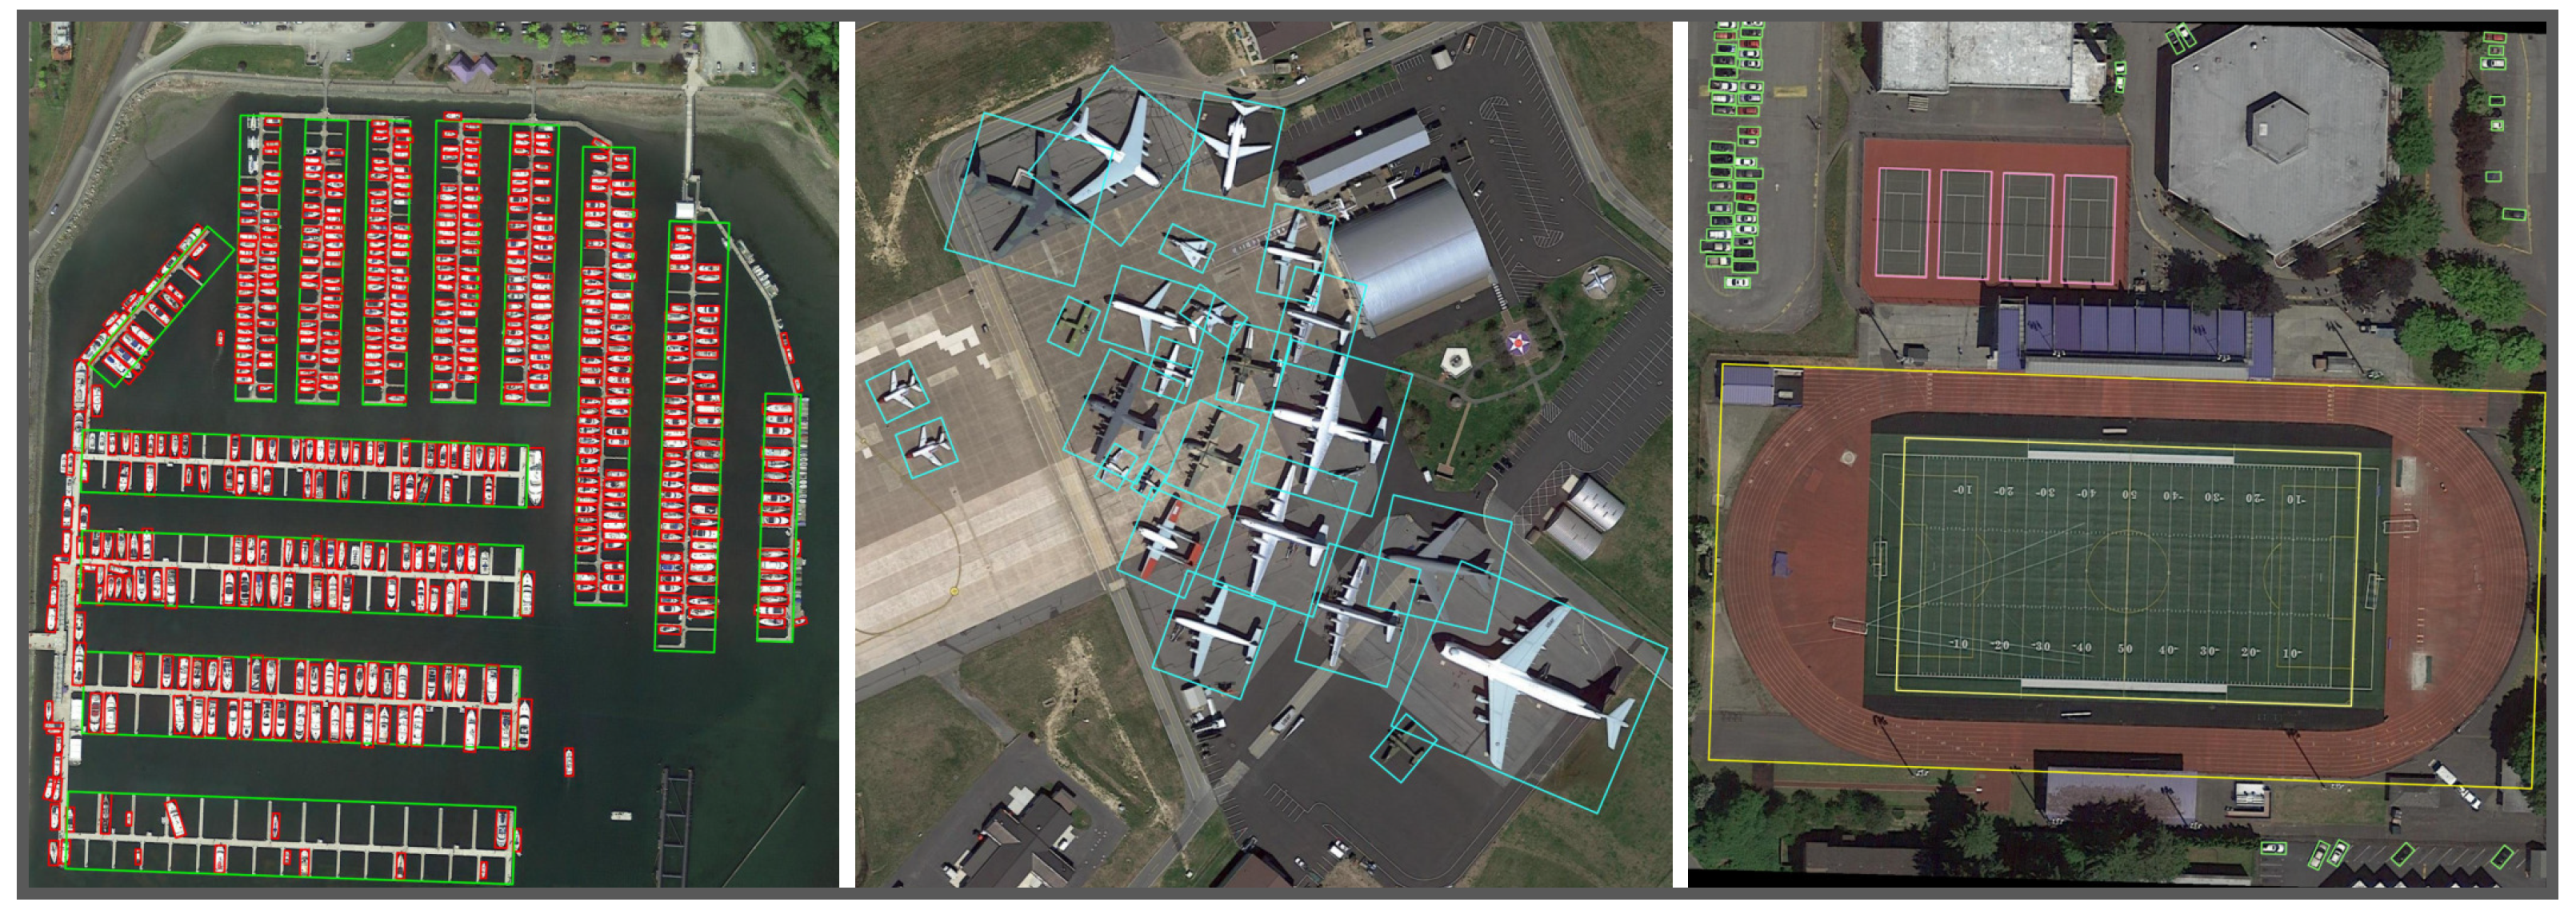
4.3.4. Visualization
The visualization results are presented using our CenterRot. The results for DOTA are shown in
Figure 8 and those for HRSC2016 are shown in
Figure 9.
5. Discussion
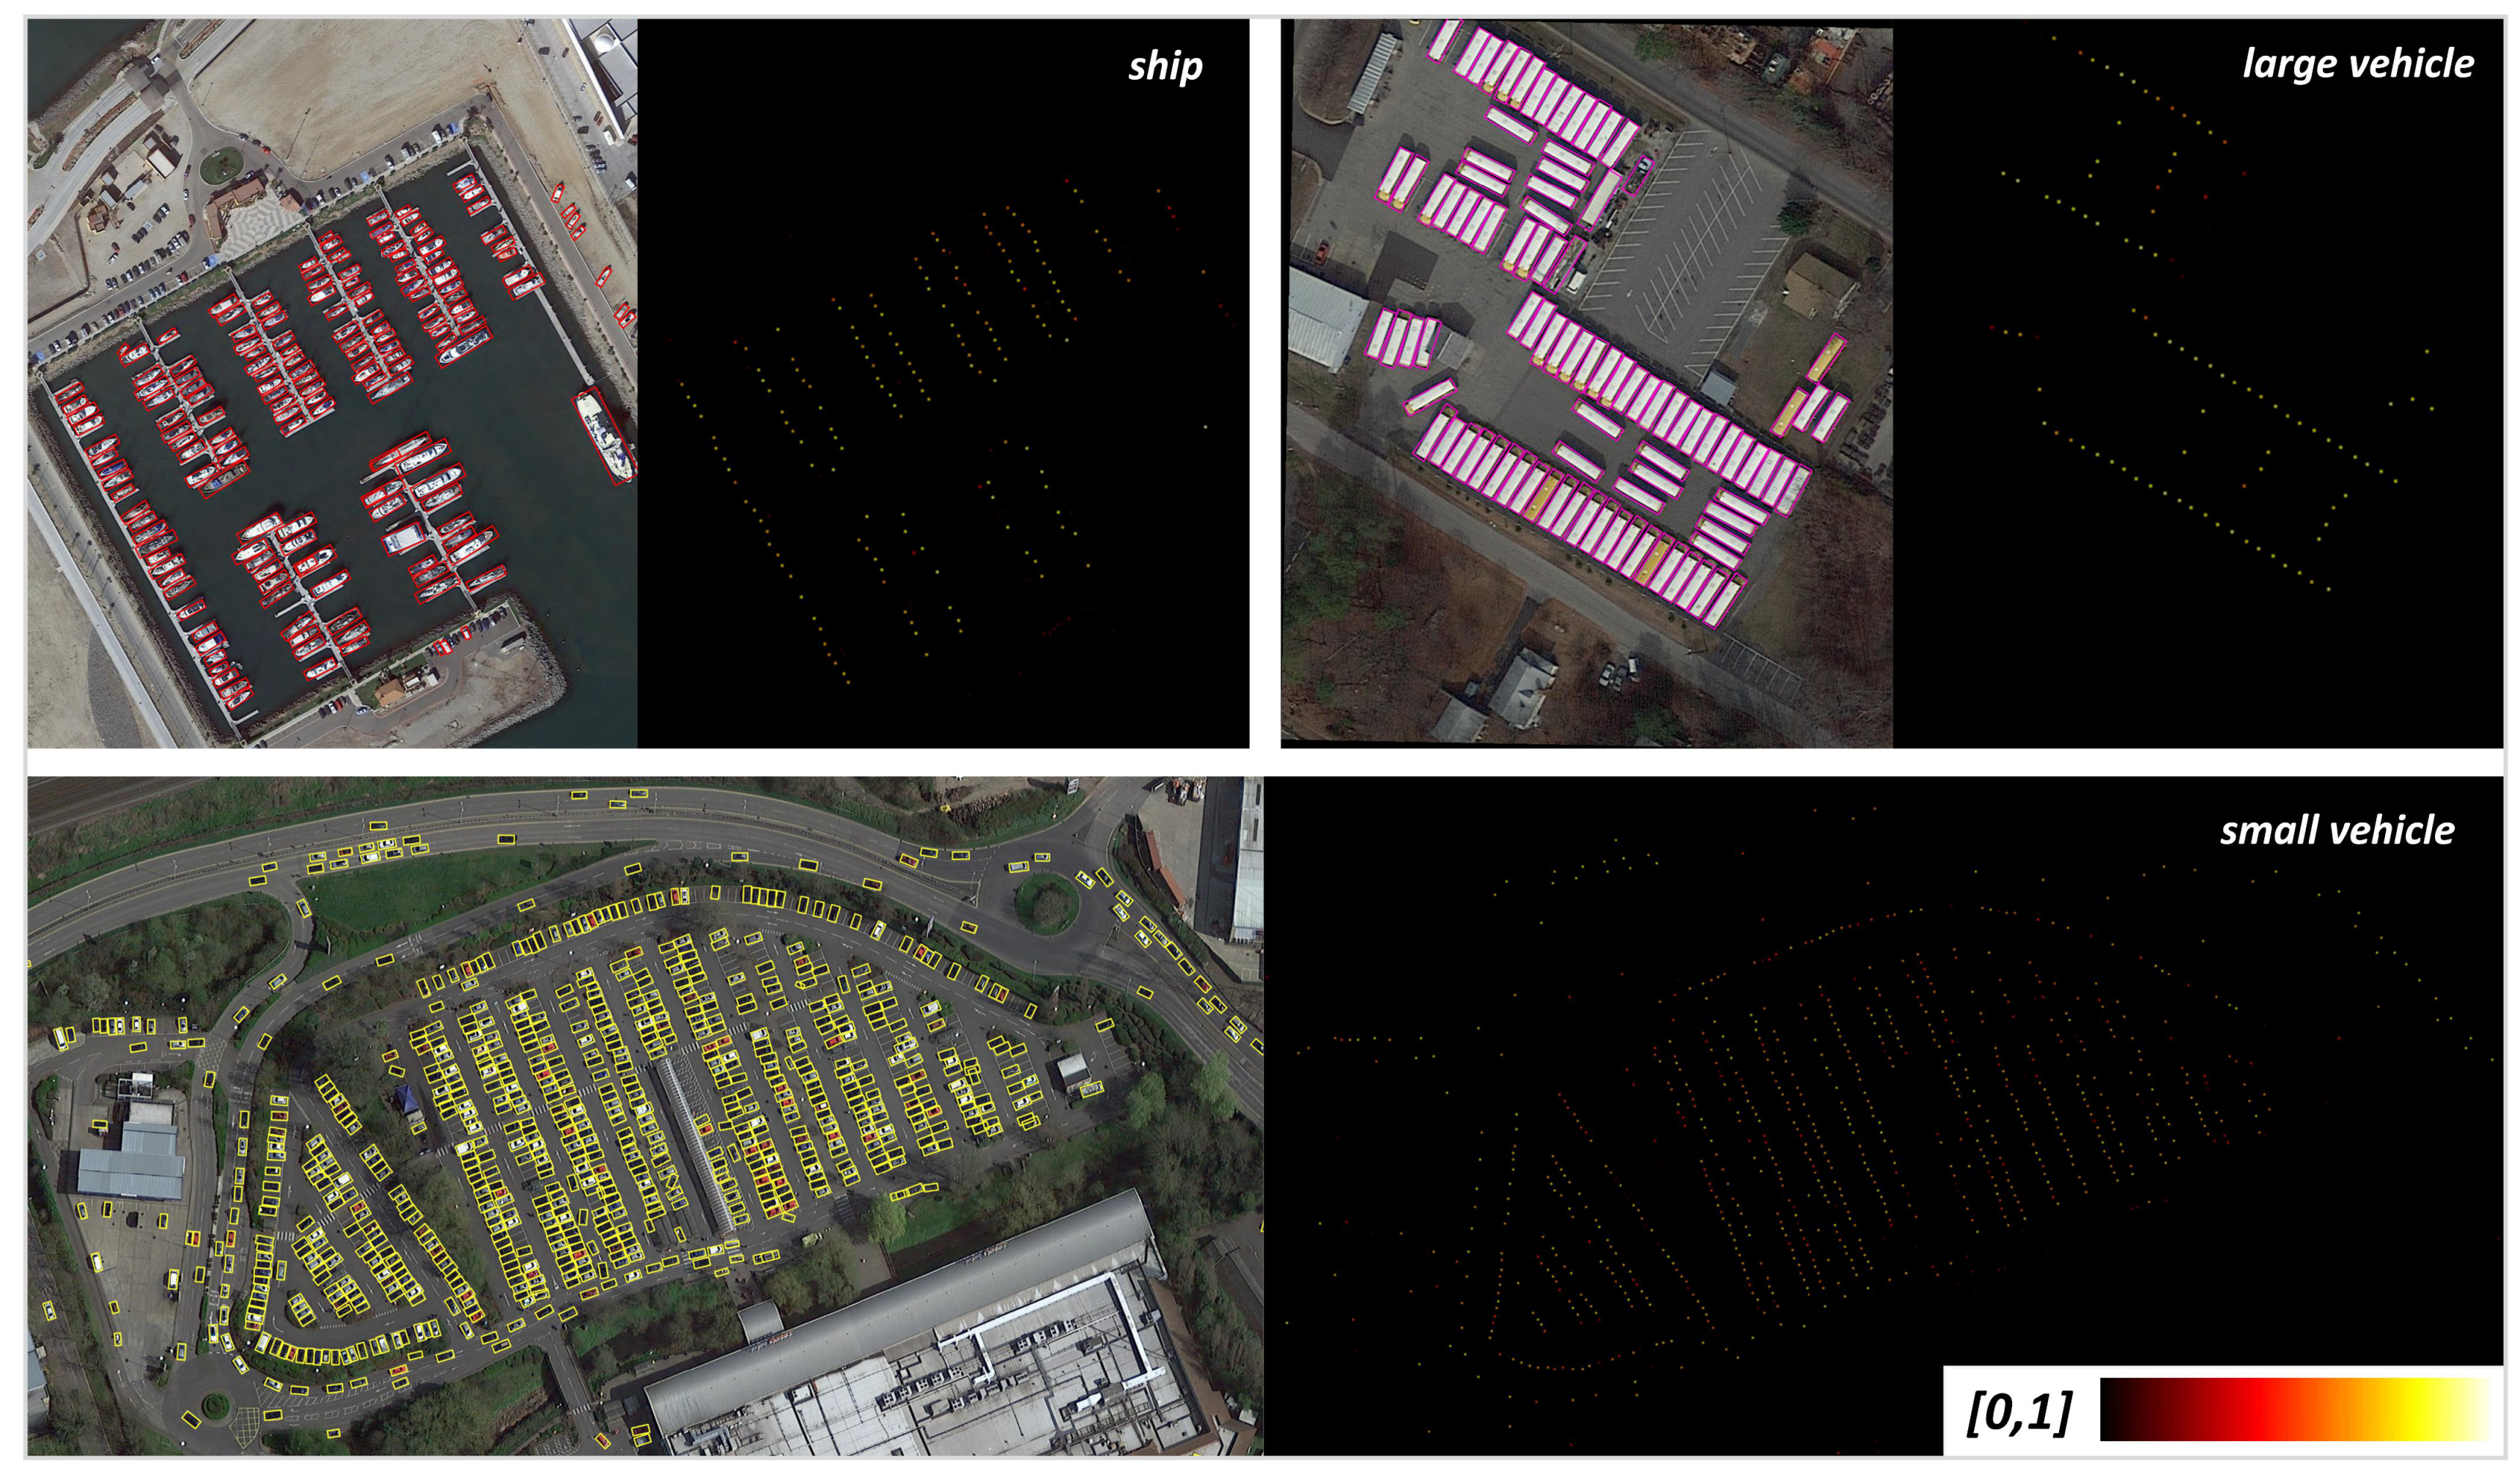
The proposed CenterRot achieved prominent performance in detecting rotated objects for both of the DOTA and HRSC2016 datasets. Objects with the same category have a lower probability of overlapping each other, so directly detecting rotated objects from their center is effective and efficient. We selected several categories in order to further analyze our method. As shown in
Table 4, small vehicle, large vehicle, and ship were the most common rotated objects in DOTA, which always appeared in a densely arranged manner. Anchor-based methods operate by setting anchors with different angles, scales and aspect ratios per location, in order to cover the rotated objects as much as possible. However, it is impossible to assign appropriate anchors for each object, due to the various orientations in this situation. Our methods performed well in these categories especially, due to the fact that we converted the oriented bounding box regression problem into a center point localization problem. Less overlap between objects means fewer collisions between object centers, such that the networks can learn the positions of rotated objects from their center easier. We also visualized some predicted center heatmaps, as shown in
Figure 10. Moreover, since the deformable FPN can better project features for rotated objects and the use of CSL to predict the object direction, our methods still performed well for objects with large aspect ratios, such as harbors and ships in HRSC2016.
However, as we cut the original images, some large objects were incomplete during training, such as the soccer ball field, which may confuse our detector when localizing the exact center, resulting in relatively poor performance in these categories. Due to this, we use the five-parameter long side-based representation for oriented objects, which will create some ambiguity when representing the square-like objects (objects with small aspect ratio). So, the model will produce a large loss value when predicting the angle and size of these objects and perform poorly in these categories, such as roundabout. Other oriented representations, such as the five-parameter acute angle-based method [
19], will avoid this problem while suffering EoE problems. Therefore, it is still worth studying how to better represent the rotated objects.
Future works will mainly involve improving the effectiveness and robustness of the proposed methods in real-world applications. Different from the classical benchmark datasets, the objects in input images can vary much more frequently and can be affected by other conditions, such as angle of insolation. Moreover, as cloudy weather is very common, the cloud can occlude some objects. The anchor-free rotated object detection problem in such a circumstance is also worth studying.
6. Conclusions
In this paper, we found that objects within the same category tend to have less overlap with each other in remote sensing images, and setting multiple anchors per location to detect rotated objects may not be necessary. We proposed an anchor-free based arbitrary-oriented object detector to detect the rotated objects from their centers and achieved great performance without pre-set anchors, which avoids complex computations on anchors, such as IoU. To accurately localize the object center under complex backgrounds and the arbitrary orientations of rotated objects, we proposed a deformable feature pyramid network to fuse the multi-level features and obtained a better feature representation for detecting rotated objects. Experiments on DOTA showed that our Deformable FPN can better project the features of rotated objects than standard FPN. Our CenterRot achieved a state-of-the-art performance, with 74.75% mAP on DOTA and 96.59% on HRSC2016, with a single-stage model, including single-scale training and testing. Extensive experiments demonstrated that detecting arbitrary-oriented objects from their centers is, indeed, an effective baseline choice.
Author Contributions
Conceptualization, J.W., L.Y. and F.L.; methodology, J.W.; software, J.W.; validation, J.W. and L.Y.; formal analysis, J.W., L.Y. and F.L.; investigation, J.W.; resources, F.L.; data curation, J.W.; writing—original draft preparation, J.W.; writing—review and editing, J.W., L.Y. and F.L.; visualization, J.W.; supervision, L.Y. and F.L.; project administration, F.L.; funding acquisition, F.L. All authors have read and agreed to the published version of the manuscript.
Funding
This research was funded by the National Natural Science Foundation of China grant number U1903213.
Institutional Review Board Statement
Not applicable.
Informed Consent Statement
Not applicable.
Data Availability Statement
Conflicts of Interest
The authors declare no conflict of interest.
References
- Xia, G.S.; Bai, X.; Ding, J.; Zhu, Z.; Belongie, S.; Luo, J.; Datcu, M.; Pelillo, M.; Zhang, L. DOTA: A large-scale dataset for object detection in aerial images. In Proceedings of the IEEE Conference on Computer Vision and Pattern Recognition (CVPR), Salt Lake City, UT, USA, 18-22 June 2018; pp. 3974–3983. [Google Scholar]
- Liu, Z.; Yuan, L.; Weng, L.; Yang, Y. A high resolution optical satellite image dataset for ship recognition and some new baselines. In Proceedings of the International Conference on Pattern Recognition Applications and Methods, SCITEPRESS, Porto, Portugal, 24–26 February 2017; Volume 2, pp. 324–331. [Google Scholar]
- Karatzas, D.; Gomez-Bigorda, L.; Nicolaou, A.; Ghosh, S.; Bagdanov, A.; Iwamura, M.; Matas, J.; Neumann, L.; Chandrasekhar, V.R.; Lu, S.; et al. ICDAR 2015 competition on robust reading. In Proceedings of the 2015 13th International Conference on Document Analysis and Recognition (ICDAR), Nancy, France, 23–26 August 2015; pp. 1156–1160. [Google Scholar]
- Nayef, N.; Yin, F.; Bizid, I.; Choi, H.; Feng, Y.; Karatzas, D.; Luo, Z.; Pal, U.; Rigaud, C.; Chazalon, J.; et al. Icdar2017 robust reading challenge on multi-lingual scene text detection and script identification-rrc-mlt. In Proceedings of the 2017 14th IAPR International Conference on Document analysis and Recognition (ICDAR), Kyoto, Japan, 13–15 November 2017; Volume 1, pp. 1454–1459. [Google Scholar]
- Reggiannini, M.; Righi, M.; Tampucci, M.; Lo Duca, A.; Bacciu, C.; Bedini, L.; D’Errico, A.; Di Paola, C.; Marchetti, A.; Martinelli, M.; et al. Remote sensing for maritime prompt monitoring. J. Mar. Sci. Eng. 2019, 7, 202. [Google Scholar] [CrossRef] [Green Version]
- Moroni, D.; Pieri, G.; Tampucci, M. Environmental decision support systems for monitoring small scale oil spills: Existing solutions, best practices and current challenges. J. Mar. Sci. Eng. 2019, 7, 19. [Google Scholar] [CrossRef] [Green Version]
- Almulihi, A.; Alharithi, F.; Bourouis, S.; Alroobaea, R.; Pawar, Y.; Bouguila, N. Oil spill detection in SAR images using online extended variational learning of dirichlet process mixtures of gamma distributions. Remote Sens. 2021, 13, 2991. [Google Scholar] [CrossRef]
- Zhang, L.; Yang, X.; Shen, J. Frequency variability feature for life signs detection and localization in natural disasters. Remote Sens. 2021, 13, 796. [Google Scholar] [CrossRef]
- Zhang, T.; Zhang, X.; Shi, J.; Wei, S. Depthwise separable convolution neural network for high-speed SAR ship detection. Remote Sens. 2019, 11, 2483. [Google Scholar] [CrossRef] [Green Version]
- Xiao, X.; Wang, B.; Miao, L.; Li, L.; Zhou, Z.; Ma, J.; Dong, D. Infrared and visible image object detection via focused feature enhancement and cascaded semantic extension. Remote Sens. 2021, 13, 2538. [Google Scholar] [CrossRef]
- Tong, X.; Sun, B.; Wei, J.; Zuo, Z.; Su, S. EAAU-Net: Enhanced asymmetric attention U-Net for infrared small target detection. Remote Sens. 2021, 13, 3200. [Google Scholar] [CrossRef]
- Zhang, Z.; Guo, W.; Zhu, S.; Yu, W. Toward arbitrary-oriented ship detection with rotated region proposal and discrimination networks. IEEE Geosci. Remote Sens. Lett. 2018, 15, 1745–1749. [Google Scholar] [CrossRef]
- Long, Y.; Gong, Y.; Xiao, Z.; Liu, Q. Accurate object localization in remote sensing images based on convolutional neural networks. IEEE Trans. Geosci. Remote Sens. 2017, 55, 2486–2498. [Google Scholar] [CrossRef]
- Yang, R.; Pan, Z.; Jia, X.; Zhang, L.; Deng, Y. A novel CNN-based detector for ship detection based on rotatable bounding box in SAR images. IEEE J. Sel. Top. Appl. Earth Obs. Remote Sens. 2021, 14, 1938–1958. [Google Scholar] [CrossRef]
- Tian, L.; Cao, Y.; He, B.; Zhang, Y.; He, C.; Li, D. Image enhancement driven by object characteristics and dense feature reuse network for ship target detection in remote sensing imagery. Remote Sens. 2021, 13, 1327. [Google Scholar] [CrossRef]
- Dong, Y.; Chen, F.; Han, S.; Liu, H. Ship object detection of remote sensing image based on visual attention. Remote Sens. 2021, 13, 3192. [Google Scholar] [CrossRef]
- Lin, T.Y.; Maire, M.; Belongie, S.; Hays, J.; Perona, P.; Ramanan, D.; Dollár, P.; Zitnick, C.L. Microsoft coco: Common objects in context. In Proceedings of the European Conference on Computer Vision, Zurich, Switzerland, 6–12 September 2014; pp. 740–755. [Google Scholar]
- Everingham, M.; Van Gool, L.; Williams, C.K.; Winn, J.; Zisserman, A. The pascal visual object classes (voc) challenge. Int. J. Comput. Vis. 2010, 88, 303–338. [Google Scholar] [CrossRef] [Green Version]
- Yang, X.; Yan, J. Arbitrary-oriented object detection with circular smooth label. In Proceedings of the European Conference on Computer Vision, Glasgow, UK, 23–28 August 2020; pp. 677–694. [Google Scholar]
- Dai, J.; Qi, H.; Xiong, Y.; Li, Y.; Zhang, G.; Hu, H.; Wei, Y. Deformable convolutional networks. In Proceedings of the IEEE International Conference on Computer Vision, Venice, Italy, 22–29 October 2017; pp. 764–773. [Google Scholar]
- Zhu, X.; Hu, H.; Lin, S.; Dai, J. Deformable convnets v2: More deformable, better results. In Proceedings of the IEEE/CVF Conference on Computer Vision and Pattern Recognition, Long Beach, CA, USA, 16–20 June 2019; pp. 9308–9316. [Google Scholar]
- Ren, S.; He, K.; Girshick, R.; Sun, J. Faster r-cnn: Towards real-time object detection with region proposal networks. Adv. Neural Inf. Process. Syst. 2015, 28, 91–99. [Google Scholar] [CrossRef] [PubMed] [Green Version]
- He, K.; Gkioxari, G.; Dollár, P.; Girshick, R. Mask r-cnn. In Proceedings of the IEEE International Conference on Computer Vision, Venice, Italy, 22–29 October 2017; pp. 2961–2969. [Google Scholar]
- Dai, J.; Li, Y.; He, K.; Sun, J. R-fcn: Object detection via region-based fully convolutional networks. In Proceedings of the Advances in Neural Information Processing Systems, Barcelona, Spain, 5–10 December 2016; pp. 379–387. [Google Scholar]
- Lin, T.Y.; Dollár, P.; Girshick, R.; He, K.; Hariharan, B.; Belongie, S. Feature pyramid networks for object detection. In Proceedings of the IEEE Conference On Computer Vision and Pattern Recognition, Honolulu, HI, USA, 21–26 July 2017; pp. 2117–2125. [Google Scholar]
- Girshick, R. Fast r-cnn. In Proceedings of the IEEE International Conference on Computer Vision, Santiago, Chile, 7–13 December 2015; pp. 1440–1448. [Google Scholar]
- Liu, W.; Anguelov, D.; Erhan, D.; Szegedy, C.; Reed, S.; Fu, C.Y.; Berg, A.C. Ssd: Single shot multibox detector. In Proceedings of the European Conference on Computer Vision, Amsterdam, The Netherlands, 8–16 October 2016; pp. 21–37. [Google Scholar]
- Redmon, J.; Divvala, S.; Girshick, R.; Farhadi, A. You only look once: Unified, real-time object detection. In Proceedings of the IEEE Conference on Computer Vision and Pattern Recognition, Las Vegas, NV, USA, 27–30 June 2016; pp. 779–788. [Google Scholar]
- Redmon, J.; Farhadi, A. YOLO9000: Better, faster, stronger. In Proceedings of the IEEE Conference on Computer Vision and Pattern Recognition, Honolulu, HI, USA, 21–26 July 2017; pp. 7263–7271. [Google Scholar]
- Redmon, J.; Farhadi, A. Yolov3: An incremental improvement. arXiv 2018, arXiv:1804.02767. [Google Scholar]
- Lin, T.Y.; Goyal, P.; Girshick, R.; He, K.; Dollár, P. Focal loss for dense object detection. In Proceedings of the IEEE International Conference on Computer Vision, Venice, Italy, 22–29 October 2017; pp. 2980–2988. [Google Scholar]
- Zhang, S.; Wen, L.; Bian, X.; Lei, Z.; Li, S.Z. Single-Shot refinement neural network for object detection. In Proceedings of the IEEE Conference on Computer Vision and Pattern Recognition (CVPR), Salt Lake City, UT, USA, 18–22 June 2018; pp. 4203–4212. [Google Scholar]
- Liu, S.; Huang, D. Receptive field block net for accurate and fast object detection. In Proceedings of the European Conference on Computer Vision (ECCV), Munich, Germany, 8–14 September 2018; pp. 385–400. [Google Scholar]
- Zhou, X.; Zhuo, J.; Krahenbuhl, P. Bottom-up object detection by grouping extreme and center points. In Proceedings of the IEEE/CVF Conference on Computer Vision and Pattern Recognition, Long Beach, CA, USA, 16–20 June 2019; pp. 850–859. [Google Scholar]
- Zhang, S.; Chi, C.; Yao, Y.; Lei, Z.; Li, S.Z. Bridging the gap between anchor-based and anchor-free detection via adaptive training sample selection. In Proceedings of the IEEE/CVF Conference on Computer Vision and Pattern Recognition, Seattle, WA, USA, 14–19 June 2020; pp. 9759–9768. [Google Scholar]
- Law, H.; Deng, J. Cornernet: Detecting objects as paired keypoints. In Proceedings of the European Conference on Computer Vision (ECCV), Munich, Germany, 8–14 September 2018; pp. 734–750. [Google Scholar]
- Zhou, X.; Wang, D.; Krähenbühl, P. Objects as points. arXiv 2019, arXiv:1904.07850. [Google Scholar]
- Tian, Z.; Shen, C.; Chen, H.; He, T. Fcos: Fully convolutional one-stage object detection. In Proceedings of the IEEE/CVF International Conference on Computer Vision, Seoul, Korea, 27 October–2 November 2019; pp. 9627–9636. [Google Scholar]
- Ma, J.; Shao, W.; Ye, H.; Wang, L.; Wang, H.; Zheng, Y.; Xue, X. Arbitrary-oriented scene text detection via rotation proposals. IEEE Trans. Multimed. 2018, 20, 3111–3122. [Google Scholar] [CrossRef] [Green Version]
- Liao, M.; Shi, B.; Bai, X. Textboxes++: A single-shot oriented scene text detector. IEEE Trans. Image Process. 2018, 27, 3676–3690. [Google Scholar] [CrossRef] [Green Version]
- Azimi, S.M.; Vig, E.; Bahmanyar, R.; Körner, M.; Reinartz, P. Towards multi-class object detection in unconstrained remote sensing imagery. In Proceedings of the Asian Conference on Computer Vision, Perth, Australia, 2–6 December 2018; pp. 150–165. [Google Scholar]
- Ding, J.; Xue, N.; Long, Y.; Xia, G.S.; Lu, Q. Learning roi transformer for oriented object detection in aerial images. In Proceedings of the IEEE/CVF Conference on Computer Vision and Pattern Recognition, Long Beach, CA, USA, 16–20 June 2019; pp. 2849–2858. [Google Scholar]
- Yang, X.; Liu, Q.; Yan, J.; Li, A.; Zhang, Z.; Yu, G. R3det: Refined single-stage detector with feature refinement for rotating object. arXiv 2019, arXiv:1908.05612. [Google Scholar]
- Li, Y.; Mao, H.; Liu, R.; Pei, X.; Jiao, L.; Shang, R. A lightweight keypoint-based oriented object detection of remote sensing images. Remote Sens. 2021, 13, 2459. [Google Scholar] [CrossRef]
- Ming, Q.; Miao, L.; Zhou, Z.; Song, J.; Yang, X. Sparse label assignment for oriented object detection in aerial images. Remote Sens. 2021, 13, 2664. [Google Scholar] [CrossRef]
- Qing, Y.; Liu, W.; Feng, L.; Gao, W. Improved YOLO network for free-angle remote sensing target detection. Remote Sens. 2021, 13, 2171. [Google Scholar] [CrossRef]
- Yang, X.; Sun, H.; Fu, K.; Yang, J.; Sun, X.; Yan, M.; Guo, Z. Automatic Ship Detection in Remote Sensing Images from Google Earth of Complex Scenes Based on Multiscale Rotation Dense Feature Pyramid Networks. Remote Sens. 2018, 10, 132. [Google Scholar] [CrossRef] [Green Version]
- He, K.; Zhang, X.; Ren, S.; Sun, J. Deep residual learning for image recognition. In Proceedings of the IEEE Conference on Computer Vision and Pattern Recognition, Las Vegas, NV, USA, 27–30 June 2016; pp. 770–778. [Google Scholar]
- Deng, J.; Dong, W.; Socher, R.; Li, L.J.; Li, K.; Fei-Fei, L. Imagenet: A large-scale hierarchical image database. In Proceedings of the 2009 IEEE Conference on Computer Vision and Pattern Recognition, Miami, FL, USA, 20–25 June 2009; pp. 248–255. [Google Scholar]
- Kingma, D.P.; Ba, J. Adam: A method for stochastic optimization. arXiv 2014, arXiv:1412.6980. [Google Scholar]
- Zhang, G.; Lu, S.; Zhang, W. CAD-Net: A context-aware detection network for objects in remote sensing imagery. IEEE Trans. Geosci. Remote. Sens. 2019, 57, 10015–10024. [Google Scholar] [CrossRef] [Green Version]
- Li, C.; Xu, C.; Cui, Z.; Wang, D.; Zhang, T.; Yang, J. Feature-attentioned object detection in remote sensing imagery. In Proceedings of the 2019 IEEE International Conference on Image Processing (ICIP), Taipei, Taiwan, 22–25 September 2019; pp. 3886–3890. [Google Scholar]
- Yang, F.; Li, W.; Hu, H.; Li, W.; Wang, P. Multi-scale feature integrated attention-based rotation network for object detection in VHR aerial images. Sensors 2020, 20, 1686. [Google Scholar] [CrossRef] [Green Version]
- Qian, W.; Yang, X.; Peng, S.; Guo, Y.; Yan, J. Learning modulated loss for rotated object detection. arXiv 2019, arXiv:1911.08299. [Google Scholar]
- Jiang, Y.; Zhu, X.; Wang, X.; Yang, S.; Li, W.; Wang, H.; Fu, P.; Luo, Z. R2cnn: Rotational region cnn for orientation robust scene text detection. arXiv 2017, arXiv:1706.09579. [Google Scholar]
- Yi, J.; Wu, P.; Liu, B.; Huang, Q.; Qu, H.; Metaxas, D. Oriented object detection in aerial images with box boundary-aware vectors. In Proceedings of the IEEE/CVF Winter Conference on Applications of Computer Vision, Waikoloa, HI, USA, 5–9 January 2021; pp. 2150–2159. [Google Scholar]
- Yang, X.; Yang, J.; Yan, J.; Zhang, Y.; Zhang, T.; Guo, Z.; Sun, X.; Fu, K. Scrdet: Towards more robust detection for small, cluttered and rotated objects. In Proceedings of the IEEE/CVF International Conference on Computer Vision, Seoul, Korea, 27 October–2 November 2019; pp. 8232–8241. [Google Scholar]
- Wang, Y.; Zhang, Y.; Zhang, Y.; Zhao, L.; Sun, X.; Guo, Z. SARD: Towards scale-aware rotated object detection in aerial imagery. IEEE Access 2019, 7, 173855–173865. [Google Scholar] [CrossRef]
- Li, C.; Luo, B.; Hong, H.; Su, X.; Wang, Y.; Liu, J.; Wang, C.; Zhang, J.; Wei, L. Object Detection Based on Global-Local Saliency Constraint in Aerial Images. Remote Sens. 2020, 12, 1435. [Google Scholar] [CrossRef]
- Yang, X.; Hou, L.; Zhou, Y.; Wang, W.; Yan, J. Dense label encoding for boundary discontinuity free rotation detection. In Proceedings of the IEEE/CVF Conference on Computer Vision and Pattern Recognition, Nashville, TN, USA, 19–25 June 2021; pp. 15819–15829. [Google Scholar]
Figure 1.
Examples of Low overlap and Densely arranged (Left), Arbitrary orientations of objects (Middle), and Drastic scale changes (Right) in remote sensing images.
Figure 1.
Examples of Low overlap and Densely arranged (Left), Arbitrary orientations of objects (Middle), and Drastic scale changes (Right) in remote sensing images.
Figure 2.
Overall architecture of our proposed center-point based arbitrary-oriented object detector.
Figure 2.
Overall architecture of our proposed center-point based arbitrary-oriented object detector.
Figure 3.
Five-parameter long side-based representation for oriented objects.
Figure 3.
Five-parameter long side-based representation for oriented objects.
Figure 4.
An example of discontinuous angular boundary based on the five-parameter long side representation.
Figure 4.
An example of discontinuous angular boundary based on the five-parameter long side representation.
Figure 5.
Visualization of the circular smooth label.
Figure 5.
Visualization of the circular smooth label.
Figure 6.
Different kinds of necks to process the backbone features: (a) A direct Top-down pathway without the feature pyramid structure; (b) our proposed Deformable FPN; and (c) standard FPN.
Figure 6.
Different kinds of necks to process the backbone features: (a) A direct Top-down pathway without the feature pyramid structure; (b) our proposed Deformable FPN; and (c) standard FPN.
Figure 7.
Illustration of 3 × 3 deformable convolution: (a) One deformable group; and (b) n deformable groups.
Figure 7.
Illustration of 3 × 3 deformable convolution: (a) One deformable group; and (b) n deformable groups.
Figure 8.
Visualization of detection results on DOTA.
Figure 8.
Visualization of detection results on DOTA.
Figure 9.
Visualization of detection results on HRSC2016.
Figure 9.
Visualization of detection results on HRSC2016.
Figure 10.
Visualization of predicted center heatmaps for some categories.
Figure 10.
Visualization of predicted center heatmaps for some categories.
Table 1.
Three kinds of necks are used to build arbitrary-oriented object detectors: Feature pyramid network (FPN), direct Top-down structure (DTS), and Deformable FPN(De-FPN). HRT denotes using High-Resolution crop during Testing. All models use ImageNet-pretrained ResNet50 as a backbone.
Table 1.
Three kinds of necks are used to build arbitrary-oriented object detectors: Feature pyramid network (FPN), direct Top-down structure (DTS), and Deformable FPN(De-FPN). HRT denotes using High-Resolution crop during Testing. All models use ImageNet-pretrained ResNet50 as a backbone.
| Neck | HRT | PL | BD | BR | GTF | SV | LV | SH | TC | BC | ST | SBF | RA | HA | SP | HC | mAP |
|---|
| FPN | | 88.36 | 78.03 | 45.35 | 57.90 | 76.52 | 78.24 | 85.12 | 90.63 | 78.89 | 82.23 | 39.04 | 61.21 | 62.56 | 70.64 | 50.50 | 69.68 |
| DTS | | 88.79 | 82.99 | 42.75 | 59.31 | 76.53 | 77.15 | 85.17 | 90.76 | 79.84 | 82.27 | 49.59 | 59.68 | 63.98 | 68.15 | 56.28 | 70.88 |
| De-FPN | | 88.73 | 80.71 | 46.36 | 67.10 | 78.16 | 80.51 | 86.32 | 90.67 | 79.84 | 81.66 | 45.91 | 63.66 | 66.89 | 71.22 | 53.87 | 72.11 |
| FPN | √ | 89.15 | 78.98 | 47.07 | 59.17 | 76.78 | 79.14 | 86.89 | 90.80 | 79.51 | 83.67 | 46.60 | 60.83 | 66.81 | 72.77 | 53.84 | 71.47 |
| DTS | √ | 89.70 | 84.72 | 45.00 | 67.62 | 76.64 | 78.23 | 86.60 | 90.78 | 79.66 | 83.59 | 54.91 | 59.84 | 67.08 | 70.29 | 64.32 | 73.27 |
| De-FPN | √ | 89.47 | 81.96 | 46.89 | 70.72 | 77.01 | 81.44 | 87.32 | 90.81 | 80.06 | 83.68 | 46.27 | 63.55 | 73.62 | 72.91 | 60.62 | 73.76 |
Table 2.
State-of-the-Art comparison with other methods in the oriented object detection task in the DOTA test set. AP for each category and overall mAP on DOTA are provided (the best result is highlighted in bold), where MS denotes multi-scale training and testing and * denotes that larger deformable groups ( in Deformable FPN) were used.
| Method | Backbone | MS | PL | BD | BR | GTF | SV | LV | SH | TC | BC | ST | SBF | RA | HA | SP | HC | mAP |
|---|
| SSD [27] | VGG16 | | 41.06 | 24.31 | 4.55 | 17.10 | 15.93 | 7.72 | 13.21 | 39.96 | 12.05 | 46.88 | 9.09 | 30.82 | 1.36 | 3.50 | 0.00 | 17.84 |
| YOLOv2 [29] | Darknet19 | | 52.75 | 24.24 | 10.60 | 35.50 | 14.36 | 2.41 | 7.37 | 51.79 | 43.98 | 31.35 | 22.30 | 36.68 | 14.61 | 22.55 | 11.89 | 25.49 |
| FR-H [22] | ResNet50 | | 49.74 | 64.22 | 9.38 | 56.66 | 19.18 | 14.17 | 9.51 | 61.61 | 65.47 | 57.52 | 51.36 | 49.41 | 20.80 | 45.84 | 24.38 | 39.95 |
| FR-O [1] | ResNet50 | | 79.42 | 77.13 | 17.70 | 64.05 | 35.30 | 38.02 | 37.16 | 89.41 | 69.64 | 59.28 | 50.30 | 52.91 | 47.89 | 47.40 | 46.30 | 54.13 |
| RetinaNet-R [43] | ResNet50 | | 88.90 | 67.70 | 33.60 | 56.80 | 66.10 | 73.30 | 75.20 | 90.90 | 74.00 | 75.10 | 43.80 | 56.70 | 51.10 | 55.70 | 21.50 | 62.00 |
| RetinaNet-H [43] | ResNet50 | | 88.90 | 74.50 | 40.10 | 58.00 | 63.10 | 50.60 | 63.60 | 90.90 | 77.90 | 76.40 | 48.30 | 55.90 | 50.70 | 60.20 | 34.20 | 62.20 |
| RSDet [54] | ResNet50 | | 89.30 | 82.70 | 47.70 | 63.90 | 66.80 | 62.00 | 67.30 | 90.80 | 85.30 | 82.40 | 62.30 | 62.40 | 65.70 | 68.60 | 64.60 | 70.80 |
| CenterRot (Ours) | ResNet50 | | 89.47 | 81.96 | 46.89 | 70.72 | 77.01 | 81.44 | 87.32 | 90.81 | 80.06 | 83.68 | 46.27 | 63.55 | 73.62 | 72.91 | 60.62 | 73.76 |
| R-FCN [24] | ResNet101 | | 39.57 | 46.13 | 3.03 | 38.46 | 9.10 | 3.66 | 7.45 | 41.97 | 50.43 | 66.98 | 40.34 | 51.28 | 11.14 | 35.59 | 17.45 | 30.84 |
| R-DFPN [47] | ResNet101 | | 80.92 | 65.82 | 33.77 | 58.94 | 55.77 | 50.94 | 54.78 | 90.33 | 66.34 | 68.66 | 48.73 | 51.76 | 55.10 | 51.32 | 35.88 | 57.94 |
| RCNN [55] | ResNet101 | | 80.94 | 65.67 | 35.34 | 67.44 | 59.92 | 50.91 | 55.81 | 90.67 | 66.92 | 72.39 | 55.06 | 52.23 | 55.14 | 53.35 | 48.22 | 60.67 |
| RRPN [39] | ResNet101 | | 88.52 | 71.20 | 31.66 | 59.30 | 51.85 | 56.19 | 57.25 | 90.81 | 72.84 | 67.38 | 56.69 | 52.84 | 53.08 | 51.94 | 53.58 | 61.01 |
| ICN [41] | ResNet101 | √ | 81.40 | 74.30 | 47.70 | 70.30 | 64.90 | 67.80 | 70.00 | 90.80 | 79.10 | 78.20 | 53.60 | 62.90 | 67.00 | 64.20 | 50.20 | 68.20 |
| ROI Trans [42] | ResNet101 | √ | 88.64 | 78.52 | 43.44 | 75.92 | 68.81 | 73.68 | 83.59 | 90.74 | 77.27 | 81.46 | 58.39 | 53.34 | 62.83 | 58.93 | 47.67 | 69.56 |
| CAD-Net [51] | ResNet101 | | 87.80 | 82.40 | 49.40 | 73.50 | 71.10 | 63.50 | 76.70 | 90.90 | 79.20 | 73.30 | 48.40 | 60.90 | 62.00 | 67.00 | 62.20 | 69.90 |
| RSDet [54] | ResNet101 | | 89.80 | 82.90 | 48.60 | 65.20 | 69.50 | 70.10 | 70.20 | 90.50 | 85.60 | 83.40 | 62.50 | 63.90 | 65.60 | 67.20 | 68.00 | 72.20 |
| BBAVectors [56] | ResNet101 | √ | 88.35 | 79.96 | 50.69 | 62.18 | 78.43 | 78.98 | 87.94 | 90.85 | 83.58 | 84.35 | 54.13 | 60.24 | 65.22 | 64.28 | 55.70 | 72.32 |
| SCRDet [57] | ResNet101 | √ | 89.98 | 80.65 | 52.09 | 68.36 | 68.36 | 60.32 | 72.41 | 90.85 | 87.94 | 86.86 | 65.02 | 66.68 | 66.25 | 68.24 | 65.21 | 72.61 |
| SARD [58] | ResNet101 | | 89.93 | 84.11 | 54.19 | 72.04 | 68.41 | 61.18 | 66.00 | 90.82 | 87.79 | 86.59 | 65.65 | 64.04 | 66.68 | 68.84 | 68.03 | 72.95 |
| GLS-Net [59] | ResNet101 | | 88.65 | 77.40 | 51.20 | 71.03 | 73.30 | 72.16 | 84.68 | 90.87 | 80.43 | 85.38 | 58.33 | 62.27 | 67.58 | 70.69 | 60.42 | 72.96 |
| FADet [52] | ResNet101 | √ | 90.21 | 79.58 | 45.49 | 76.41 | 73.18 | 68.27 | 79.56 | 90.83 | 83.40 | 84.68 | 53.40 | 65.42 | 74.17 | 69.69 | 64.86 | 73.28 |
| CenterRot (Ours) | ResNet101 | | 89.74 | 83.57 | 49.53 | 66.45 | 77.07 | 80.57 | 86.97 | 90.75 | 81.50 | 84.05 | 54.14 | 64.14 | 74.22 | 72.77 | 54.56 | 74.00 |
| MFIAR-Net [53] | ResNet152 | √ | 89.62 | 84.03 | 52.41 | 70.30 | 70.13 | 67.64 | 77.81 | 90.85 | 85.40 | 86.22 | 63.21 | 64.14 | 68.31 | 70.21 | 62.11 | 73.49 |
| RDet [43] | ResNet152 | | 89.49 | 81.17 | 50.53 | 66.10 | 70.92 | 78.66 | 78.21 | 90.81 | 85.26 | 84.23 | 61.81 | 63.77 | 68.16 | 69.83 | 67.17 | 73.74 |
| RSDet-Refine [54] | ResNet152 | | 90.10 | 82.00 | 53.80 | 68.50 | 70.20 | 78.70 | 73.60 | 91.20 | 87.10 | 84.70 | 64.30 | 68.20 | 66.10 | 69.30 | 63.70 | 74.10 |
| CenterRot * (Ours) | ResNet152 | | 89.69 | 81.42 | 51.16 | 68.82 | 78.77 | 81.45 | 87.23 | 90.82 | 80.31 | 84.27 | 56.13 | 64.24 | 75.80 | 74.68 | 56.51 | 74.75 |
Table 3.
State-of-the-art comparison of HRSC2016. mAP 07(12) means using the 2007(2012) evaluation metric.
Table 3.
State-of-the-art comparison of HRSC2016. mAP 07(12) means using the 2007(2012) evaluation metric.
| Method | Backbone | mAP 07 | mAP 12 |
|---|
| RoI-Trans [42] | ResNet101 | 86.20 | - |
| RetinaNet-R [43] | ResNet101 | 89.18 | 95.21 |
| RDet [43] | ResNet101 | 89.26 | 96.01 |
| RDet-DCL [60] | ResNet101 | 89.46 | 96.41 |
| CenterRot (Ours) | ResNet50 | 90.20 | 96.59 |
Table 4.
Comparison of selected categories in DOTA. All methods use ResNet152 as a backbone.
Table 4.
Comparison of selected categories in DOTA. All methods use ResNet152 as a backbone.
| Method | SV | LV | SH | HA | SBF | RA |
|---|
| MFIAR-Net | 70.13 | 67.64 | 77.81 | 68.31 | 63.21 | 64.14 |
| RDet | 70.92 | 78.66 | 78.21 | 68.16 | 61.81 | 63.77 |
| RSDet-Refine | 70.20 | 78.70 | 73.60 | 66.10 | 64.30 | 68.20 |
| CenterRot (Ours) | 78.77 | 81.45 | 87.23 | 75.80 | 56.13 | 64.24 |
| Publisher’s Note: MDPI stays neutral with regard to jurisdictional claims in published maps and institutional affiliations. |
© 2021 by the authors. Licensee MDPI, Basel, Switzerland. This article is an open access article distributed under the terms and conditions of the Creative Commons Attribution (CC BY) license (https://creativecommons.org/licenses/by/4.0/).


