1. Introduction
Since the launch of the first polar-orbiting environmental operational satellite (POES), the Television Infrared Observation Satellite (TIROS), in 1960 [
1], the earth’s atmosphere has been studied based on POES data. Global numerical weather forecast centers, such as the National Centers for Environmental Prediction (NECP) and the European Centre for Medium-Range Weather Forecasts (ECMWF), have assimilated a large amount of POES microwave and infrared satellite observations in medium-range global forecast models, and demonstrated significant improvements of the forecast skill of numerical weather prediction and greatly narrowed the gap of the forecast scores between the northern and southern hemispheres [
2]. Satellite data can also be used to retrieve the atmospheric temperature and humidity profiles [
3], to estimate the typhoon path and intensity [
4], to monitor atmospheric aerosols [
5], and to study the decadal global warming of the atmosphere [
6]. Since 2008, four Chinese second-generation polar-orbiting meteorological satellites, namely the Fengyun-3 (FY-3) A/B/C/D, were successively launched, and the fifth one in the FY-3 series, FY-3E, is planned to be launched into an early morning orbit in July 2021. The Microwave Temperature Sounder (MWTS) onboard the FY-3A/B was similar to the Microwave Sounding Unit (MSU) onboard the National Oceanic and Atmospheric Administration-14 satellite (NOAA-14), since they both had four temperature sounding channels. The MWTS-2 onboard the FY-3C/D has 13 temperature sounding channels, which are similar to the Advanced Microwave Sounding Unit-A (AMSU-A) channels 3–15 onboard the NOAA-15. After more than 10 years of development, the MWTS-2 onboard the FY-3C/D has become more mature and stable [
7]. The microwave temperature sounders onboard the FY-3 series, the NOAA series, and the European Organization for the Exploitation of Meteorological Satellites Meteorological Operational (MetOp) series of POESs have become the main players of the earth’s atmosphere observation system [
8]. It is of great significance to establish the fundamental climate datasets of microwave temperature sounding observations onboard all POESs. The dataset can be used in the decadal change and variability of typhoons in the Northwest Pacific, the impacts of global warming on typhoon activity, and evaluations of the accuracy, trends, and error sources for Northwest Pacific typhoon intensity forecasts [
9].
In the eye region of a typhoon, there is a warm anomaly relative to its environment. This temperature anomaly is called the warm-core [
10]. Typhoon warm-cores generally appear in their developing and mature stages and are the most significant in their mature stages. Once the warm-core of a typhoon begins to weaken and eventually disappear, the typhoon will degenerate and dissipate. Therefore, the warm-core is a key feature for describing the evolution of typhoons [
11,
12]. The warm-core formation is generally due to the latent heat release within the updraft near and around the eyewall region and the adiabatic warming of the downdraft within the eye. The warm-core affects the minimum sea-level pressure (MSLP) and the maximum sustained surface wind speed (MSSW) of a typhoon according to the thermal wind relationship [
13]. Intensification of a warm-core leads to a reduction of the atmospheric mass, leading to a decrease in the central MSLP of a typhoon. It was found that the strongest center of a warm-core is located between 250 hPa and 300 hPa for most tropical cyclones, such as Hurricane Hilda in 1964, which hit the Gulf of Mexico [
14]. Sometimes, the typhoon warm-core would appear in the middle troposphere near 600 hPa, such as typhoon Megi [
15] and typhoon Lan [
16], which hit the eastern coast of China. Based on model simulations of Hurricane Wilma in 2005, which is one of the few hurricanes to directly hit the Yucatan Channel [
17,
18], it was proposed that the formation and intensification of the warm-core in the upper troposphere (15–16 km) could trigger a rapid intensification (RI) stage of the typhoon. However, there was no significant relationship between the height of the warm-core and the intensity variation of Hurricane Earl in 2010 [
19]. Therefore, the horizontal and vertical structures of warm-cores derivable from satellite microwave temperature sounding observations is of great significance to understand and verify the warm-core height and intensity variations of any particular typhoon.
Compared with sparsely distributed conventional meteorological observations, such as marine buoys, ships, and aircraft dropsondes over the vast ocean, satellite observations have much higher horizontal, vertical, and temporal resolutions. The global analysis data, such as the NCEP global forecast system (GFS) analysis data, sometimes underestimate the typhoon warm-core intensity [
20,
21] and are not available to all users in real-time [
22]. Of course, different satellite instruments have different characteristics. The geostationary operational environmental satellites (GOES), including the GOES-R Advanced Baseline Imager (ABI), the Japanese Advanced Himawari Imager (AHI), and the Chinese Fengyun-4A (FY-4A) Advanced Geostationary Radiation Imager (AGRI), provide high horizontal (~4 km) and temporal resolution (~10 min) data in clear-sky and above the cloud top [
23,
24]. The microwave temperature sounding instruments onboard POES can provide useful observations in both clear-sky and cloudy conditions except for heavy precipitation. Therefore, the TB observations from microwave temperature sounders were used in many studies for retrieving the near-real-time (NRT) three-dimensional (3D) temperature structures of hurricanes, including MSU onboard the National Oceanic and Atmospheric Administration (NOAA)-6 to NOAA-14 satellites [
25], the Advanced Microwave Sounding Unit-A (AMSU-A) onboard NOAA-15 to NOAA-19 satellites [
26], and the Advanced Technology Microwave Sounder (ATMS) onboard Suomi National Polar-Orbiting Partnership and NOAA-20 satellites [
27]. Although a single POES instrument can only observe the same place twice a day, multiple POESs can be combined to capture the developments of hurricanes four or more times daily [
3]. Besides warm-cores, the POES microwave observations can also retrieve the MSLP and MSSW of hurricanes [
28]. Moreover, the forecast skills in typhoon track and intensity can be improved by incorporating the retrieved temperature profiles into vortex initialization [
29].
The purpose of this study is to derive atmospheric temperature distributions within and around typhoons directly from FY-3D MWTS-2 observations of brightness temperature. The largest challenge is the cloud detection since FY-3D MWTS-2 does not provide observations of two window channels with center frequencies located at 23.8 GHz and 31.4 GHz. Three typhoon cases of different sizes and intensities that were located in different environmental flows are selected for demonstrating the success of the proposed effort. The rest of this paper is structured as follows.
Section 2 briefly describes the FY-3D MWTS-2 channel characteristics and three typhoons in August 2019 over the Pacific Ocean selected for this study. The cloud detection algorithm and methodology of the temperature retrieval of the FY-3D MWTS-2 are presented in
Section 3.
Section 4 discusses the warm-core results obtained from the MWTS-2 observations and makes a comparison with the European Centre for Medium-Range Weather Forecasts Reanalysis v5 (ERA5). Summary and conclusion are provided in
Section 5.
2. MWTS-2 and Typhoon Cases
The Fengyun-3D satellite (FY-3D) was successfully launched into space on 14 November 2017. Its local equator crossing time (LECT) is 14:00 local time (LT), and is 0600 UTC at (120° E, 0). The FY-3E satellite has been launched in July 2021, with a LECT of 05:30 LT, and is 2130 UTC at (120° E, 0). FY-3E will be the first early-morning orbit in the FY-3 series [
30]. Each POES provides global observations twice daily. After the launch of FY-3E, a combination of the FY-3D, FY-3E, the European series MetOp-B/C, and the NOAA series S-NPP and NOAA-20 can observe typhoons with relatively high temporal resolution (~12 times daily). Although the MWTS-2 onboard the FY-3D lacks 23.8 GHz and 31.4 GHz window channels for retrieving the cloud liquid water path (LWP) [
31], the cloud detection scheme developed by Niu and Zou [
32,
33] can be applied. The cloud detection scheme is based on the MWTS-2 50.3 GHz bias-corrected observations-minus-backgrounds (
O-B) and can effectively identify more than 97% of cloudy data points of MWTS-2. The two window channels at 23.8 GHz and 31.4 GHz are added to the MWTS-3 onboard the FY-3E. We point out that the cloud detection algorithm is crucial for the accurate retrieval of typhoon warm-cores from FY-3D MWTS-2 observations of brightness temperature (TB).
The FY-3D ascending and the descending node have local equator crossing times (LECTs) at 02:00 and 14:00 LT, respectively. The MWTS-2 onboard FY-3D is a cross-track temperature-sounding radiometer. It scans the earth with a 2.2° beam width to provide 90 field-of-views (FOVs) along a single line.
Figure 1 shows the FOVs along a single scan line (green) as well as the 2nd (blue), 9th (cyan), 25th (orange), and 45th (red, nadir) FOVs distributed in the along-track direction over a portion of the swath over the ocean during the period of typhoon Lekima (2019). The cross-track diameter increases from 32 km at nadir to 110 km at the limb. The FY-3D MWTS-2 has 13 channels whose center frequencies are located between the 50.30–57.29 GHz oxygen absorption bands. The MWTS-2 channels 8–13 have the same center frequency (f
0 = 57.29 GHz). Channel 8 has a single bandwidth. Channels 9–13 are double bandwidths located at f
0 ± 0.322 GHz, arising from a standing acoustic wave filter [
34]. The weighting function peaks (WFPs) of the MWTS-2 channels 1–13 distribute evenly from the surface to the upper stratosphere (
Table 1). The weighting function is the vertical differential of the atmospheric transmittance, and a WFP level indicates where the channel has received the most radiation emitted by the atmosphere at or near this level. Oxygen is a well-mixed gas in the atmosphere. These features of MWTS-2 channels are the physical basis for the temperature regression. The channel number, center frequency, noise equivalent differential temperature (NEDT), beam width, and weighting function peak (WFP) of the FY-3D MWTS-2 are provided in
Table 1. As shown in Niu and Zou (2019, 2020), we can use the 50.3 GHz channel for cloud detection over the ocean. The surface emissivity of the sea (
) is smaller than the emissivity of clouds; thus, the TB values of the 50.3 GHz channel in clear-sky oceanic regions are smaller than under cloudy conditions if atmospheric temperatures in the lower troposphere are similar. The observation error measure NEDT is the smallest (0.75 K) for channels 2–7, and those of channels 11, 12 and 13 are much larger (i.e., 1.7 K, 2.4 K, and 3.6 K, respectively).
This study takes up three typhoons (Francisco, Lekima, and Krosa) in the monsoon trough during the 2019 season as case studies.
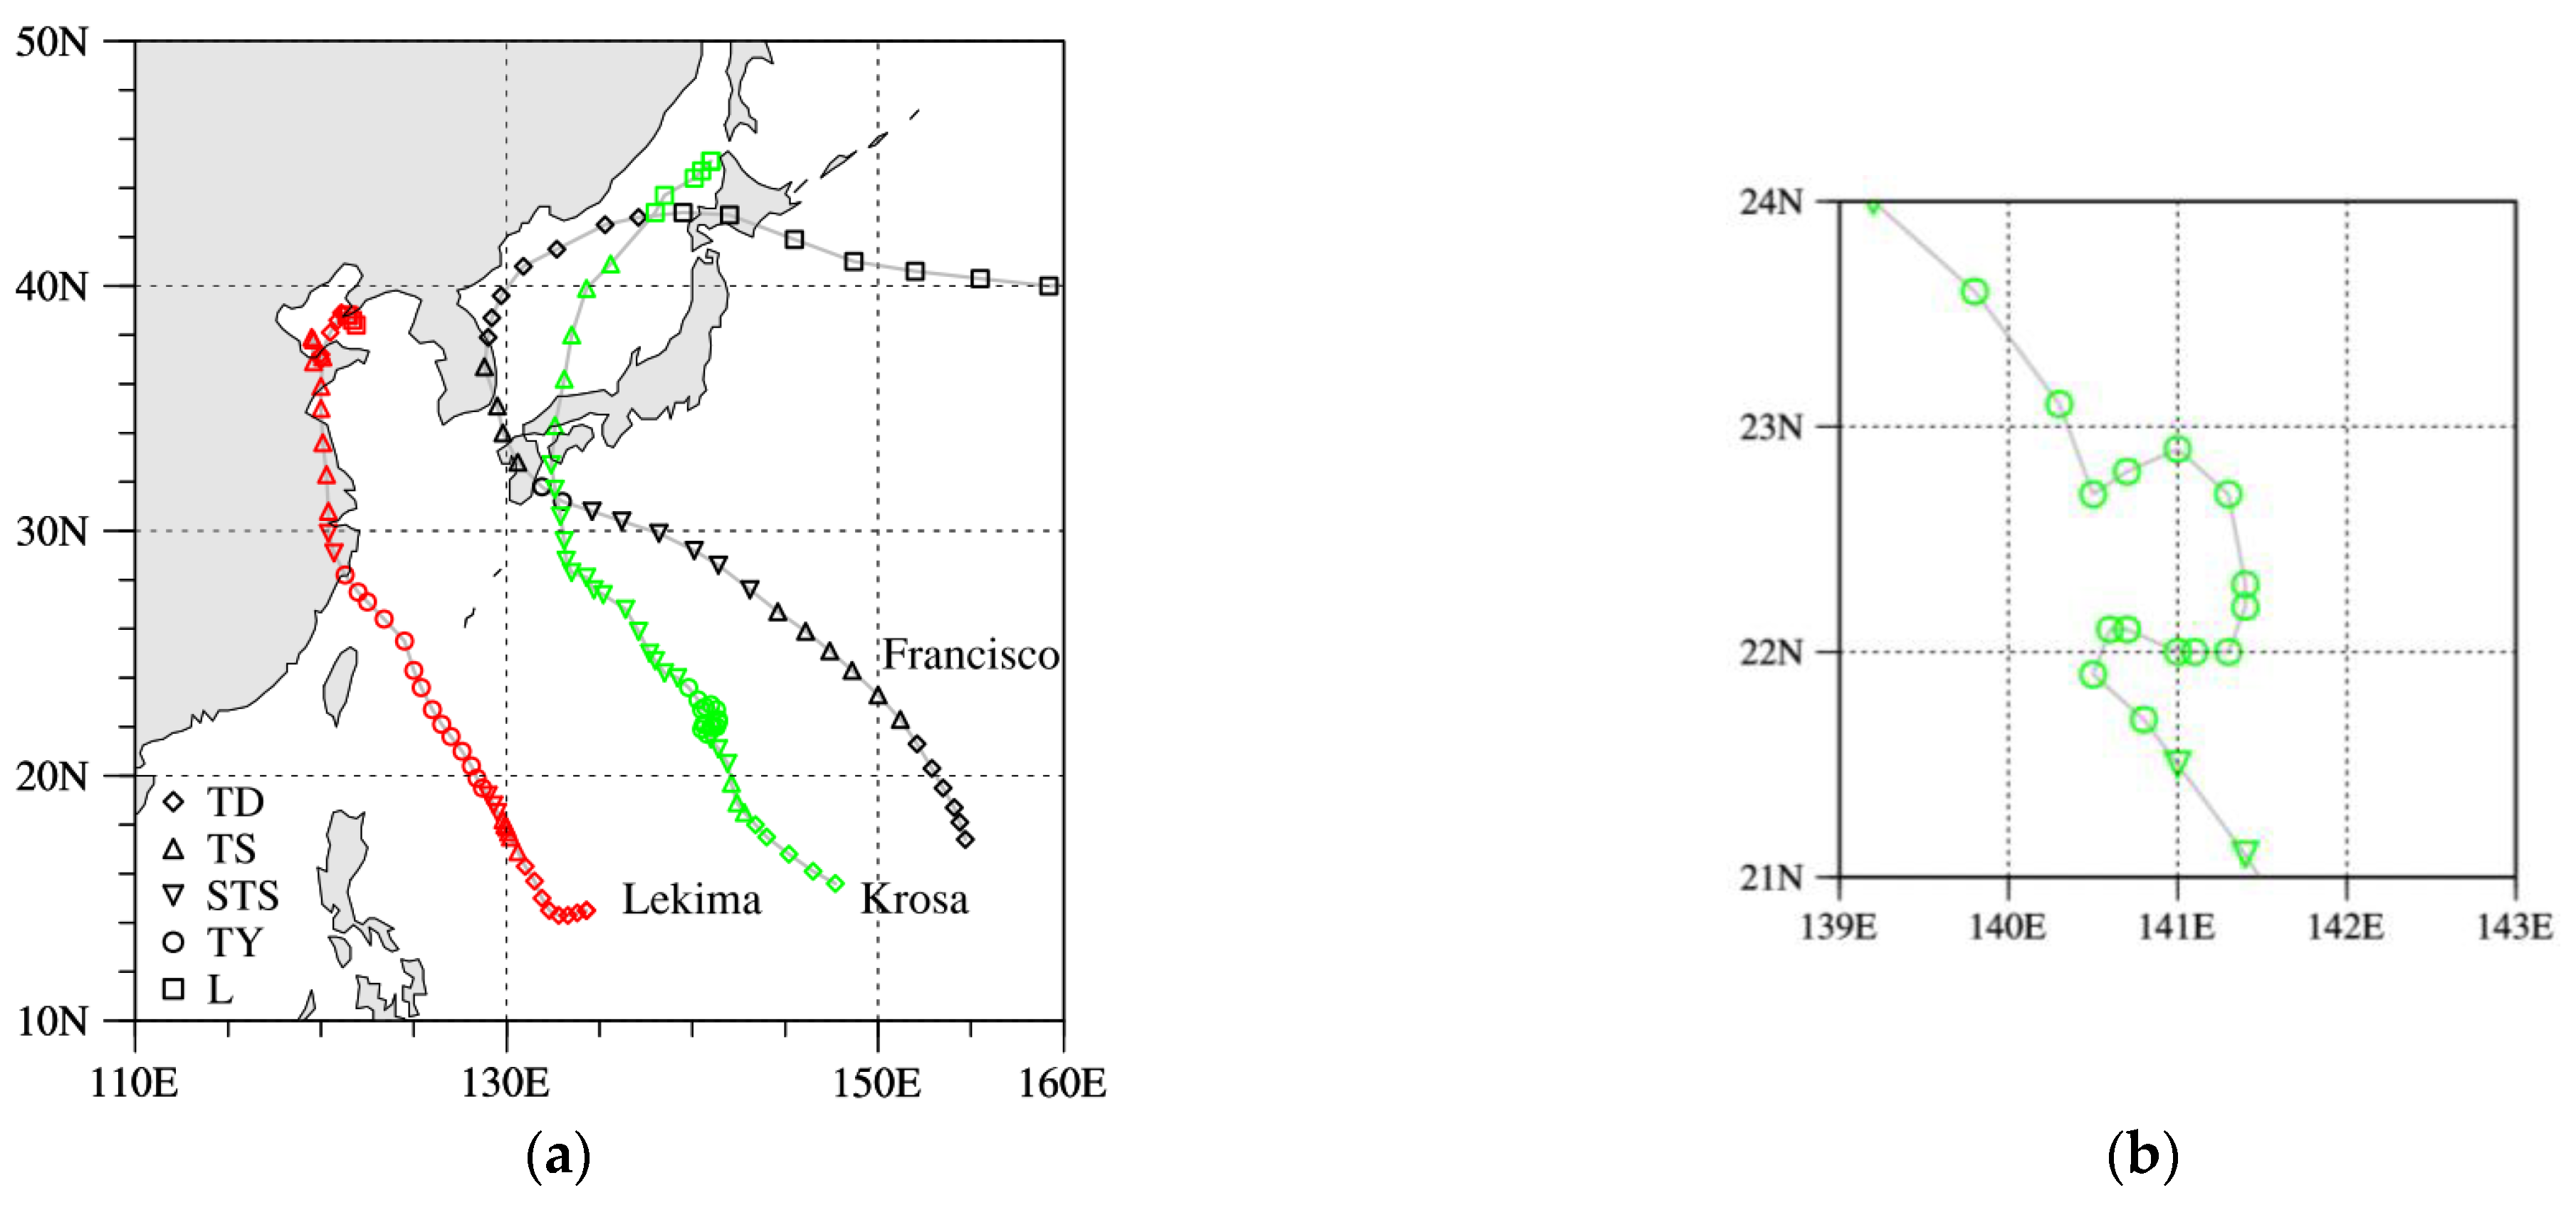
Figure 1 shows their observed tracks based on the best track data from the Regional Specialized Meteorological Center in Tokyo. Lekima formed in a tropical cloud cluster east of the Philippine Sea as a tropical depression at 0600 UTC on 2 August 2019. It developed into a typhoon at about 1800 UTC on August 6. Lekima landed on Wenling City with a maximum sustained wind of 50 m s
−1 (
Figure 2c) at 0600 UTC on 8 August 2019, while causing severe rainstorms and disasters in Zhejiang, Jiangsu, and Shanghai provinces. Typhoon Krosa formed at 0000 UTC on August 5 and dissipated at 1200 UTC on 17 August 2019. Krosa was stagnant and rotated during the period from 0000 UTC on August 8 to 1800 UTC on 10 August 2019 (
Figure 2b). The temporal evolutions of the radii of 30- and 64-kt (1 kt = 0.51 m s
−1) winds from 2 August to 16 August are shown in
Figure 2d, which indicates the typhoon’s size and intensity.
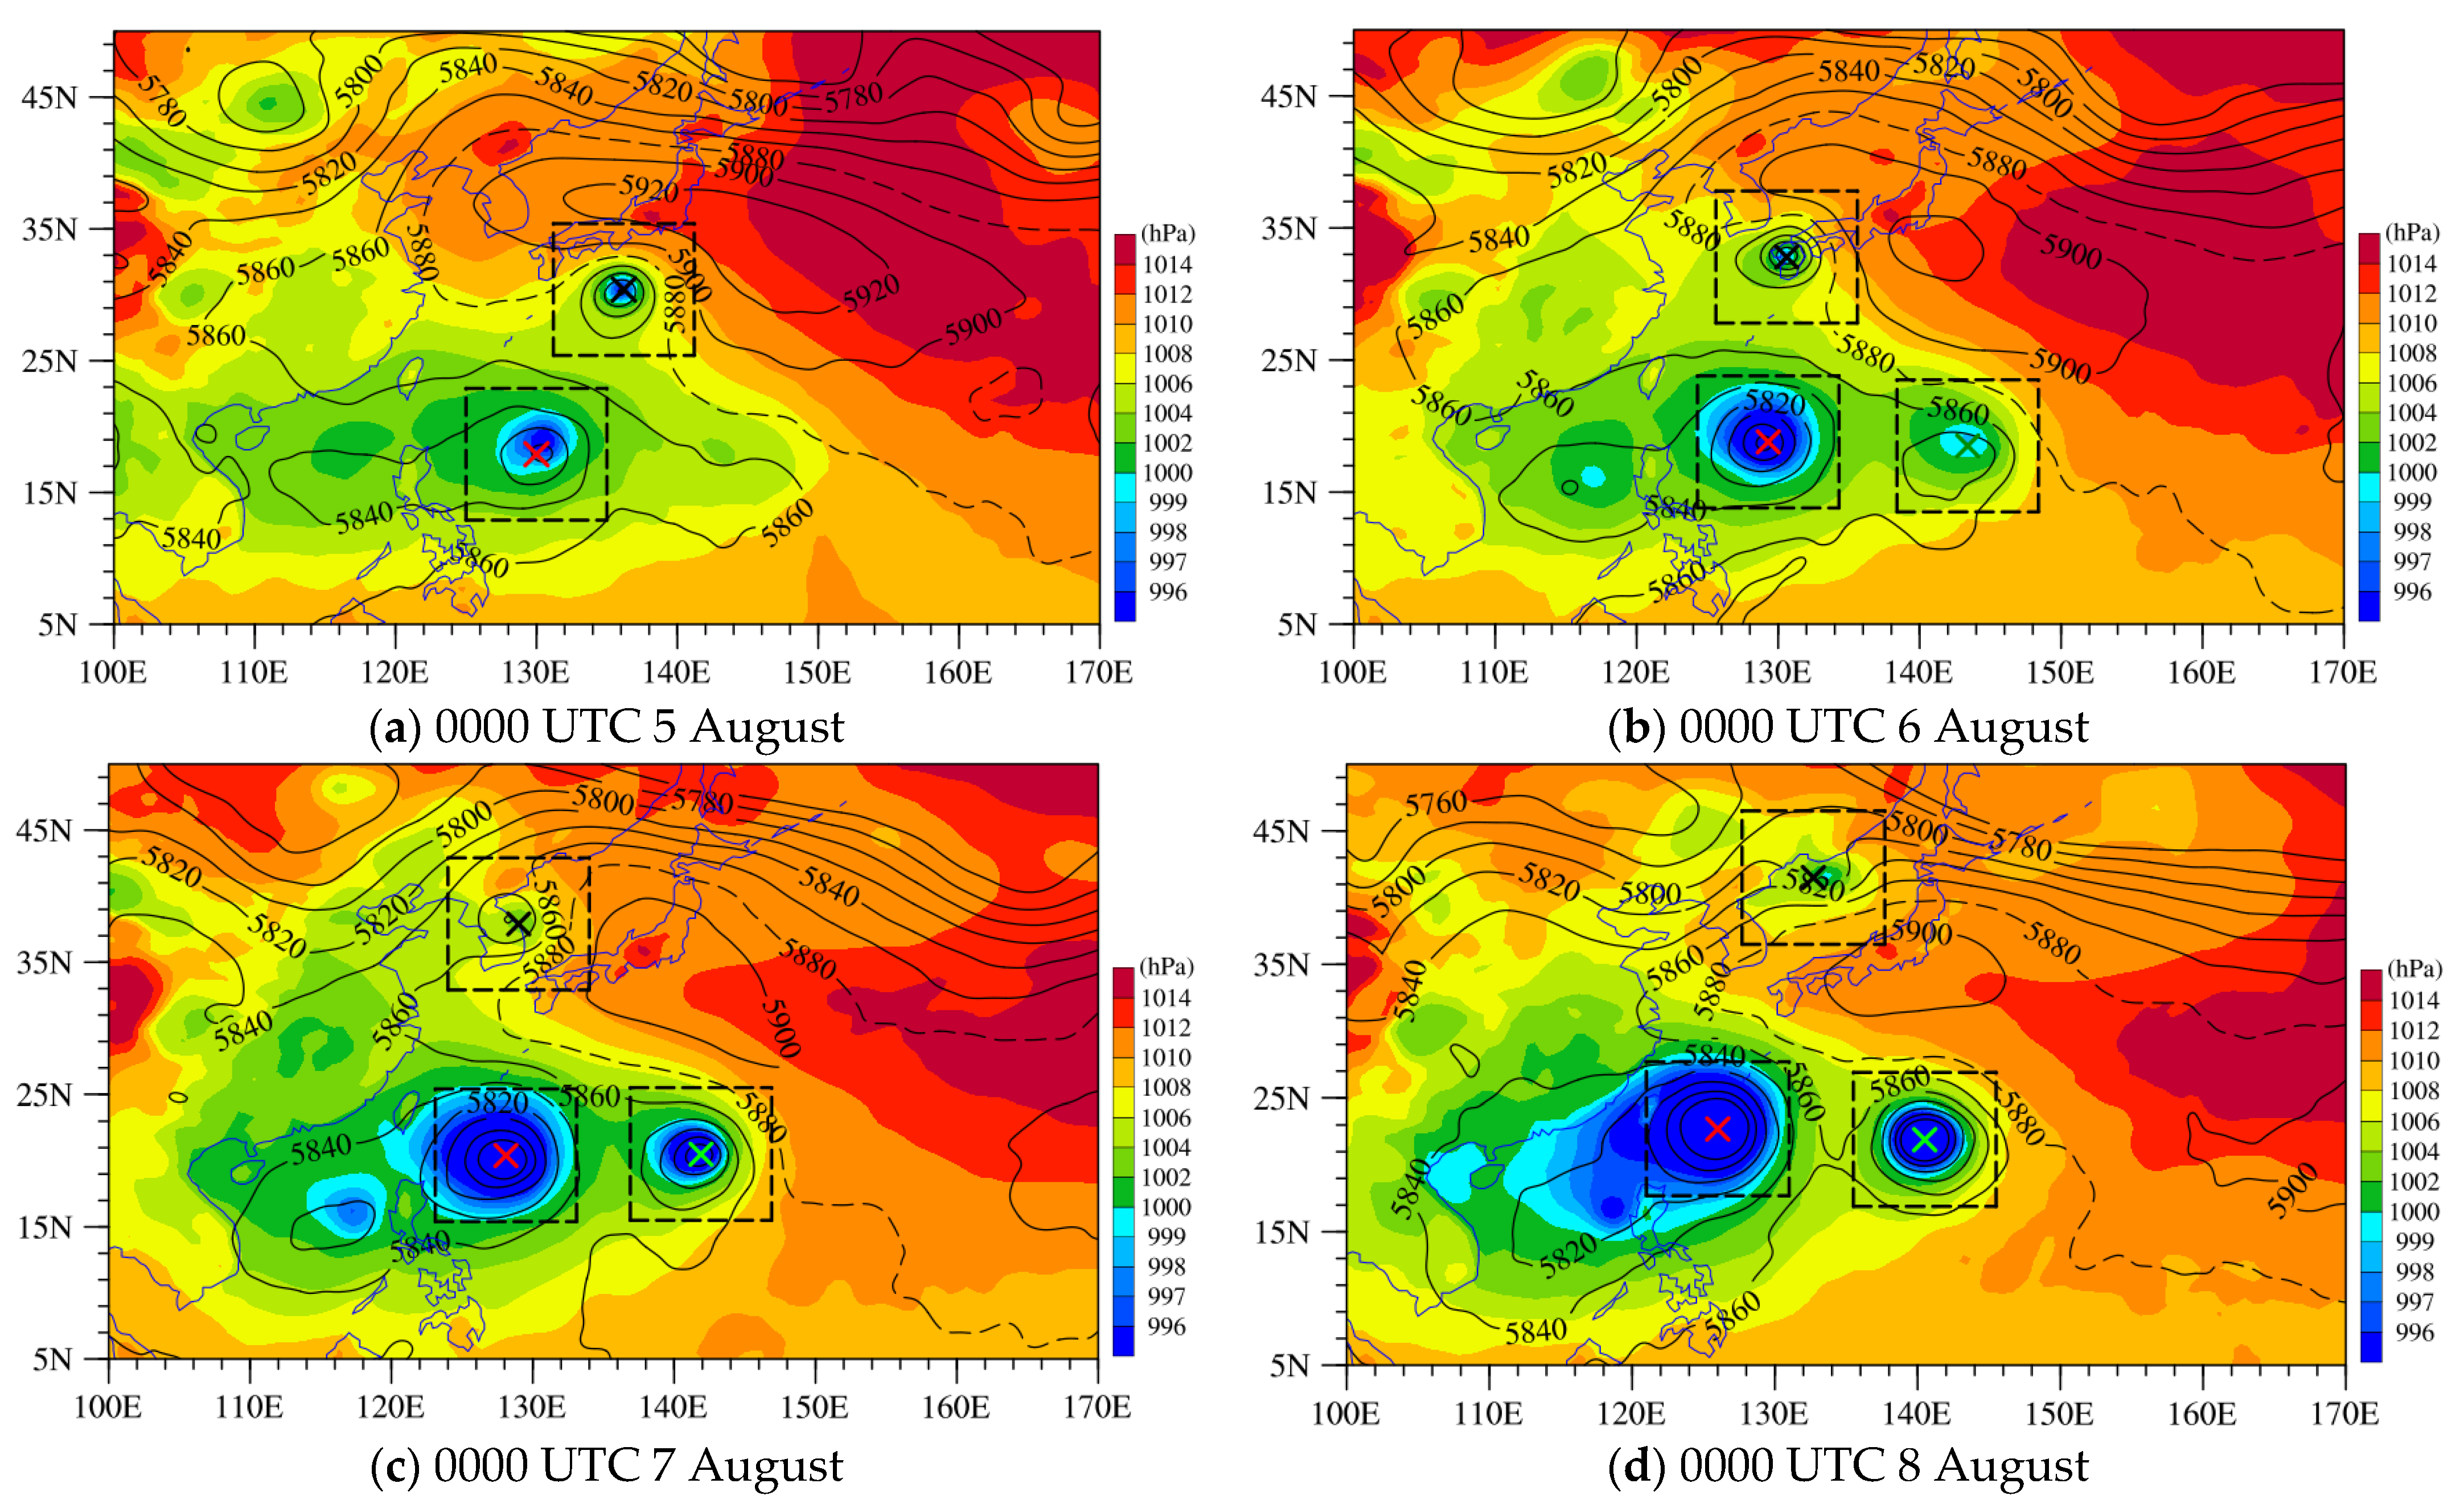
We first examine the large-scale circulation during 5–9 August 2019 when typhoons Francisco, Lekima, and Krosa existed simultaneously. The hourly ERA5 reanalysis data at 37 pressure levels with a horizontal resolution of 0.25° × 0.25° are used in this study.
Figure 3 shows the ERA5 mean sea level pressure and geopotential height at 500 hPa. The subtropical high was located to the east of Francisco (
Figure 3a–c). Due to the lack of the steering flow of the subtropical high, Lekima moved northwestward slowly on the ocean at the speed of about 5 km h
−1 before 7 August 2019. As a result, the longer Lekima stayed in the area with high sea surface temperature (SST), the more energy it accumulated, and the lower the center sea level pressure was. On the west side of Lekima, there was a South China Sea low-pressure disturbance near (117.3° E, 15.5° N), which merged with and intensified Lekima later on (
Figure 3d). The 10° × 10° boxes of typhoon centers are depicted to show the regions where the temperature anomalies are calculated in this study.
3. Cloud Detection and MWTS-2 Temperature Retrieval Algorithms
Due to the unrealistic cold-cores in the lower troposphere caused by the scattering effects of the cloud-affected channels, a cloud detection algorithm has been developed for accurately retrieving the 3D air temperature from FY-3D MWTS-2 TB observations.
In general, clouds emit more longwave radiation than clear-sky sea surfaces. Therefore, larger bias-corrected
O-B values indicate the presence of clouds. A cloud detection method based on the MWTS-2 50.3 GHz channel bias-corrected
O-B values were first developed (Niu and Zou, 2018, the N18 scheme) and then modified (Niu and Zou, 2020, the N20 scheme). A point is defined as a temporal clear-sky (cloudy) point if
(
). A temporal clear-sky point with all temporal clear-sky points within its 60-km radial distance is a final clear-sky point. Also, if the mean of
within a circle of 100-km radius is less than 2 K, all temporal clear-sky points within this circle are taken as the clear-sky points. The remaining data points are flagged as cloudy. As a result, the N20 scheme can effectively identify more than 95% of cloudy data points and 70% of clear-sky data points.
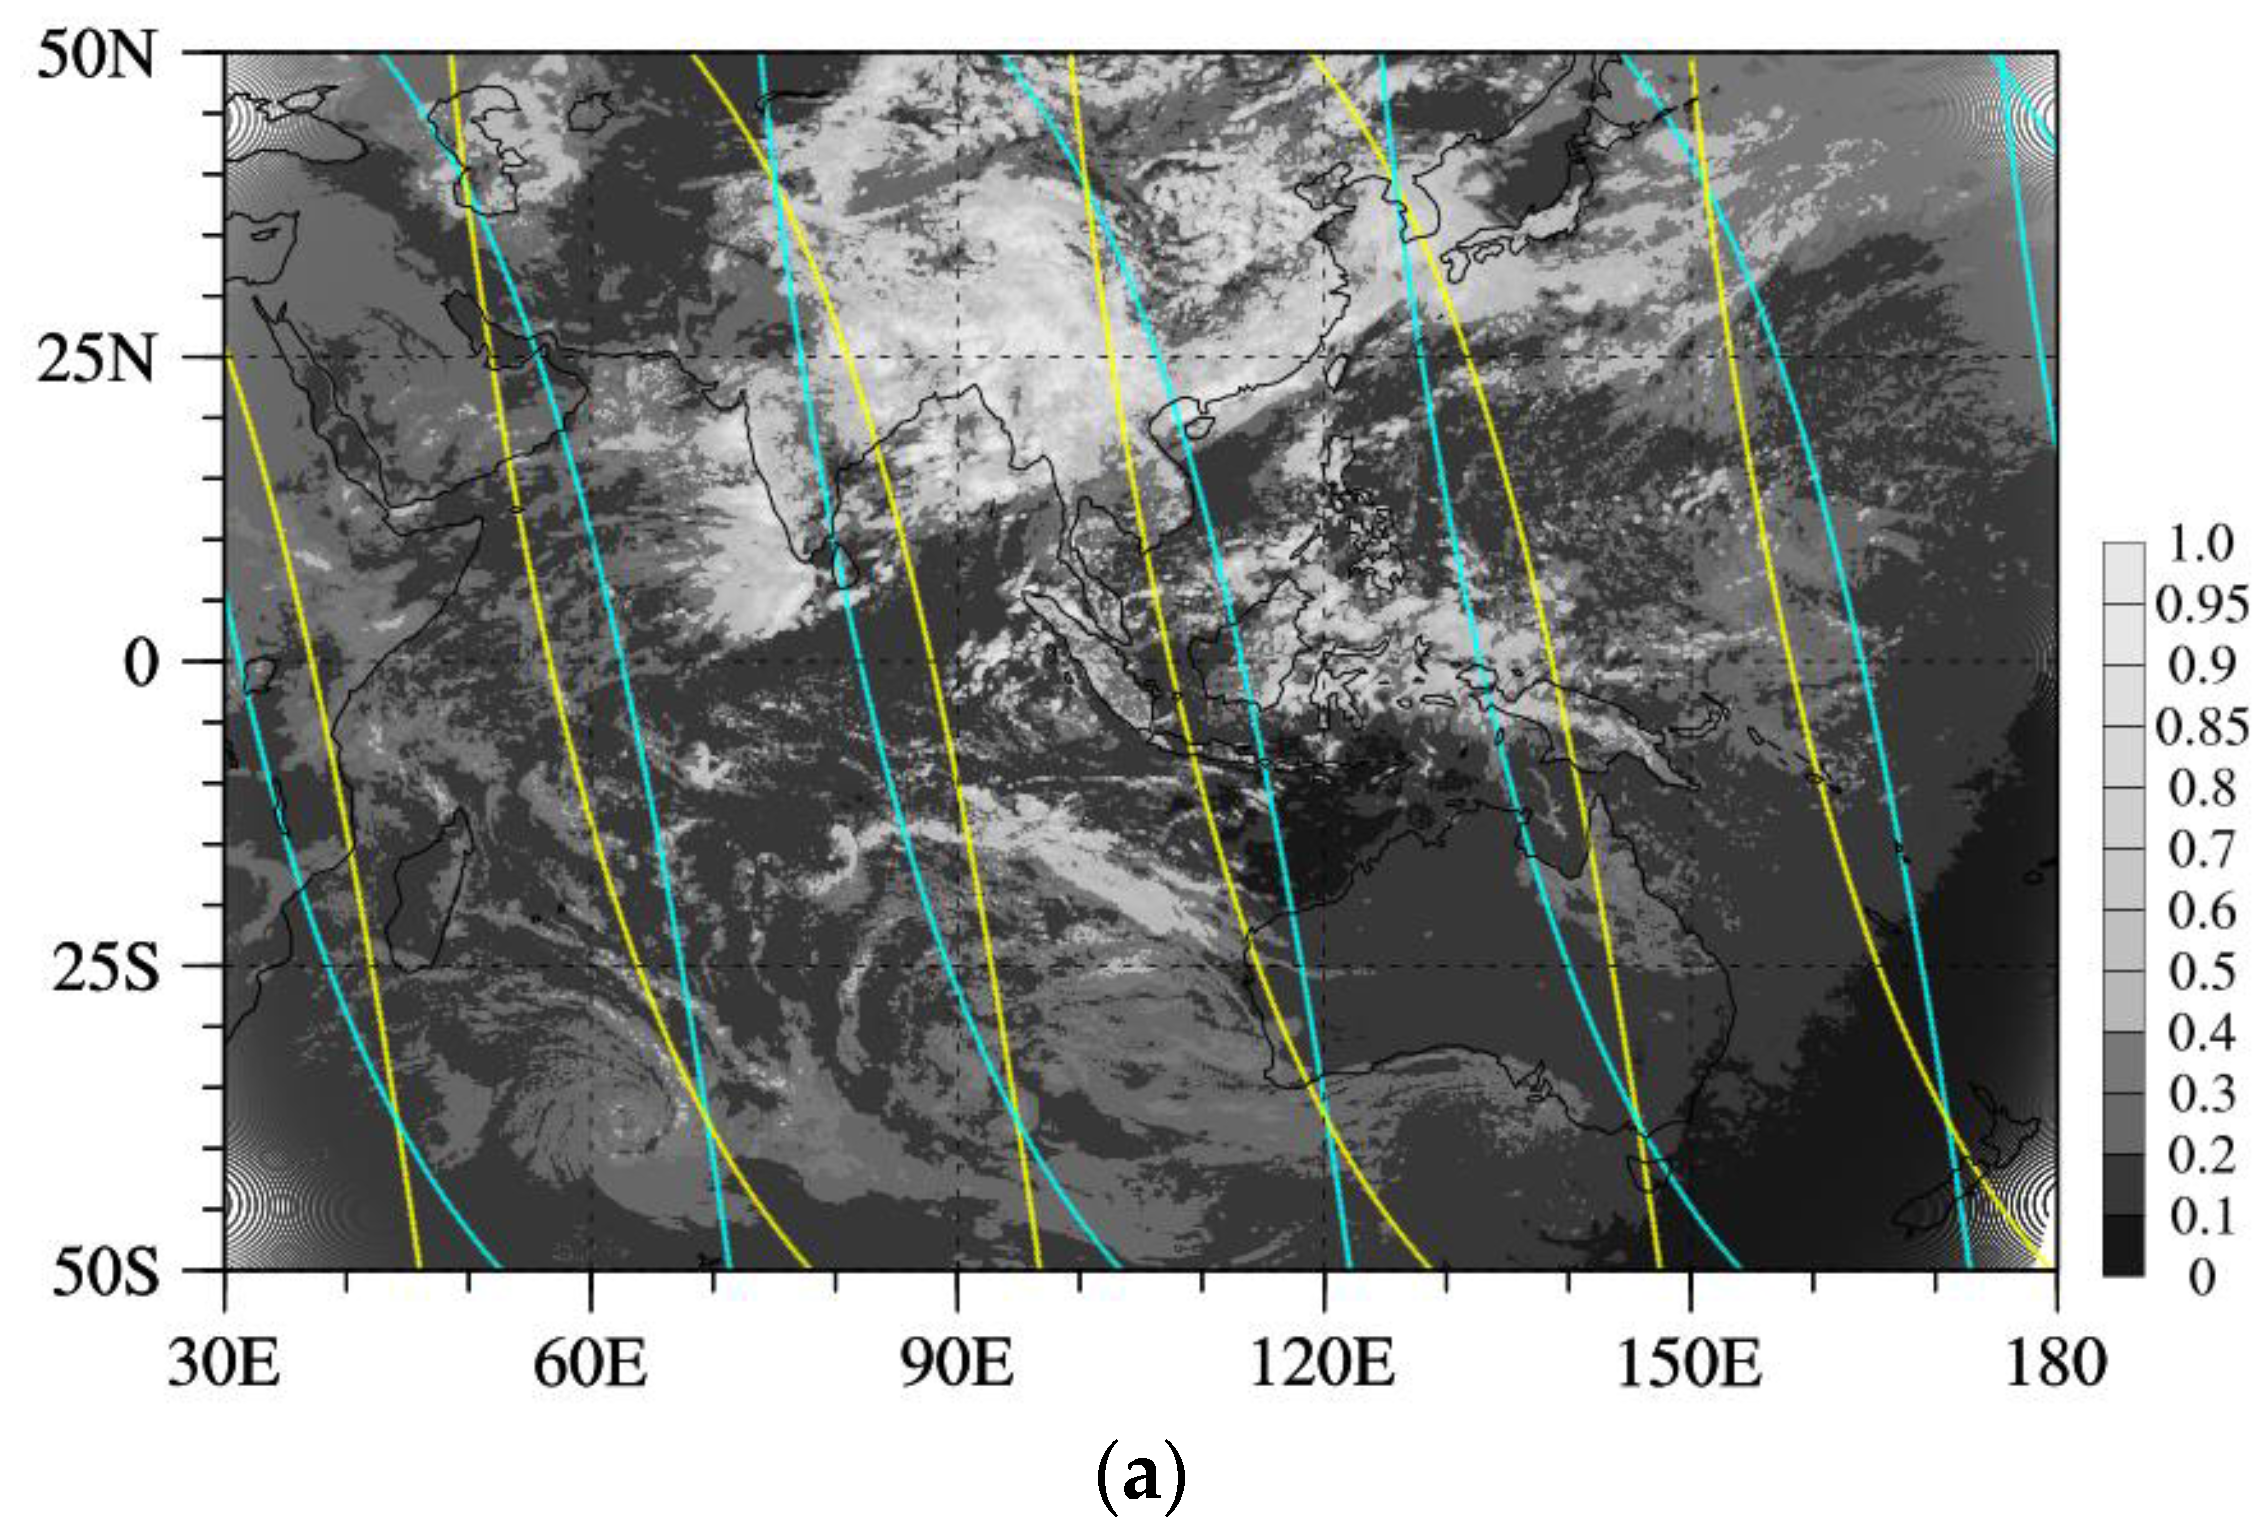
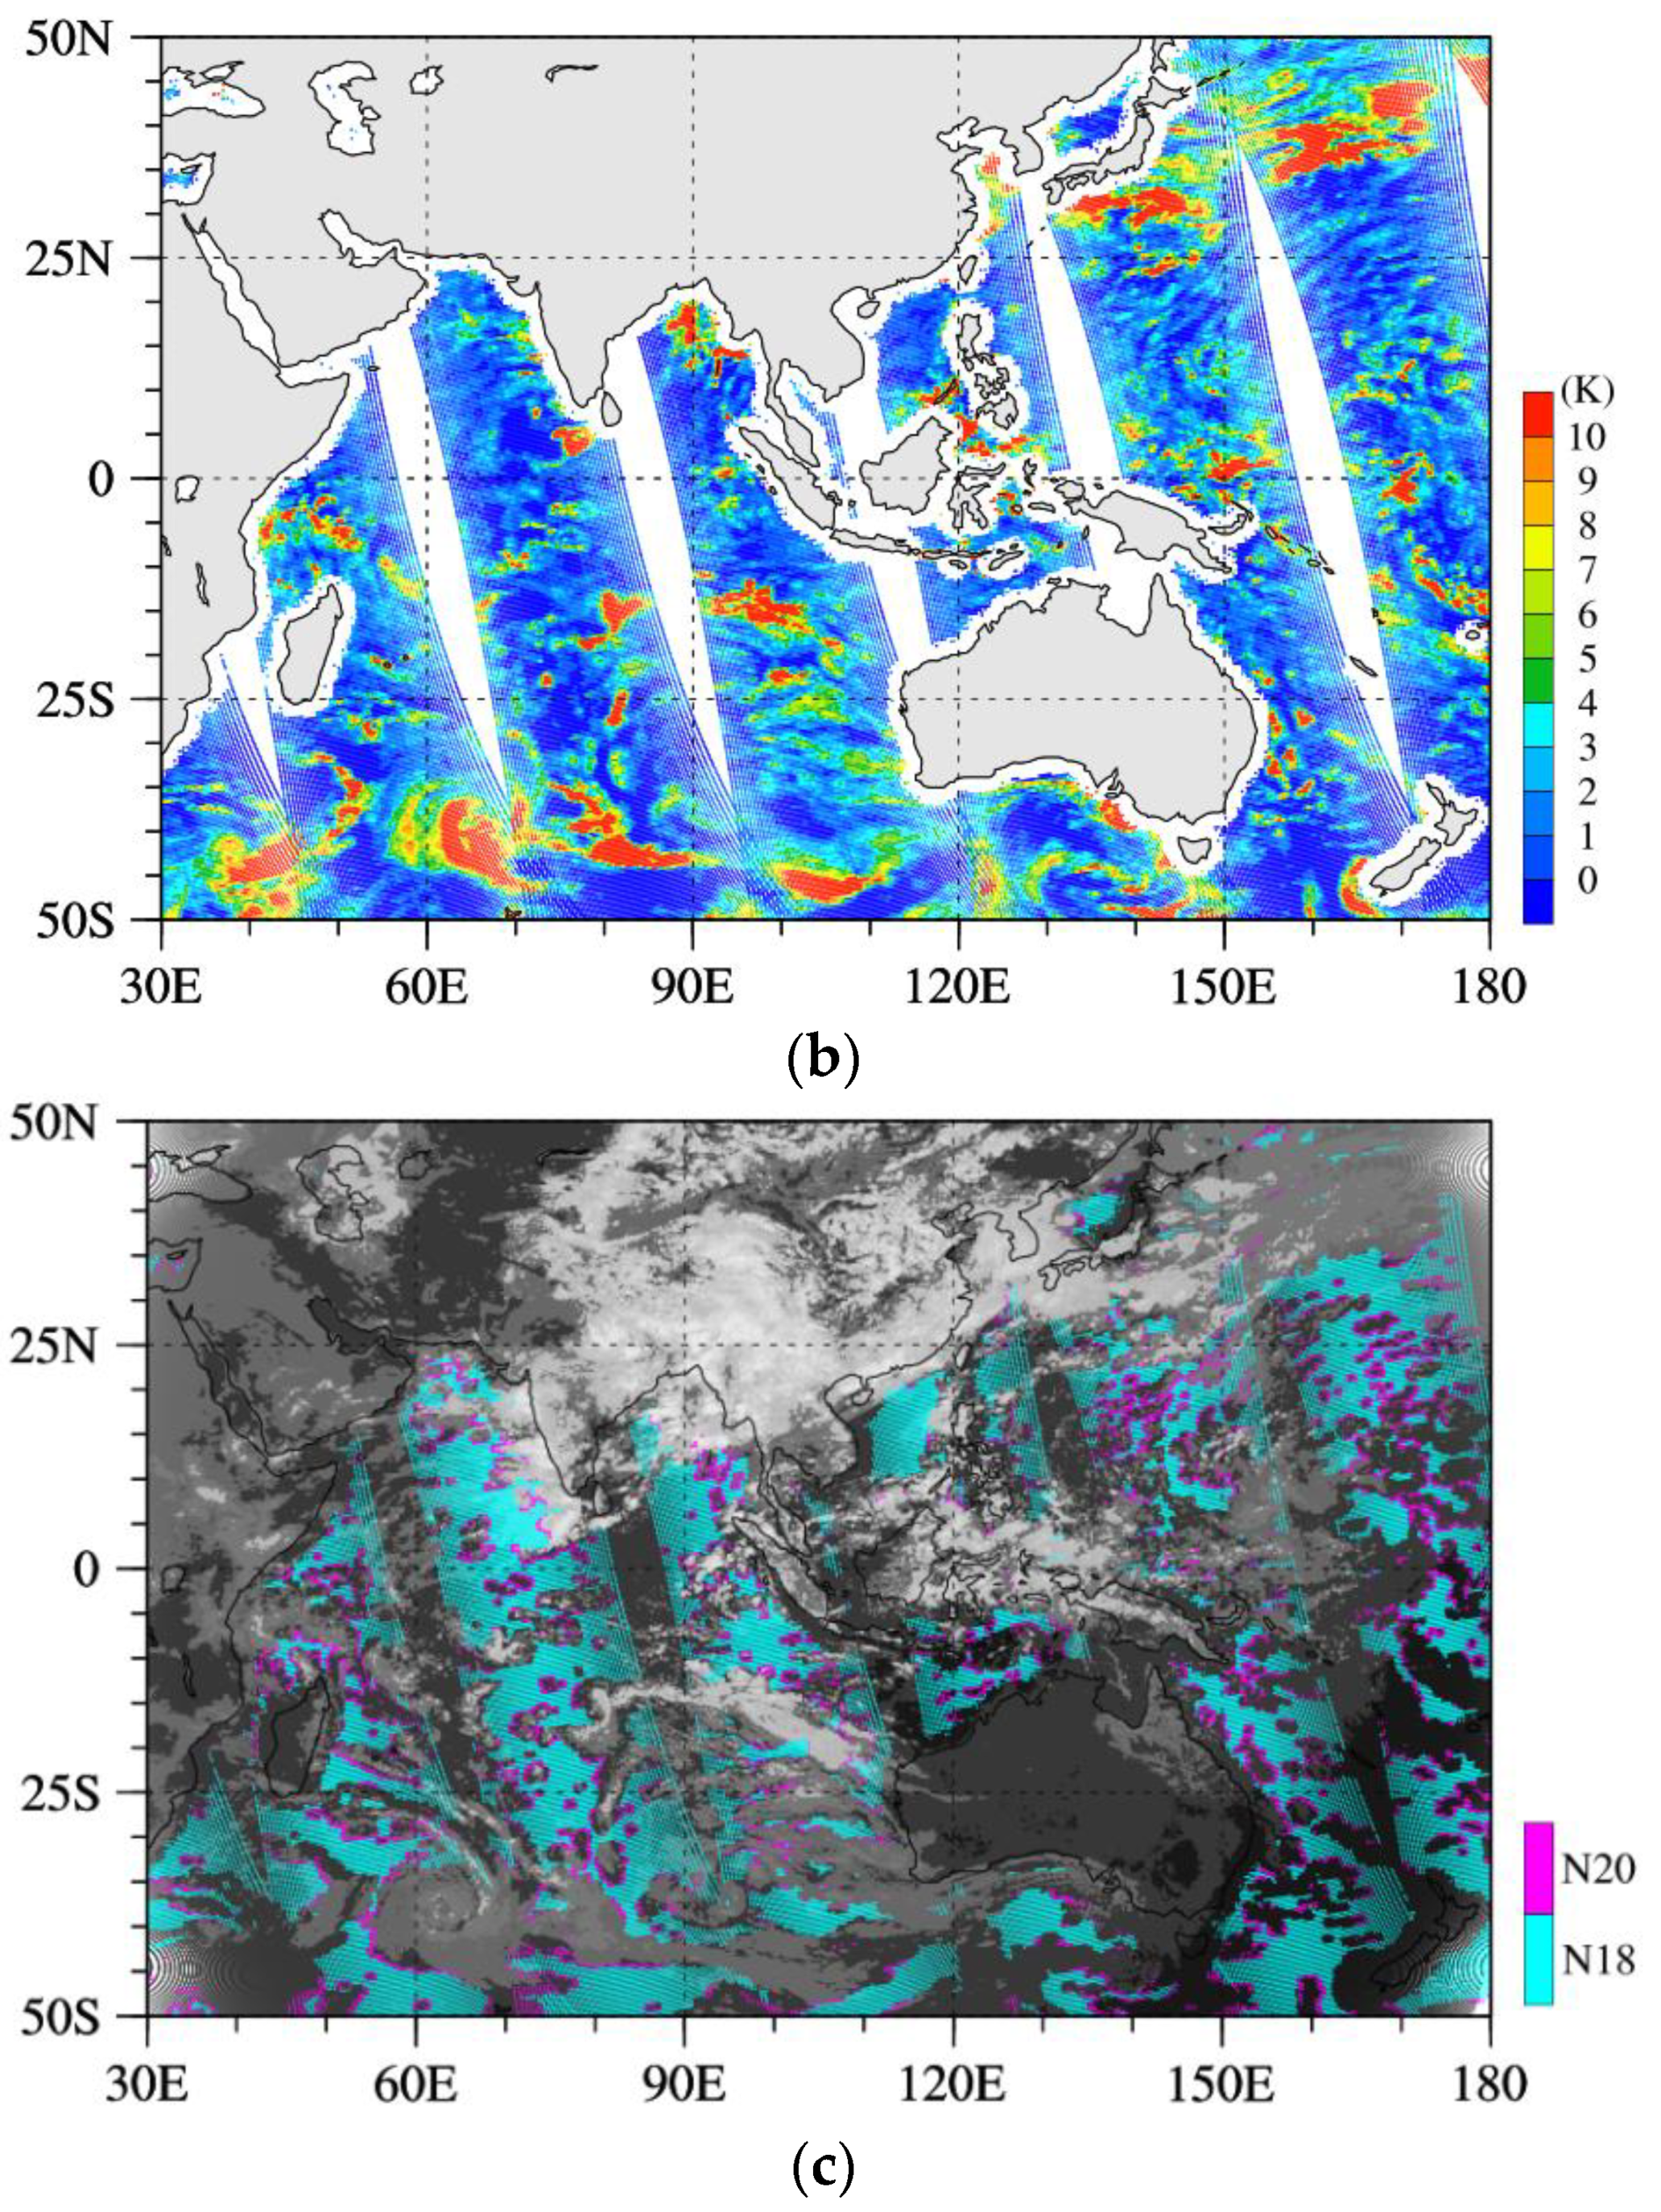
Figure 4a,b present the FY-4A AGRI visible channel (0.65 μm) reflectivity at 0600 UTC on 10 July 2019, and the FY-3D MWTS-2 50.3 GHz bias-corrected
O-B at ascending nodes on 10 July 2019.
Figure 5c exhibits the FY-3D MWTS-2 clear-sky data points over the ocean identified by the N18 scheme and the additional cloud-free data points detected by the N20 scheme at ascending nodes on 10 July 2019. The MWTS-2 clear-sky data points match well the areas with low reflectivity of the AGRI visible channel, indicating the effectiveness of the N20 scheme for the cloud detection of MWTS-2 data.
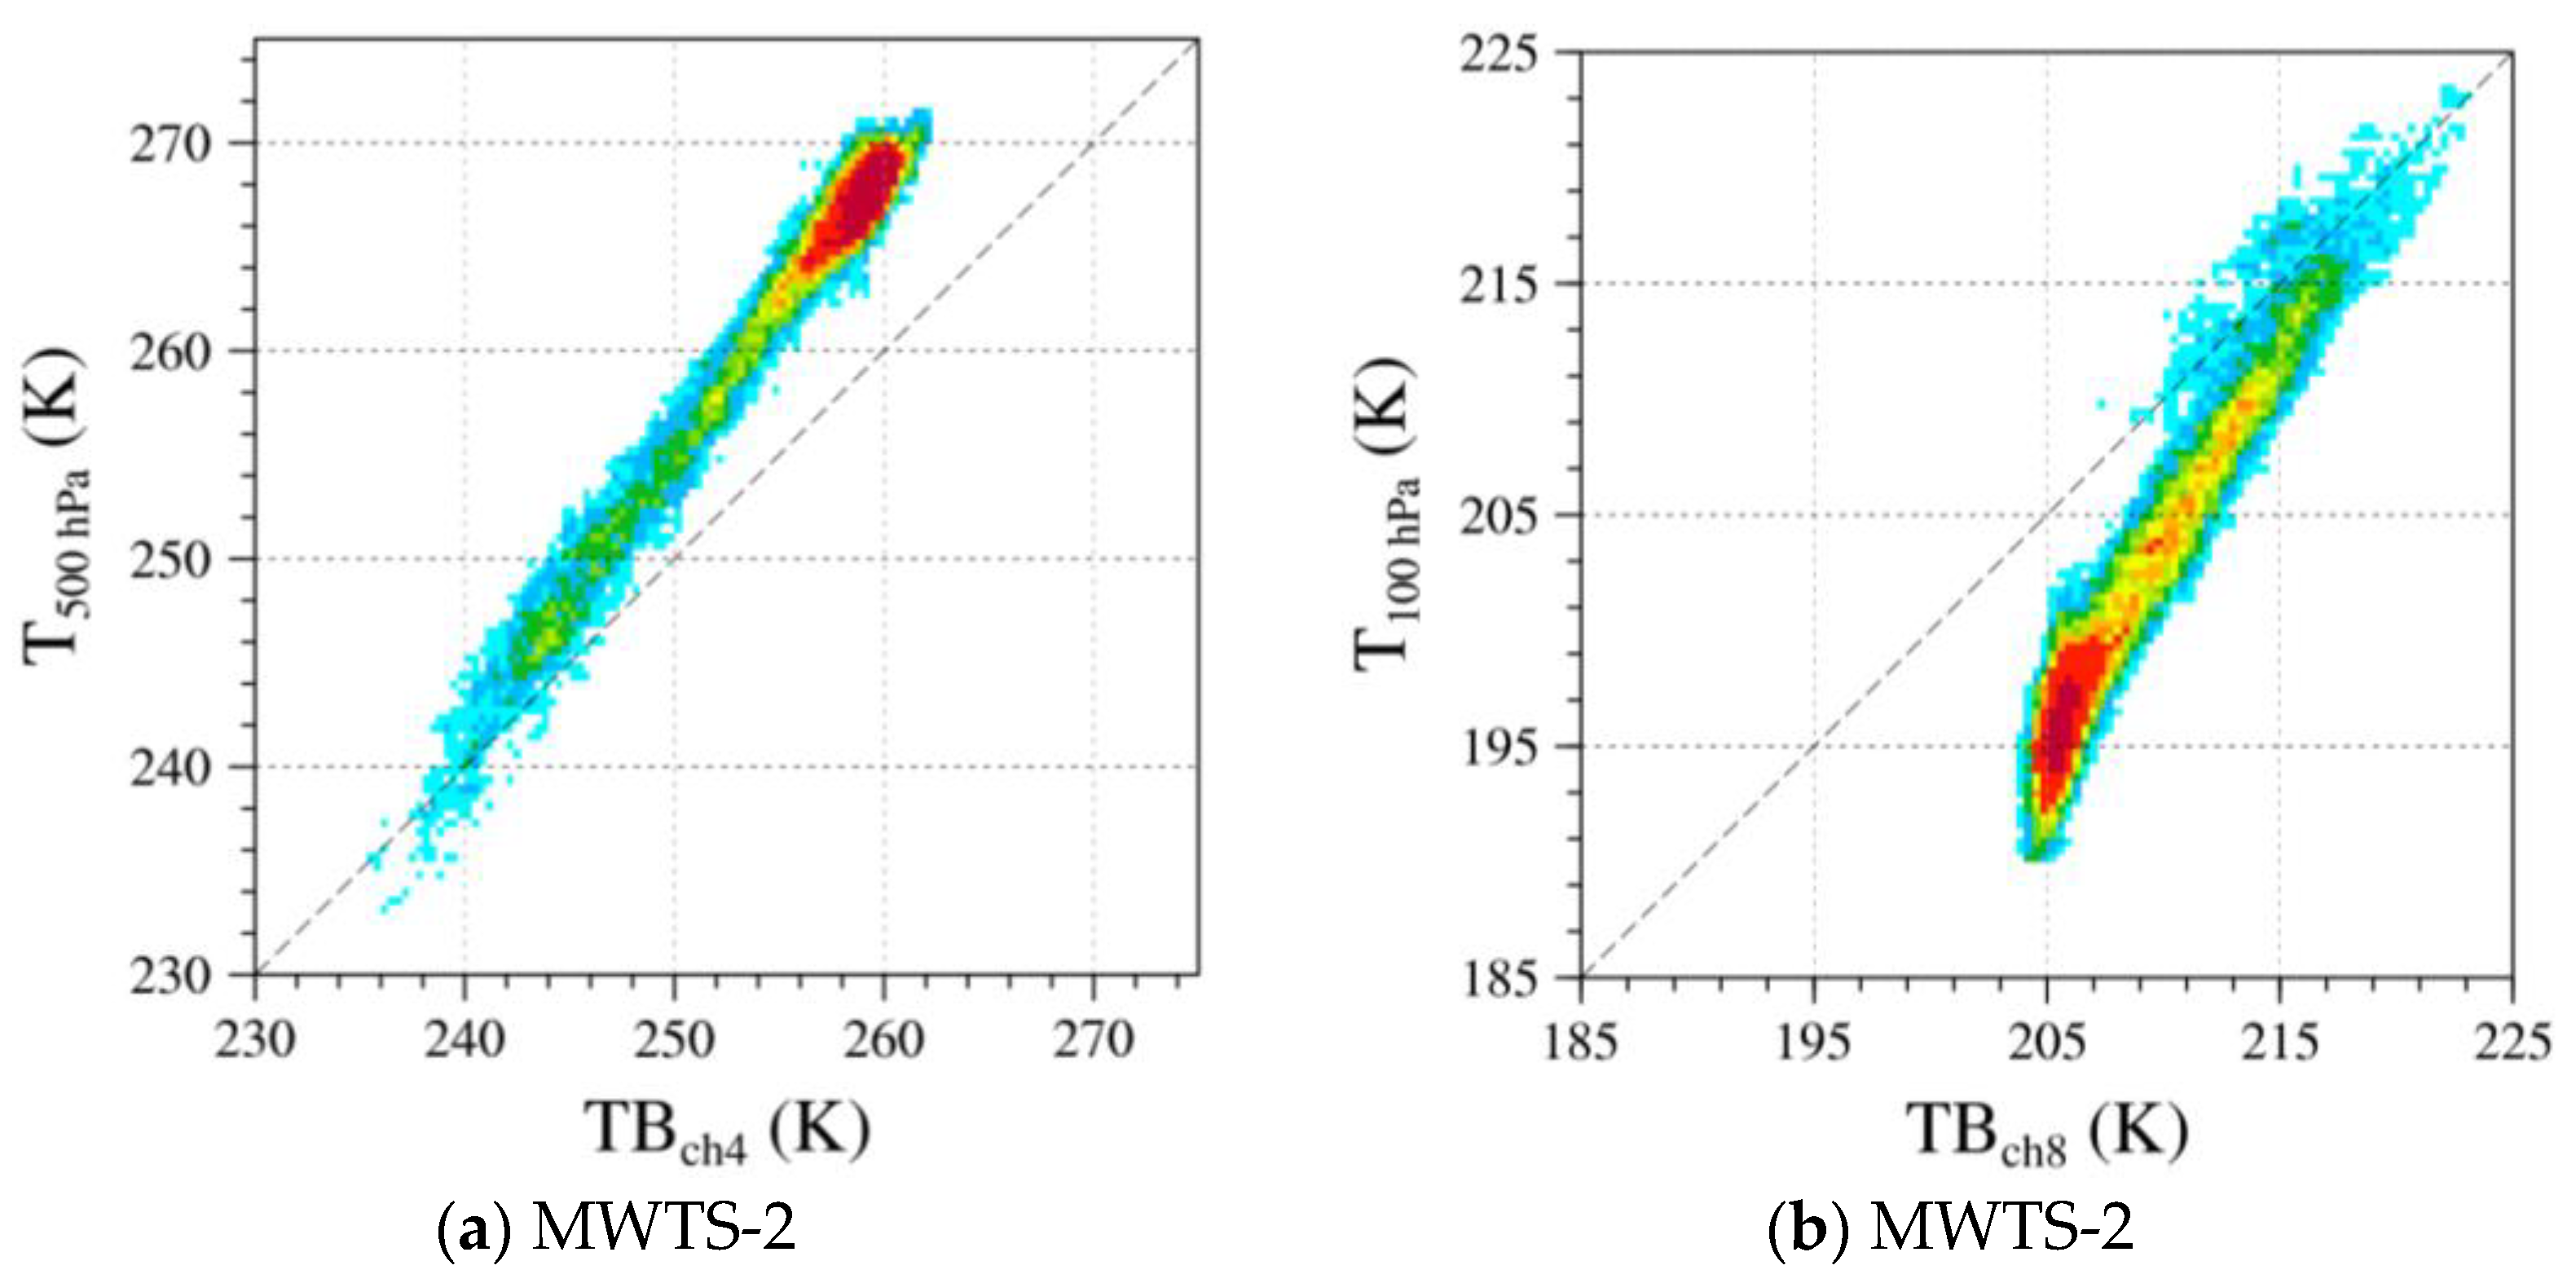
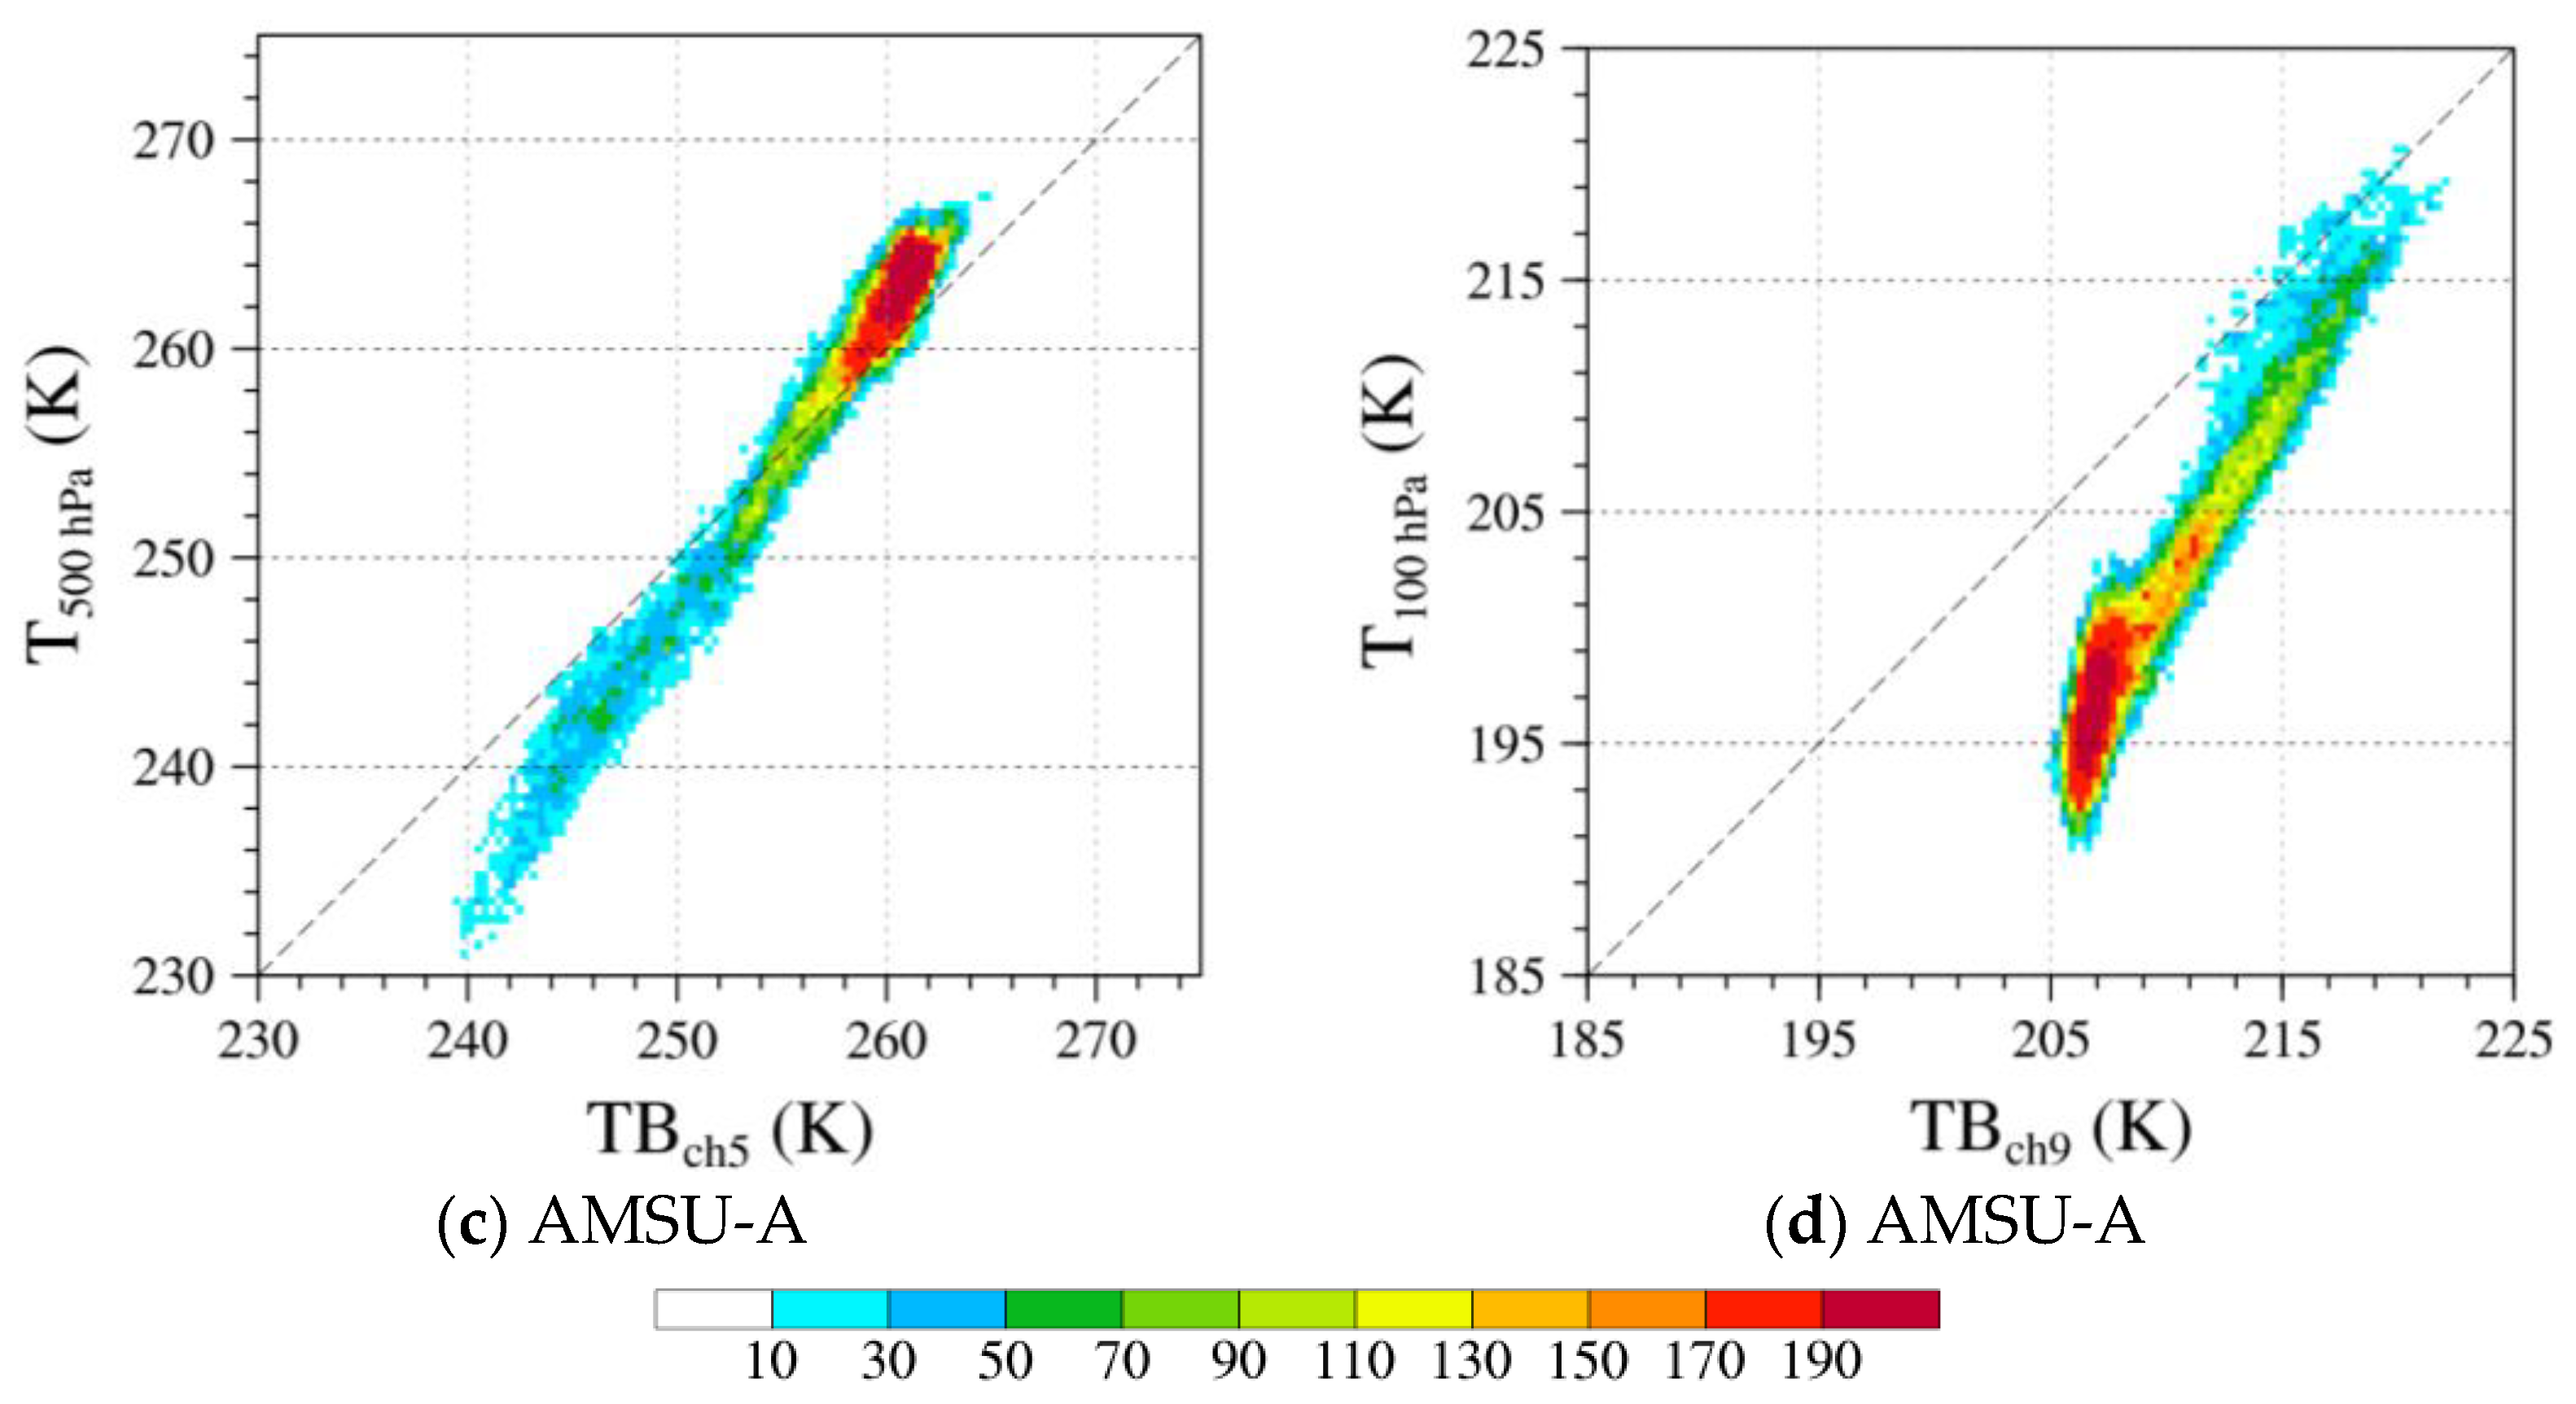
In this study, FY-3D MWTS-2 channels 3–13 brightness temperatures with the collocated ERA5 temperatures at 37 pressure levels from 10 to 31 July 2019 are used as the training data for the multiple linear regressions. The TB observations and ERA5 air temperatures have a correlation coefficient greater than 0.95, which is well above the 95% confidence level (~0.91). Examples are shown in
Figure 5 for the FY-3D MWTS-2 channel 4 TBs (WFP = 700 hPa) versus air temperature at 500 hPa (
Figure 6a), and the FY-3D MWTS-2 channel 8 TBs (WFP = 100 hPa) versus air temperature at 100 hPa (
Figure 6b). Included in
Figure 5 are all the clear-sky nadir oceanic data between 50° S and 50° N from 10 to 31 July 2019. Similar results are obtained for the AMSU-A channel data with the same frequency (
Figure 5c,d).
Figure 5a,b also show that the maximum densities of the data count of the MWTS-2 TBs at channels 4 and 8 are about 250–260 K and 205–210 K, respectively. To validate the above results,
Figure 6 shows the scatterplots of the latitudinal distribution of the FY-3D MWTS-2 channel 4 and channel 8 TBs at the data points in
Figure 5a,b. The latitudinal mean values and data counts at an interval of 2° are also given to confirm the concentration thresholds of the MWTS-2 channel 4 and channel 8 TBs. The latitudinal data counts (dotted lines) are low from 5° N to 15° N due to the broad cloudy areas in the Intertropical Convergence Zone. Additionally, the data count in the southern hemisphere is higher than that in the northern hemisphere because the oceanic area in the southern hemisphere is much larger.
The high correlations between the TBs and the air temperature at channel WFPs allow temperature retrieval using the multiple linear regression method. According to the Rayleigh-Jeans approximation, the MWTS-2-received upward radiation emission at a specific channel (
i) is a linear function of temperature (
T). Specifically, the air temperature
at different pressure levels are retrieved from the FY-3D MWTS-2 channels by the following multiple linear regression equation,
where
p and
θ are the pressure and FOV number, respectively,
i indicates a subset of the MWTS-2 channels 3–13 under clear-sky condition,
is the observation of the MWTS-2 channels TBs, and
represents the regression coefficients. The MWTS-2 channels 6–13 are used in cloudy conditions. The regression coefficients in the multiple-channel linear regression formula are obtained using the ERA5 reanalysis of temperature interpolated to the MWTS-2 TB locations.
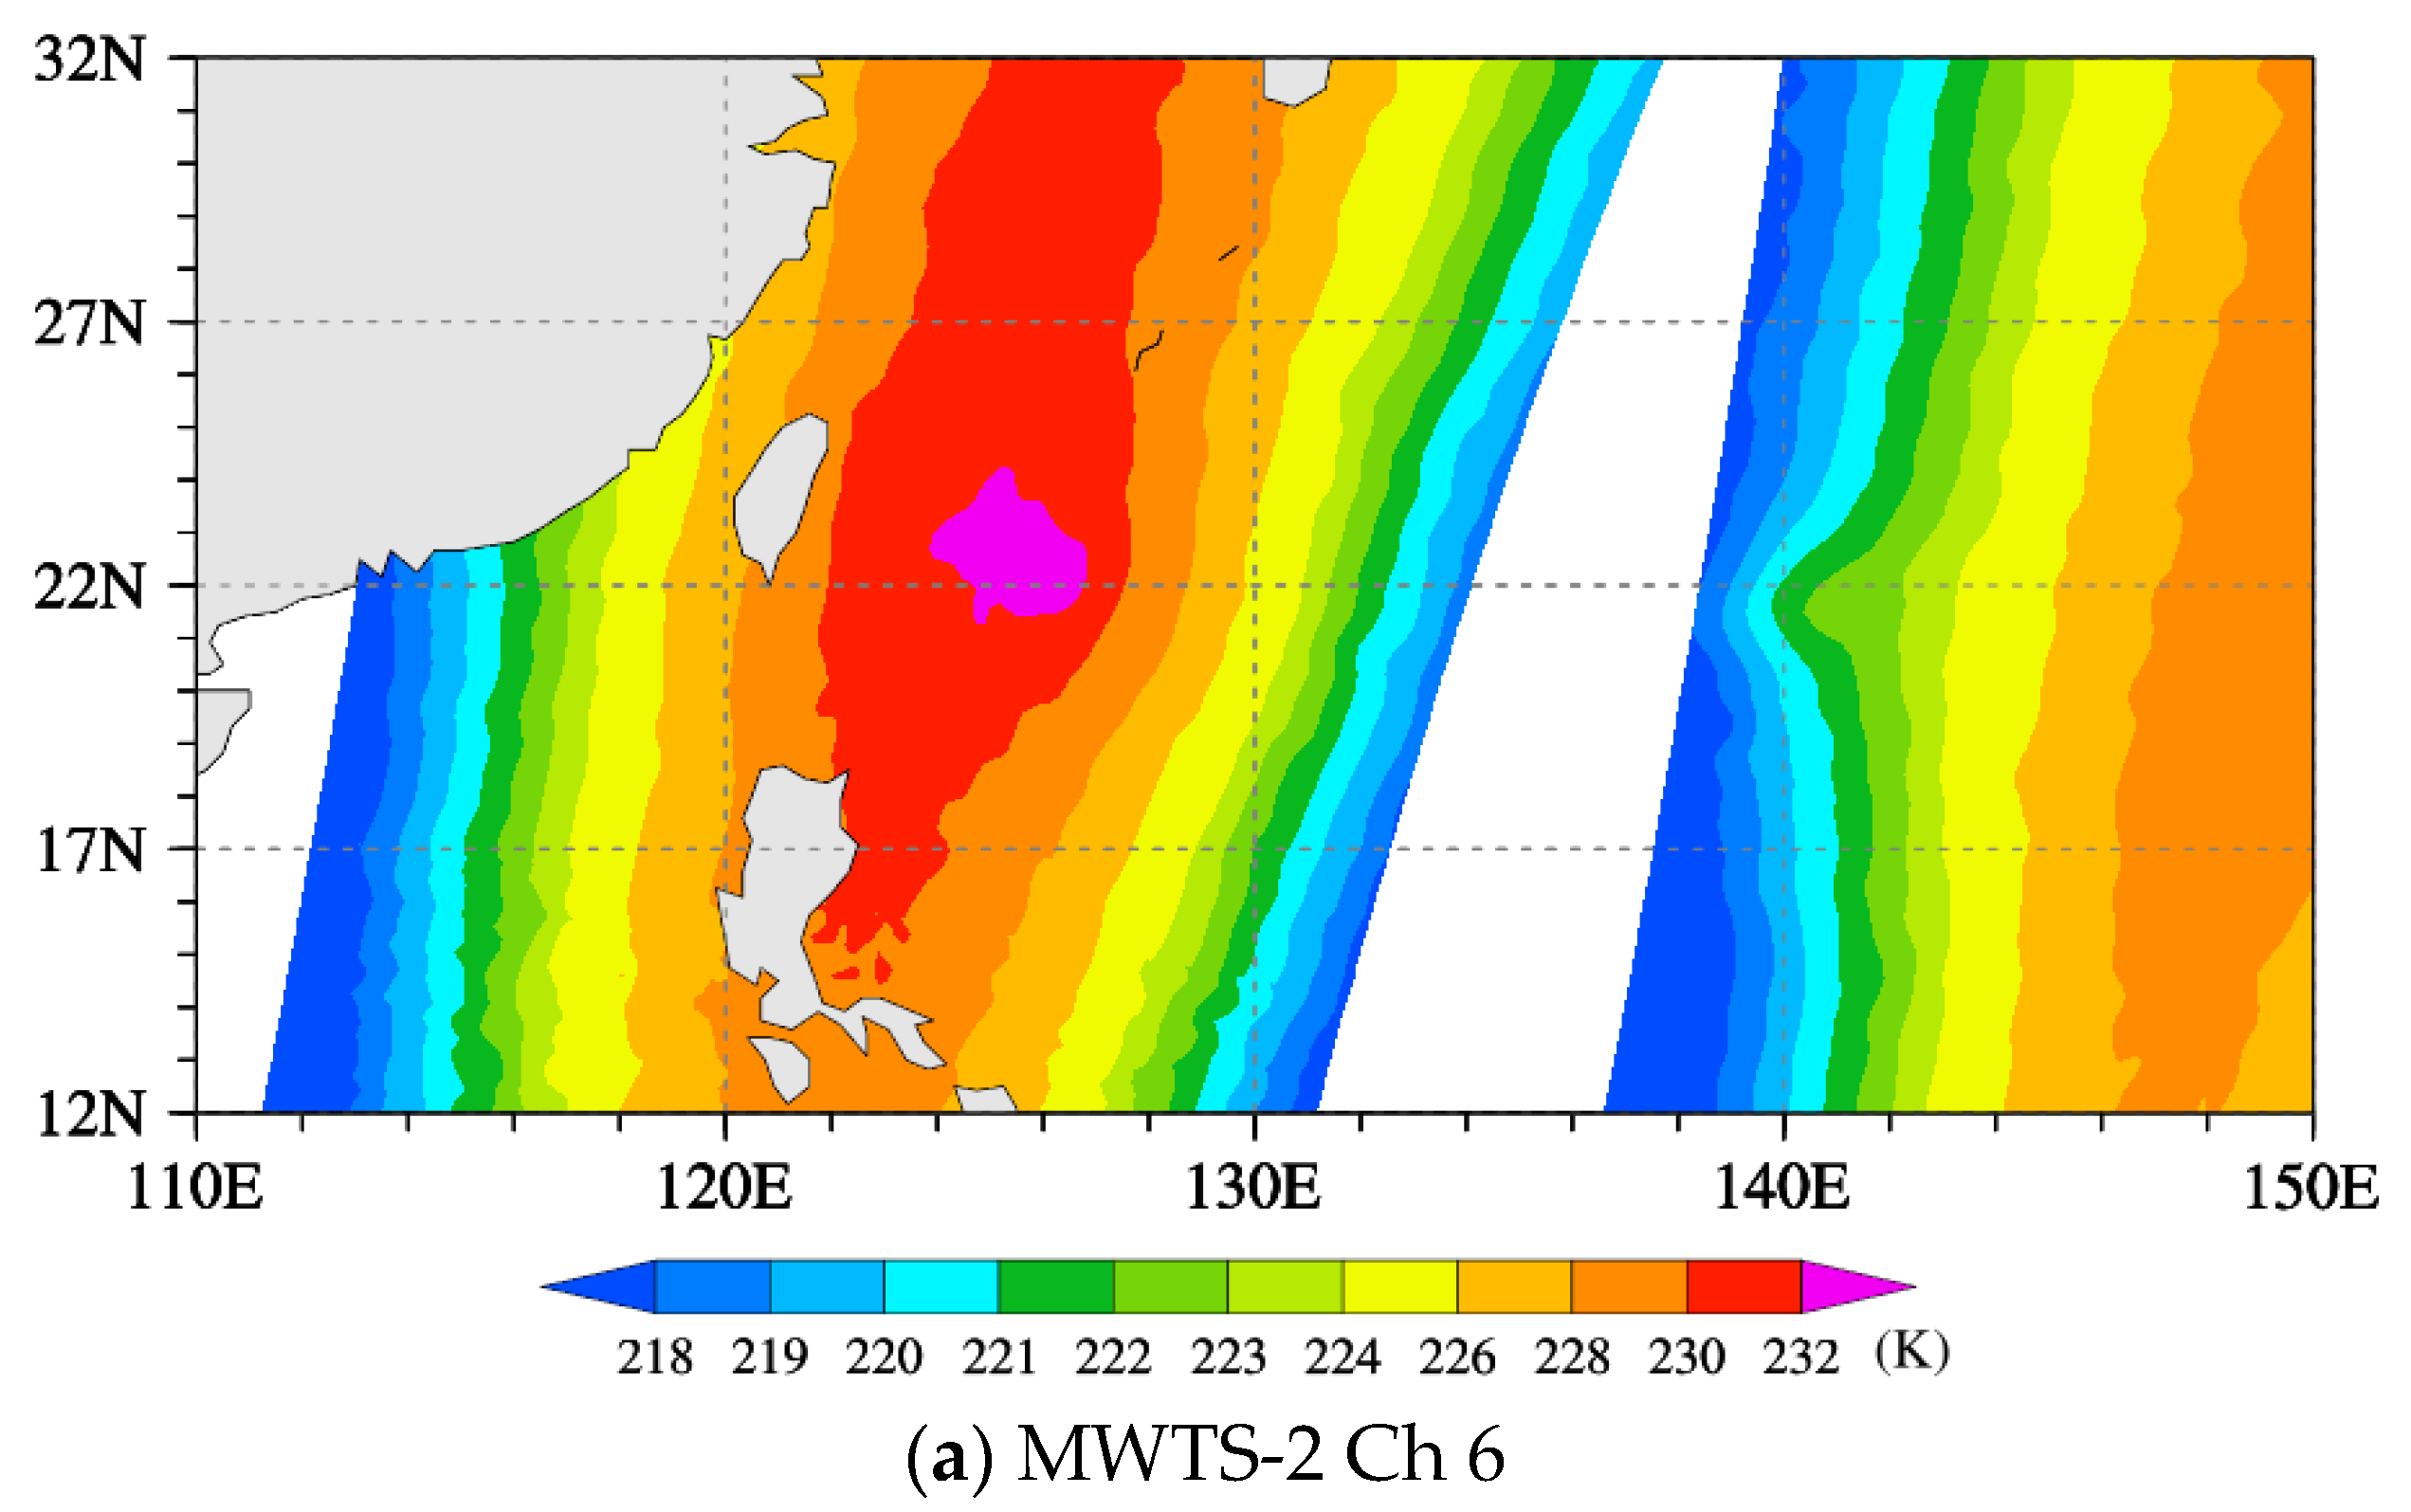
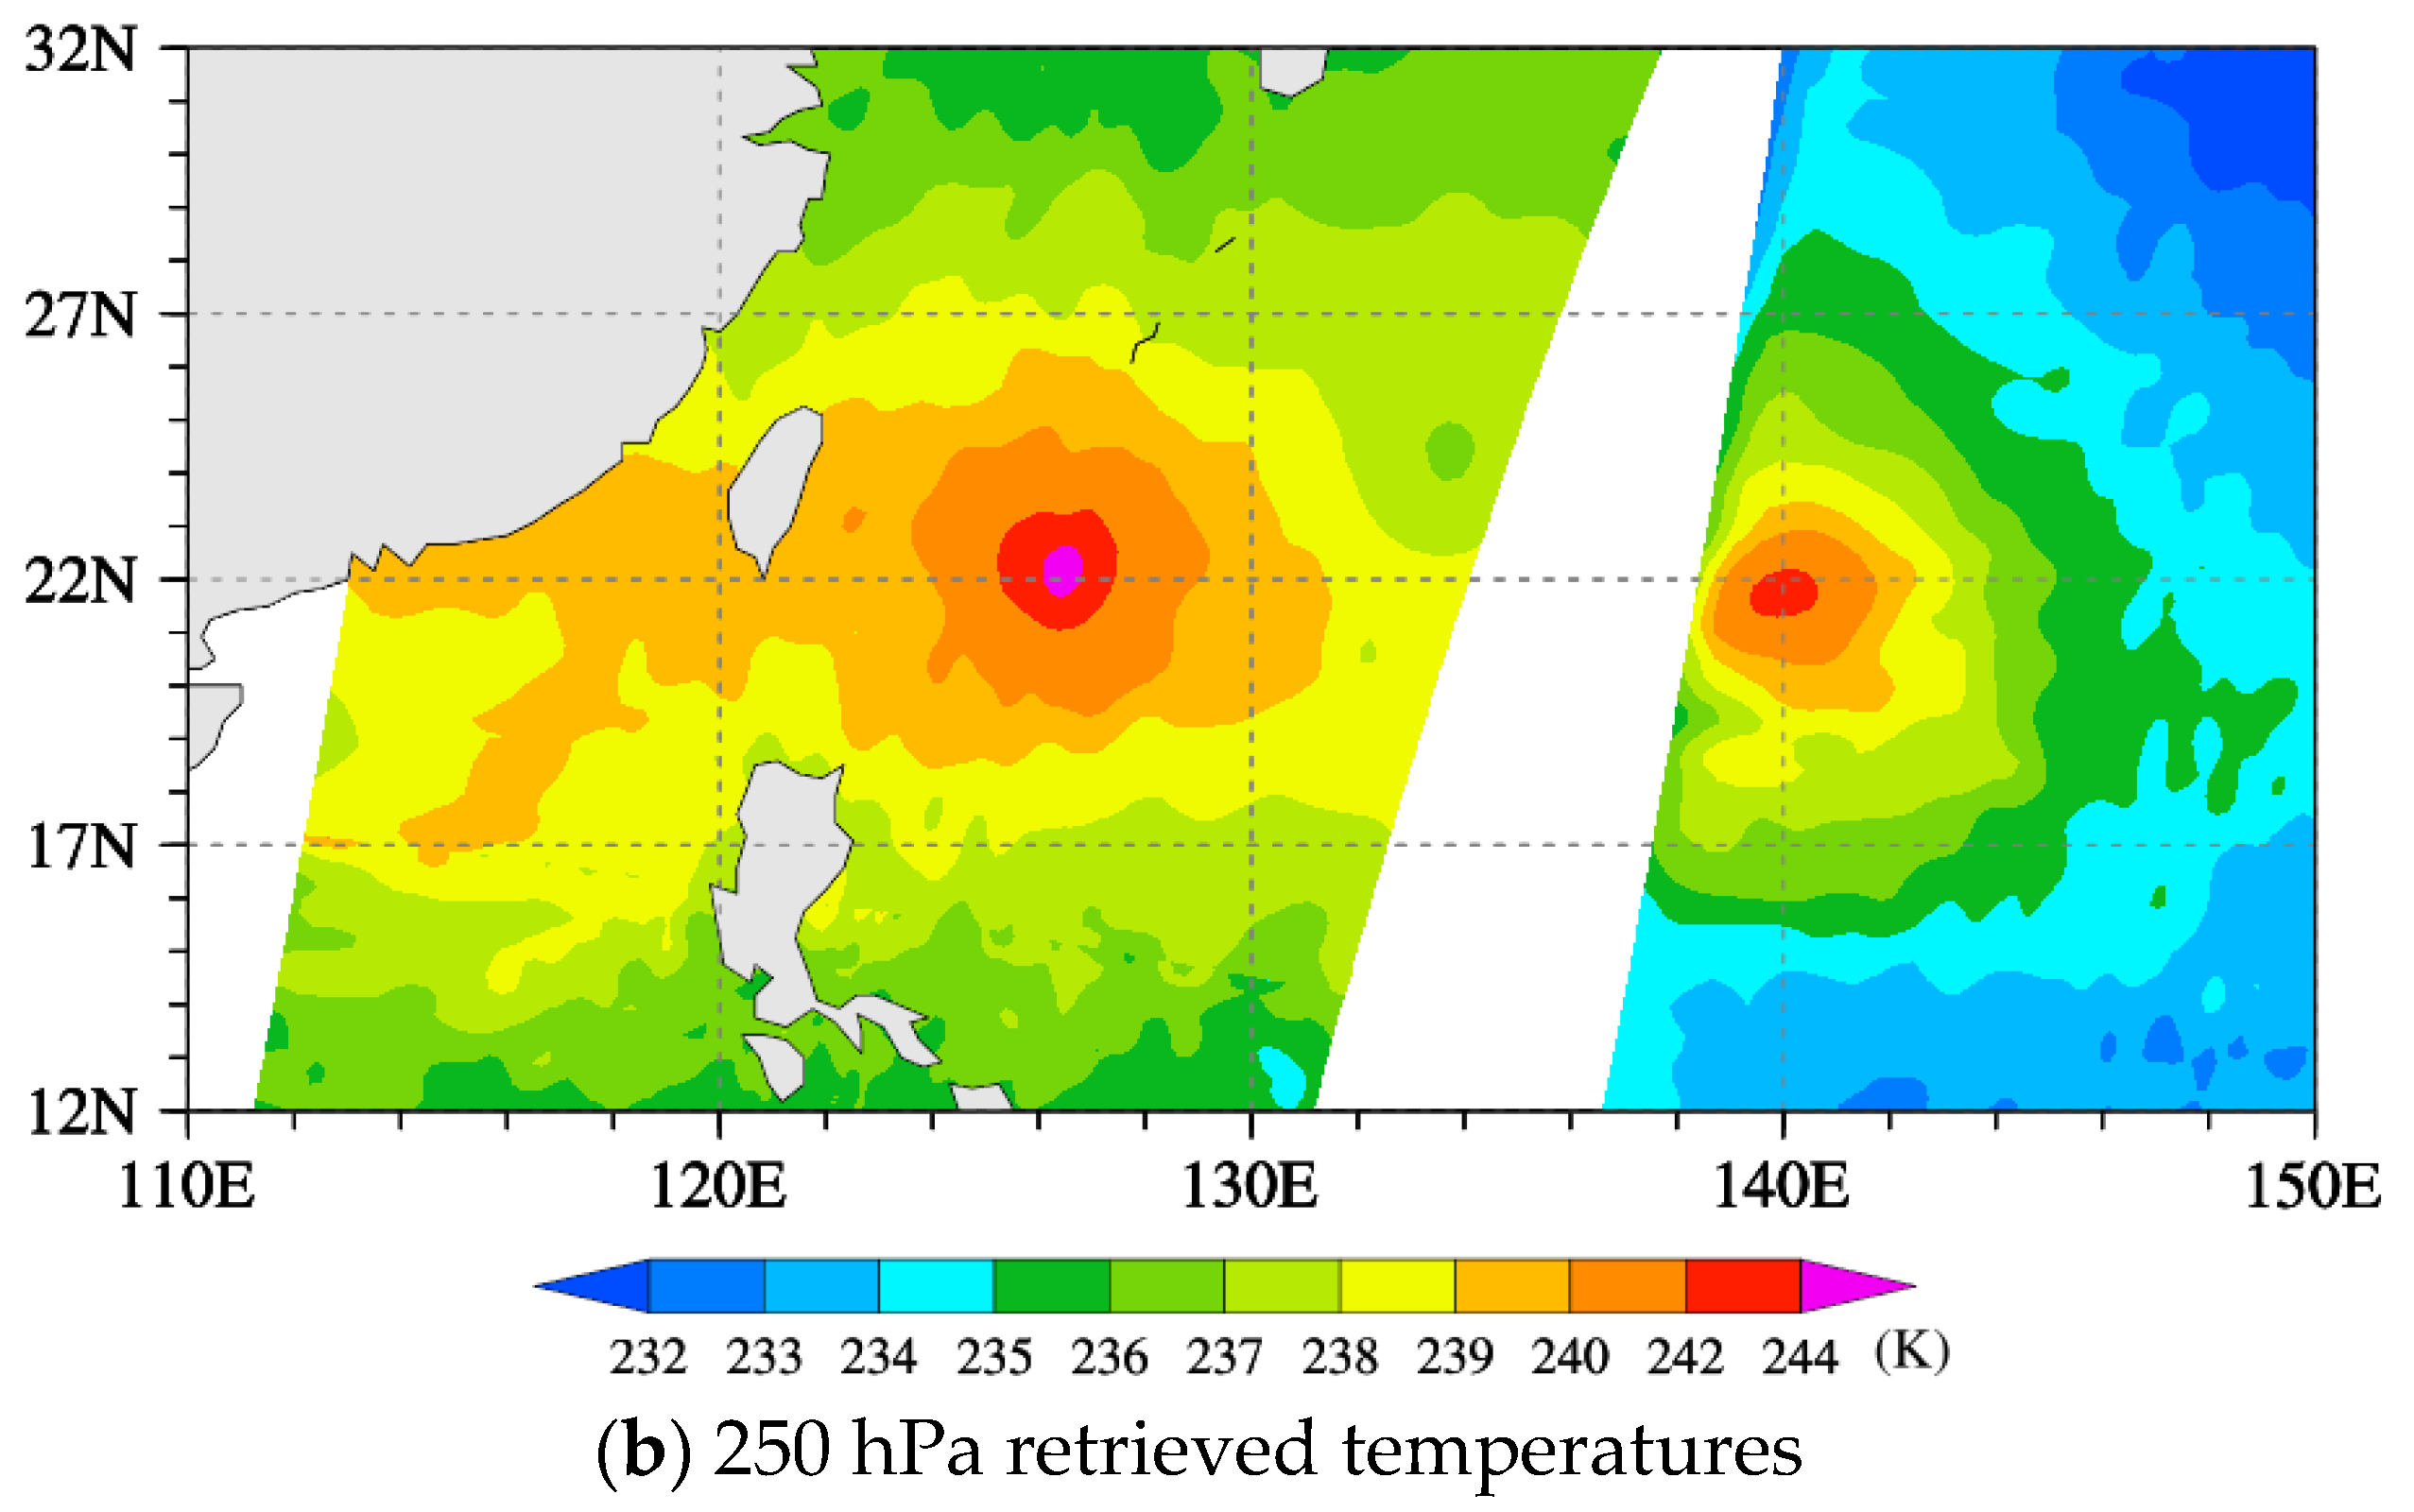
We examine the spatial distribution of the MWTS-2 channel 6 (WFP = 250 hPa) TB observations at descending nodes on 7 August 2019 (
Figure 7a). The TB values at limb FOVs are smaller than those at nadir, which is the so-called limb effect. The limb effect is mainly due to longer atmospheric optical paths at larger scan angles, which result in higher weighting function peaks (above 250 hPa) of the limb FOVs for MWTS-2 channel 6. Therefore, the MWTS-2 temperature retrieval is carried out at different FOVs in consideration of the limb effect. The air temperature thus retrieved by the MWTS-2 at 250 hPa on the same day does not present any limb effect (
Figure 7b). The warm anomalies are seen around the centers of typhoons Krosa and Lekima, whose centers were located at (140.2° E, 22.4° N) 1545 UTC and (126.5° E, 22.1° N) 1724 UTC on 7 August 2019, respectively.
Figure 8 shows the vertical cross-sections of the temperature anomalies at 1724 UTC on 7 August 2019.
Figure 8a shows an unrealistic cold anomaly in the lower troposphere, which is eliminated in the retrieval (
Figure 8b) that removes cloudy data at MWTS-2 channels 3, 4 and 5.
4. MWTS-2 Retrieved Typhoon Warm-Cores and Comparison with the ERA5 Reanalysis
Although a typhoon bogus method was incorporated in the Japanese 55-year Reanalysis (JRA-55) isobaric analysis fields [
35], its horizontal (1.25° × 1.25°) and temporal (0000, 0600, 1200, and 1800 UTC) resolutions are too coarse to resolve typhoon structures. Therefore, the ERA-5 reanalysis with much higher resolutions (0.25° × 0.25°, hourly) is also used for validating the typhoon’s warm-core structure in this study.
Figure 9 compares the warm-core anomalies at 250 hPa between the FY-3D MWTS-2 retrieval and the ERA5 and the JRA-55 reanalysis for typhoons Lekima at three selected times during 7–8 August 2019. Although ERA5 and JRA-55 have comparable warm-core structures to MWTS-2, the peak temperature anomalies are too weak. It shows that the peak warm-core intensities obtained from the ERA5 and JRA-55 are about 2–3 K and 3–4 K lower than that retrieved by the MWTS-2, after subtracting the same environmental temperature. The environmental temperature is defined as the average temperature within two 15° × 15° boxes 1000 km away from the typhoon center on the west and east sides, which are 236.4 K, 236.5 K, and 236.5 K for
Figure 9a,d,g, respectively. The horizontal resolutions of ERA5 and JRA-55, which are lower than that of MWTS-2 (~0.15° × 0.15°), can explain the underestimation of TC’s size and intensity [
21]. The warm-core center obtained from the MWTS-2 (
Figure 9d) is located to the west of that from the ERA5 (
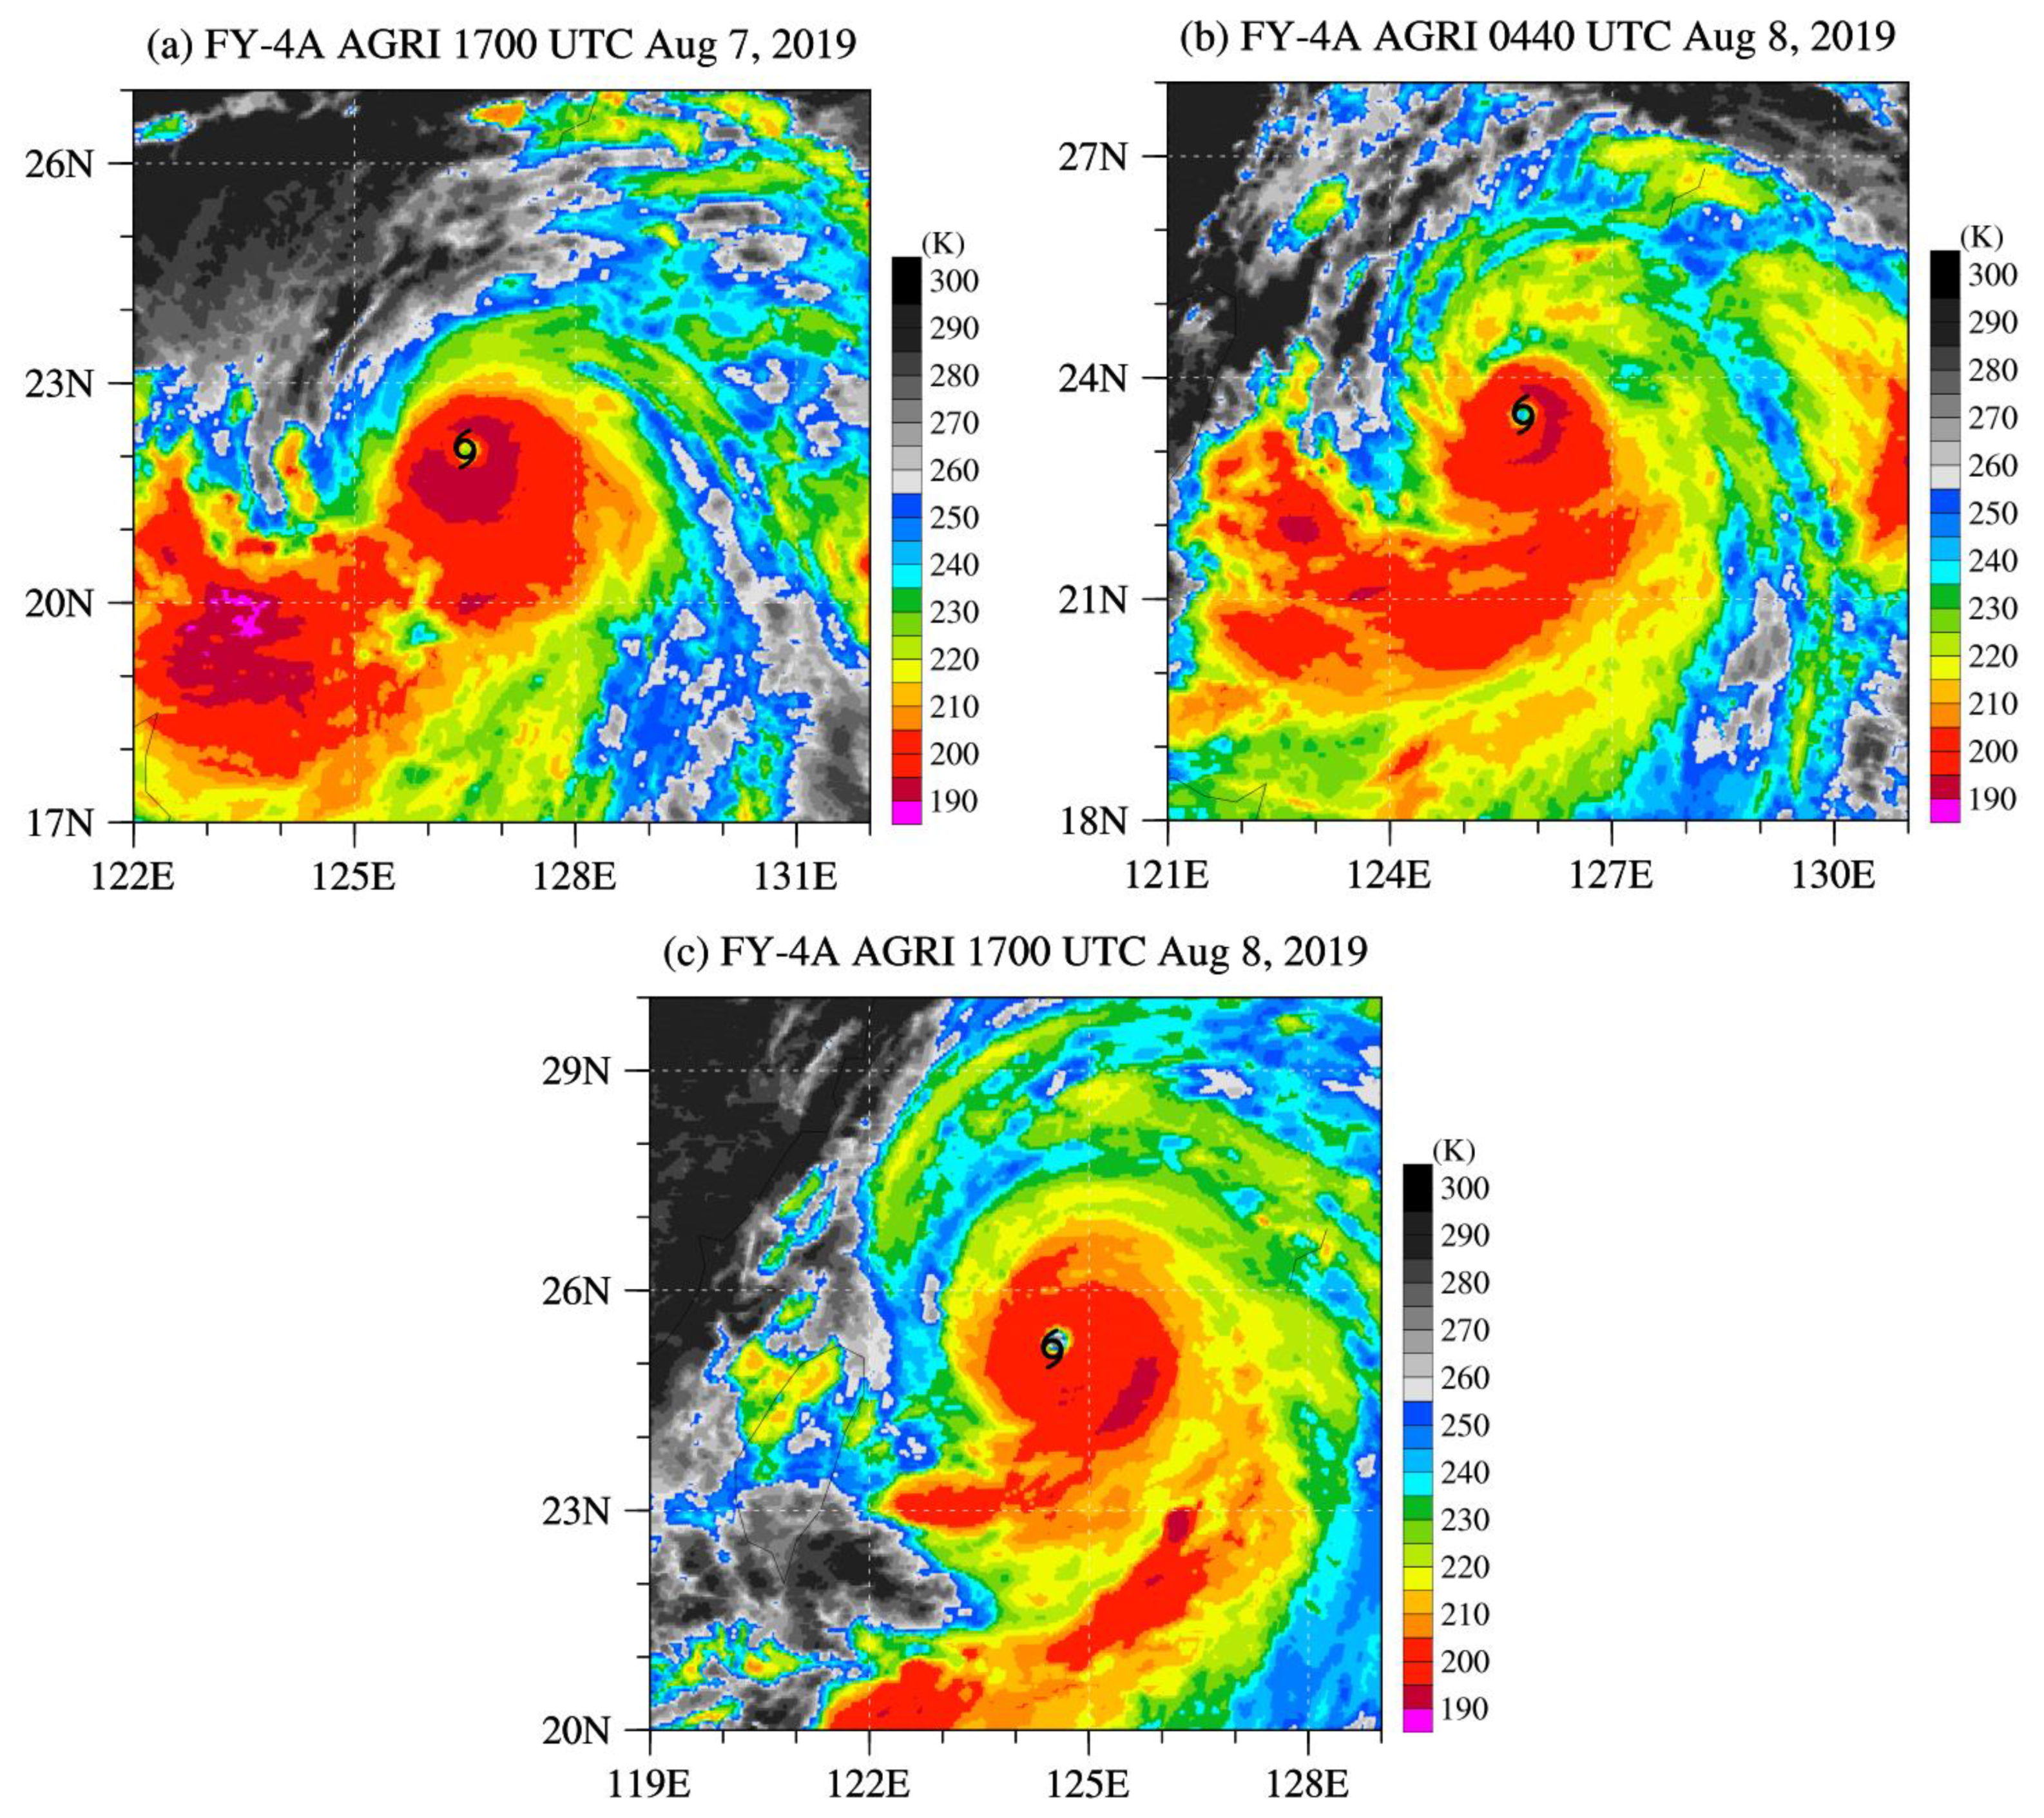
Figure 9e) around 0500 UTC on 8 August 2019. By comparing with the FY-4A AGRI observations in
Figure 10a–c, the MWTS-2 warm-core center (black typhoon symbol) is closer to the AGRI observed typhoon eye of Lekima, which indicates a good reference to estimate the locations of typhoon centers.
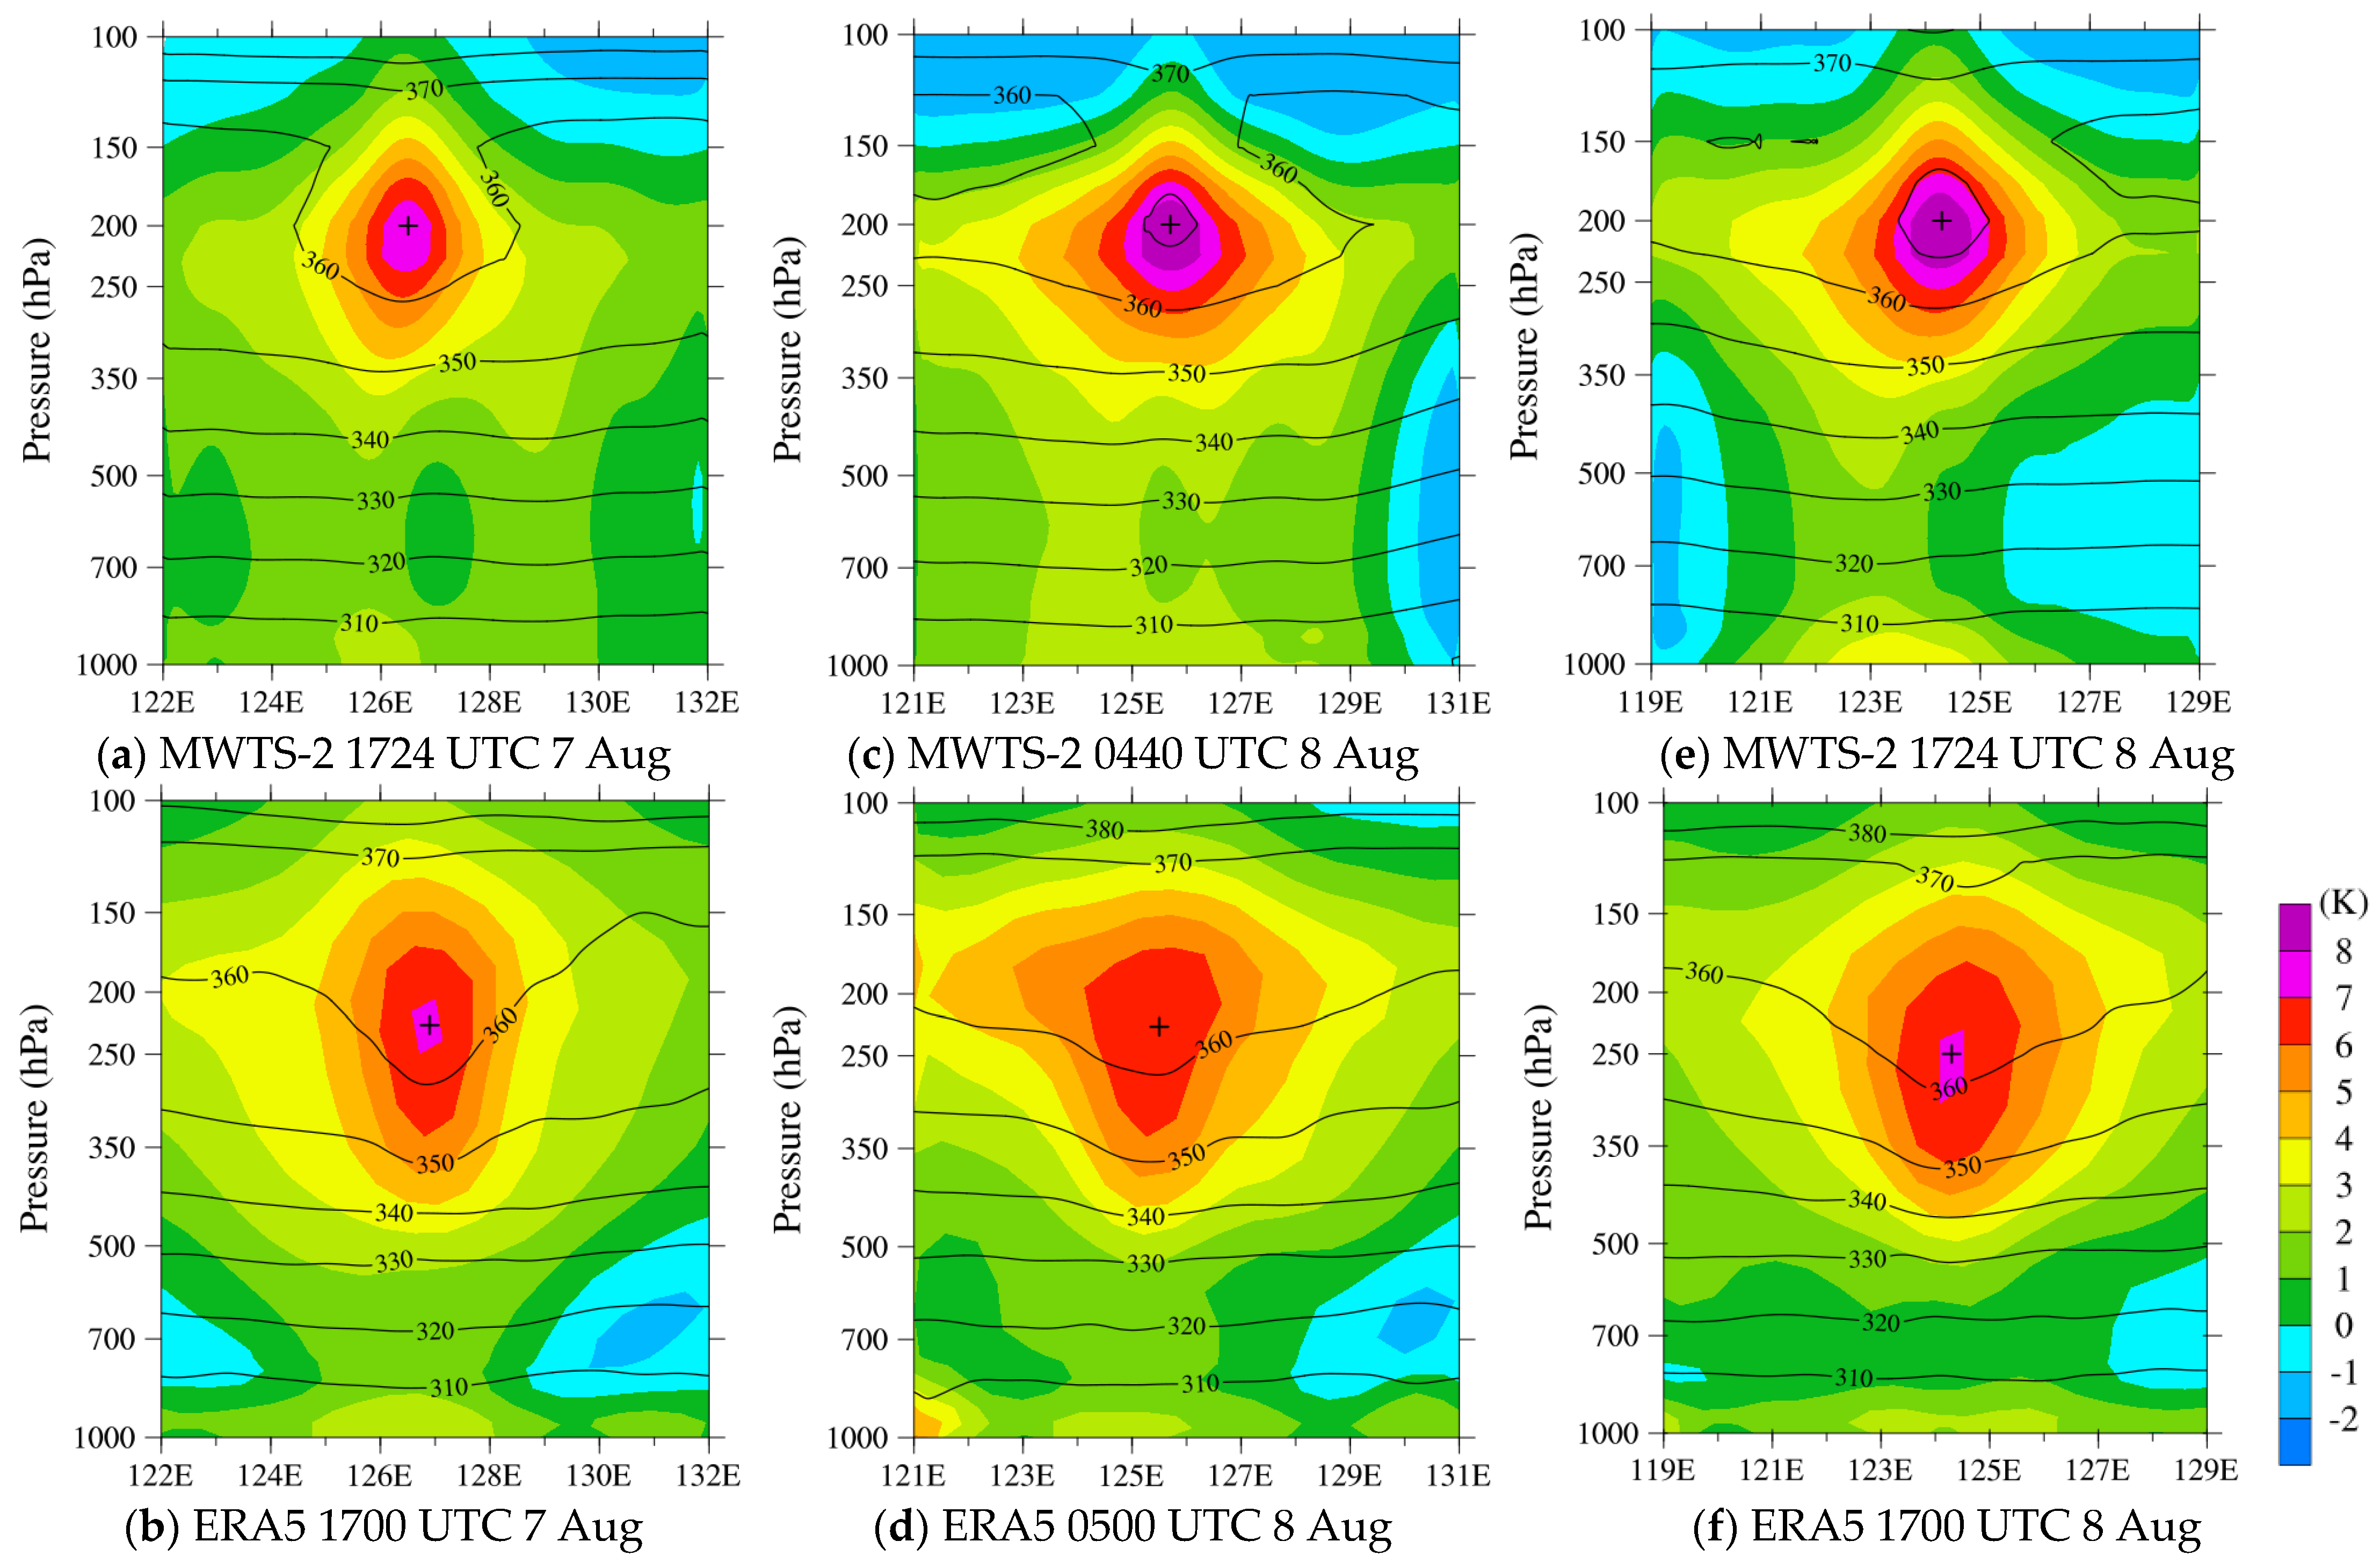
We may also compare the vertical structures of warm-cores between the MWTS-2 retrieval and the ERA5 reanalysis.
Figure 11 shows the cross-sections of temperature anomalies and potential temperatures obtained from the FY-3D MWTS-2 and the ERA5 reanalysis along a line from west to east passing the best track centers of Lekima at the same times as
Figure 9a,d,g. The structures of the warm-cores retrieved by the MWTS-2 are more compact than the ERA5 reanalysis. Compared with the hourly ERA5 reanalysis in August 2019 over the ocean, the biases of the MWTS-2 retrieved atmospheric temperatures are smaller than ±0.2 K (
Figure 12a), and root-mean-square errors (RMSEs) are smaller than 2.0 K (
Figure 12b) at all pressures.
Figure 13a,b shows the FY-4A AGRI channel-12 TB observations and the LWP retrieved by the NOAA-20 ATMS [
36] at 1700 UTC on 7 August 2019. The TB values in the inner-core region and the outer spiral rain band of Lekima are relatively low (
Figure 13a), which are associated with high cloud tops, strong convection, and heavy precipitation (
Figure 13b). The LWPs have two significant precipitation centers, one near the typhoon eye and the other near the location of 19.2° N, 124.5° E. The temperature anomalies and potential temperatures at 200 hPa obtained from the FY-3D MWTS-2 and the ERA5 reanalysis at this time are provided in
Figure 13c,d, respectively. The temperature anomalies of the MWTS-2 and ERA5 are the strongest in the typhoon inner-core. There is a weak warm-core in the outer rain bands (19.2° N, 124.5° E).
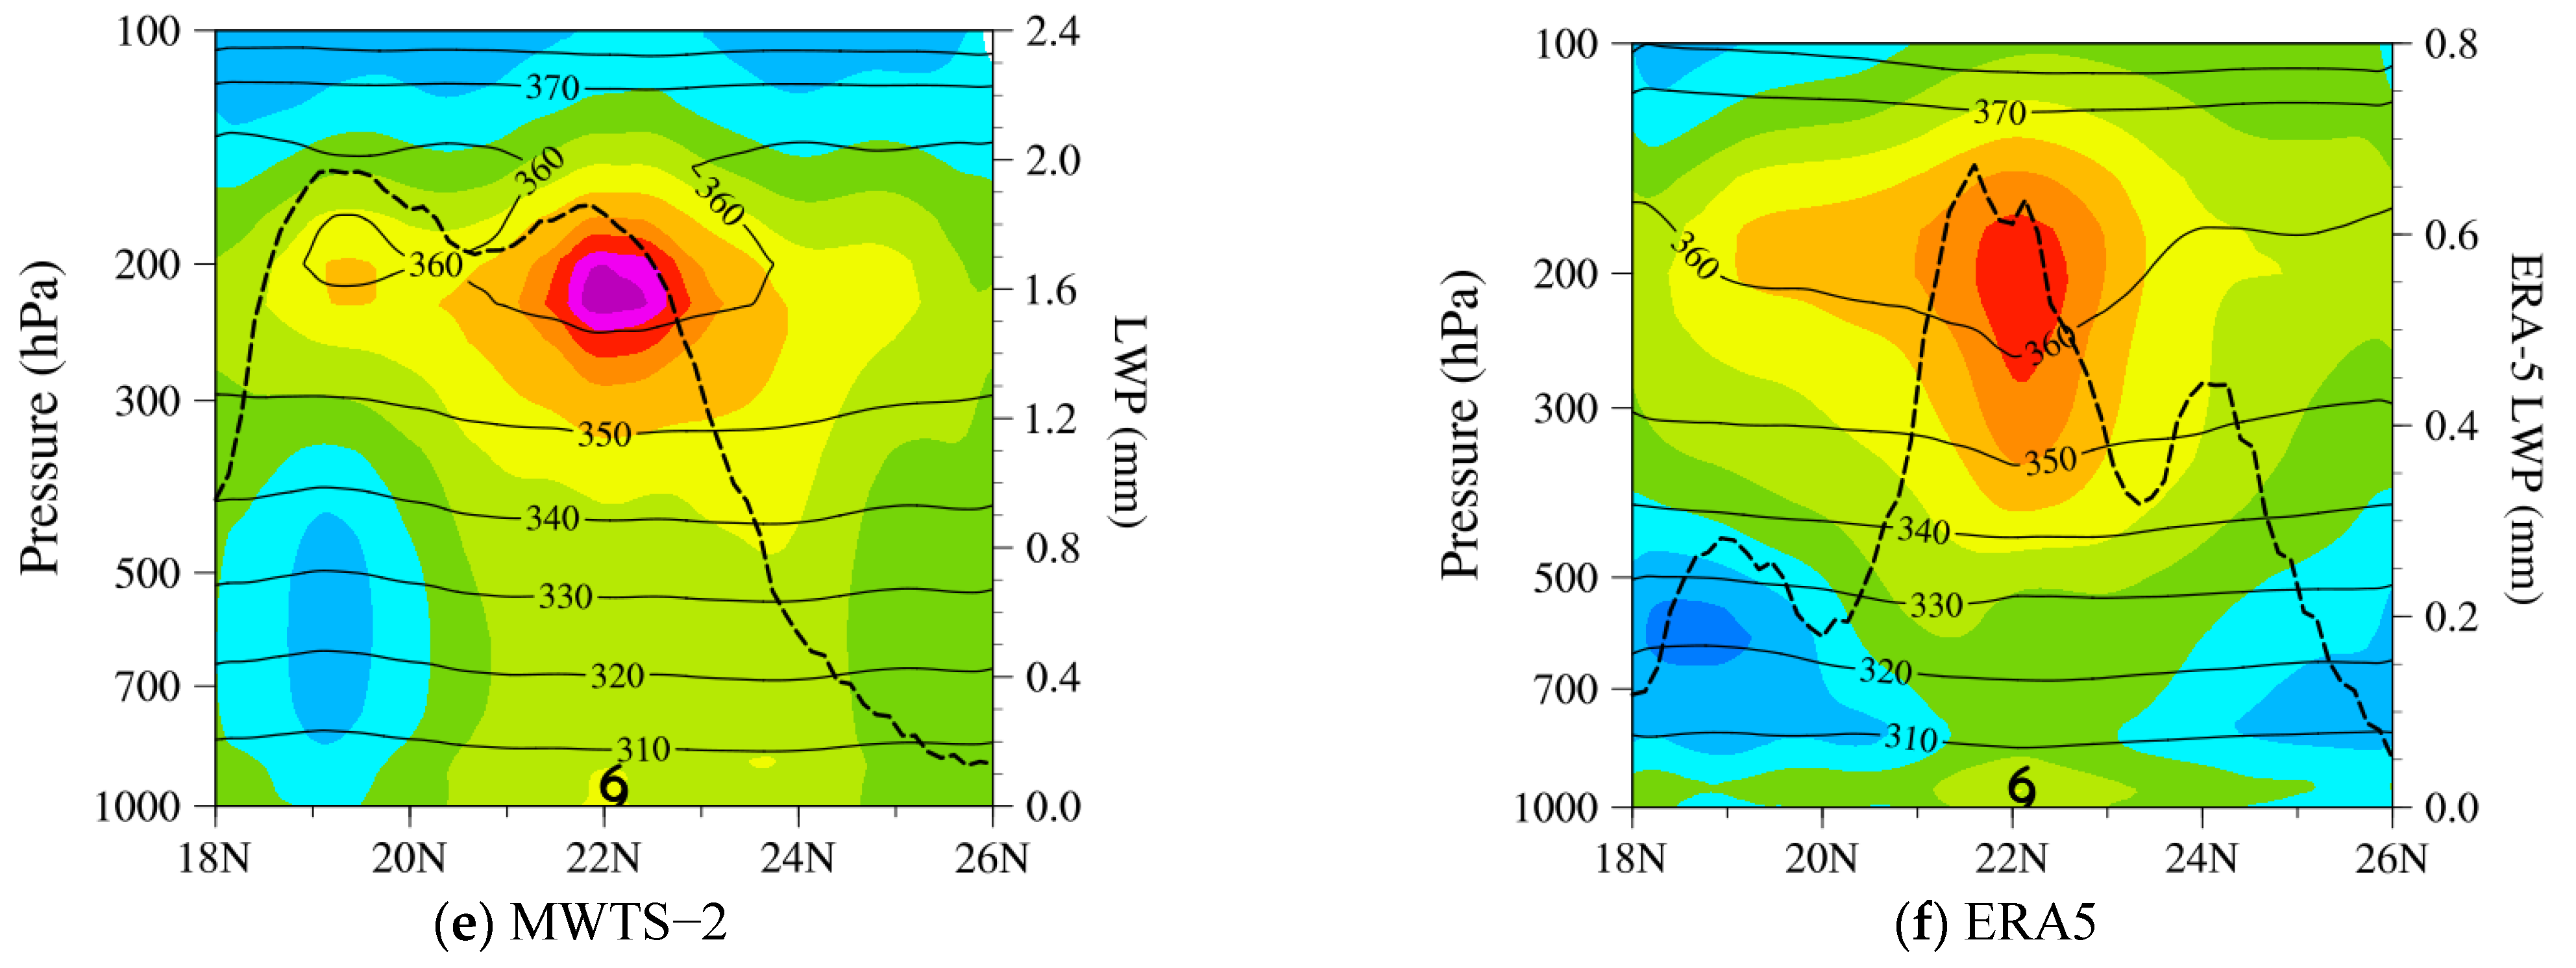
Figure 13e,f shows the cross-sections of temperature anomalies and potential temperatures from the FY-3D MWTS-2 retrieval and the ERA5 reanalysis along the AB line in
Figure 13c,d. The points A and B are located at (18.5° N, 123.5° E) and (25.5° N, 129.5° E), respectively. There is a weak warm-core anomaly in the MWTS-2 (~5 K,
Figure 13e) and the ERA5 (~5 K,
Figure 13f) temperature distributions near 19.2° N at 225 hPa (
Figure 13e) where the LWP values are large (black dashed line). Generally, there will be strong latent heat release when clouds form, which will result in a warm-core structure in the upper troposphere. There are also cold anomalies in the middle troposphere at 19.2° N in the air temperature obtained from both the MWTS-2 and ERA5, which could be associated with evaporation when rainfall occurred.
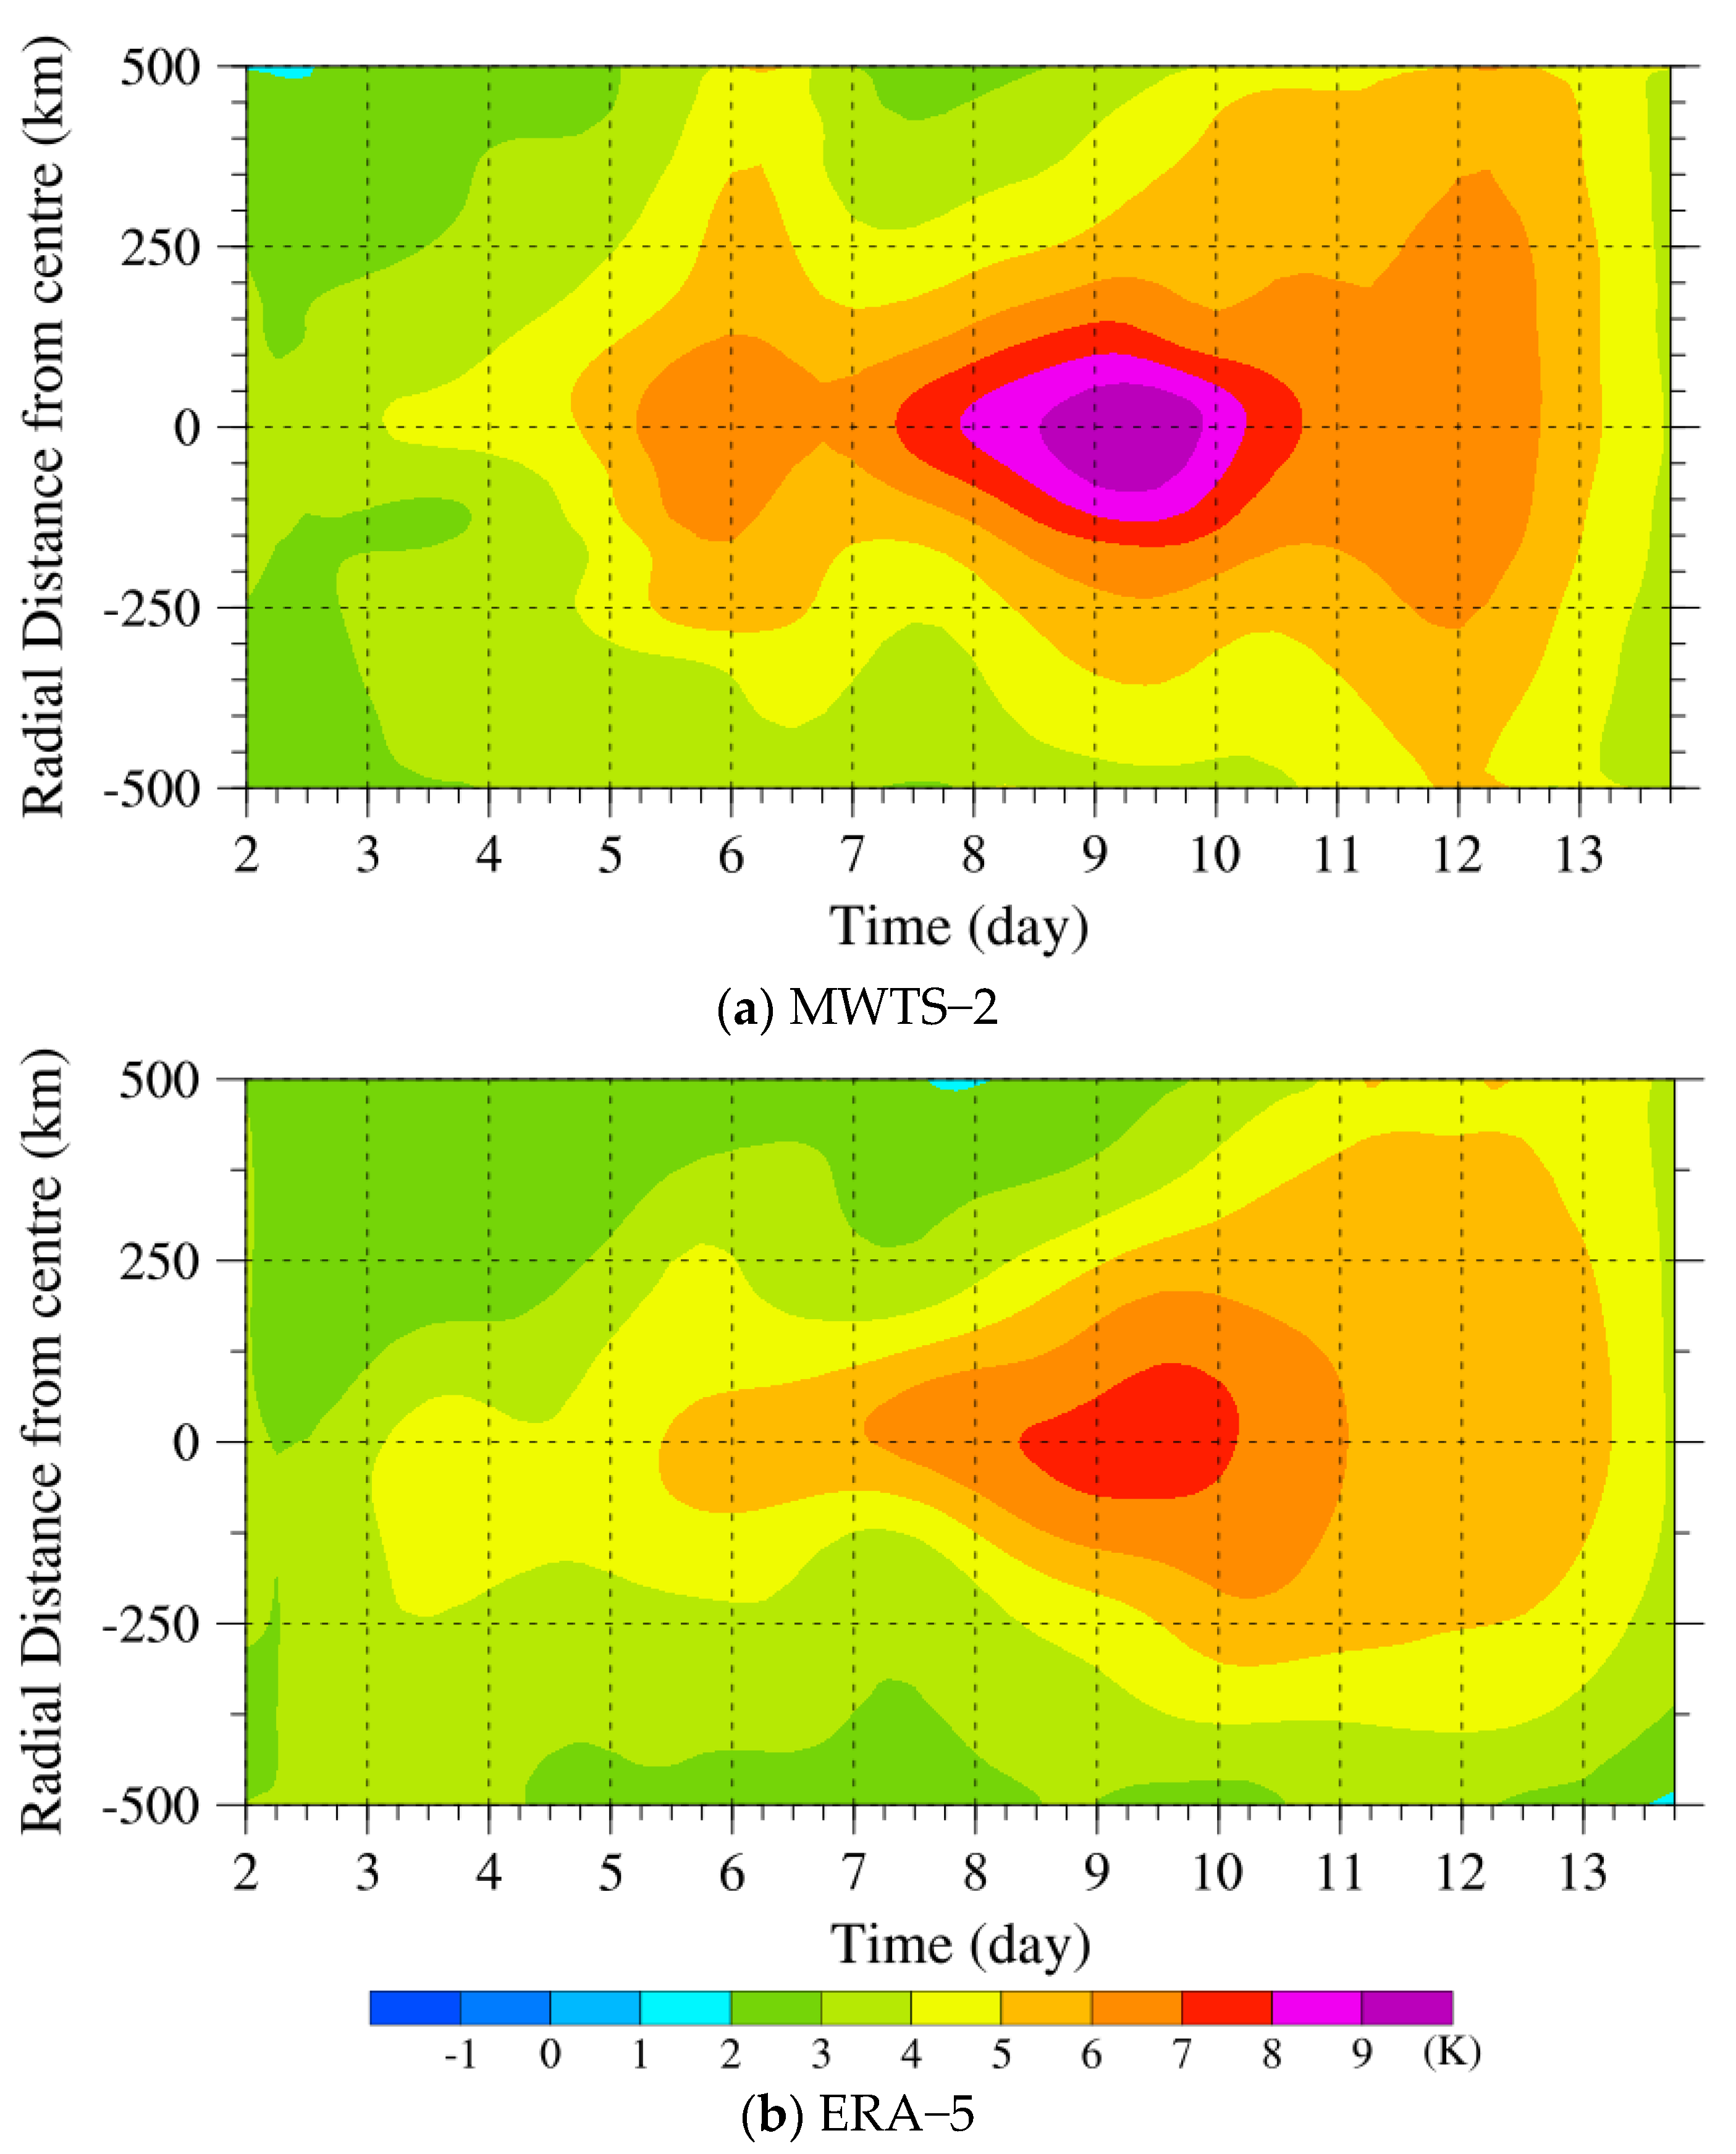
Typhoon Lekima experienced a significant increase in the radial size of the warm-cores as it intensified. This is confirmed by the temporal evolution of the radial variation in MWTS-2 retrieved temperature and ERA5 warm-core anomalies at 250 hPa within a 500-km radial distance along the west-east direction through the center of Typhoon Lekima from 2 to 14 August 2019 (
Figure 14).
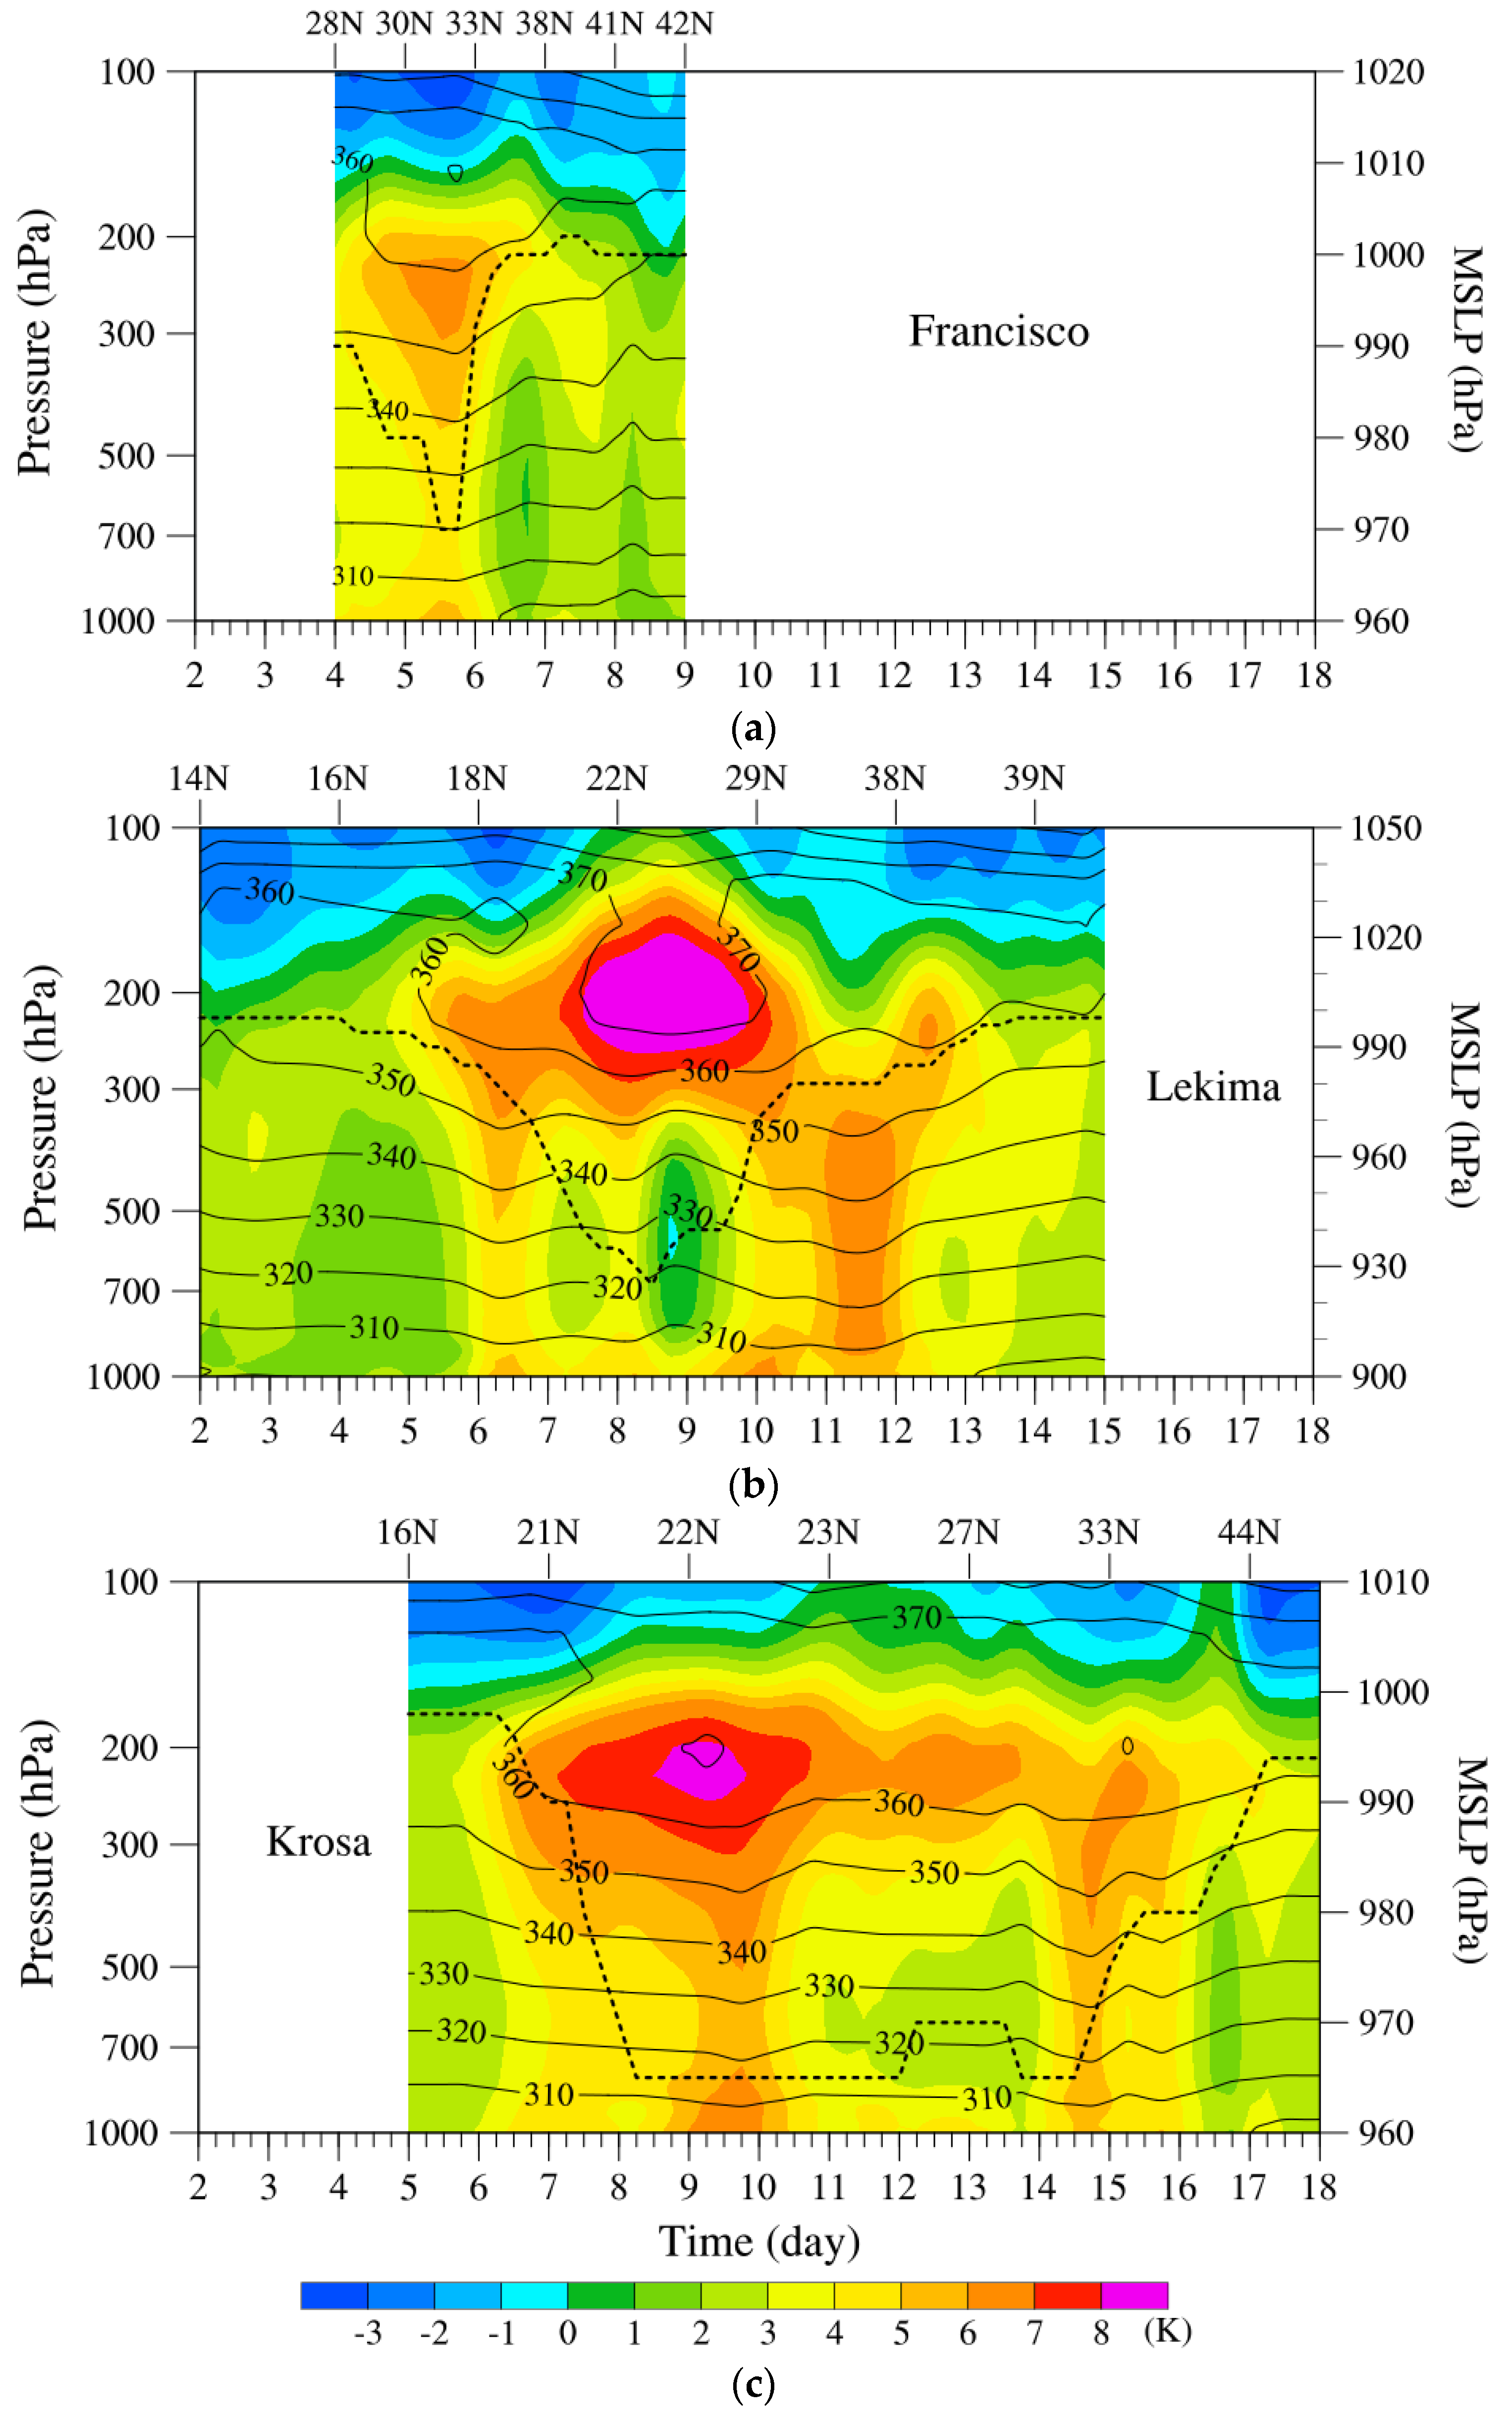
Figure 15 shows the temporal evolution of the temperature anomalies and potential temperatures obtained from the FY-3D MWTS-2 at the typhoon centers of Francisco (
Figure 15a), Lekima (
Figure 15b), and Krosa (
Figure 15c) from 2 to 18 August 2019. The warm-core height of Lekima is around 200 hPa, while the warm-core heights of Francisco and Krosa are below 200 hPa when they reached typhoon intensity.
5. Discussions and Conclusions
In this study, the TB observations of the FY-3D MWTS-2 channels 3–13 are used to obtain the warm-core anomalies of typhoons Lekima, Krosa, and Francisco that occurred in August 2019. In the typhoon stage of Lekima, the warm-core peak anomalies are 8–12 K warmer than the environments due to strong latent heat release and adiabatic heating of a downward motion at the eye. The warm-core center locations retrieved by the MWTS-2 are consistent with the best track and FY-4A AGRI observations, and the maximum intensity is found around 200–250 hPa. Although ERA5 and JRA-55 reanalysis have comparable Lekima’s warm-core structures to MWTS-2, the peak temperature anomalies are too weak. It shows that the peak warm-core intensities obtained from the ERA5 and JRA-55 are about 2–3 K and 3–4 K lower than that retrieved by the MWTS-2, which can be explained by the different horizontal resolutions. Compared with the hourly ERA5 reanalysis in August 2019 over the ocean, the biases of the MWTS-2 retrieved atmospheric temperatures are smaller than ±0.2 K, and RMSEs are smaller than 2.0 K at all altitudes.
A warm-core and cold-core are found at 200 hPa and the middle troposphere, respectively, in the outer rainband of Lekima both from MWTS-2 retrievals and ERA5 reanalysis. By comparing the distribution of LWP, it is not difficult to find that the cold-core is generated in the area with heavy precipitation, which is due to the effect of evaporation of rainfall. The height of the upper boundary of the cold-core of ERA5 is about 500 hPa, generally near the 0 °C lines, while the upper boundary of the cold-core of MWTS-2 retrieval is about 400 hPa. This could be due to the coarser vertical resolution of limited numbers of MWTS-2 channels.
In the future, the MetOp-A/B/C AMSU-A and FY-3E MWTS-3 can be combined to establish the Northwest Pacific typhoon warm-core dataset. We will use it to examine a statistical relationship between the warm-core height and/or intensity and the rapid intensification of typhoons. Moreover, the gradient wind can also be derived from the temperature retrieval of microwave temperature sounders. The MWTS-2 and AMSU-A retrieved wind and temperatures can be used for vortex initialization to improve the track and intensity forecasts of typhoons. We can also use the dataset to study the decadal change of the inner-core rain rate of typhoons [
37].

