Article

Evaluation of SWIR Crop Residue Bands for the Landsat Next Mission

1
U.S. Geological Survey, Lower Mississippi-Gulf Water Science Center, Beltsville, MD 20705, USA
2
U.S. Geological Survey, Lower Mississippi-Gulf Water Science Center, Coram, NY 11727, USA
3
Agricultural Research Service, Hydrology and Remote Sensing Laboratory, U.S. Department of Agriculture, Beltsville, MD 20705, USA
4
EOanalytics Ltd., D11 YNR2 Dublin, Ireland
5
Department of Geography, University of Utah, Salt Lake City, UT 84112, USA
6
U.S. Geological Survey, Geology, Geophysics, and Geochemistry Science Center, Lakewood, CO 80225, USA
7
U.S. Geological Survey, National Land Imaging Program, Flagstaff, AZ 86001, USA
8
NASA Goddard Space Flight Center, Biospheric Sciences Laboratory, 8800 Greenbelt Road, Greenbelt, MD 20771, USA
*
Author to whom correspondence should be addressed.
Remote Sens. 2021, 13(18), 3718; https://doi.org/10.3390/rs13183718
Submission received: 31 May 2021 / Revised: 23 August 2021 / Accepted: 30 August 2021 / Published: 17 September 2021
(This article belongs to the Special Issue Remote Sensing of Crop Residue and Non-photosynthetic Vegetation)

Abstract

:
This research reports the findings of a Landsat Next expert review panel that evaluated the use of narrow shortwave infrared (SWIR) reflectance bands to measure ligno-cellulose absorption features centered near 2100 and 2300 nm, with the objective of measuring and mapping non-photosynthetic vegetation (NPV), crop residue cover, and the adoption of conservation tillage practices within agricultural landscapes. Results could also apply to detection of NPV in pasture, grazing lands, and non-agricultural settings. Currently, there are no satellite data sources that provide narrowband or hyperspectral SWIR imagery at sufficient volume to map NPV at a regional scale. The Landsat Next mission, currently under design and expected to launch in the late 2020’s, provides the opportunity for achieving increased SWIR sampling and spectral resolution with the adoption of new sensor technology. This study employed hyperspectral data collected from 916 agricultural field locations with varying fractional NPV, fractional green vegetation, and surface moisture contents. These spectra were processed to generate narrow bands with centers at 2040, 2100, 2210, 2260, and 2230 nm, at various bandwidths, that were subsequently used to derive 13 NPV spectral indices from each spectrum. For crop residues with minimal green vegetation cover, two-band indices derived from 2210 and 2260 nm bands were top performers for measuring NPV (R2 = 0.81, RMSE = 0.13) using bandwidths of 30 to 50 nm, and the addition of a third band at 2100 nm increased resistance to atmospheric correction residuals and improved mission continuity with Landsat 8 Operational Land Imager Band 7. For prediction of NPV over a full range of green vegetation cover, the Cellulose Absorption Index, derived from 2040, 2100, and 2210 nm bands, was top performer (R2 = 0.77, RMSE = 0.17), but required a narrow (≤20 nm) bandwidth at 2040 nm to avoid interference from atmospheric carbon dioxide absorption. In comparison, broadband NPV indices utilizing Landsat 8 bands centered at 1610 and 2200 nm performed poorly in measuring fractional NPV (R2 = 0.44), with significantly increased interference from green vegetation.

1. Introduction

1.1. Spectral Characteristics of the Agricultural Land Surface

The presence of crop residues (non-photosynthetic stalks, stubble, and other senescent plant material) on the surface of agricultural soils supports a variety of environmental services, serving to decrease soil erosion, increase soil organic matter, and improve soil health [1]. Additionally, crop residue can preserve soil moisture, reduce evaporation, inhibit the germination of weeds, increase aggregate stability, and support healthy soil ecosystems [2,3]. The amount of crop residue cover is directly linked to crop system management, responding to tillage practices, crop rotations, and harvest methods. Accurate measurement and mapping of crop residue cover can contribute to a better understanding of implementation of conservation practices within agricultural landscapes. Crop residue transect surveys are frequently conducted by State and Federal agencies, and by farmers, to monitor the adoption and effectiveness of conservation tillage practices. In temperate agricultural settings, crop residue cover is typically measured at its seasonal minimum, when spring tillage and planting are complete but before summer crops have grown to cover the soil [4,5]. Traditionally, crop residue cover has been quantified by use of in-field line-point transects [6,7], or more recently by line-point analogs using photographic analysis [8], and most recently using spectral analysis of reflectance from the field surface [9,10,11].
Reflectance (R) from agricultural fields is largely determined by three land cover components: green vegetation (GV) including crops and weeds; non-photosynthetic vegetation (NPV) including crop residue and other senescent plant material; and exposed soil, including the variety of colors and absorption features associated with various soil types. Spectral identification of the GV fraction is relatively straightforward using broadband indices such as the Normalized Difference Vegetation Index (NDVI), because GV has strong absorption in the visible red wavelengths and high reflectance in the near infrared (NIR):
NDVI = ( ( R N I R R R e d ) / ( R N I R + R R e d ) )  
The NDVI has been proven robust and effective for assessing green vegetation cover in agricultural regions [12,13]. However, substantial amounts of green vegetation interfere with the estimation of NPV and soil fractional cover, both by physically covering those fractions and due to vegetation water absorption masking NPV and soil spectral characteristics. For this reason, NDVI is often used to identify areas of high green vegetation cover prior to characterizing NPV cover, with many agricultural studies applying a threshold of NDVI < 0.3 to identify minimally vegetated areas suitable for remote sensing detection of NPV [4,10,11].
Spectral separation of the NPV and soil components of agricultural land cover is more challenging because NPV and soil show broad spectral similarity with few distinguishing features at visible-NIR (VNIR) wavelengths [9,14]. Separation of the two components using VNIR wavelengths can sometimes be achieved by detecting spectrally broad differences in VNIR brightness, particularly when crop residues are fresh (visibly bright) and soils are visibly dark, but these measures are highly dependent on soil moisture content and the age and decomposition state of crop residue, resulting in a low degree of accuracy when these conditions are unknown [15,16].
However, NPV exhibits absorption features related to plant biochemical constituents, primarily lignin and cellulose (ligno-cellulose), in the shortwave infrared (SWIR) wavelengths, at 2100 and 2300 nm [17]. These features can be exploited to distinguish NPV from soil reflectance if sensor spectral resolution is sufficient to measure the absorption feature depths (i.e., imaging spectrometers and narrowband multispectral sensors measuring the SWIR region) [9,18,19]. Currently, spaceborne platforms that provide sufficient spectral sampling and resolution are limited to WorldView-3, with a 12 km swath, and Hyperspectral PRecursor of the Application Mission (PRISMA), with a 30 km swath, such that large-scale State and regional mapping of NPV and tillage intensity based on ligno-cellulose absorption is not feasible. Multispectral satellites that provide wall-to-wall coverage, such as Landsat 8 and Sentinel-2, each provide two SWIR bands centered at 1600 and 2200 nm. However, the 2200 nm band covers a broad spectral range from 2100 nm to 2300 nm, a wavelength range poorly situated to capture the spectrally narrow ligno-cellulose absorption features [17,20].

1.2. Crop Residue Measurement Using Broadband Multispectral Indices

In spite of spectral sampling and resolution limitations, SWIR spectral indices produced from broadband multispectral sensors have been demonstrated to be somewhat useful for characterizing relative cover of NPV and soil [21,22,23,24,25,26]. These studies have largely utilized Landsat and Sentinel-2 imagery, leveraging spectrally broad contrasts between SWIR bands at ~1600 nm and ~2200 nm to separate NPV and soil. The most effective Landsat-based NPV index has generally been found to be the Normalized Difference Tillage Index (NDTI) (Gelder et al., 2009, R2 = 0.67 [27]; Jin et al., 2015 [22], R2 = 0.84; Najafi et al., 2019, R2 = 0.76 [23]; Hively et al., 2019, R2 = 0.84 [28], where R2 refers to goodness of fit for the correlation between the index and percent NPV cover):
NDTI = ( R 1610 R 2200 ) / ( R 1610 + R 2200 )
The ability to compute the NDTI from Landsat imagery provides multi-decadal, wall-to-wall mapping of NPV, crop residue, and tillage intensity at a 30 m resolution. The NDTI (sometimes also termed the Landsat Normalized Burn Ratio 2 (NBR2)) can be derived from heritage Landsat 4 and 5 Thematic Mapper (TM) imagery and current Landsat 7 Enhanced Thematic Mapping plus (ETM+) and Landsat 8 Operational Land Imager (OLI) imagery, as well as Sentinel-2 Multispectral Instrument (MSI) imagery. Recently, Beeson et al., (2020) used Landsat-derived NDTI to map conservation tillage in three Midwest states over a 10-year period, with overall accuracies ranging from 64% to 78%, which is a typical accuracy range for studies employing this index [4]. In addition to use of spectral indices for NPV cover estimation, researchers using broadband multispectral imagery have employed various innovative methods such as spectral unmixing (Laamrani et al., 2020; R2 = 0.70 [29]) and machine learning (Ding et al., 2020; R2 = 0.69 [30]), but seldom do such studies produce accuracies exceeding 80%.
The limited accuracy of broadband approaches results from several factors including issues with inter-image calibration, background soil moisture conditions, and interference from low levels of green vegetation. Yue et al., (2019) conducted a laboratory-based study assessing the NPV cover prediction performance of broadband indices, narrowband indices, and narrowband spectral angle mapping approaches, finding that broadband indices were most susceptible to errors in NPV cover prediction when moisture conditions varied [31]. Quemada and Daughtry (2016) obtained similar findings in a field-based study assessing NPV cover prediction performance for established indices and finding the more accurate applications of NDTI are generally limited to settings where residue is fresh, soil and residue moisture contents are below 25%, and GV cover is minimal [32]. The influence of moisture on broadband NPV index variability can make inter-image calibration and NPV timeseries analyses particularly challenging [28,33].

1.3. Narrowband SWIR Indices Measuring 2100 nm and 2300 nm Ligno-Cellulose Absorption Features

Narrowband SWIR indices have consistently demonstrated improved accuracy in mapping crop residue compared to broadband approaches like the NDTI [9,10,11,16,28,31,32,33,34,35]. Furthermore, the narrowband SWIR indices that measure ligno-cellulose absorption features are far less influenced by the presence of green vegetation than are broadband indices [9,10,11] and are also less influenced by moisture variability and more amenable to correction for moisture content using water ratio indices [9,32,33].
The Cellulose Absorption Index (CAI) is a three-band SWIR index originally developed by Nagler et al., (2000) [20] and applied in numerous studies using surface-collected hyperspectral or satellite narrowband reflectance data [9,10,11,16,31,32,35,36]. The CAI characterizes NPV by measuring ligno-cellulose absorption centered near 2100 nm relative to shoulder reflectance maxima at 2040 nm and 2200 nm.
CAI = ( 0.5 ( R 2000 + R 2200 ) ) R 2100
The Lignin-Cellulose Absorption Index (LCA) is a three-band index that measures ligno-cellulose absorption at 2100 and 2330 nm relative to a central maximum at 2210 nm, while the Shortwave Infrared Normalized Difference Residue Index (SINDRI) relies on two bands to measure absorption at 2260 nm relative to the maximum at 2210 nm. Both these indices are effective for measuring NPV while also demonstrating resistance to interference from GV and surface moisture content [9,11]. Additionally, in this manuscript we consider a three-band Ligno-Cellulose Peak Centered Difference Index (LCPCDI) that measures ligno-cellulose absorption at 2100 and 2260 nm relative to a central reflectance maximum at 2210 nm. While mathematically similar to the LCA, the LCPCDI avoids low radiance levels associated with the 2330 nm band.
LCA = ( 2 ( R 2210 ) ) ( R 2100 + R 2330 )
  SINDRI = ( R 2210 R 2260 ) / ( R 2210 + R 2260 )
LCPCDI = ( 2 ( R 2210 ) ) ( R 2100 + R 2260 )
The major impediment for implementing narrowband approaches to map NPV has been limited coverage and availability of high spectral resolution SWIR imagery from aircraft and satellites. The Advanced Spaceborne Thermal Emission and Reflection Radiometer (ASTER) instrument on-board the Terra satellite, which was launched in 1999, was the first to provide SWIR bands with spectral resolutions capable of characterizing ligno-cellulose absorption features at a spatial resolution of 30-m or finer [10]. ASTER has not collected SWIR imagery since 2008 due to a sensor malfunction. More recently, the WorldView-3 (WV3) satellite was launched in 2014 with SWIR spectral bands similar to ASTER, but with a 4-m spatial resolution. The WV3 narrowband SWIR imagery has been shown to be highly effective for crop residue characterization [11]. However, WV3 imagery is limited by the fact it must be tasked for acquisition and it lacks large-scale coverage (12 km swath width). Spaceborne hyperspectral data have also been, or will be, available at limited scale, from missions including Hyperion, TianGong-1, PRISMA, HISUI, EnMAP, Shalom, EMIT, and HypXIM [37], with demonstrated applications in the detection of NPV using Hyperion [9,38] and PRISMA [39]. Hyperspectral imagery with large-scale coverage will also likely become available from the Surface Biology and Geology (SBG) Designated Observable and the Copernicus Hyperspectral Imaging Mission for the Environment (CHIME) [40]. However, at present, both missions are in development phase with no specific launch dates. At this time, there are no satellite data sources that provide narrowband or hyperspectral SWIR imagery at a volume sufficient to map NPV at a regional scale, pointing to the need for a spaceborne sensor that provides wall-to-wall narrowband SWIR imagery for detection of crop residue and conservation tillage.

1.4. Future of Landsat

Currently, the Landsat 7 and 8 missions provide imagery of the Earth at 30-m resolution, with a return time of 16 days per satellite. Landsat 7 was launched in April 1999 and is currently in decaying orbit (9:45 am equatorial crossing, with 9:15 am projected for 2022) and exhibits a scan line artifact that reduces its coverage. Landsat 8 was launched in February 2013, and relative to Landsat 7 provides narrower spectral bands, improved calibration and signal-to-noise ratios, improved 12-bit radiometric resolution, and more precise geolocation. Its data acquisition remains stable. The Landsat 9 satellite, scheduled for launch in September 2021, will be a near-clone of Landsat 8. Together, these Landsat missions will provide continuity in multispectral imagery suitable for mapping NPV using broadband SWIR indices such as NDTI.
The Landsat 9 follow-on mission, Landsat Next, currently in pre-formulation and expected to launch in the late 2020s, provides the opportunity for achieving increased SWIR spectral sampling and resolution with the adoption of new sensor technology [41,42]. Landsat Next aims to continue the unprecedented long-term Landsat data record while providing spatial, temporal and spectral improvements to address pressing societal issues and scientific questions. Landsat Next will provide Landsat data continuity by preserving heritage Landsat spectral bands and will improve synergy with the European Space Agency’s Sentinel-2 sensors by including additional spectral bands and adopting improved spatial resolution. Landsat Next will also include additional spectral bands to address applications such as water quality and quantity, snow and ice detection, crop residue, and improved surface temperature retrieval via temperature/emissivity separation. Narrow spectral bands in the SWIR region are planned to be added for measurement of ligno-cellulose absorption features to support the detection of NPV, including crop residue.
This manuscript reports the findings of a Landsat Next expert review panel convened in 2020–21 that focused on the use of narrow SWIR bands to measure ligno-cellulose absorption features, with the objective of measuring and mapping NPV, crop residue cover, and the adoption of conservation tillage practices. The members of the panel are the authors of this manuscript. Using a published dataset of 916 surface reflectance spectra collected from agricultural fields that ranged from 0% to 100% NPV cover, we calculated mean reflectance for five SWIR bands (2040, 2100, 2210, 2260, and 2330 nm) at varying bandwidths ranging from 10 to 50 nm. These band centers were chosen based on demonstrated NPV characterization performance from previous missions like ASTER, WV3, and Hyperion. Using these band centers, we evaluated the effects of bandwidths, atmospheric impacts, sensor signal-to-noise ratios, fractional green vegetative cover, and background soil reflectance on the ability of SWIR-derived indices to measure fractional NPV cover on agricultural fields, as well as assessing spectral continuity with the existing Landsat 8 OLI Band 7. Several options, including the best 4-band, 3-band, and 2-band solutions, were described for possible inclusion on the Landsat Next mission.

2. Materials and Methods

2.1. Hyperspectral Source Data

Hyperspectral field spectrometer data published in Dennison et al. [43] were used to simulate and subsequently evaluate five SWIR bands and associated NPV indices relevant to the Landsat Next mission, focusing on 916 source spectra collected by Daughtry and Hunt (2008) [16] and by Quemada and Daughtry (2016) [32] from agricultural fields located at the U.S. Department of Agriculture, Henry A. Wallace Beltsville Agricultural Research Center (BARC), near Beltsville, MA, USA.
Daughtry and Hunt (2008) collected 506 field spectra from seven different agricultural field sites at BARC with soil type typified by Codorus (fine-loamy, mixed, active, mesic, Fluvaquentic Dystrudept) in May 2002, June 2003, and June 2004 [16]. These spectra captured fields with varying percent cover of soil, crop residue, and young green corn (Zea mays L.), soybean (Glycine max (L.) Merr.), or wheat (Triticum aestivum L.). From this dataset, 276 samples were identified with moderate levels of green vegetation (NDVI > 0.3) and 230 samples were identified with minimal levels of green vegetation (NDVI < 0.3). Percent NPV cover ranged from 0 to 100%.
Quemada and Daughtry (2016) collected field spectra from a single non-vegetated agricultural field at BARC with soil type of Matawan sandy loam (fine-loamy, siliceous, semi-active, mesic Aquic Hapludult) [32]. Crop residue cover and moisture conditions were manually manipulated at field sampling locations in a series of experiments carried out from 24–30 July 2014, in which five levels of crop residue cover (0 to 100% NPV) were established using corn residue and water content was manipulated using overhead irrigation. Relative water content (RWC) of soil and residue was measured for all spectra. Spectra of material with RWC in excess of 60% were excluded from the Dennison et al. [43] analysis due to strong attenuation of SWIR reflectance, resulting in a total of 410 spectra and associated NPV-soil fractional cover values. All samples exhibited NDVI < 0.3.
In both studies, the original reflectance spectra [44] were measured using Analytical Spectral Devices (ASD) FieldSpec Pro field spectrometers [45]. The native sampling intervals of the ASD spectrometer used in these studies range from 2 to 12 nm for the SWIR detectors (1001 to 2500 nm). ASD instruments resample the native channels using cubic spline interpolation before recording 2151 channels at standardized wavelengths (350 to 2500 nm) at a 1 nm interval [45]. The 18° foreoptic of an ASD FieldSpec Pro spectroradiometer and a red-green-blue (RGB) digital camera were aligned and mounted on a pole at 2.3 m above the surface with a nadir view angle, resulting in an approximately 0.7 m diameter field of view for the spectroradiometer. At each sampling location, a digital image (<1 mm spatial resolution) and a single composite ASD spectrum, which was an integrated average of 30 consecutive spectral scans, were recorded. The ASD spectra were calibrated to surface reflectance using a 46 cm square Spectralon reference panel [46] with recalibration occurring every 15–20 min. Data acquisition occurred within 2 h of local solar noon under clear sky conditions. The area viewed by the spectroradiometer was extracted from each digital image, and SamplePoint software [8] was used to overlay a matrix either of 156 points (Daughtry and Hunt, [16]) or 132 points (Quemada and Daughtry, [32]) on each extracted image. Each point was visually interpreted as either GV, NPV, or soil, and fractional cover was determined by dividing the number of points in each class by the total number of points per image.
In this manner, 916 surface reflectance spectra (400 to 2400 nm) were acquired, along with corresponding measurements of percent GV, NPV, and soil cover. Two versions of this dataset were subsequently compiled: gaussian surface reflectance with and without simulated residual atmospheric effects and sensor noise (Version A), and boxcar surface reflectance (Version B). For the gaussian dataset, Dennison et al. [43] first convolved the source surface reflectance spectra to 10 nm using full-width half-maximum (FWHM) gaussian spectral response functions (SRF), creating the gaussian “original” dataset. To add sensor noise, these spectra were subsequently converted to simulated radiance for a satellite sensor using a radiative transfer model and then a radiance-dependent noise function was applied. Reflectance was then retrieved from the simulated radiance spectra from an atmospheric correction using the ATmospheric REMoval (ATREM) model [47], resulting in a gaussian “atm” dataset of spectra that included simulated atmospheric correction artifacts and sensor noise. The Version B (boxcar) spectra were derived by using boxcar spectral response functions to process the original 916 hyperspectral surface reflectance data into 10 nm resolution bands [44]. While the boxcar dataset did not contain simulated atmospheric or sensor noise effects, it was created to provide greater bandwidth specificity (the gaussian data could only be used to evaluate bandwidths of 10, 30, and 50 nm, while the boxcar could be used to evaluate 10, 20, 30, 40, and 50 nm bandwidths), and also because the boxcar SRF was expected to be more similar to the probable SRFs of the future Landsat Next sensor. Each of the datasets (gaussian original; gaussian atm; and boxcar) is available in [44]. Examples of the differences between original and atm gaussian spectra are provided for crop residue, soil, and green vegetation in Figure 1.

2.2. Selection of Shortwave Infrared (SWIR) Bands and Indices

Using the gaussian and boxcar datasets [44], reflectance was calculated for each of five SWIR bands centered at 2040, 2100, 2210, 2260, and 2330 nm (Figure 1) at varying bandwidths (10, 30, 50 nm for the gaussian dataset and 10, 20, 30, 40, 50 nm for the boxcar dataset). The SWIR band centers were selected based on spectral alignment with ligno-cellulose absorption features, avoidance of atmospheric water absorption features, and previously demonstrated utility for NPV characterization in studies using ASTER, WV3, and hyperspectral data. The range of considered bandwidths were selected based on expected Landsat Next imaging sensor technical considerations for achieving ample signal-to-noise ratios (see Section 2.4, below) while also avoiding regions of the SWIR spectrum that are both unrelated to ligno-cellulose absorption and prone to atmospheric interference. The resulting range of SWIR reflectance bands were used to calculate 11 SWIR-based NPV indices including CAI, LCA, SINDRI, and NDTI, as well as several new indices described in Table 1. The overall workflow from this point is depicted in Figure 2 and described in detail below.

2.3. Assessment of Atmospheric Interference

The gaussian datasets were used to compare untransformed surface reflectance spectra (original) vs. spectra transformed to include simulated atmospheric artifacts and sensor noise (atm), using relative percent difference (RPD) as a performance metric to assess the impact of these factors on band calculation at various bandwidths (10, 30, and 50 nm). Original and atm spectra were also used to compute NPV indices. RPD was again used as a metric to compare the NPV index values between the original and atm. The differences between the original and atm spectra for both band and NPV index calculations are unique to the atmospheric correction residuals using MODTRAN for simulation of at-sensor radiance and ATREM for the subsequent atmospheric correction of atm spectra as described by Dennison et al. [43]. Because the differences between the original and atm spectra are the result of a single atmospheric simulation and correction scheme, they are not comprehensive nor specifically tailored to Landsat Next. While the specific RPD values are unique to this dataset, bands and indices with relatively high RPD magnitude are likely to also have high RPD for Landsat Next, thus providing qualitative and relative assessments of band and NPV index resilience to atmospheric effects.
To further assess the impacts of atmospheric interference, we calculated a single mean spectrum from the original dataset of 916 agricultural target surface reflectance spectra, as well as spectra for mean +/− one standard deviation. These representative surface reflectance spectra were used to simulate at-sensor radiance with MODTRAN6 [48]. The three surface reflectance spectra for mean +/− one standard deviation were used as inputs to parameterize MODTRAN with expected properties for an agricultural surface target for three simulations corresponding to each reflectance spectra. These three MODTRAN simulations assumed a 45-degree solar zenith angle, 3 cm column water vapor, a mid-latitude summer atmospheric profile, and multiple scattering with a rural aerosol model and 30 km visibility. At-sensor radiance output from MODTRAN for each of the surface spectra simulations was used to calculate average spectral radiance for each band center of interest, at 10, 30, and 50 nm bandwidths. Results were used to assess differences between at-sensor spectral radiance (including full atmospheric impacts) to surface reflectance spectra for the band of interest. This combined atmospheric assessment allowed us to determine which bandwidths and band centers were most robust to atmospheric interference, enabling us to identify band-specific recommended bandwidths that were subsequently applied to NPV prediction analysis, described below.

2.4. Assessment of Signal to Noise Ratio

A signal-to-noise ratio (SNR) uncertainty analysis was conducted to assess the degree to which the proposed bands and NPV indices (computed from the boxcar dataset) exhibited performance variability resulting from reflectance errors attributed to Landsat Next expected SNR, employing a relative percent difference metric to make the comparisons. The SNR uncertainty analysis combined WV3 radiance imagery (at SWIR bands similar to considered Landsat Next bands) with a National Aeronautics and Space Administration, Goddard Space Flight Center (NASA-GSFC) simulation of expected Landsat Next sensor radiometric properties including band centers, bandwidths, band saturation levels, SNR values, and noise equivalent delta Rho (NEDρ) based on typical upwelling radiance specifications [44]. The GSFC radiometric simulation assessed 2040, 2100, and 2210 nm Landsat Next bands considering a minimum SNR > 50 requirement, yielding minimum radiances of 2.0, 1.8, and 1.5 W/m2/sr/µm for each respective band required to achieve SNR > 50. Note that the radiometric simulation was not dependent on bandwidth. To compare radiometric simulations to satellite observed radiance values, four WV3 SWIR radiance images were acquired during the spring tillage season (April-May) for each year from 2015, 2016, 2017, and 2019, over the Eastern Shore of Maryland. These four WV3 images (15MAY14160710-A2AS-054596091020_01_P001,16APR19160508-A2AS-500660052010_01_P002,17APR27161145-A1BS-501298014010_01_P001, 19APR30161924-A1BS-503109756010_01_P005) were downloaded from the Earth Explorer (https://earthexplorer.usgs.gov, accessed on 16 December 2020) with a NextView License and then were converted to radiance by applying metadata calibration coefficients. The resulting images represent average radiance observations that could be expected in the mid-latitude springtime when assessment of ground NPV provides an indication of combined agricultural tillage and planting practices for many regions of the United States. Observed 2015–2019 WV3 radiance pixels (n = 716) for a given spectral band were extracted from ground sampling points identifying crop residue cover in agricultural fields. These radiance pixels were then compared to radiometric simulations of associated SNR values, simulated reflectance (ρ) values (simulated downwelling radiance/simulated upwelling radiance), and simulated noise equivalent delta ρ (NEDρ) (simulated ρ/simulated SNR). NEDρ values were calculated for a solar zenith angle of 45°. The median radiance value of each WV3 band was referenced to NASA-GSFC simulated Landsat Next band radiometric properties for the subset of three bands with provided simulation output (2040, 2100, and 2210 nm). The median radiance value for the WV3 2165 nm band (7 W/m2/sr/µm) was matched with 2040 and 2100 nm Landsat Next band radiances, corresponding to NEDρ values of 0.002623 and 0.002713, respectively. The median radiance value for the WV3 2205 nm band (6 W/m2/sr/µm), the WV3 2260 nm band (5 W/m2/sr/µm), and the WV3 2330 nm band (4 W/m2/sr/µm) were all matched with the longest wavelength band radiances (2210 nm), corresponding to NEDρ values of 0.002587, 0.002401, and 0.002199, respectively. The NEDρ values were treated as +/− errors in the derivation of reflectance spectral bands computed from the boxcar spectra. The +/− band errors were propagated in generating the NPV indices with +/− error terms attributed to SNR uncertainty. While no WV3 and Landsat Next bands matched exactly, these WV3-Landsat Next band matches are expected to provide adequate assessment of radiometric performance. It is critical to note that while these NEDρ values increase when radiance increases, the relative impact of the NEDρ decreases, as is expressed in the increasing SNR values. For instance, take the 2210 nm Landsat Next band with radiance values of 4, 5, and 6 W/m2/sr/µm that corresponded to SNR values of 96.2, 110.1, and 122.6, respectively. For the 2040 nm and 2100 nm bands with the same radiance value of 7 W/m2/sr/µm, these bands had respective SNR values of 109.4 and 117.7, reflecting differences in band radiometric properties.

2.5. Accuracy of NPV Measurement

Assessment of index performance was performed by using regression analysis to determine goodness of fit (R2) and root mean square error (RMSE) between calculated NPV indices and in situ measurements of % NPV cover. The indices were calculated using a variety of bandwidth combinations [44] including 10, 20, 30, 40, and 50 nm bandwidths for the boxcar dataset and 10, 30, and 50 nm bandwidths for the gaussian datasets (with (atm) and without (original) residual artifacts of atmospheric correction and sensor noise). The performance assessment first considered the ability of various NPV indices to measure fractional NPV cover under non-vegetated conditions (NDVI < 0.3, n = 650), then under the full observed range of green vegetation cover (NDVI < 1.0; n = 916). Results were first calculated for the complete dataset and were subsequently recalculated after randomly dividing the data into 2/3 calibration samples (n = 613) and 1/3 validation samples (n = 303), with R2 and RMSE reported for each [44]. While this manuscript focuses on measurement of crop residue in the agricultural setting, for completeness we also assessed index performance using 594 spectra collected from grasslands and pastures that were gleaned from Dennison et al. [19], applying similar methods and reporting the results in the data release accompanying this manuscript [44].

2.6. Effects of Background Soil Spectra

Two additional spectral datasets pertaining to soils and crop residues were used to assess background soil impacts on index measurement of NPV cover. A soil spectra dataset described in Brown et al. [49] containing 854 spectra collected from dried, ground soils in a laboratory setting was used to represent a broad range of soil types and parent materials. These soil spectra were mathematically combined with crop residue spectra collected from 6-month-old corn, soybean, and wheat residues (n = 69) published in Serbin et al. [14] using linear spectral mixing, to create NPV-soil spectral mixes at 0%, 15%, 30%, 60%, and 100% NPV cover for each unique soil and residue combination. The resulting spectra were used to calculate average reflectance in the five proposed SWIR bands, along with associated residue indices, at respective bandwidths of 20, 20, 40, 40, and 50 nm for the 2040, 2100, 2210, 2260, and 2330 nm band centers. Index values were calculated for each linear soil and residue composite spectra, and regression of resulting index values with calculated fractional NPV cover was performed to determine linearity of response (as indicated by R-values) and consistency of regression slope, with linearity indicating minimal effect of soil absorption features. This analysis was performed for each unique combination of 854 soil spectra and 69 residue spectra.

2.7. Assessment of Mission Continuity

Finally, we performed a mission continuity assessment to determine which combination of proposed Landsat Next bands provide the greatest degree of continuity with previous Landsat missions. The continuity assessment used a linear regression-based comparison of mean reflectance for various Landsat Next band combinations (convolutions of two to three select Landsat Next bands) with the mean reflectance associated with the bandwidth specifications of Landsat 8 OLI Band 7 (2200 nm band center, 180 nm bandwidth). These calculations were made using the gaussian original and atm datasets to assess whether they differed in terms of statistical agreement between OLI Band 7 and the band combinations under consideration for Landsat Next.
Throughout the analysis, relative percent difference (RPD) calculations are used to provide a relative assessment of the importance of spectral bandwidths, radiometric uncertainties, and atmospheric impacts. Datasets with errors added (atmospheric impacts and SNR-related errors) are treated as the ‘observed’ term, while untransformed surface reflectance are treated as the ‘reference’.
RPD = ( ( o b s e r v e d r e f e r e n c e ) / ( r e f e r e n c e ) )     100

3. Results and Discussion

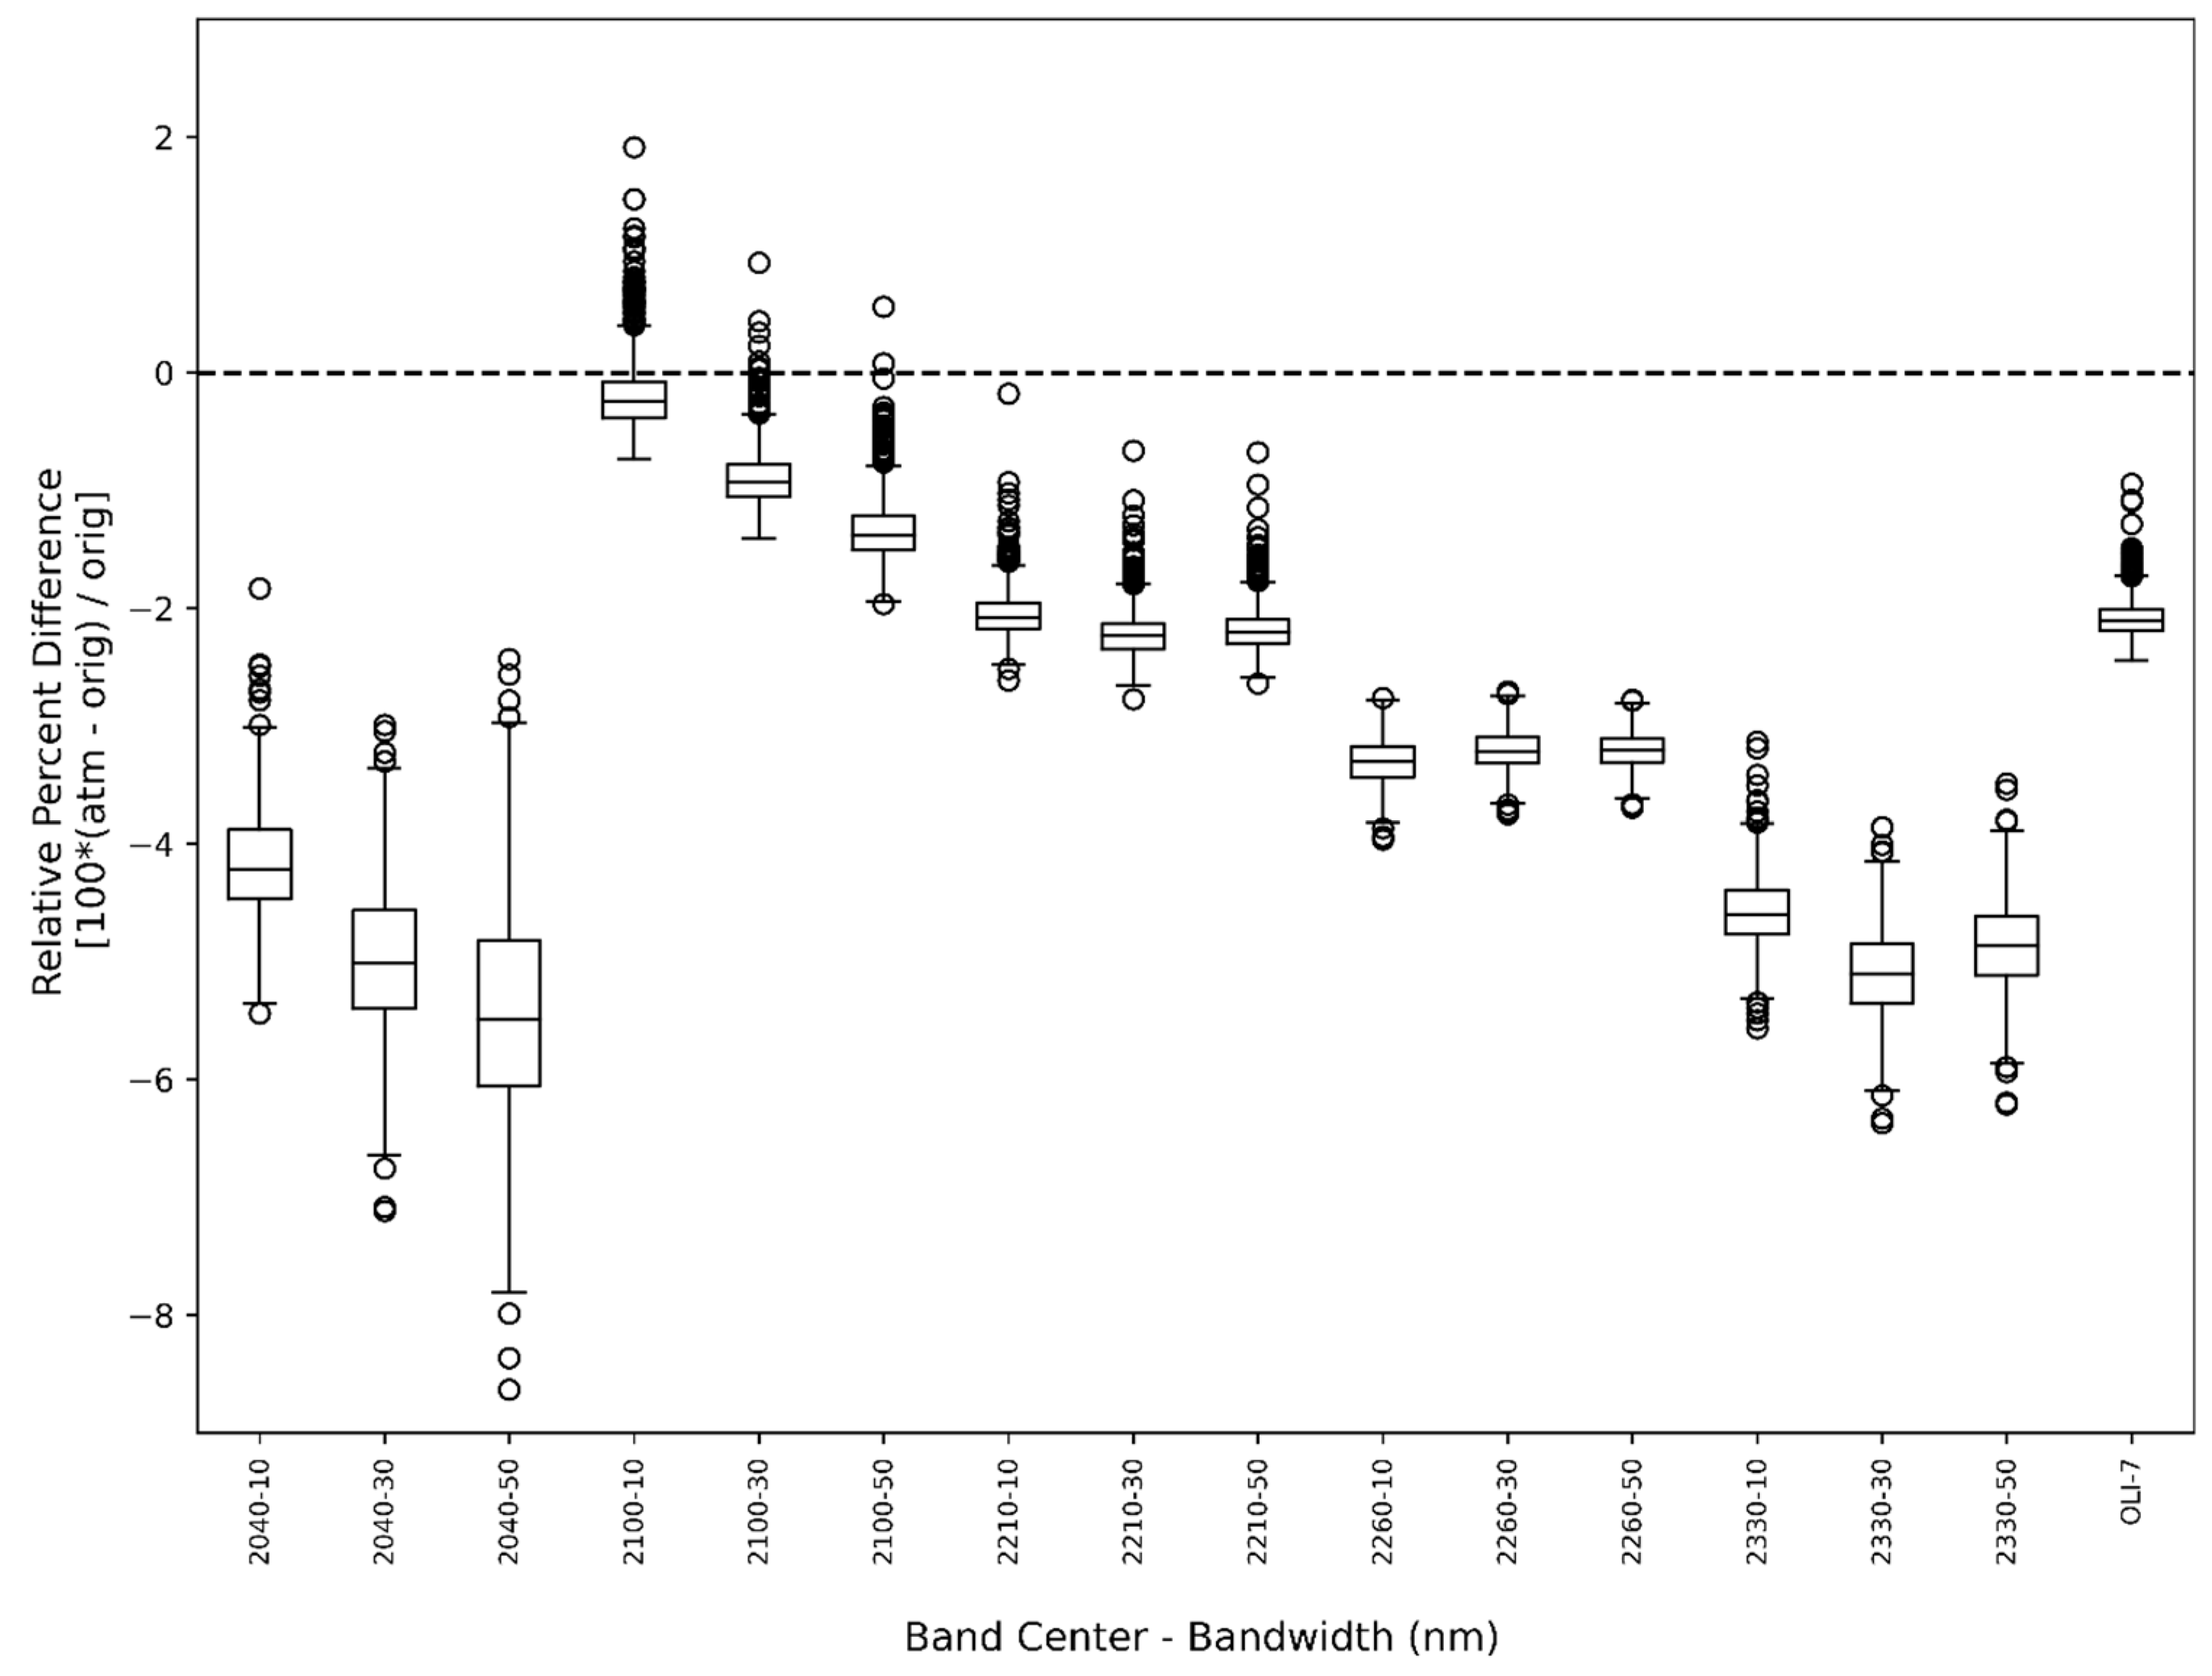
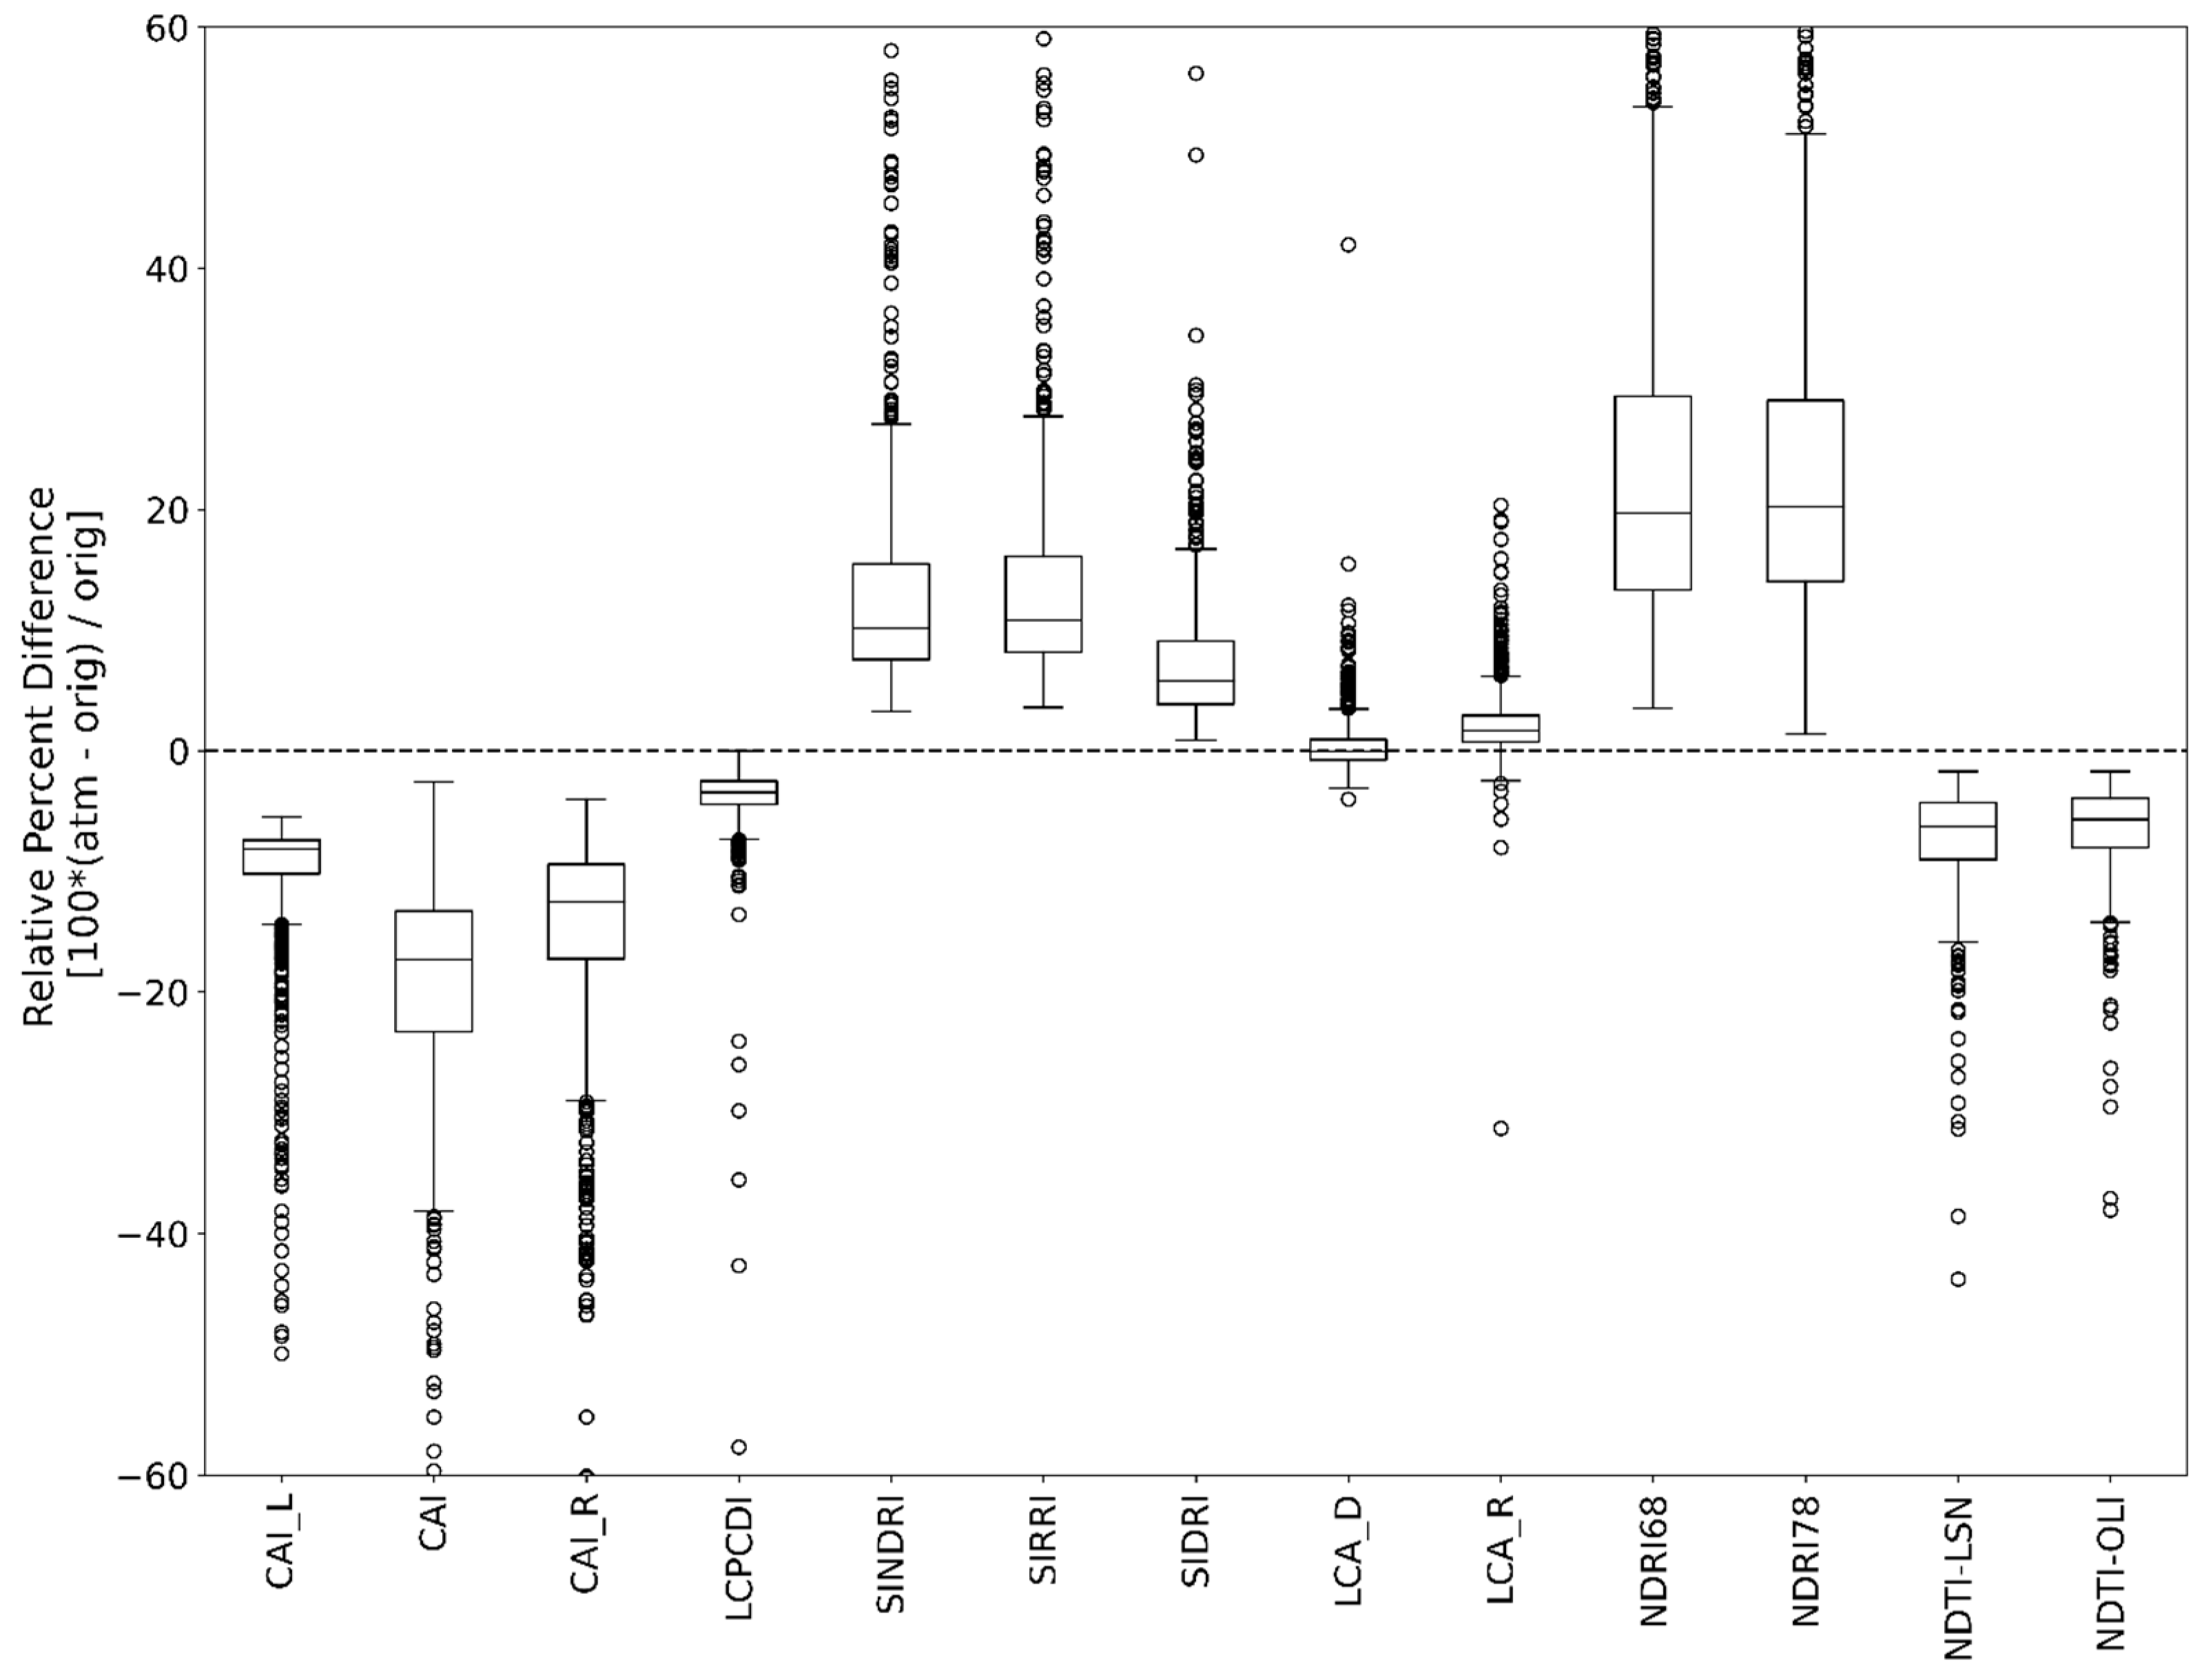
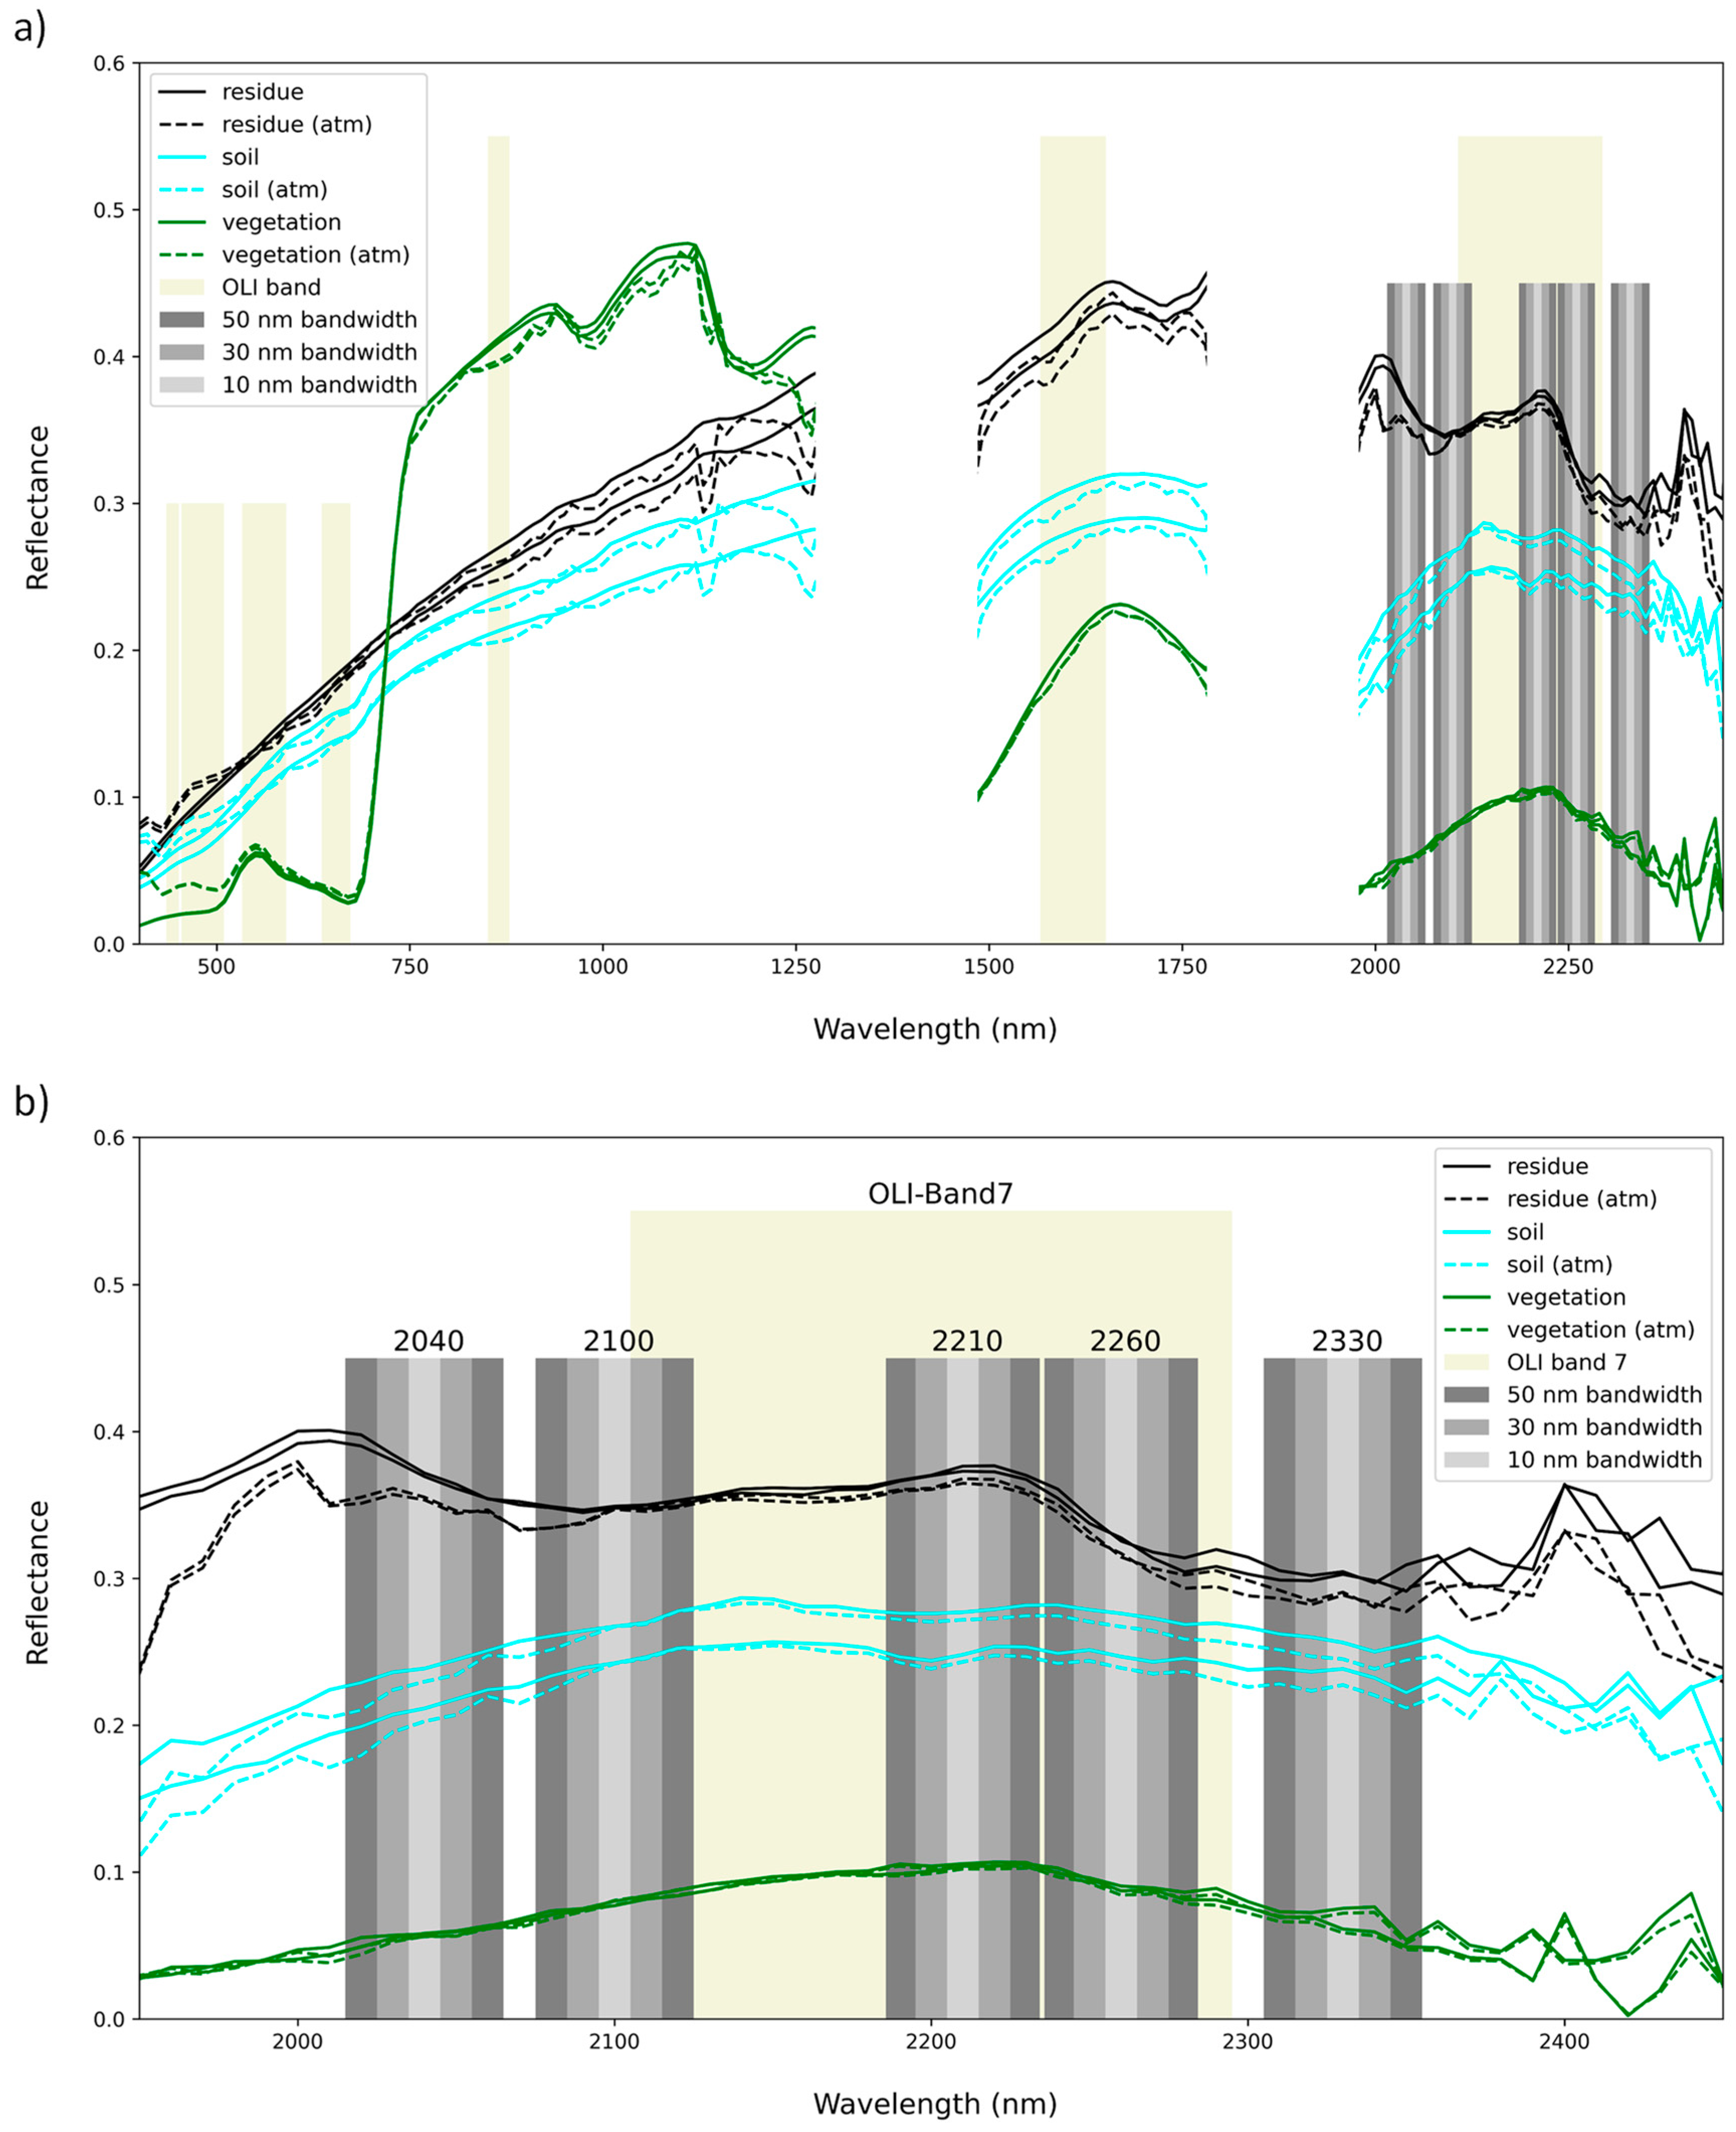
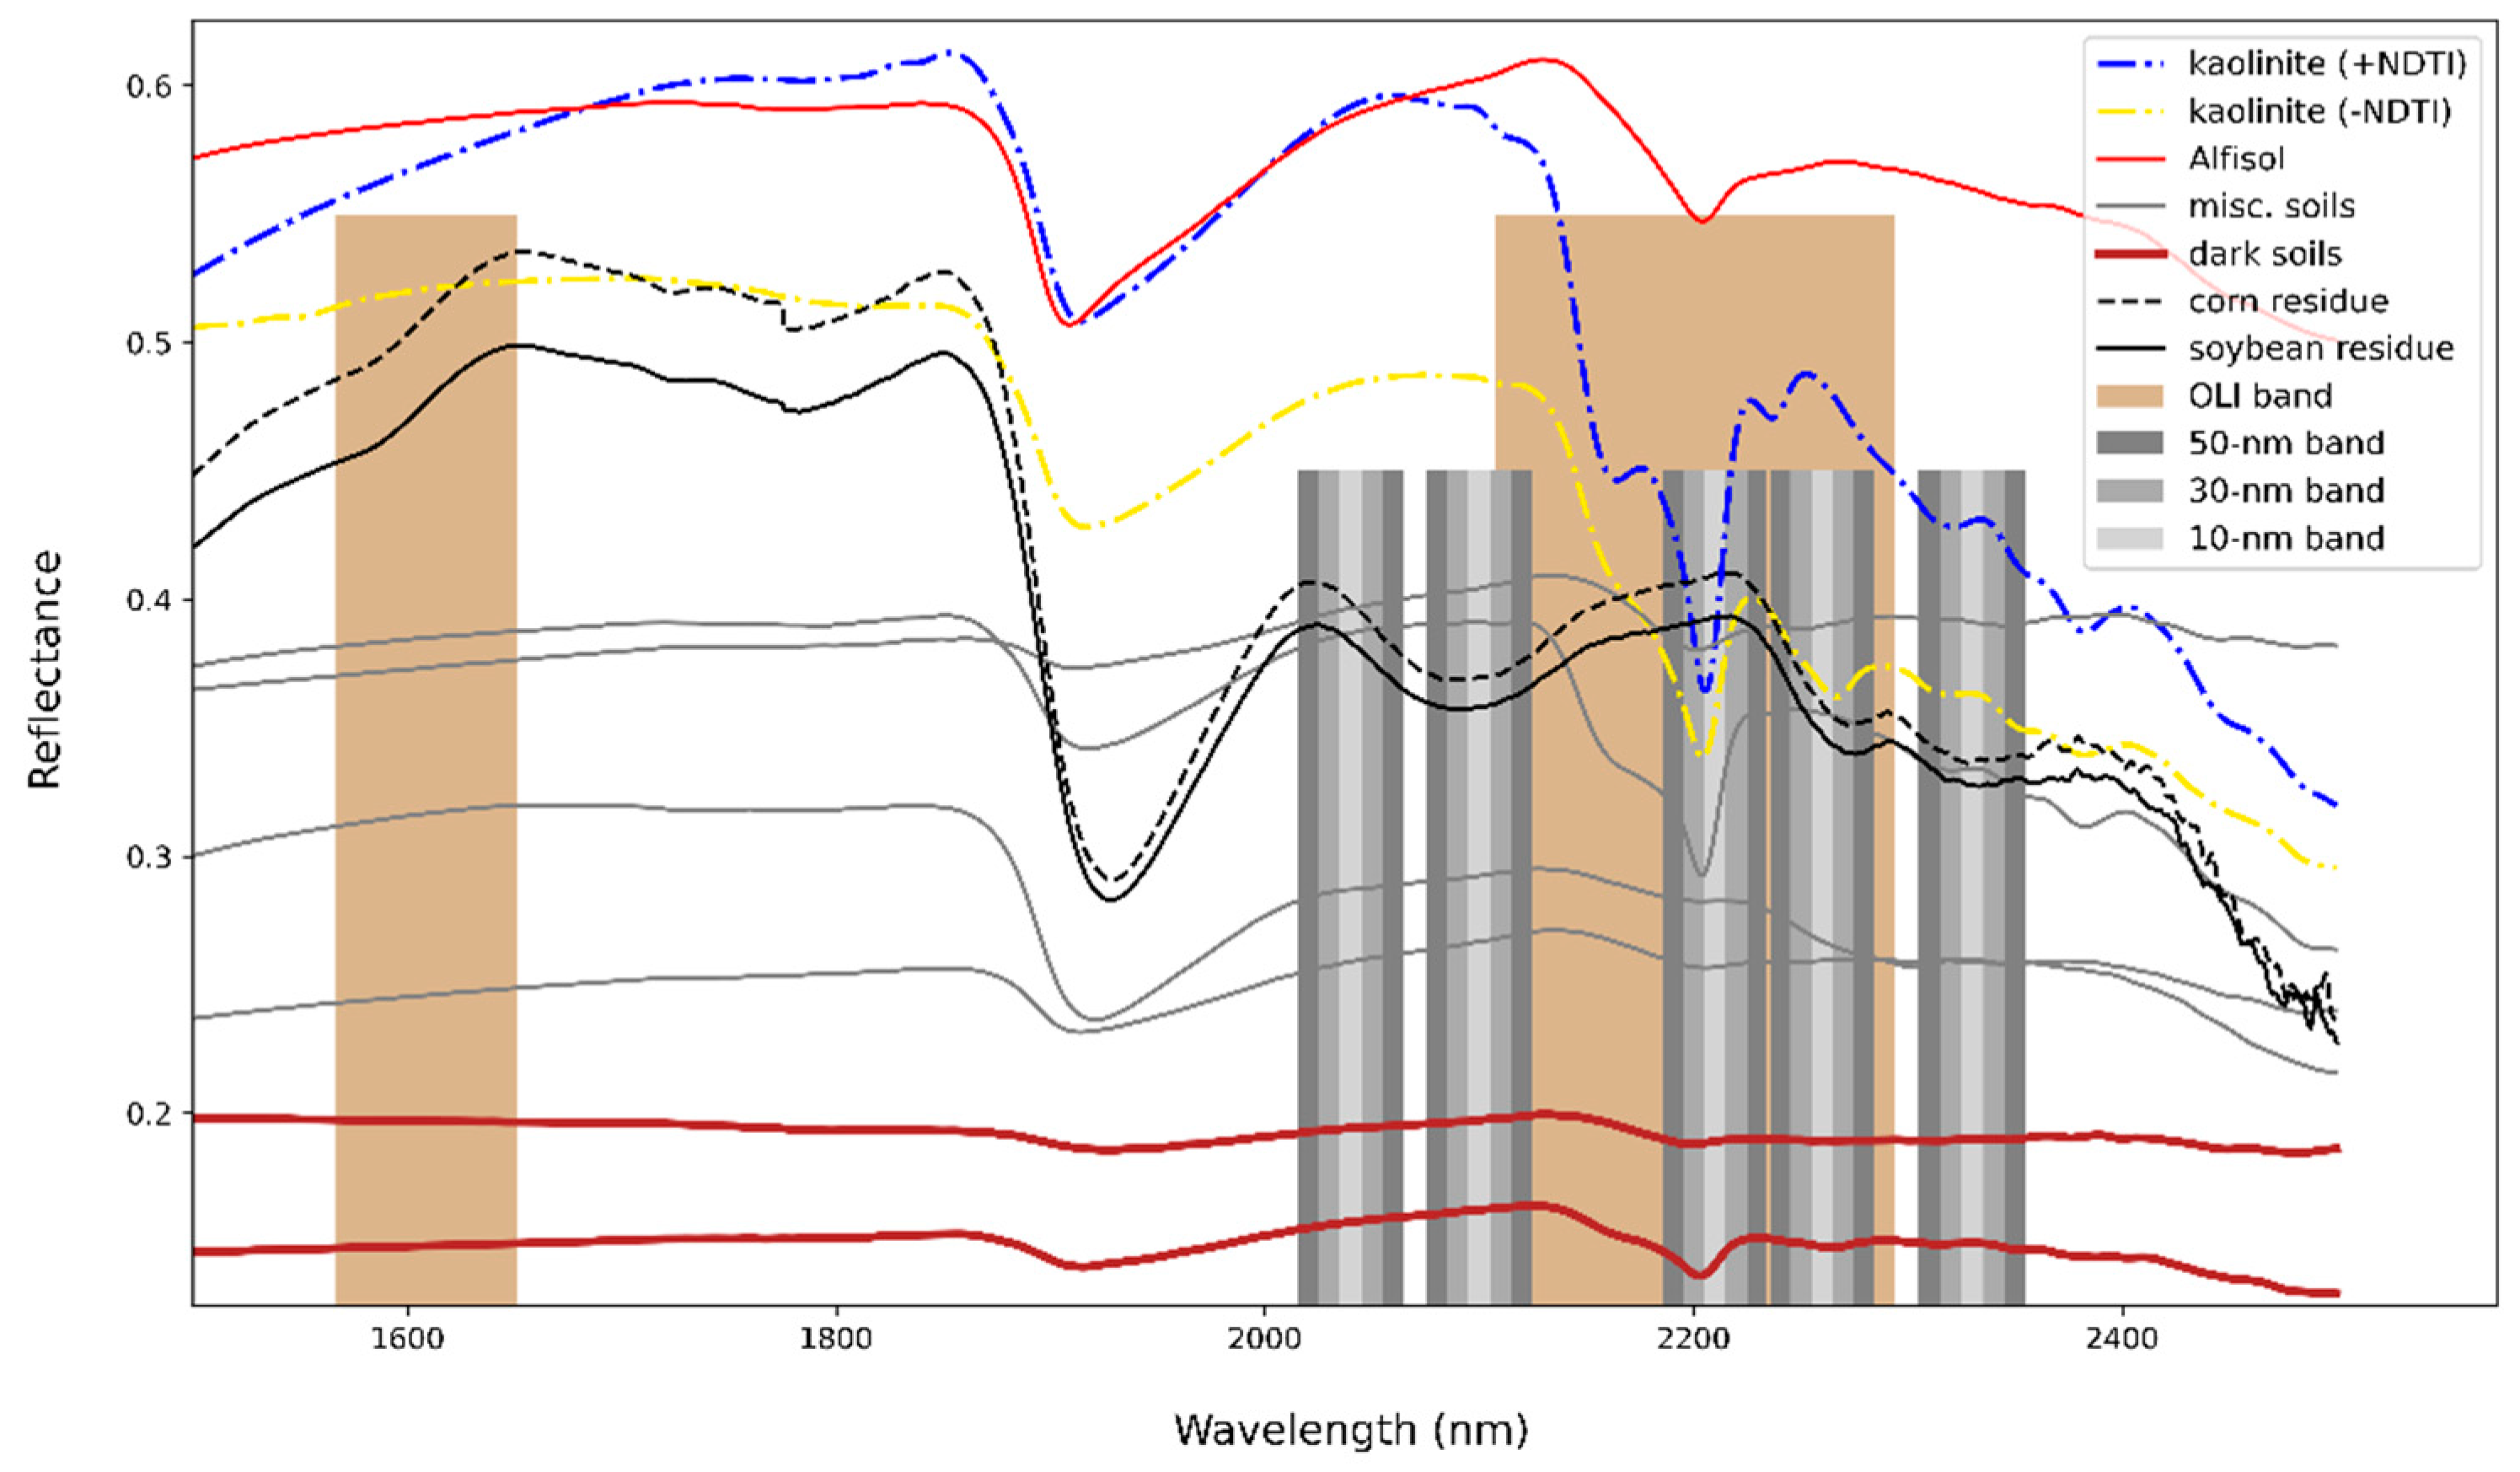
3.1. Effects of Atmosphere and Bandwidth on SWIR Band Reflectance

Band resilience to residual atmospheric effects and sensor noise was evaluated by calculating the RPD between gaussian surface reflectance spectra (original) and gaussian atmospherically impacted spectra (atm) for each SWIR band at varying bandwidths of 10, 30, and 50 nm, with results shown in Figure 3. Overall, the order of band sensitivity to combined sensor noise and atmospheric artifacts was: 2100 < 2210 < 2260 < 2040 < 2330 nm, with mean RPD values ranging from ~0.2% to ~5.6%. Bands in the middle portion of the continuum, which is less impacted by water vapor or carbon dioxide (CO2) absorption, had lower magnitude RPD.
When comparing bandwidths (Figure 3), there was a reduction of ~1.0% RPD attributable to atmospheric residuals for the 2040 nm and 2100 nm bands when using a 10 nm bandwidth relative to 30 nm, and further reductions relative to 50 nm bandwidth; minimal error change relative to bandwidth for the 2210 nm and 2260 nm bands; and an error reduction of ~0.5 and 0.25% in the 2330 nm band when comparing 30 nm bandwidth to the 10 nm and 50 nm bandwidths, respectively. These results are consistent with visual inspection of the example spectra presented in Figure 1, which show increased deviation between original and atm spectra beyond the 20 nm bandwidth for the 2040 nm and 2100 nm bands. The increased deviation for the wider bandwidths at 2040 nm is attributable to increased interference from CO2 absorption features centered near 2010 and 2060 nm.
The fact that RPD calculations for the bands were often negative indicates that reflectance values were lower for the atm spectra than the original spectra. This result is indicative of the atm spectra’s atmospheric correction under-correcting for absorbing atmospheric constituents including water vapor and CH4. This result was unique to the single atmospheric simulation and correction in Dennison et al., (2019) which presumably underestimated these constituents. An atmospheric correction that over-estimated these constituents would have led to a subsequent over-correction and positive RPD values. Both under-correction and over-correction result from inaccuracies estimating absorbing atmospheric constituents, such that higher absolute RPD values should be interpreted as bands that are more sensitive to atmospheric effects, rather than the expected directional bias caused by atmospheric correction. As is importantly demonstrated with the 2040 nm band, the absolute RPD values are larger than the 2100, 2210, and 2260 nm bands. Further, the 2040 nm band absolute RPD becomes notably larger with widening bandwidth as the band becomes more impacted by a CO2 absorption feature at 2010 nm as previously discussed.
The effect of atmospheric residuals on band reflectance (0.2 to ~5.6% mean RPD) were magnified during the calculation of SWIR NPV indices (~1% to ~20% mean RPD; Figure 4). The differences caused by atmospheric impacts on SWIR bands may manifest in negative errors (e.g., CAI) or positive errors (e.g., SINDRI) depending on relative spectral differences of atmospheric effects on different spectral bands. While most NPV indices exhibited relatively modest ranges of errors between +/−0% to 30%, the CAI, NDRI68 and NDRI78 indices showed median RPD well exceeding 15%. NDTI-LSN and NDTI-OLI showed very similar performance despite being computed with different bandwidths.
Similar to the band RPDs which should be interpreted in absolute terms, the sign of NPV index RPDs may also reverse if the atm spectra dataset were generated with an over-correcting atmospheric correction. Due to the fact that NPV indices are computed from spectral differences between bands, spectrally differing atmospheric impacts should manifest in larger differences between certain indices, but it is important to note that the results in Figure 4, like Figure 3, are from a single atmospheric correction and its corresponding assumptions and therefore do not capture temporal or spatial variability in atmospheric constituents.
In general, the application of the ATREM correction to hyperspectral datasets, like the atm spectra analyzed in Figure 3 and Figure 4, is likely to result in more accurate reflectance retrieval than a comparable retrieval from a multispectral dataset; parameterizing a hyperspectral retrieval is simplified by the presence of distinct absorption features captured by high spectral resolution data. For instance, updates to the ATREM correction approach described in Thompson et al. [47] include the use of oxygen A band ratios to calculate pressure altitude look up tables and the use of H2O band ratios to obtain H2O vapor path length [47]. Currently, very few multispectral sensors on land imaging satellites have both capabilities. Thus, it is important to note that while the hyperspectral datasets and ATREM correction approach used in Dennison et al. [43] present useful estimates of spectrally varying errors from sensor noise and atmospheric correction artifacts, the magnitude of errors for Landsat Next could potentially be higher, depending on the uncertainties associated with atmospheric correction.
Figure 3 and Figure 4 provide insight into relative impacts of atmospheric effects for different bands and NPV indices; indices utilizing bands with higher RPD (Figure 3) will experience greater impact of atmospheric residuals than indices utilizing bands with lower RPD. Although Thompson et al. [47] have demonstrated that atmospheric transmittance is quite variable in the 2000–2500 nm SWIR region, evaluation of a range of atmospheric conditions was beyond the scope of this study. The need for spectral specificity to avoid atmospheric absorption features comes at a trade-off, since photon count will decrease as spectral ranges narrow, unless spatial resolution or instrument design are adjusted to compensate.

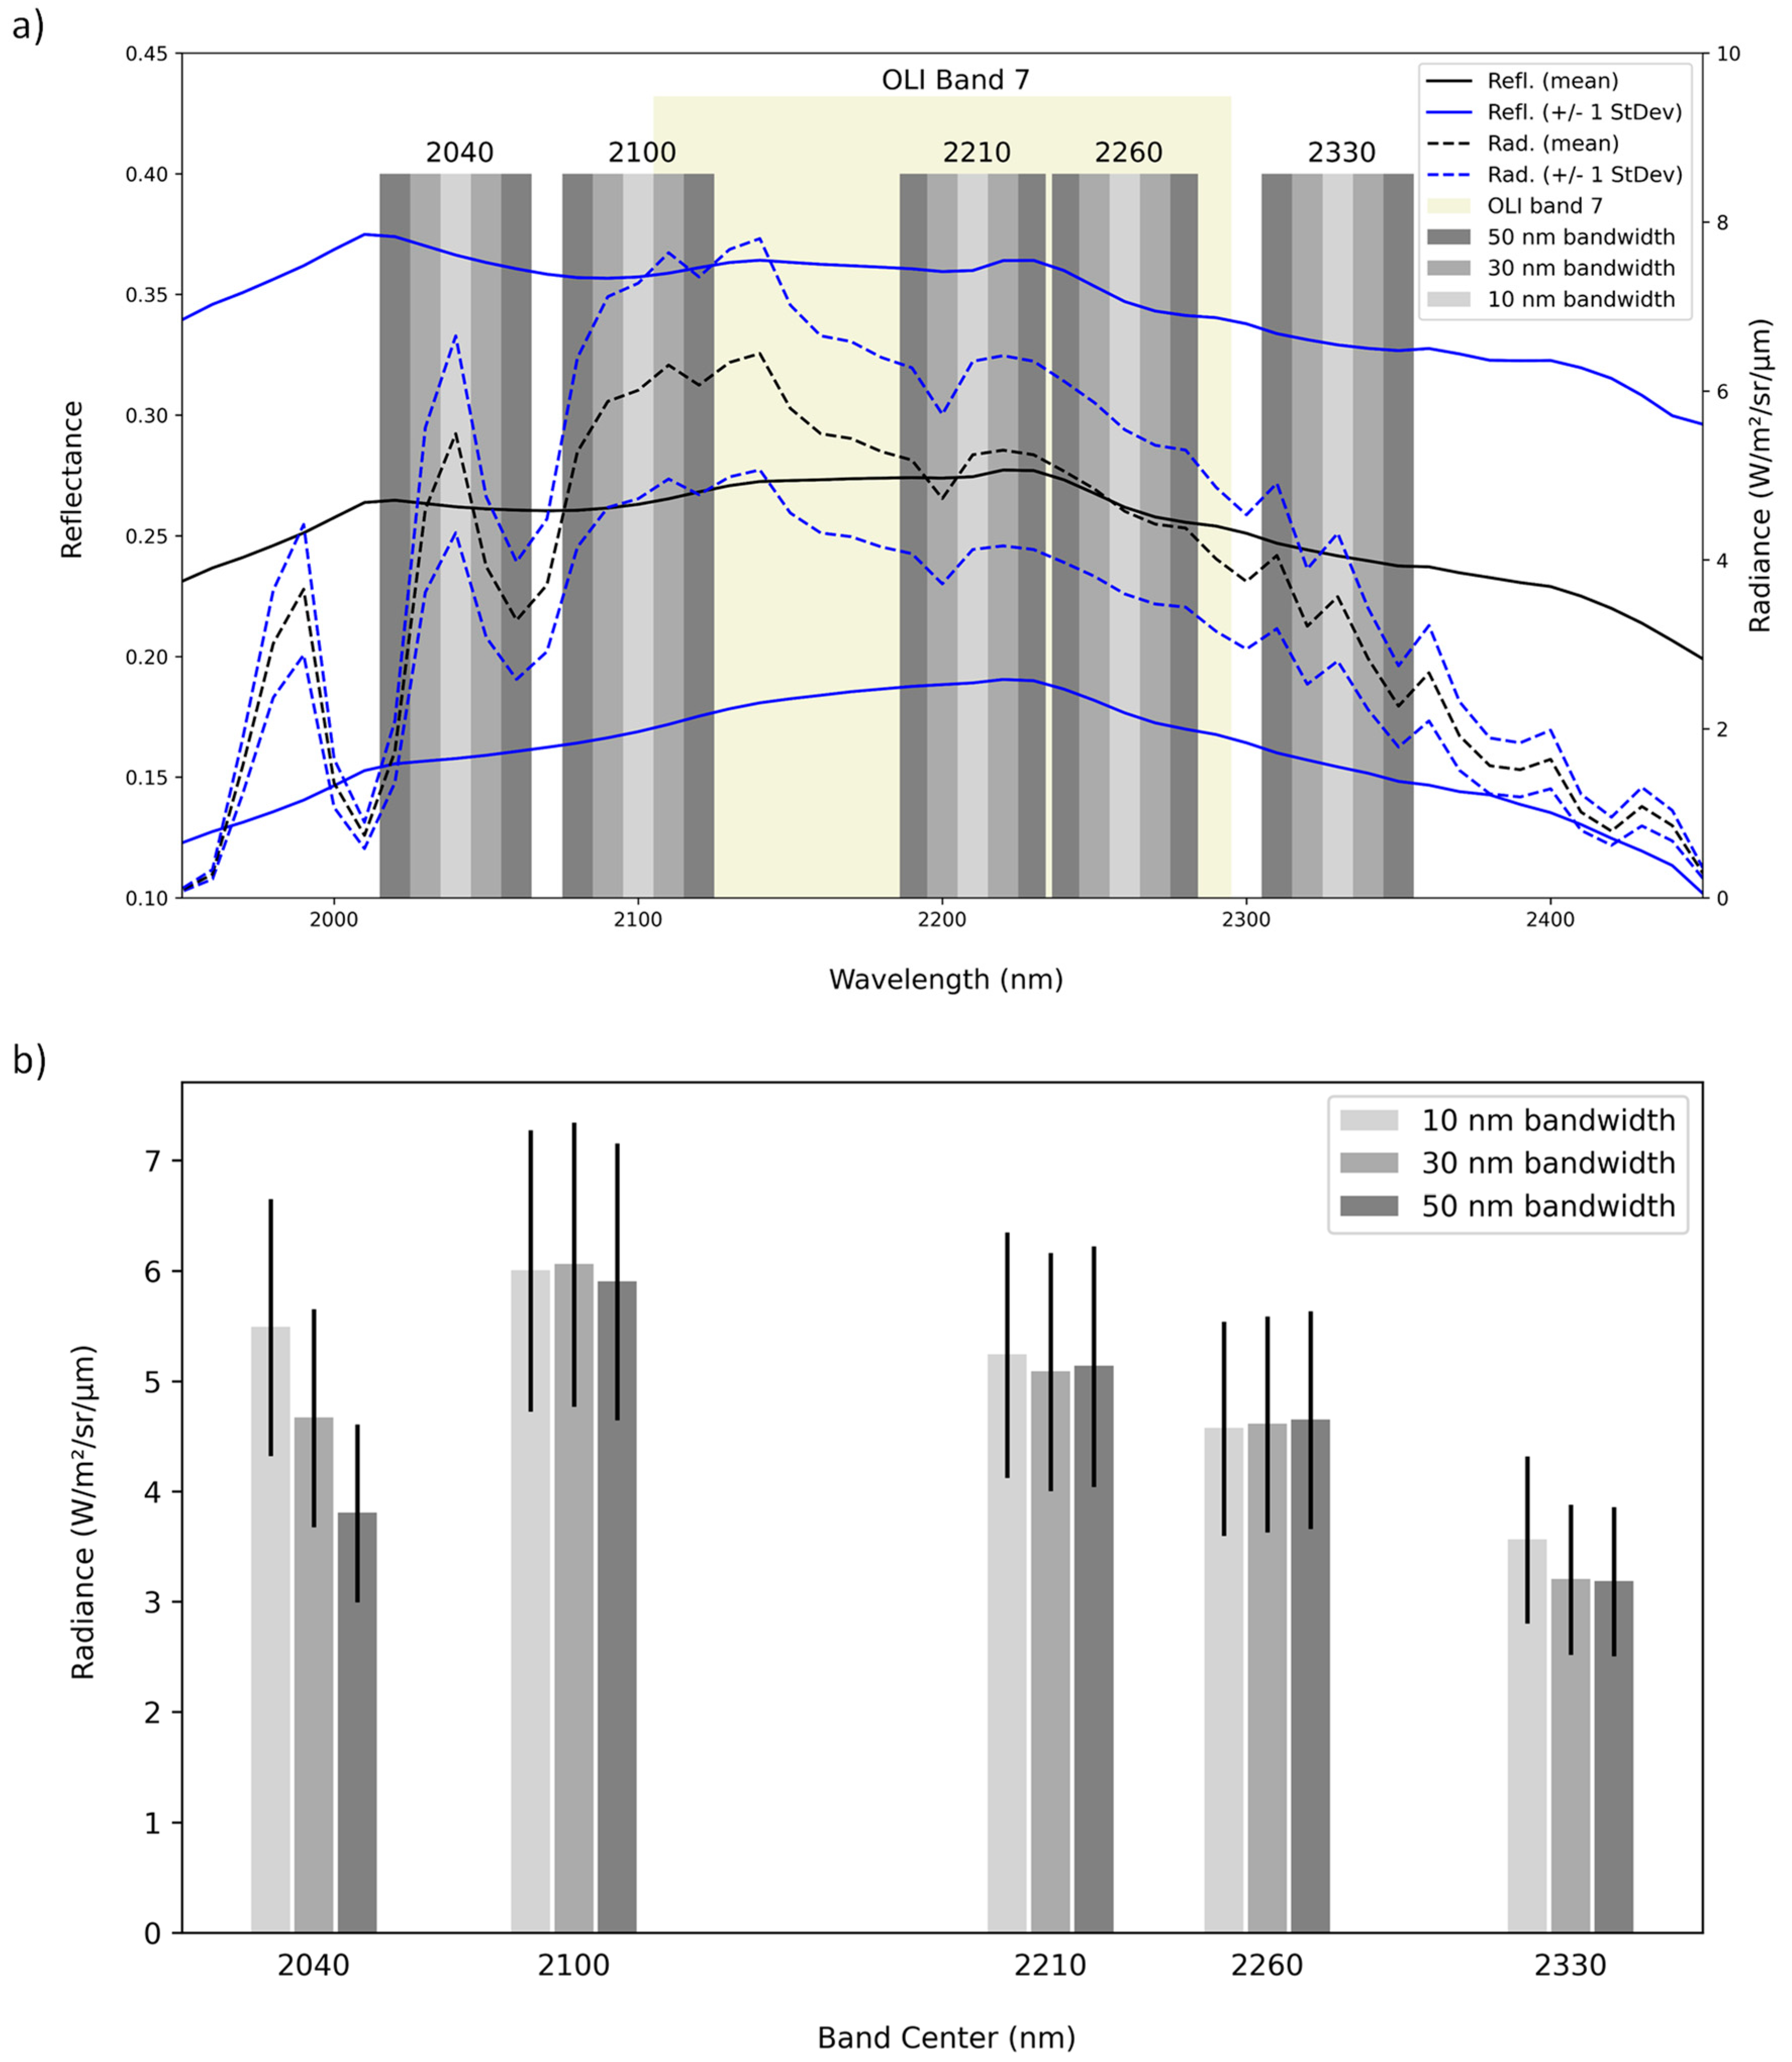
3.2. MODTRAN Assessment of Atmospheric Impacts on Band Radiometric Performance

The MODTRAN simulation of at-sensor radiance provided insight into atmospheric impacts on band radiometric performance as a function of bandwidth. Figure 5a illustrates the mean surface reflectance for 916 agricultural targets (+/−1 standard deviation), along with MODTRAN output at-sensor radiance using the three surface reflectance spectra as MODTRAN inputs. While the mean surface reflectance spectra show the ligno-cellulose absorption features that form the basis for SWIR NPV indices (peaks near 2040 and 2210 relative to absorption at 2100, 2260, and 2330 nm), the radiance spectra demonstrate the effects of atmospheric absorption features associated with CO2 (centered near 2010 and 2060 nm), CH4 (multiple small features between 2200 and 2400 nm), and water vapor (strongest at wavelengths shorter than 2100 nm and longer than 2300 nm in Figure 5a), leading to substantial loss of signal in the impacted portions of the spectrum. Focusing on the bands under consideration for Landsat Next (Figure 5b), the 2040 nm band, located between adjacent CO2 features and within a region with higher water vapor absorption, shows a large decrease in at-sensor spectral radiance as bandwidth increases. The 2330 nm band likewise shows a decrease in spectral radiance for bandwidths greater than 10 nm, while the three bands in the center portion of the continuum, which is less impacted by water vapor, CO2, or CH4 absorption, showed no change in at-sensor spectral radiance relative to bandwidth.
Because atmospheric CO2 trace gas absorption impacts are expected to vary in space and time [47], this clearly presents a performance issue for the 2040 band, which displays CO2 impacts at bandwidths >10 nm. The 2100, 2210, and 2260 nm bands, in contrast, demonstrate stable at-sensor spectral radiance values that remain above 4 W/m2/µm/sr for all considered bandwidths. The 2330 nm band does not exhibit substantial performance differences between the 30 and 50 nm bandwidths but has a general issue of producing lower at-sensor spectral radiance values, making it more prone to exhibit lower errors due to lower signal in this portion of the electromagnetic spectrum. Therefore, maintaining a wide bandwidth for 2330 nm would help to ensure ample SNR.
It should be noted that the conversion from surface reflectance to at-sensor radiance affected the 2210 and 2260 nm bands similarly, implying that the SINDRI, SIRRI, and SIDRI indices calculated from these bands would remain robust (spectral slope from 2210 to 2260 nm is consistent for both surface reflectance and radiance). In contrast, atmospheric impact on the 2040 and 2210 nm bands is larger than the impact on the 2100 nm band, leading to increased sensitivity to atmospheric correction for the CAI index. This implies that a robust, spatially distributed, and effective surface reflectance retrieval would be required to successfully implement the CAI index from a space-borne platform.

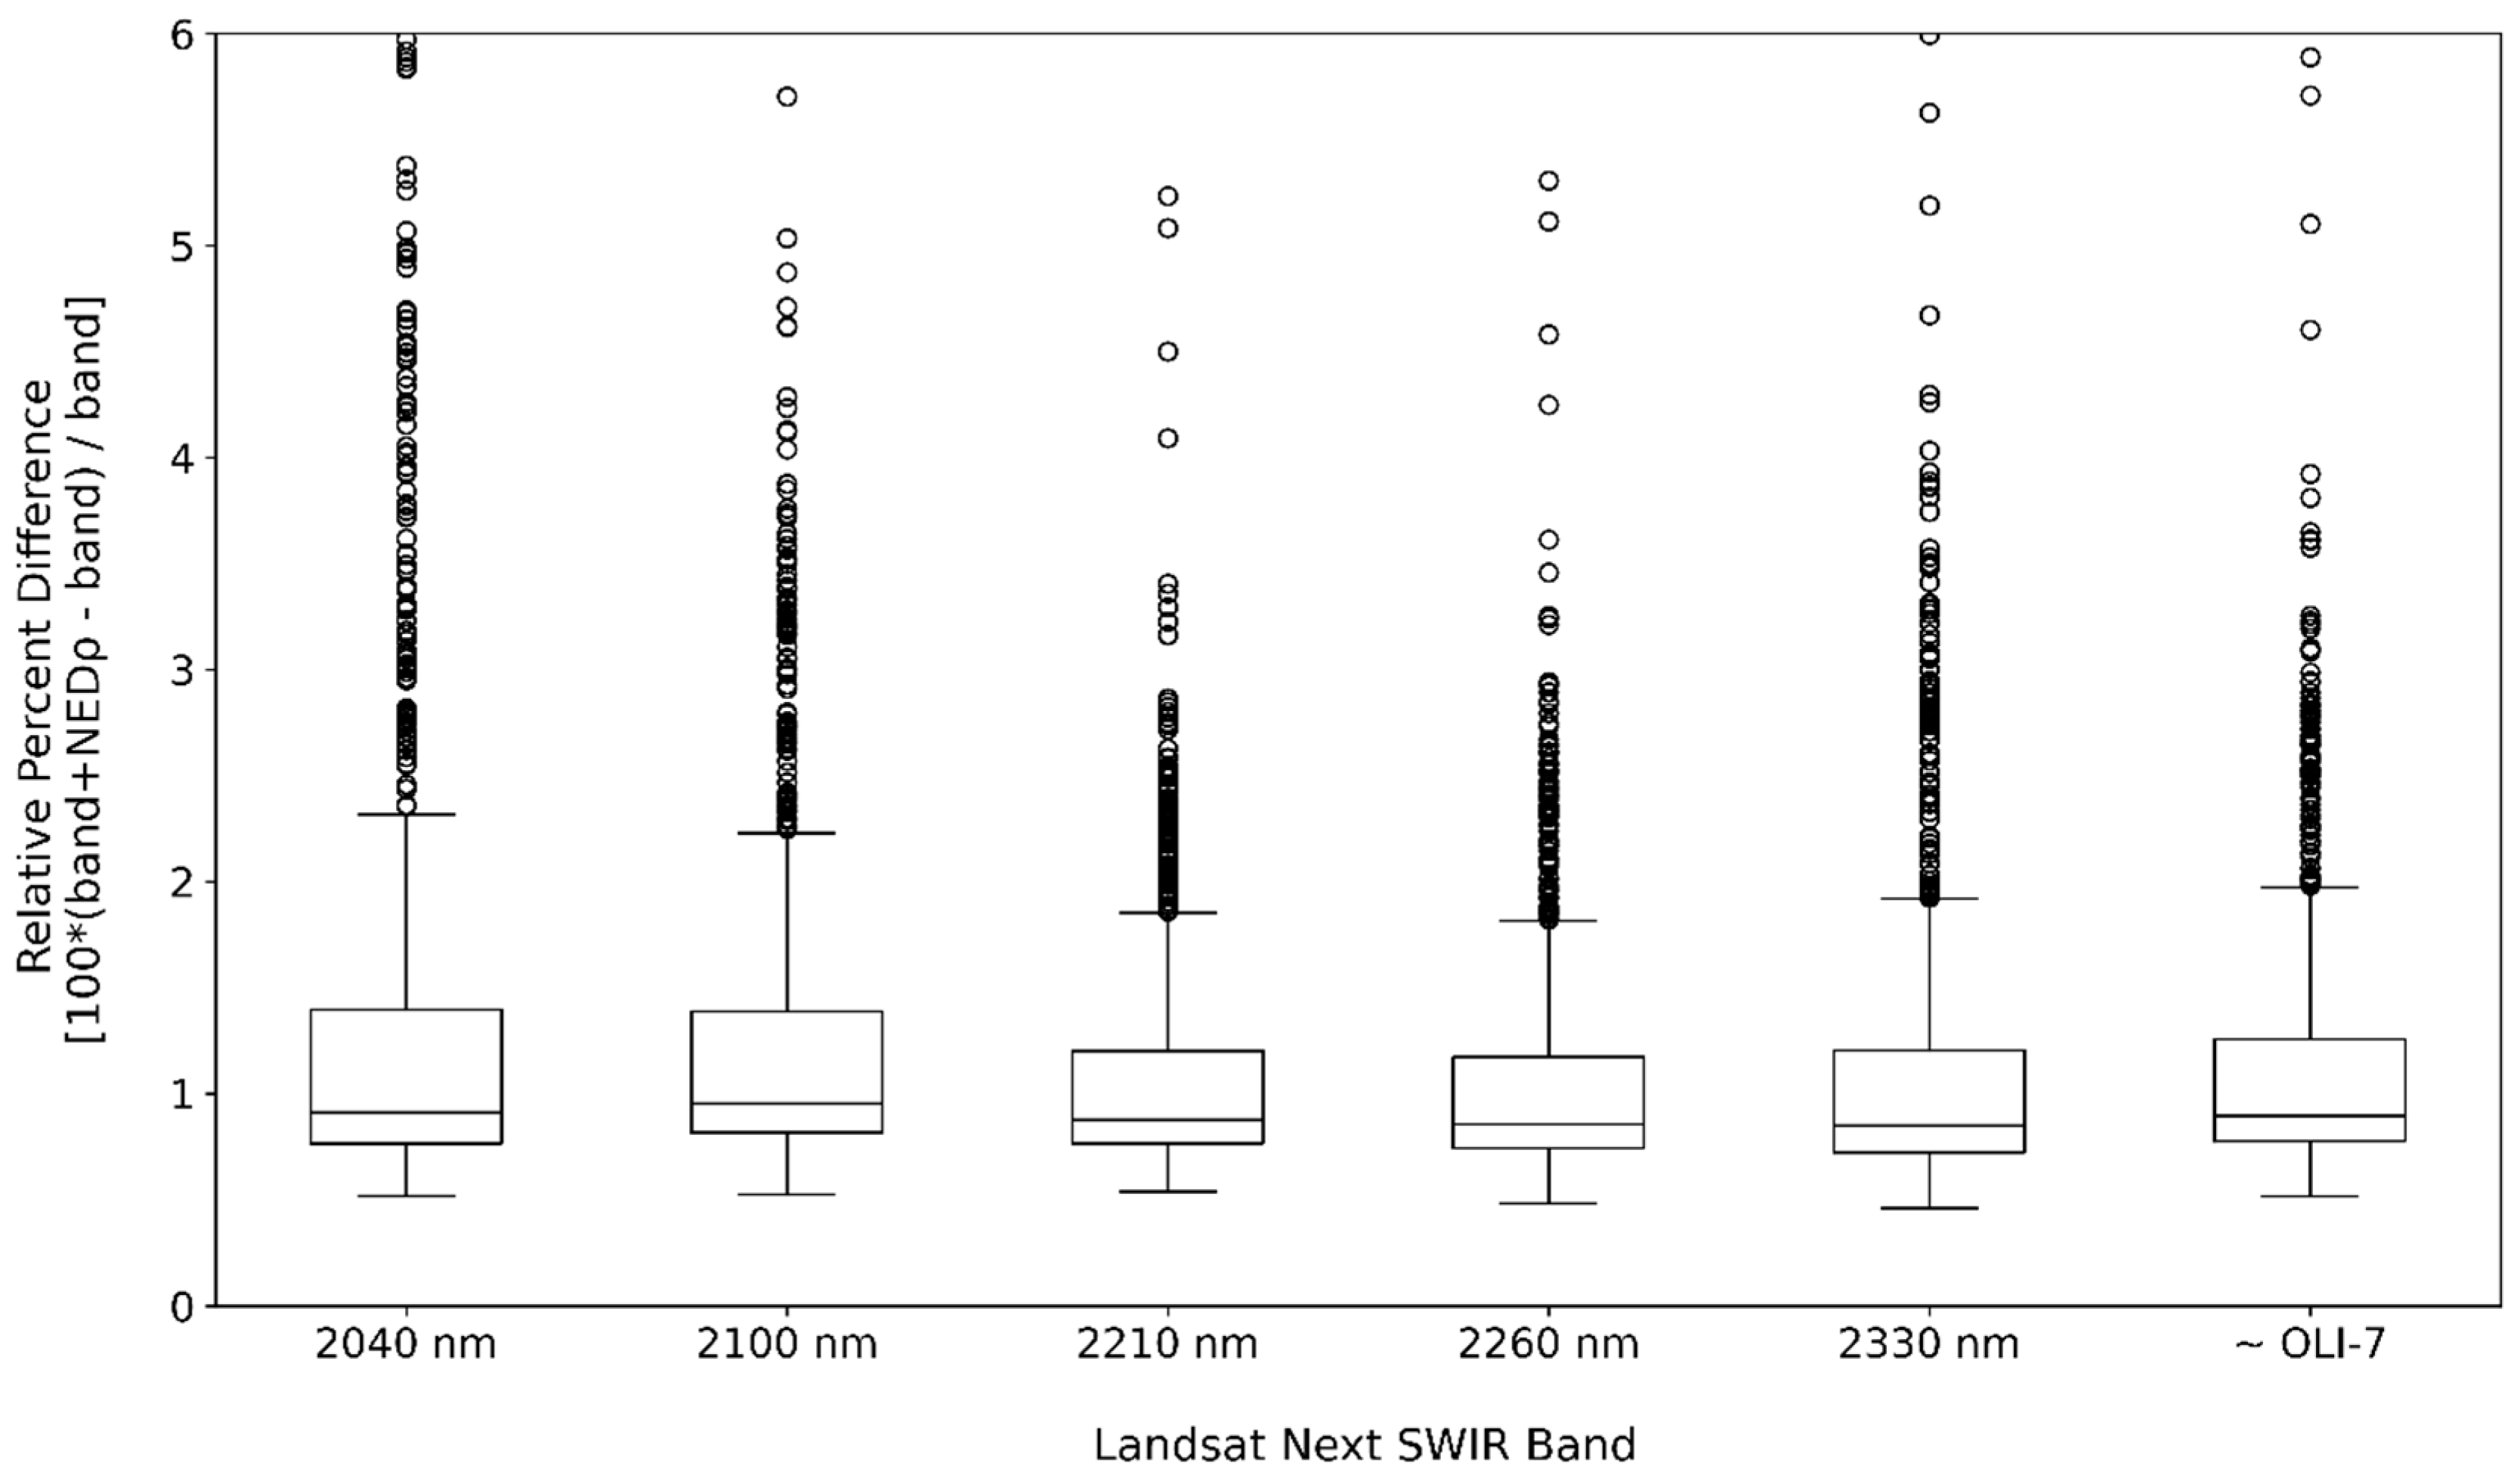
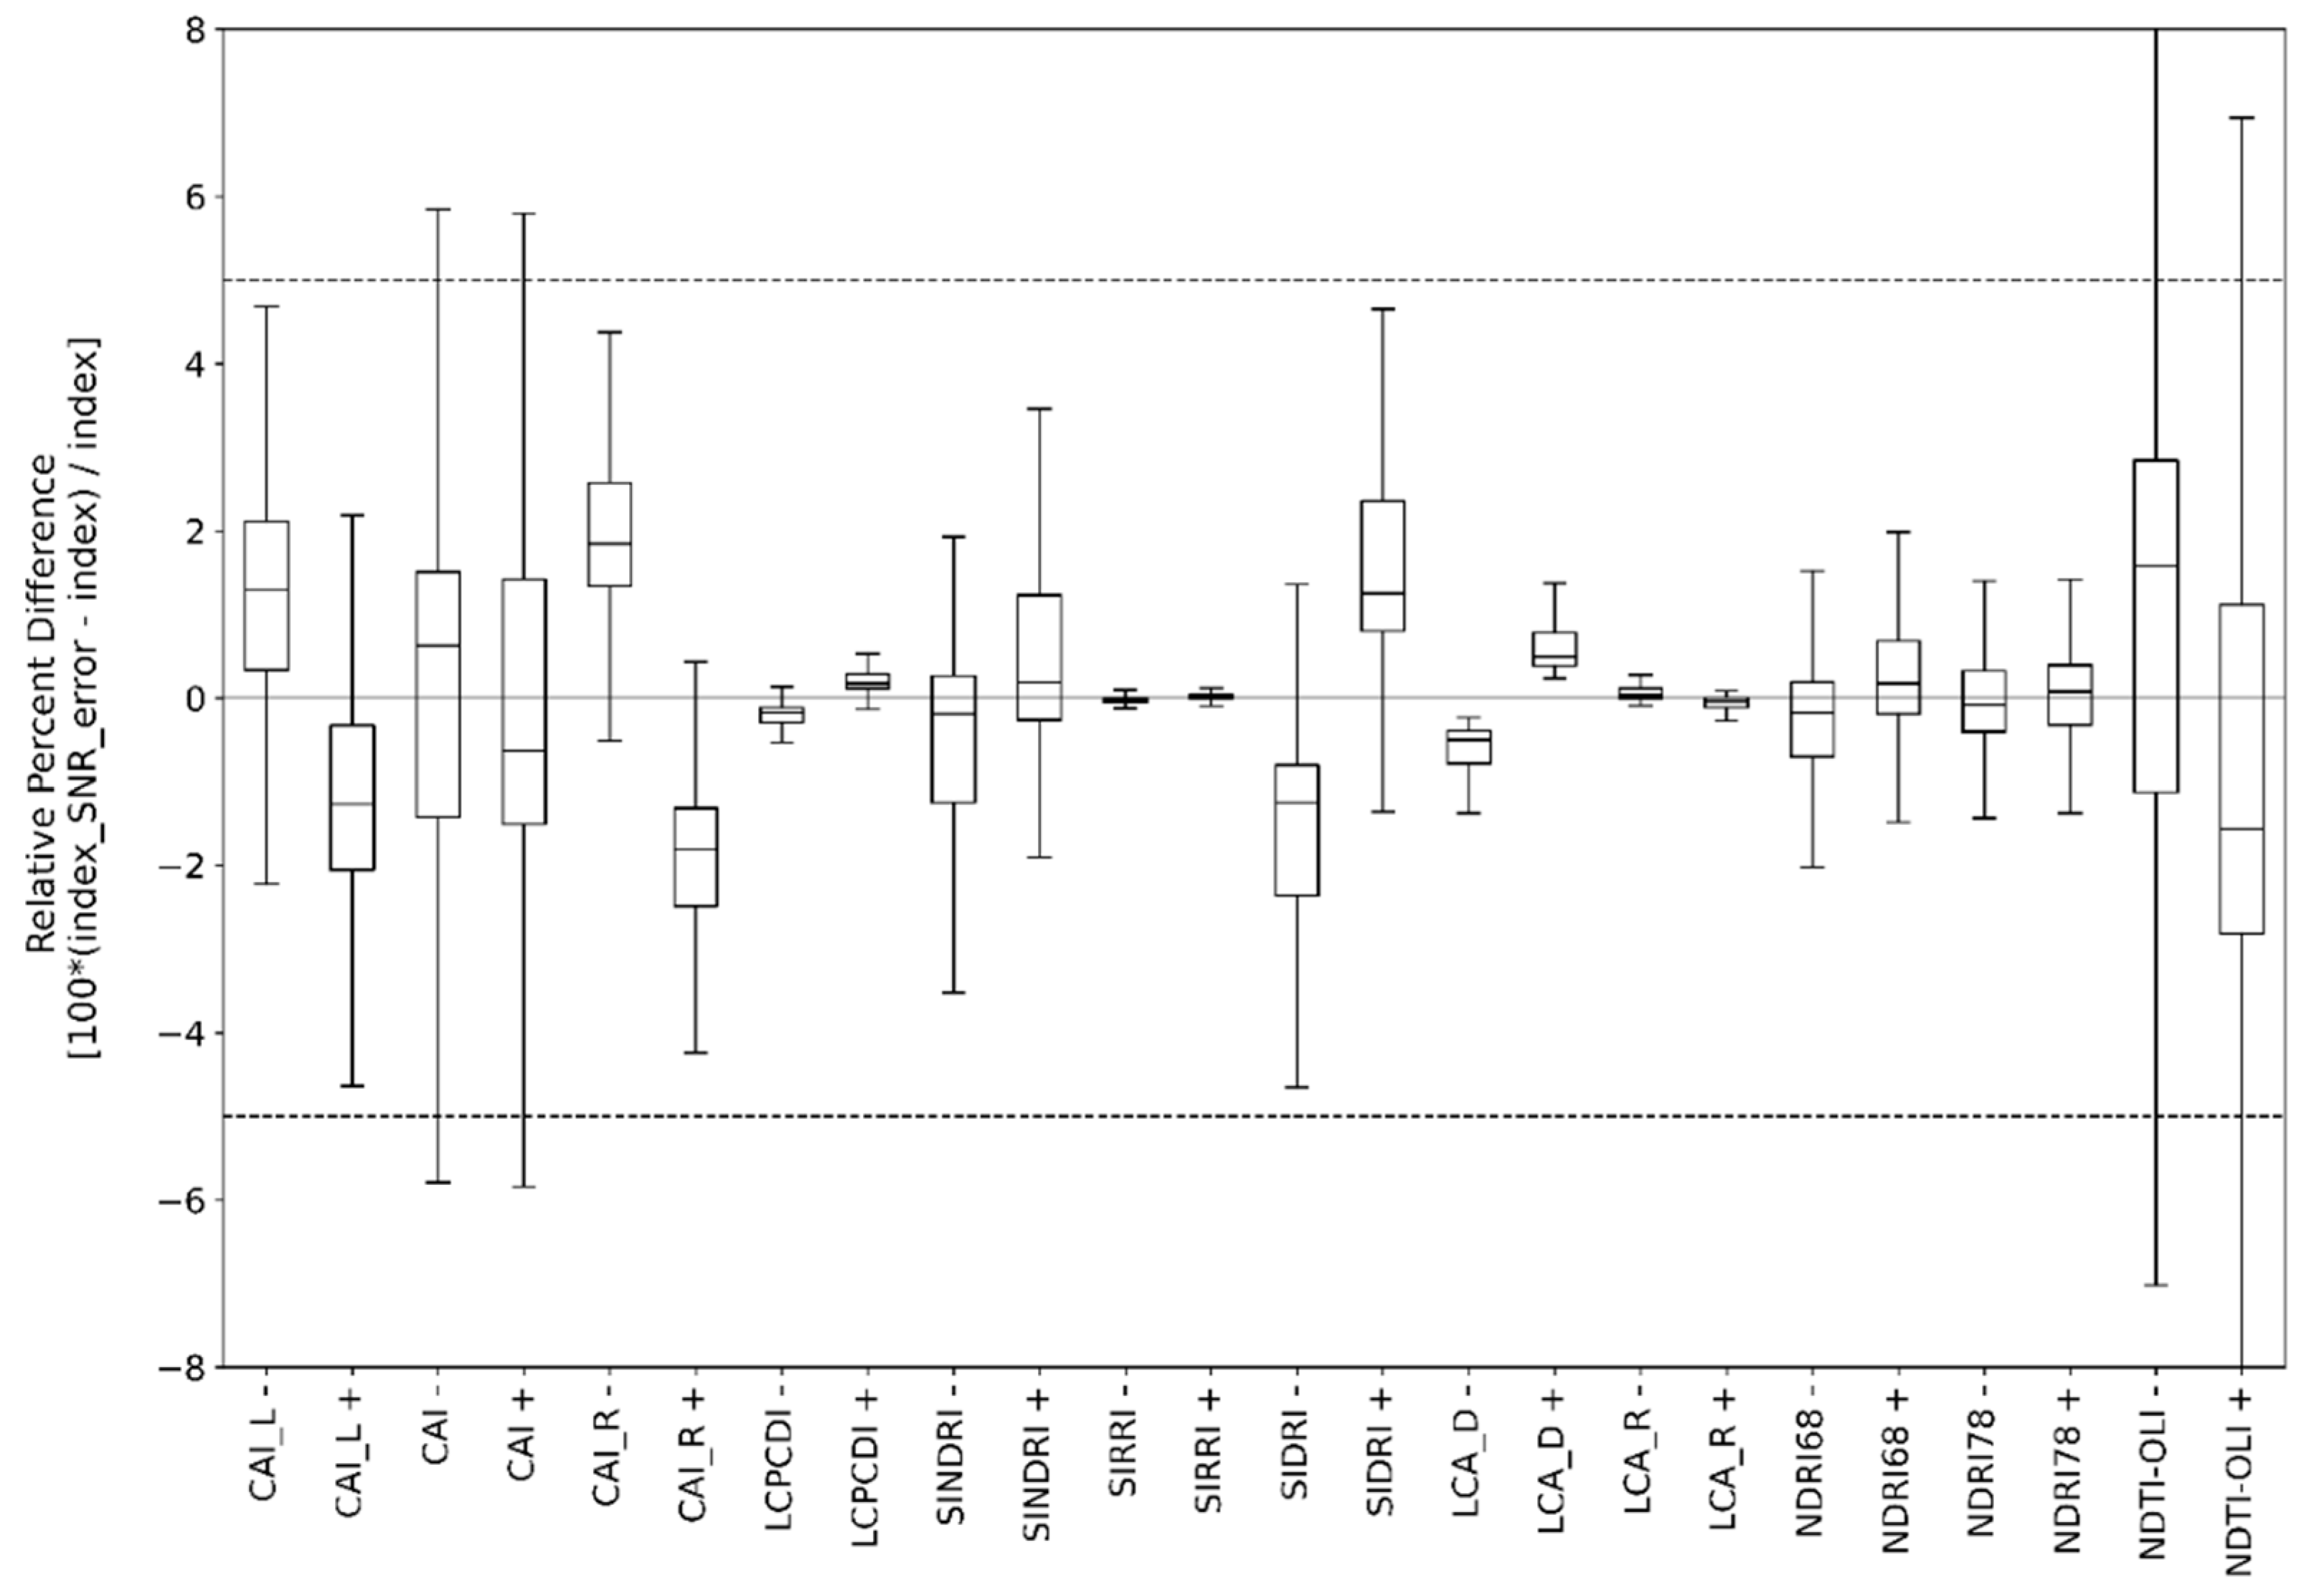
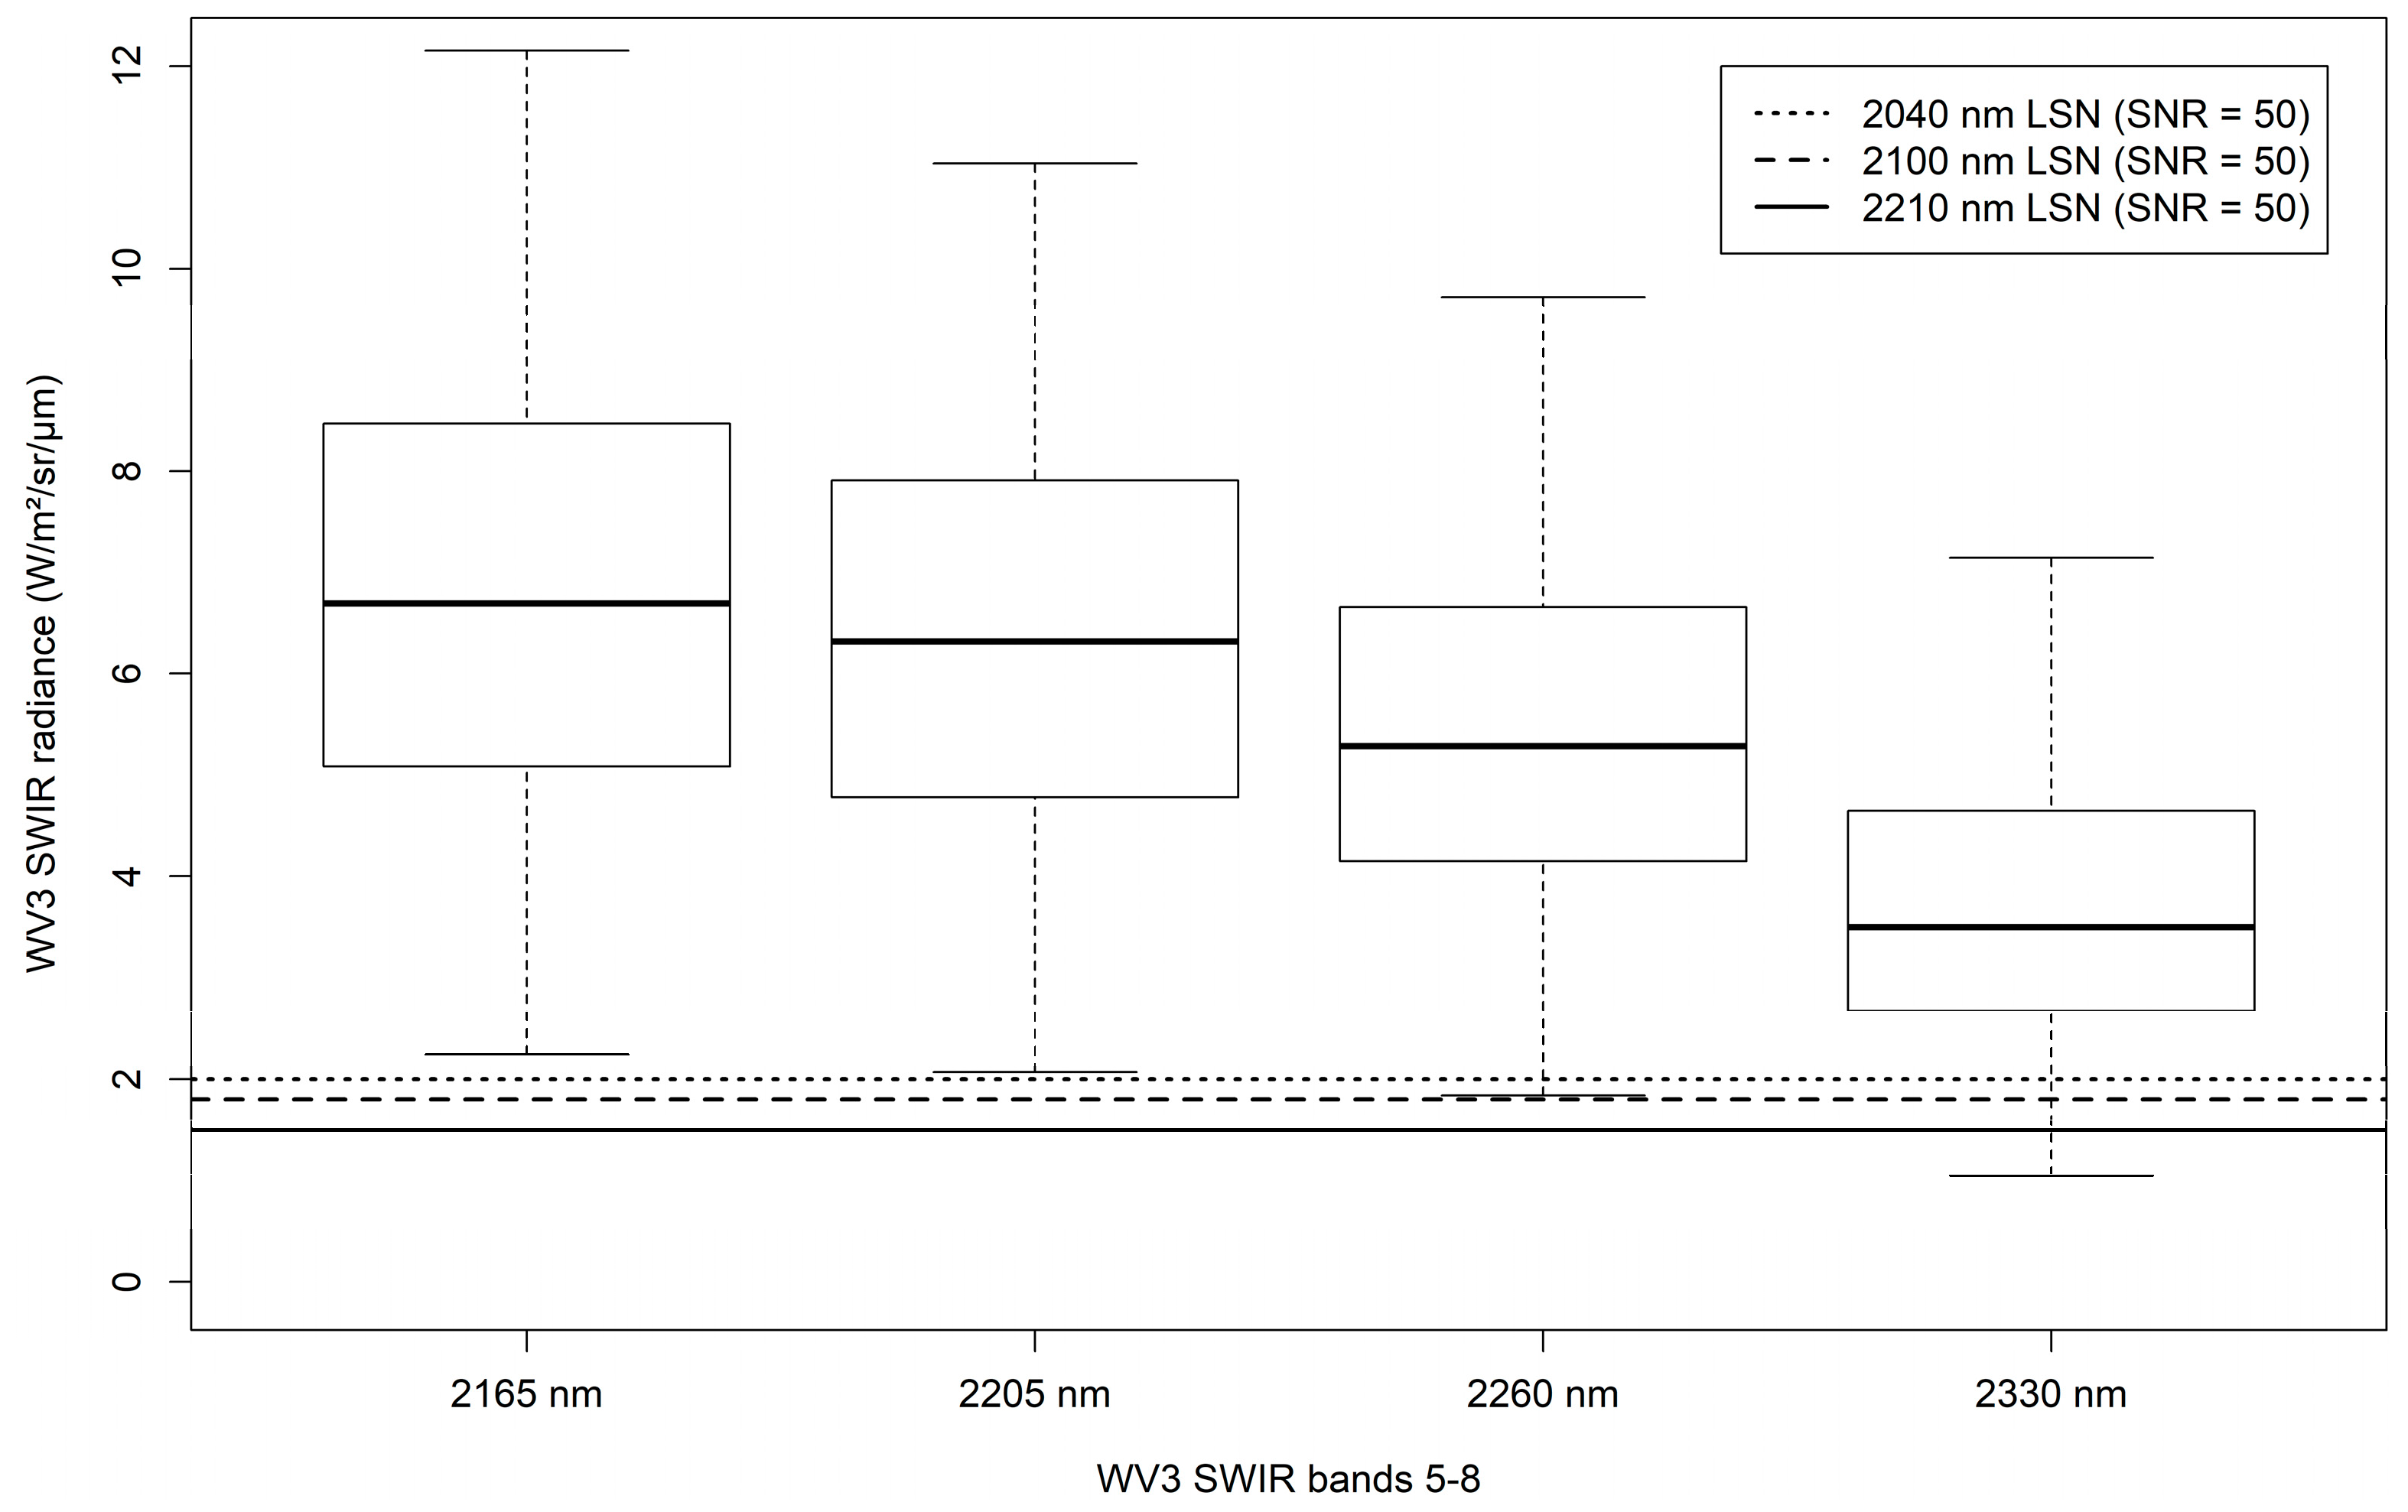
3.3. Sensor Signal-to-Noise Ratio Uncertainty Analysis

Prior to assessing the effect of Landsat Next band specifications on the generation of SWIR NPV indices, we compared simulated Landsat Next radiance and SNR values to WV3 radiance observations to evaluate SNR impacts. The distributions of observed WV3 radiance values for WV3 bands 5–8 are shown in Figure 6 (n = 716 pixels per band). These values were referenced to the closest simulated Landsat Next (LSN) band radiance value and corresponding NEDρ value in a look-up table that was subsequently used to reference the minimum radiance needed to achieve an SNR > 50 (shown as horizontal lines in Figure 6). Although the WV3 2330 nm band did not have corresponding LSN estimated radiance values in the SNR analysis, the WV3 mean radiance values and corresponding NEDρ values were obtained by matching observed WV3 2330 nm band average radiance to the radiance value in the proposed LSN 2210 nm band for the purpose of obtaining an approximate NEDρ value for 2330 nm.
Noise-equivalent delta reflectance (NEDρ) values were obtained using the LSN SNR scaled to the measured radiance of the residue samples (Figure 6). Since the residue samples had higher radiance values than the LSN minimum radiance levels (SNR = 50), actual SNR for the samples was generally ~90–100. For all five SWIR bands the NEDρ RPD (Figure 7) terms were less than +/−1% (0.91, 0.95, 0.88, 0.86, and 0.85% for the 2040, 2100, 2210, 2260, and 2330 bands, respectively, and 0.90% for ~OLI-7). Although NEDρ RPD differences were not large, relative performance as indicated by an RPD closest to zero was: 2330 < 2260 < 2210 < OLI-7 < 2040 < 2100 nm.
When SNR uncertainties (NEDρ values) were propagated into the generation of SWIR NPV indices, mean RPD varied within a range of +/−5.5% (Figure 8). Relative index performance as indicated by RPD closest to zero was: SIRRI < LCA-R < NDRI78 < LCPCDI < NDRI68 < SINDRI < LCA-D < CAI < SIDRI < CAI_L < NDTI-OLI < CAI_R. Overall, these findings suggest that SNR-related uncertainties do not have a large impact on spectral band radiometric properties nor on derived NPV indices. Overall, the band-specific SNR related impacts (Figure 8) are considerably less than the impacts of residual atmospheric artifacts and sensor noise (Figure 4). We conclude that projected SNR properties do not have a substantial impact on the ability of Landsat Next to accurately characterize NPV and crop residue.

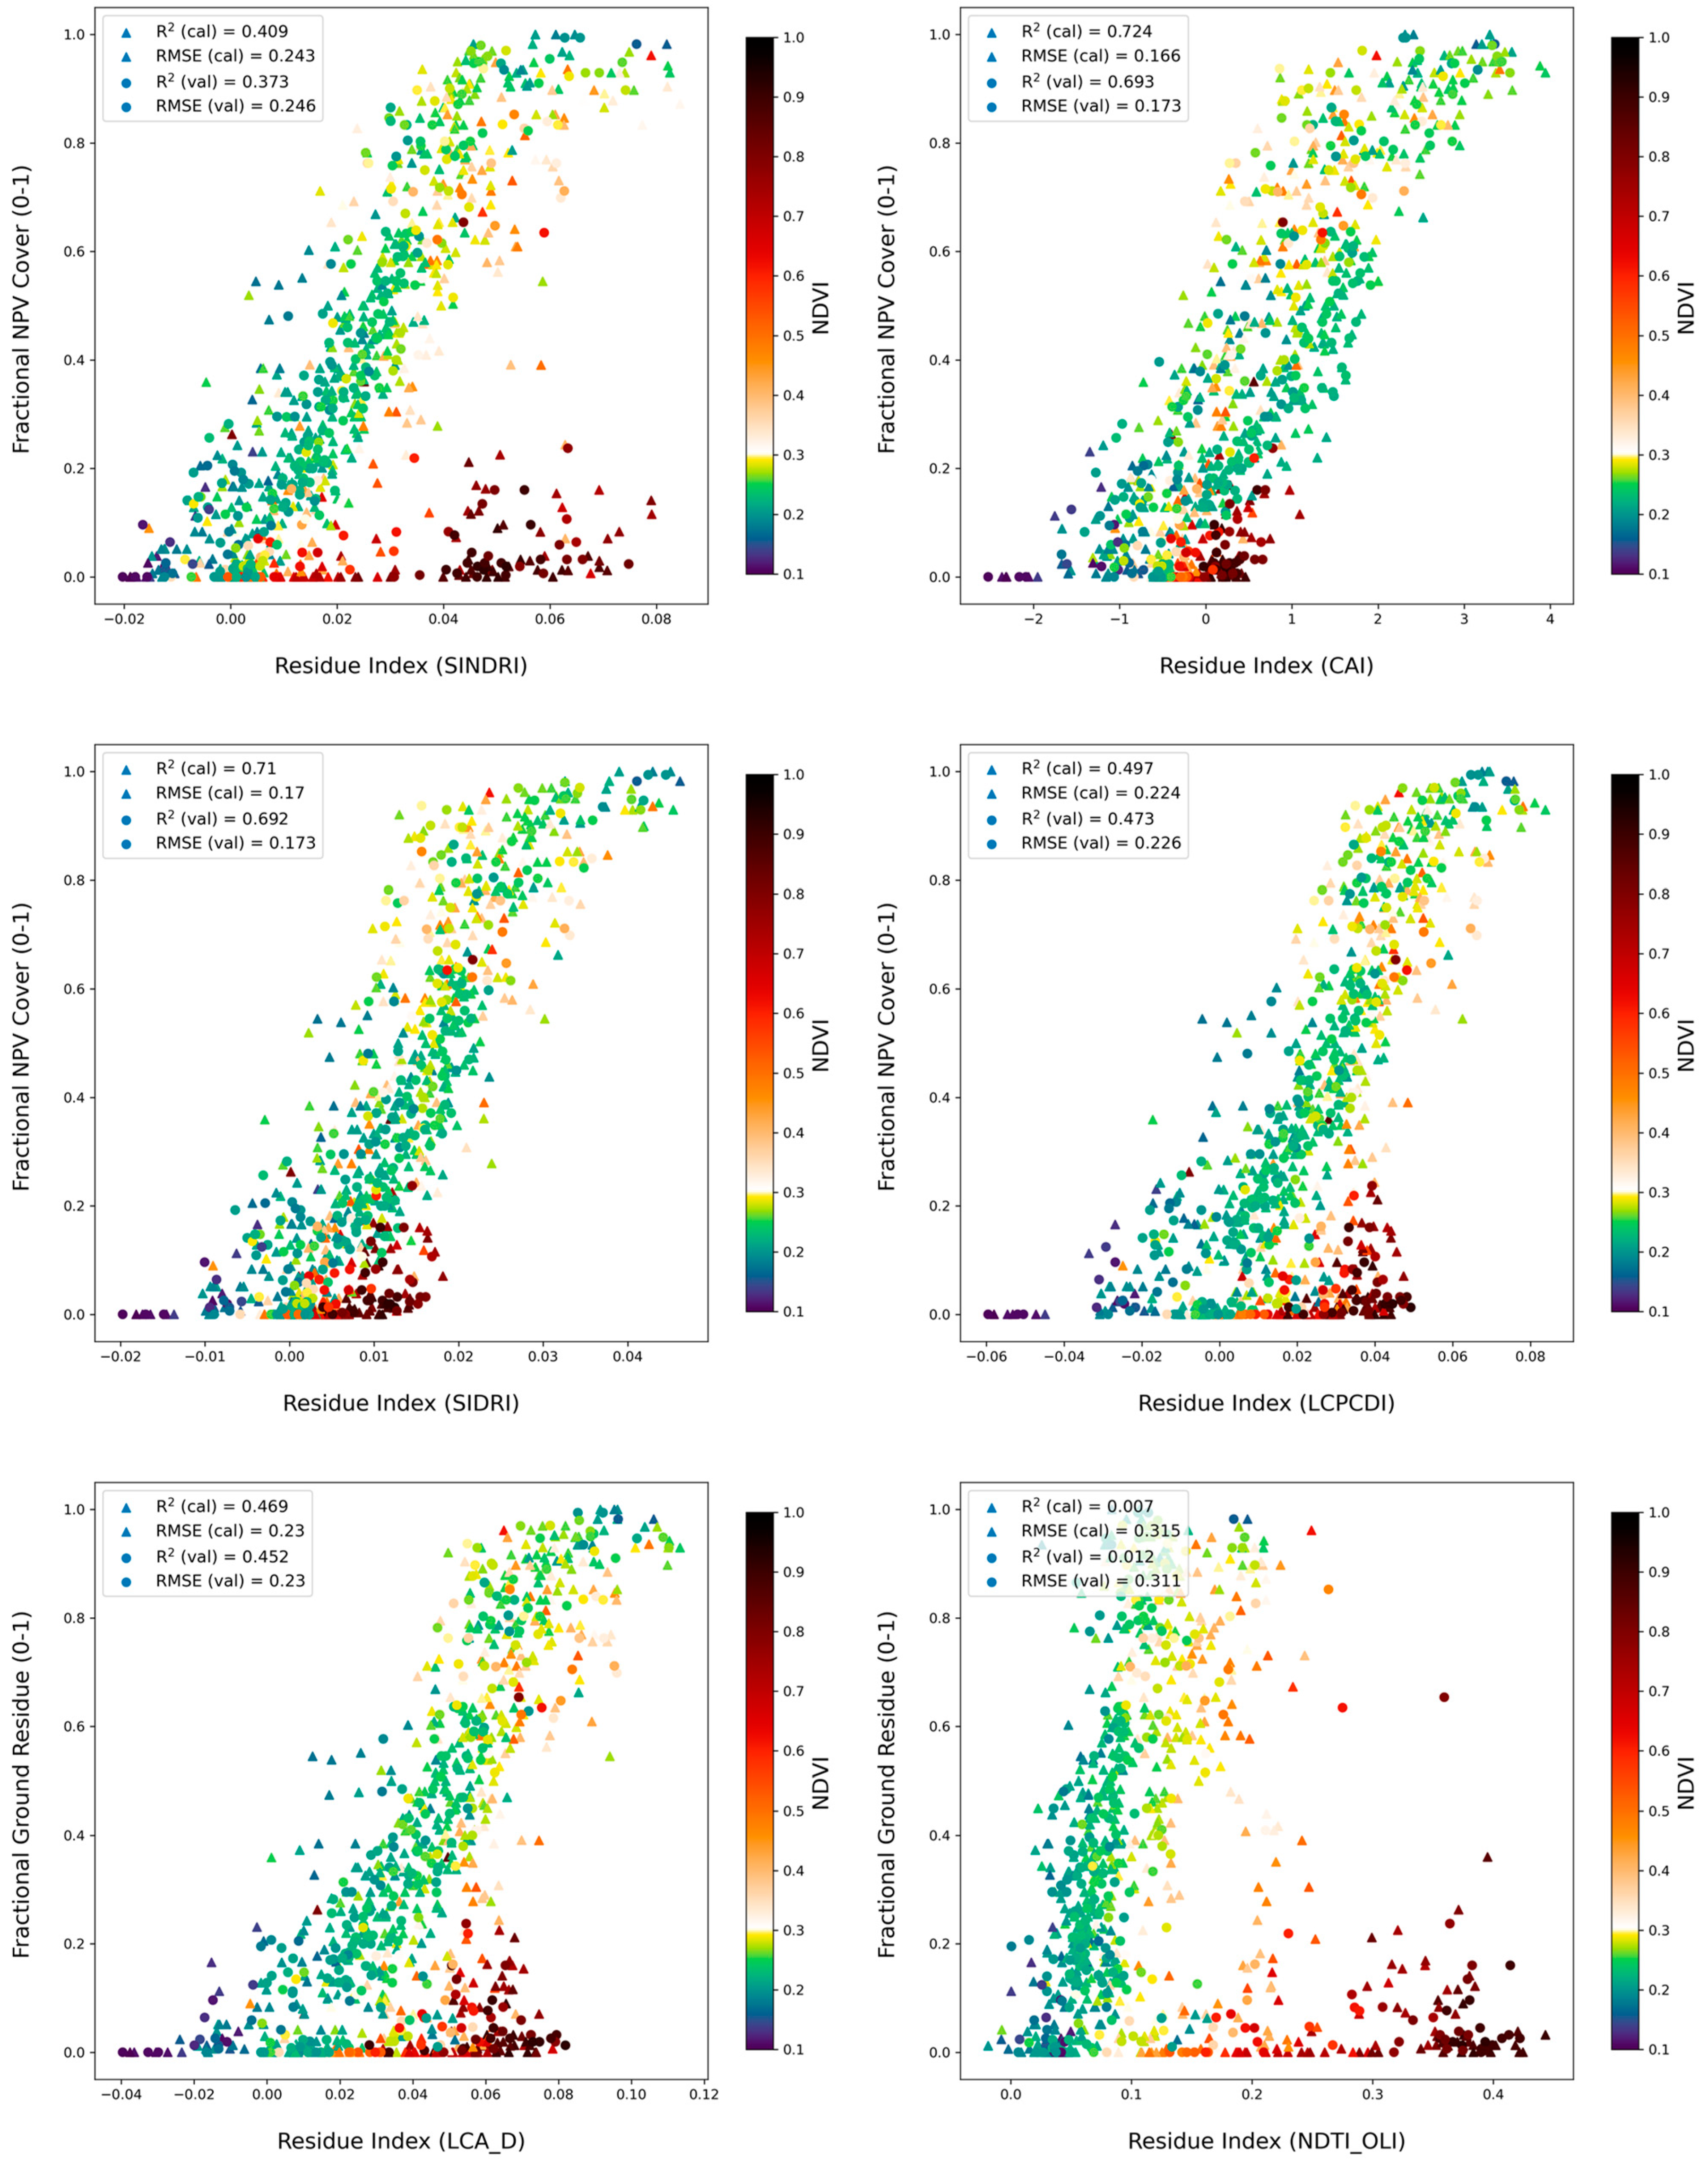
3.4. Measurement of NPV

For boxcar spectra from agricultural targets with minimal green vegetation (NDVI < 0.3, n = 650), using 20, 20, 40, 40, and 40 nm bandwidths for the 2040, 2100, 2210 2260, and 2330 nm band centers, respectively, SINDRI and SIRRI (Table 2) were the top performers in predicting NPV cover (R2 = 0.81, RMSE = 0.13), while CAI and SIDRI were next-ranked indices (R2 = 0.77, RMSE = 0.15) (Table 2), followed by a set of medium-ranked indices (LCA_D > LCPCDI > NDRI68 > LCA_R; R2 = 0.76 to 0.63, RMSE = 0.15 to 0.19) and the remaining poorly ranked indices (CAI_R > NDTI_OLI > CAI_L > NDTI_LSN > NDRI78; R2 = 0.51 to 0.24, RMSE = 0.21 to 0.27). When the dataset was expanded to include all agricultural targets (NDVI < 1.0, n = 916) performance dropped for all indices, with CAI and SIDRI maintaining a high level of predictive capability (R2 = 0.71 and 0.70, respectively, RMSE = 0.17) while SINDRI (R2 = 0.40, RMSE = 0.24) and SIRRI (R2 = 0.39, RMSE = 0.24) exhibited a marked drop in performance. The remaining indices exhibited either moderate performance (LCPCDI > LCA_D > CAI_L; R2 = 0.49 to 0.40, RMSE = 0.22 to 0.24) or poor performance (NDRI68 > NDRI78 > NDTI_LSN > NDTI_OLI > LCA_R > CAI_R; R2 = 0.03 to 0.00, RMSE = 0.31). The broadband NDTI (compatible with Landsat 7–9 sensors) exhibited only moderate performance under conditions of minimal green cover (R2 = 0.44, RMSE = 0.23) and very poor performance under the full range of green vegetation (R2 = 0.01, RMSE = 0.31; Table 2), demonstrating the utility of narrowband SWIR indices for detection of the ligno-cellulose absorption features.
The difference in performance between SIDRI (difference of 2210 and 2260 nm bands) and SINDRI and SIRRI (normalized difference or ratio of the same bands) was striking, with SINDRI and SIRRI being the top performers when vegetation was absent, but poor performers when the full range of green vegetation was present, while SIDRI maintained good performance under both conditions (see Table 1 for index equations). As can be seen in Figure 1, green vegetation (under agricultural conditions) exhibits a peak at 2210 and decrease at 2260, similar to crop residue although with a gentler decreasing slope. It appears that SIDRI measures the spectral slope of the decrease, and so the residue signal remains prominent, while the calculation of a normalized difference or ratio of these bands reduces the slope-based distinction between crop residue and green vegetation, resulting in reduced performance for prediction of NPV cover under a full range of vegetated conditions. For CAI, the slope between 2100 and 2210 nm is similar for both residue and green vegetation, but residue displays a reflectance peak at 2040 nm where green vegetation does not (Figure 1), likely accounting for the strong performance of CAI in the presence of vegetation (NDVI < 1.0). The LCA index uses the 2100 and 2210 nm bands (in common with CAI) between which the residue and green vegetation slope is similar, as well as and the 2210 and 2330 nm bands (similar to the 2210 and 2260 nm peak and absorption utilized by SINDRI and SIDRI) between which crop residue exhibits a stronger decrease than does green vegetation. Interestingly, relative performance results for LCA calculated as a difference (LCA_D) and calculated as a ratio (LCA_R) were similar to those derived for SIDRI and SIRRI, with the difference performing best under non-vegetated conditions, although the overall goodness of fit measures for LCA were less than those for SIDRI and SIRRI.
Goodness of fit was also calculated for each boxcar index relative to fractional GV, soil cover, and NDVI. A comparison of results (Table 2) reveals the sensitivity of each index to green vegetation, with the top performing indices (SINDRI, SIRRI, SIDRI, CAI, LCA_D, and LCPCDI) exhibiting little correlation with GV (R2 = 0.01 to 0.10) or NDVI (R2 = 0.00 to 0.16), indicating a resilience to the presence of green vegetation, while the remaining indices exhibited a strong correlation with GV (R2 = 0.54 to 0.71) and NDVI (R2 = 0.56 to 0.85) when NDVI was not limited (Table 2), indicating their sensitivity to interference from vegetative cover above minimal levels. Correlations with percent soil cover were an echo of those for NPV, as is expected due to the inverse relationship of soil and NPV cover. The broadband NDTI-OLI exhibited a poor correlation with NPV (R2 = 0.44) and the strongest correlation with GV (R2 = 0.70) and NDVI (R2 = 0.85) when NDVI was not limited (Table 2), indicating its susceptibility to interference from green vegetation cover.
Similar boxcar results were calculated using a variety of bandwidth combinations for the various indices ranging from 10 nm to 50 nm, with full results reported in [44]. Changing bandwidth for the various bands used to calculate SINDRI, SIRRI, SIDRI, and CAI had minimal effect on R2 and RMSE; narrower bandwidths improved performance measures by <0.01 for samples with minimal green vegetation (NDVI < 0.3), and by <0.04 for the full range of green vegetation (NDVI < 1.0). This indicates that the ligno-cellulose absorption features present in the NPV surface reflectance spectra (Figure 1) were adequately characterized by bandwidths ranging from 10 nm to 50 nm. However, because they were field-collected surface reflectance spectra, in this case bandwidth choice does not measure any impact of atmospheric absorption features, beyond the secondary atmospheric effect on incoming solar radiation at time of surface reflectance measurements.
For gaussian surface reflectance spectra (using 30 nm bandwidths), results were similar to the boxcar analysis: for agricultural targets with minimal green vegetation (NDVI < 0.3) SINDRI and SIRRI were the top performers in predicting NPV cover (R2 = 0.78, RMSE = 0.14), while CAI and SIDRI were the next-ranked indices (R2 = 0.75 and 0.74, RMSE = 0.15 and 0.16) (Table 3), followed by a set of medium-ranked indices (LCA_D > LCPCDI > NDRI68 > LCA_R; R2 = 0.73 to 0.61, RMSE = 0.16 to 0.19) and the remaining poorly ranked indices (CAI_R > NDTI_OLI > CAI_L > NDTI_LSN > NDRI78; R2 = 0.50 to 0.21, RMSE = 0.22 to 0.27). When the dataset was expanded to include all agricultural targets (NDVI < 1.0) performance dropped for all indices, with CAI and SIDRI maintaining a high level of predictive capacity (R2 = 0.68 and 0.67, respectively, RMSE = 0.18) while SINDRI and SIRRI exhibited a marked drop in performance (R2 = 0.39 and 0.38, RMSE = 0.25). Two of the remaining indices exhibited moderate performance (LCA_D > CAI_L; R2 = 0.44 and 0.37, RMSE = 0.24 and 0.25) and the rest showed abysmal performance (LCPCDI > NDRI68 > NDRI78 > NDTI_LSN > NDTI_OLI > LCA_R > CAI_R; R2 = 0.06 to 0.00, RMSE = 0.31) (Table 3).
For the gaussian spectra with atmospheric artifacts and sensor noise included, performance of the indices degraded only to a very slight degree compared to the performance of indices calculated from gaussian surface reflectance (reduction of R2 = 0.006 and increase in RMSE = 0.001, on average), except for the CAI which demonstrated a drop in R2 of 0.08 and increase in RMSE of 0.02 for prediction of samples with full range of NDVI (Table 3). A similar analysis of gaussian residual atmospheric artifacts was conducted using various bandwidth combinations, with full results detailed in [44]. Results showed minimal differences in goodness of fit attributable to atmospheric artifacts (average change in R2 of 0.012 for NDVI < 0.3 and 0.017 for NDVI < 1.0) with CAI again displaying the largest change in R2 (0.074 on average) for samples with NDVI < 1.0. Changes in bandwidth did not have an obvious effect on goodness of fit, although this should not be taken as an indication of resilience to atmospheric interference, since the assumptions of the ATREM model (standard mid-latitude atmosphere) did not account for spatial or temporal variability in CO2 and water vapor concentrations, and employed a constant residual that was not greatly affected by bandwidth.
The results detailed above were calculated using the entire dataset of spectra collected from agricultural targets (n = 916) with 650 spectra exhibiting NDVI < 0.3. When that dataset was divided into 2/3 calibration spectra and 1/3 validation spectra, results (Figure 9) demonstrated minimal change in R2 and RMSE relative to the complete dataset when using samples with NDVI < 0.3, while performance decreased slightly (change in R2 < 0.03) when using the entire range of spectra (NDVI < 1.0), with full results reported in [44].
Spectra collected from sites with abundant green vegetation (0.3 < NDVI < 1) generally exhibited much higher SWIR index values than would be expected from their low fractional NPV cover (Figure 9). In the case of indices that were more sensitive to vegetation (NDTI, LCA, SINDRI) this discrepancy, if undetected, could lead to a severe overestimation of percent residue cover, pointing to the importance of implementing an NDVI threshold to limit NPV analysis on agricultural settings to fields with minimal green vegetative cover. For the indices that were more resistance to interference from green vegetation (CAI, SIDRI) index values for high vegetation samples were only somewhat elevated above what might be expected, which if uncorrected would similarly lead to overestimation of NPV cover, but to a much lesser degree.
In addition to the 916 spectra dataset of agricultural targets, NPV assessment was conducted on 808 gaussian spectra collected from non-agricultural areas that were gleaned from Dennison et al. [19], with results included in the data release accompanying this manuscript [44]. The dataset included 129 spectra from California grassland, 60 spectra from Brazilian grassland, 595 spectra of California shrubs, and 24 spectra of poplar shrubs. Overall, results were similar to those for agricultural targets, with somewhat lower R2 (maximum R2 of 0.71 for NDVI < 0.3 and 0.51 for NDVI < 1.0) and higher RMSE (minimum RMSE of 0.06 for NDVI < 0.3 and 0.16 for NDVI < 1.0), and a somewhat different comparative performance of the various indices, with NDRI68 index emerging as a strong performer and CAI performing poorly in the non-agricultural dataset with NDVI < 0.3 (n = 45) [44].

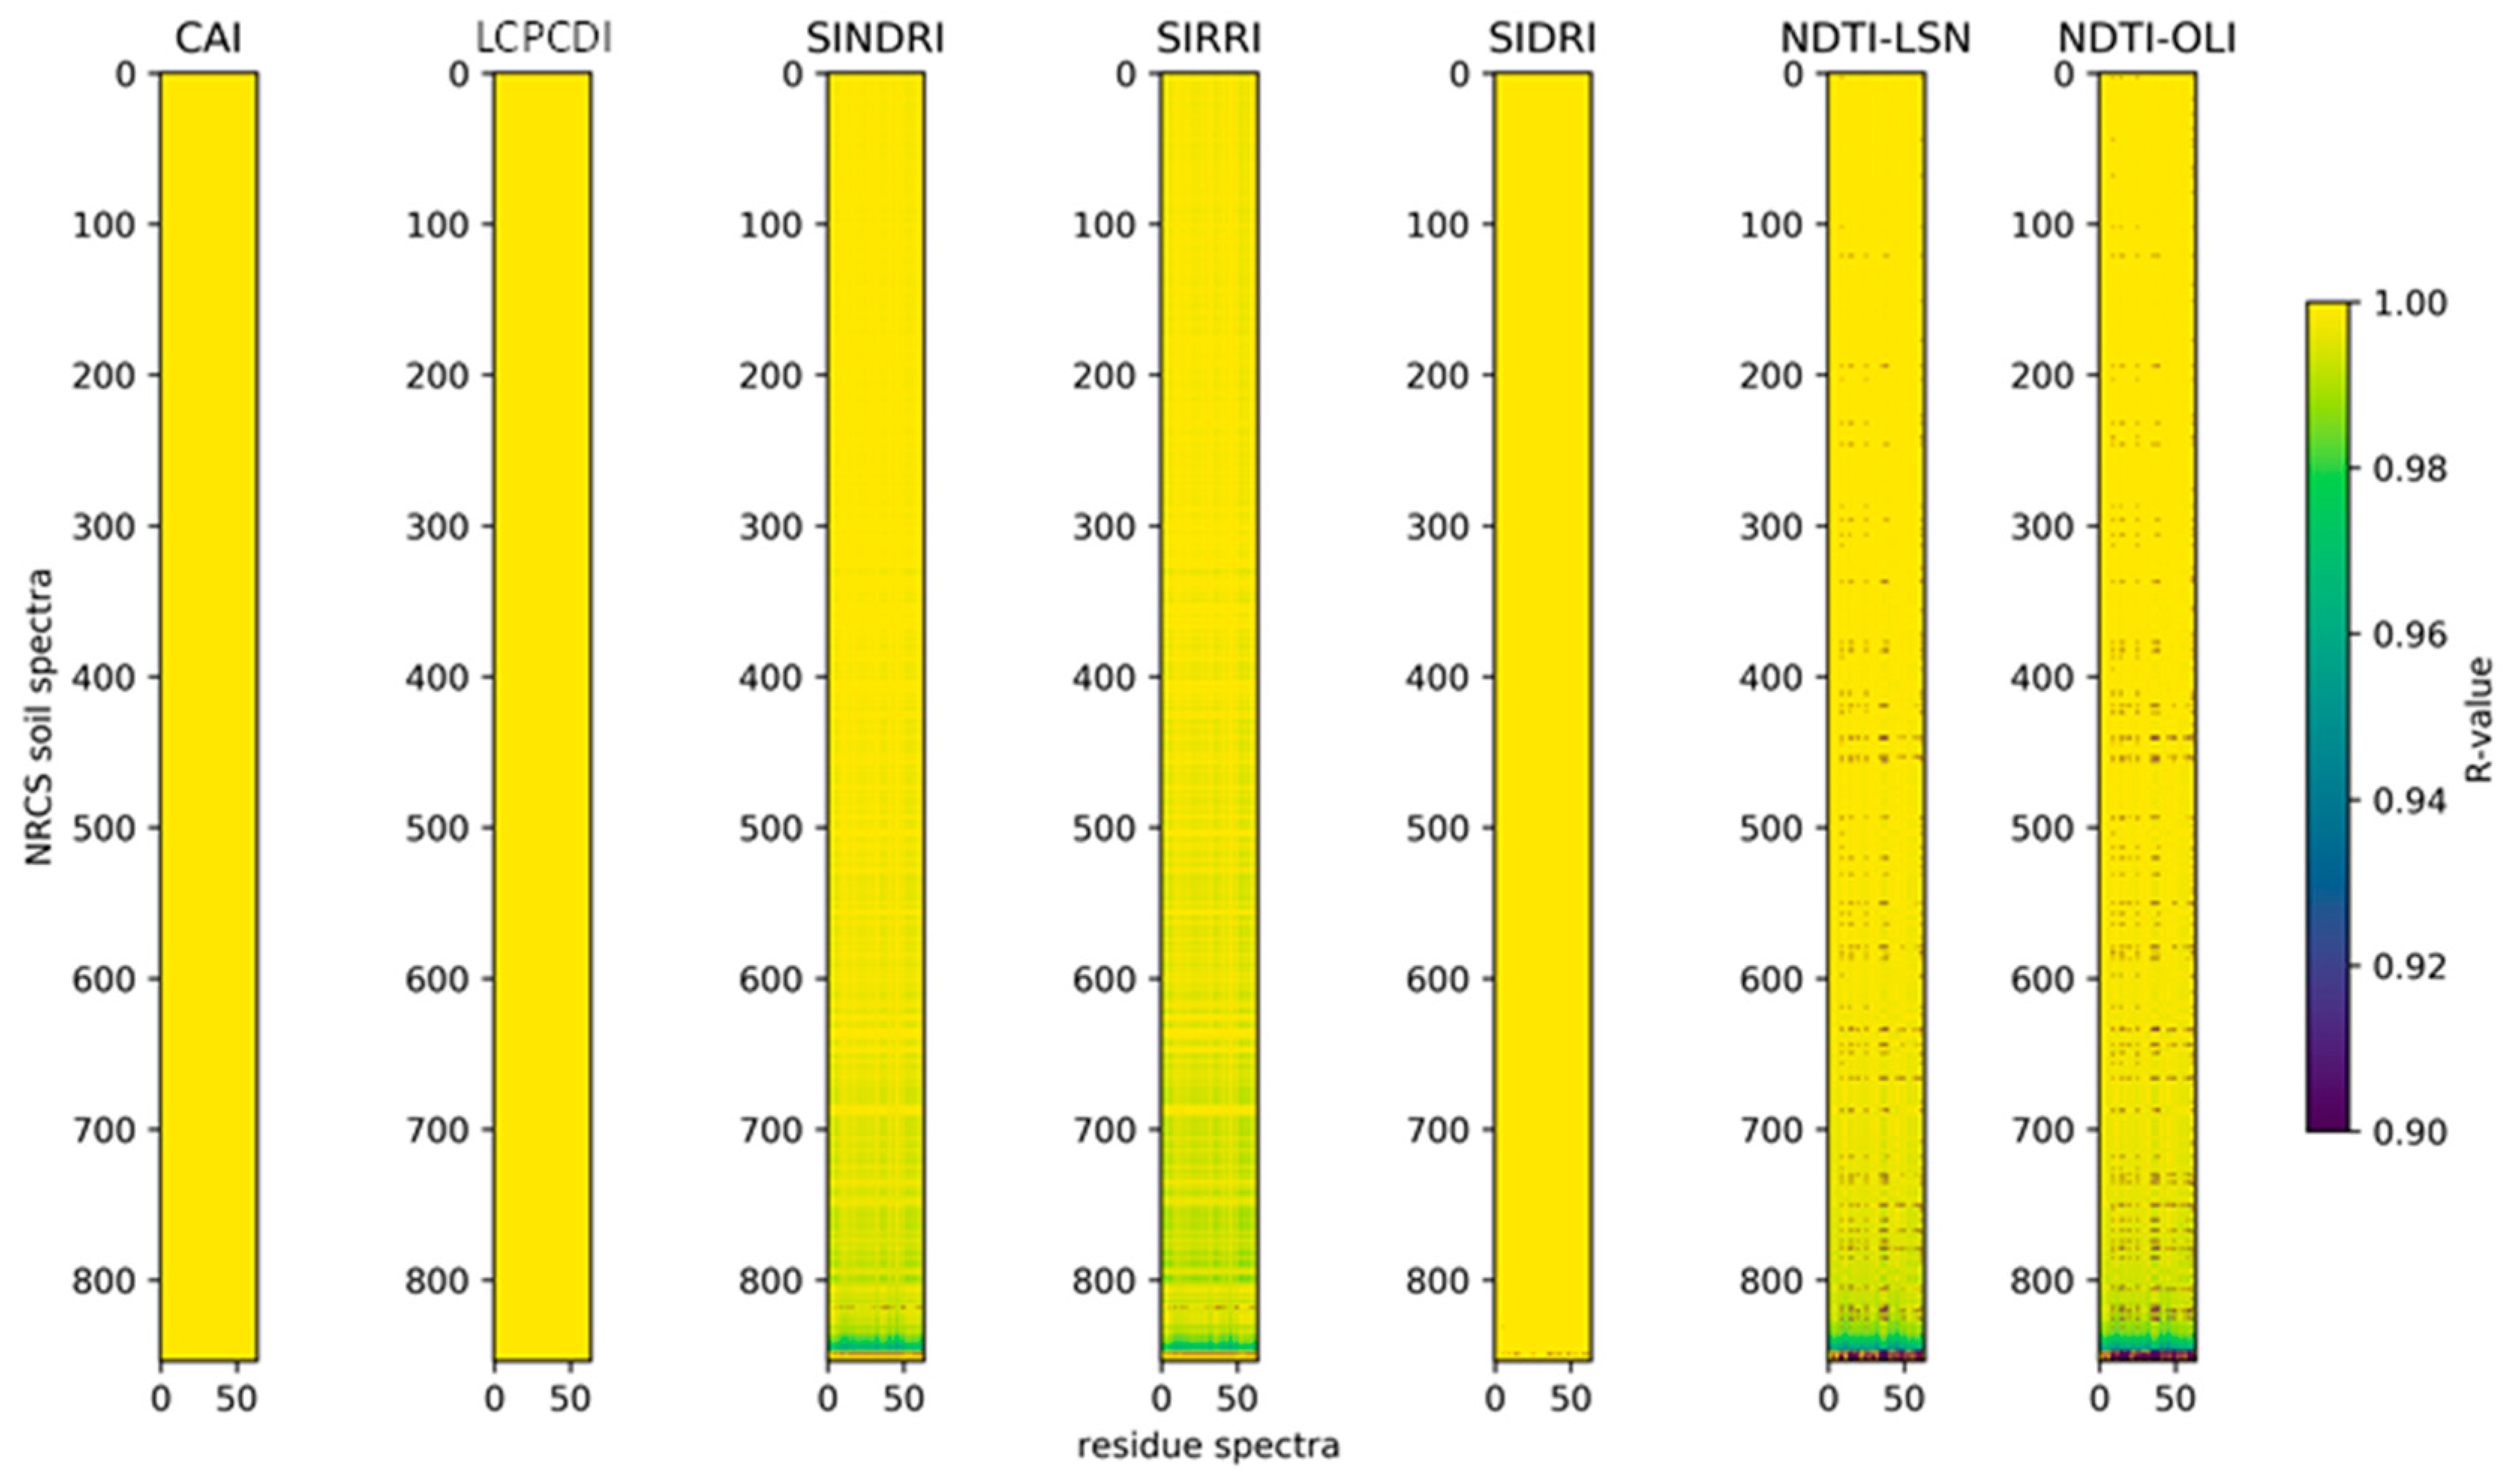
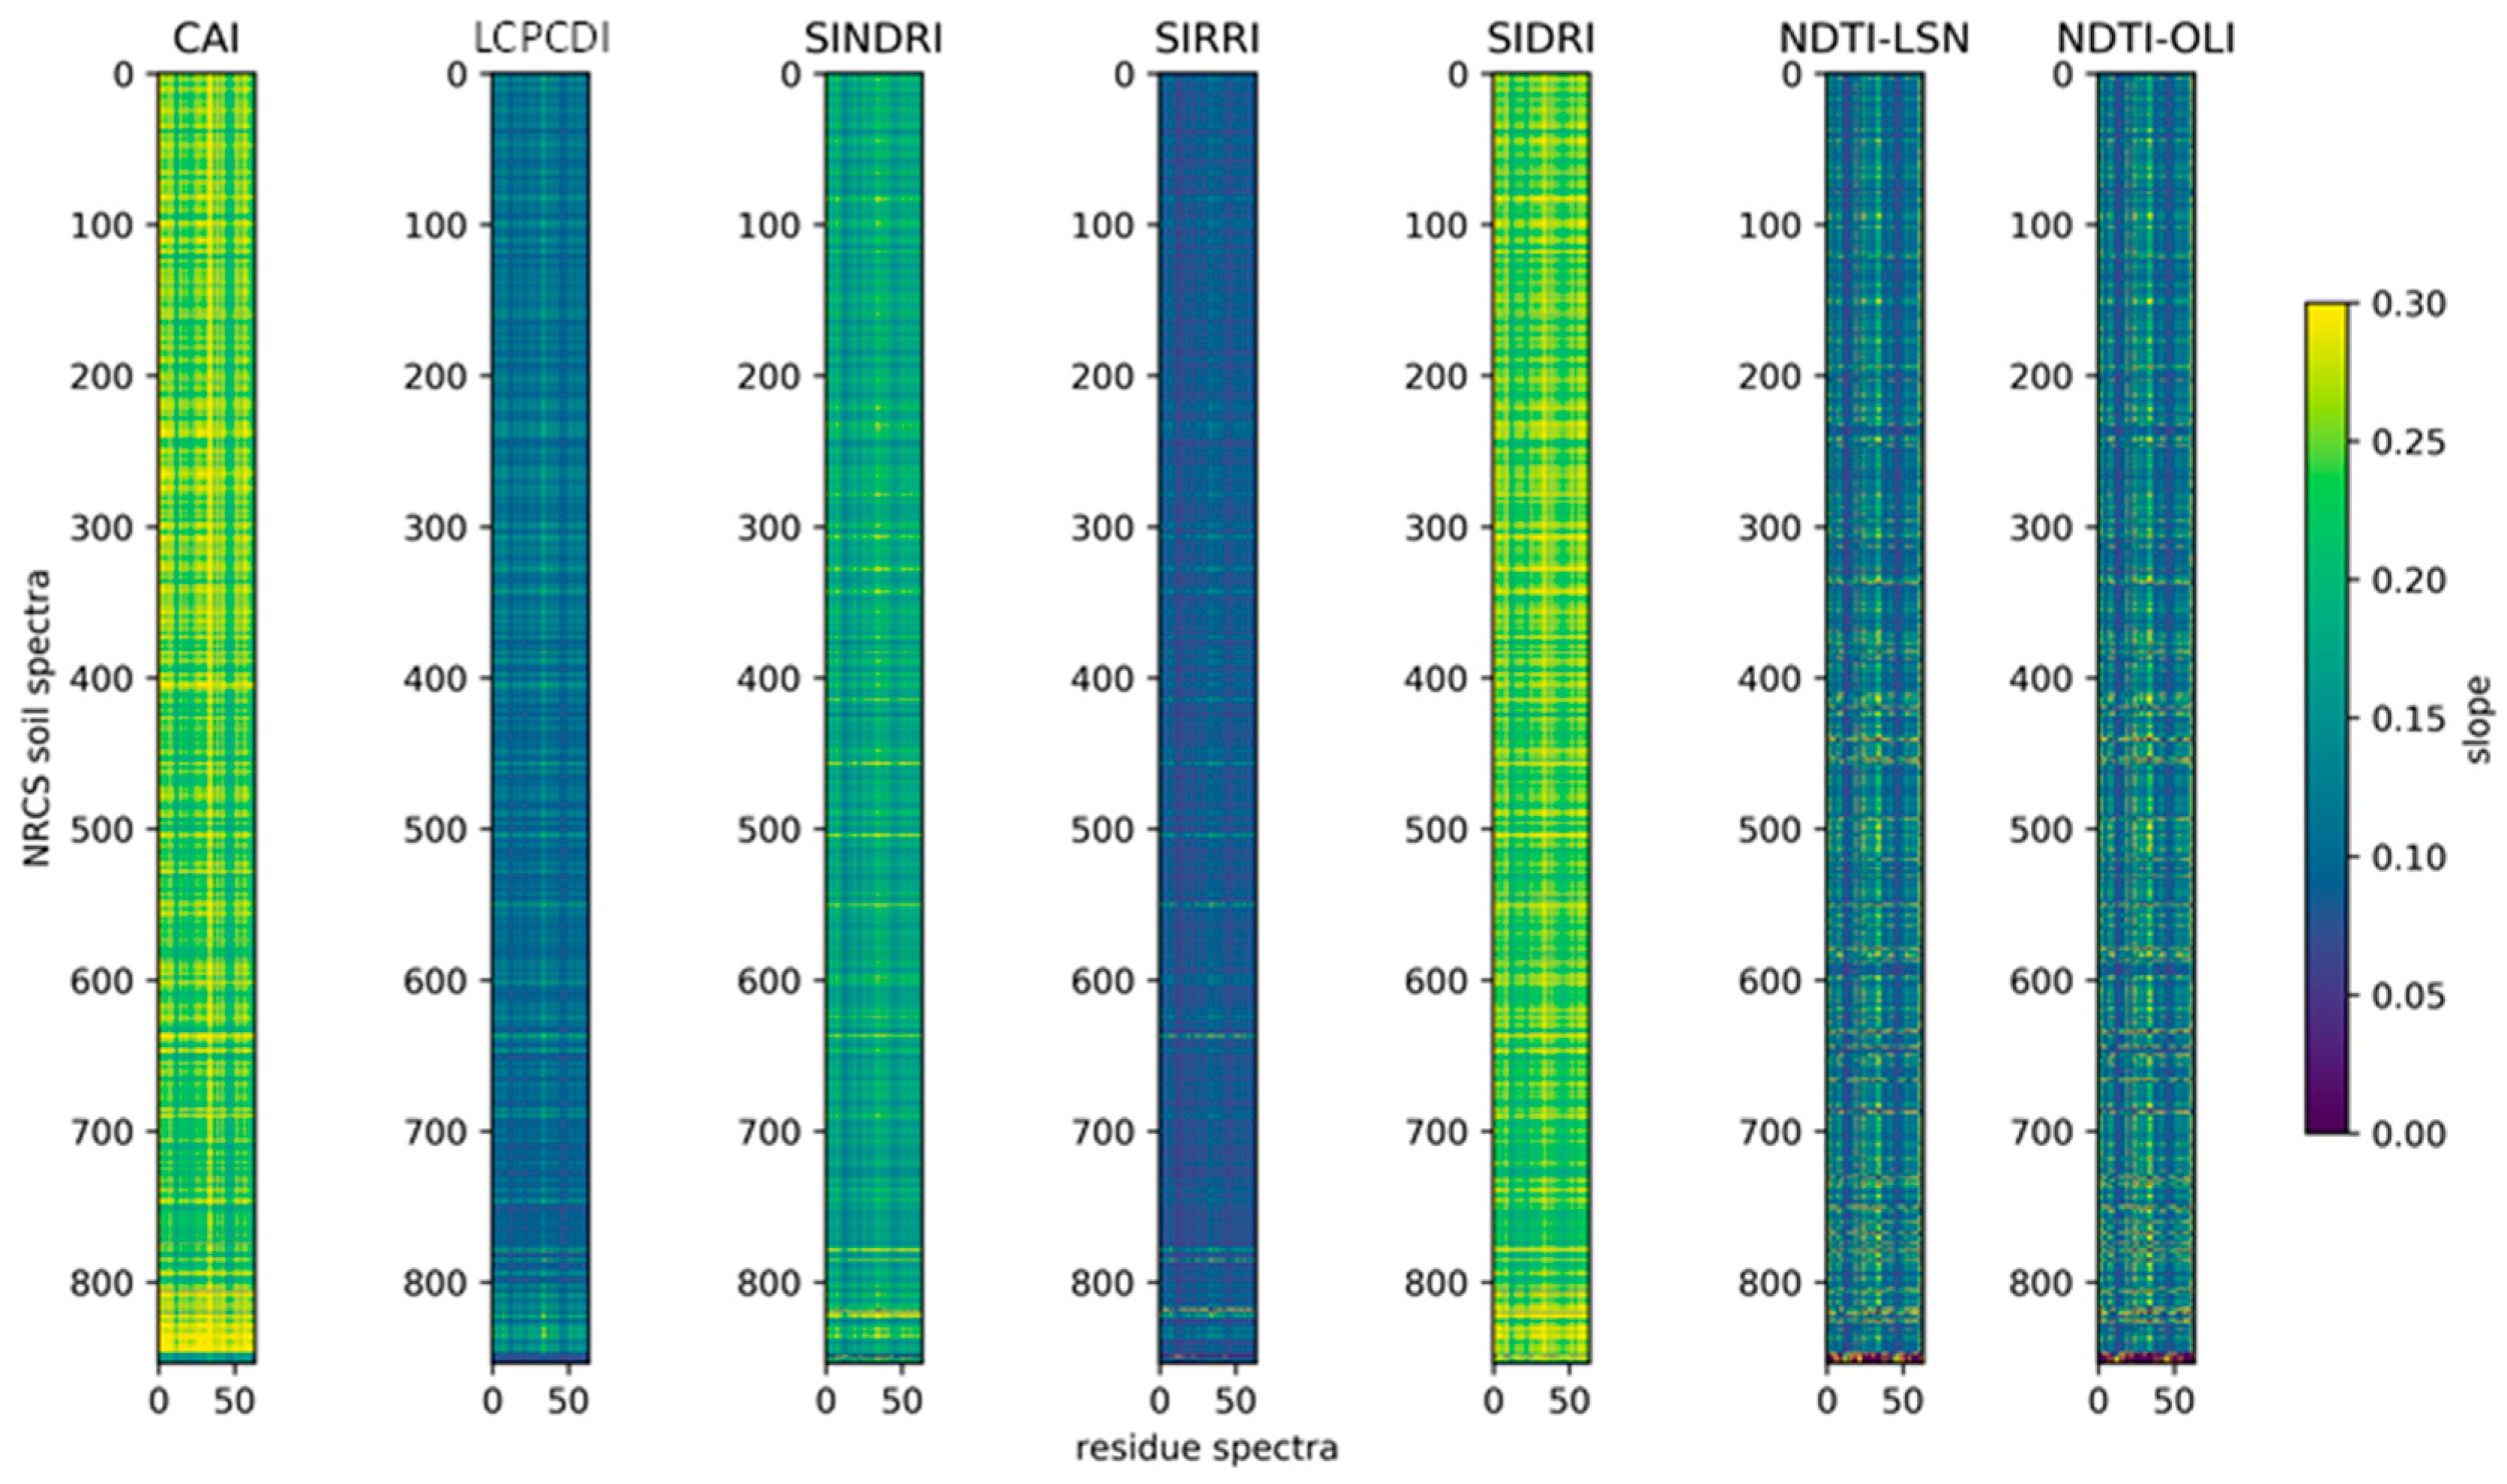
3.5. Effect of Varying Background Soil Reflectance

Soil composition and minerology affect reflectance from the soil fractional component, in the SWIR as well as the visible-NIR wavelengths [14,35]. To assess response of SWIR NPV indices to various background soil types, the Brown et al., (2006) [49] soil reflectance dataset was used to perform a simulated linear spectral mixing of each soil type with NPV reflectance spectra from crop residue (Serbin, 2009 [14]) at calculated levels of 0, 15, 30, 60, and 100% NPV (no green vegetation fraction was present, therefore % NPV + % soil cover = 100). After performing this mixing, the various SWIR NPV indices were calculated and were correlated with fractional NPV. Ideally each SWIR NPV index would yield an R-value of 1.0 for each simulated NPV-soil pair, indicating that the index is responding linearly to fractional NPV and not to reflectance features of the background soil. Additionally, slopes should be consistent between different NPV-soil spectra pairs for a given index, demonstrating efficacy across different soil types. To present a clear illustration of patterns in both R-value and slope (Figure 10 and Figure 11, respectively), the soil spectra number (y-axis) was ordered by median NTDI R-value computed across NPV residue spectra (x-axis). This ordering was applied across indices for both R-value and slope comparison figures for various NPV indices.
The three difference indices, CAI, SIDRI, and LCPCDI, demonstrated near-perfect linearity in their correlation with simulated fractional NPV, while the three ratio indices, SINDRI, SIRRI, and NDTI, displayed reduced linearity, apparently because the normalization increased the relative spectral impact of the background soil fraction. Although linear relationships are not necessary for accurate residue prediction [14], they provide the most straightforward interpretation, especially when considering three-component spectral mixing models with NPV, soil, and green vegetation. The spectral mixing analysis demonstrated that all indices exhibited different slopes with different NPV-soil pairs (Figure 11). Generally, LCPCDI and SIRRI had the most consistent values. NDTI was the worst performer, demonstrating a lack of consistency in prediction of simulated percent NPV cover across various NPV-soil pairs. Resistance to background soil impacts is an important consideration when selecting indices with applicability across a range of landscapes and soil types. The LCPCDI, derived from the 2100, 2200, and 2260 nm bands, and the CAI, derived from the 2040, 2100, and 2210 bands, are indices with linear response and fairly consistent slopes across different soil and NPV pairs.
The findings of the simulated spectral mixing analysis demonstrate that the narrowband SWIR NPV indices generally outperform the broadband NDTI in terms of consistency across different NPV-soil pairs. For NDTI, seven NPV-soil spectra pairs exhibited negative trends (i.e., negative R-value). These spectra (numbers 847–853) are shown as the lower black regions in Figure 10. This indicates that certain soils may produce NDTI values that are greater than that of NPV, thus resulting in negative trends in the mixing analysis. Compared to NPV, these soils would need to have a greater relative reflectance decrease between the 1610 nm band (OLI-6) and the 2200 nm band (OLI-7) when computed as a normalized difference. While such soils were not common in the NRCS soils dataset (7 out of 854 total spectra), this is an important consideration for NDTI compared to other indices. The soils that tended to produce negative NDTI trends tended to be rich in kaolinite. Twenty-two additional spectra produced NDTI R-values that were positive, but lower than 0.99. Kaolinite was present in many of these spectra as well. The soil spectra that produced positive <0.99 trends for NDTI also did for SIRRI and SINDRI, as shown by the light blue color in Figure 10. OLI-7 and the 2210 nm bands are both impacted by the presence of kaolinite that has a strong absorption feature at 2200 nm. Kaolinite, other clays, and micas with absorption features centered near 2200 nm (such as those caused by Al-OH bonds and similar cation-OH bonds) are widespread components of soils in natural ecosystems [50,51]. For example, the mineral map of Australia, the largest area of the Earth mapped with imaging spectrometer data, shows widely distributed kaolinite, montmorillonite, muscovite and illite [52].
An illustration of the kaolinite absorption feature is provided in Figure 12, which depicts a variety of individual soil spectra, along with two crop residue spectra, to provide illustrative support for the findings of the spectral mixing analysis. The SWIR NPV indices utilizing the 2210 and 2260 nm bands effectively identify a reflectance decrease associated with corn and soybean crop residues. In contrast, soils rich in kaolinite exhibit a reflectance increase between the 2210 nm to 2260 nm band, while other soils exhibit little difference between these spectral regions. Using SINDRI as an example, a positive index value would result when NPV is the dominant surface cover, an index value near zero when a kaolinite poor soil is the dominant surface cover, and a negative index value when a kaolinite rich soil is the dominant surface cover. When mapping percent NPV cover, these soil-based differences in index range will not impact mapping accuracy so long as the kaolinite richness of the soil remains relatively consistent [11]. However, the differences in SINDRI, as well as CAI, that may be expected from soils with different kaolinite levels does impact the applicability of standardized mapping approaches across different landscapes, as expected ranges for the ranges would change due to the impact of background soil variability near 2210 nm.
Additional study is needed to control for the impact of soil minerals with absorption features in the 2200 nm region. With the SWIR bands under consideration for Landsat Next, a potential method to control for the impact of kaolinite on SWIR reflectance would be to establish a spectral angle adjustment routine in which a collection of bare soil ground control points would be matched with image pixels for which a spectral angle between the 2100 nm and 2210 nm bands would be computed. This spectral angle could be used as an adjustment coefficient to provide a standardized scaling for SINDRI index values across a range of landscapes with soils varying in kaolinite richness. This kaolinite spectral angle coefficient would be ideal for standardization of SIRRI, SINDRI, and SIDRI which utilize spectral differences in a separate spectral region (i.e., 2210 nm and 2260 nm bands).

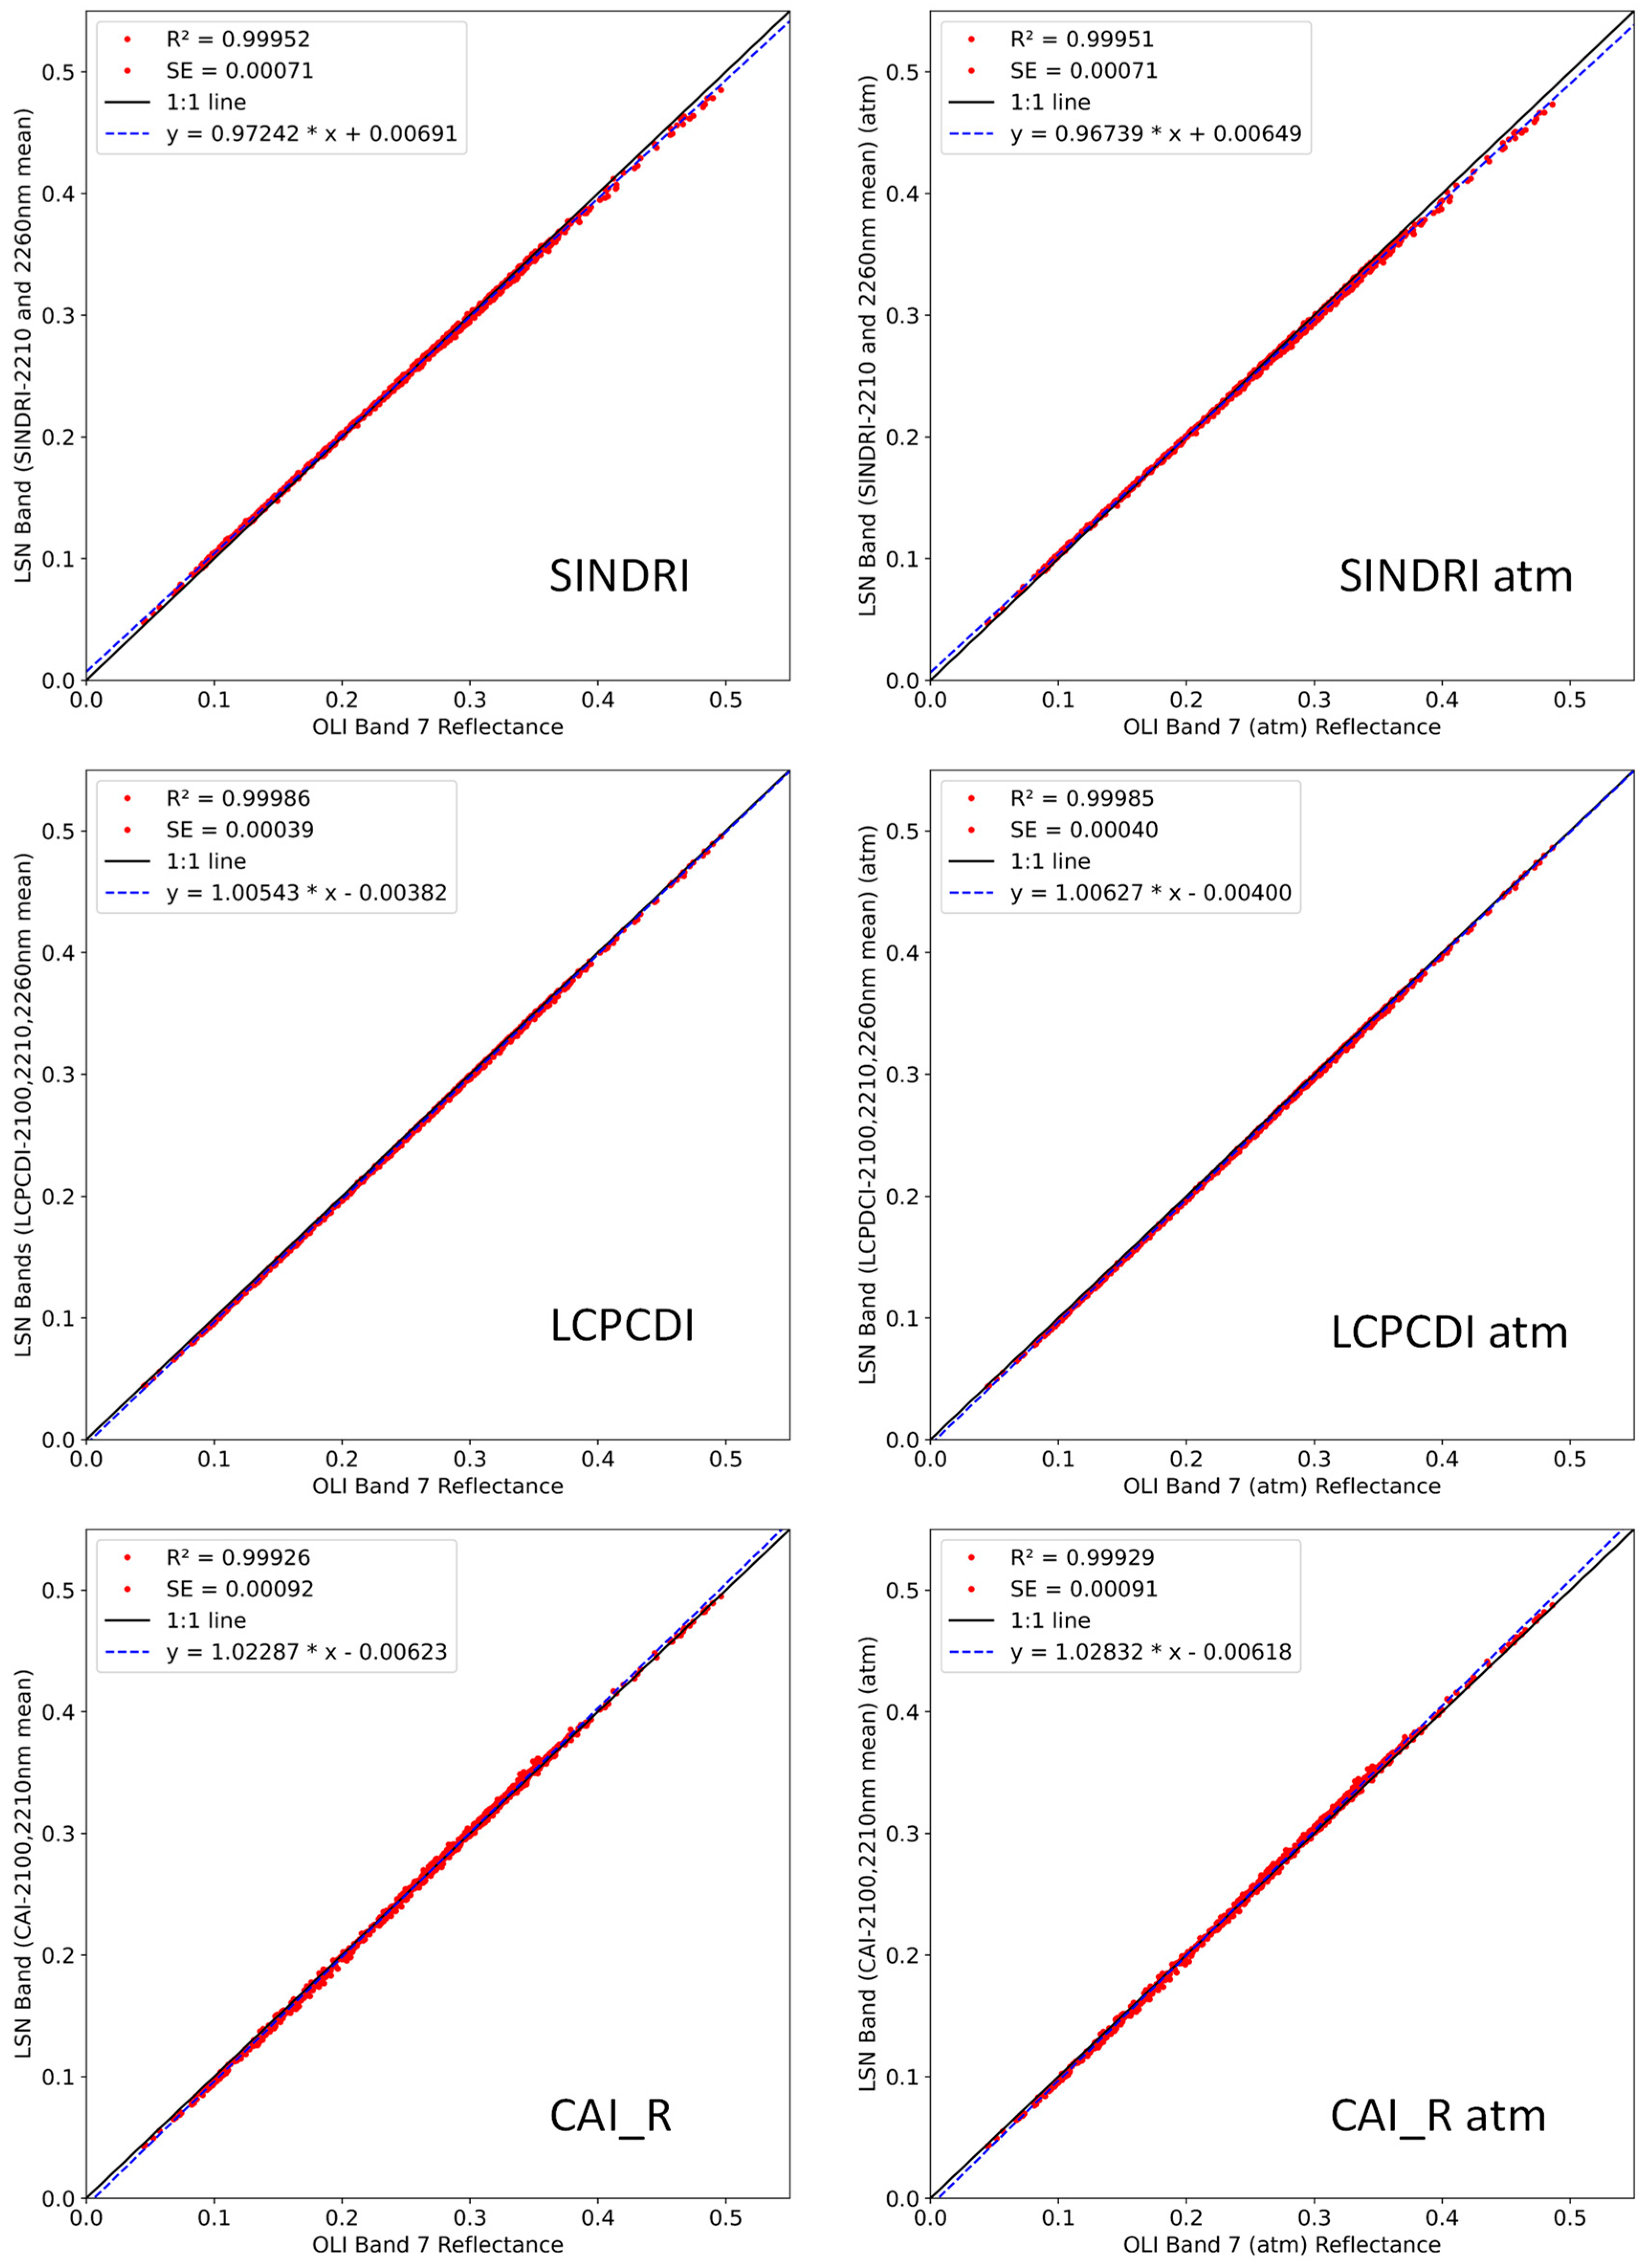
3.6. Mission Continuity

The Landsat program has established a long-term record of Earth observation, and continuity of SWIR measurements from the Landsat 8 and 9 missions to the Landsat Next instrumentation is a desirable outcome. The dataset of original gaussian spectra (n = 916) was used to approximate band reflectance for Landsat 8 OLI Band 7 (2200 nm center, 180 nm bandwidth) and also to calculate reflectance for the proposed Landsat Next band centers at 2040, 2100, 2210, and 2260 nm with 30 nm bandwidth. These bands were then used to calculate mean reflectance across the two-band and three-band ranges combinations associated with SINDRI, CAI, and LCPCDI for comparison with OLI Band 7, using R2 and slope as comparison metrics. The LCPCDI three-band convolution (2100, 2210, and 2260 nm), with an R2 of 0.99986 and slope of 1.00543 (Figure 13), provided the closest match for the OLI Band 7. The two bands associated with the SINDRI, SIRRI, and SIDRI indices (2210, 2260 nm) exhibited a strong correlation (R2 = 0.99952) but a slope that deviated somewhat from 1.000 (slope = 0.097242). The three bands associated with CAI (2040, 2100, and 2210 nm) displayed reduced correlation (R2 = 0.99588), larger residuals, and steeper slope (1.07428), although this improved somewhat (R2 = 0.99926; slope = 1.02287) if the calculations were made using only the two longest-wavelength bands of CAI (2100 and 2210 nm) which exhibit overlap with OLI Band 7 (Figure 13). The inclusion of atmospheric residuals and sensor noise did not affect results. Overall, the combination of 2100, 2210, and 2260 bands at 30 nm bandwidth provided a large degree of continuity with OLI Band 7 reflectance. It should be noted that these results were derived using spectra from agricultural targets, and future studies could be designed to calculate similar results for non-agricultural targets.

4. Summary of Findings

In this study we used a dataset of 916 reflectance spectra from agricultural targets, with associated measures of percent cover by NPV, soil, and green vegetation, to evaluate various narrowband SWIR indices employed to measure fractional NPV cover under a variety of surface moisture conditions. We assessed spectral band radiometric properties including band centers, bandwidths, interference from atmospheric absorption features, and expected signal-to-noise (SNR) tolerances, and then assessed the performance of 13 SWIR indices for measuring fractional NPV cover (primarily crop residue), as well as their resistance to interference from green vegetation cover. Finally, we evaluated the impacts of background soil reflectance, assessed continuity with current Landsat 8 OLI Band 7, and described band combinations suitable for inclusion on the Landsat Next mission to support the detection of NPV.
Atmospheric assessments were performed using a standard mid-latitude atmosphere and did not account for spatial and temporal variability in atmospheric components such as CO2 and water vapor. The indices that demonstrated the greatest susceptibility to atmospheric impacts were those calculated using the 2040, 2100, and 2330 nm bands. In particular, the 2040 nm band, situated between atmospheric CO2 absorption features at 2010 and 2060 nm, required a more narrow bandwidth (≤20 nm) to avoid noise from CO2 absorption. It should be noted that when calculating CAI using a 2040 nm bandwidth of 10, 30, or 50 nm (gaussian spectra) while keeping 2100 and 2200 bands constant at 50 nm bandwidth, the R2 and RMSE of NPV predictions using original vs. atm spectra did not vary significantly [44]. However, this should not be taken as evidence that a 50 nm bandwidth at 2040 nm is sufficient to avoid atmospheric CO2 and water absorption features, since the gaussian ATREM atmospheric transformation analysis uses a constant residual that is not greatly affected by bandwidth. Obtaining sufficient upwelling radiance becomes problematic beyond 2350 nm, partially attributable to a spectrally broad atmospheric methane absorption feature, and likely a wide bandwidth would be required to acquire adequate signal for a 2330 nm band center on a spaceborne imaging system, although better analytic results would be achieved using a narrow bandwidth. The intermediate bands (2210, 2260 nm) showed little impact of atmospheric artifacts or absorption features over the full range of assessed bandwidths (10 to 70 nm). The NDTI, which was calculated using the same SWIR range as the LCPCDI (in addition to the 1610 nm OLI Band 6) was also relatively resistant to atmospheric effects, with the fourth lowest RPD of all indices.
Using proposed Landsat Next sensor specifications, we demonstrated that NEDρ uncertainties did not have a significant impact on obtaining accurate reflectance estimates for the 2040, 2100, 2210, and 2260 nm bands when considering a goal of SNR > 50. We were not able to make a direct SNR evaluation of the 2330 nm band but noted that this band had lower average upwelling spectral radiance values than the other four bands, leading to lower SNR values if all other factors are equal. Overall, observed signal at bandwidths of 10 to 70 nm, for agricultural targets under mid-latitude wintertime conditions, was found to be adequate to meet mission requirements and was not judged to be a significantly limiting factor.
Bandwidth choice depends upon a balance of factors, with narrow bands providing analytical specificity, wide bands providing additional signal, and the balance of precision and signal affecting the cost and feasibility of sensor design. For this manuscript, we present our main performance results using boxcar bandwidths of 20, 20, 40, 40, and 50 nm, respectively, for the 2040, 2100, 2210, 2260, and 2330 nm band centers, and using boxcar bandwidths of 30 nm for all bands. However, we also repeated the calculations using a variety of bandwidth combinations, with full results presented in the accompanying data release [44].
For the measurement of NPV cover, indices calculated from the boxcar spectra provided improved results compared to those calculated from the gaussian spectra (e.g., R2 = 0.81 vs. 0.78 for SINDRI, 0.77 vs. 0.75 for CAI; NDVI < 0.3) likely due to increased bandwidth specificity. While the best accuracies were achieved using 650 samples with a low level of green vegetation cover, and therefore minimal interference from vegetation water content and minimal physical masking of the field surface by growing vegetation, certain indices (CAI, SIDRI) also showed a high level of resistance to interference from green vegetation when using the dataset of 916 samples with full range of observed NDVI. A striking difference was observed between indices calculated using a simple difference (SIDRI, LCA_D), which exhibited resistance to green vegetation, and their analogs calculated using a ratio or a normalized difference (SIRRI, SINDRI, LCA_R), which displayed decreased performance and risk of over-prediction of NPV cover in the presence of green vegetation. Overall, the top-performing indices were SINDRI, SIRRI, SIDRI, CAI, and LCPCDI (R2 = 0.81 to 0.75) for samples with minimal green vegetation, and CAI and SIDRI (R2 = 0.77) for samples with a full range of green vegetation. In contrast, the broadband NDTI index calculated from Landsat 8 bands was moderately to poorly correlated with NPV cover (R2 = 0.44 and 0.01 under non-vegetated and vegetated conditions, respectively), indicating the increased effectiveness of narrowband SWIR indices for measurement of NPV and crop residue cover.
The findings of the soil and residue simulated spectral mixing analysis demonstrate that the narrowband SWIR NPV indices generally outperformed the broadband NDTI in terms of consistency across different NPV-soil pairs. The three difference indices (CAI, SIDRI, LCPCDI) demonstrated near-perfect linearity in their correlation with simulated fractional NPV, while the three ratio indices (SINDRI, SIRRI, NDTI) displayed reduced linearity, apparently because the normalization increased the relative spectral impact of the background soil fraction. Overall, the CAI, SIDRI, and LCPCDI displayed the greatest degree of linearity, indicating their robustness across soil and residue types. The indices that utilize the 2210 and 2260 nm bands effectively identify a reflectance decrease associated with NPV ligno-cellulose absorption. However, kaolinite, other clays, and micas with absorption features centered near 2200 nm are widespread components of soils in natural ecosystems, and some soils rich in kaolinite exhibited a reflectance increase in this region, while other soils in the dataset exhibited little difference between these spectral regions. Additional study is needed to control for the impact of soil minerals with absorption features in the 2200 nm region when characterizing NPV cover.
To evaluate mission continuity, the gaussian NPV spectral dataset was used to compare simulated reflectance for the current OLI Band 7 (2200 nm band center, 180 nm bandwidth) with mean reflectance acquired by the proposed Landsat Next band, using 30 nm bandwidths. The closest match with OLI Band 7 was provided by the LCPCDI bands (2100, 2210, and 2260 nm) with R2 of 0.99986 and slope of 1.00039, while the two bands associated with the SINDRI, SIRRI, and SIDRI indices (2210, 2260 nm) exhibited a tight correlation (R2 = 0.99961) but a slope that deviated somewhat from 1.000 (slope = 0.97653). The three bands associated with CAI (2040, 2100, and 2210 nm) displayed reduced correlation (R2 = 0.99612), larger residuals, and steeper slope (1.06660) because the 2040 band center was outside the range of OLI Band 7. The inclusion of atmospheric residuals and sensor noise did not affect results.
In addition to the 916 spectra dataset of agricultural targets, NPV assessment was conducted on 808 spectra collected from non-agricultural areas, with results included in the data release accompanying this manuscript [44]. The dataset included 129 spectra from California grassland, 60 spectra from Brazilian grassland, 595 spectra of California shrubs, and 24 spectra of poplar shrubs. Natural ecosystems with dominant green vegetation tend to exhibit a reflectance peak near 2200 nm with reflectance decreases to either side. Grassland targets do not uniformly display the decrease in reflectance from 2210 to 2260 nm that is measured by the SINDRI index, due to differences in biochemical composition and increased diversity of plant structure compared to agricultural settings. Overall, results for this dataset were similar to those for agricultural targets, with somewhat lower R2 and higher RMSE and similar comparative performance of the various indices, except that the NDRI68 index emerged as a strong performer in the non-agricultural dataset with NDVI < 0.3 (n = 45).
This study investigated the performance of five reflectance bands centered at 2040, 2100, 2210, 2260, and 2330 nm, which were the heritage band centers employed by previous instruments such as ASTER and WV3. However, ligno-cellulose absorption features vary spectrally according to the lignin to cellulose ratio, plant biochemical composition, and residue water content [19], and the heritage band centers are not an exact match to ligno-cellulose absorption maxima. Future analysis could examine precise placement of band center wavelengths, using original ASD surface reflectance spectra with and without MODTRAN transformation to simulate atmospheric absorption effects, in order to more accurately match the maxima and minima associated with observed ligno-cellulose absorption features, and thereby maximize the accuracy of NPV prediction.

5. Spectral Bands to Consider for the Landsat Next Mission

With regard to the selection of optimal spectral bands for the Landsat Next mission, there are four viable options to consider, with various tradeoffs:
(1)
Three bands at 2040, 2100, and 2210 nm (CAI index): Use of the CAI index is a well-established technique for determining the depth of the 2100 nm ligno-cellulose absorption feature and it performed well for samples with minimal green vegetation (NDVI < 0.3; R2 = 0.77). It was also the index most resistant to impacts from green vegetation (NDVI < 1.0; R2 = 0.71). However, the 2040 nm band center is positioned between two strong atmospheric absorption features associated with CO2 and water vapor, and therefore requires use of a narrow bandwidth (likely < = 20 nm for best results) as well as an accurate atmospheric correction since conversion from surface reflectance to at-sensor radiance had a strong impact on index values. A 30–50 nm bandwidth is likely adequate for the 2100 and 2210 nm bands.
(2)
Two bands at 2210 and 2260 nm (SINDRI, SIRRI, and SIDRI indices): The SINDRI index was the top performer in predicting agricultural NPV cover under non-vegetated conditions (NDVI <0.3; R2 = 0.81, boxcar spectra) and was also quite resistant to atmospheric interference. Its performance was greatly reduced in the presence of higher levels of green vegetation (NDVI < 1.0; R2 = 0.40). However, the SIDRI simple difference index appears to avoid the interference from green vegetation, maintaining a performance (NDVI < 1.0; R2 = 0.71) that was similar to CAI. Good results can likely be achieved at 30–50 nm bandwidth for these two bands.
(3)
Three bands at 2100, 2210, and 2260 nm (SINDRI, SIRRI, and SIDRI indices, as well as LCPCDI). While determination of NPV would focus on the SINDRI and SIDRI indices (2210 and 2260 nm), this three-band solution provides the greatest degree of mission continuity (convolved three-band reflectance was very similar to the current OLI Band 7) as well as the capability to employ the 2100 nm band in calculating spectral angle indices that could adjust for the presence of soil spectral absorption features in this range. Good results can likely be achieved by using a 30–50 nm bandwidth for each of the three bands.
(4)
Four bands at 2040, 2100, 2210, and 2260 nm (all of the above listed indices): This robust solution would support the calculation of SINDRI for conditions with minimal vegetation, and CAI for conditions with moderate vegetation, each being the best-performing index for those vegetation classes. Additionally, the abundance of bands would provide useful information to calibrate results to account for soil moisture content and mineral absorption features.
Any of these alternatives would provide a greatly improved capability for detecting crop residue cover based on characterization of ligno-cellulose absorption features centered near 2100 and 2300 nm, and could therefore be used to monitor the adoption of conservation tillage practices, as well as the effects of grassland management, through accurate global characterization of NPV, providing mission continuity and aiding in consistent and long term Earth observation while simultaneously advancing sensor technological capabilities and greatly improving the accuracy of satellite-based NPV monitoring with narrowband approaches.

Author Contributions

Conceptualization, W.D.H., C.S.T.D. and B.T.L.; methodology, W.D.H., C.S.T.D., G.S., B.T.L., P.D. and J.G.M.; formal analysis, W.D.H., B.T.L., P.D. and R.F.K.; investigation, W.D.H., C.S.T.D., G.S. and B.T.L.; resources, W.D.H.; data curation, W.D.H., B.T.L., P.D. and C.S.T.D.; writing—original draft preparation, W.D.H. and B.T.L.; writing—review and editing, W.D.H., B.T.L., C.S.T.D., Z.W., J.G.M., P.D. and R.F.K.; visualization, W.D.H. and B.T.L.; supervision, W.D.H.; project administration, W.D.H. and Z.W.; funding acquisition, W.D.H. All authors have read and agreed to the published version of the manuscript.

Funding

This project was supported by the U.S. Geological Survey Land Change Science Program within the Land Resources Mission Area; the U.S. Department of Agriculture-Agricultural Research Service, National Program 211; and the U.S. Department of Agriculture Lower Chesapeake Long Term Agricultural Research (LTAR) program.

Institutional Review Board Statement

Not applicable.

Informed Consent Statement

Not applicable.

Data Availability Statement

Data supporting this analysis are published in a USGS Data Release hosted on Science Base [44].

Conflicts of Interest

The authors declare no conflict of interest.

Disclaimer

Any use of trade, firm, or product names is for descriptive purposes only and does not imply endorsement by the U.S. Government.

Abbreviations

CAICellulose absorption index
GVGreen vegetation
LCALignin-cellulose absorption index
LCPCDILignin-cellulose peak centered difference index
NDTINormalized difference tillage index
NDVINormalized difference vegetation index
SIDRIShortwave infrared difference residue index
SINDRIShortwave infrared normalized difference residue index
SIRRIShortwave infrared ratio residue index
SWIRShortwave infrared wavelengths

References

  1. Lal, R.; Bruce, J.P. The potential of world cropland soils to sequester C and mitigate the greenhouse effect. Environ. Sci. Policy 1999, 2, 177–185. [Google Scholar] [CrossRef]
  2. Magdoff, F. Soil Organic Matter Management Strategies. In Soil Organic Matter in Sustainable Agriculture; CRC Press: Boca Raton, FL, USA, 2004. [Google Scholar]
  3. Palm, C.; Blanco-Canqui, H.; DeClerck, F.; Gatere, L.; Grace, P. Conservation agriculture and ecosystem services: An overview. Agric. Ecosyst. Environ. 2014, 187, 87–105. [Google Scholar] [CrossRef] [Green Version]
  4. Beeson, P.C.; Daughtry, C.S.T.; Wallander, S.A. Estimates of conservation tillage practices using landsat archive. Remote Sens. 2020, 12, 2665. [Google Scholar] [CrossRef]
  5. CTIC (Conservation Technology Information Center). Procedures for Using the Cropland Roadside Transect Survey for Obtaining Tillage Crop Residue Data; Conservation Technology Information Center, Purdue University: West Lafayette, IN, USA, 2009; Available online: http://www.ctic.org (accessed on 2 June 2021).
  6. Bonham, C.D. Measurements for Terrestrial Vegetation; John Wiley & Sons: New York, NY, USA, 1989; ISBN 0471048801. [Google Scholar]
  7. Morrison, J.E.; Huang, C.; Lightle, D.T.; Daughtry, C.S.T. Residue Cover Measurement Techniques. J. Soil Water Conserv. 1993, 48, 478–483. [Google Scholar]
  8. Booth, D.T.; Cox, S.E.; Berryman, R.D. Point sampling digital imagery with “Samplepoint”. Environ. Monit. Assess. 2006, 123, 97–108. [Google Scholar] [CrossRef] [PubMed]
  9. Daughtry, C.S.T.; Hunt, E.R., Jr.; Doraiswamy, P.C.; McMurtrey, J.E. Remote sensing the spatial distribution of crop residues. Agron. J. 2005, 97, 864–871. [Google Scholar] [CrossRef]
  10. Serbin, G.; Hunt, E.R., Jr.; Daughtry, C.S.T.; McCarty, G.W.; Doraiswamy, P.C. An improved ASTER index for remote sensing of crop residue. Remote Sens. 2009, 1, 971–991. [Google Scholar] [CrossRef] [Green Version]
  11. Hively, W.D.; Lamb, B.T.; Daughtry, C.S.T.; Shermeyer, J.; McCarty, G.W.; Quemada, M. Mapping crop residue and tillage intensity using WorldView-3 satellite shortwave infrared residue indices. Remote Sens. 2018, 10, 1657. [Google Scholar] [CrossRef] [Green Version]
  12. Tucker, C.J. Red and photographic infrared linear combinations monitoring vegetation. Remote Sens. Environ. 1979, 8, 127–150. [Google Scholar] [CrossRef] [Green Version]
  13. Prabhakara, K.; Dean Hively, W.; McCarty, G.W. Evaluating the relationship between biomass, percent groundcover and remote sensing indices across six winter cover crop fields in Maryland, United States. Int. J. Appl. Earth Obs. Geoinf. 2015, 39, 88–102. [Google Scholar] [CrossRef] [Green Version]
  14. Serbin, G.; Daughtry, C.S.T.; Hunt, E.R., Jr.; Brown, D.J.; McCarty, G.W. Effect of Soil Spectral Properties on Remote Sensing of Crop Residue Cover. Soil Sci. Soc. Am. J. 2009, 73, 1545. [Google Scholar] [CrossRef]
  15. Daughtry, C.S.T.; Serbin, G.; Reeves, J.B.; Doraiswamy, P.C.; Hunt, E.R., Jr. Spectral reflectance of wheat residue during decomposition and remotely sensed estimates of residue cover. Remote Sens. 2010, 2, 416–431. [Google Scholar] [CrossRef] [Green Version]
  16. Daughtry, C.S.T.; Hunt, E.R., Jr. Mitigating the effects of soil and residue water contents on remotely sensed estimates of crop residue cover. Remote Sens. Environ. 2008, 112, 1647–1657. [Google Scholar] [CrossRef]
  17. Elvidge, C.D. Visible and near infrared reflectance characteristics of dry plant materials. Int. J. Remote Sens. 1990, 11, 1775–1795. [Google Scholar] [CrossRef]
  18. Daughtry, C.S.T. Agroclimatology: Discriminating crop residues from soil by shortwave infrared reflectance. Agron. J. 2001, 93, 125–131. [Google Scholar] [CrossRef]
  19. Kokaly, R.; Asner, G.P.; Ollinger, S.V.; Martin, M.E.; Wessman, C.A. Characterizing canopy biochemistry from imaging spectroscopy and its application to ecosystem studies. Remote Sens. Environ. 2009, 113, 78–91. [Google Scholar] [CrossRef]
  20. Nagler, P.L.; Daughtry, C.S.T.; Goward, S.N. Plant litter and soil reflectance. Remote Sens. Environ. 2000, 71, 207–215. [Google Scholar] [CrossRef]
  21. Beeson, P.C.; Daughtry, C.S.T.; Hunt, E.R., Jr.; Akhmedov, B.; Sadeghi, A.M.; Karlen, D.L.; Tomer, M.D. Multispectral satellite mapping of crop residue cover and tillage intensity in Iowa. J. Soil Water Conserv. 2016, 71, 385–395. [Google Scholar] [CrossRef] [Green Version]
  22. Jin, X.; Ma, J.; Wen, Z.; Song, K. Estimation of maize residue cover using Landsat-8 OLI image spectral information and textural features. Remote Sens. 2015, 7, 14559–14575. [Google Scholar] [CrossRef] [Green Version]
  23. Najafi, P.; Navid, H.; Feizizadeh, B.; Eskandari, I.; Blaschke, T. Fuzzy object-based image analysis methods using Sentinel-2A and Landsat-8 data to map and characterize soil surface residue. Remote Sens. 2019, 11, 2583. [Google Scholar] [CrossRef] [Green Version]
  24. Thoma, D.P.; Gupta, S.C.; Bauer, M.E. Evaluation of optical remote sensing models for crop residue cover assessment. J. Soil Water Conserv. 2004, 59, 224–233. [Google Scholar]
  25. Van Deventer, A.P.; Ward, A.D.; Gowda, P.M.; Lyon, J.G. Using thematic mapper data to identify contrasting soil plains and tillage practices. Photogramm. Eng. Remote Sensing. 1997, 63, 87–93. [Google Scholar]
  26. Zheng, B.; Campbell, J.B.; Serbin, G.; Galbraith, J.M. Remote sensing of crop residue and tillage practices: Present capabilities and future prospects. Soil Tillage Res. 2014, 138, 26–34. [Google Scholar] [CrossRef]
  27. Gelder, B.K.; Kaleita, A.L.; Cruse, R.M. Estimating mean field residue cover on midwestern soils using satellite imagery. Agron. J. 2009, 101, 635–643. [Google Scholar] [CrossRef]
  28. Hively, W.D.; Shermeyer, J.; Lamb, B.T.; Daughtry, C.T.; Quemada, M.; Keppler, J. Mapping crop residue by combining landsat and worldview-3 satellite imagery. Remote Sens. 2019, 11, 1857. [Google Scholar] [CrossRef] [Green Version]
  29. Laamrani, A.; Joosse, P.; McNairn, H.; Berg, A.A.; Hagerman, J.; Powell, K.; Berry, M. Assessing soil cover levels during the non-growing season using multitemporal satellite imagery and spectral unmixing techniques. Remote Sens. 2020, 12, 1397. [Google Scholar] [CrossRef]
  30. Ding, Y.; Zhang, H.; Wang, Z.; Xie, Q.; Wang, Y.; Liu, L.; Hall, C.C. A Comparison of Estimating Crop Residue Cover from Sentinel-2 Data Using Empirical Regressions and Machine Learning Methods. Remote Sens. 2020, 12, 1470. [Google Scholar] [CrossRef]
  31. Yue, J.; Tian, Q.; Dong, X.; Xu, K.; Zhou, C. Using hyperspectral crop residue angle index to estimate maize and winter-wheat residue cover: A laboratory study. Remote Sens. 2019, 11, 807. [Google Scholar] [CrossRef] [Green Version]
  32. Quemada, M.; Daughtry, C.S.T. Spectral indices to improve crop residue cover estimation under varying moisture conditions. Remote Sens. 2016, 8, 660. [Google Scholar] [CrossRef] [Green Version]
  33. Quemada, M.; Hively, W.D.; Daughtry, C.S.T.; Lamb, B.T.; Shermeyer, J. Improved crop residue cover estimates obtained by coupling spectral indices for residue and moisture. Remote Sens. Environ. 2018, 206, 33–44. [Google Scholar] [CrossRef]
  34. Eskandari, I.; Navid, H.; Rangzan, K. Evaluating spectral indices for determining conservation and conventional tillage systems in a vetch-wheat rotation. Int. Soil Water Conserv. Res. 2016, 4, 93–98. [Google Scholar] [CrossRef] [Green Version]
  35. Serbin, G.; Hunt, E.R., Jr.; Daughtry, C.S.T.; McCarty, G.W. Assessment of spectral indices for cover estimation of senescent vegetation. Remote Sens. Lett. 2013, 4, 552–560. [Google Scholar] [CrossRef]
  36. Serbin, G.; Daughtry, C.S.T.; Hunt, E.R., Jr.; Reeves, J.B.; Brown, D.J. Effects of soil composition and mineralogy on remote sensing of crop residue cover. Remote Sens. Environ. 2009, 113, 224–238. [Google Scholar] [CrossRef]
  37. Transon, J.; d’Andrimont, R.; Maugnard, A.; Defourny, P. Survey of hyperspectral Earth Observation applications from space in the Sentinel-2 context. Remote Sens. 2018, 10, 157. [Google Scholar] [CrossRef] [Green Version]
  38. Bannari, A.; Staenz, K.; Champagne, C.; Khurshid, K.S. Spatial variability mapping of crop residue using hyperion (EO-1) hyperspectral data. Remote Sens. 2015, 7, 8107–8127. [Google Scholar] [CrossRef] [Green Version]
  39. Pepe, M.; Pompilio, L.; Gioli, B.; Busetto, L.; Boschetti, M. Detection and Classification of Non-Photosynthetic Vegetation from PRISMA Hyperspectral Data in Croplands. Remote Sens. 2020, 12, 3903. [Google Scholar] [CrossRef]
  40. Cawse-Nicholson, K.; Townsend, P.A.; Schimel, D.; Assiri, A.M.; Blake, P.L.; Buongiorno, M.F.; Campbell, P.; Carmon, N.; Casey, K.A.; Correa-Pabón, R.E.; et al. NASA’s surface biology and geology designated observable: A perspective on surface imaging algorithms. Remote Sens. Environ. 2021, 257, 112349. [Google Scholar] [CrossRef]
  41. NGAC. Recommendations for Possible Future U.S. Global Land Data Collection Missions Beyond Landsat 9: A Report of the National Geospatial Advisory Committee Landsat Advisory Group, April 2018. Available online: https://www.fgdc.gov/ngac/meetings/april-2018/ngac-landsat-future-missions-recommendations-paper.pdf (accessed on 2 June 2021).
  42. Wu, Z.; Snyder, G.; Vadnais, C.; Arora, R.; Babcock, M.; Stensaas, G.; Doucette, P.; Newman, T. User needs for future Landsat missions. Remote Sens. Environ. 2019, 231, 111214. [Google Scholar] [CrossRef]
  43. Dennison, P.E.; Qi, Y.; Meerdink, S.K.; Kokaly, R.F.; Thompson, D.R.; Daughtry, C.S.T.; Quemada, M.; Roberts, D.A.; Gader, P.D.; Wetherley, E.B.; et al. Comparison of methods for modeling fractional cover using simulated satellite hyperspectral imager spectra. Remote Sens. 2019, 11, 2072. [Google Scholar] [CrossRef]
  44. Hively, W.D.; Lamb, B.T.; Daughtry, C.S.T.; Serbin, G.; Dennison, P. Reflectance Spectra of Agricultural Field Conditions Supporting Remote Sensing Evaluation of Non-Photosynthetic Vegetative Cover. 2021. (U.S. Geological Survey Data Release. Available online: https://doi.org/10.5066/P9XK3867 (accessed on 14 September 2021). [CrossRef]
  45. ASD Incorporated/Malvern Panalytical, Westborough, MA, USA. Available online: www.malvernpanalytical.com (accessed on 2 June 2021).
  46. Spectralon; Labsphere, Inc.: North Sutton, NH, USA, 1994.
  47. Thompson, D.R.; Gao, B.C.; Green, R.O.; Roberts, D.A.; Dennison, P.E.; Lundeen, S.R. Atmospheric correction for global mapping spectroscopy: ATREM advances for the HyspIRI preparatory campaign. Remote Sens. Environ. 2015, 167, 64–77. [Google Scholar] [CrossRef]
  48. Berk, A.; Conforti, P.; Kennett, R.; Perkins, T.; Hawes, F.; Van Den Bosch, J. MODTRAN® 6: A major upgrade of the MODTRAN® radiative transfer code. In Proceedings of the 2014 6th Workshop on Hyperspectral Image and Signal Processing: Evolution in Remote Sensing (WHISPERS), Lausanne, Switzerland, 24–27 June 2014; IEEE: Piscataway, NJ, USA; pp. 1–4. [Google Scholar]
  49. Brown, D.J.; Shepherd, K.D.; Walsh, M.G.; Dewayne Mays, M.; Reinsch, T.G. Global soil characterization with VNIR diffuse reflectance spectroscopy. Geoderma 2006, 132, 273–290. [Google Scholar] [CrossRef]
  50. Kokaly, R.F.; King, T.V.V.; Hoefen, T.M. Surface Mineral Maps of Afghanistan Derived from HyMap Imaging Spectrometer Data, Version 2: U.S. Geological Survey Data Series 787, 29p, 2013. Available online: https://pubs.usgs.gov/ds/787/ (accessed on 6 August 2021).
  51. Graham, G.E.; Kokaly, R.F.; Kelley, K.D.; Hoefen, T.M.; Johnson, M.R.; Hubbard, B.E. Application of imaging spectroscopy for mineral exploration in Alaska: A study over porphyry Cu deposits in the eastern Alaska Range. Econ. Geol. 2018, 113, 489–510. [Google Scholar] [CrossRef]
  52. The ASTER Mineral Map of Australia, Cudahy et al., Auscope Discovery Portal. Available online: http://portal.auscope.org.au/ (accessed on 6 August 2021).
Figure 1. Example spectra for crop residue (NPV), soil, and green vegetation as surface reflectance and as surface reflectance with addition of simulated sensor noise and atmospheric correction residuals (atm) for (a) 400–2500 nm wavelength range, and (b) 1950–2450 nm wavelength range for the same spectra, showing the five shortwave infrared (SWIR) bands under consideration at 10, 30, and 50 nm bandwidths (grey bars) as well as current Landsat Operational Land Imager (OLI) bands (tan bars). Note the decreased crop residue reflectance at 2100 nm and 2300 nm due to ligno-cellulose absorption, with bordering reflectance maxima at 2000 nm and 2210 nm. The five narrow SWIR bands under consideration capture these differences in spectral reflectance, which are otherwise convolved into a single Landsat 8 OLI Band 7.
Remotesensing 13 03718 g001
Figure 2. Workflow, including data compilation, atmospheric and signal-to-noise assessment, evaluation of index performance, background soil effects, and determination of mission continuity for proposed bandwidths and band centers associated with the top-performing indices.
Remotesensing 13 03718 g002
Figure 3. Relative percent difference of reflectance between original (org) and atm spectra, indicating residual atmospheric interference for five SWIR bands, at bandwidths of 10, 30, and 50 nm, as well as OLI Band 7, at 180 nm bandwidth. The x axis indicates band center wavelength followed by bandwidth (nm). The generally negative RPD values are unique to the correction scheme in [43]. The relative differences between bands provides a performance metric of robustness to atmospheric constituents with 2040 nm band being notably impacted by CO2 absorption.
Remotesensing 13 03718 g003
Figure 4. Relative impact of atmospheric residuals and sensor noise on SWIR NPV indices, computed using bandwidths with low RPD as shown in Figure 3 (2040: 10 nm, 2100: 10 nm, 2210: 30 nm, 2260: 30 nm, 2330 nm: 50 nm). See Table 1 for index definitions. The results in this figure are unique to a single atmospheric correction set of assumptions [43] and do not represent temporal or spatial atmospheric variability.
Remotesensing 13 03718 g004
Figure 5. (a) MODTRAN input mean surface reflectance spectra (Refl., solid lines) and output mean at-sensor radiance spectra (Rad., dashed lines), plotted with the five considered Landsat Next bands at various bandwidths. (b) MODTRAN mean at-sensor radiance spectra averaged by bandwidths of 10, 30, or 50 nm for the considered Landsat Next bands. The 2040 nm band is increasingly impacted by atmospheric CO2 absorption at wider bandwidths.
Remotesensing 13 03718 g005
Figure 6. Observed WorldView-3 (WV3) shortwave infrared (SWIR) radiance under springtime conditions (boxplots) compared to simulated minimum radiance needed to achieve sensor signal-to-noise ratio (SNR) > 50 for Landsat Next (LSN) proposed bands at 2040 nm, 2100 nm, and 2210 nm (horizontal lines). SNR calculations for the ~2330 nm band were not included in Landsat Next radiometric simulations.
Remotesensing 13 03718 g006
Figure 7. Relative percent difference for shortwave infrared (SWIR) band reflectance computed from difference of reflectance with NEDρ as positive errors/uncertainties. Negative uncertainties have identical absolute values for RPD. This NEDρ uncertainty generally falls in a range of +/−0.5% to +/−2.5% RPD reflectance with +/−1% median RPD reflectance. Bands were calculated using boxcar spectra at 20, 20, 40, 40, 50 nm bandwidth for the 2040, 2100, 2210, 2260, and 2330 nm bands, respectively. An approximation of OLI Band 7 (~OLI-7) was computed from mean of 2100 nm, 2210 nm, and 2260 nm after +/− NEDρ calculation.
Remotesensing 13 03718 g007
Figure 8. The impact of SNR NEDρ uncertainty on the generation of NPV indices, using bandwidths described in Figure 7. Note that the indices exhibit differences in +/− absolute error. The higher RPD values of NDTI are likely attributable to OLI band 6 NEDρ values being substantially lower than values for SWIR bands > 2000 nm that drive an equivalent OLI Band 7, resulting in greater relative differences.
Remotesensing 13 03718 g008
Figure 9. Scatterplots of selected shortwave infrared (SWIR) indices and fraction non-photosynthetic vegetation (NPV) cover, relative to amount of vegetation (NDVI), using 916 spectra with NDVI < 1.0 (650 spectra with NDVI < 0.3)). See Table 1 for index definitions. Indices were calculated using boxcar spectra at 20, 20, 40, 40, 50 nm bandwidth for the 2040, 2100, 2210, 2260, and 2330 nm bands, respectively.
Remotesensing 13 03718 g009
Figure 10. R-value of six select SWIR NPV indices showing that the three indices based on differences (i.e., CAI, LCPCDI, and SIDRI) have near-perfect linearity (R-value = 1.0) across all simulated soil-residue spectra combinations. In contrast, ratio and normalized difference indices (i.e., NDTI, SIRRI, SINDRI) do not show this near-perfect linearity. Note that the soil-residue spectra combinations for all indices are ordered identically based on decreasing NDTI R-values and that SINDRI and SIRRI follow similar general patterns of decreasing R-value. Values in black at the bottom of the NDTI plots indicate seven soils with negative R values. The x-axis denotes the range of 69 crop residue spectra (corn, soybean, and wheat), while the y-axis denotes the range of 854 soil spectra collected from a broad variety of soils.
Remotesensing 13 03718 g010
Figure 11. Slope of six select SWIR NPV indices. Ideal performance shown by color similarly (slope similarity) across different simulated soil-residue spectra combinations for each index. Note that indices cannot be directly compared to one another because differences in index scaling impacts slope. The x-axis denotes the range of 69 crop residue spectra (corn, soybean, and wheat), while the y-axis denotes the range of 854 soil spectra collected from a broad variety of soils.
Remotesensing 13 03718 g011
Figure 12. Example soil spectra with crop residue spectra for comparison. Note that some soils exhibit a 2200 nm reflectance decrease attributed to absorption by minerals such as montmorillonite, muscovite and illite, with variable absorption depending on soil type. The blue and yellow spectra represent kaolinite-rich soils, with a positive NDTI-fractional residue trend in blue, and a negative NDTI-fractional residue trend in yellow. Soils with overall low reflectance are noted as dark soils shown as thick brown lines. Crop residues are spectrally distinguished from soils based on a reflectance decrease from 2210 nm to 2260 nm associated with ligno-cellulose absorption. In contrast, soils show either consistent reflectance between these regions or minor reflectance increases as a function of wavelength.
Remotesensing 13 03718 g012
Figure 13. Spectral reflectance for calculated OLI Band 7 (2200 nm center, 180 nm bandwidth) compared to the convolution of proposed Landsat Next bands, with high R2, low standard error (SE) and slopes nearest to 1.000 indicating the best mission continuity. The various two- and three-band convolutions displayed here are associated with the Shortwave Infrared Normalized Difference Index (SINDRI), the Lignin-Cellulose Peak Centered Difference Index (LCPCDI), and the two rightmost (longest-wavelength) bands of the Cellulose Absorption Index (CAI_R), calculated from original gaussian surface reflectance spectra, as well as from gaussian spectra transformed to include simulated residuals of atmospheric correction and sensor noise (atm).
Remotesensing 13 03718 g013
Table 1. Equations for the 13 calculated shortwave infrared (SWIR) reflectance indices: CAI-L-Cellulose Absorption Index (left shoulder); CAI-Cellulose Absorption Index; CAI-R-Cellulose Absorption Index (right shoulder); LCPCDI-Cellulose Side Peak Difference Index; SINDRI–Shortwave Infrared Normalized Difference Residue Index; SIRRI–Shortwave Infrared Ratio Residue Index; SIDRI–Shortwave Infrared Difference Residue Index; LCA_D-Lignin Cellulose Absorption Difference Index; LCA_R-Lignin Cellulose Absorption Ratio Index; NDRI68-Normalized Difference Residue Index (WV3 bands 6 and 8); NDRI78-Normalized Difference Residue Index (WV3 bands 7 and 8); NDTI-LSN-Normalized Difference Tillage Index (using convolved Landsat Next proposed bands along with OLI band 6 bandwidth mean reflectance calculated from hyperspectral dataset); NDTI-OLI-Normalized Difference Tillage Index (using OLI bands 6 and 9 bandwidth mean reflectance calculated from hyperspectral dataset).
IndexBand Center Wavelength (nm)Equation# BandsTypeCitation
20402100221022602330
CAI_Lxx (2040 − 2100)/(2040 + 2100) 2normalized differencenew
CAIxxx 100 * (0.5 *(2040 + 2210) − 2100) 3difference[20]
CAI_R xx (2210 − 2100)/(2210 + 2100) 2normalized differencenew
LCPCDI xxx (2 * 2210) − (2100 + 2260) 3differencenew
SINDRI xx (2210 − 2260)/(2210 + 2260) 2normalized difference[10]
SIRRI xx (2210/2260) 2rationew
SIDRI xx (2210 − 2260) 2differencenew
LCA_D xx x (2 * 2210) − (2100 + 2330) 3difference[9]
LCA_R xx x (2 * 2210)/(2100 + 2330) 3ratio[11]
NDRI68 x x (2210 − 2330)/(2210 + 2330) 2normalized differencenew
NDRI78 xx (2260 − 2330)/(2260 + 2330) 2normalized differencenew
NDTI-OLI * -x- (1609 − 2201)/(1609 + 2201) 2normalized difference[25]
NDTI-LSN ** -x- (1609 − ((2100 + 2210 + 2260)/3))/(1609 − ((2100 + 2210 + 2260)/3)) 4normalized difference-
* using simulated Landsat 8 OLI bands 6 (1609 nm) and 7 (2201 nm). ** using simulated Landsat 8 OLI band 6 (1609 nm) and average of Landsat Next proposed bands 2100, 2210, and 2260.
Table 2. Correlation (R2) and root mean squared error (RMSE) between shortwave infrared (SWIR) indices and fractional cover of non-photosynthetic vegetation (NPV), green vegetation (GV), and soil, as well as NDVI, for datasets limited to NDVI < 0.3 (n = 640) and to the full range of NDVI < 1.0 (n = 619). See Table 1 for index definitions. Derived from boxcar spectra using 20, 20, 40, 40, and 40 nm bandwidths, respectively, for the 2040, 2100, 2210, 2260, and 2330 nm band centers.
R2
NPVNDVIGVSoil
IndexNDVI < 0.3NDVI < 1.0NDVI < 0.3NDVI < 1.0NDVI < 0.3NDVI < 1.0NDVI < 0.3NDVI < 1.0
SINDRI0.810.400.280.160.020.100.780.77
SIRRI0.810.390.270.160.020.100.780.77
SIDRI0.770.700.210.000.030.010.730.52
CAI0.770.710.190.000.050.020.710.49
LCA_D0.760.460.350.100.010.040.740.68
LCPCDI0.750.490.350.080.020.020.720.66
NDRI680.690.030.380.610.000.540.680.58
LCA_R0.630.000.410.670.000.610.620.49
CAI_R0.510.000.430.660.000.580.500.44
NDTI_OLI0.440.010.400.850.000.700.450.36
CAI_L0.400.400.000.560.050.600.360.00
NDTI_LSN0.290.010.210.650.010.650.310.32
NDRI780.240.020.300.750.020.710.270.30
RMSE
NPVNDVIGVSoil
IndexNDVI < 0.3NDVI < 1.0NDVI < 0.3NDVI < 1.0NDVI < 0.3NDVI < 1.0NDVI < 0.3NDVI < 1.0
SINDRI0.130.240.030.170.050.250.140.16
SIRRI0.130.250.030.170.050.250.140.16
SIDRI0.150.170.030.190.050.270.160.22
CAI0.150.170.030.190.050.260.160.23
LCA_D0.150.230.030.180.050.260.150.18
LCPCDI0.150.220.030.180.050.260.160.19
NDRI680.170.310.030.120.050.180.170.21
LCA_R0.190.310.030.110.050.170.190.23
CAI_R0.210.310.030.110.050.170.220.24
NDTI_OLI0.230.310.030.070.050.150.230.26
CAI_L0.240.240.040.130.050.170.240.32
NDTI_LSN0.260.310.030.110.050.160.250.27
NDRI780.270.310.030.100.050.150.260.27
Note: bold text indicates top two performing indices in each class of green vegetated cover (NDVI < 0.3 and NDVI < 1.0).
Table 3. Shortwave infrared (SWIR) index performance measures (R2, RMSE) for prediction of fractional non-photosynthetic vegetation (NPV) cover, for gaussian surface reflectance spectra and for gaussian spectra modified to simulate residual artifacts of atmospheric calibration, and sensor noise. Indices were derived from gaussian spectra using 30 nm bandwidth in all bands.
Surface ReflectanceWith Atmospheric Residuals
NDVI < 0.3NDVI < 1.0NDVI < 0.3NDVI < 1.0
IndexR2RMSER2RMSER2RMSER2RMSE
SINDRI0.780.140.390.250.770.150.360.25
SIRRI0.780.140.380.250.770.150.350.25
CAI0.750.150.680.180.760.150.600.20
SIDRI0.740.160.670.180.720.160.670.18
LCA_D0.730.160.440.240.730.160.460.23
LCPCDI0.690.170.060.310.680.170.060.31
NDRI680.670.180.030.310.660.180.030.31
LCA_R0.610.190.000.310.600.190.000.31
CAI_R0.500.220.000.310.490.220.000.31
NDTI_OLI0.420.230.010.310.420.230.010.31
NDTI_LSN0.410.240.010.310.410.240.010.31
CAI_L0.380.240.370.250.360.240.370.25
NDRI780.210.270.020.310.200.270.020.31
Note: bold text indicates top two performing indices in each NDVI class.
Publisher’s Note: MDPI stays neutral with regard to jurisdictional claims in published maps and institutional affiliations.

