Article

Changing Pattern of Water Level Trends in Eurasian Endorheic Lakes as a Response to the Recent Climate Variability

1
Department of Ecohydrology, Leibniz-Institute of Freshwater Ecology and Inland Fisheries, 12587 Berlin, Germany
2
College of Global Climate and Earth System Science, Beijing Normal University, Beijing 100875, China
3
Institute of Continuing Education, Yassawi International Kazakh-Turkish University, Turkestan 161200, Kazakhstan
*
Author to whom correspondence should be addressed.
Remote Sens. 2021, 13(18), 3705; https://doi.org/10.3390/rs13183705
Submission received: 29 July 2021 / Revised: 8 September 2021 / Accepted: 11 September 2021 / Published: 16 September 2021
(This article belongs to the Section Biogeosciences Remote Sensing)

Abstract

:
Lake level is a sensitive integral indicator of climate change on regional scales, especially in enclosed endorheic basins. Eurasia contains the largest endorheic zone with several large terminal lakes, whose water levels recently underwent remarkable variations. To address the patterns of these variations and their links to the climate change, we investigated the variability of levels in 15 lakes of three neighboring endorheic regions—Central Asia, Tibetan Plateau, and Mongolian Plateau. Satellite altimetry revealed a heterogeneous pattern among the regions during 1992–2018: lake levels increased significantly in Central Asia and the Tibetan Plateau but decreased on the Mongolian Plateau. The shifts to the increasing trend were detected since 1997 in Central Asia, since 1998 in the southern part of the Tibetan Plateau, and since 2005 in its northern part. The shift in air temperatures around 1997 and the precipitation shifts around 1998 and 2004 contributed to the trend’s turning points, with precipitation being the major contributor to the heterogeneous pattern of lake levels. Our findings reveal the linkage of the heterogeneous pattern of lake levels to climatic factors in the endorheic basins, providing a further understanding of the hydrological regime in the Eurasian endorheic zone and its sensitivity to climate change.

Graphical Abstract

1. Introduction

An endorheic basin is a closed or internal drainage system without an outflow into an ocean or a sea. The closed character of the hydrological cycle makes endorheic basins especially sensitive to basin-scale climate variations. Endorheic basins are inherent features of intracontinental arid and semiarid regions. Surface runoff in endorheic basins typically accumulates in large terminal lakes; the largest number of endorheic lakes worldwide is concentrated on the continent of Eurasia, covering Central Asia (CA), the Tibetan Plateau (TP), and the Mongolian Plateau (MP). The lake levels in those regions present “end points”, accumulating multiple responses of the basin-scale water balance, and are therefore considered to be one of the most sensitive indicators for regional response to climate change. Endorheic lakes play an important role in maintaining biodiversity and providing valuable water support for ecosystem services [1,2]. The endorheic lakes in Mongolia are the main water resource for endangered species and migratory waterfowl [3,4].
The lakes in Central Asia are important for local agriculture, vegetation, and ecology [5]. The pristine lakes of the Tibetan Plateau that remain generally undisturbed by anthropogenic activities have gained attention as “sentinels” of regional climate change [6,7,8,9]. Several recent studies have indicated significant climate variations in CA, TP, and MP, such as the warmer temperature [10], a weakened aridity in Central Asia [11], and a wetter environment in the central part of the Tibetan Plateau [12]. The corresponding changes in the large-scale hydrological cycle [13] affect the water levels of the terminal endorheic lakes as integrated indicators of the hydrological cycle respond to climate change [14]. The Eurasian endorheic zone is affected by several global circulation patterns: Central Asia and the Mongolian Plateau are influenced by westerlies, whereas the Tibetan Plateau is affected by the intersection of the westerlies and the monsoonal system. Therefore, the water levels of the endorheic lakes in the three large continental regions are expected to have heterogeneous responses to global change. Several previous studies [14,15,16,17,18] have investigated water level dynamics in terminal lakes with a projection on climate change. However, no attempt has been made to date to compare the responses of neighboring endorheic basins covering the largest continental area. Such a comparative analysis of lake changes at the regional scale can hint at global tendencies in climate change. With this purpose in mind, we selected five lakes in Central Asia, seven lakes in the Tibetan Plateau, and three lakes in the Mongolia Plateau as objects in order to investigate changes in their water levels and to reveal their links to the regional climatic patterns. In-situ data on lake water levels and relevant meteorological records are extremely scarce in this area compared to those in other parts of the world. The availability of meteorological records in Central Asia were limited for the past 30 years, since many meteorological stations were discontinued since the Soviet Union collapsed [19]. The gauge stations in the Tibetan Plateau were also limited due to the harsh environment and high elevation. The rapid development of remote sensing technology has provided an opportunity to collect continuous data for lakes in recent decades, especially at a large regional scale. In particular, satellite altimetry data has developed as an alternative tool for lake level estimation. Several studies have applied time-series satellite altimetry data to detect lake level change [6,16,20,21,22,23]. There are two major categories of satellite altimeter data: laser- and radar-based. The traditional radar altimetry missions (TOPEX/Poseidon, Jason, ERS, ENVISAT, etc.,) have been collecting lake level data since October 1992, with the revisiting period of 10 days (for TOPEX/Poseidon, Jason-1, Jason-2) or 35 days (Envisat, ERS-2), and the footprint diameters of 2–4 km. Compared with radar altimeters, the laser altimeter missions (ICESat/ICESat-2 and CryoSat-2) have a longer revisit period, e.g., 91 days for ICESat/ICESat-2, and a relatively denser ground track (0.07 km footprint diameter for ICESat/ICESat-2), and has been collecting data since 2003.
The ‘dry-gets-drier’ and ‘wet-gets-wetter’ pattern has been recognized across the globe as a part of a global change [24,25]. Previous studies have reported a drying trend in CA and a warming trend in MP [26], and a tendency for warmer and wetter climates in western Kyrgyzstan zones and Tibetan Plateau [27,28], especially after 1997 [15]. Air temperature and precipitation were found to be the main factors affecting the changes in the water level of most lakes in TP [16], CA [29,30], and MP [15,28]. This temperature increase over a lake basin could accelerate the melting rate of snow and glaciers, but also lengthen the period of melting, providing lakes with more water. An increase in precipitation supplies water to lakes directly as well as via surface and groundwater runoff. To qualify the reasons for the heterogeneous patterns observed in the lake water levels, we examined the relationship between the two major climatic factors—precipitation and air temperature—and the water level of terminal lakes.
The combination of different altimetry satellites can increase the spatial coverage of lakes and extend the temporal resolution span to nearly thirty years. There are several global databases that are available to provide water level time series of inland water bodies by merging different altimeter missions. In our study, we employed three global datasets, namely the Hydroweb dataset, the Global Reservoir and Lake Monitor (G-REALM), and the Database for Hydrological Time Series of Inland Waters (DAHITI), to (1) investigate the interannual characteristics of lake level in Eurasian lakes, (2) compare the spatial patterns in lake water levels in three adjacent regions, and (3) assess the relationship between lake dynamics and climatic factors. Finally, we discuss the potential climate drivers for the spatial heterogeneity of lake-level variations.

2. Materials and Methods
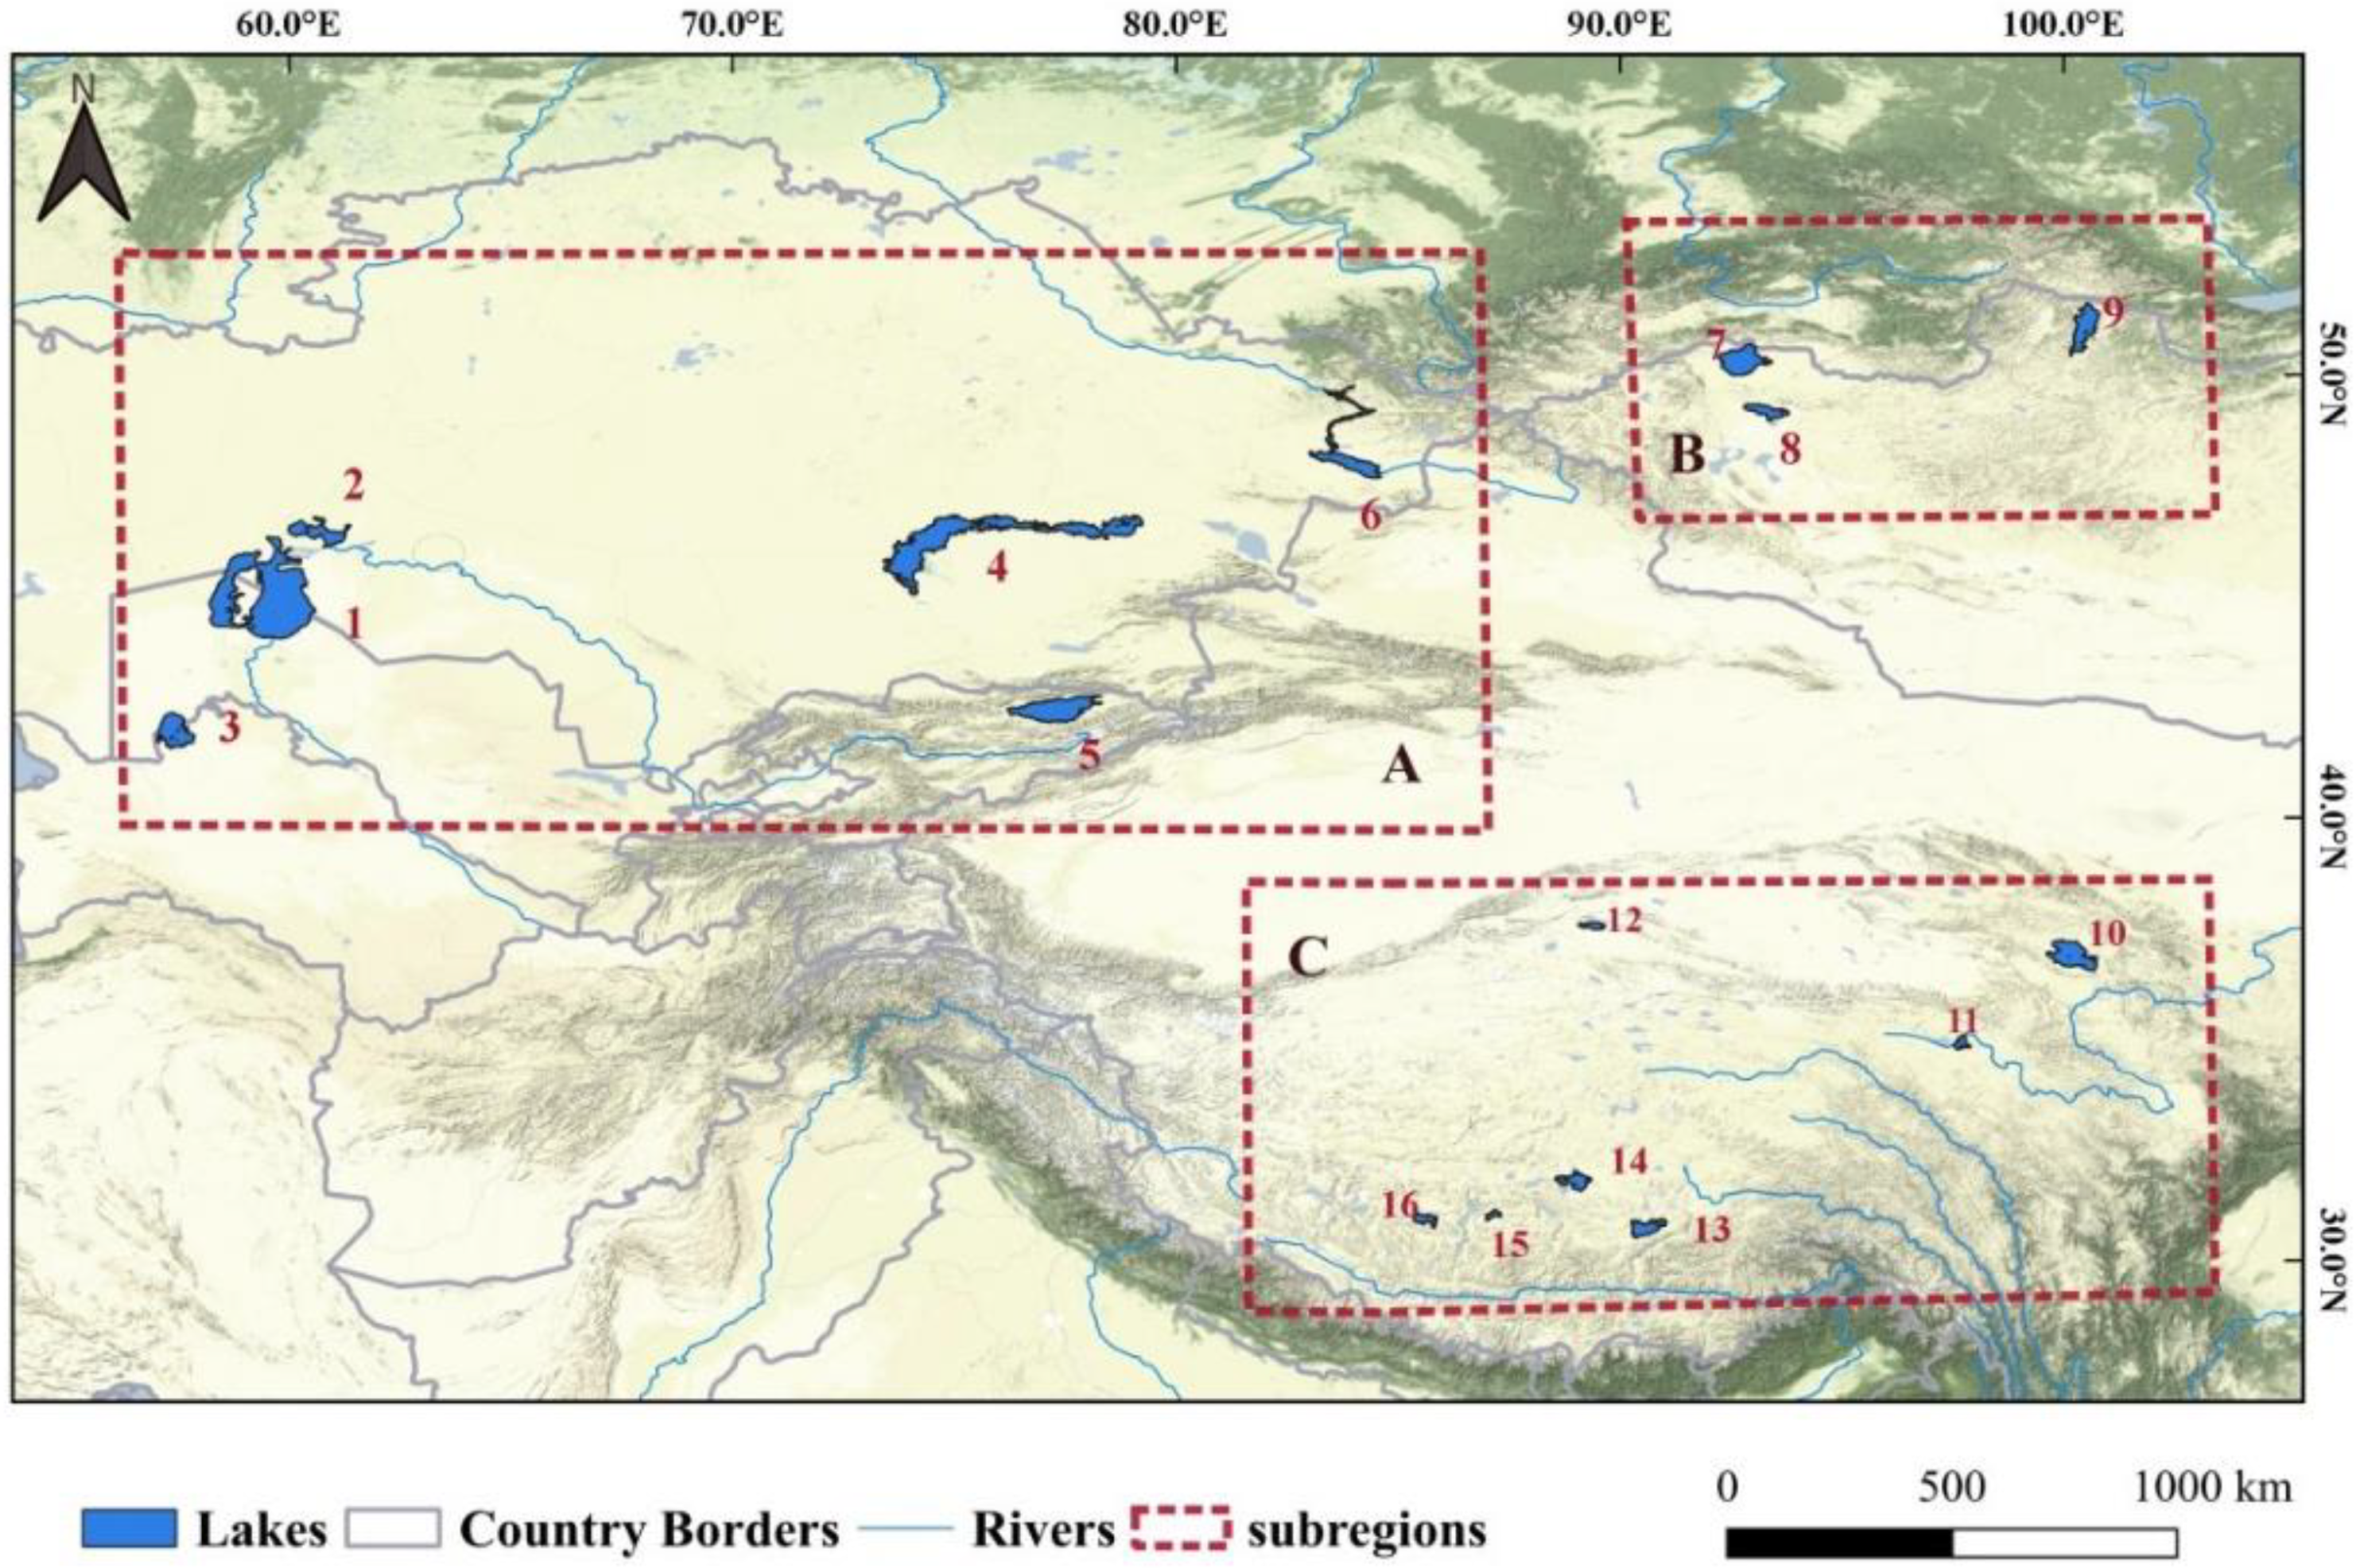
2.1. Study Sites

In the following analysis, data from 12 terminal lakes were used, spotted over the Eurasian endorheic zone. They include the four large terminal lakes of Central Asia: the Aral Sea (having two virtually separated basins, i.e., the North Aral and the South Aral), Lake Balkhash, Lake Issyk-Kul, and Lake Sarykamysh. The term “Central Asia” refers here to the geographical region bounded by the Caspian Sea on the west, the Tian Shan Mountains on the south, the Altai Mountains on the east, and by the basins of the Ural and Ob Rivers on the north. The strongly continental arid climate of the region is characterized by cold winters and hot dry summers. The largest lake of the region, the Caspian Sea, was intentionally excluded from the analysis as having a unique hydrological regime determined by complex interactions on its large catchment area (see [18] and citations therein on the Caspian Sea water level change). Two more lakes, the Uvs and Hyargas (Khyargas), are the largest terminal lakes of the “Great Lakes Depression” in the western Mongolian Plateau (MP), bounded by the Altai Mountains on the west, the Khungai Mountains on the east, the Tannu-Ola Mountains on the north, and the Gobi Desert to the south. The remaining six lakes are located on the Tibetan Plateau (TP). Based on Yao et al. [31], the Kunlun Mountains divide the TP in two parts with different dominant atmospheric circulation patterns: the area to the south of 35° N is dominated by the Indian monsoon circulation, and the northern part of the Kunlun Mountains is dominated by the mid-latitude westerlies [31,32]. Four of the investigated lakes—Namco, Ngangzco, Silingco, and Zharinamco—are large saline terminal lakes in the southern TP of the Kunlun Mountains, whereas Qinghai and Ayakkum are the largest terminal lakes located in the northern TP. Additionally, one exoreic lake per each large region was included in the analysis: Lake Zaysan (the largest freshwater lake in Central Asia), Lake Hovsgol (the largest freshwater lake on Mongolian Plateau), and Lake Ngoring (the largest freshwater lake on the TP). Herewith, the 15 lakes (Figure 1) provide a representative reference set allowing for a comparative analysis of the common patterns and differences in the water level variations of terminal lakes over the Eurasian endorheic zone, and their relation to the level changes in the open exoreic lakes of the same climate. The basic characteristics of the selected lake basins are summarized in Table 1.

2.2. Lake Water Level Dataset from Satellite Altimetry Data

The water levels of the target lakes were obtained from three different satellite altimetry databases: the Hydroweb from Laboratoire d’Etudes en Géophysique et Océanographie Spatiales (http://hydroweb.theia-land.fr/, accessed on 14 July 2021) [33], Global Reservoir and Lake Monitor (G-REALM, https://ipad.fas.usda.gov/cropexplorer/global_reservoir/, accessed on 14 July 2021) [34,35], and Database for Hydrological Time Series of Inland Waters (DAHITI, https://dahiti.dgfi.tum.de/, accessed on 14 July 2021) [36].
In the Hydroweb database, the lake water level records were provided by combining several altimetry data, including Topex/Poseidon (T/P), Jason-1, GFO, ERS-1 and ERS-2, and Envisat satellites, and are available from 1992 to the present. The water level data were generated by applying several corrections on each altimetry datum, such as ionospheric and tropospheric correction. The details on the processing procedures are described in [33]. The mean lake level was computed by averaging the altimetry measurements over time, and the lake level anomaly was calculated by subtracting the mean lake level. The long-term time series of lake water levels since 1992 was generated on a monthly basis by merging several altimetry data using T/P data as a reference during the overlap period [33,37]. The lake level records from this dataset range in accuracy from a few centimeters (e.g., 3–9 cm rms at Great Lakes, USA) to tens of centimeters (e.g., 29 cm rms at Lake Chad, Africa), which is comparable to the gauge data accuracy [37,38].
In the G-REALM altimetry database, the water levels were utilized from T/P, Jason-1 and Jason-2 and Envisat satellites and are available from 1992 to present. The relative water level records were provided from G-REALM by merging T/P, Jason-1 and Jason-2 time-series at 10-day intervals. This time series has been smoothed with a median-type filter to eliminate outliers and reduce high-frequency noise, using the mean value of the Jason-2 water level as the reference [39]. The rms in the range of 6 cm to 34 cm and median correlation higher than 0.90 were observed between G-REALM and gauge-based data on 18 lakes and reservoirs distributed across three continents [38,39].
The DAHITI database also combined many altimetry satellite products, such as T/P, Jason 1, Jason-2 Envisat, ERS-2, and SARAL/AltiKa. The processing strategy was based on a Kalman filtering approach and extended outlier detection [36]. Compared with in-situ data, the lake level data from DAHITI show the accuracies to be between 4 and 36 cm rms, depending on the surface extent of the lake and climate conditions (i.e., ice coverage) [36].
These databases have been widely used in related studies on lake water levels because of their fine temporal resolution and good validated accuracy [6,29,33]. The annual time series of the water levels was calculated for each lake from three altimetry datasets. The consistency and accuracy of the time series from the three products were verified by correlation analysis and cross-evaluation, taking into account the different datum/reference systems when combining the records from different satellite data. In our study, the bias of the absolute water level value was not removed among the different products when the consistency of water level records was significantly good to avoid unnecessary errors. Thereafter, the statistical information for evaluating the water level variability, such as the trends and mean values, was calculated from the Hydroweb database as the reference, considering that it had the longest record for most target lakes.

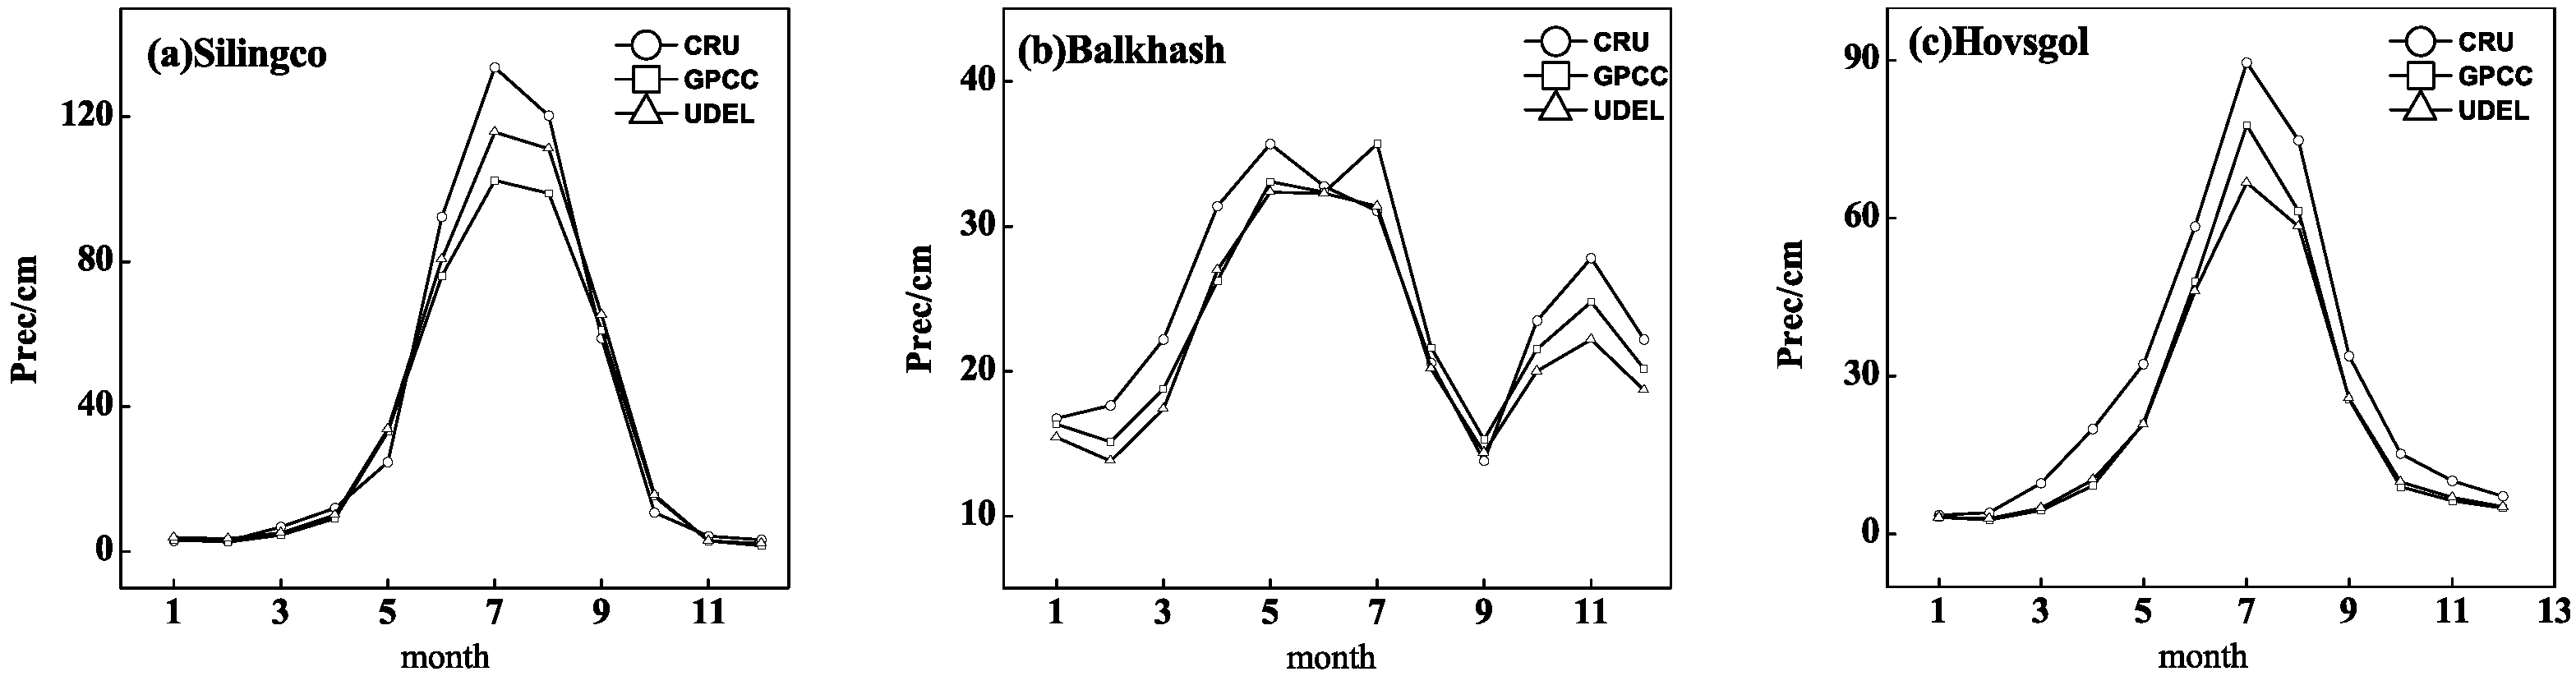
2.3. Meteorological Dataset

The climate effect on lake level variation was traced with the regional precipitation and temperature patterns. Due to possible large variation and uncertainty in single-point measurements, precipitation records were selected from global gridded observation datasets to evaluate the climatic pattern. We used three in-situ-based products: Global Precipitation Climatology Centre products (GPCC, https://www.dwd.de/EN/ourservices/gpcc/gpcc.html, accessed on 14 July 2021) [40,41], precipitation products from the University of Delaware (UDEL, http://climate.geog.udel.edu/~climate/html_pages/download.html, accessed on 14 July 2021) [42], and Climate Research Unit products (CRU, http://www.cru.uea.ac.uk/data, accessed on 14 July 2021) [43]. The temperature dataset was adopted from the CRU products.
The GPCC precipitation data was based on 85,000 meteorological stations spread worldwide with a record duration of 10 years or longer. It collected and integrated many observations from the national meteorological agencies (NMAs), which were the primary data source, and the Food and Agriculture Organization (FAO), the Global Historical Climate Network (GHCN2), and the World Meteorological Organization (WMO), among others. The latest version of GPCC V7 [41] provided monthly precipitation data from January 1901 to December 2016. The UDEL product was also compiled from several updated sources, and the number of stations in this dataset ranges from 4100 to 22,000, globally. The newest version of UDEL (V5.01) provided the monthly precipitation spanning from January 1900 to December 2018. The CRU dataset comprised a suite of climate variables, including precipitation and temperature. This dataset was obtained based on more than 4000 meteorological stations through the NMAs, the WMO, the FAO, and other sources. The latest version of CRU (TS 4.01) provided data at a monthly scale from 1901 to 2018.
These datasets were built based on a network of gauge observations and were widely used as a “baseline” dataset for the validation of other model outputs and satellite products [44,45,46]. In our study, we adopted data from the newest version on a monthly basis with a spatial resolution of 0.5° × 0.5° and selected a comparable period of 1990–2016. The precipitation and temperature records for each lake were extracted at the basin scale.

2.4. Data Integration

The precipitation datasets mentioned above have generally shown similar spatial patterns and temporal variations [47,48]. The seasonal cycles of precipitation over the study areas were demonstrated from three products in the three respective lake basins (Figure 2). The three products showed a generally good agreement since they use many rain gauges in common. The spread showed a slight difference in summer, especially in mountainous areas [49], possibly due to the differences in grid and interpolation approaches [50].
The simple weight approach from [51] was employed to integrate different precipitation datasets into one single data series with a minimum root mean square error (RMSE). Specifically, the method was used as a weighted average of all the products, and the weights were determined based on the error level. First, the error variance of each product was calculated using the mean of the products as the truth. The weights were summed up to 1 and were calculated as follows:
w i , j = 1 σ i , j 2   / j = 1 n 1 σ j 2  
σ i , j 2   =   ( v i , j v j ¯ ) 2 ¯
where w i is the weight for the product j at the grid of i , σ i , j 2   is the error variance of the product j , n is the total number of products to merge, v i , j is the precipitation from the product j at the grid of i , v j ¯ is the mean value of the product j .

2.5. Trend Analysis

We adopted the non-parametric Mann–Kendall (MK) test [52,53] to detect the significance of trends in the time series of lake water level and climate-related variables. The MK test was minimally affected by the un-normalized distribution of variables [54]. However, data should be assumed to be independent. According to Von Storch [55], autocorrelation would lead to a rejection of the null hypothesis of no trend when the null hypothesis was actually true. To eliminate this concern, the “trend-free pre-whitening” method, based on Yue et al. [56] and Yue and Wang (2004) was applied prior to the MK test to preserve the magnitude of a trend. The combination can provide an accurate trend estimate of the autocorrelation process and has been widely used in hydrological and meteorological time series [57,58,59]. The slope was estimated using Sen’s estimator [60], considering its robustness against outliers. In our study, we adopted significance levels of α = 0.01 and α = 0.05.

2.6. Cumulative Anomaly Analysis

The cumulative anomaly analysis can be used not only to identify the state of changes in the time series anomaly, i.e., above or below the average condition, but also to evaluate the accumulated effects of climate variables over a certain period and their long-term tendencies. It has commonly been used to assess variations in hydrological and meteorological factors [61,62,63]. In our study, we calculated the cumulative anomaly time series of annual precipitation and temperature in each lake basin. The cumulative anomaly C U M t at the year of t can be expressed as:
C U M t = i = 1 n ( x i X ¯ ) ( t = 1 , 2 , 3 , , , , n )
X ¯ = 1 n i = 1 n ( x i )
where x i is the yearly value of temperature or precipitation, n is the number of years of data used.

2.7. Change Point Detection

The change point was defined as the time when the means become statistically different. This point was regarded as a possible starting point of the new regime. The Pettitt test [64] and the Bayesian change point test [65,66] were applied to detect shifts in the meteorological variables. The Pettitt test is a non-parametric trend test used to estimate the occurrence of a change point and has been widely used to detect abrupt changes in hydrological and climatic series [62,67]. The Bayesian change point test detects a change point at an unknown time point and the amount of shift in the time series, operating under the assumption that a change had occurred. This test detects changes in the mean, trend, and/or variance by using a minimum segment length between two shifts. A change point was selected only when the two methods detected the same change point; then, mean values before and after the regime shift were calculated.

3. Results

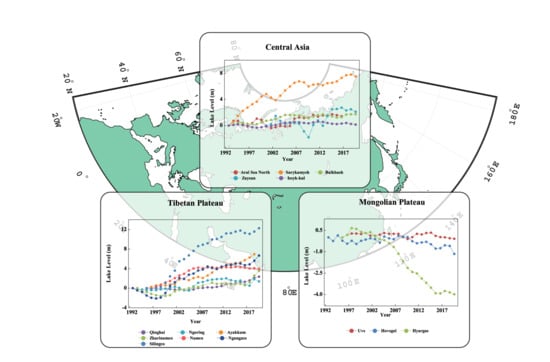
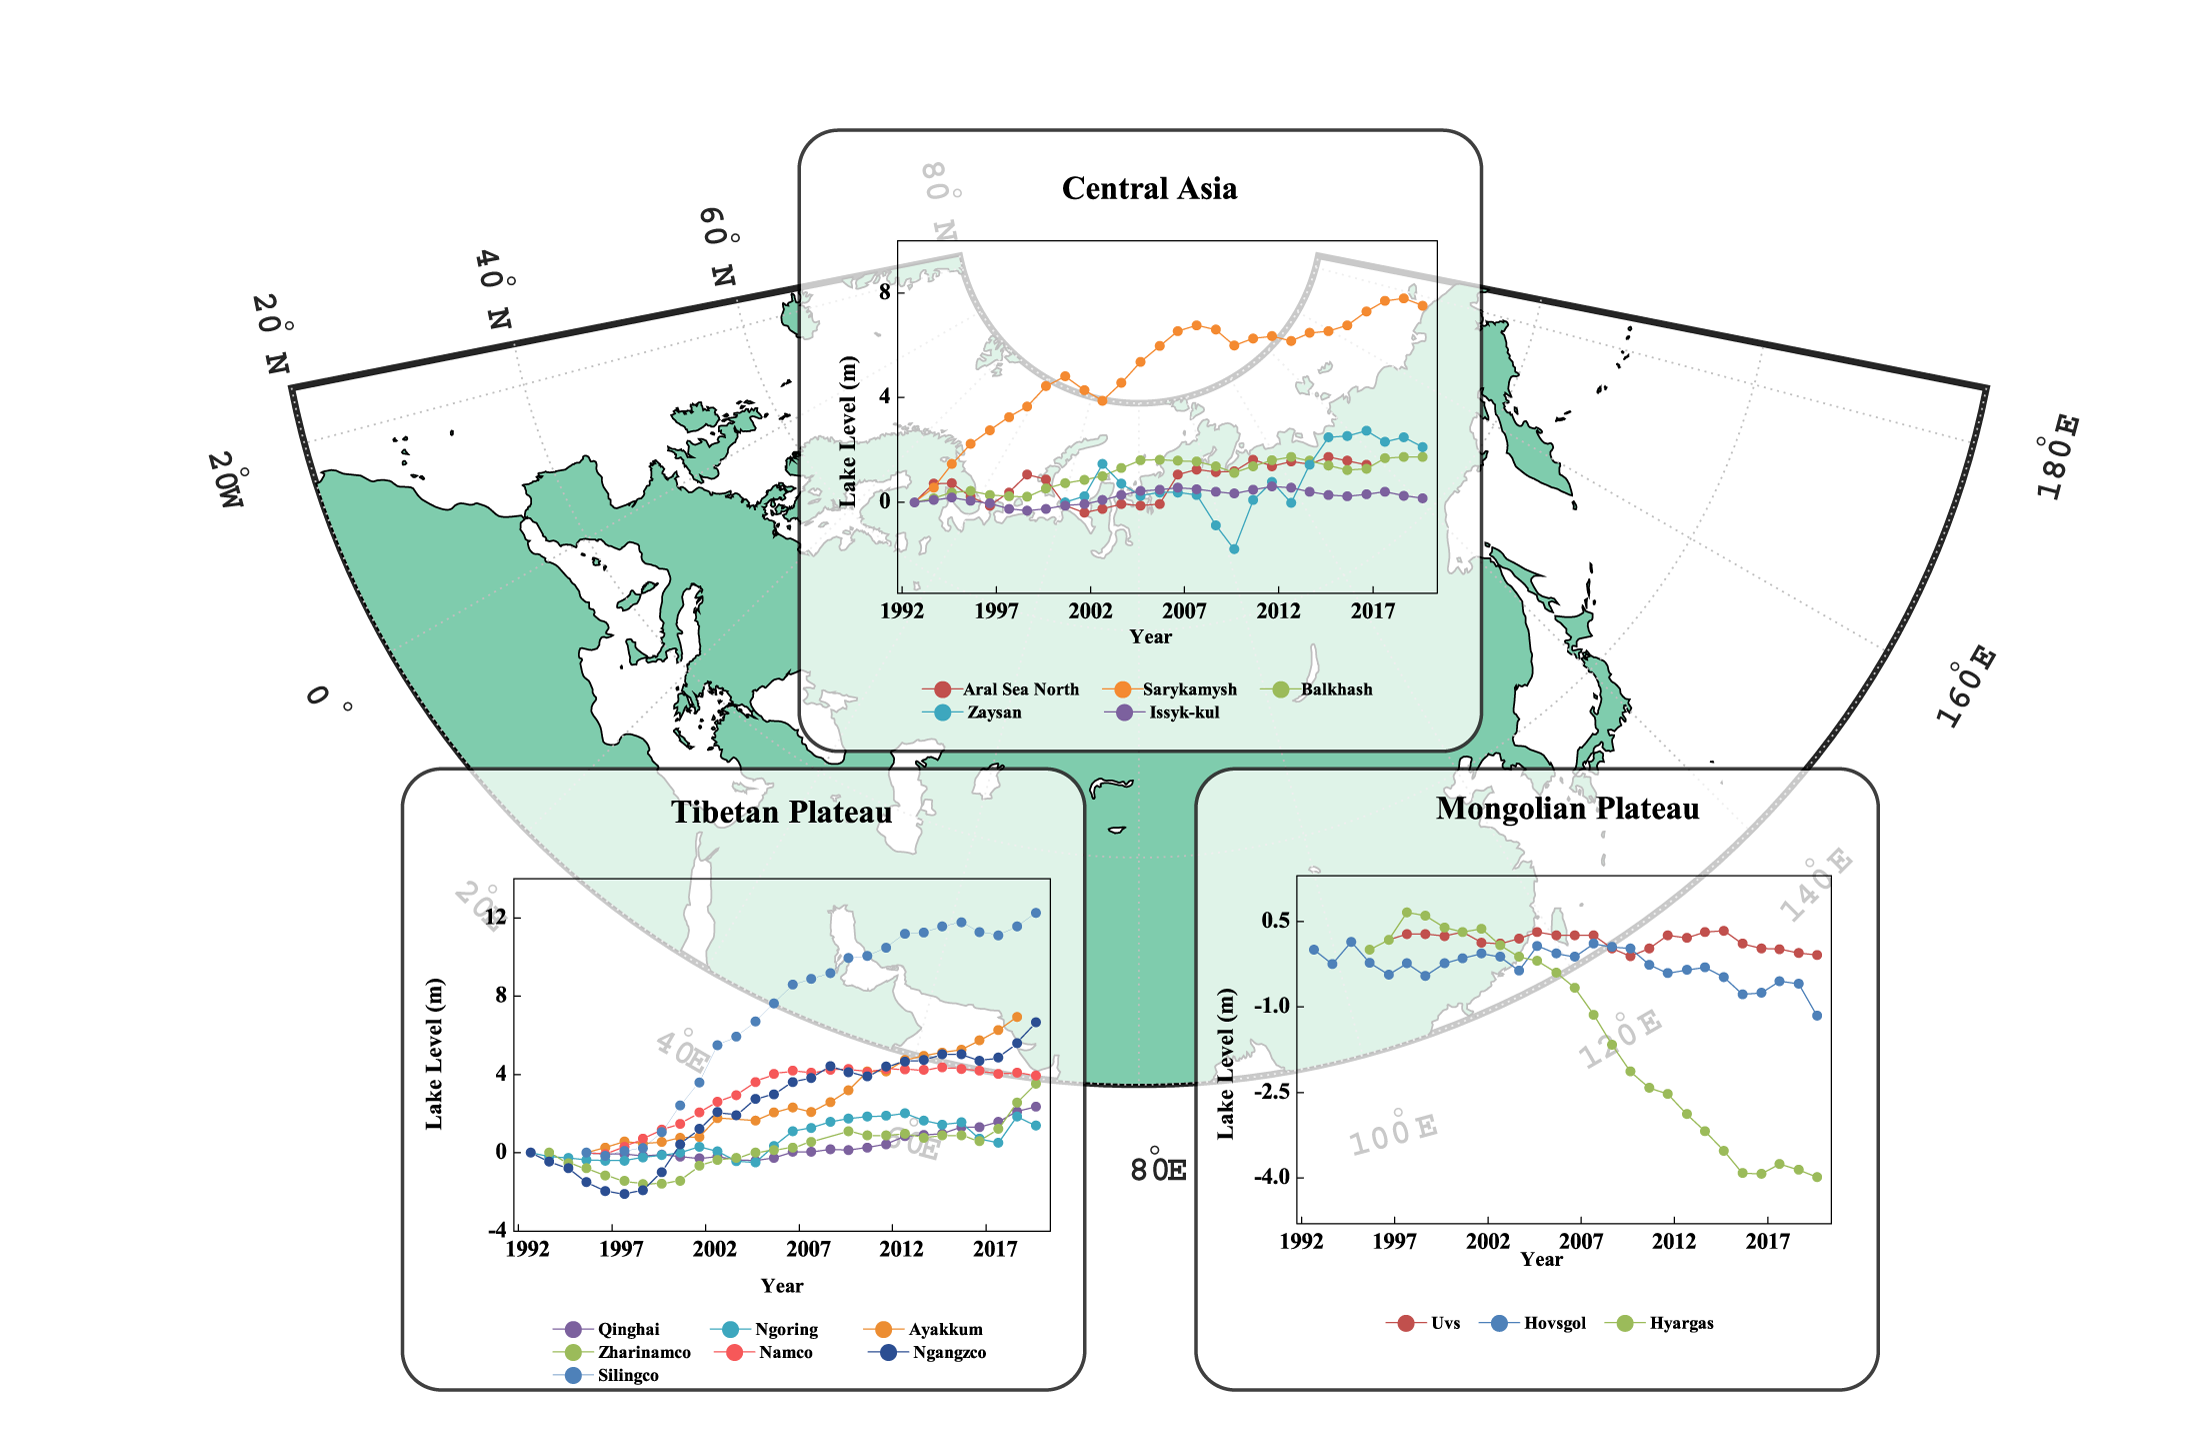
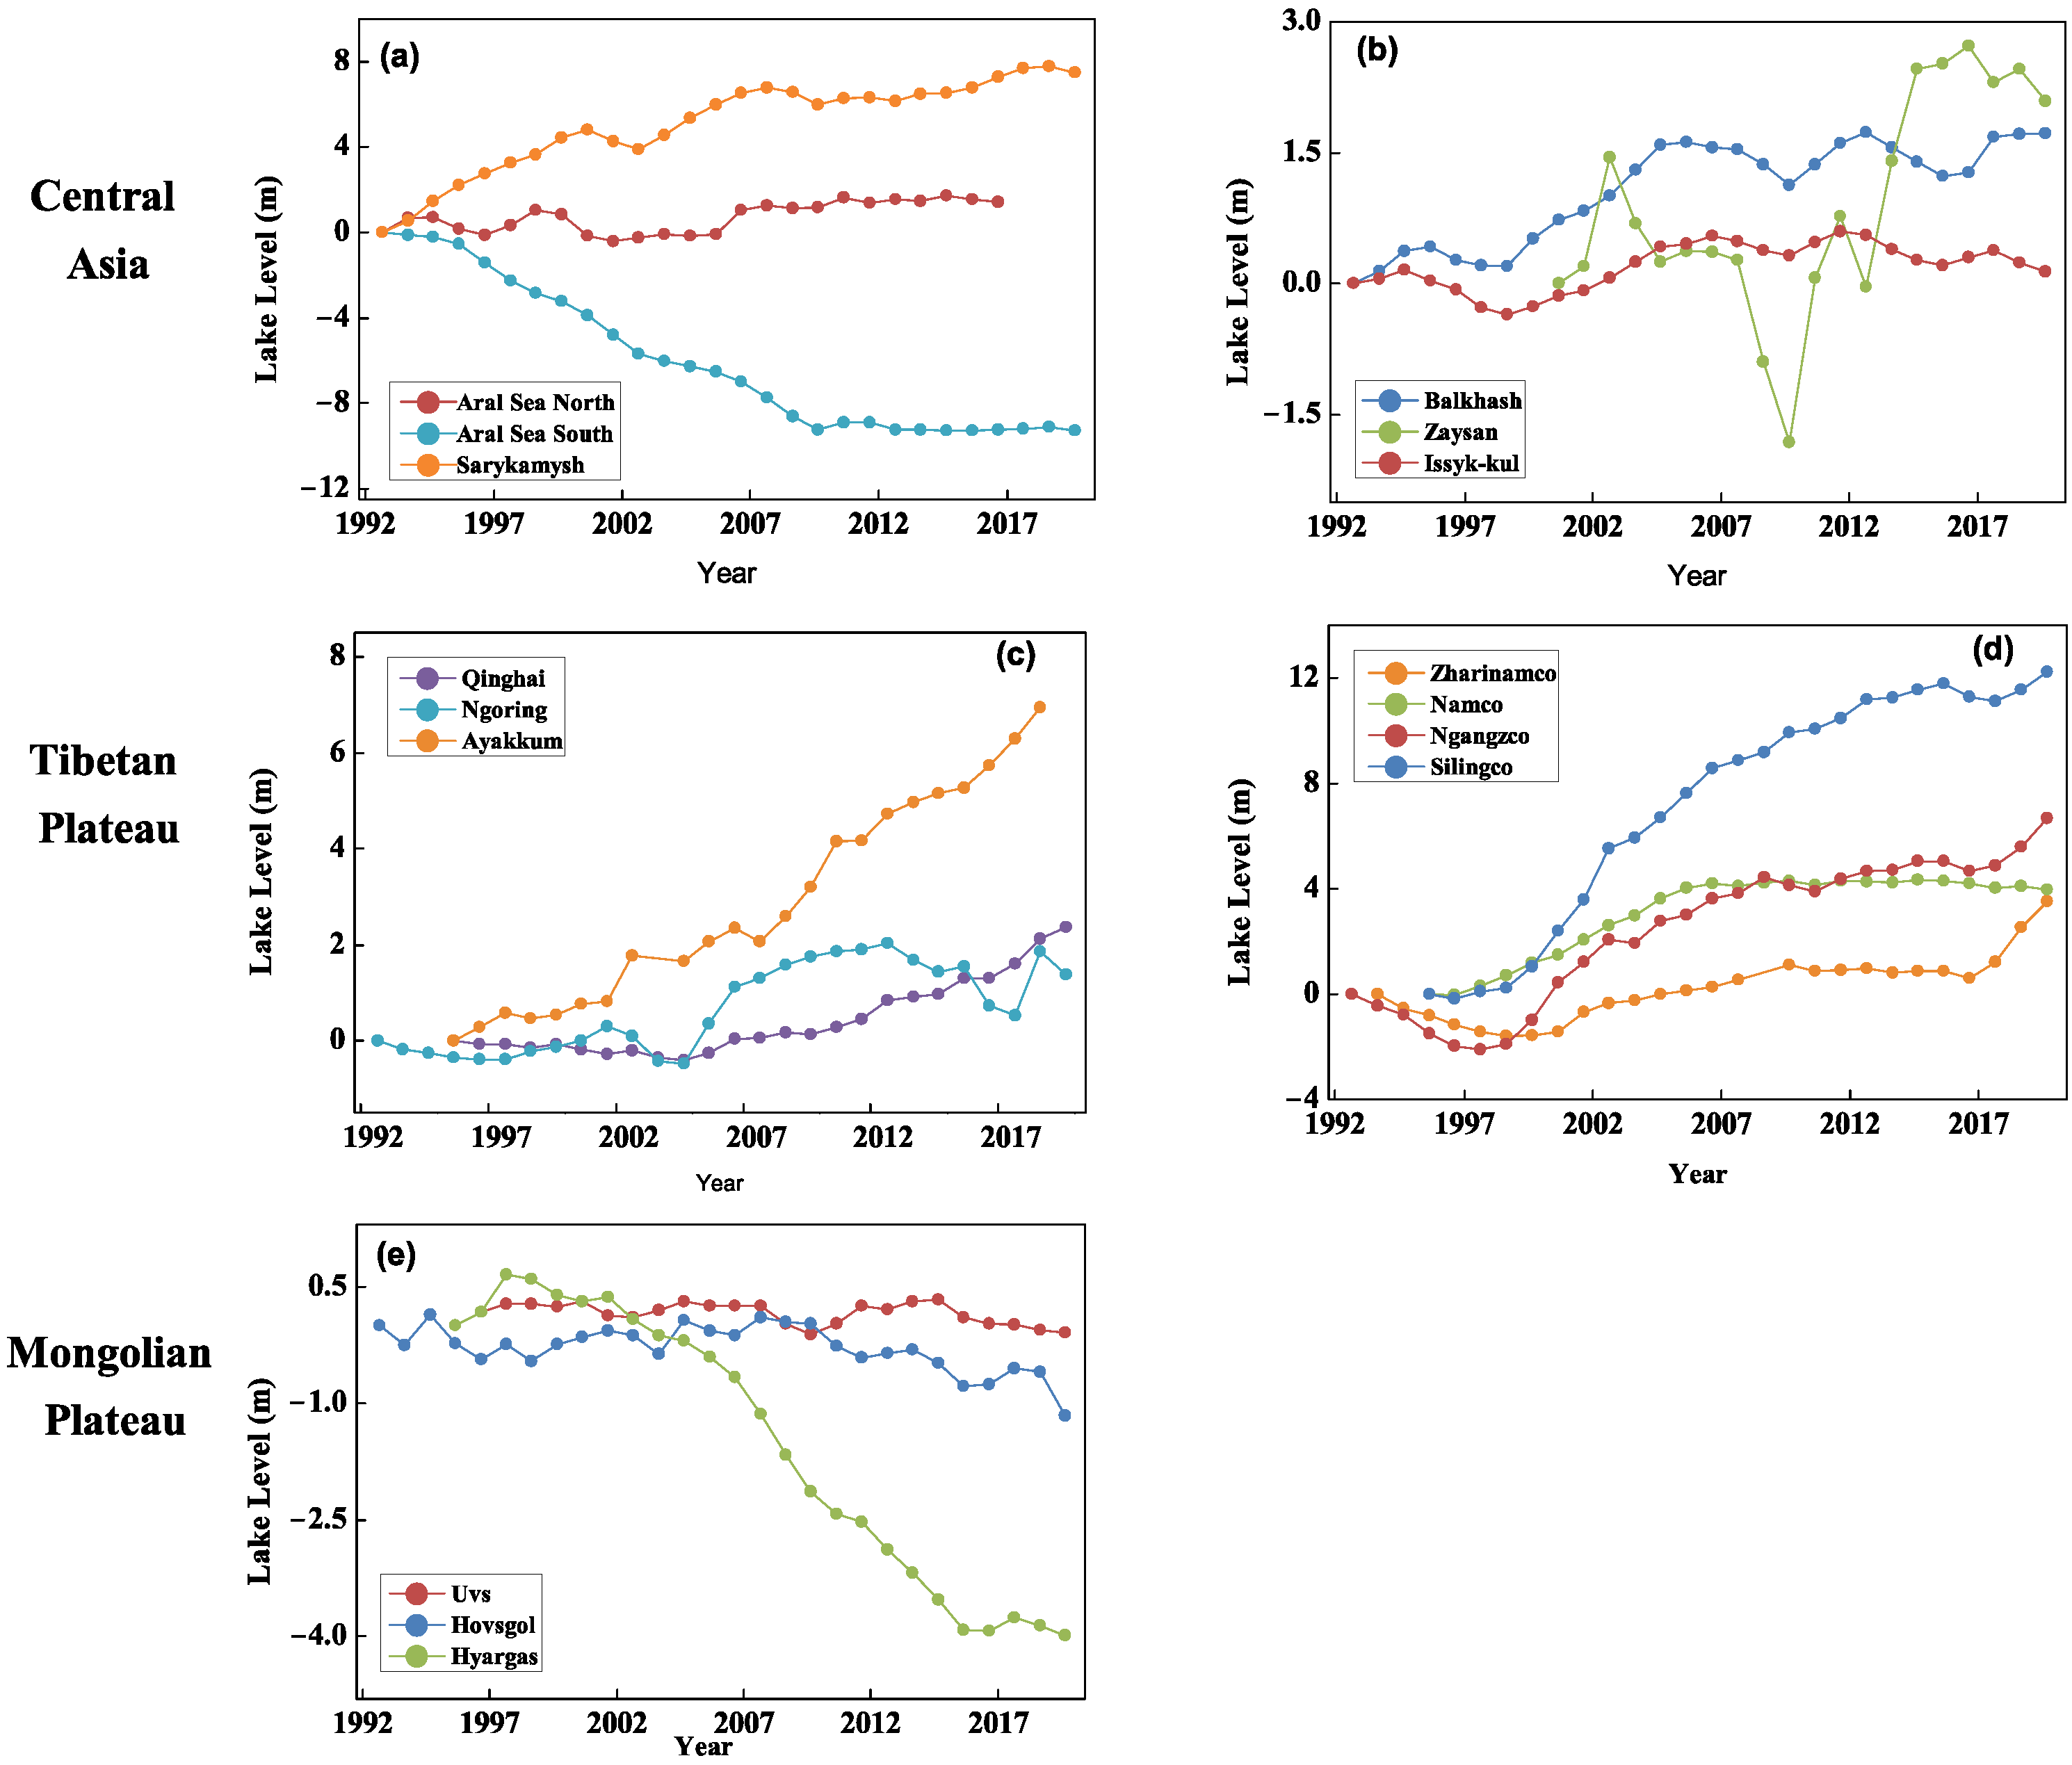
3.1. Spatiotemporal Variations of Lake Level

The water level changes during the period of 1992–2016 for the selected lakes are summarized in Figure 3 (see also Supplementary Figures S5–S8). The time series of water levels from the three altimetry datasets showed a high consistency in all the examined lakes, as the correlation coefficients (R) were significant at the 95% confidence level, and the R values for 14 lakes were higher than 0.9 (Table 2). The results were also in good agreement in depicting intra-annual variations and abrupt changes in lake levels. For example, a sudden turning point of the water level in Lake Qinghai occurred in 2005, followed by an increasing trend from this year, which was captured by all the satellite altimetry data.
All three regions revealed diverging spatial characteristics between the CA, the TP, and the MP; the temporal patterns of water level variations in the 15 lakes were also distinguished by different trends. In the CA region, the water levels showed a generally increasing trend (Figure 3a,b), except for the south Aral Sea. The south Aral Sea (Figure 3a) had a continuous decreasing trend since the beginning of the analyzed period (1992), which was consistent with the Aral Sea desiccation starting in 1960 and described in previous studies [68,69]. However, the lake level stopped decreasing in 2009 (Figure 3a). The water levels of Lake Balkhash and Lake Issyk-Kul showed similar patterns during the whole period, increasing by 0.058 cm/yr and 0.017 cm/yr, respectively. The lake water levels grew until approximately 2008, followed by fluctuations with no obvious trends. The fluctuations in water level were found in Lake Zaysan, where the initial level decrease was replaced by an increasing trend since 2008. It is interesting to note that the latter increase in the lake level in the open lake coincided with a simultaneous increase of the lake water level in the endorheic lakes of the region.
In the TP, the water levels in the lakes showed an overall upward trend during the past three decades, with a decrease in the early stage, followed by a strong increase (Figure 3 and Supplementary Figures S2–S4). These increasing trends were more evident from around 1997 onwards in the lakes located in the southern part of the TP and from approximately 2005 onwards in the northern part of the TP. In the southern TP region, based on the time series from the Hydroweb altimetry dataset, the water levels of the four lakes since circa 1997 have increased by 17.815 cm/yr for Lake Namco, 12.882 cm/yr for Lake Zharinamco, 56.923 cm/yr for Lake Silingco, and 30.312 cm/yr for Lake Ngangzco (Figure 3d). Noteworthy, the increasing trend of the water level in Lake Namco paused in approximately 2005 and was then followed by a fluctuation. From 1992 to 1997, the lake levels showed a decreasing trend in Lake Zharinamco and Lake Ngangzco. This decreasing trend was unclear in Lake Namco and Lake Silingco, as the records of the water levels in the two lakes started in 1995. In the northern TP region, the lake water levels presented noticeably increasing trends of 9.214 cm/yr (Lake Qinghai), 8.576 cm/yr (Lake Ngoring), 57.023 cm/yr (Lake Ayakkum), and 30.284 cm/yr (Lake Ngangzco). Notably, these increases were more evident from 2005 onwards in Lake Qinghai and Lake Ngoring; before 2005, the water levels in the two lakes were stable, with a slight decrease.
In the MP region, the lake water levels in all three lakes showed generally decreasing trends. Lake Uvs and Lake Hyargas showed continuously decreasing water levels since 2002, by −6.211 cm/yr and −36.102 cm/yr, respectively (Figure 3e, Supplementary Figure S4). The water level in open Lake Hovsgol decreased slightly by −1.183 cm/yr from 1992 to 2018, with an initial positive trend before 2004, followed by an obvious level decrease. Notably, the lake levels showed clear decreases from 2002–2004 onwards in all the lakes of the region, whereas the rate of change was different for open and closed lakes.
Generally, the lake water levels showed increasing trends both in the CA and in the TP, while showed decreasing trends in the MP. However, the increasing patterns exhibited different characteristics in CA and TP regions. There was a turning point in approximately 2005 at the northern part of the TP, and from 2005 onwards, the lake levels experienced significant rapid increases. In turn, in the southern part of the TP, except Lake Silingco, the turning point occurred in 1997, and the lake levels showed slow increases after 2005. In the CA region, the lake levels continuously increased until approximately 2005 and showed fluctuating behavior afterwards.

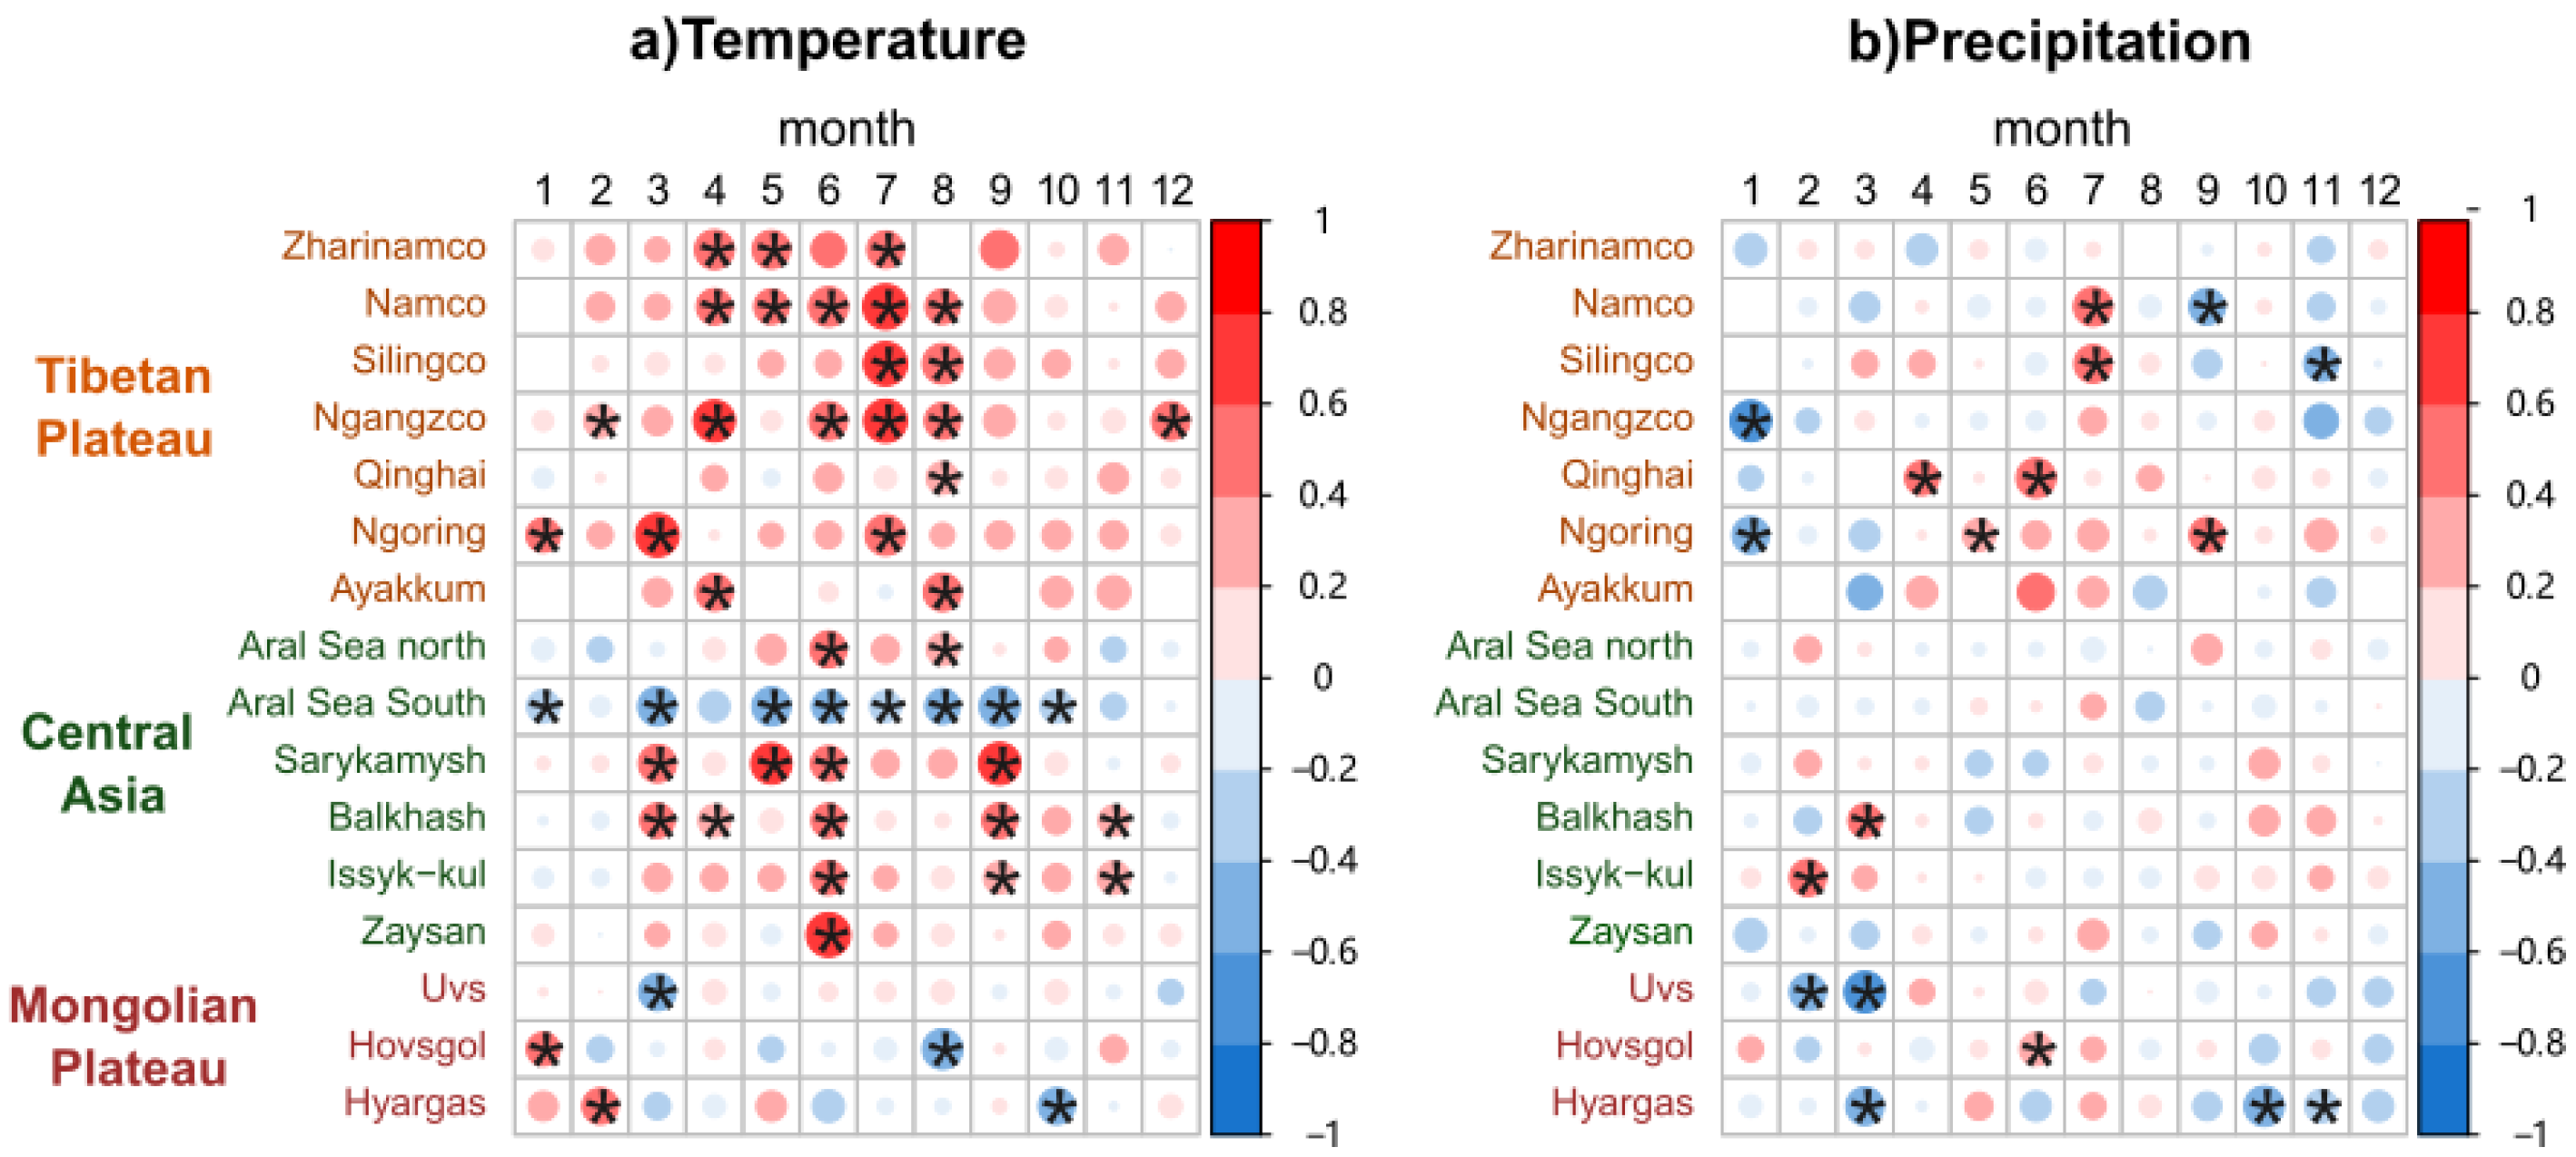
3.2. Climate Effects on the Lake Levels

Among the two major climatic factors—precipitation and air temperature—a similar the air temperature pattern was found over both TP and CA: Air temperature decreased from 1990 to 1997 and changed to an apparent increase afterwards. In contrast to the CA, the air temperature increase slowed down from 1997 to 2005 in the TP. In the MP, increasing trends of air temperature were found over the three lake basins before 2007, followed by large fluctuations with an evident temperature drop in 2012 (Figure 4 and Supplementary Figure S8).
In CA, precipitation generally decreased during most of the study period, but found an increase after 2014. Precipitation in the lake basins exhibited different patterns in the southern and northern part of TP. The cumulative precipitation value reached a low point in approximately 2005 in the northern TP, and then started to increase (Supplementary Figure S6). In the southern TP, the precipitation had a large variability from 2005 onwards, with no obvious trend during this period (Figure 4, Supplementary Figure S7). Except for Lake Silingco, the increase rates of the lake levels slowed down in this region (Supplementary Figure S7). In the MP, the cumulative precipitation showed a general decrease during the entire period for three lakes (Supplementary Figure S8), which is consistent with the pattern of lake level variations. A warmer and drier environment, especially after 2009, when the temperature increased significantly, probably mainly contributed to a lower water level in this region.
The different patterns of precipitation and temperature at the lake basin scale (Table 3) were reflected in the spatial heterogeneity of lake level variations. The selected lakes showed obvious negative trends of water level over TP and showed a slightly positive trend of water level over CA (except the Aral Sea South), but experienced different climate: a warmer and wetter climate in TP, but warmer and a slightly dryer climate in CA (except Lake Issyk-Kul).
The different response of lake levels to the precipitation and air temperature can be ascribed to the effect of additional glacier runoff. The surface runoff from precipitation will have a direct impact on lake level variation, but the warmer air temperature will increase the meltwater runoff from glacier and snow in glacier-fed lakes, and the surface runoff from precipitation. For the non-glacier-fed lakes in CA, the fluctuation of lake level is more consistent with the annual variation of precipitation than with air temperature, indicating a direct impact of precipitation on water levels. In turn, the selected lakes in TP with an apparent water level growth were glacier-fed and had a significantly positive correlation between spring air temperature and lake level (Figure 4). For example, in Lake Namco, the lake level showed a significant correlation of 0.626 with the April temperature of 0.626, but was not correlated with precipitation, demonstrating the higher importance of meltwater runoff compared with precipitation.

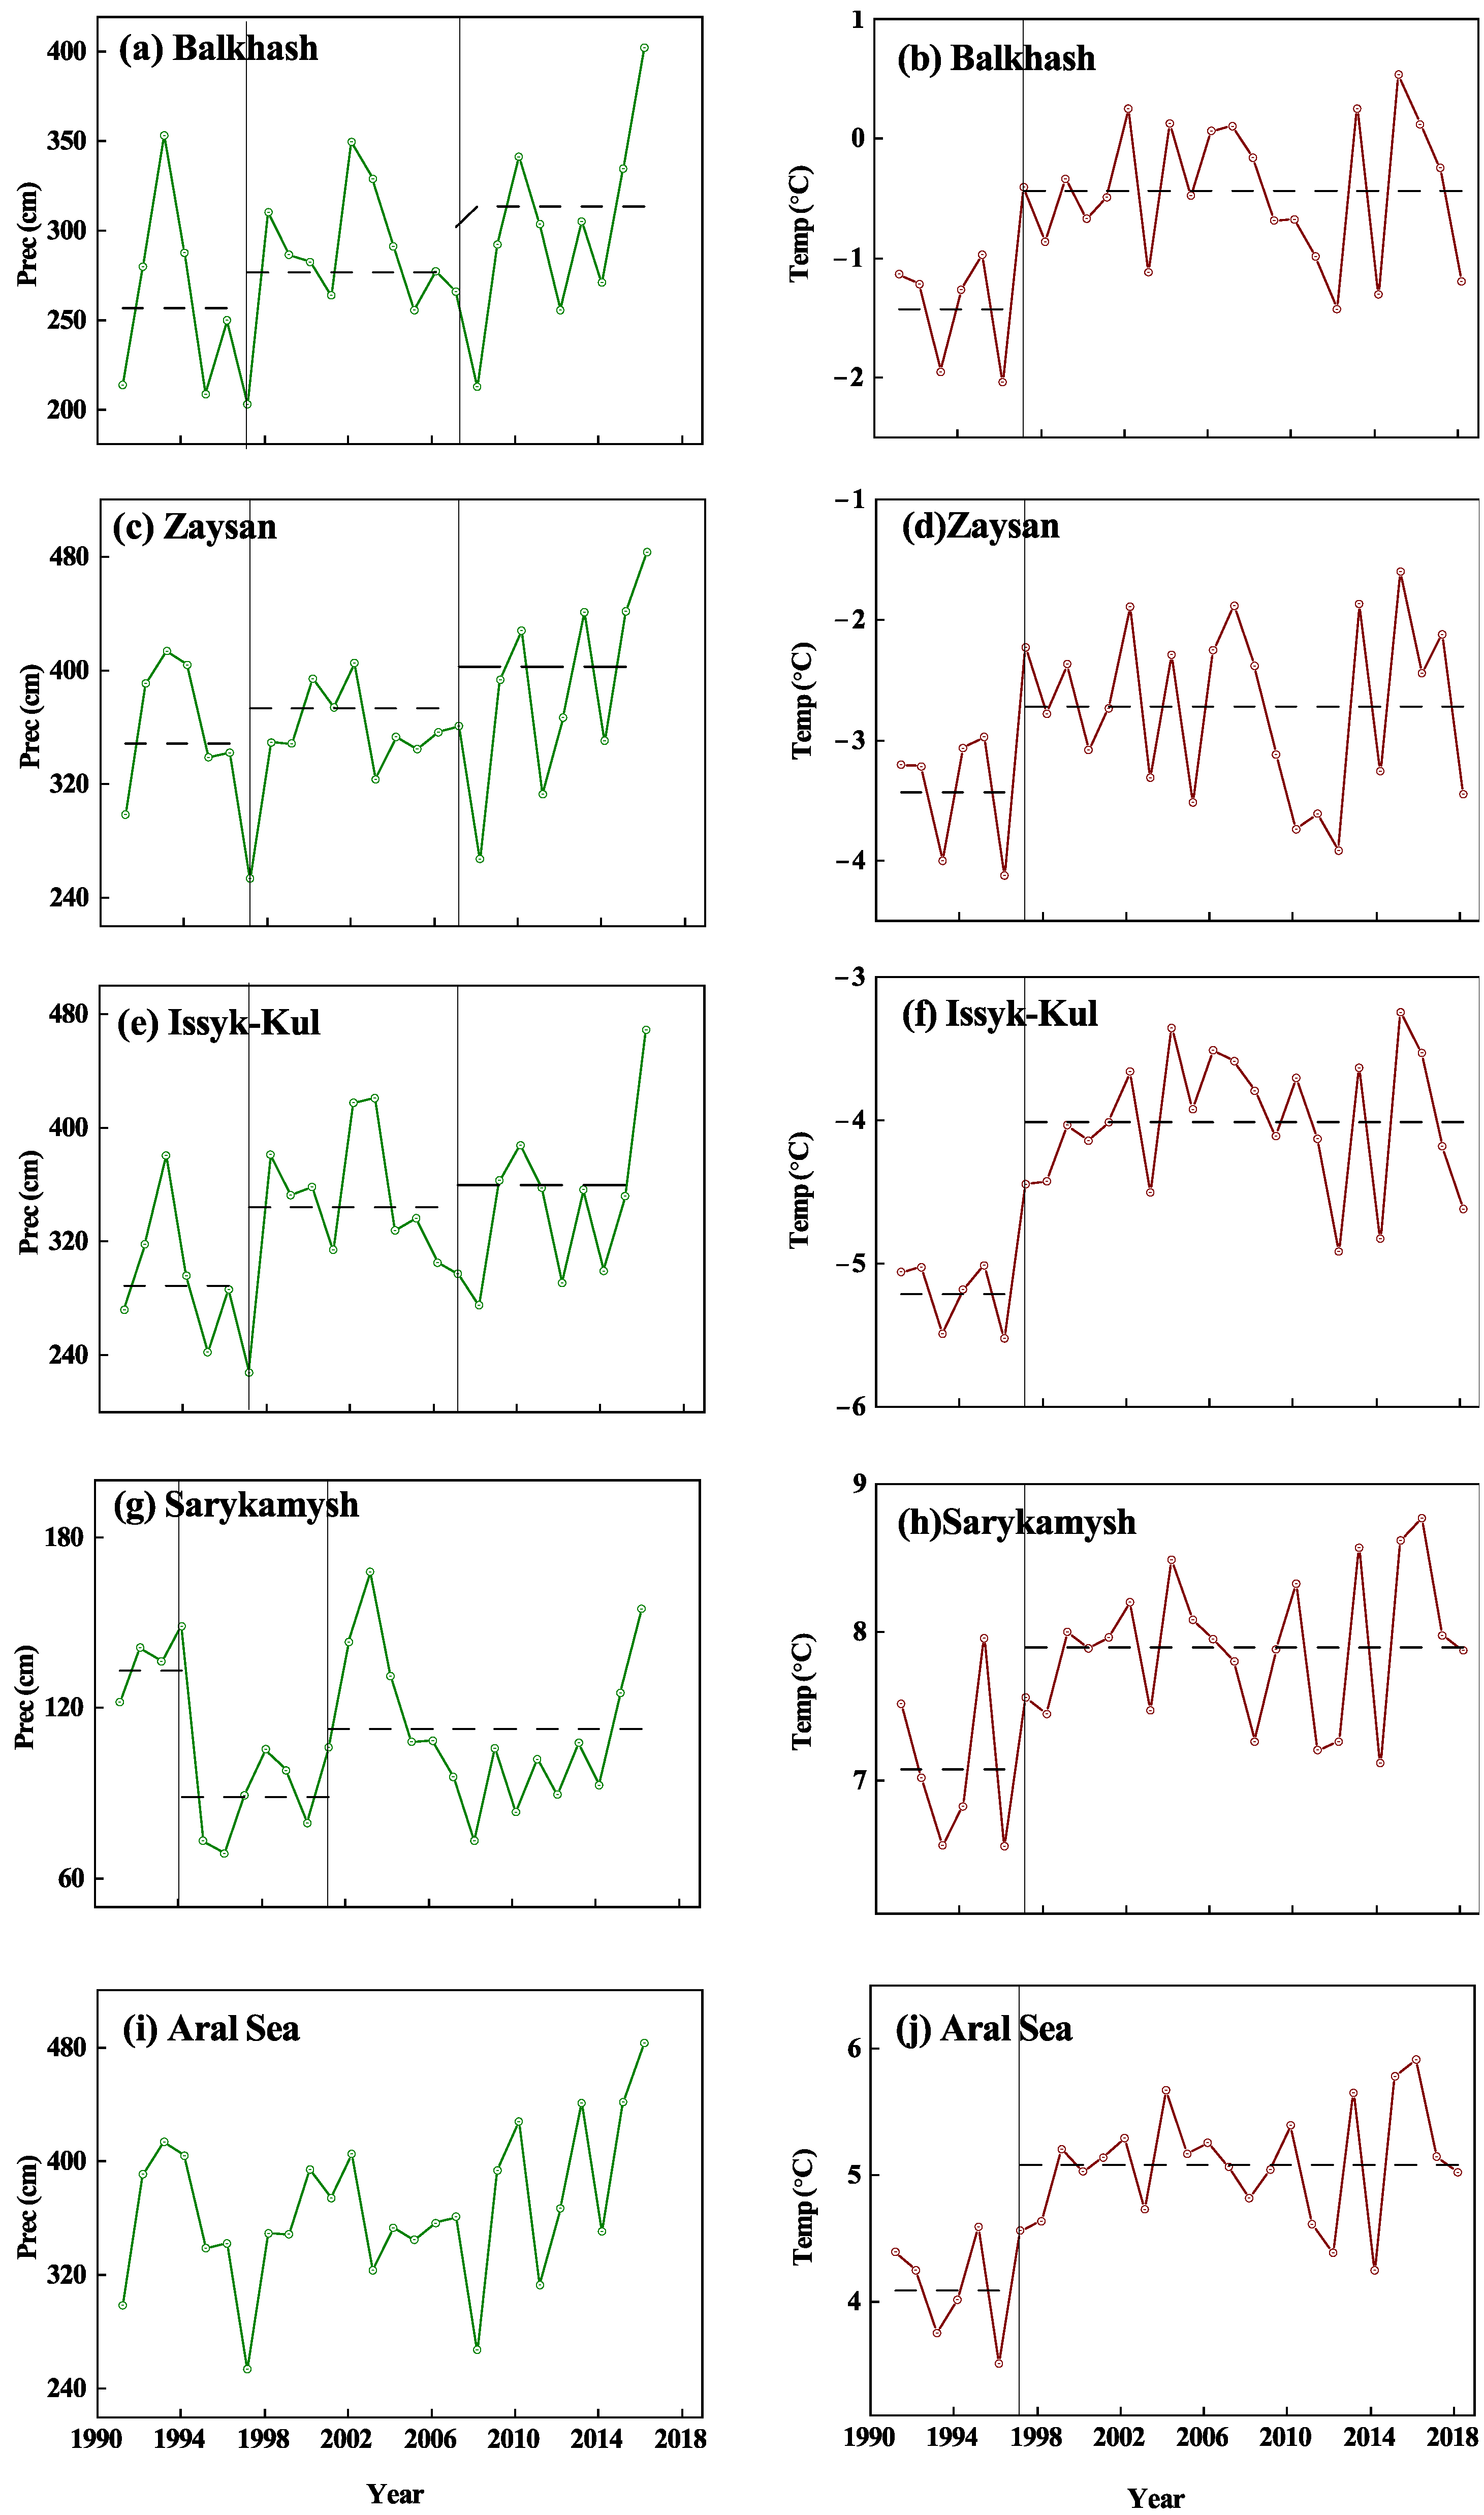
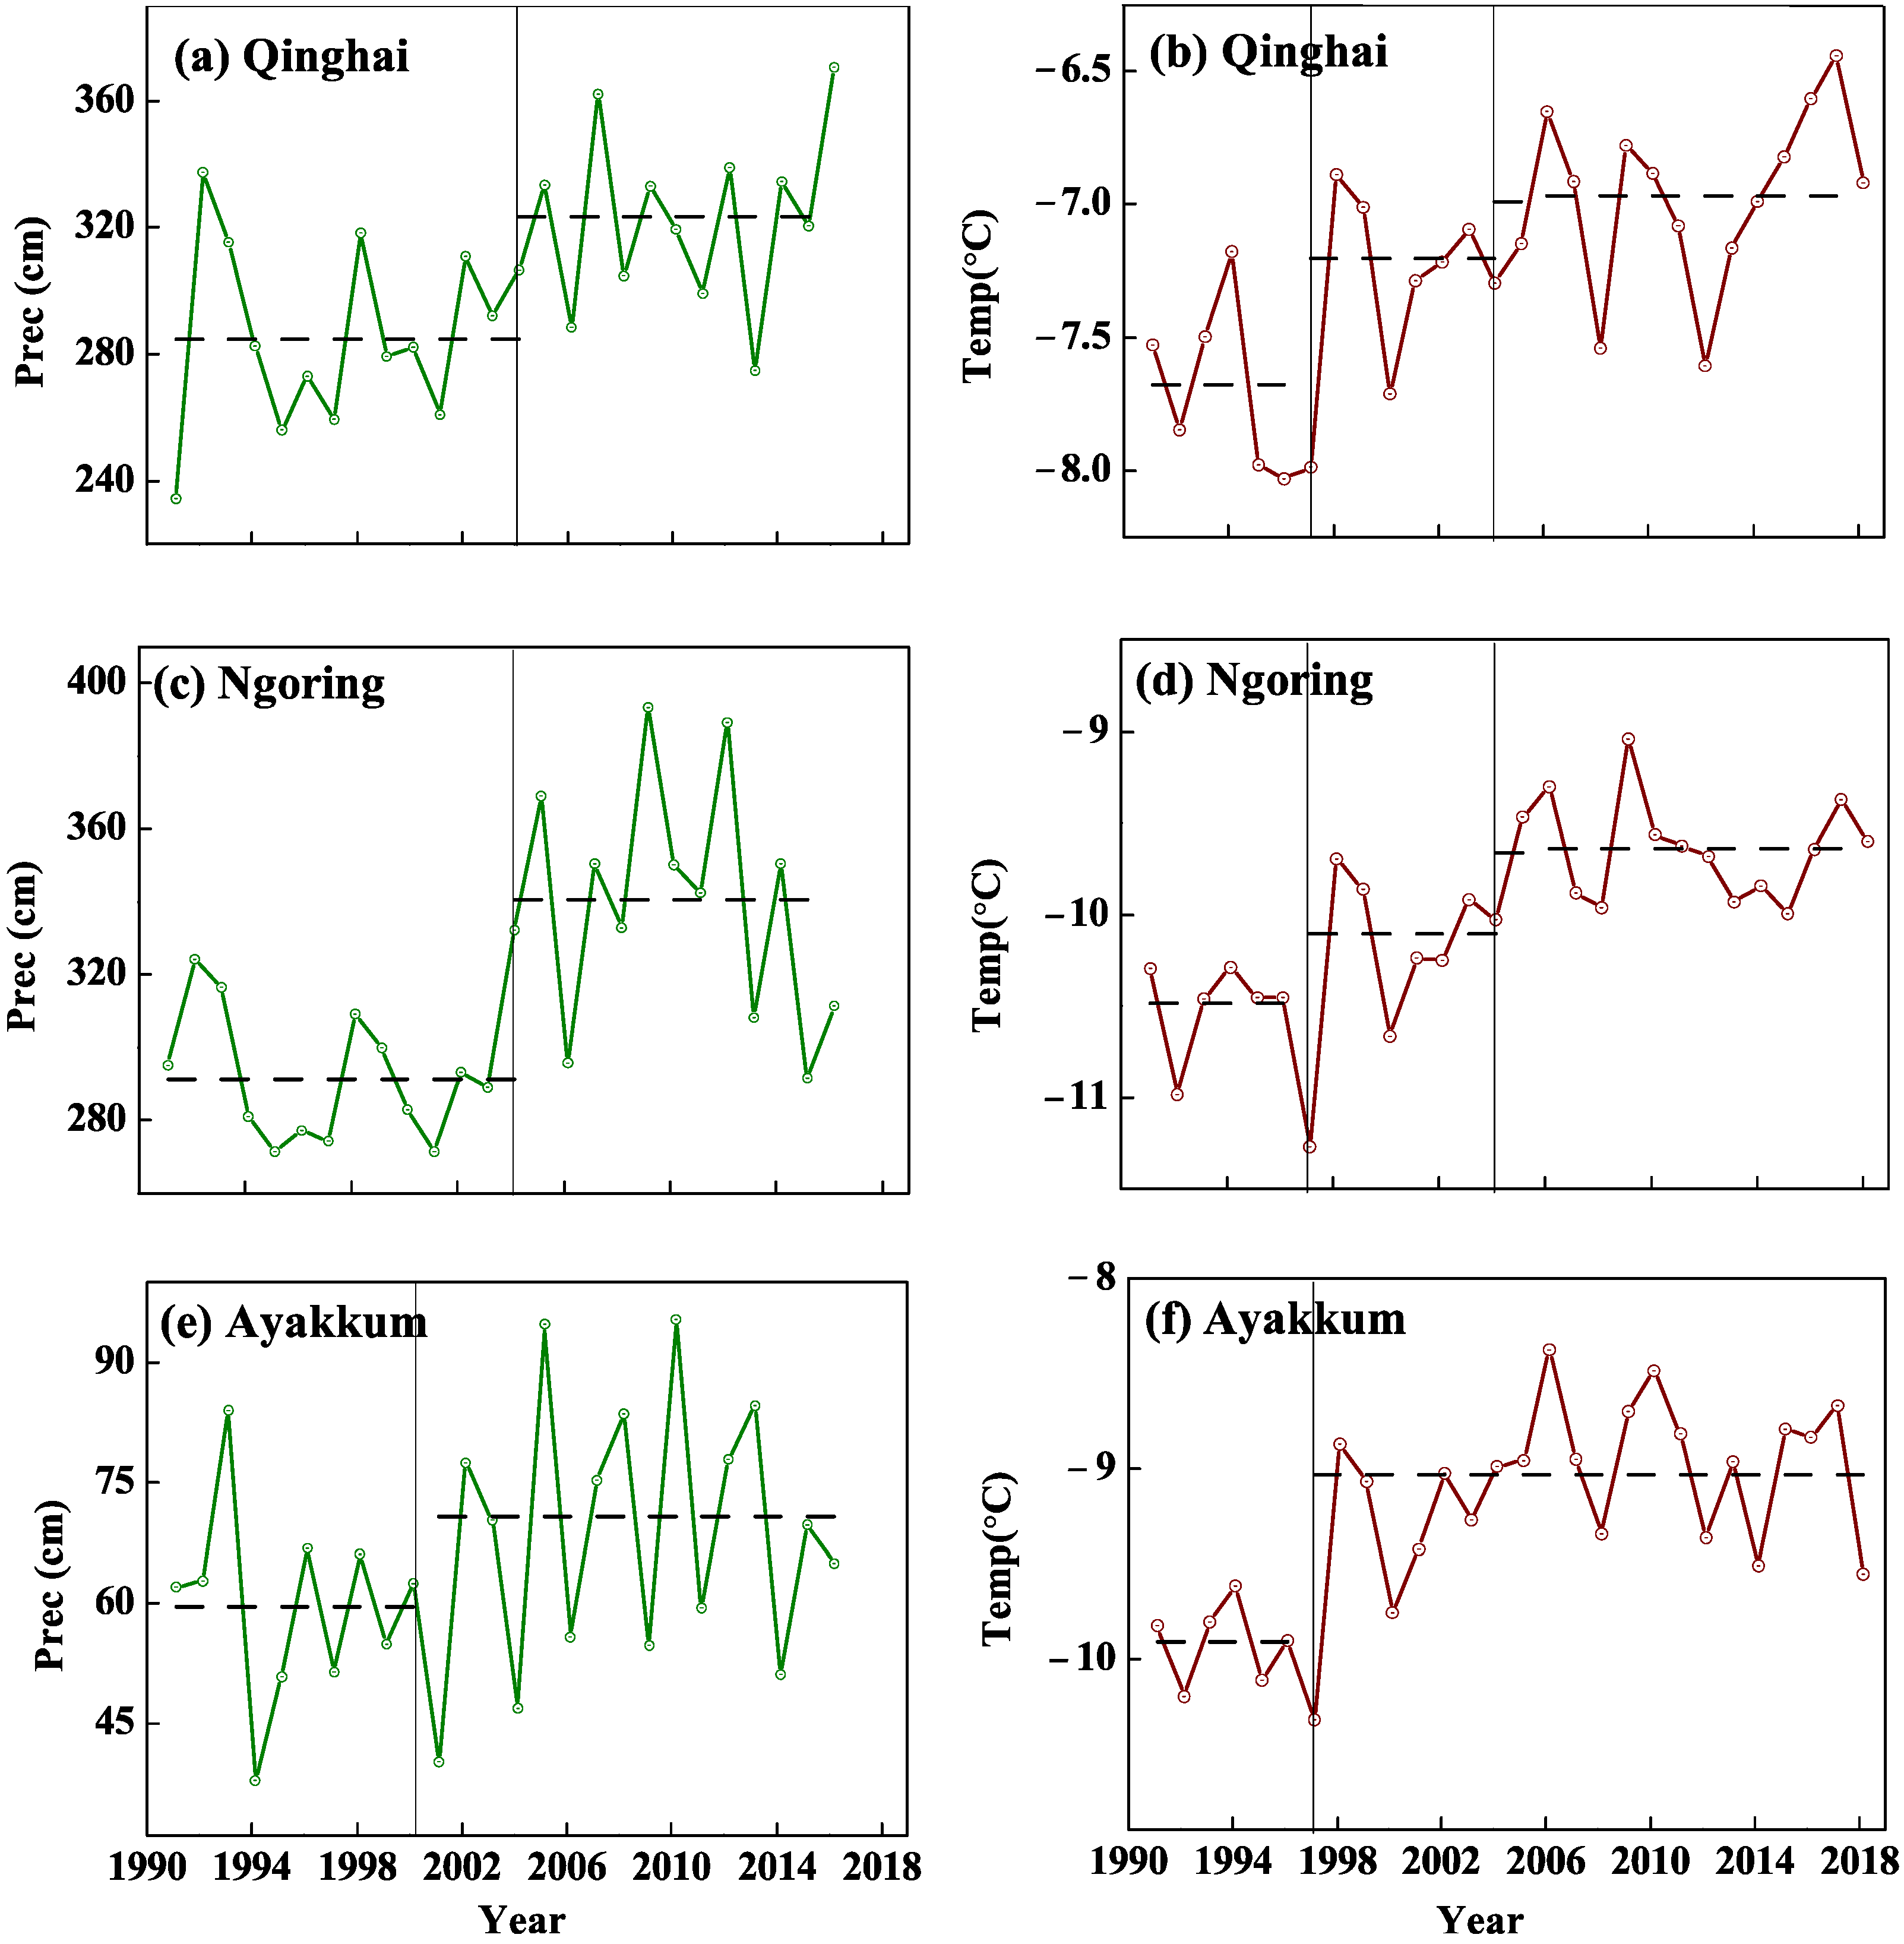
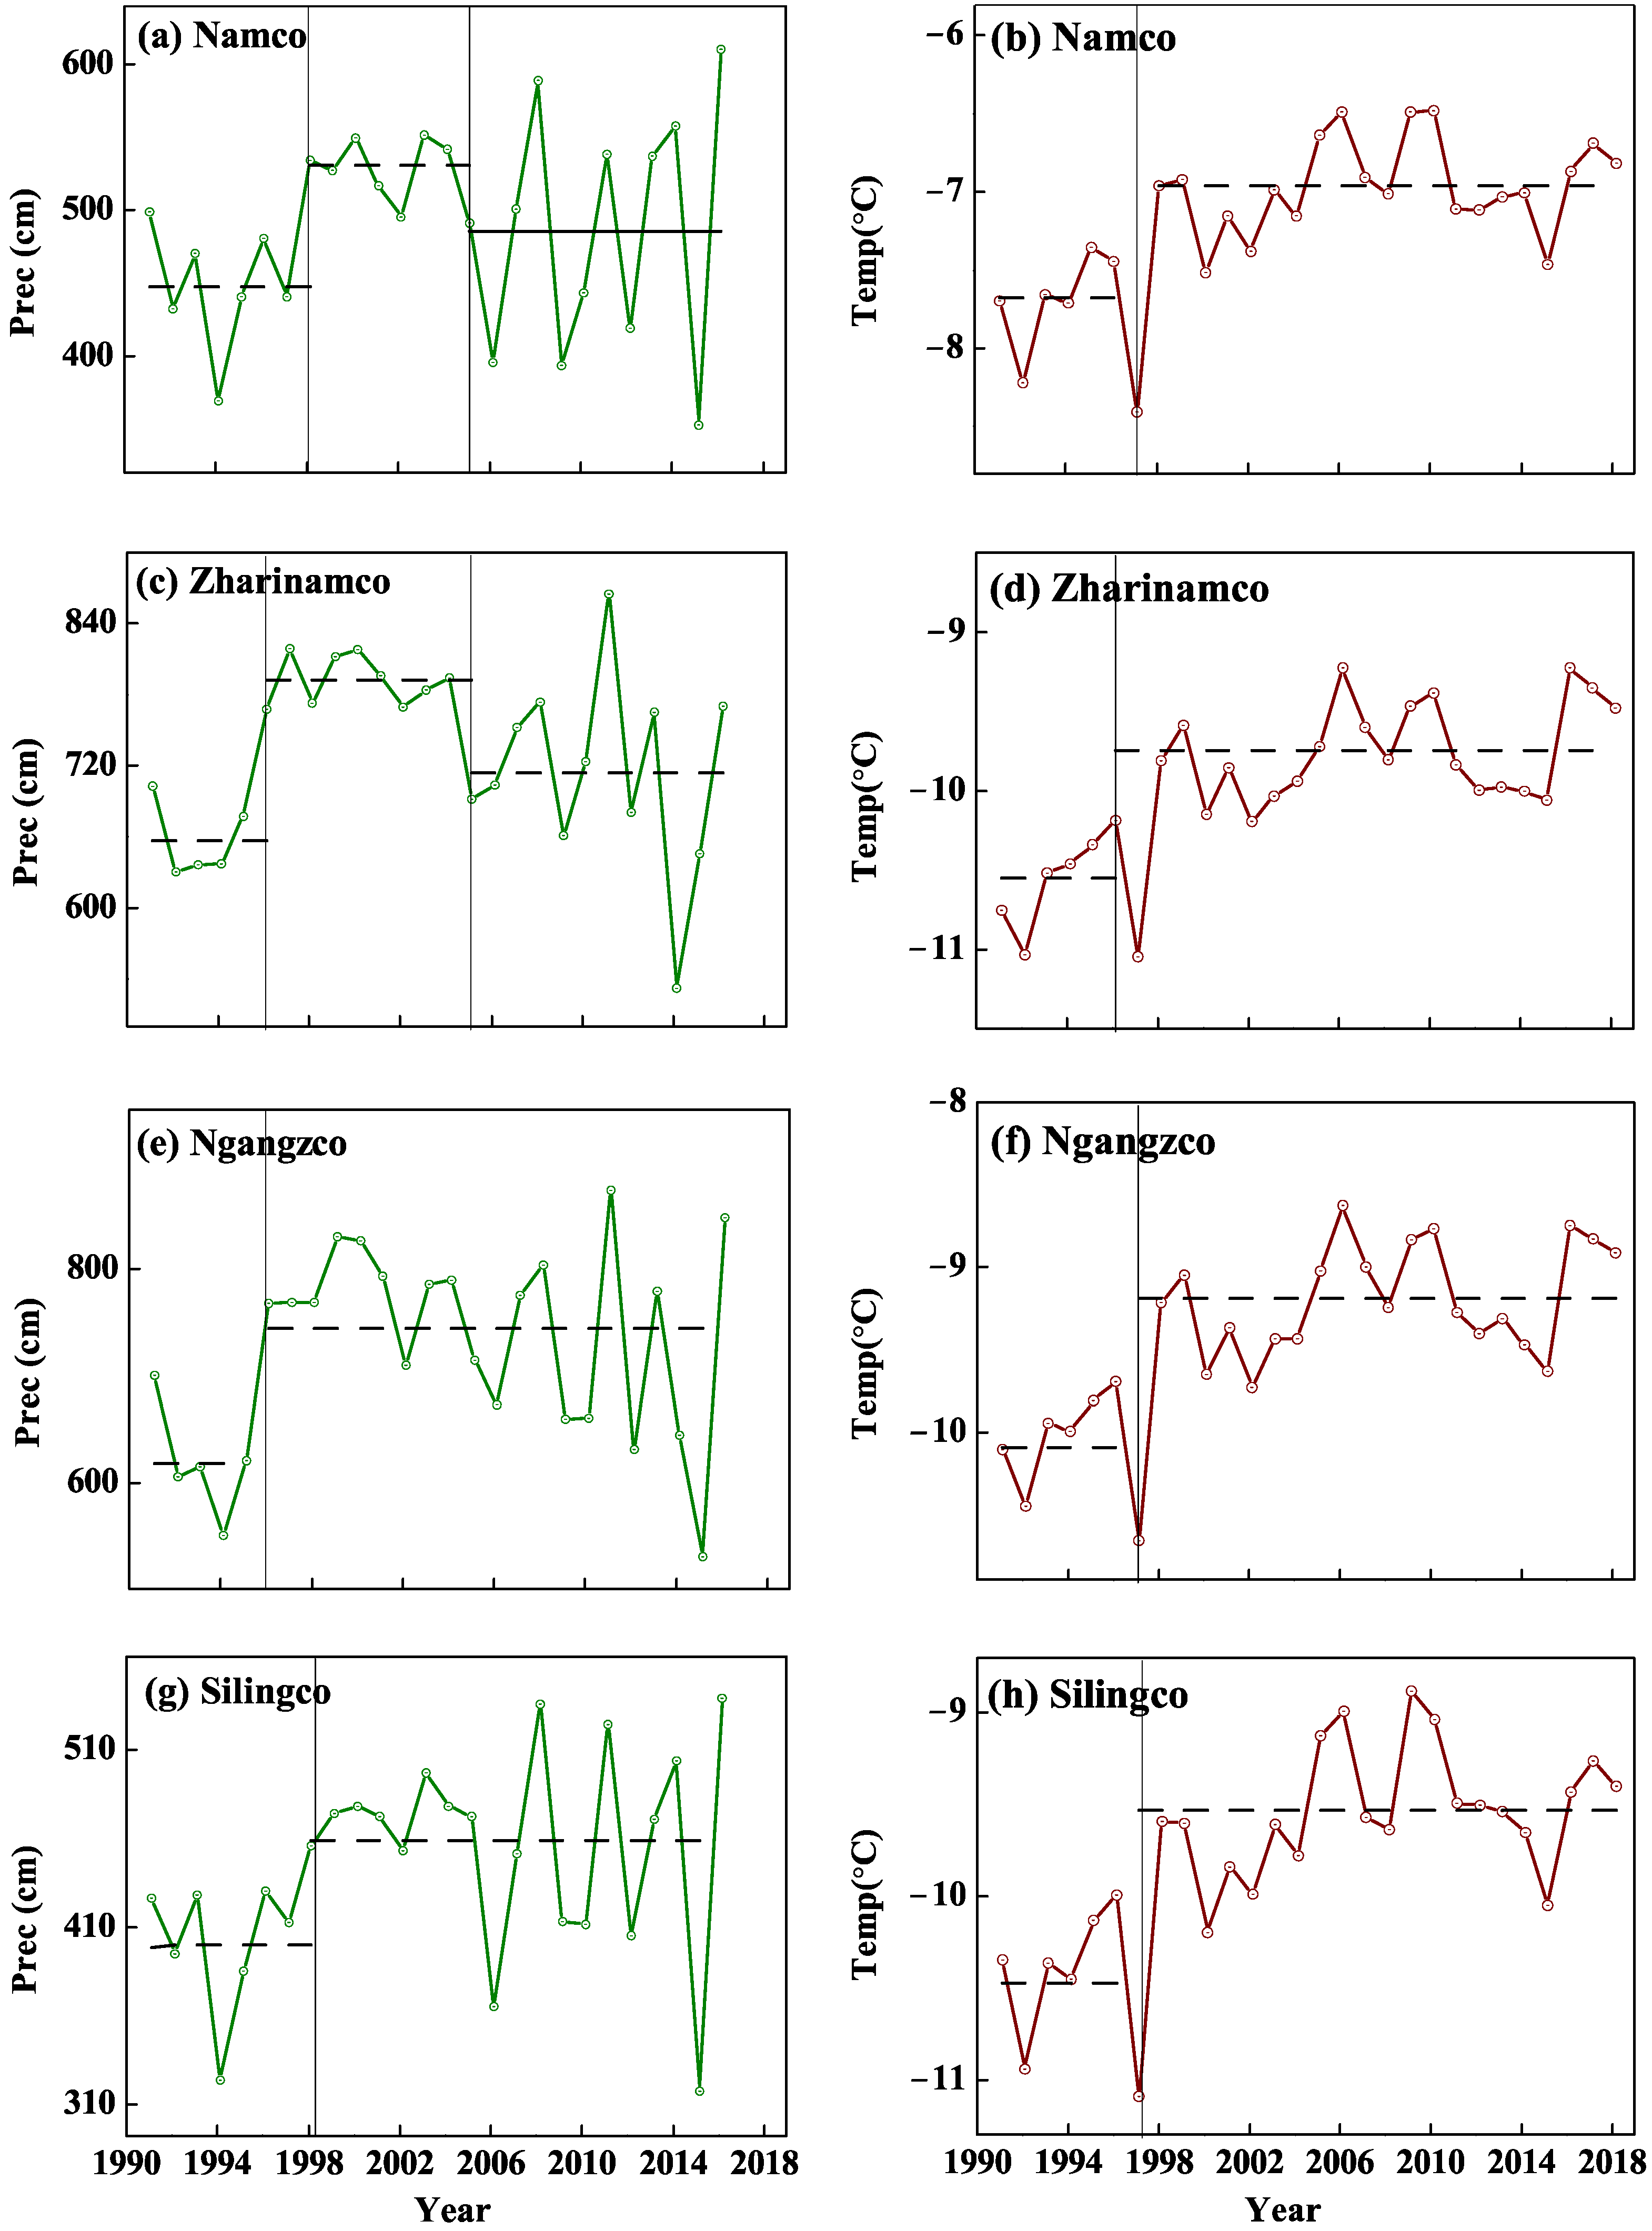
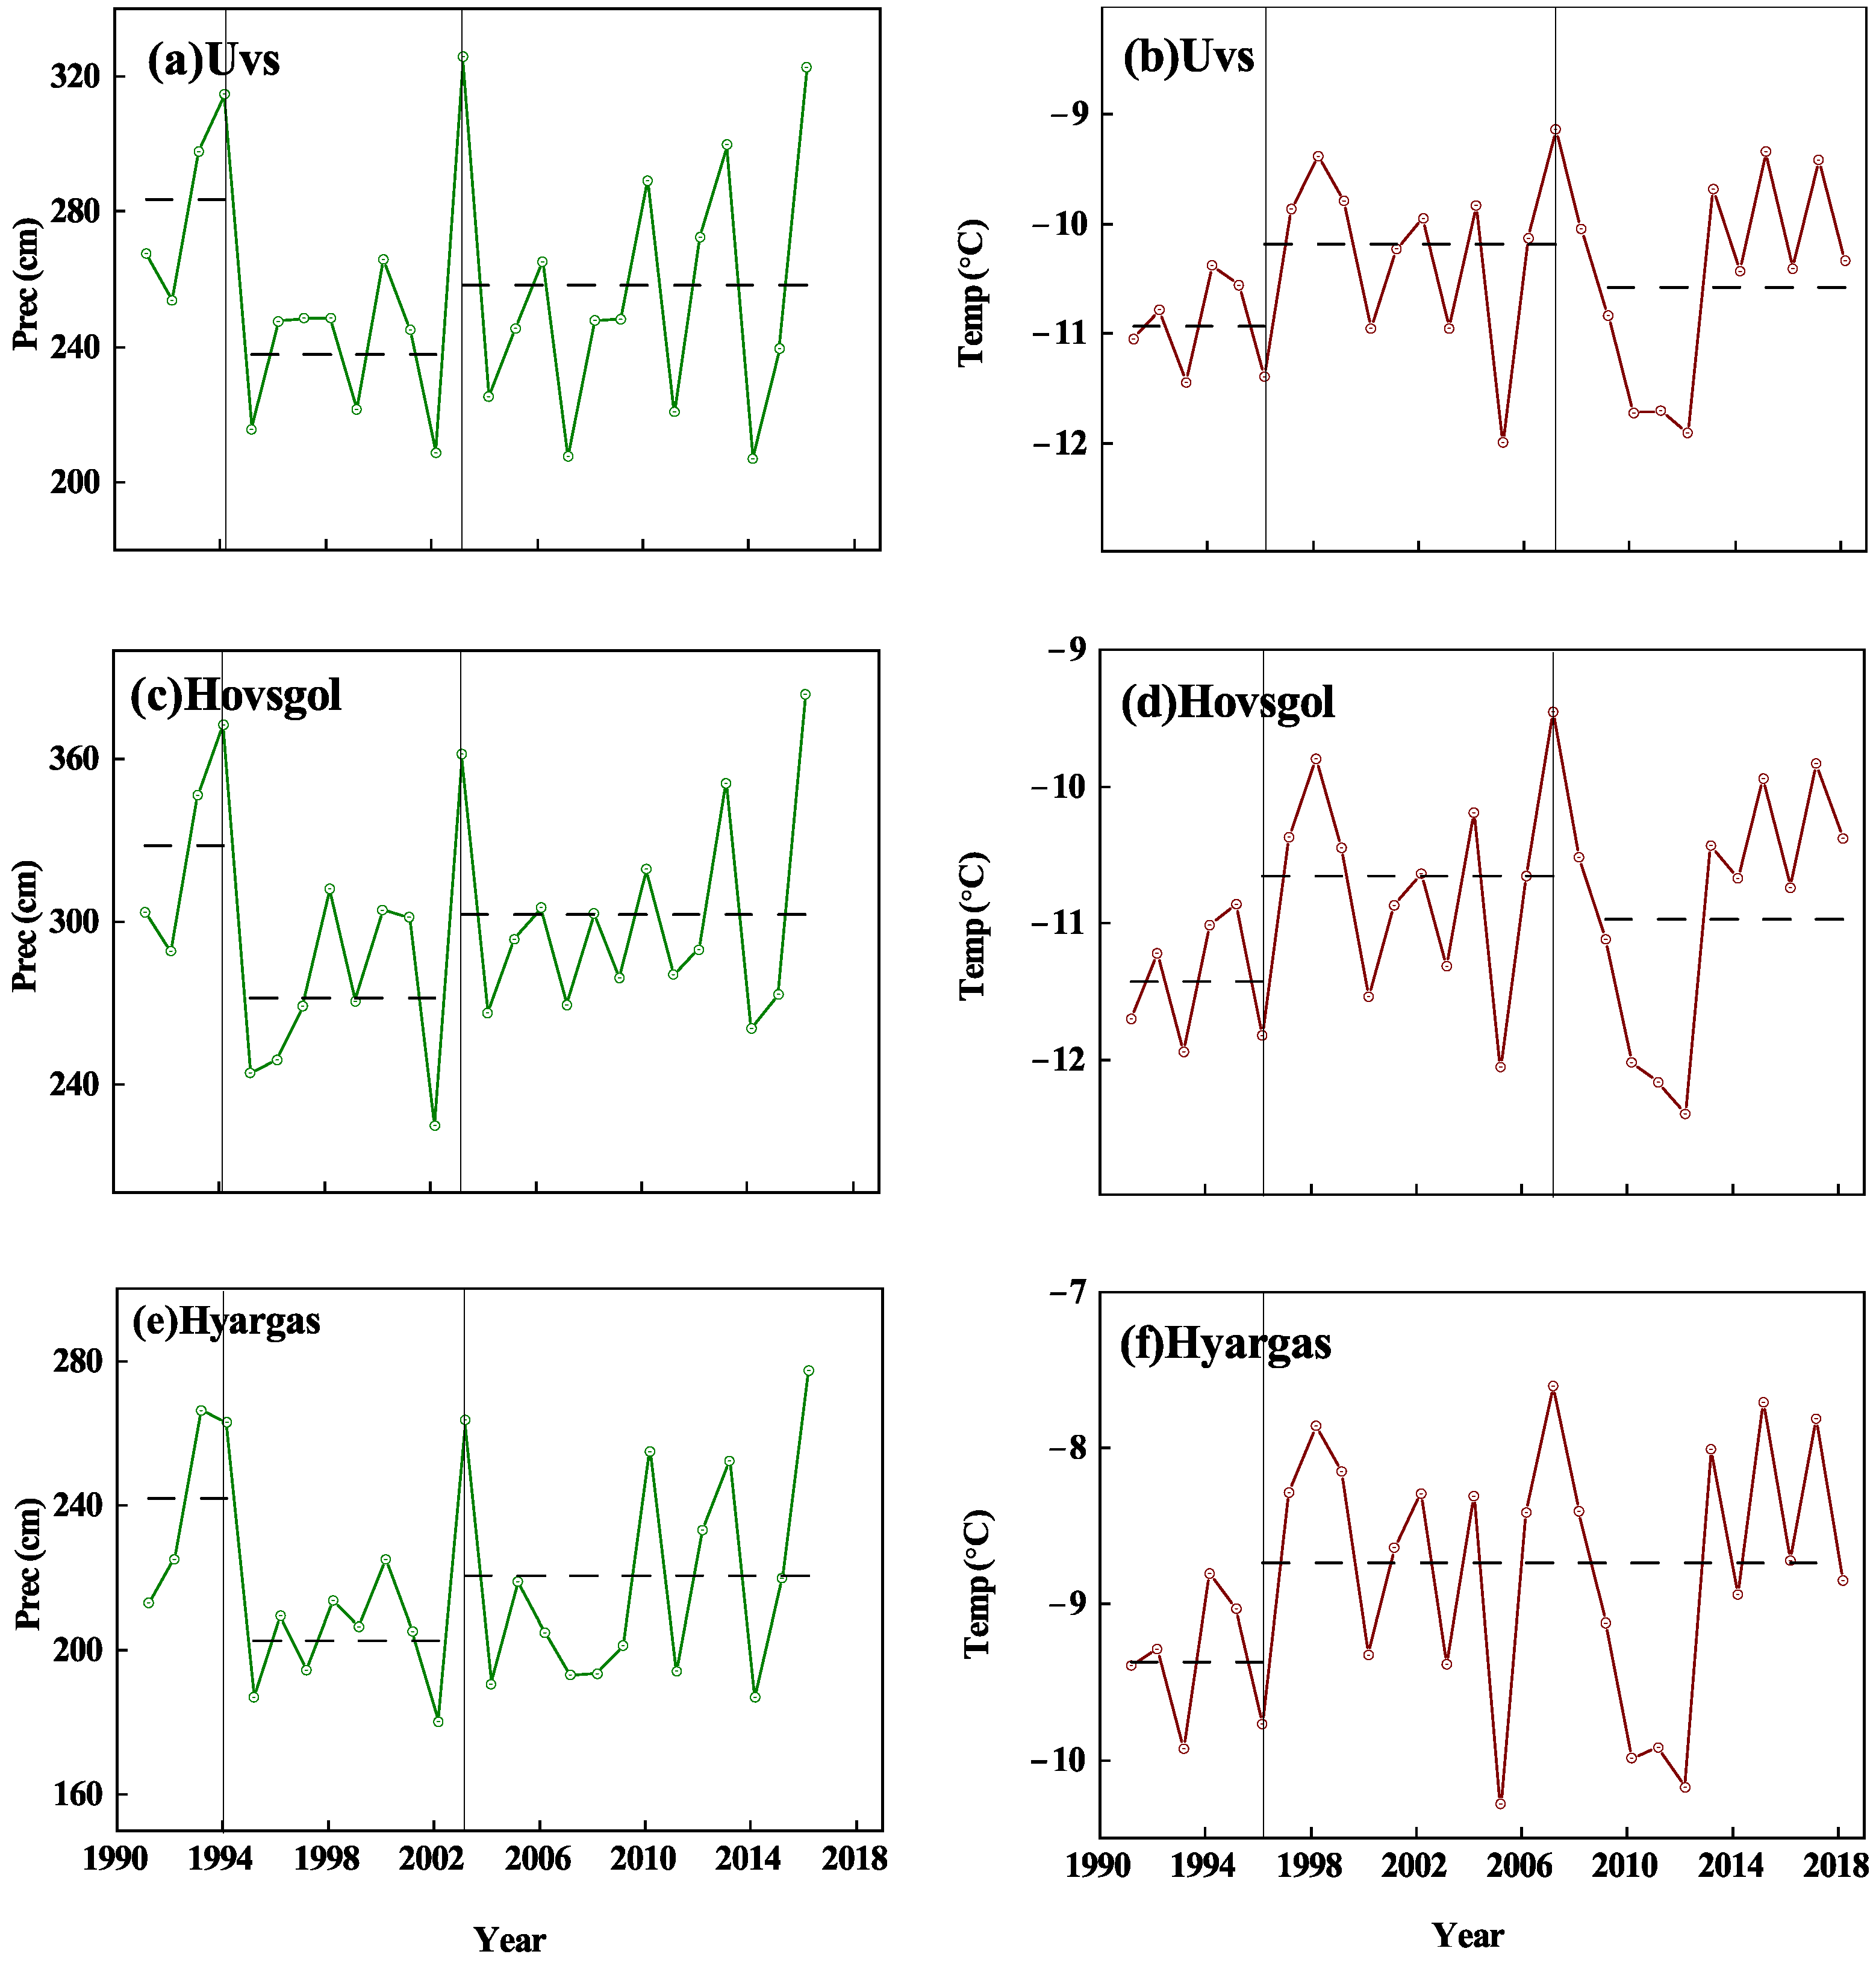
3.3. Regime Shifts in Precipitation and Temperature

To explore possible factors leading to the turning trends in lake level, the regime shift of annual time series of precipitation and air temperature were checked by the Pettitt test and the Bayesian change point test (Table 4).
Two shifts were detected in the precipitation records in the CA region (Figure 5), dividing the period of 1990–2016 into three periods: 1990–1997, 1998–2008, and 2009–2016. Stepwise water level increases were found in the three periods in Lake Balkhash, Lake Issyk-Kul, and Lake Zaysan, linking the lake level growth since 1997 to the regime shift in air temperature in 1997. In the TP, the temperature shift occurred in 1997, similar to that in the CA, and was associated with a corresponding turning point in the lake level variation. The regime shifts in precipitation in the TP were different between the northern and southern parts (Figure 6 and Figure 7): In the northern part of TP, a shift in 2004 was detected in Lake Qinghai and Lake Ngoring, and a shift in 2001 was found in Lake Ayakkum, with an increasing trend of precipitation after the change point. In the southern TP, 1997 and 2004 were identified as shift years in Lake Namco and Zharinamco, respectively. The mean value of precipitation increased in first phase and decreased in second phase (Table 4). In the MP region, the patterns of precipitation and temperature were different from those in the other two regions, corresponding to the gradual decrease in the lake level variation (Figure 8). The shift years of precipitation were found in 1994 and 2003. The precipitation decreased in the first two phases and then increased in the last phase, while shifts in temperature were found in 1997. The air temperature also showed a slight decrease from 2009 onwards.

4. Discussion

The essence of the above analysis consisted in evaluating the potential of terminal lakes as single-point indicators for multiple climate change stresses in large endorheic basins. In this way, the water level variations in endorheic lakes may provide a valuable insight into both the regional hydrological regimes and global circulation changes. The patterns revealed in the three regions under study suggest diverging trends in the Tibetan Plateau, the Central Asia, and the Mongolian Plateau.
The rapidly increasing lake water levels in the TP agreed with previous studies [6,14,15], whereas apparent differences between the northern and southern parts indicated the different characteristics of the hydrological response in the monsoon-dominated southern part of the plateau and the westerlies-dominated northern part. The lake levels in the southern TP started to increase in 2003 but stabilized in approximately 2008, followed by fluctuations without a significant trend. This pattern is also supported by results from Zhang, Xie, Kang, Yi and Ackley [20], who used the ICESat altimetry data available from 2003. On the other hand, the turning point in the northern TP was in approximately 2005, with continuous significant increase in lake levels occurring afterwards.
All lakes in the CA region have experienced a dramatic increase in lake water levels since the 1990s. This consistent rise in lake water levels across all basins in the largest endorheic region is a notable result of the present study. Numerous previous studies have reported an alarming decrease in lake levels from the mid- to late 20th century. The growing water use demand during this century was charged as being responsible for the continuous drying of Lake Issyk-Kul [70,71], Lake Balkhash [72], Lake Zaysan [73], and Lake Sarykamysh [74]. These lakes were threatening to share the fate of the infamous Aral Sea, which had desiccated to 10% of its volume within 40 years between 1960 and 2000 [69,70]. The nearly simultaneous and consistent turn to the water level increase can, in this case, be treated as a signature of a large-scale change in the hydrologic regime in the arid zone of CA. The results agreed with recent findings: Bai et al. [75] investigated the lake area variation in CA based on Landsat images from 1975 to 2007 and found that most of the lake surface area had an increasing trend since 1997. Propastin [76] and Imentai et al. [5] also found that the water level in Lake Balkhash increased from 1993 onwards. We have revealed a similar rise in water level in Sarykamysh, which was additionally affected by regulation of the drained water.
In this regard, Sarykamysh and the two largest remaining water bodies of the Aral Sea: The South Aral Sea and the North Aral Sea are the important representatives of the strongly regulated waters, with different facets of human impact: the level of the North Aral Sea is regulated by a dam, the South Aral Sea experiences a continuous water deficit due to the agricultural water withdraw on its catchment, and Sarykamysh is mainly fed by the runoff from the surrounding irrigated lands. A special case is represented by the two largest remaining water bodies of the Aral Sea: the Aral Sea South and the Aral Sea North. The latter is mainly fed by the inflow of the Syr-Daria River, and its water level has been regulated since 2005 by the Dike Kokaral—a dam separating the North Aral Sea from the rest of the former Aral Sea basin. As a result, the water level in the North Aral Sea had quickly grown to the maximum value allowed by the construction of the dam and has remained nearly constant after 2006, whereas the dam floodgates were kept open for most parts of the year. Simultaneously, the water level in the Aral Sea south stabilized around a constant value after decades of continuous decline. The main tributary of the South Aral Sea, the Amu-Daria River, is strongly regulated and intensively used for irrigation and generally does not reach the lake, partially draining to Sarykamysh Lake (Figure 1). Hence, stabilization of the water level in the South Aral Sea may be interpreted as a result of the same large-scale processes causing the water level increases in other lakes of CA.
Only one of the three regions in our study, the MP, revealed a gradual decrease in lake water levels since 1997. The drying trends are apparent in both large terminal lakes in the region and, to a lesser degree, in the exoreic Lake Hovsgol. This decreasing trend is supported by previous studies which have reported a significant loss in lake area and number, especially from the late 1990s to 2010 based on remote sensing image analysis [15,28]. Our results exhibited decreasing rainfall and growing temperatures in this region, which could further explain this shrinking pattern of lakes that were affected by a drier and warmer climate.
The coherent pattern of the water level changes in the lakes in CA and the TP, covering the largest intracontinental endorheic area, provides an important insight into the climate change effects on the arid Eurasian regions. The turn of the water level trend in the terminal lakes from the long-term decrease [76,77,78,79] to a consistent increase suggests the fundamental changes in the regional atmospheric circulation and water balance. Our results have shown that the spatial pattern of lake water levels was considerably related to climatic variables, such as precipitation and air temperature. The “turning point” can be seen in the trend of lake water levels, for example, in 1997 in CA, 1998 in the southern TP, and 2005 in the northern TP. This phenomenon was considerably related to the climate regime shift: more rainfall and a higher air temperature in the lake basins were found in CA and the TP, especially since 1997. These two regions experienced a climate shift from a warm and dry to a warm and humid environment, which has also been supported by several studies [77,78,79]. The variability in water level in Lake Zaysan (an open lake) was also highly correlated with precipitation variation. Climate regime shift would also have a profound influence on the regional hydrological cycle, and terminal lakes demonstrated their efficiency as indicators of climate shifts at basin spatial scales.
Our results suggest that precipitation was the dominant factor explaining the interannual variability in lake water levels, in particular, in the TP and CA. Our findings were also supported by previous studies [6,7] and validated using hydrological models [80,81]. It is likely that glacial meltwater may also contribute to the water level increases in endorheic lakes when the basins contain glaciers. This is especially important in the TP and CA, where the meltwater from glaciers can be the major tributary to surface runoff, and most glaciers have been experiencing melting over the past decades due to increasing air temperatures since 1997 [82]; this provided further positive feedback on the evaporation–precipitation balance. However, satellite data and glacier mass balance suggest that increased glacial meltwater contributed only ~10% to lake expansion in the interior TP [83], and that the glacial runoff into the lakes themselves should not increase the overall water volume mass on the TP [9]. Additionally, according to hydrological modeling [80], the glacial meltwater contribution to basin runoff played a less important role compared to precipitation in nonglacial-fed land surfaces. The study on Lake Silingco [84] found that glacial meltwater contributed to less than 10% of the water input to the lake basin. On the other hand, several studies have pointed to the importance of glacial meltwater in recent lake variations [20,85]. Hence, the role of glacial meltwater needs further investigation with regard to lake level variations. Furthermore, the different interactions between glacial runoff and atmospheric circulation, when analyzed in more detail, may explain the differences found in the lake responses, such as non-coincidental turning points in the water level trends between the northern and southern parts of the TP.

5. Conclusions

Based on satellite altimetry databases and global gridded climate products, we analyzed the characteristics of the water levels in terminal lakes in Central Asia, the Tibetan Plateau, and the Mongolian Plateau regions, where more than 50% of endorheic basins are concentrated. The synergetic comparative analysis of magnitude and variability in lake levels included cumulative analysis and change point tests and revealed their links with climatic variables. The major outcomes of this study demonstrated that the water levels in Mongolian lakes dramatically decreased during the past two decades, whereas the lake levels showed generally increasing trends in the TP and CA. The lake level patterns in the TP and CA had different interannual variabilities: the increasing trends were significant until 2008 in CA, while the increasing trends were more noticeable from approximately 1997 onwards in the southern TP and from approximately 2005 onwards in the northern TP. Precipitation was found to be the main climatic driver causing the differences in the response of terminal lake levels to the global warming in the three neighboring regions. While all three regions revealed similar patterns of air temperature with consistent warming after 1997, the precipitation were diverging: the TP and CA became wetter while the MP became drier. The shift year of precipitation occurred in 1997 and 2008 in CA, in 2004 in the northern part of the TP, and in 1997 and 2008 in the southern part of the TP. The decadal variability and distinctly different spatial patterns of lake water level variability in the three adjacent lake zones demonstrated diverging responses to climate change within the Eurasian endorheic zone.

Supplementary Materials

The following are available online at https://www.mdpi.com/article/10.3390/rs13183705/s1, Figure S1. Comparisons of annual water levels from three altimetry datasets for five lakes in Central Asia between 1992 and 2018. The blue line is the data from Hydroweb, the black line is from GREALM and the grey line is from DAHITI. Figure S2. Comparisons of water level in four lakes located in the southern Tibetan Plateau. The annual time series are shown since 1995 in Lake Namco and Lake Silingco, and since 1992 in Lake Zharinamco and Lake Ngangzco. The blue curve is the data from Hydroweb and the black is the data from GREALM and the grey is from DAHITI. Figure S3. Comparisons of water level in three lakes located in the northern Tibetan Plateau. The annual time series are shown since 1992 in Lake Ngoring and since 1995 in Lake Qinghai and Lake Ayakkum. The blue curve is the data from Hydroweb and the black is the data from GREALM and the grey curve is from DAHITI. Figure S4. Comparisons of water level in three lakes located in the Mongolian Plateau. The annual time series are shown since 1992 in Lake Hovsgol and since 2002 in Lake Uvs and Lake Hyargas. The blue curve is the data from Hydroweb and the black is the data from GREALM and the grey curve is from DAHITI. Figure S5. The relationship between water level variation and climatic factors over six lakes in Central Asia. The climatic factors include precipitation and air temperature from 1992 to 2018. The left panel is the cumulative precipitation anomalies (blue line), and the right panel is the cumulative temperature anomalies (orange line) at basin scale compared with lake levels (gray line) shown on the right x-axis. Figure S6. The relationship between water level variation and precipitation and air temperature from 1992 to 2018 over three lakes in the northern Tibetan Plateau. The precipitation and air temperature are from 1992 to 2018. The left panel is the cumulative precipitation anomalies (blue line), and the right panel is the cumulative temperature anomalies (orange line) at basin scale compared with lake levels (gray line) shown on the right x-axis. Figure S7. The relationship between water level variation and precipitation and air temperature are from 1992 to 2018 over four lakes in the southern Tibetan Plateau. The left panel is the cumulative precipitation anomalies (blue line), and the right panel is the cumulative temperature anomalies (orange line) at basin scale compared with lake levels (gray line) shown on the right x-axis. Figure S8. The relationship between water level variation and precipitation and air temperature from 1992 to 2018 over three lakes in the Mongolian Plateau. The left panel is the cumulative precipitation anomalies (blue line), and the right panel is the cumulative temperature anomalies (orange line) at basin scale compared with lake levels (gray line) shown on the right x-axis.

Author Contributions

G.K. and X.Z. conceived the study; X.Z. developed the methodology; X.Z. and A.K. prepared and processed the data; G.K. and X.Z. performed the final analysis, X.Z. wrote the original draft manuscript; G.K., X.Z. and A.K. contributed to the final version. All authors have read and agreed to the published version of the manuscript.

Funding

This research was funded by the funded by the German Research Foundation (DFG grants KI 853/16-1 and GR 1540/37-1), by the German Federal Ministry of Education and Research (BMBF grant 01LP2006A), and by the Sino-German Center for Research Promotion (CDZ project GZ1259). GK and AK were supported by the Ministry of Education and Science of the Republic of Kazakhstan (Project ID: AP05134202).

Institutional Review Board Statement

Not applicable.

Informed Consent Statement

Not applicable.

Data Availability Statement

The satellite altimetry data used in the study are available from the Hydroweb (http://hydroweb.theia-land.fr/, accessed on 13 July 2021) Global Reservoir and Lake Monitor (G-REALM, https://ipad.fas.usda.gov/cropexplorer/global_reservoir/, accessed on 14 July 2021), and Database for Hydrological Time Series of Inland Waters (DAHITI, https://dahiti.dgfi.tum.de/, accessed on 13 July 2021). The precipitation data are available from the Global Precipitation Climatology Centre products (GPCC, https://www.dwd.de/EN/ourservices/gpcc/gpcc.html, accessed on 13 July 2021), precipitation products from the University of Delaware (UDEL, http://climate.geog.udel.edu/~climate/html_pages/download.html, accessed on 13 July 2021). The temperature and precipitation dataset was adopted from Climate Research Unit products (CRU, http://www.cru.uea.ac.uk/data, accessed on 13 July 2021).

Acknowledgments

We gratefully acknowledge the work of research teams behind the Hydroweb, G-REALM, and DAHITI satellite altimetry products, who provided the data essential for the study. The study was performed under financial support of BMBF, DFG, and CDZ (see Funding Section for details), which is thankfully appreciated.

Conflicts of Interest

The authors declare no conflict of interest.

References

  1. Dudgeon, D.; Arthington, A.H.; Gessner, M.O.; Kawabata, Z.-I.; Knowler, D.J.; Lévêque, C.; Naiman, R.J.; Prieur-Richard, A.-H.; Soto, D.; Stiassny, M.L.J.; et al. Freshwater biodiversity: Importance, threats, status and conservation challenges. Biol. Rev. 2006, 81, 163–182. [Google Scholar] [CrossRef] [PubMed]
  2. Lioubimtseva, E. Impact of Climate Change on the Aral Sea and Its Basin. In The Aral Sea; Springer: Berlin/Heidelberg, Germany, 2014; Volume 10178, pp. 405–427. [Google Scholar]
  3. Shinneman, A.L.C.; Almendinger, J.E.; Umbanhowar, C.E.; Edlund, M.B.; Nergui, S. Paleolimnologic Evidence for Recent Eutrophication in the Valley of the Great Lakes (Mongolia). Ecosystems 2009, 12, 944–960. [Google Scholar] [CrossRef]
  4. Yakutin, M.V.; Andrievskii, V.S.; Lhagvasuren, C. Change in the main components of the destruction link of biological cycle in the series of plain soils of the Great Lakes Depression in West Mongolia. Contemp. Probl. Ecol. 2010, 3, 305–311. [Google Scholar] [CrossRef]
  5. Imentai, A.; Thevs, N.; Schmidt, S.; Nurtazin, S.; Salmurzauli, R. Vegetation, fauna, and biodiversity of the Ile Delta and southern Lake Balkhash—A review. J. Great Lakes Res. 2015, 41, 688–696. [Google Scholar] [CrossRef]
  6. Song, C.; Huang, B.; Ke, L.; Richards, K.S. Seasonal and abrupt changes in the water level of closed lakes on the Tibetan Plateau and implications for climate impacts. J. Hydrol. 2014, 514, 131–144. [Google Scholar] [CrossRef]
  7. Lei, Y.; Yao, T.; Bird, B.W.; Yang, K.; Zhai, J.; Sheng, Y. Coherent lake growth on the central Tibetan Plateau since the 1970s: Characterization and attribution. J. Hydrol. 2013, 483, 61–67. [Google Scholar] [CrossRef]
  8. Li, B.; Zhang, J.; Yu, Z.; Liang, Z.; Chen, L.; Acharya, K. Climate change driven water budget dynamics of a Tibetan inland lake. Glob. Planet. Chang. 2017, 150, 70–80. [Google Scholar] [CrossRef]
  9. Zhang, G.; Yao, T.; Xie, H.; Kang, S.; Lei, Y. Increased mass over the Tibetan Plateau: From lakes or glaciers? Geophys. Res. Lett. 2013, 40, 2125–2130. [Google Scholar] [CrossRef]
  10. Hu, Z.; Zhang, C.; Hu, Q.; Tian, H. Temperature Changes in Central Asia from 1979 to 2011 Based on Multiple Datasets. J. Clim. 2013, 27, 1143–1167. [Google Scholar] [CrossRef]
  11. Chen, F.; Huang, W.; Jin, L.; Chen, J.; Wang, J. Spatiotemporal precipitation variations in the arid Central Asia in the context of global warming. Sci. China Earth Sci. 2011, 54, 1812–1821. [Google Scholar] [CrossRef]
  12. Yang, K.; Wu, H.; Qin, J.; Lin, C.; Tang, W.; Chen, Y. Recent climate changes over the Tibetan Plateau and their impacts on energy and water cycle: A review. Glob. Planet. Chang. 2014, 112, 79–91. [Google Scholar] [CrossRef]
  13. Oki, T.; Kanae, S. Global Hydrological Cycles and World Water Resources. Science 2006, 313, 1068. [Google Scholar] [CrossRef] [Green Version]
  14. Zhao, Y.; Liao, J.J.; Shen, G.Z.; Zhang, X.L. Monitoring lake level changes by altimetry in the arid region of Central Asia. IOP Conf. Ser. Earth Environ. Sci. 2017, 74, 012004. [Google Scholar] [CrossRef] [Green Version]
  15. Zhang, G.; Yao, T.; Piao, S.; Bolch, T.; Xie, H.; Chen, D.; Gao, Y.; O’Reilly, C.M.; Shum, C.K.; Yang, K.; et al. Extensive and drastically different alpine lake changes on Asia’s high plateaus during the past four decades. Geophys. Res. Lett. 2017, 44, 252–260. [Google Scholar] [CrossRef] [Green Version]
  16. Song, C.; Huang, B.; Ke, L. Heterogeneous change patterns of water level for inland lakes in High Mountain Asia derived from multi-mission satellite altimetry. Hydrol. Process. 2015, 29, 2769–2781. [Google Scholar] [CrossRef]
  17. Kouraev, A.V.; Kostianoy, A.G.; Lebedev, S.A. Ice cover and sea level of the Aral Sea from satellite altimetry and radiometry (1992–2006). J. Mar. Syst. 2009, 76, 272–286. [Google Scholar] [CrossRef]
  18. Chen, J.L.; Pekker, T.; Wilson, C.R.; Tapley, B.D.; Kostianoy, A.G.; Cretaux, J.F.; Safarov, E.S. Long-term Caspian Sea level change. Geophys. Res. Lett. 2017, 44, 6993–7001. [Google Scholar] [CrossRef]
  19. Lioubimtseva, E.; Cole, R. Uncertainties of Climate Change in Arid Environments of Central Asia. Rev. Fish. Sci. 2006, 14, 29–49. [Google Scholar] [CrossRef]
  20. Zhang, G.; Xie, H.; Kang, S.; Yi, D.; Ackley, S.F. Monitoring lake level changes on the Tibetan Plateau using ICESat altimetry data (2003–2009). Remote Sens. Environ. 2011, 115, 1733–1742. [Google Scholar] [CrossRef]
  21. Phan, V.H.; Lindenbergh, R.C.; Menenti, M. Geometric dependency of Tibetan lakes on glacial runoff. Hydrol. Earth Syst. Sci. 2013, 17, 4061–4077. [Google Scholar] [CrossRef] [Green Version]
  22. Lei, Y.; Yao, T.; Yang, K.; Sheng, Y.; Kleinherenbrink, M.; Yi, S.; Bird, B.W.; Zhang, X.; Zhu, L.; Zhang, G. Lake seasonality across the Tibetan Plateau and their varying relationship with regional mass changes and local hydrology. Geophys. Res. Lett. 2017, 44, 892–900. [Google Scholar] [CrossRef] [Green Version]
  23. Wang, H.; Chu, Y.; Huang, Z.; Hwang, C.; Chao, N. Robust, Long-term Lake Level Change from Multiple Satellite Altimeters in Tibet: Observing the Rapid Rise of Ngangzi Co over a New Wetland. Remote Sens. 2019, 11, 558. [Google Scholar] [CrossRef] [Green Version]
  24. Held, I.M.; Soden, B.J. Robust Responses of the Hydrological Cycle to Global Warming. J. Clim. 2006, 19, 5686–5699. [Google Scholar] [CrossRef]
  25. Chou, C.; Chiang, J.C.H.; Lan, C.-W.; Chung, C.-H.; Liao, Y.-C.; Lee, C.-J. Increase in the range between wet and dry season precipitation. Nat. Geosci. 2013, 6, 263–267. [Google Scholar] [CrossRef]
  26. Hu, Z.; Chen, X.; Chen, D.; Li, J.; Wang, S.; Zhou, Q.; Yin, G.; Guo, M. “Dry gets drier, wet gets wetter”: A case study over the arid regions of central Asia. Int. J. Climatol. 2019, 39, 1072–1091. [Google Scholar] [CrossRef]
  27. Dilinuer, T.; Yao, J.-Q.; Chen, J.; Mao, W.-Y.; Yang, L.-M.; Yeernaer, H.; Chen, Y.-H. Regional drying and wetting trends over Central Asia based on Köppen climate classification in 1961–2015. Adv. Clim. Chang. Res. 2021, 12, 363–372. [Google Scholar] [CrossRef]
  28. Tan, Q.; Liu, Y. Spatiotemporal variation and climatic response of water level of major lakes in China, Mongolia, and Russia. Open Geosci. 2020, 12, 1200–1211. [Google Scholar] [CrossRef]
  29. Yang, X.; Wang, N.; Chen, A.a.; He, J.; Hua, T.; Qie, Y. Changes in area and water volume of the Aral Sea in the arid Central Asia over the period of 1960–2018 and their causes. CATENA 2020, 191, 104566. [Google Scholar] [CrossRef]
  30. Liu, H.; Chen, Y.; Ye, Z.; Li, Y.; Zhang, Q. Recent Lake Area Changes in Central Asia. Sci. Rep. 2019, 9, 16277. [Google Scholar] [CrossRef] [Green Version]
  31. Yao, T.; Masson-Delmotte, V.; Gao, J.; Yu, W.; Yang, X.; Risi, C.; Sturm, C.; Werner, M.; Zhao, H.; He, Y.; et al. A review of climatic controls on δ18O in precipitation over the Tibetan Plateau: Observations and simulations. Rev. Geophys. 2013, 51, 525–548. [Google Scholar] [CrossRef]
  32. Yao, T.; Thompson, L.; Yang, W.; Yu, W.; Gao, Y.; Guo, X.; Yang, X.; Duan, K.; Zhao, H.; Xu, B.; et al. Different glacier status with atmospheric circulations in Tibetan Plateau and surroundings. Nat. Clim. Chang. 2012, 2, 663–667. [Google Scholar] [CrossRef]
  33. Crétaux, J.F.; Jelinski, W.; Calmant, S.; Kouraev, A.; Vuglinski, V.; Bergé-Nguyen, M.; Gennero, M.C.; Nino, F.; Abarca Del Rio, R.; Cazenave, A.; et al. SOLS: A lake database to monitor in the Near Real Time water level and storage variations from remote sensing data. Adv. Space Res. 2011, 47, 1497–1507. [Google Scholar] [CrossRef]
  34. Birkett, C.M. The contribution of TOPEX/POSEIDON to the global monitoring of climatically sensitive lakes. J. Geophys. Res. Ocean. 1995, 100, 25179–25204. [Google Scholar] [CrossRef]
  35. Birkett, C.M.; Beckley, B. Investigating the Performance of the Jason-2/OSTM Radar Altimeter over Lakes and Reservoirs. Mar. Geod. 2010, 33, 204–238. [Google Scholar] [CrossRef]
  36. Schwatke, C.; Dettmering, D.; Bosch, W.; Seitz, F. DAHITI—An innovative approach for estimating water level time series over inland waters using multi-mission satellite altimetry. Hydrol. Earth Syst. Sci. 2015, 19, 4345–4364. [Google Scholar] [CrossRef] [Green Version]
  37. Crétaux, J.F.; Abarca-del-Río, R.; Bergé-Nguyen, M.; Arsen, A.; Drolon, V.; Clos, G.; Maisongrande, P. Lake Volume Monitoring from Space. Surv. Geophys. 2016, 37, 269–305. [Google Scholar] [CrossRef] [Green Version]
  38. Martina, R.; Charon, M.B.; James, C.; Jean-Francois, C. Intercomparison and validation of continental water level products derived from satellite radar altimetry. J. Appl. Remote Sens. 2012, 6, 063614. [Google Scholar] [CrossRef]
  39. Birkett, C.; Reynolds, C.; Beckley, B.; Doorn, B. From Research to Operations: The USDA Global Reservoir and Lake Monitor. In Coastal Altimetry; Vignudelli, S., Kostianoy, A.G., Cipollini, P., Benveniste, J., Eds.; Springer: Berlin/Heidelberg, Germany, 2011; pp. 19–50. [Google Scholar]
  40. Becker, A.; Finger, P.; Meyer-Christoffer, A.; Rudolf, B.; Schamm, K.; Schneider, U.; Ziese, M. A description of the global land-surface precipitation data products of the Global Precipitation Climatology Centre with sample applications including centennial (trend) analysis from 1901–present. Earth Syst. Sci. Data 2013, 5, 71–99. [Google Scholar] [CrossRef] [Green Version]
  41. Schneider, U.; Finger, P.; Meyer-Christoffer, A.; Rustemeier, E.; Ziese, M.; Becker, A. Evaluating the Hydrological Cycle over Land Using the Newly-Corrected Precipitation Climatology from the Global Precipitation Climatology Centre (GPCC). Atmosphere 2017, 8, 52. [Google Scholar] [CrossRef] [Green Version]
  42. Willmott., C.J.; Matsuurra, K. Terrestrial Precipitation: 1900–2017 Gridded Monthly Time Series (Version 5.01). 2018. Available online: http://climate.geog.udel.edu/~climate/html_pages/download.html (accessed on 13 July 2021).
  43. Harris, I.; Jones, P.D.; Osborn, T.J.; Lister, D.H. Updated high-resolution grids of monthly climatic observations—The CRU TS3.10 Dataset. Int. J. Climatol. 2014, 34, 623–642. [Google Scholar] [CrossRef] [Green Version]
  44. Schiemann, R.; Lüthi, D.; Vidale, P.L.; Schär, C. The precipitation climate of Central Asia—Intercomparison of observational and numerical data sources in a remote semiarid region. Int. J. Climatol. 2008, 28, 295–314. [Google Scholar] [CrossRef]
  45. Sun, Q.; Miao, C.; Duan, Q.; Ashouri, H.; Sorooshian, S.; Hsu, K.-L. A Review of Global Precipitation Data Sets: Data Sources, Estimation, and Intercomparisons. Rev. Geophys. 2018, 56, 79–107. [Google Scholar] [CrossRef] [Green Version]
  46. Thorndahl, S.; Einfalt, T.; Willems, P.; Nielsen, J.E.; ten Veldhuis, M.C.; Arnbjerg-Nielsen, K.; Rasmussen, M.R.; Molnar, P. Weather radar rainfall data in urban hydrology. Hydrol. Earth Syst. Sci. 2017, 21, 1359–1380. [Google Scholar] [CrossRef] [Green Version]
  47. Hu, Z.; Zhou, Q.; Chen, X.; Li, J.; Li, Q.; Chen, D.; Liu, W.; Yin, G. Evaluation of three global gridded precipitation data sets in central Asia based on rain gauge observations. Int. J. Climatol. 2018, 38, 3475–3493. [Google Scholar] [CrossRef]
  48. Hu, Z.; Zhou, Q.; Chen, X.; Qian, C.; Wang, S.; Li, J. Variations and changes of annual precipitation in Central Asia over the last century. Int. J. Climatol. 2017, 37, 157–170. [Google Scholar] [CrossRef]
  49. Hu, Z.; Hu, Q.; Zhang, C.; Chen, X.; Li, Q. Evaluation of reanalysis, spatially interpolated and satellite remotely sensed precipitation data sets in central Asia. J. Geophys. Res. Atmos. 2016, 121, 5648–5663. [Google Scholar] [CrossRef] [Green Version]
  50. Pan, M.; Sahoo, A.K.; Troy, T.J.; Vinukollu, R.K.; Sheffield, J.; Wood, E.F. Multisource Estimation of Long-Term Terrestrial Water Budget for Major Global River Basins. J. Clim. 2011, 25, 3191–3206. [Google Scholar] [CrossRef]
  51. Aires, F. Combining Datasets of Satellite-Retrieved Products. Part I: Methodology and Water Budget Closure. J. Hydrometeorol. 2014, 15, 1677–1691. [Google Scholar] [CrossRef]
  52. Kendall, M.G. Rank Correlation Methods; Griffin: London, UK, 1948. [Google Scholar]
  53. Mann, H.B. Nonparametric Tests against Trend. Econometrica 1945, 13, 245–259. [Google Scholar] [CrossRef]
  54. Hamed, K.H. Trend detection in hydrologic data: The Mann–Kendall trend test under the scaling hypothesis. J. Hydrol. 2008, 349, 350–363. [Google Scholar] [CrossRef]
  55. Von Storch, H. Misuses of statistical analysis in climate research. In Analysis of Climate Variability; Springer: Berlin/Heidelberg, Germany, 1999; pp. 11–26. [Google Scholar]
  56. Yue, S.; Pilon, P.; Phinney, B.; Cavadias, G. The influence of autocorrelation on the ability to detect trend in hydrological series. Hydrol. Process. 2002, 16, 1807–1829. [Google Scholar] [CrossRef]
  57. Tan, X.; Gan, T.Y.; Shao, D. Effects of persistence and large-scale climate anomalies on trends and change points in extreme precipitation of Canada. J. Hydrol. 2017, 550, 453–465. [Google Scholar] [CrossRef]
  58. Gocic, M.; Trajkovic, S. Analysis of changes in meteorological variables using Mann-Kendall and Sen’s slope estimator statistical tests in Serbia. Glob. Planet. Chang. 2013, 100, 172–182. [Google Scholar] [CrossRef]
  59. Dadaser-Celik, F.; Cengiz, E. Wind speed trends over Turkey from 1975 to 2006. Int. J. Climatol. 2013, 34, 1913–1927. [Google Scholar] [CrossRef]
  60. Sen, P.K. Estimates of the regression coefficient based on Kendall’s tau. J. Am. Stat. Assoc. 1968, 63, 1379–1389. [Google Scholar] [CrossRef]
  61. Lozowski, E.P.; Charlton, R.B.; Nguyen, C.D.; Wilson, J.D. The Use of Cumulative Monthly Mean Temperature Anomalies in the Analysis of Local Interannual Climate Variability. J. Clim. 1989, 2, 1059–1068. [Google Scholar] [CrossRef] [Green Version]
  62. Yang, Y.; Long, D.; Guan, H.; Scanlon, B.R.; Simmons, C.T.; Jiang, L.; Xu, X. GRACE satellite observed hydrological controls on interannual and seasonal variability in surface greenness over mainland Australia. J. Geophys. Res. Biogeosci. 2014, 119, 2245–2260. [Google Scholar] [CrossRef]
  63. Wu, L.; Wang, S.; Bai, X.; Luo, W.; Tian, Y.; Zeng, C.; Luo, G.; He, S. Quantitative assessment of the impacts of climate change and human activities on runoff change in a typical karst watershed, SW China. Sci. Total Environ. 2017, 601–602, 1449–1465. [Google Scholar] [CrossRef] [PubMed]
  64. Pettitt, A.N. A Non-Parametric Approach to the Change-Point Problem. J. R. Stat. Soc. Ser. C (Appl. Stat.) 1979, 28, 126–135. [Google Scholar] [CrossRef]
  65. Kim, C.; Suh, M.-S.; Hong, K.-O. Bayesian Changepoint Analysis of the Annual Maximum of Daily and Subdaily Precipitation over South Korea. J. Clim. 2009, 22, 6741–6757. [Google Scholar] [CrossRef]
  66. Ruggieri, E. A Bayesian approach to detecting change points in climatic records. Int. J. Climatol. 2013, 33, 520–528. [Google Scholar] [CrossRef]
  67. Yang, Z.; Zhou, Y.; Wenninger, J.; Uhlenbrook, S. The causes of flow regime shifts in the semi-arid Hailiutu River, Northwest China. Hydrol. Earth Syst. Sci. 2012, 16, 87–103. [Google Scholar] [CrossRef] [Green Version]
  68. Izhitskiy, A.S.; Zavialov, P.O.; Sapozhnikov, P.V.; Kirillin, G.B.; Grossart, H.P.; Kalinina, O.Y.; Zalota, A.K.; Goncharenko, I.V.; Kurbaniyazov, A.K. Present state of the Aral Sea: Diverging physical and biological characteristics of the residual basins. Sci. Rep. 2016, 6, 23906. [Google Scholar] [CrossRef] [Green Version]
  69. Zavialov, P. Physical Oceanography of the Dying Aral Sea; Springer: Berlin/Heidelberg, Germany, 2007. [Google Scholar] [CrossRef]
  70. Shnitnikov, A. Water balance variability of lakes Aral, Balkhash, Issyk-Kul and Chany. In Hydrology of Lakes; Bartholomew Press: Dorking, Surrey, 1973; pp. 130–140. [Google Scholar]
  71. Klerkx, J.; Imanackunov, B. Lake Issyk-Kul: Its Natural Environment; Springer: Berlin/Heidelberg, Germany, 2002. [Google Scholar]
  72. Kezer, K.; Matsuyama, H. Decrease of river runoff in the Lake Balkhash basin in Central Asia. Hydrol. Process. 2006, 20, 1407–1423. [Google Scholar] [CrossRef]
  73. Dorfman, B.F. Zaysan-the Only Surviving Cretaceous Lake-May be Lost. Procedia Environ. Sci. 2011, 10, 1376–1382. [Google Scholar] [CrossRef] [Green Version]
  74. Orlovsky, L.; Matsrafi, O.; Orlovsky, N.; Kouznetsov, M. Sarykamysh Lake: Collector of Drainage Water–The Past, the Present, and the Future. In The Turkmen Lake Altyn Asyr and Water Resources in Turkmenistan; Springer: Berlin/Heidelberg, Germany, 2012; pp. 107–140. [Google Scholar]
  75. Bai, J.; Chen, X.; Yang, L.; Fang, H. Monitoring variations of inland lakes in the arid region of Central Asia. Front. Earth Sci. 2012, 6, 147–156. [Google Scholar] [CrossRef]
  76. Propastin, P. Patterns of Lake Balkhash water level changes and their climatic correlates during 1992–2010 period. Lakes Reserv. Sci. Policy Manag. Sustain. Use 2012, 17, 161–169. [Google Scholar] [CrossRef]
  77. Lioubimtseva, E.; Henebry, G.M. Climate and environmental change in arid Central Asia: Impacts, vulnerability, and adaptations. J. Arid Environ. 2009, 73, 963–977. [Google Scholar] [CrossRef]
  78. Lioubimtseva, E. A multi-scale assessment of human vulnerability to climate change in the Aral Sea basin. Environ. Earth Sci. 2015, 73, 719–729. [Google Scholar] [CrossRef]
  79. Zhao, L.; Simon Wang, S.Y.; Meyer, J. Interdecadal Climate Variations Controlling the Water Level of Lake Qinghai over the Tibetan Plateau. J. Hydrometeorol. 2017, 18, 3013–3025. [Google Scholar] [CrossRef]
  80. Biskop, S.; Maussion, F.; Krause, P.; Fink, M. Differences in the water-balance components of four lakes in the southern-central Tibetan Plateau. Hydrol. Earth Syst. Sci. 2016, 20, 209–225. [Google Scholar] [CrossRef] [Green Version]
  81. Zhou, J.; Wang, L.; Zhang, Y.; Guo, Y.; Li, X.; Liu, W. Exploring the water storage changes in the largest lake (Selin Co) over the Tibetan Plateau during 2003–2012 from a basin-wide hydrological modeling. Water Resour. Res. 2015, 51, 8060–8086. [Google Scholar] [CrossRef] [Green Version]
  82. Yao, T.; Thompson, L.G.; Mosbrugger, V.; Zhang, F.; Ma, Y.; Luo, T.; Xu, B.; Yang, X.; Joswiak, D.R.; Wang, W.; et al. Third Pole Environment (TPE). Environ. Dev. 2012, 3, 52–64. [Google Scholar] [CrossRef]
  83. Zhang, G.; Yao, T.; Shum, C.K.; Yi, S.; Yang, K.; Xie, H.; Feng, W.; Bolch, T.; Wang, L.; Behrangi, A.; et al. Lake volume and groundwater storage variations in Tibetan Plateau’s endorheic basin. Geophys. Res. Lett. 2017, 44, 5550–5560. [Google Scholar] [CrossRef]
  84. Tong, K.; Su, F.; Xu, B. Quantifying the contribution of glacier meltwater in the expansion of the largest lake in Tibet. J. Geophys. Res. Atmos. 2016, 121, 11, 111–158, 173. [Google Scholar] [CrossRef]
  85. Qiao, B.; Zhu, L. Difference and cause analysis of water storage changes for glacier-fed and non-glacier-fed lakes on the Tibetan Plateau. Sci. Total Environ. 2019, 693, 133399. [Google Scholar] [CrossRef] [PubMed]
Figure 1. Locations of lakes selected in this study: The rectangles represent the spatial extent of general endorheic regions in (A) Central Asia, (B) the western Mongolian Plateau, and (C) the Tibetan Plateau. The lakes in Central Asia include (1) the South Aral Sea, (2) the North Aral Sea, (3) Sarykamysh, (4) Balkhash, (5) Issyk-Kul, and (6) Zaysan; The lakes in the Mongolian Plateau are (7) Uvs, (8) Hyargas, and (9) Hovsgol; The lakes in the Tibetan Plateau are (10) Qinghai, (11) Ngoring, (12) Ayakkum, (13) Namco, (14) Silingco, (15) Ngangzco, and (16) Zharinamco.
Remotesensing 13 03705 g001
Figure 2. The seasonal cycle of precipitation from different gridded datasets over three lakes from three endorheic lake zones during the period of 1990–2016: (a) Lake Silingco, selected as the example for the Tibetan Plateau (TP), (b) Lake Balkhash, from the Central Asia (CA), and (c) Lake Hovsgol, from the Mongolian Plateau (MP).
Remotesensing 13 03705 g002
Figure 3. The annual change of water level in lakes located at Central Asia (a,b), Tibetan Plateau (c,d), and Mongolian Plateau (e).
Remotesensing 13 03705 g003
Figure 4. The correlation relationship map between water level variation and monthly precipitation and air temperature over three lakes in the Mongolian Plateau: Asterisks mark significant correlations. The circle size scales with the absolute correlation coefficient value.
Remotesensing 13 03705 g004
Figure 5. The significant regime shift in time series of precipitation (green line, left panel) and temperature (red line, right panel) over five lakes in Central Asia: vertical lines represent regime shift years and horizontal dash lines represent the mean value of each regime.
Remotesensing 13 03705 g005
Figure 6. The significant regime shift in time series of precipitation (green line, left panel) and temperature (red line, right panel) over three lakes in the northern part of the Tibetan Plateau: vertical lines represent regime shift years and horizontal dash lines represent the mean value of each regime.
Remotesensing 13 03705 g006
Figure 7. The significant regime shift in time series of precipitation (green line, left panel) and temperature (red line, right panel) over four lakes in the southern part of the Tibetan Plateau: vertical lines represent regime shift years and horizontal dash lines represent the mean value of each regime.
Remotesensing 13 03705 g007
Figure 8. The significant regime shift in time series of precipitation (green line, left panel) and temperature (red line, right panel) over three lakes in the Mongolian Plateau: vertical lines represent regime shift years and horizontal dash lines represent the mean value of each regime.
Remotesensing 13 03705 g008
Table 1. Detailed information about the selected lakes.
RegionLake NameLatitude
(° N)
Longitude
(° E)
Area
(km2)
Elevation
(m)
Country
Central
Asia
Aral Sea46.460.618,99942Kazakhstan
Uzbekistan
Sarykamysh41.957.438525Uzbekistan
Balkhash46.174.216,683349Kazakhstan
Issyk-Kul42.477.361481619Kyrgyzstan
Zaysan48.183.92913379Kazakhstan
Tibetan
Plateau
Qinghai37100.143123260China
Ngoring34.997.76214292China
Ayakkum37.589.48564161China
Silingco31.8088.9922224550China
Namco30.7490.6020214730China
Zharinamco30.9285.6110014292China
Ngangzco31.1087.103904680China
Mongolian
Plateau
Uvs50.392.73421759Mongolia
Hyargas49.193.113621028Mongolia
Hovsgol55.1100.527411645Mongolia
Table 2. Trends of lake water levels from the Hydroweb dataset during the period of 1992–2018 and Pearson correlation coefficients calculated between three altimetry datasets: The significance is shown in bold font. The blank in the table is due to a lack of data in the corresponding altimetry databases.
Lake NameTrend
(cm/yr)
Pearson Correlation Coefficient
Hydroweb
GREALM
GREALM
DAHITI
Hydroweb DAHITI
Central
Asia
Balkhash5.7620.9960.9301.000
Issyk-Kul1.6980.9940.9811.000
Zaysan6.0670.8650.9820.968
Aral Sea South−37.8240.9951.0000.997
Aral Sea North5.8620.9870.9890.996
Sarykamysh21.1510.9880.9971.000
Tibetan PlateauQinghai10.461 0.996
Ngoring8.6510.983
Ayakkum32.631 0.991
Zharinamco14.7630.9800.7420.953
Ngangzco3.0120.9960.9620.959
Namco13.821 0.940
Silingco52.451 0.999
Monglian PlateauUvs−0.6172 0.936
Hovsgol−1.1920.5860.3770.497
Hyargas−36.143 0.999
Table 3. The summary of trends of lake level anomaly, precipitation anomaly and temperature anomaly in the lake over CA, TP, and TP.
Lake NamesGlacier Area/Lake AreaLake Level
Anomaly
Precipitation AnomalyTemperature Anomaly
Central
Asia
Balkhash Increase(+), then fluctuateFluctuatedSlight increase (+)
Zaysan Decrease (−), then increased (+)Decrease (−), then increased (+)Increase (+)
Issyk-Kul0.08Increase (+)Increase (+)Increase (+)
Sarykmysh Increase (+)FluctuatedIncrease (+)
Aral Sea FluctuatedFluctuated decrease (−)Increase (+)
Tibetan
Plateau
(south)
Zharinamco0.15Increase (+),Increase (+), then fluctuatedIncrease (+)
Namco0.1Increase (+),Increase (+), then fluctuatedIncrease (+)
Silingco0.13Increase (+)Increase (+)Increase (+)
Ngangzco0.02Increase (+)Increase (+)Increase (+)
Tibetan
Plateau
(north)
Qinghai0.01Increase (+)Increase (+)Increase (+)
Ngoring Increase (+)Increase (+)Increase (+)
Ayakkum0.55Increase (+)Increase (+)Increase (+)
Mongolian
Plateau
Uvs Decrease (−)Decrease (−)Fluctuated increase (+)
Hyargas Decrease (−)Decrease (−)Fluctuated increase (+)
Hovsgol Decrease (−)Decrease (−)Fluctuated increase (+)
Table 4. The change points and the mean value of each regime in precipitation and temperature over the lake basin located at Tibetan Plateau, Central Asia, and Mongolian Plateau.
RegionLake NamesPrecipitationTemperature
The Timing of Change PointMean Value of Each Regime
(cm)
The Timing of Change PointMean Value of Each Regime
Tibetan PlateauQinghai2004284,714
323,244
1997
2004
−7.677
−7.202
−6.990
Ngoring2004291,226
340,488
1997
2004
−10,490
−10,106
−9.663
Ayakkum200159,6041997−9.910
70,768−9.035
Silingco1997400,3161997−10,475
458,957−9.532
Namco1997
2004
447,5501997−7.680
−6.962
530,700
485,552
Zharinamco1997
2004
656,8501997−10,549
792,739−9.749
713,963
Ngangzco1996618,1871997−10,096
744,426−9.191
Central AsiaBalkhash1997
2008
256,6141997−1.430
−0.436
276,950
302,053
Issyk-Kul1997
2008
289,1331997−5.215
−4.012
344,317
359,559
Zaysan1997
2008
348,7531997−3.430
−2.719
373,358
402,177
Sarykmysh1997
2008
133,17319977.073
7.897
88,694
112,688
Aral Sea 19974.084
5.081
Mongolian PlateauUvs1994283,5361997−10,935
2004237,6852005−10,188
258,436−10,579
Hovsgol1994328,0441997−11,428
2004271,8912007−10,656
302,621−10,971
Hyargas1994241,8362007−9.371
2004202,668−8.737
220,327
Publisher’s Note: MDPI stays neutral with regard to jurisdictional claims in published maps and institutional affiliations.

