Article

Vertical Structure of Air Pollutant Transport Flux as Determined by Ground-Based Remote Sensing Observations in Fen-Wei Plain, China

1
School of Environmental Science and Optoelectronic Technology, University of Science and Technology of China, Hefei 230026, China
2
Key Lab of Environmental Optics and Technology, Anhui Institute of Optics and Fine Mechanics, Hefei Institutes of Physical Science, Chinese Academy of Sciences, Hefei 230031, China
3
State Key Laboratory of Atmospheric Boundary Layer Physics and Atmospheric Chemistry (LAPC), Institute of Atmospheric Physics, Chinese Academy of Sciences, Beijing 100029, China
4
School of Earth and Space Sciences, University of Science and Technology of China, Hefei 230026, China
*
Author to whom correspondence should be addressed.
Remote Sens. 2021, 13(18), 3664; https://doi.org/10.3390/rs13183664
Submission received: 30 July 2021 / Revised: 3 September 2021 / Accepted: 8 September 2021 / Published: 14 September 2021
(This article belongs to the Special Issue Optical and Laser Remote Sensing of Atmospheric Composition)

Abstract

:
Air pollutant transport plays an important role in local air quality, but field observations of transport fluxes, especially their vertical distributions, are very limited. We characterized the vertical structures of transport fluxes in central Luoyang, Fen-Wei Plain, China, in winter based on observations of vertical air pollutant and wind profiles using multi-axis differential optical absorption spectroscopy (MAX-DOAS) and Doppler wind lidar, respectively. The northwest and the northeast are the two privileged wind directions. The wind direction and total transport scenarios were dominantly the northwest during clear days, turning to the northeast during the polluted days. Increased transport flux intensities of aerosol were found at altitudes below 400 m on heavily polluted days from the northeast to the southwest over the city. Considering pollution dependence on wind directions and speeds, surface-dominated northeast transport may contribute to local haze events. Northwest winds transporting clean air masses were dominant during clean periods and flux profiles characterized by high altitudes between 200 and 600 m in Luoyang. During the COVID-19 lockdown period in late January and February, clear reductions in transport flux were found for NO2 from the northeast and for HCHO from the northwest, while the corresponding main transport altitude remained unchanged. Our findings provide better understandings of regional transport characteristics, especially at different altitudes.

Graphical Abstract

1. Introduction

Severe haze events caused by particulate matter have occurred regularly in China during recent decades, bringing health hazards and reducing atmospheric visibility [1,2,3,4]. These events have drawn worldwide attention, with many studies reporting frequent severe pollution in China’s most developed regions [5,6]. Beside the influence of local emissions and further atmospheric chemical reactions [7], regional transport also plays a key role in pollution episodes [8,9]. Cross-boundary transport may transport precursors or pollutants from their source regions to another area [10], leading to some severe haze days in Beijing [11] and ozone pollution episodes in North China [12]. A better understanding of transport characteristics is of great importance for the joint control of regional pollution. Air pollution transport takes place near the ground, as well as in the upper boundary layer [13], making vertical profiles of pollutant and wind distributions (rather than in situ measurements alone) essential to further investigations of transport flux characteristics [10]. However, previous research mainly focused on the near-ground pollutants variations; vertical structures of transport characteristics and pollutants distribution still need further investigations.
Some approaches have been applied to the estimation of transport and its effect on local air pollution. Backward trajectory models based on the reanalysis meteorological field data provide the most probable transport pathway of the air mass before its arrival at the target location. They can help us to analyze the transport effect, such as the effect from emission source in pathway [14]. Since the models do not take pollutant concentrations into account, transport flux cannot be quantified this way [15]. Some researchers have estimated transport flux based on simulated meteorology fields and air pollutant concentrations from chemical models [16], but this cannot represent real situations due to a lack of actual measurements. Atmospheric conditions simulated by chemical models are limited by parametric schemes and existing atmospheric processes, such as aerosol–cloud–radiative processes [17], so they may not provide precise variations in pollutant and meteorological parameters. Ground-based instruments have been used to estimate vertical flux profiles in various ways, such as determining water vapor flux by combining a water vapor lidar and a wind lidar near Broomfield, Colorado [18], vertical aerosol flux by combining an aerosol Raman lidar and a Doppler wind lidar in Leipzig, Germany [19], and particulate matter transport flux within the mixing layer in Beijing by combining a ceilometer and a wind radar [20]. However, these studies mainly focused on particulate matter transport and did not consider other gaseous pollutants transport characteristics.
Vertical distributions of pollutants and the wind field are essential for the study of transport flux profiles. Multi-axis differential optical absorption spectroscopy (MAX-DOAS) is a ground-based remote sensing technique that can synchronously retrieve vertical profiles of aerosol and trace gases (such as NO2, HCHO, SO2, HONO and CHOCHO) in the troposphere (typically up to ~4 km). Doppler wind lidar is another important remote sensing technique to obtain the vertical wind profiles in target altitude range. MAX-DOAS and lidar have wide applications in scientific studies (e.g., the evolution of pollutants and vertical structure of boundary layer) [21,22,23,24,25], but research on transport flux by combining both two technologies has not been reported yet.
In this study, we characterized the vertical structure of four pollutants (aerosol, NO2, HCHO and SO2) and estimated the corresponding transport flux by combining MAX-DOAS and Doppler wind lidar measurements in Luoyang, Fen-Wei Plain (FWP), China. Increasing PM2.5 concentrations, especially during autumn and winter, have been reported for FWP in recent studies [26,27]. The increasing trend is especially obvious in the Luoyang basin, as documented by both in situ and satellite measurements, drawing significant attention from the public [28]. Luoyang is located in the southeast edge of FWP, close to the megacity Zhengzhou in the North China Plain to the northeast, locating it in a transportation corridor pathway between two megalopolises, which provide a unique opportunity to study the transport flux and its corresponding effect on local air quality. In the following sections, different characteristics of vertical distribution and flux were obtained under different degrees of pollution. We tried to evaluate the transport characteristics and the transport pathways around Luoyang, China. We further investigated pathway transport scenarios during an extremely-low-emission period. This work estimated the variations in the transport flux profiles of four pollutants (including aerosol and precursors) in a single study. Our results also provide a better understanding of air pollution in FWP and can be used to design joint pollution prevention and control strategies at a regional scale.

2. Measurements and Methodology

2.1. Overview of the Measurement Station

Luoyang, which has >7 million habitants, is surrounded by the Mang Mountains to the north and the Wan’an Mountains and some hills to the south and east, forming an east–west basin whose orientation encourages pollutant transport from the east or west (Figure 1). MAX-DOAS and Doppler wind lidar were co-located on the roof of the 14-story HuanBao building (112.46° E, 34.67° N, ~60 m a.g.l.) and measurements were taken from 16 January to 8 March 2020. They were set next to each other within a range of less than 10 m. MAX-DOAS measurements provided the daytime (typically 08:00–18:00 local standard time) vertical profiles of NO2, SO2, HCHO and aerosol extinction, while the Doppler lidar derived the all-day 3D wind profiles in the boundary layer.

2.2. MAX-DOAS Measurements

A commercial MAX-DOAS instrument, Airyx SkySpec-2D (Airyx, Heidelberg, Germany, https://www.airyx.de/ (accessed on 10 September 2021), was used to continuously collect scattered sunlight with an azimuth angle of 350° with respect to the north. The MAX-DOAS contains outdoor and indoor parts. The outdoor part consists of a telescope unit to collect the scattered sunlight and two motors to control the elevation and azimuth angles of the telescope, respectively. The telescope field of view is less than 0.3°, while the angle accuracy of these two motors is less than 0.1°. The indoor part consists of two spectrometers (AvaSpec-ULS2048L-USB2) with built-in CCD chip (charge coupled device, Sony ILX511, with 2048 individual pixels) and a controlling computer. The UV spectrometer covers 300–409 nm with a resolution of 0.45 nm at 334 nm, while the VIS one covers 400–495 nm with a resolution of 0.41 nm at 436 nm. The sunlight collected by the telescope was coupled into the spectrometer through a prism reflector and quartz fibers.
The elevation angles were set to 1°, 2°, 3°, 4°, 5°, 6°, 8°, 10°, 15°, 30° and 90° to form a measurement sequence lasting ~11 min. The exposure time and number of scans for each measurement were adjusted automatically depending on the intensity of received scattered sunlight to achieve a similar signal-to-noise ratio. MAX-DOAS was controlled by computer and operated in unattended automatic mode collecting scattered sunlight during daytime and dark current and offset spectra at night. The pollutants’ vertical profiles were retrieved by spectral analysis and a profile inversion algorithm based on the Lambert–Beer law and the optimal estimation method.

2.2.1. DOAS Analysis of O4, NO2, HCHO and SO2 Differential Slant Column Densities (dSCDs)

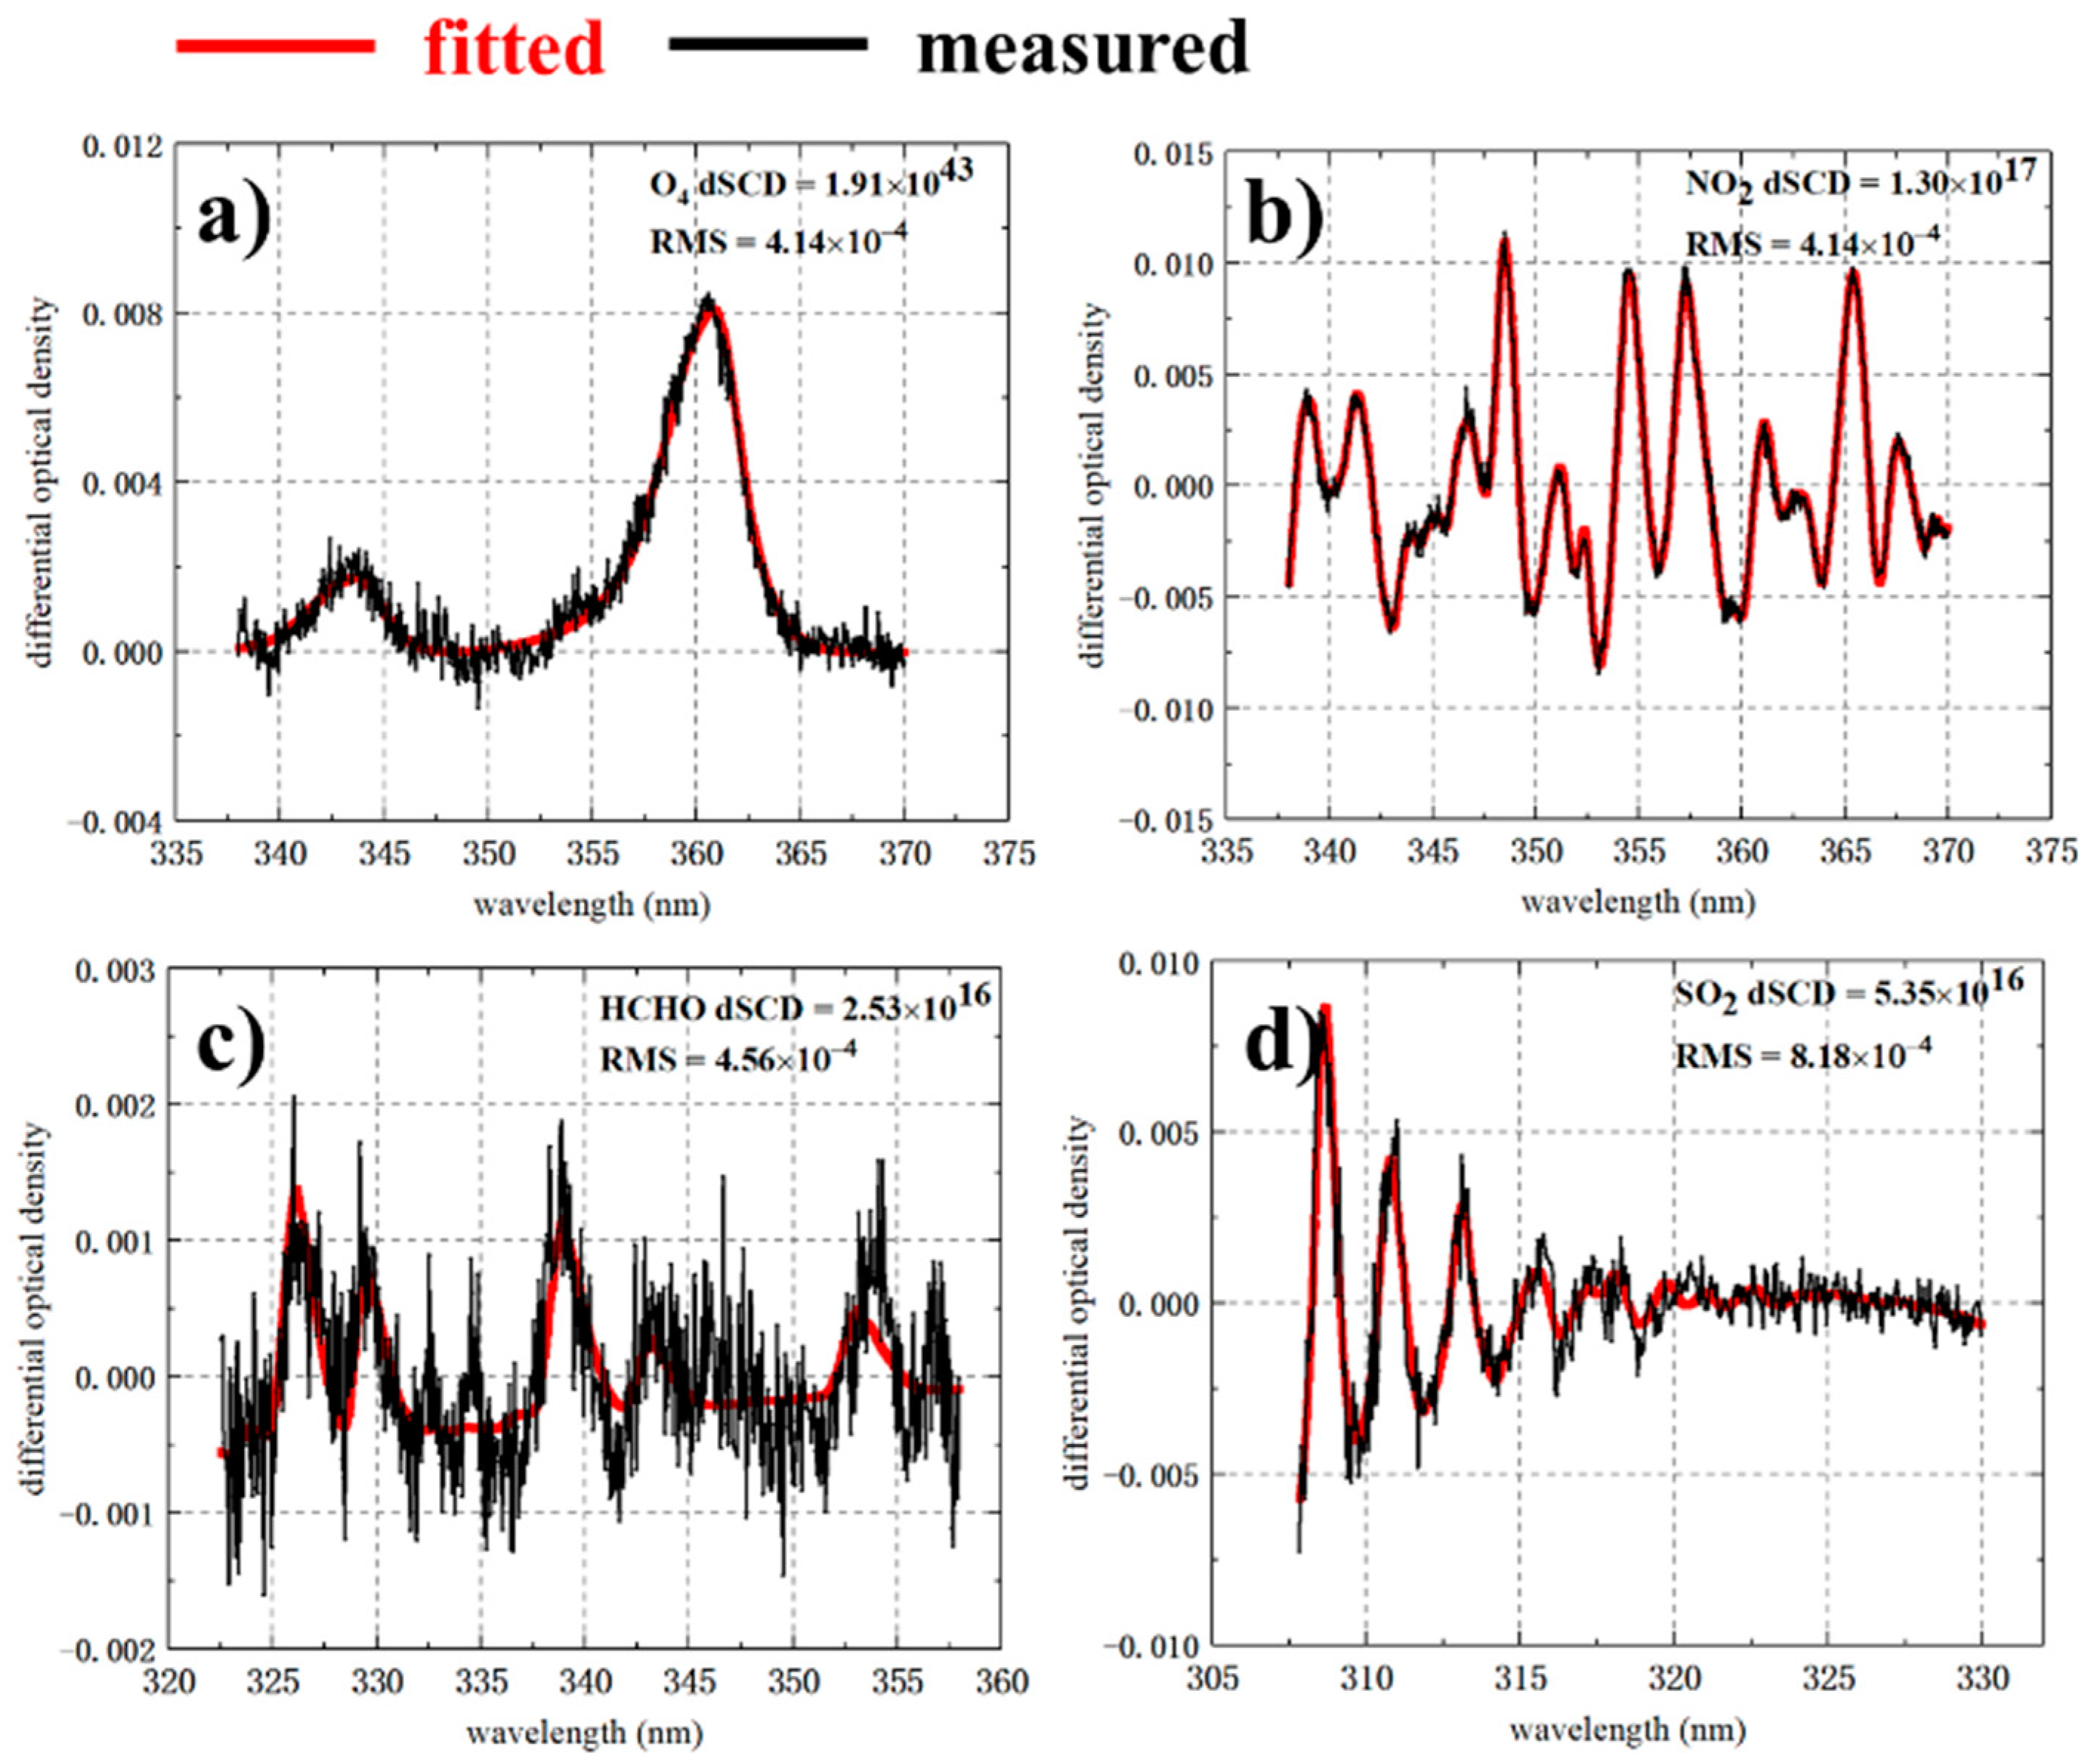
The scattered sunlight at different elevation angles measured by MAX-DOAS was firstly analyzed using the DOAS method based on the Lambert–Beer law [29]. To analyze a collected spectrum, a Fraunhofer reference spectrum (FRS) should be included in the analysis procedure, then the differential slant column densities (dSCDs) can be retrieved, which are the slant column densities difference between measured spectrum and FRS. In this study, the zenith sky spectrum of the same measurement sequence, that is, the last spectrum of each sequence, was chosen as FRS in the DOAS analysis. The QDOAS software package developed by the Royal Belgian Institute for Space Aeronomy (BIRA-IASB, Brussels, Belgium, http://uv-vis.aeronomie.be/software/QDOAS/ (accessed on 10 September 2021) was used to analyze the collected spectrum. The wavelength range, trace-gas absorption cross sections and many other parameters of the DOAS fit for O4, NO2, HCHO and SO2 are listed in Table 1 (O4: collision complex of ground state oxygen molecules [30], its absorption features could be detected by DOAS method and further used in aerosol extinction retrieval [31]). A typical example of the DOAS analysis of a spectrum measured at 11:56 20 January 2020 local standard time (LST) at the elevation angle equal to 2 degrees is shown in Figure 2. The dSCDs results with root mean square (RMS) larger than 1 × 10 3 (O4, NO2 and HCHO) and 2 × 10 3 (SO2) were not included in further analysis.

2.2.2. Vertical Profile Retrieval

Aerosol extinction and trace gases vertical profiles were retrieved from dSCDs using the profile retrieval algorithm [41,42,43], which is based on the optimal estimation method (OEM) [44]. The vertical concentration profile C(z) is retrieved from the dSCDs obtained from the DOAS analysis in one sequence by minimizing the cost function χ 2 in Equation (1); then, the optimal a posteriori state vector x is the profile C(z).
χ 2 = ( y F ( x , b ) ) T S ε 1 ( y F ( x , b ) ) + ( x x a ) T S a 1 ( x x a )
where y is the measurement vector, which is the dSCDs in one measurement sequence, F(x, b) is a simulated vector simulated by the forward model libRadtran [45], which describes the function between measurement and atmospheric state, x is the posteriori state vector, b refers to other atmosphere parameters, i.e., vertical temperature, pressure profile and aerosol properties, which are necessary for forward model simulations, and S ε and S a are covariance matrices of y and a priori vector xa, which describe the uncertainties of the measurement and a priori, respectively. In this study, we set an exponential decreasing a priori with scaling height of 0.5 km for both aerosol extinction and trace gases profile retrieval and the atmosphere from surface to 4 km was divided into 25 layers, with a vertical resolution of 100 m from surface to 1 km and 200 m from 1 km to 4 km. Then, the aerosol optical depth (AOD) and tropospheric vertical column density (VCD) corresponding to the total amount of aerosol extinction and trace gases were calculated by integrating the concentrations of all layers. All profiles were validated before further analysis; the comparison results and details are shown in Appendix A.1. Validations of MAX-DOAS results.

2.3. Doppler Wind Lidar Measurements

The Doppler wind lidar (WindMast PBL) used in this study was jointly developed by the Ocean University of China and Qingdao Leice Transient Technology Co., Ltd., Qingdao, China. It operates at a wavelength of 1.5 um and measures the Doppler frequency shift of laser light that has been backscattered by particles in the atmosphere. The WindMast can retrieve near-surface temperature, pressure and 3D vertical wind profiles from 42 m to 3 km (a.g.l.) with a spatial resolution of 14 m and a temporal resolution of 1 min (further technical parameters are given in Table 2). The 3D wind profile for each measurement was expressed by layers composed of a horizontal wind vector expressed by a wind speed and direction with respect to the north and a vertical wind speed expressed by a wind speed value with positive representing upward and negative representing downward. Invalid wind results were filtered according to the corresponding signal-to-noise ratio.

2.4. Flux Calculation

The calculation of regional transport flux requires pollutant mass concentration and wind profile data [46]. We calculated the transport flux from the combination of the pollutant concentration retrieved from MAX-DOAS and the corresponding wind speed observed by the Doppler wind lidar. Since the latter had a higher temporal and spatial resolution, the vertical wind speeds were temporal and the spatial vector averaged according to the resolution of MAX-DOAS results following Equations (2)–(4):
{ u ( z ) = w s ( z ) × sin ( w d ( z ) × π 180 ) v ( z ) = w s ( z ) × cos ( w d ( z ) × π 180 )
{ u j ¯ = 1 z 2 z 1 z 1 z 2 u ( z ) d z v j ¯ = 1 z 2 z 1 z 1 z 2 v ( z ) d z w j ¯ = 1 z 2 z 1 z 1 z 2 w ( z ) d z
{ W S j = u j ¯ 2 + v j ¯ 2 W D j = arctan ( u j ¯ v j ¯ ) W S Z j = w j ¯
where w s ( z ) and w d ( z ) are the horizontal wind speed (m/s) and wind direction (degree, with respect to the north) at height z (m), respectively, while w ( z ) is the vertical wind speed (m/s) at height z , u ( z ) and v ( z ) are the E–W and N–S portions of horizontal wind (m/s), respectively, u j ¯ and v j ¯ are averaged portions of wind speed (m/s) for the MAX-DOAS layer j , w j ¯ is the averaged vertical wind (m/s), W S j and W D j are spatial averaged wind speed (m/s) and wind direction (degree, with respect to the north) for layer j , respectively, and W S Z j is the spatial-averaged vertical wind (m/s).
The transport flux was calculated by multiplying the vectors for pollutant concentration, wind speed and cross-sectional area [10]. Since we used wind and pollutant profiles at a single point (in the city center) rather than the information for 3D cross-sections, we defined the flux intensity through the concurrent measurement of pollutants and wind profiles. The flux intensity corresponding to layer j was thus calculated by Equation (5) [47,48]:
f l u x ( T ) j = W S j × c j ¯
where W S j and c j are the time series of the mean wind speed (horizontal flux using horizontal wind vector and vertical transport flux using vertical wind vector) and the mean retrieved pollutant concentration for layer j (km−1 for aerosol and molecules/cm3 for other pollutants), respectively, and the bar means a temporal average within the time period. The flux unit is also the product of two units, wind and concentration. So, the flux intensity f l u x ( T ) j is defined by the ks−1 for aerosol and m o l e c u l e s / ( c m 2 s ) for NO2, HCHO and SO2 (abbreviated as m o l e / ( c m 2 s ) in figures).
The aerosol extinction coefficient is an optical property that describes the extent to which light attenuation in the atmosphere is caused by aerosol. It correlates with particle mass depending on the aerosol type. The contributions of PM2.5 chemical components to aerosol extinction were relatively constant for all pollution levels in FWP [49]. A linear relationship between them could be obtained in some previous studies [48,49] and our two-month observations (Figure A1a), so the transport flux intensity of aerosol (calculated based on aerosol extinction) could quantify the strength of regional transport.

2.5. Date from China National Environmental Monitoring Center (CNEMC)

The in situ monitoring data, including PM2.5, PM10, NO2, SO2 and O3, were released from the website of the China National Environmental Monitoring Center (http://www.cnemc.cn/, accessed on 10 September 2021). The CNEMC network is composed of more than 1300 monitoring sites throughout China at present and automated monitoring systems were installed at each monitoring station, mainly composed of a series of sample analysis instruments from Thermo Fisher Scientific Inc., Waltham, MA, USA. Each station measures the near-surface concentration of six pollutants in near-real time automatically and the Air Quality Index (AQI) was calculated according to each pollutant’s concentration to describe the air quality status. The hourly data at each monitoring station were published from 2013 and they have been reported in detail in many previous studies [50,51]. The near-surface data of PM2.5, PM10, NO2, SO2, O3 and AQI of Luoyang were used to analyze the temporal variation in the pollutants and validate the MAX-DOAS results. In this study, we filtered the released CNEMC data using the z-score method for quality assurance purposes before using the data in further analysis. More details for the z-score method are provided in Appendix A.2. Description of Z-score method.

3. Results

The transport flux observed at a boundary station could capture the cross-boundary transport effect on target location [10]. Single-point flux observations in the city center instantaneously monitor transport variations from all directions at a regional scale [20]. In this study, we obtained the transport flux profiles and further characterized the transport structures and transport pathway.

3.1. Temporal Variations of Pollutants in Boundary Layer

The daytime vertical distribution of pollutants from near surface to 4 km was divided into 25 layers, while AOD or VCD represented the total amount of aerosol or trace gases within the whole troposphere, respectively. To better understand temporal variations in pollutants at different altitudes, we chose the concentrations of the 0–100 m, 500–600 m and 900–1000 m layers (retrieved from MAX-DOAS) to represent the lower, middle and upper boundary layers, respectively, and determined the daily time series of aerosol extinction, NO2, HCHO and SO2 in the chosen layers from 16 January to 8 March (Figure 3).
The pollutant concentrations in each layer could be clearly distinguished throughout the study period, with the highest concentrations at the surface and the lowest in the upper boundary layer. The study period began with a severe haze episode, during which aerosol extinction and NO2 reached 4.3 km−1 and 35 ppbv, respectively. After this, all pollutants except for SO2 gradually decreased, until the second haze episode started on 20 February. The two haze episodes observed during the study period were characterized by pronounced continuous aerosol extinction higher than 2 km−1, as well as HCHO and NO2 concentrations significantly higher than the mean value across the entire period. The haze episode from 20 to 29 January 2020 was defined as episode 1 (EP1) and that from 19 to 29 February 2020 as episode 2 (EP2). EP1 began with a rapid increase in NO2 and aerosol extinction on 21 January, reaching a maximum of 4.3 km−1 on 26 January. Compared to the preceding clean period, the surface, 500 m and 900 m layer aerosols, as well as AOD, increased by 188%, 143%, 129% and 162%, respectively. EP2 began on 19 February and peaked on 26 February, with a smaller increase in aerosol extinction than EP1, with increases in the surface, 500 m and 900 m layer aerosols, as well as AOD, of 170%, 120%, 122% and 142%, respectively. The time series of aerosol, NO2 and HCHO exhibited a ‘U’ shape, but SO2 varied little throughout the period, with a mean concentration of 3.5 ppbv near the surface and a mean VCD of 7.89 × 10¹⁵ molec/cm2. These differences can be attributed to different sources; SO2 mainly originates from primary emissions, such as emissions from household fuel burning and industrial power generation during wintertime [52], while particulate matter and NO2 mainly originate from human activities and vehicle emissions [53].

3.2. Statistics of Wind and Pollutant Transport Characterization

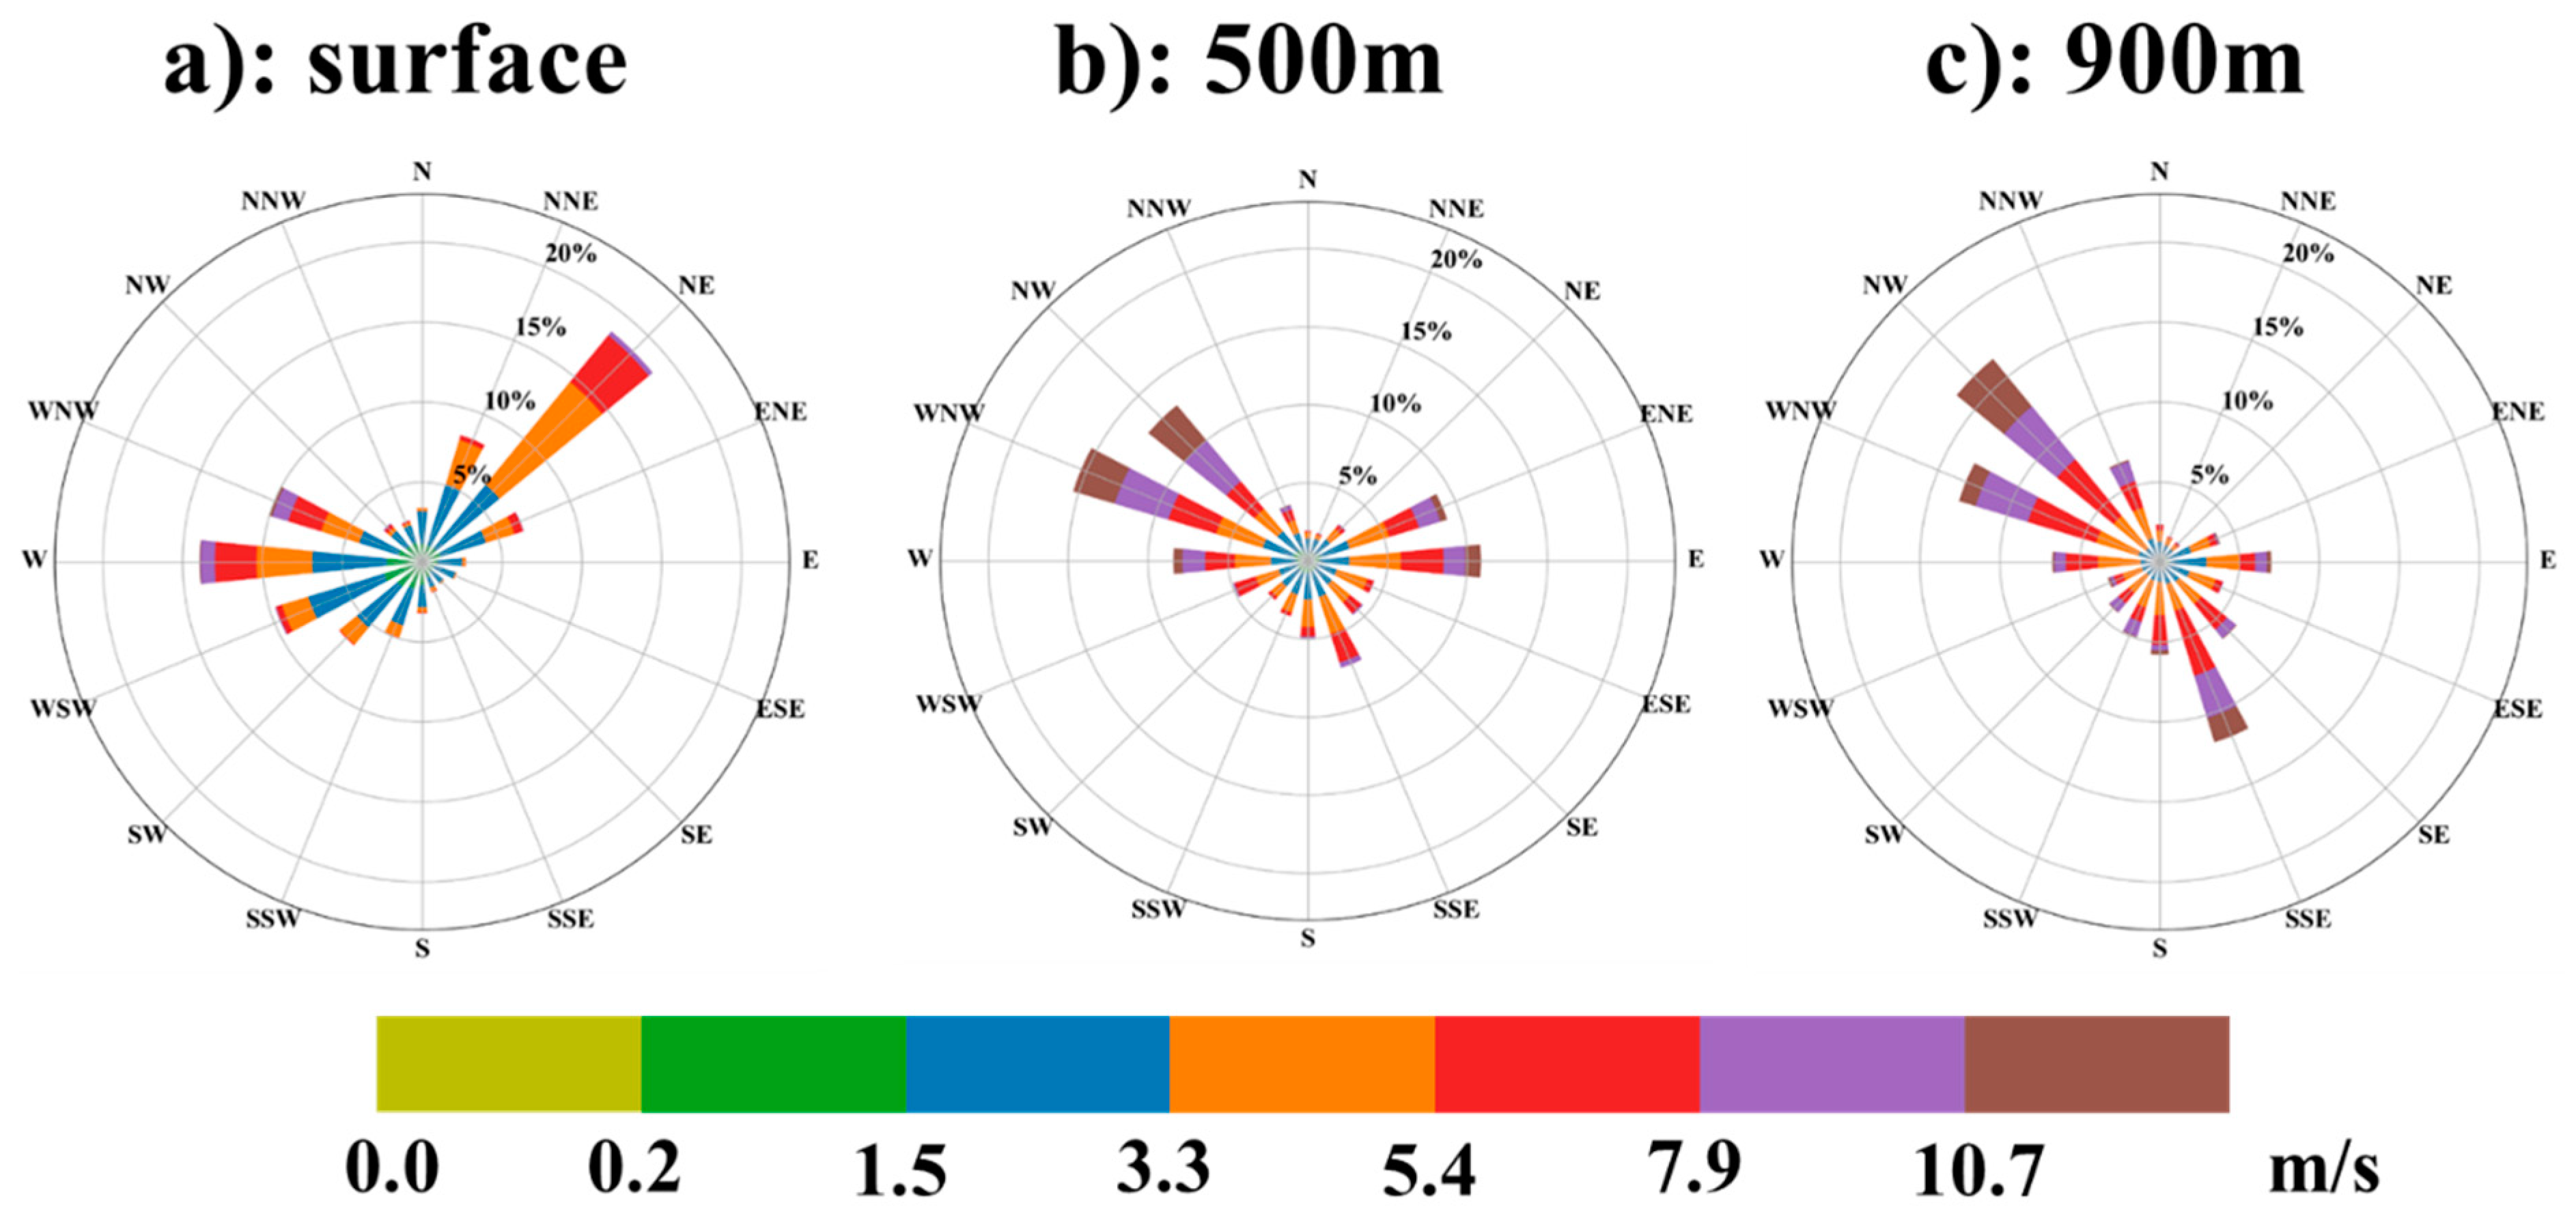
Statistics of wind directions and wind speeds for the whole observation period (including day and night) are shown in Figure 4. The wind speed generally increased with altitude and the prevailing wind direction gradually turned northwest, meaning that the air quality in the higher boundary layer may be more easily affected by air pollutants from the northwest. In the near-surface layer, the wind blew most frequently from the northeast at less than 5 m/s, though west winds were also common (reaching 13.5 m/s). However, these varied in the middle and upper layers. In the former, prevailing winds from the northwest and the east had mean wind speeds of 6.6 and 4.9 m/s, respectively. Winds from the southeast and the northwest mainly contributed to the upper boundary layer.
Wind is a kind of physical atmospheric process that can transport atmospheric components [47], including pollutants or clean air mass. The northeast and northwest are two privileged wind directions, which indicate two potential transport pathways in the local area. We further plotted the polar plots of four pollutants during the observation period to investigate whether both two directions contribute pollutants to haze events in the local area (Figure 5). Bivariate polar plot is a common method used in source characterization [54]. It explores the relationship between the chemical constituents and meteorological parameters. Results suggest that transport plays an important role in local air quality. Higher concentration experienced with northeast winds indicate that wind from the northeast may contribute to local pollution events. Locally sourced pollution during low wind speed was also potentially indicated for all pollutants at the near-surface layer. As for middle and upper boundary layer, transport from the east or northeast play an even more import role than local emissions (except for SO2). Transport effect from the east or northwest is obvious for SO2 in 500 m latitude and local emissions or transport from other directions cannot be clearly distinguished in the upper boundary layer. Although two main privilege wind directions were found in the local area, air masses from the northeast direction may contribute more pollutants to local severe haze events.

3.3. Vertical Structure of Transport Flux from Privileged Wind Directions

Pollutant transport may take place near the ground, as well as in the upper boundary layer [13]. To investigate the vertical structures of transport flux from two major privileged wind directions, the transport fluxes from the northeast and northwest in different layers were gathered and averaged to obtain the transport flux profiles (Figure 6). The transport strength was generally smaller in the northwest direction and was mainly located in the middle boundary layer. The total transport fluxes in the boundary layer from the northeast were generally 60%, 72% and 56% larger than fluxes from the northwest for aerosol, NO2 and HCHO, respectively, while fluxes for SO2 were similar in both directions. The largest transport strength occurred at the near-surface layer for the northeast pathway, while the main transport altitude was between 200 and 600 m for the northwest pathways, which means the two privileged directions have different vertical transport structures. The structure differences between these two directions may be attributed to the meteorological conditions of the wind field. For each specific direction, more transport fractions in the middle boundary layer can be found in SO2 profiles, which indicates that SO2 distributed in the middle and upper boundary layers is more obvious than other pollutants (this point can also be proven in Table A1).

3.4. Structure of the Transport Flux under Different Pollution Degrees

Transport may play a more important role during severe haze events than on clear days [11]. To investigate the transport scenarios and characteristics under different pollution levels, we compared the mean concentration and flux profiles after grouping the total observation period into four levels, following a previous study on PM2.5 concentrations [55]: PI (<35 ug/m3), PII (35–75 ug/m3), PIII (75–115 ug/m3) and PIV (>115 ug/m3). The wind direction was dominantly northwest during PI and PII, turning to the northeast during the PIII and PIV periods, indicating different privileged wind directions during clear and polluted days (Figure 7). The horizontal wind speeds during clear days (PI conditions) were higher than in other phases. The measurement site is located at an east–west basin (Figure 1). A narrow pathway in the northwest direction connects Luoyang with other cities in Fen-Wei Plain. The valley makes the wind blow at a relative high speed, while the North China Plain in the northeast direction may mostly cause the wind to blow at a lower speed.
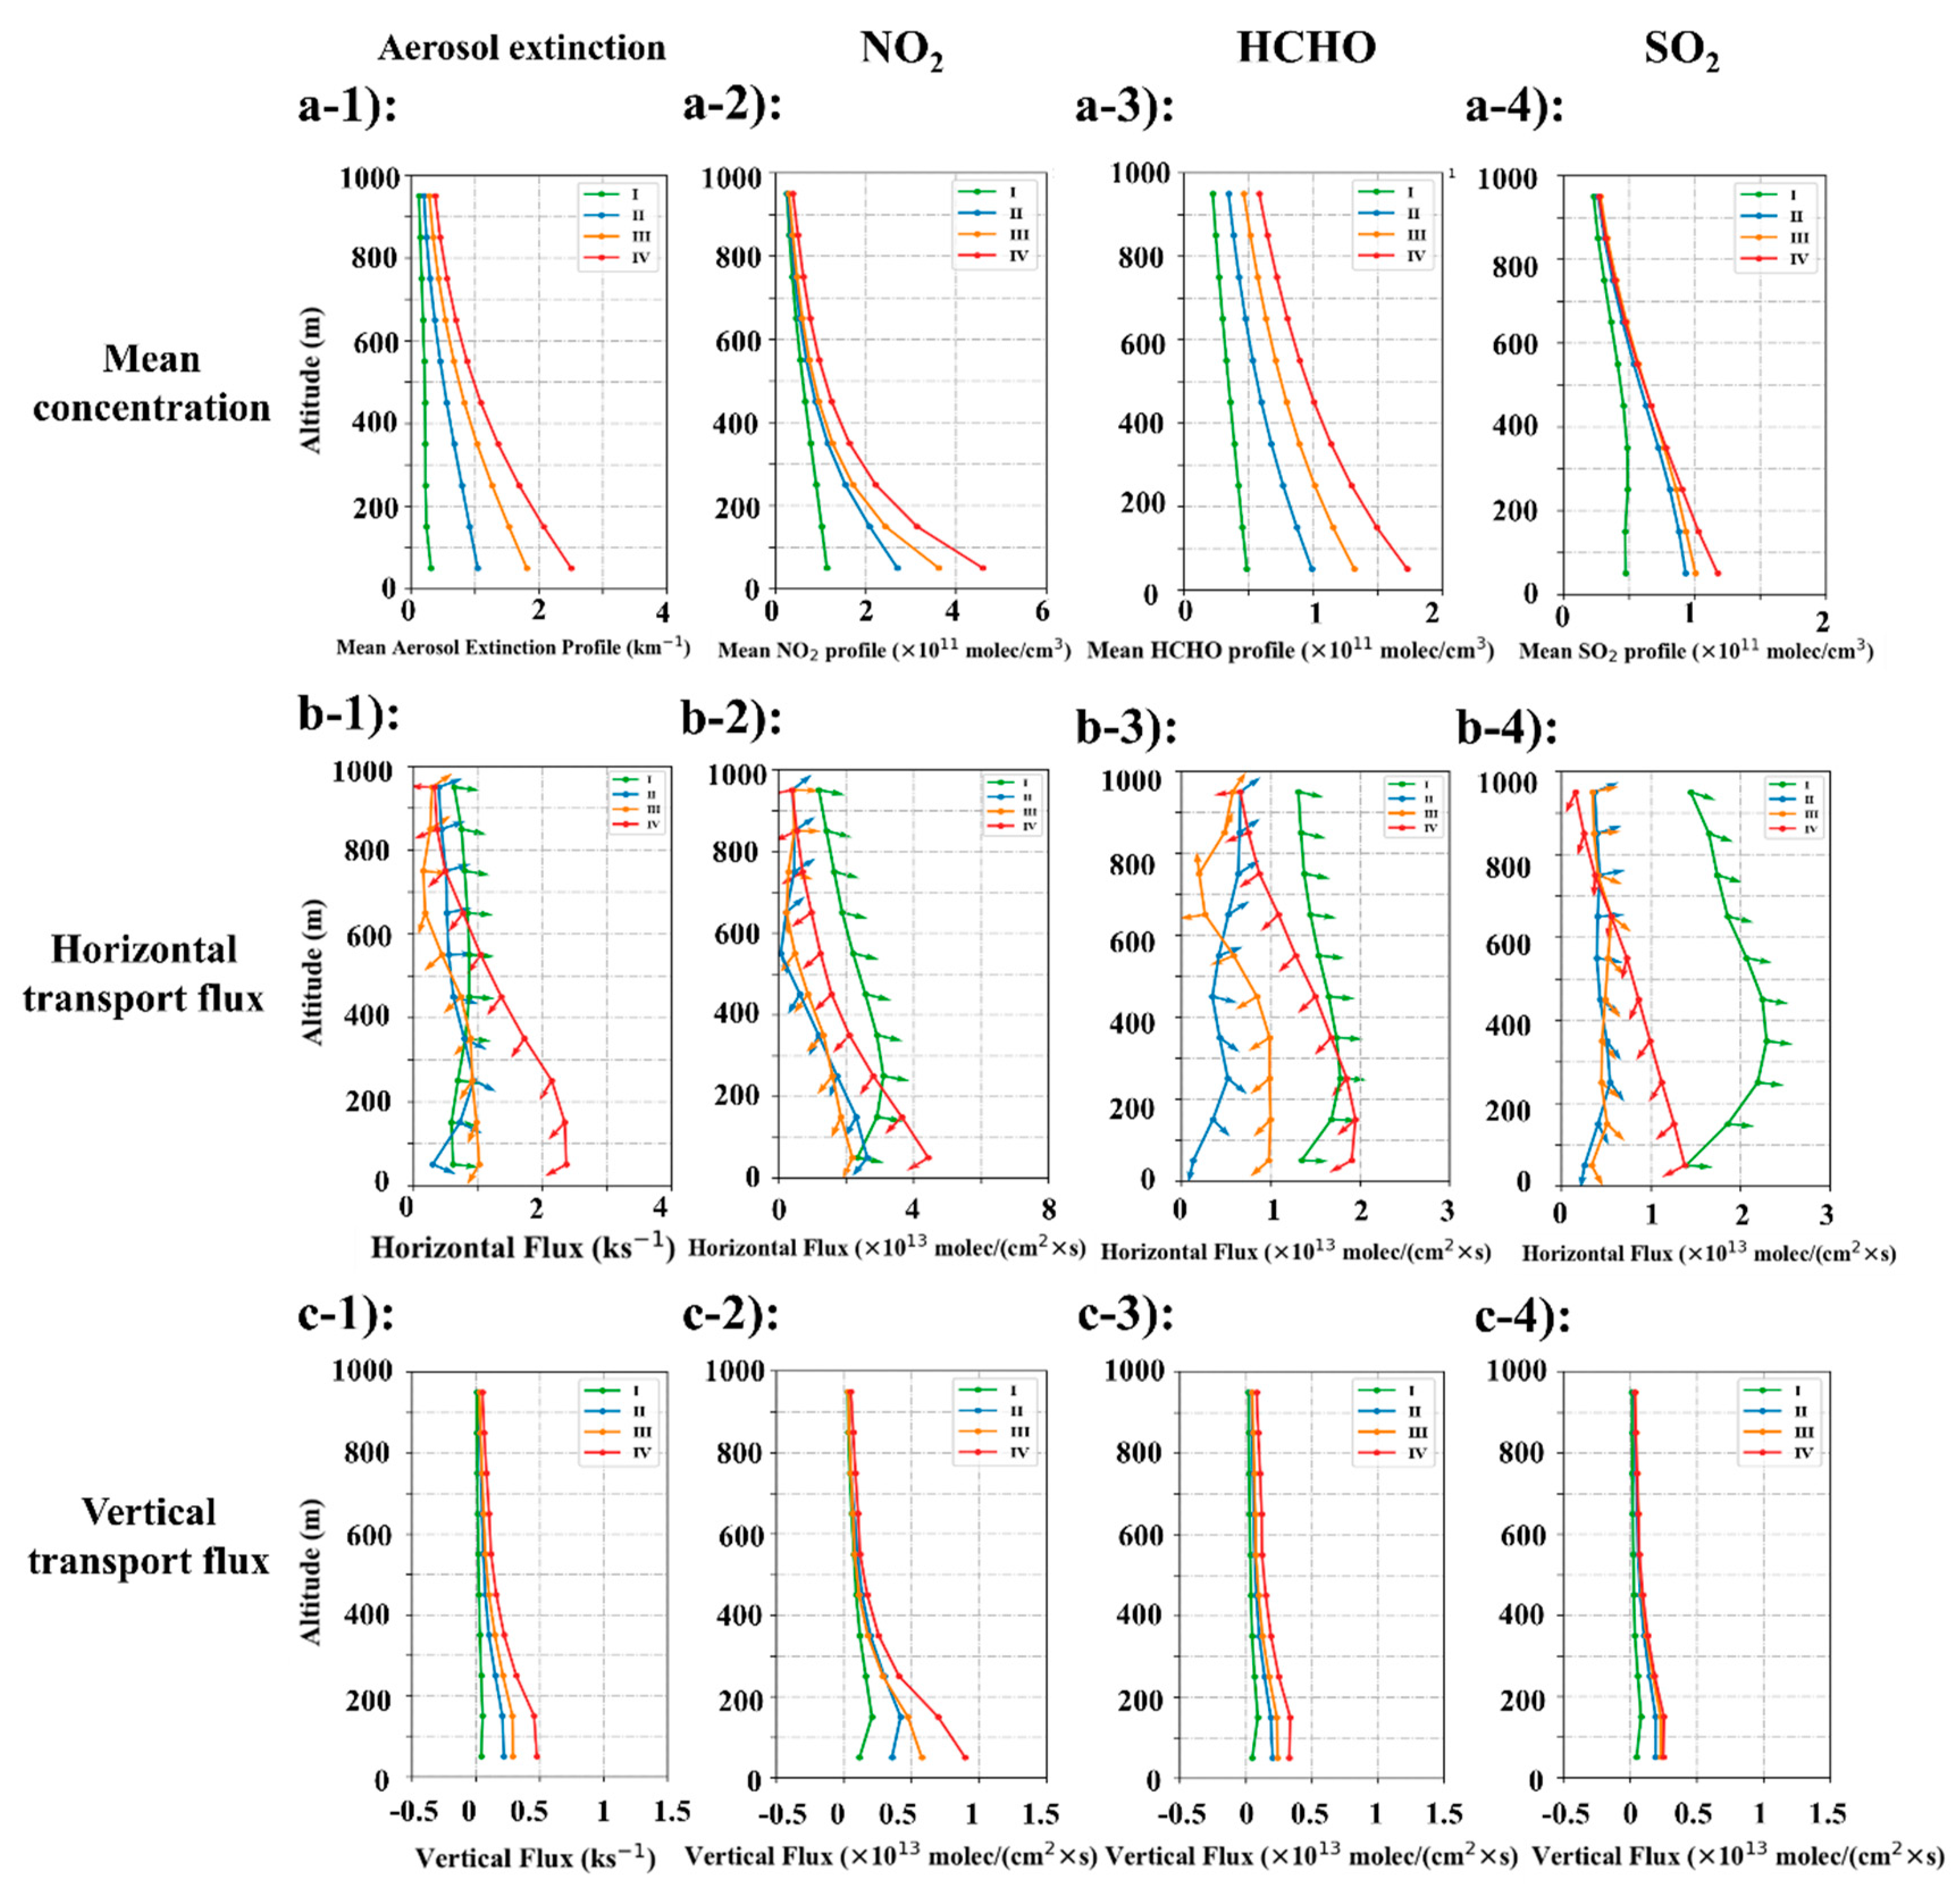
The four pollutant profiles all exhibited an exponentially decreasing shape with altitude (Figure 8) and were mainly distributed near the ground. The maximum increase in the boundary layer was found near the surface for all pollutants. The near-surface aerosol extinction, NO2, HCHO and SO2 increased by 700%, 300%, 250% and 150%, respectively, when mean concentrations for PIV were compared with PI, indicating explosive pollutant growth during heavily polluted days. Different distributions of pollutions may be attributed to their different sources, chemical reactions and transport effect. Particulate matter and NO2 mainly originate from human activities and vehicle emissions [51], causing an exponentially decreasing trend with altitude. SO2 mainly originates from primary emissions, such as emissions from household fuel burning and industrial power generation during wintertime [52]. Long-range transport from other areas may also contribute to SO2 at a higher altitude [56]. Therefore, more fractions in the upper boundary layer can be found for SO2. As for HCHO, primary emissions (e.g., biomass and industrial emissions) and secondary generation (photochemical oxidation) are two important sources in the atmosphere [57,58], so it can be produced in higher altitude because of vertical transport of its precursors.
The mean transport flux profiles were calculated by the vector average and are shown in Figure 8b. These profiles represent the total transport scenarios across the local area during the whole period (the transport effect may get cancelled if two transport directions are opposite to each other during one divided period). The horizontal flux directions were often different or even opposite between clear days (PI and PII) and polluted days (PIII and PIV). Transport from the west to the east dominated clear days for all pollutants, but could turn northeast during haze days. Great transport flux from the northeast was found for aerosol below 400 m during the PIV period, which may indicate more particulate matters were transported from the northeast to the southwest over the city on heavily polluted days. The mean NO2 transport flux showed a nearly exponential decreasing trend with altitude during the PII, PIII and PIV periods from the northeast direction. As for HCHO, the mean transport intensities were similar during clear (PI) and severely polluted days (PIV) with almost opposite directions. The vertical transport fluxes calculated from pollutant concentration and vertical wind speed (Figure 8c) showed a decreasing trend with altitude at all pollution levels. Higher vertical fluxes were found in the lower-most layer during polluted days, meaning that the upward transport in the lower boundary layer would increase during polluted days. Turbulence is another important atmospheric process which mixes the pollutants well in the boundary layer [59]. The vertical transport flux may be larger than the turbulent flux at the surface layer.

4. Discussion

4.1. Transport Flux Variations during Severe-Haze Days

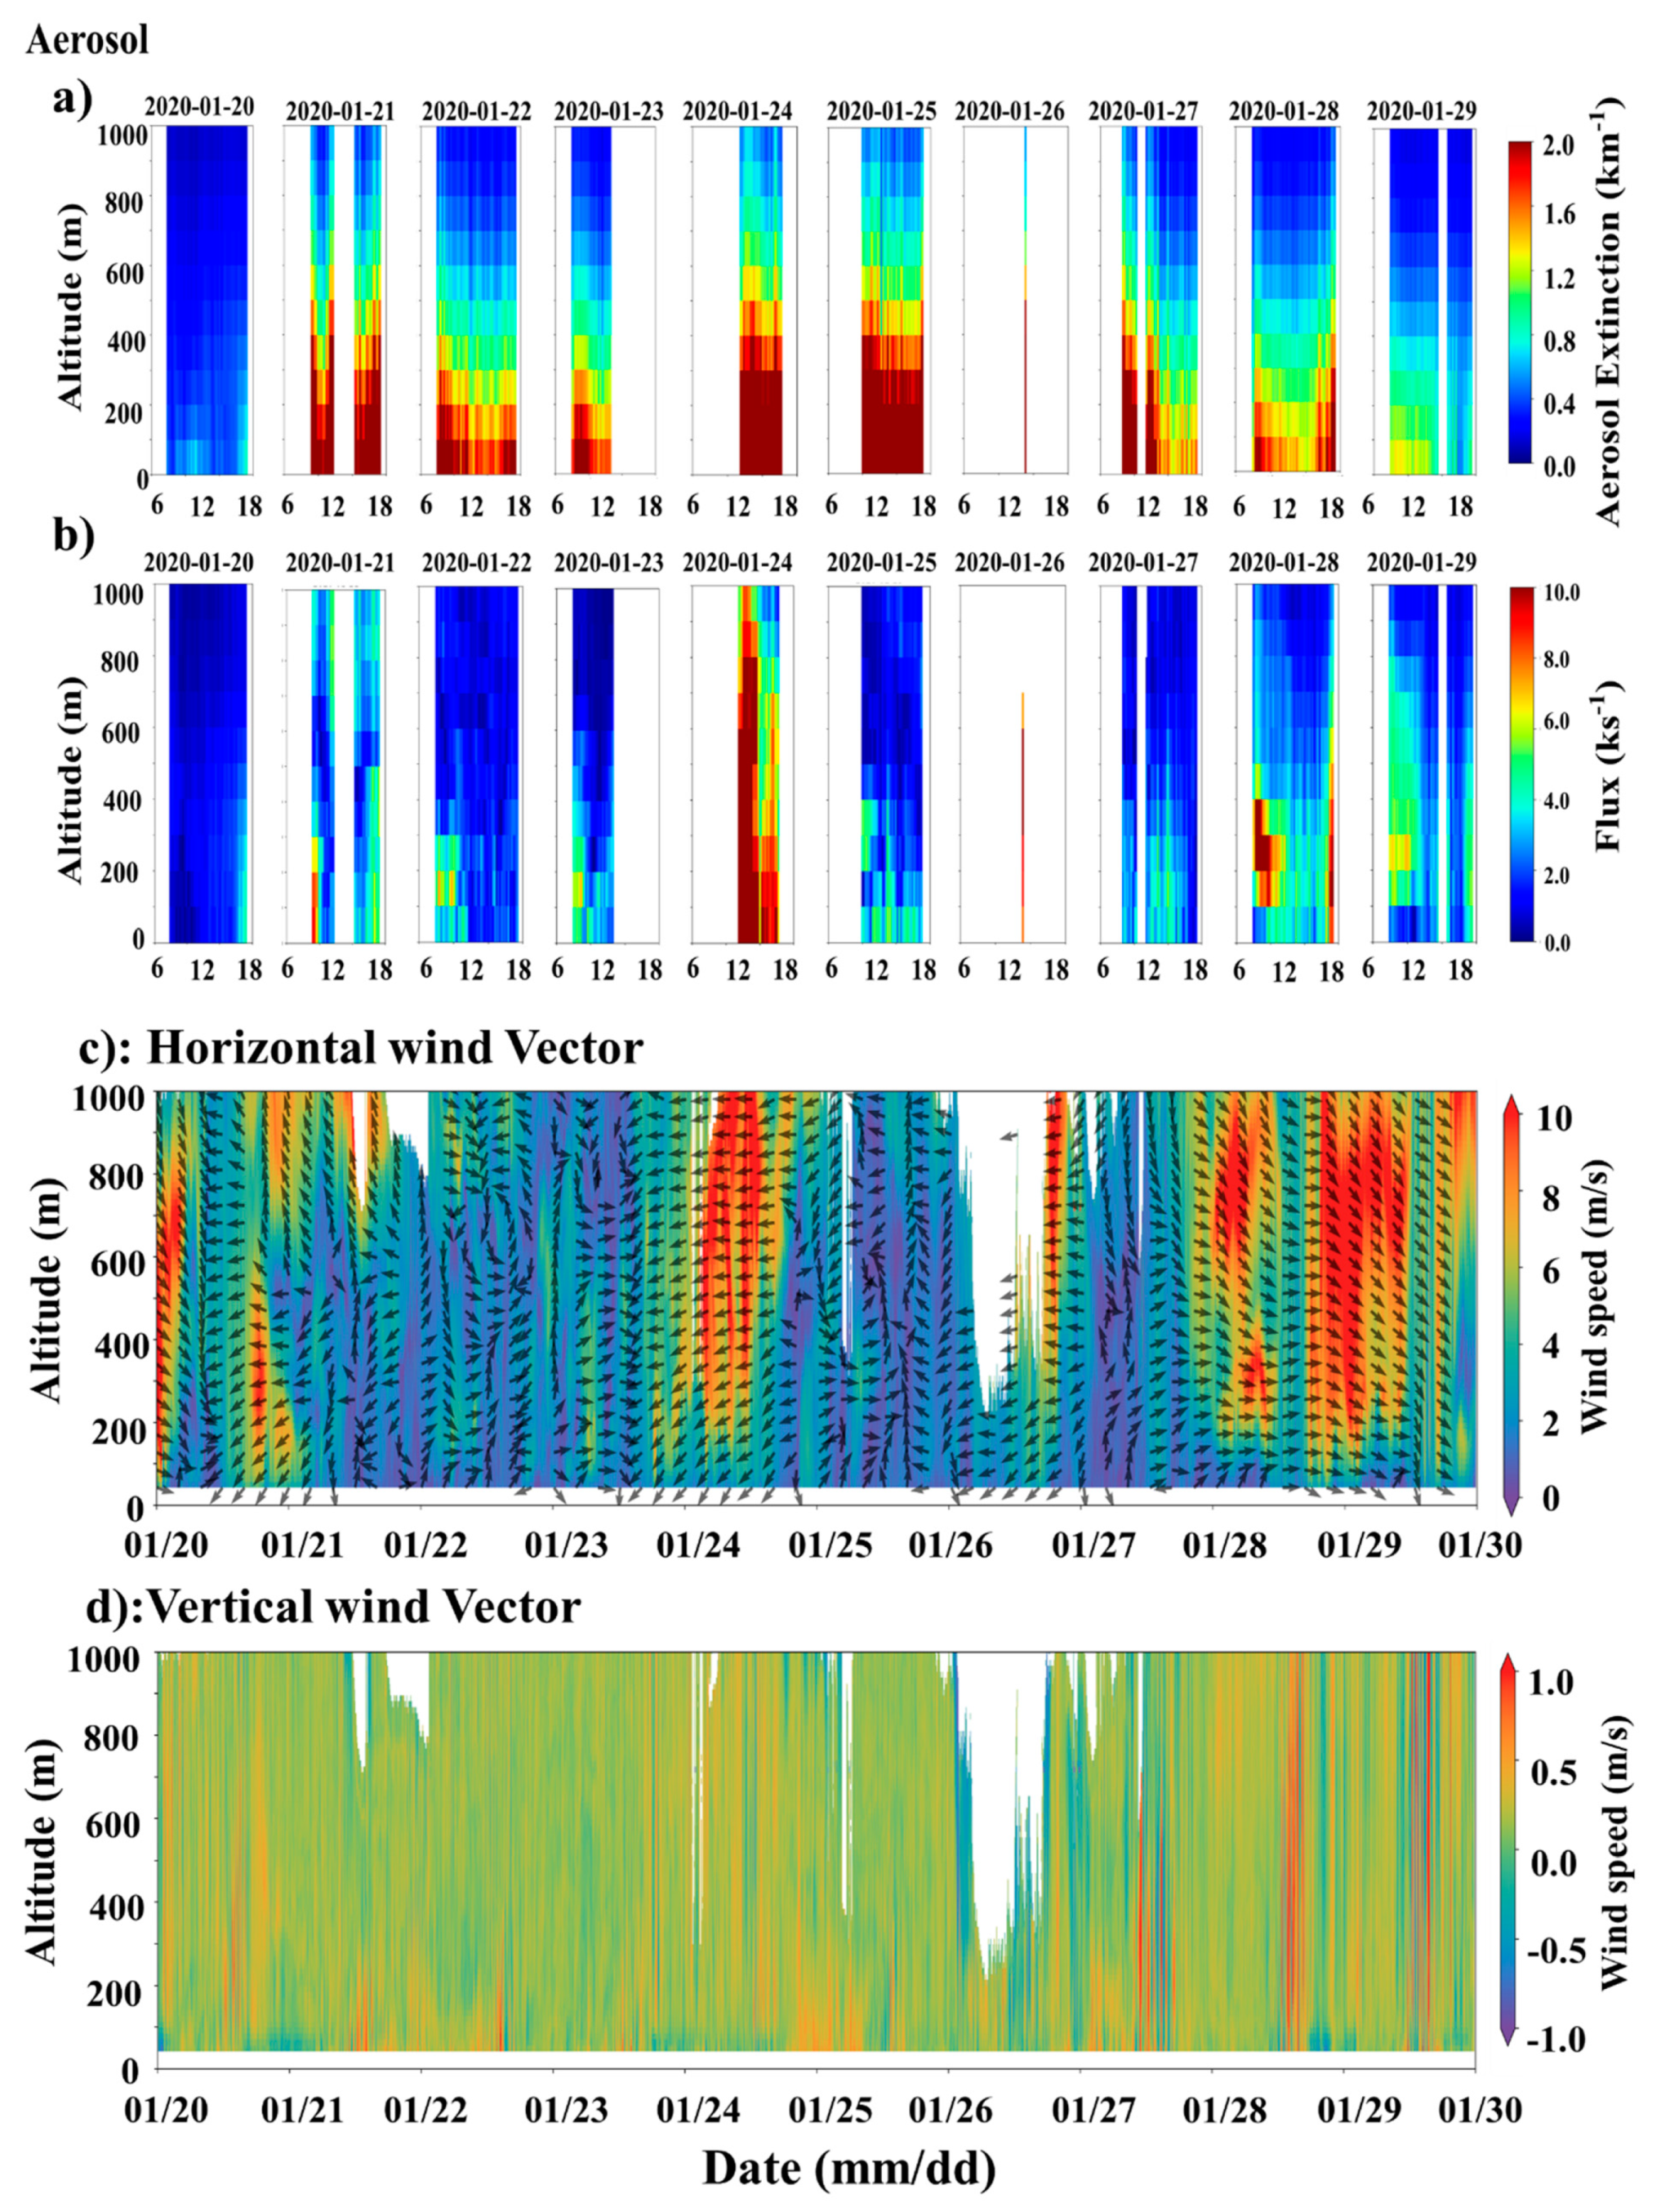
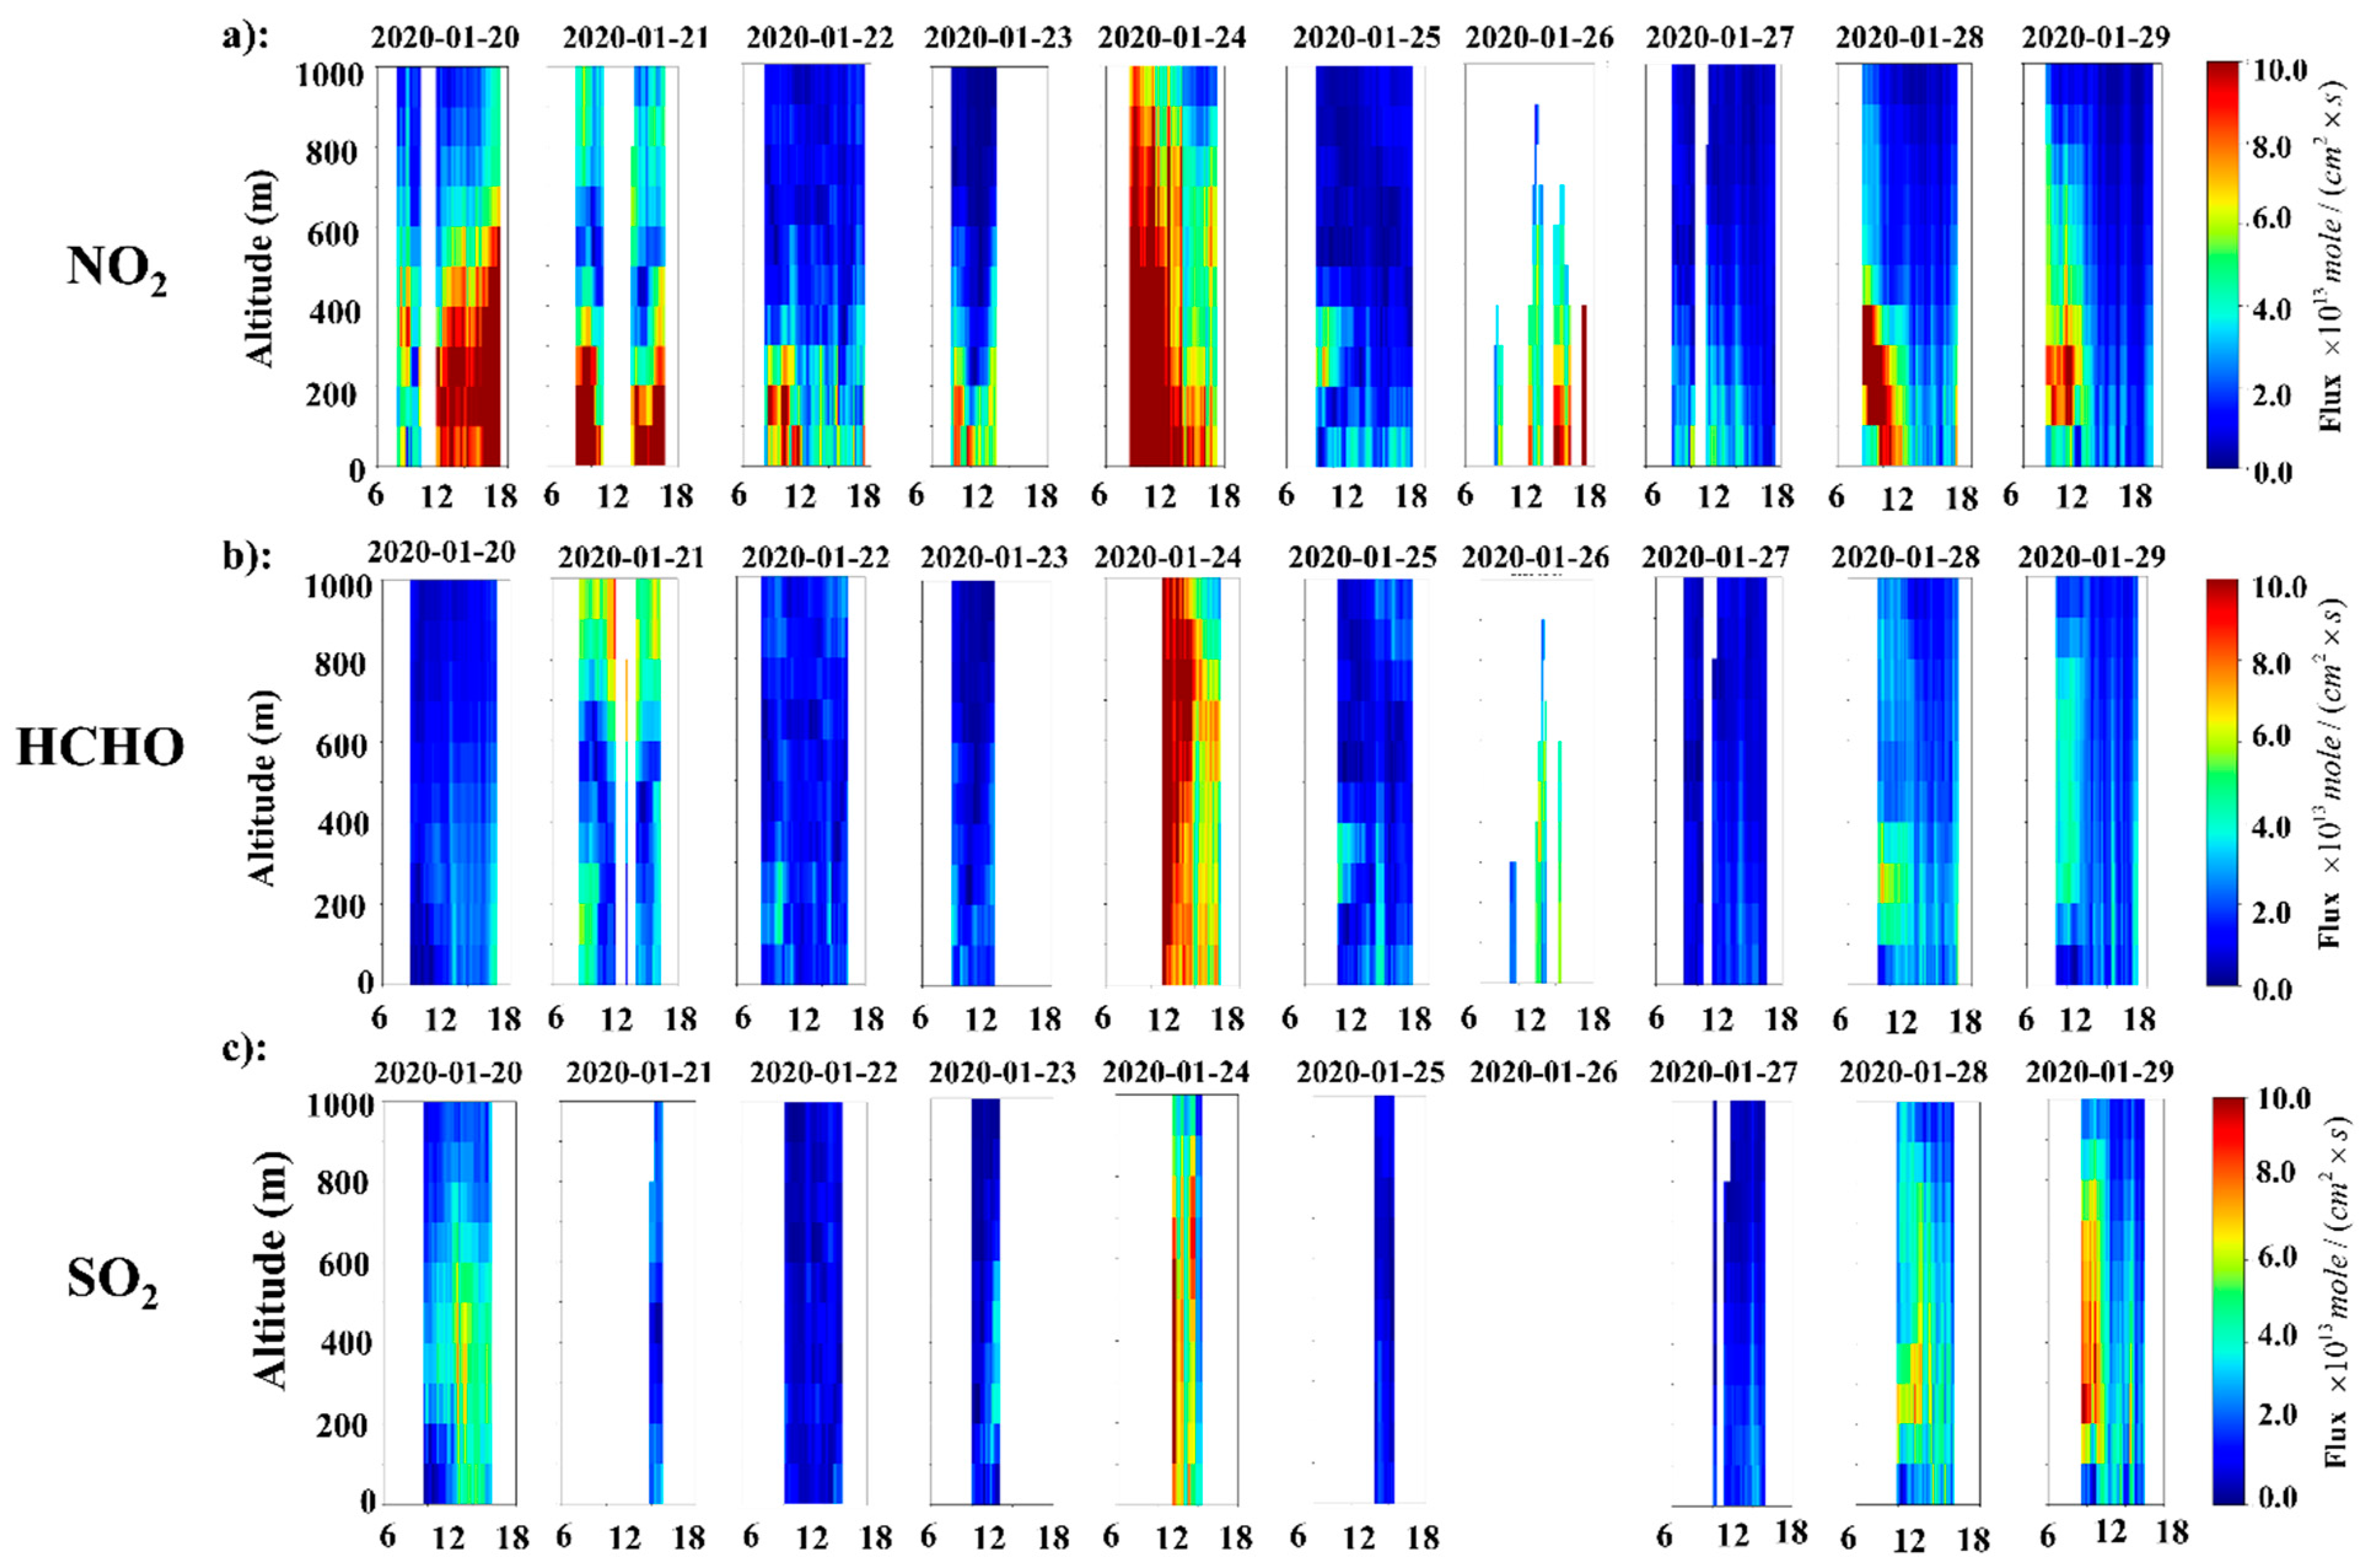
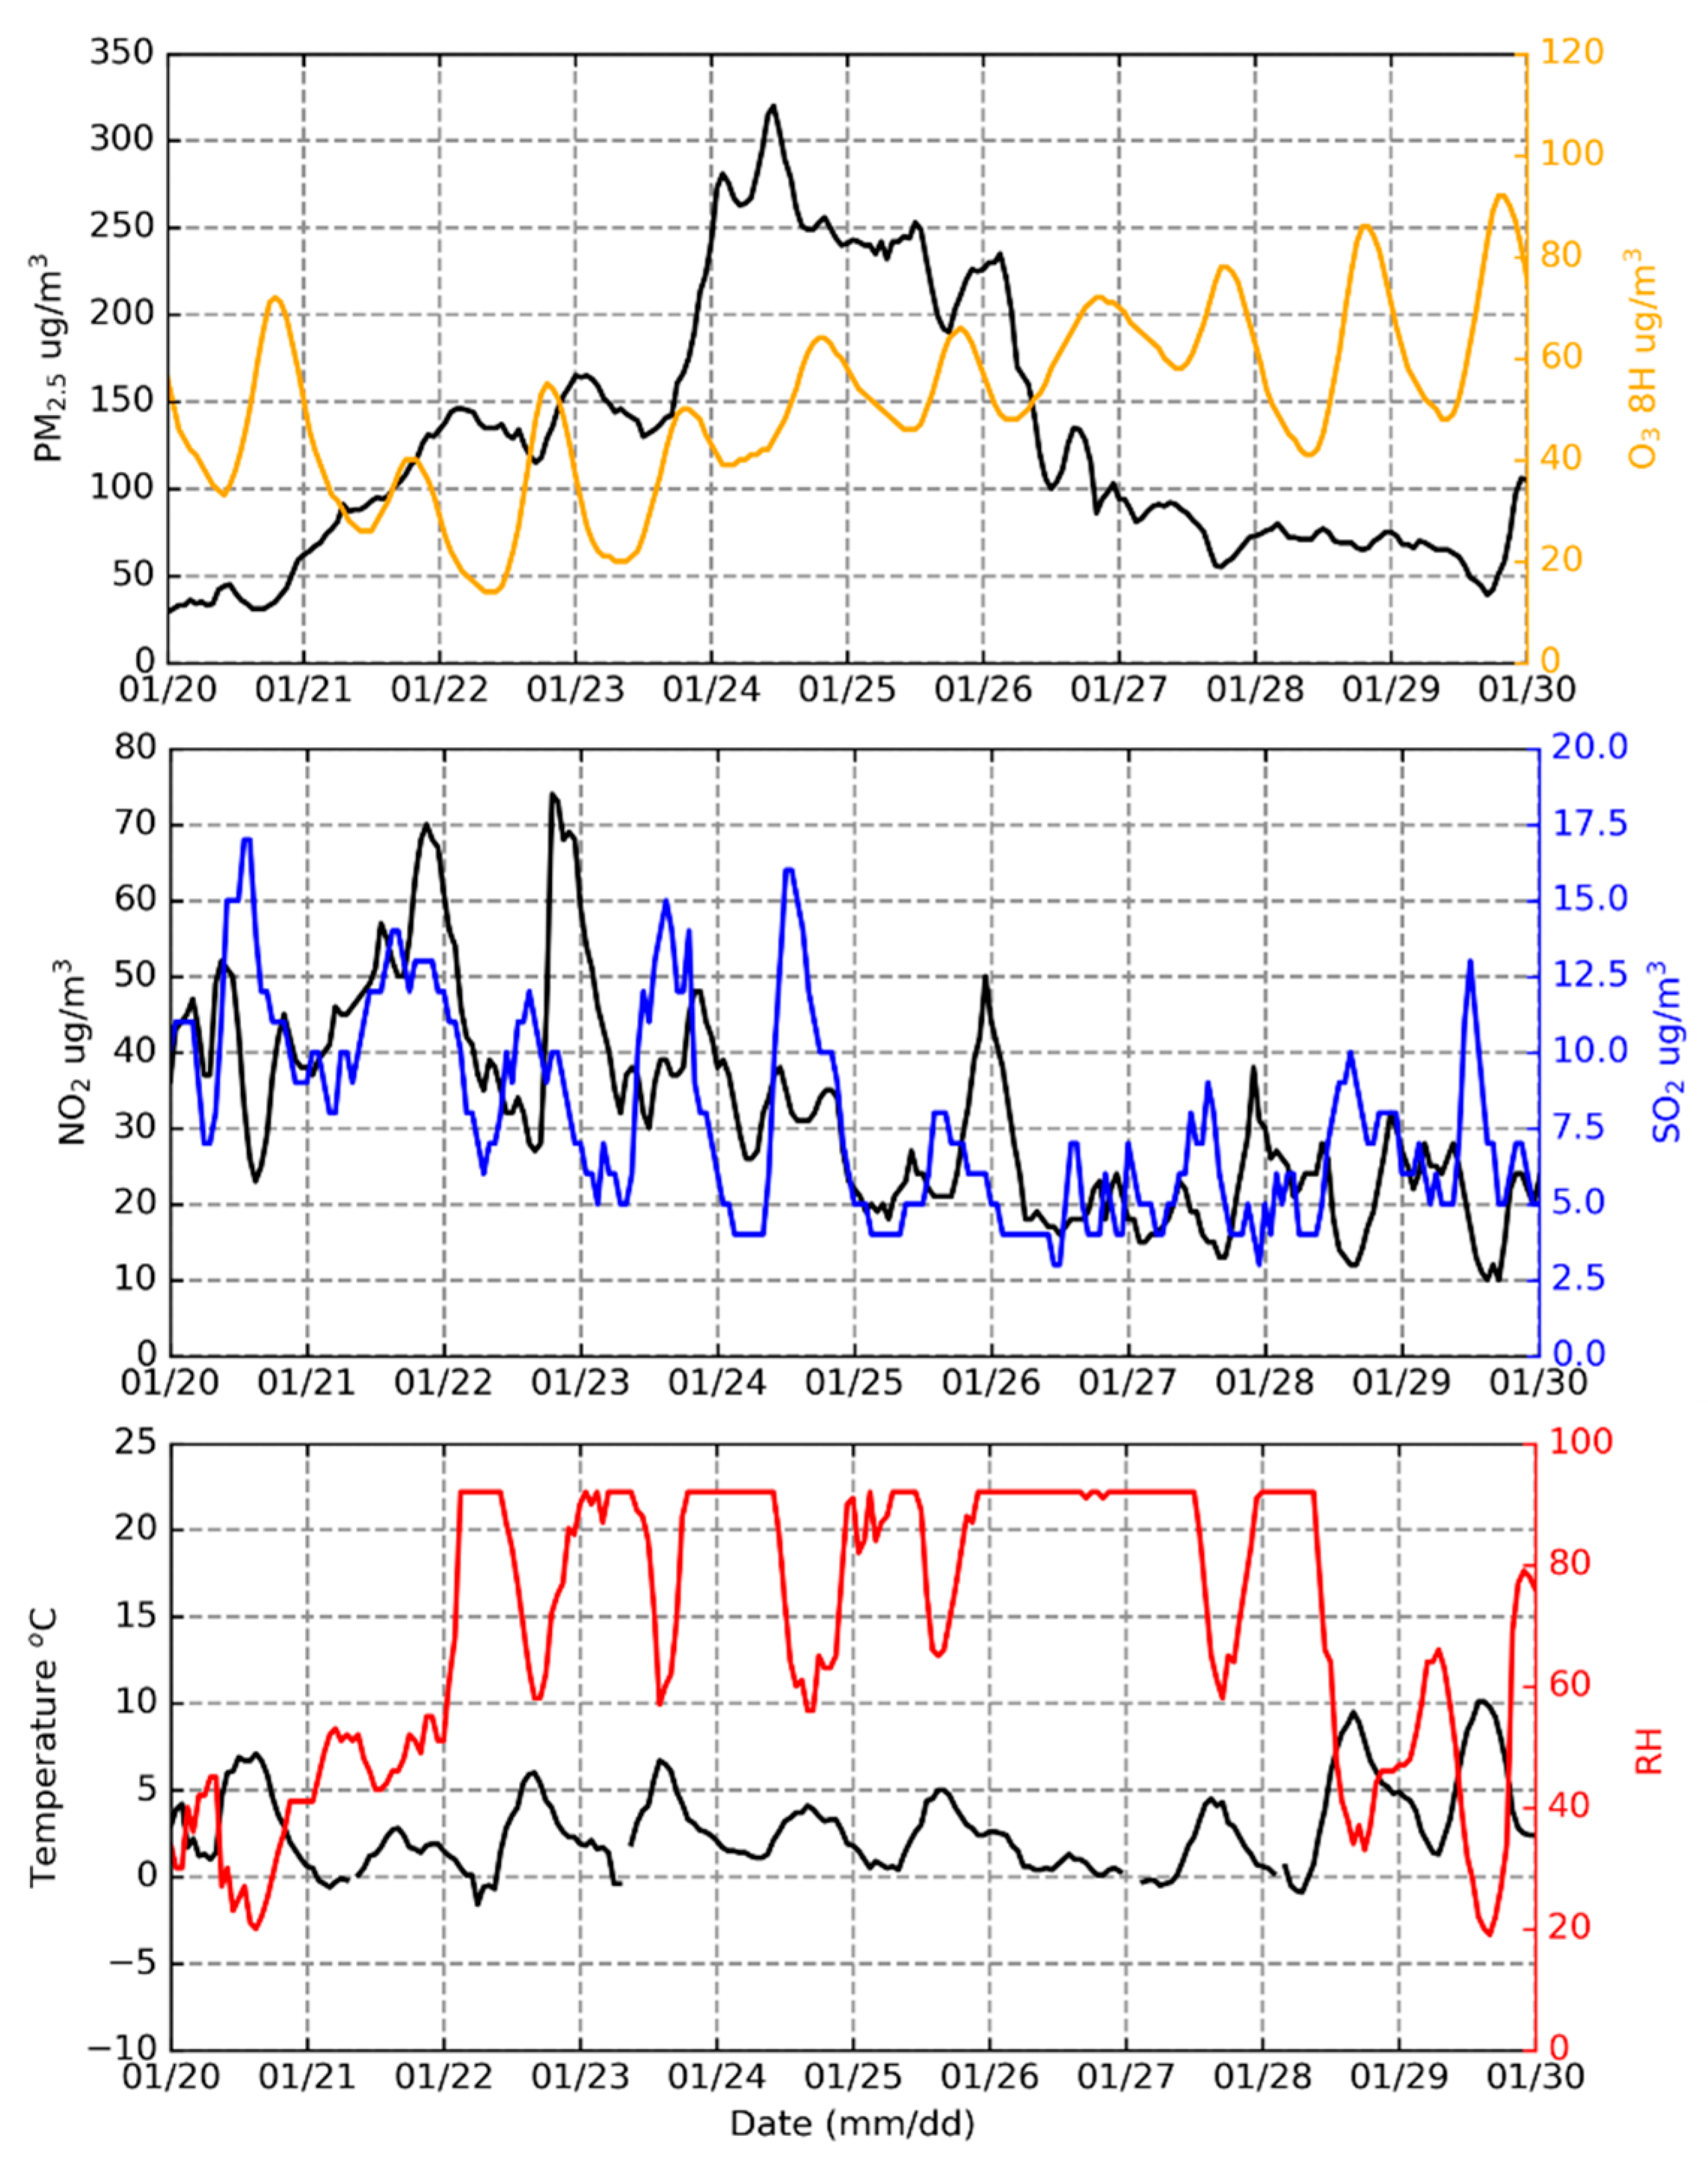
We further investigated the transport flux temporal variations across a haze episode (EP1, 20 to 29 January 2020). The time series of aerosol extinction profiles and pollutants transport fluxes profiles are shown in Figure 9 and Figure 10; surface measurement data, including data on NO2, SO2 and PM2.5 released by CNEMC and temperature and relative humidity measured by lidar are shown in Figure 11. Wind blowing from two privileged wind directions occurred at the start, middle and end of this episode, respectively, which caused increases in transport flux intensities. On 20 January, NO2 (Figure 10a, 20 January) was transported from the northeast to the southwest at an altitude <500 m. The near-surface PM2.5 concentrations also increased after the night on 20 January. This transport process may dominate local precursors or pollutant accumulation before the pollution event. Aerosol extinction began to rise with the increase in NO2 within the boundary layer on 21 January. The transport process of pollutants, including aerosol (Figure 9b), NO2 (Figure 10a), HCHO (Figure 10b) and SO2 (Figure 10c), occurred from the northeast to the southwest (Figure 9c) on 24 January. During this period, the near-surface PM2.5 concentrations significantly increased and reached their peak of the whole episode at noon on 24 January. The flux throughout the boundary layer was dominated by a maximum wind speed of >9 m/s from the northeast to the southwest. PM2.5 reached its maximum concentration (>300 ug/m3) around 12:00 on 24 January, which lasted for roughly two days, while the air quality reached a severely polluted level. Increased flux intensities could be found from 28 to 29 January from the northwest, including aerosol, NO2 and SO2, characterized by high-altitude transport. The horizontal flux was dominated by winds from the northwest to the southeast with a mean speed >10 m/s. The main transport altitude was located at 100–500 m a.g.l.
Flux variations indicate that clear days were dominated by wind blowing from the northwest; significant northeast transport at the surface occurred at the beginning or in the middle of severe-haze days and was accompanied by an increase in near-surface PM2.5 concentrations. Pollutants transported from the surrounding area before haze events may promote local pollutant accumulations [11,49]. Combining the analysis with polar plots of bivariate statistics (Figure 5), we could infer that transport at the surface from the northeast contribute to local haze events; the wind from the northwest may transport fresh air at the middle boundary layer. These results also make up for an inability to observe high-altitude transport processes [10]. Different contributions of wind from the northeast and the northwest were discussed through the analysis of flux variations during a severe haze event. Further improvements in local air quality should be based on the relocation of severely polluting enterprises according to the prevailing wind direction and introducing strong emission reduction measures according to air quality forecasts.

4.2. Transport Flux during the Low-Emission COVID-19 Period

In early 2020, the rapid spread of the novel coronavirus (COVID-19) led the Chinese government to ask citizens to reduce activities nationwide, encouraging them to reduce travel and stay at home [60,61,62,63]. These lockdown restrictions provided a unique opportunity to investigate pollutant variation and pathway transport scenarios under the resulting significant reduction in anthropogenic emission levels. COVID-19 lockdown restrictions began on the Chinese New Year (25 January 2020); we defined the observation period from 26 January to 17 February 2020 as the lockdown period and from 16 to 24 January and from 18 February to 8 March as non-lockdown periods.
To investigate the impact of emission reductions on transport fluxes from the northeast and the northwest during the lockdown period, the mean vertical transport flux profiles for the two directions were obtained (Figure 12). The NO2 transport flux from the northeast was clearly reduced during the lockdown period, which can be attributed to the lockdown of the highly industrialized and urbanized megacity Zhengzhou and the associated reduction in traffic emissions. At the same time, the aerosol transport flux from the northeast increased. Huang et al. comprehensively investigated the mechanisms of enhanced aerosol episodes under the large decreases in primary pollution during the lockdown period and suggested that the large decrease in NOx emissions increased the atmospheric oxidizing capacity and, in turn, promoted the formation of secondary particulate matter (ozone could be used to assess the oxidizing capacity of the atmosphere; an increasing trend in surface O3 concentration after 26 January can also be found in Figure 11) [60]. This is also consistent with our observations. As for the northwest direction, a reduced transport profile was found for HCHO. The area northwest of Luoyang is dominated by rural areas with few manufactories, the closure of which reduced the primary HCHO emissions and led to a decrease in the HCHO transport flux. The lockdown restrictions greatly reduced primary pollutant emissions for a regional and even national scale [61,62], with the changes in the transport profile being also associated with the background and corresponding land use situations along different directions, while the main transport altitudes remained unchanged.

5. Summary and Conclusions

We obtained transport flux profiles of four kinds of pollutants (aerosol, NO2, HCHO and SO2) during winter in Luoyang, Fen-Wei Plain, China, using ground-based remote sensing to gather pollutant concentrations and wind profiles rather than single-point in situ measurements at the near-surface layer. The maximum concentrations of all four pollutants were found in the near-surface layer. Prevailing winds came from the northwest and the northeast during the study period due to the specific topography of the Luoyang surrounding area. The wind direction and total transport scenarios were dominantly northwest during clear days, turning to the northeast during the polluted days. Particulate matters were transported from the northeast to the southwest over the city on heavily polluted days. As for the transport flux profiles from the northeast and the northwest directions, the largest transport strength was found at the near surface for the northeast direction and the main transport altitude was between 200 and 600 m for the northwest pathway. Considering pollution dependence on wind directions and speeds, surface-dominated northeast transport potentially contributes to local haze events and northwest winds transport clean air mass during clean periods. During the COVID-19 lockdown period, primary emissions were greatly reduced and transport fluxes declined for NO2 from the northeast and HCHO from the northwest. A smaller transport flux increment was found for aerosols from the northeast, while the main transport altitudes for each direction remained unchanged. Our findings provide a more thorough understanding of regional transport at different altitudes under different degrees of pollution. Further improvements in the local air quality should be based on relocating severely polluting enterprises according to the prevailing wind direction and introducing strong emission reduction measures according to air quality forecasts.
Flux observations in city centers allow the monitoring of pollutant transport from all directions, clarifying the transport characteristics related to different pollution degrees and pathways. Considering the dominant wind directions and unknown pathway cross-sectional areas, future studies could seek to achieve higher-precision and higher-resolution flux observations for whole days along city boundaries and transport pathways to better quantify the total amount of transport along pathways.

Author Contributions

Conceptualization, Q.H. and B.H.; data curation, X.J., S.W. and H.L.(Hanyang Liu); formal analysis, X.J.; funding acquisition, Q.H.; investigation, X.J., C.X., H.L. (Hua Lin) and J.L.; methodology, Q.H., B.H. and X.J.; project administration, Q.H. and B.H.; software, H.L.(Hanyang Liu). All authors have read and agreed to the published version of the manuscript.

Funding

This work was supported by the National Key Research and Development Program of China (Nos. 2017YFC0210002, 2017YFC0210003, 2018YFC0213104, 2016YFC0203302 and 2017YFC0212800), the National Natural Science Foundation of China (Nos. 41722501, 51778596 and 41977184), the Strategic Priority Research Program of the Chinese Academy of Sciences (No. XDA23020301), the Youth Innovation Promotion Association of CAS (2021443) and the Young Talent Project of the Center for Excellence in Regional Atmospheric Environment, CAS (CERAE202004).

Data Availability Statement

The data presented in this study are available on request from the corresponding author.

Acknowledgments

We thank Jing Cao (Luoyang Eco-Environmental Monitoring Center of Henan Province, Luoyang, Henan, China) and Xueping Zheng and Xiaoyan Zhang (both work at the Luoyang Radiation Environment Service Office, Luoyang, Henan, China) for their contributions in the forms of observations and partial software data analysis. We also thank the Belgian Institute for Space Aeronomy (BIRA-IASB), Brussels, Belgium, for their freely accessible QDOAS software. We also sincerely thank the great contribution of the libRadtran package and the SCIATRAN radiative transfer model.

Conflicts of Interest

The authors declare no conflict of interest.

Appendix A

Appendix A.1. Validations of MAX-DOAS Results

The retrieved concentration profiles from MAX-DOAS were compared with other independent data sets for validation before further analysis. One profile result was divided into 25 vertical layers. The results for each layer represent the mean concentration of the corresponding altitude range. Here, we compared the results of the lower-most layer with the in situ measurement from CNEMC. All results show good correlation with the data from the CNEMC network, which suggests the great reliability of MAX-DOAS observations. The aerosol extinction was compared with the variation in the PM2.5 concentrations; the results are shown in Figure A1.
Figure A1. Comparison results for near-surface layer between MAX-DOAS profiles and CNEMC data: (a) aerosol extinction; (b) NO2; (c) SO2 (colors represent data points’ densities; warmer colors represent more data points).
Remotesensing 13 03664 g0a1
Here, we calculated the frequencies of different vertical distributions for aerosol extinction, NO2, HCHO and SO2. The maximum concentration of the vertical profile was near the surface, indicating a decreasing trend with altitude and abbreviated as “surface” in Table A1. Higher concentrations at higher altitudes than near the surface generally indicate an elevated concentration layer in the boundary layer and are abbreviated as “elevated”. In the majority of cases, aerosol, NO2 and HCHO were distributed near the surface, while SO2 showed elevated distribution characteristics in half of the cases, which may suggest that SO2 in Luoyang is more likely affected by high-altitude transport from the surrounding area.
Table A1. Statistics of vertical distribution of various pollutants.
Aerosol ExtinctionNO2HCHOSO2
surface84.92%79.72%88.48%53.96%
elevated15.08%20.28%11.52%46.04%
For MAX-DOAS profile retrieval, the degrees of freedom of signal (DFS), which correspond to the number of independent pieces of information contained in the measurements, was also concluded to evaluate the retrieval quality. The profile corresponding to a DFS greater than 3 usually is not credible in MAX-DOAS profile retrieval. The average DFS were 1.77, 2.23, 1.43 and 2.10 for aerosol, NO2, HCHO and SO2, respectively, during the whole observation period.
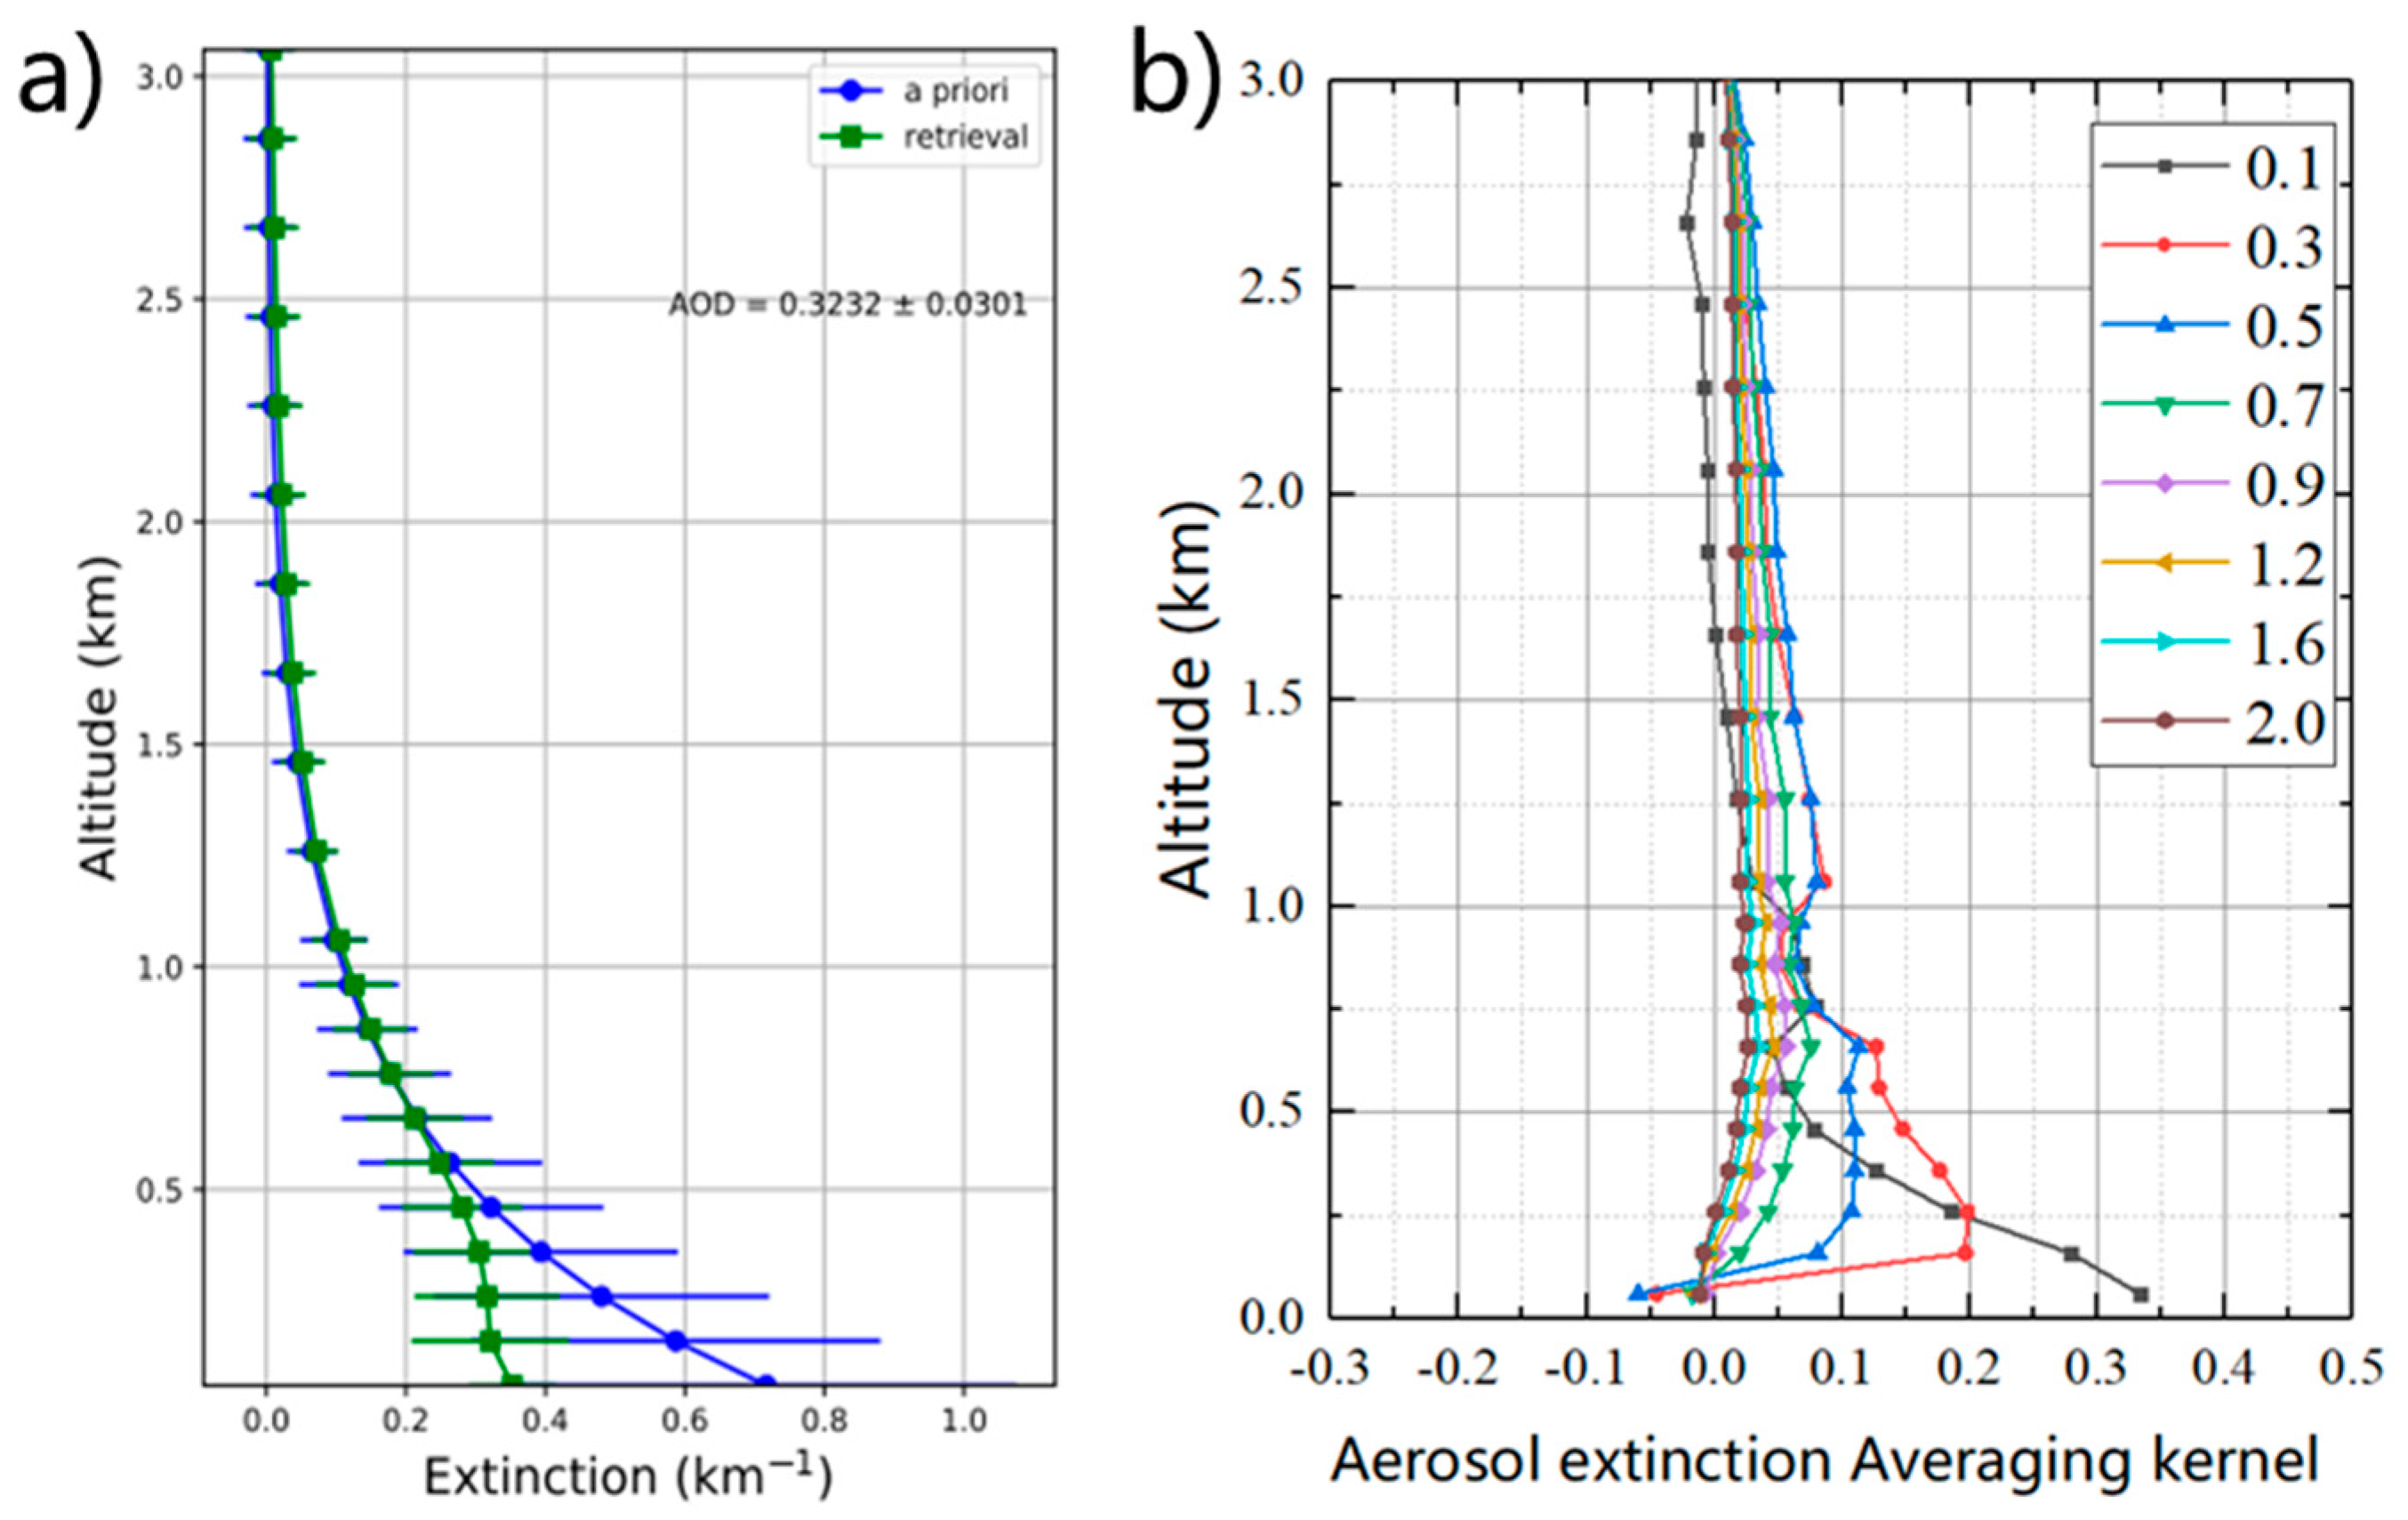
We show an example of the retrieval performance of the aerosol extinction profile in Figure A2 (20 January 2020, 05:10:39 UTC time). Figure A2a compares the a priori and the retrieved profile; the maximum aerosol extinction was found near the surface. The DFS is 2.28, indicating more than two independent pieces of information contained in the measurements. Averaging kernels profiles (Figure A2b) suggest that aerosol retrieval is mainly sensitive to the layer close to the boundary layer, especially for the surface. MAX-DOAS profile results below 1 km were further used in this study.
Figure A2. Example of aerosol extinction vertical profile retrieval (20 January 2020, 05:10:39 UTC time): (a) retrieved profile and a priori profile; (b) averaging kernel profiles.
Remotesensing 13 03664 g0a2
For the vertical profiles validations, we compared the aerosol extinction profiles retrieved by MAX-DOAS with those from lidar measurements in our previous studies [23,64] and water vapor profiles with sounding profiles by Lin et al. [21]. Furthermore, our group participated in the international comparison campaigns (CINDI-2 campaign in Cabauw, the Netherlands, refers to USTC group) to verify our instruments and algorithms [65,66,67]. Our results are consistent with those from other groups and show good performance.

Appendix A.2. Description of Z-Score Method

The Z-score method is a data quality control method to filter the unreliable data points according to the principles of statistics. This method has been used in many previous studies [68,69,70,71]. All data are first standardized following Equation (A1):
Z i = [ d i m e a n ( d ) ] / s t d ( d )
where Zi represents standardized data, d represents all raw data, mean(d) is the average of all raw data d and std(d) is the standard deviation of all raw data. Then, standardized data (Zi) is removed if it meets one of the following conditions:
(1)
The absolute Zi is greater than 4 (|Zi| > 4).
(2)
The variation of Zi compared with its previous Zi−1 is greater than 9 (|ZiZi−1| > 9).
(3)
The ratio of three times Zi compared with its centered sum (Zi−1 + Zi + Zi+1) is greater than 2 (3 × Zi/(Zi−1 + Zi + Zi+1) > 2).

Appendix A.3. Discussion about the Classification Criteria of Polluted Days
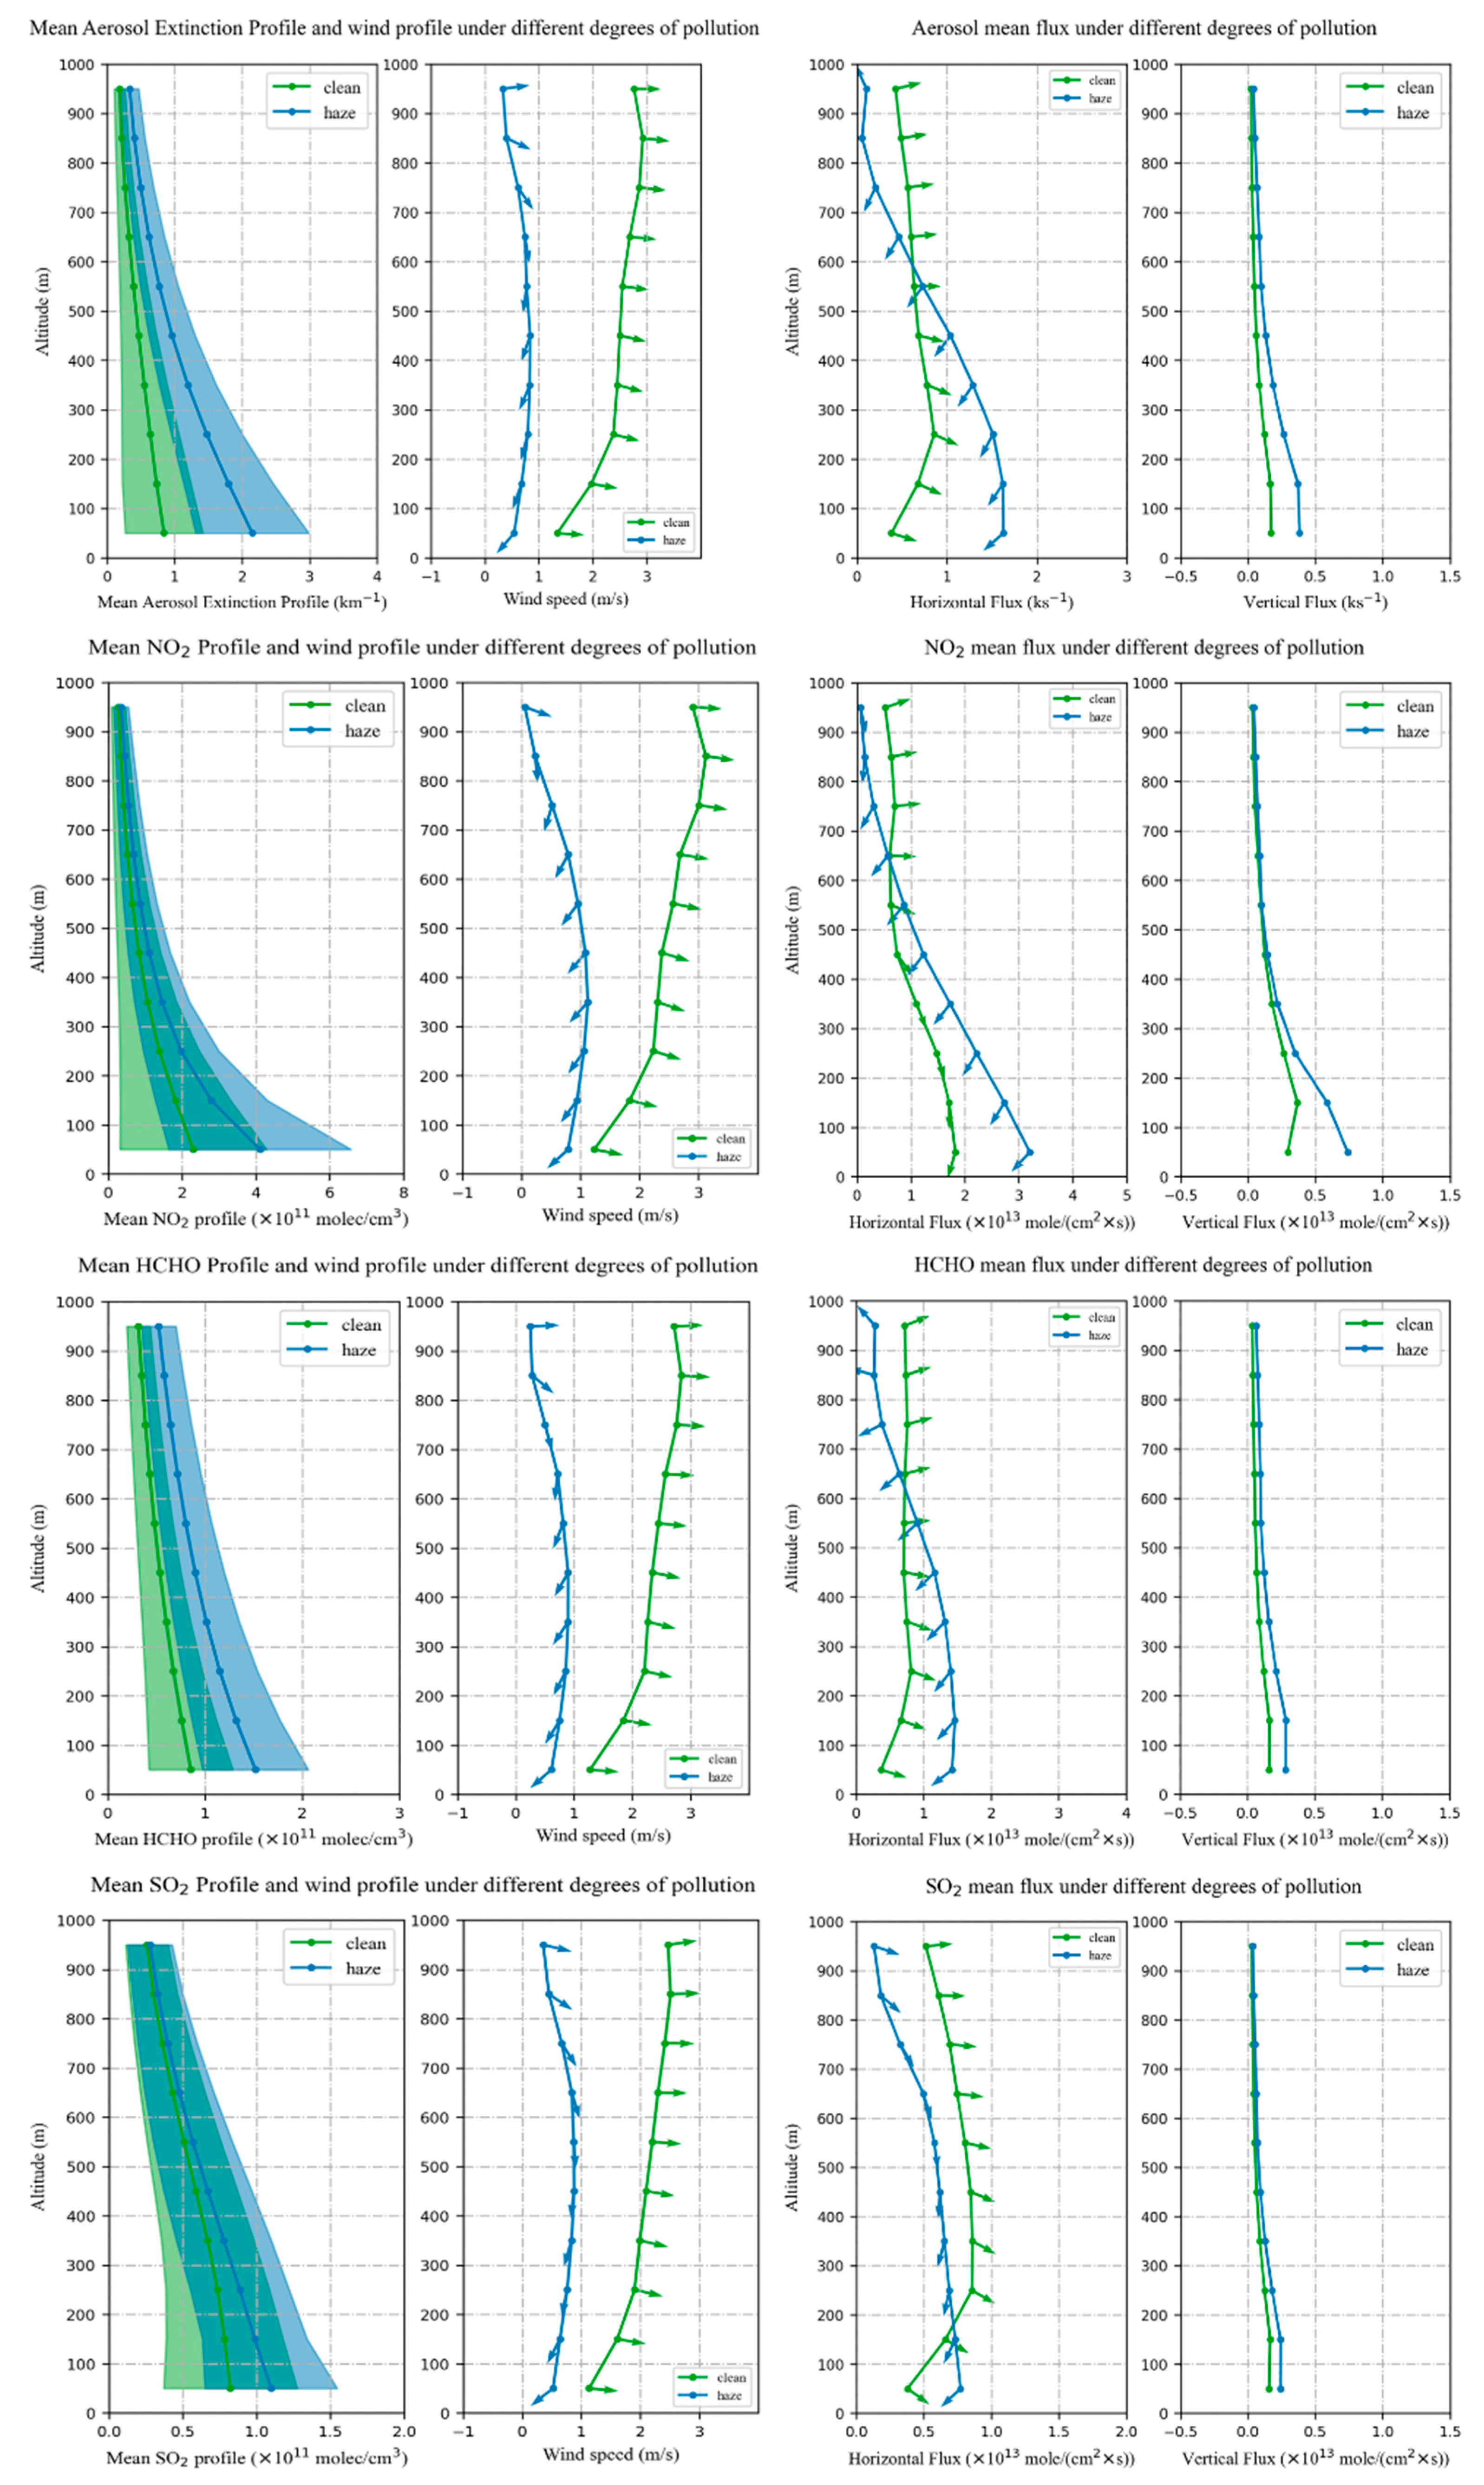
Here, we classify the sampling days into two groups according to the PM2.5 concentrations (clear days, PM2.5 < 75 ug·m−3, and polluted days, PM2.5 > 75 ug·m−3). The mean concentration profiles and the mean flux profiles during clear and polluted days are shown in Figure A3. The transport flux generally shows a decreasing trend with altitude; the maximum transport flux was found at the surface layer. Four kinds of pollutants profiles exhibit an exponentially decreasing trend with altitude. Two transport directions (northeast and northwest) were obvious for clear and polluted days, respectively. In the main text of this study, we classified the sampling days into four groups according to the PM2.5 concentrations (PI, PII, PIII and PIV respectively). It is worth mentioning here that SO2 was found to be transported from the north during haze days and NO2 was found to be transported from the north during clear days, if we classify the sampling days into two groups. Considering the difference in criteria for the classification, the pollution degrees of PI and PII were taken as clear days; PIII and PIV as polluted days. Transport from the ‘north’ could be the result of vector average calculations (taking NO2 concentration during clear days as an example; as a result of vector average calculations of NO2 transport from the northwest during the PI period and transport from the northeast during the PII period, we obtain transport from the ‘north’ during clear days; please refer to Figure A3). So, we think it is better to classify the sampling days into four groups.
Figure A3. Mean pollutants profiles (first column), mean wind profiles (second column), mean horizontal transport flux profiles (third column) and mean vertical transport flux profiles (fourth column) during clear days and polluted days. Each row is the result of aerosol extinction, NO2, HCHO and SO2, respectively (from top to bottom).
Remotesensing 13 03664 g0a3

References

  1. Shen, F.; Zhang, L.; Jiang, L.; Tang, M.; Gai, X.; Chen, M.; Ge, X. Temporal variations of six ambient criteria air pollutants from 2015 to 2018, their spatial distributions, health risks and relationships with socioeconomic factors during 2018 in China. Environ. Int. 2020, 137, 105556. [Google Scholar] [CrossRef]
  2. Liu, J.; Zheng, Y.; Geng, G.; Hong, C.; Li, M.; Li, X.; Liu, F.; Tong, D.; Wu, R.; Zheng, B. Decadal changes in anthropogenic source contribution of PM 2.5 pollution and related health impacts in China, 1990–2015. Atmos. Chem. Phys. 2020, 20, 7783–7799. [Google Scholar] [CrossRef]
  3. Lu, X.; Lin, C.; Li, Y.; Yao, T.; Fung, J.C.; Lau, A.K. Assessment of health burden caused by particulate matter in southern China using high-resolution satellite observation. Environ. Int. 2017, 98, 160–170. [Google Scholar] [CrossRef]
  4. Hu, J.; Ying, Q.; Wang, Y.; Zhang, H. Characterizing multi-pollutant air pollution in China: Comparison of three air quality indices. Environ. Int. 2015, 84, 17–25. [Google Scholar] [CrossRef] [PubMed]
  5. Tang, G.; Zhang, J.; Zhu, X.; Song, T.; Münkel, C.; Hu, B.; Schäfer, K.; Liu, Z.; Zhang, J.; Wang, L. Mixing layer height and its implications for air pollution over Beijing, China. Atmos. Chem. Phys. 2016, 16, 2459. [Google Scholar] [CrossRef] [Green Version]
  6. Yu, M.; Tang, G.; Yang, Y.; Li, Q.; Wang, Y.; Miao, S.; Zhang, Y.; Wang, Y. The interaction between urbanization and aerosols during a typical winter haze event in Beijing. Atmos. Chem. Phys. 2020, 20, 9855–9870. [Google Scholar] [CrossRef]
  7. Hong, Q.; Liu, C.; Hu, Q.; Xing, C.; Tan, W.; Liu, H.; Huang, Y.; Zhu, Y.; Zhang, J.; Geng, T.; et al. Evolution of the vertical structure of air pollutants during winter heavy pollution episodes: The role of regional transport and potential sources. Atmos. Res. 2019, 228, 206–222. [Google Scholar] [CrossRef]
  8. Chen, D.; Liu, X.; Lang, J.; Zhou, Y.; Wei, L.; Wang, X.; Guo, X. Estimating the contribution of regional transport to PM2.5 air pollution in a rural area on the North China Plain. Sci. Total Environ. 2017, 583, 280–291. [Google Scholar] [CrossRef]
  9. Zhu, X.; Tang, G.; Hu, B.; Wang, L.; Xin, J.; Zhang, J.; Liu, Z.; Münkel, C.; Wang, Y. Regional pollution and its formation mechanism over North China Plain: A case study with ceilometer observations and model simulations. J. Geophys. Res. Atmos. 2016, 121, 14574–14588. [Google Scholar] [CrossRef]
  10. Li, Y.; Ye, C.; Liu, J.; Zhu, Y.; Wang, J.; Tan, Z.; Lin, W.; Zeng, L.; Zhu, T. Observation of regional air pollutant transport between the megacity Beijing and the North China Plain. Atmos. Chem. Phys. 2016, 16, 14265–14283. [Google Scholar] [CrossRef] [Green Version]
  11. Zhong, J.; Zhang, X.; Dong, Y.; Wang, Y.; Liu, C.; Wang, J.; Zhang, Y.; Che, H. Feedback effects of boundary-layer meteorological factors on cumulative explosive growth of PM2.5 during winter heavy pollution episodes in Beijing from 2013 to 2016. Atmos. Chem. Phys. 2018, 18, 247. [Google Scholar] [CrossRef] [Green Version]
  12. Gong, C.; Liao, H.; Zhang, L.; Yue, X.; Dang, R.; Yang, Y. Persistent ozone pollution episodes in North China exacerbated by regional transport. Environ. Pollut. 2020, 265, 115056. [Google Scholar] [CrossRef] [PubMed]
  13. Huang, X.; Ding, A.; Wang, Z.; Ding, K.; Gao, J.; Chai, F.; Fu, C. Amplified transboundary transport of haze by aerosol–boundary layer interaction in China. Nat. Geosci. 2020, 13, 1–7. [Google Scholar] [CrossRef]
  14. Koracin, D.; Vellore, R.; Lowenthal, D.H.; Watson, J.G.; Koracin, J.; McCord, T.; DuBois, D.W.; Chen, L.-W.A.; Kumar, N.; Knipping, E.M.; et al. Regional source identification using Lagrangian stochastic particle dispersion and HYSPLIT backward-trajectory models. J. Air Waste Manag. Assoc. 2011, 61, 660–672. [Google Scholar] [CrossRef] [PubMed]
  15. Stein, A.; Draxler, R.R.; Rolph, G.D.; Stunder, B.J.; Cohen, M.; Ngan, F. NOAA’s HYSPLIT atmospheric transport and dispersion modeling system. Bull. Am. Meteorol. Soc. 2015, 96, 2059–2077. [Google Scholar] [CrossRef]
  16. Chang, X.; Wang, S.; Zhao, B.; Cai, S.; Hao, J. Assessment of inter-city transport of particulate matter in the Beijing-Tianjin-Hebei region. Atmos. Chem. Phys. 2018, 18, 4843–4858. [Google Scholar] [CrossRef]
  17. Chapman, E.G.; Gustafson, W., Jr.; Easter, R.C.; Barnard, J.C.; Ghan, S.J.; Pekour, M.S.; Fast, J.D. Coupling aerosol-cloud-radiative processes in the WRF-Chem model: Investigating the radiative impact of elevated point sources. Atmos. Chem. Phys. 2009, 9, 945–964. [Google Scholar] [CrossRef] [Green Version]
  18. Giez, A.; Ehret, G.; Schwiesow, R.L.; Davis, K.J.; Lenschow, D.H. Water vapor flux measurements from ground-based vertically pointed water vapor differential absorption and Doppler lidars. J. Atmos. Ocean. Technol. 1999, 16, 237–250. [Google Scholar] [CrossRef]
  19. Engelmann, R.; Wandinger, U.; Ansmann, A.; Müller, D.; Žeromskis, E.; Althausen, D.; Wehner, B. Lidar observations of the vertical aerosol flux in the planetary boundary layer. J. Atmos. Ocean. Technol. 2008, 25, 1296–1306. [Google Scholar] [CrossRef]
  20. Liu, Y.; Tang, G.; Zhou, L.; Hu, B.; Liu, B.; Li, Y.; Liu, S.; Wang, Y. Mixing layer transport flux of particulate matter in Beijing, China. Atmos. Chem. Phys. 2019, 19, 9531–9540. [Google Scholar] [CrossRef] [Green Version]
  21. Lin, H.; Liu, C.; Xing, C.; Hu, Q.; Hong, Q.; Liu, H.; Li, Q.; Tan, W.; Ji, X.; Wang, Z.; et al. Validation of Water Vapor Vertical Distributions Retrieved from MAX-DOAS over Beijing, China. Remote Sens. 2020, 12, 3193. [Google Scholar] [CrossRef]
  22. Wagner, T.; Beirle, S.; Brauers, T.; Deutschmann, T.; Frieß, U.; Hak, C.; Halla, J.; Heue, K.; Junkermann, W.; Li, X. Inversion of tropospheric profiles of aerosol extinction and HCHO and NO2 mixing ratios from MAX-DOAS observations in Milano during the summer of 2003 and comparison with independent data sets. Atmos. Meas. Tech. 2011, 4, 2685. [Google Scholar] [CrossRef] [Green Version]
  23. Xing, C.; Liu, C.; Wang, S.; Chan, K.L.; Gao, Y.; Huang, X.; Su, W.; Zhang, C.; Dong, Y.; Fan, G. Observations of the vertical distributions of summertime atmospheric pollutants and the corresponding ozone production in Shanghai, China. Atmos. Chem. Phys. 2017, 17, 14275–14289. [Google Scholar] [CrossRef] [Green Version]
  24. Wang, H.; Barthelmie, R.; Clifton, A.; Pryor, S. Wind measurements from arc scans with Doppler wind lidar. J. Atmos. Ocean. Technol. 2015, 32, 2024–2040. [Google Scholar] [CrossRef]
  25. Wildmann, N.; Päschke, E.; Roiger, A.; Mallaun, C. Towards improved turbulence estimation with Doppler wind lidar velocity-azimuth display (VAD) scans. Atmos. Meas. Tech. 2020, 13, 4141–4158. [Google Scholar] [CrossRef]
  26. Feng, Y.; Ning, M.; Lei, Y.; Sun, Y.; Liu, W.; Wang, J. Defending blue sky in China: Effectiveness of the “Air Pollution Prevention and Control Action Plan” on air quality improvements from 2013 to 2017. J. Environ. Manag. 2019, 252, 109603. [Google Scholar] [CrossRef] [PubMed]
  27. Zhai, S.; Jacob, D.J.; Wang, X.; Shen, L.; Li, K.; Zhang, Y.; Gui, K.; Zhao, T.; Liao, H. Fine particulate matter (PM2.5) trends in China, 2013–2018: Separating contributions from anthropogenic emissions and meteorology. Atmos. Chem. Phys. 2019, 19, 11031–11041. [Google Scholar] [CrossRef] [Green Version]
  28. Zhao, Z.; Liu, R.; Zhang, Z. Characteristics of winter haze pollution in the Fenwei plain and the possible influence of EU during 1984–2017. Earth Space Sci. 2020, 7, e2020EA001134. [Google Scholar] [CrossRef]
  29. Platt, U.; Stutz, J. Differential absorption spectroscopy. In Differential Optical Absorption Spectroscopy; Springer: Cham, Switzerland, 2008; pp. 135–174. [Google Scholar]
  30. Perner, D.; Platt, U. Absorption of light in the atmosphere by collision pairs of oxygen (O2) 2. Geophys. Res. Lett. 1980, 7, 1053–1056. [Google Scholar] [CrossRef]
  31. Wagner, T.; Dix, B.; Von Friedeburg, C.; Frieß, U.; Sanghavi, S.; Sinreich, R.; Platt, U. MAX-DOAS O4 Measurements: A New Technique to Derive Information on Atmospheric Aerosols—Principles and Information Content. Available online: https://agupubs.onlinelibrary.wiley.com/doi/abs/10.1029/2004JD004904 (accessed on 1 September 2021).
  32. Vandaele, A.C.; Hermans, C.; Simon, P.C.; Carleer, M.; Colin, R.; Fally, S.; Merienne, M.-F.; Jenouvrier, A.; Coquart, B. Measurements of the NO2 absorption cross-section from 42,000 cm−1 to 10,000 cm−1 (238–1000 nm) at 220 K and 294 K. J. Quant. Spectrosc. Radiat. Transf. 1998, 59, 171–184. [Google Scholar] [CrossRef] [Green Version]
  33. Vandaele, A.C.; Simon, P.C.; Guilmot, J.M.; Carleer, M.; Colin, R. SO2 absorption cross section measurement in the UV using a Fourier transform spectrometer. J. Geophys. Res. Atmos. 1994, 99, 25599–25605. [Google Scholar] [CrossRef]
  34. Meller, R.; Moortgat, G.K. Temperature dependence of the absorption cross sections of formaldehyde between 223 and 323 K in the wavelength range 225–375 nm. J. Geophys. Res. Atmos. 2000, 105, 7089–7101. [Google Scholar] [CrossRef]
  35. Serdyuchenko, A.; Gorshelev, V.; Weber, M.; Chehade, W.; Burrows, J. High spectral resolution ozone absorption cross-sections–Part 2: Temperature dependence. Atmos. Meas. Tech. 2014, 7, 625–636. [Google Scholar] [CrossRef] [Green Version]
  36. Thalman, R.; Volkamer, R. Temperature dependent absorption cross-sections of O2—O2 collision pairs between 340 and 630 nm and at atmospherically relevant pressure. Phys. Chem. Chem. Phys. 2013, 15, 15371–15381. [Google Scholar] [CrossRef]
  37. Fleischmann, O.C.; Hartmann, M.; Burrows, J.P.; Orphal, J. New ultraviolet absorption cross-sections of BrO at atmospheric temperatures measured by time-windowing Fourier transform spectroscopy. J. Photochem. Photobiol. A Chem. 2004, 168, 117–132. [Google Scholar] [CrossRef]
  38. Chance, K.V.; Spurr, R.J. Ring effect studies: Rayleigh scattering, including molecular parameters for rotational Raman scattering, and the Fraunhofer spectrum. Appl. Opt. 1997, 36, 5224–5230. [Google Scholar] [CrossRef] [Green Version]
  39. Chance, K.; Kurucz, R.L. An improved high-resolution solar reference spectrum for earth’s atmosphere measurements in the ultraviolet, visible, and near infrared. J. Quant. Spectrosc. Radiat. Transf. 2010, 111, 1289–1295. [Google Scholar] [CrossRef]
  40. Aliwell, S.; Van Roozendael, M.; Johnston, P.; Richter, A.; Wagner, T.; Arlander, D.; Burrows, J.; Fish, D.; Jones, R.; Tørnkvist, K.; et al. Analysis for BrO in zenith—Sky spectra: An intercomparison exercise for analysis improvement. J. Geophys. Res. Atmos. 2002, 107, ACH-10. [Google Scholar] [CrossRef]
  41. Chan, K.L.; Wiegner, M.; Wenig, M.; Pöhler, D. Observations of tropospheric aerosols and NO2 in Hong Kong over 5 years using ground based MAX-DOAS. Sci. Total Environ. 2018, 619, 1545–1556. [Google Scholar] [CrossRef] [PubMed]
  42. Chan, K.L.; Wiegner, M.; van Geffen, J.; De Smedt, I.; Alberti, C.; Cheng, Z.; Ye, S.; Wenig, M. MAX-DOAS measurements of tropospheric NO2 and HCHO in Munich and the comparison to OMI and TROPOMI satellite observations. Atmos. Meas. Tech. 2020, 13, 4499–4520. [Google Scholar] [CrossRef]
  43. Chan, K.L.; Wang, Z.; Ding, A.; Heue, K.-P.; Shen, Y.; Wang, J.; Zhang, F.; Shi, Y.; Hao, N.; Wenig, M. MAX-DOAS measurements of tropospheric NO2 and HCHO in Nanjing and a comparison to ozone monitoring instrument observations. Atmos. Chem. Phys. 2019, 19, 10051–10071. [Google Scholar] [CrossRef] [Green Version]
  44. Rodgers, C.D. Inverse Methods for Atmospheric Sounding: Theory And Practice; World Scientific: Singapore, 2000; Volume 2. [Google Scholar]
  45. Mayer, B.; Kylling, A. The libRadtran software package for radiative transfer calculations—Description and examples of use. Atmos. Chem. Phys. 2005, 5, 1855–1877. [Google Scholar] [CrossRef] [Green Version]
  46. White, W.; Anderson, J.; Blumenthal, D.; Husar, R.; Gillani, N.; Husar, J.; Wilson, W.J.S. Formation and transport of secondary air pollutants: Ozone and aerosols in the St. Louis urban plume. Science 1976, 194, 187–189. [Google Scholar] [CrossRef] [PubMed]
  47. Wu, S.; Dai, G.; Song, X.; Liu, B.; Liu, L. Observations of water vapor mixing ratio profile and flux in the Tibetan Plateau based on the lidar technique. Atmos. Meas. Tech. 2016, 9, 1399–1413. [Google Scholar] [CrossRef] [Green Version]
  48. Lv, L.; Liu, W.; Zhang, T.; Chen, Z.; Dong, Y.; Fan, G.; Xiang, Y.; Yao, Y.; Yang, N.; Chu, B.; et al. Observations of particle extinction, PM2.5 mass concentration profile and flux in north China based on mobile lidar technique. Atmos. Environ. 2017, 164, 360–369. [Google Scholar] [CrossRef]
  49. Li, X.; Xie, P.; Li, A.; Xu, J.; Ren, H.; Ren, B.; Li, Y.; Li, J. Study of aerosol characteristics and sources using MAX-DOAS measurement during haze at an urban site in the Fenwei Plain. J. Environ. Sci. 2021, 107, 1–13. [Google Scholar] [CrossRef]
  50. Zhou, M.; Liu, Y.; Wang, L.; Kuang, X.; Xu, X.; Kan, H. Particulate air pollution and mortality in a cohort of Chinese men. Environ. Pollut. 2014, 186, 1–6. [Google Scholar] [CrossRef]
  51. Gao, M.; Saide, P.E.; Xin, J.; Wang, Y.; Liu, Z.; Wang, Y.; Wang, Z.; Pagowski, M.; Guttikunda, S.K.; Carmichael, G.R. Estimates of health impacts and radiative forcing in winter haze in eastern China through constraints of surface PM2.5 predictions. Environ. Sci. Technol. 2017, 51, 2178–2185. [Google Scholar] [CrossRef]
  52. Wang, T.; Hendrick, F.; Wang, P.; Tang, G.; Clémer, K.; Yu, H.; Fayt, C.; Hermans, C.; Gielen, C.; Müller, J.-F.; et al. Evaluation of tropospheric SO2 retrieved from MAX-DOAS measurements in Xianghe, China. Atmos. Chem. Phys. 2014, 14, 11149–11164. [Google Scholar] [CrossRef] [Green Version]
  53. Otmani, A.; Benchrif, A.; Tahri, M.; Bounakhla, M.; El Bouch, M.; Krombi, M. Impact of Covid-19 lockdown on PM10, SO2 and NO2 concentrations in Salé City (Morocco). Sci. Total Environ. 2020, 735, 139541. [Google Scholar] [CrossRef]
  54. Grange, S.K.; Lewis, A.C.; Carslaw, D.C. Source apportionment advances using polar plots of bivariate correlation and regression statistics. Atmos. Environ. 2016, 145, 128–134. [Google Scholar] [CrossRef]
  55. Zhang, J.; Wang, S.; Guo, Y.; Zhang, R.; Qin, X.; Huang, K.; Wang, D.; Fu, Q.; Wang, J.; Zhou, B. Aerosol vertical profile retrieved from ground-based MAX-DOAS observation and characteristic distribution during wintertime in Shanghai, China. Atmos. Environ. 2018, 192, 193–205. [Google Scholar] [CrossRef] [Green Version]
  56. Hong, Q.; Liu, C.; Hu, Q.; Xing, C.; Tan, W.; Liu, T.; Liu, J. Vertical distributions of tropospheric SO2 based on MAX-DOAS observations: Investigating the impacts of regional transport at different heights in the boundary layer. J. Environ. Sci. 2021, 103, 119–134. [Google Scholar] [CrossRef] [PubMed]
  57. Lui, K.; Ho, S.S.H.; Louie, P.K.; Chan, C.; Lee, S.; Hu, D.; Chan, P.; Lee, J.C.W.; Ho, K. Seasonal behavior of carbonyls and source characterization of formaldehyde (HCHO) in ambient air. Atmos. Environ. 2017, 152, 51–60. [Google Scholar] [CrossRef]
  58. Zhu, L.; Jacob, D.J.; Mickley, L.J.; Marais, E.A.; Cohan, D.S.; Yoshida, Y.; Duncan, B.N.; Abad, G.G.; Chance, K.V. Anthropogenic emissions of highly reactive volatile organic compounds in eastern Texas inferred from oversampling of satellite (OMI) measurements of HCHO columns. Environ. Res. Lett. 2014, 9, 114004. [Google Scholar] [CrossRef] [Green Version]
  59. Jiang, F.; Wang, T.; Wang, T.; Xie, M.; Zhao, H. Numerical modeling of a continuous photochemical pollution episode in Hong Kong using WRF–chem. Atmos. Environ. 2008, 42, 8717–8727. [Google Scholar] [CrossRef]
  60. Huang, X.; Ding, A.; Gao, J.; Zheng, B.; Zhou, D.; Qi, X.; Tang, R.; Wang, J.; Ren, C.; Nie, W. Enhanced Secondary Pollution Offset Reduction of Primary Emissions During COVID-19 Lockdown in China. Available online: https://agupubs.onlinelibrary.wiley.com/doi/full/10.1029/2004JD004904 (accessed on 1 September 2021).
  61. Le, T.; Wang, Y.; Liu, L.; Yang, J.; Yung, Y.L.; Li, G.; Seinfeld, J.H. Unexpected air pollution with marked emission reductions during the COVID-19 outbreak in China. Science 2020, 369, 702–706. [Google Scholar] [CrossRef] [PubMed]
  62. Liu, F.; Page, A.; Strode, S.A.; Yoshida, Y.; Choi, S.; Zheng, B.; Lamsal, L.N.; Li, C.; Krotkov, N.A.; Eskes, H. Abrupt decline in tropospheric nitrogen dioxide over China after the outbreak of COVID-19. Sci. Adv. 2020, 6, eabc2992. [Google Scholar] [CrossRef]
  63. Shi, X.; Brasseur, G.P. The Response in Air Quality to the Reduction of Chinese Economic Activities during the COVID-19 Outbreak. Geophys. Res. Lett. 2020, 47, e2020GL088070. [Google Scholar] [CrossRef] [PubMed]
  64. Wang, Z.; Liu, C.; Xie, Z.; Hu, Q.; Andreae, M.O.; Dong, Y.; Zhao, C.; Liu, T.; Zhu, Y.; Liu, H.; et al. Elevated dust layers inhibit dissipation of heavy anthropogenic surface air pollution. Atmos. Chem. Phys. 2020, 20, 14917–14932. [Google Scholar] [CrossRef]
  65. Wang, Y.; Apituley, A.; Bais, A.; Beirle, S.; Benavent, N.; Borovski, A.; Bruchkouski, I.; Chan, K.L.; Donner, S.; Drosoglou, T.; et al. Inter-comparison of MAX-DOAS measurements of tropospheric HONO slant column densities and vertical profiles during the CINDI-2 campaign. Atmos. Meas. Tech. 2020, 13, 5087–5116. [Google Scholar] [CrossRef]
  66. Tirpitz, J.-L.; Frieß, U.; Hendrick, F.; Alberti, C.; Allaart, M.; Apituley, A.; Bais, A.; Beirle, S.; Berkhout, S.; Bognar, K.; et al. Intercomparison of MAX-DOAS vertical profile retrieval algorithms: Studies on field data from the CINDI-2 campaign. Atmos. Meas. Tech. 2021, 14, 1–35. [Google Scholar] [CrossRef]
  67. Kreher, K.; Roozendael, M.V.; Hendrick, F.; Apituley, A.; Dimitropoulou, E.; Frieß, U.; Richter, A.; Wagner, T.; Lampel, J.; Abuhassan, N. Intercomparison of NO2, O4, O3 and HCHO slant column measurements by MAX-DOAS and zenith-sky UV–visible spectrometers during CINDI-2. Atmos. Meas. Tech. 2020, 13, 2169–2208. [Google Scholar] [CrossRef]
  68. Barrero, M.; Orza, J.; Cabello, M.; Cantón, L. Categorisation of air quality monitoring stations by evaluation of PM10 variability. Sci. Total Environ. 2015, 524, 225–236. [Google Scholar] [CrossRef]
  69. He, J.; Gong, S.; Yu, Y.; Yu, L.; Wu, L.; Mao, H.; Song, C.; Zhao, S.; Liu, H.; Li, X.; et al. Air pollution characteristics and their relation to meteorological conditions during 2014–2015 in major Chinese cities. Environ. Pollut. 2017, 223, 484–496. [Google Scholar] [CrossRef]
  70. Song, C.; Wu, L.; Xie, Y.; He, J.; Chen, X.; Wang, T.; Lin, Y.; Jin, T.; Wang, A.; Liu, Y.; et al. Air pollution in China: Status and spatiotemporal variations. Environ. Pollut. 2017, 227, 334–347. [Google Scholar] [CrossRef] [PubMed]
  71. Lu, X.; Hong, J.; Zhang, L.; Cooper, O.R.; Schultz, M.G.; Xu, X.; Wang, T.; Gao, M.; Zhao, Y.; Zhang, Y. Severe surface ozone pollution in China: A global perspective. Environ. Sci. Technol. Lett. 2018, 5, 487–494. [Google Scholar] [CrossRef]
Figure 1. Study area topography and sampling location (red cross) (elevation data source: Jarvis A., H.I. Reuter, A. Nelson, E. Guevara, 2008, Hole-filled seamless SRTM data V4, International Centre for Tropical Agriculture (CIAT), available from https://srtm.csi.cgiar.org (accessed on 10 September 2021).
Remotesensing 13 03664 g001
Figure 2. The DOAS spectral fittings example: (a) O4, (b) NO2, (c) HCHO and (d) SO2. Red line and black line represent absorption signal and absorption of the target species, respectively.
Remotesensing 13 03664 g002
Figure 3. Daily time series of aerosol extinction, NO2, HCHO and SO2; average of observed pollutants (dots) shown for 16 January 2020 to 8 March 2020. The shaded areas mark the 25th–75th percentile range.
Remotesensing 13 03664 g003
Figure 4. Wind rose plots based on frequency of wind all day (day and night) at (a) surface, (b) 500 m and (c) 900 m altitude Notes: radial scale in the wind rose plots represents count frequency of wind direction; color represents wind speed.
Remotesensing 13 03664 g004
Figure 5. Polar plots of four kinds of pollutants during the observation period (subfigure (a) for aerosol, (b) for NO2, (c) for HCHO and (d) for SO2).
Remotesensing 13 03664 g005
Figure 6. Vertical structure of transport flux in the boundary layer for the northeast and the northwest directions, for (a) aerosol extinction, (b) NO2, (c) HCHO and (d) SO2.
Remotesensing 13 03664 g006
Figure 7. Mean wind profiles under different degrees of pollution (PM2.5 concentrations: period I (<35 ug/m3), period II (35–75 ug/m3), period III (75–115 ug/m3) and period IV (>115 ug/m3); arrows represent the average direction with respect to the north).
Remotesensing 13 03664 g007
Figure 8. Mean concentration profiles: horizontal and vertical transport flux profiles for aerosol extinction, NO2, HCHO and SO2 under different degrees of pollution (a) for concentration, (b) for horizontal transport profiles (arrows represent the average direction with respect to the north) and (c) for vertical transport flux profiles (positive means upwelling, negative means downwelling) (PM2.5 concentrations: period I (<35 ug/m3), period II (35–75 ug/m3), period III (75–115 ug/m3) and period IV (>115 ug/m3)).
Remotesensing 13 03664 g008
Figure 9. Spatial variations in pollutant profiles, transport flux profiles and wind profiles from 20 January 2020 to 29 January 2020. (a) Aerosol extinction profiles, (b) horizontal transport flux of aerosol extinction profiles, (c) horizontal wind vectors (colors represent speed and arrows represent direction with respect to the north) and (d) vertical wind vectors (positive means upwelling, negative means downwelling).
Remotesensing 13 03664 g009
Figure 10. Horizontal transport flux profiles, (a) for NO2, (b) for HCHO and (c) for SO2, in Luoyang from 20 January 2020 to 29 January 2020.
Remotesensing 13 03664 g010
Figure 11. Temporal variation of near-surface PM2.5, O3 8H (8 h moving average O3 concentrations), NO2, SO2 from CNEMC, surface temperature and RH in Luoyang from 20 January 2020 to 29 January 2020.
Remotesensing 13 03664 g011
Figure 12. Vertical transport flux structure for the (1) northeast and (2) northwest directions during lockdown and non-lockdown period for (a) aerosol extinction, (b) NO2, (c) HCHO, (d) SO2.
Remotesensing 13 03664 g012
Table 1. Summary of the DOAS analysis settings used for the O4, NO2, HCHO, SO2 dSCDs retrieval.
ParameterCross SectionSpecies
O4NO2HCHOSO2
Fitting interval (nm) 338–370338–370322.5–358307.5–330
NO2Vandaele et al. [32] 220 K, 294 K, I0-correction (SCD of 1017 molecules/cm2)✓(only 294 K)✓(only 294 K)
SO2Vandaele et al. [33], 298 K
HCHOMeller and Moortgat [34], 297 K
O3Serdyuchenko et al. [35], 223 K, 243 K, I0-correction (SCD of 1020 molecules/cm2)
O4Thalman and Volkamer [36], 293 K
BrOFleischmann et al. [37], 223 K
RingRing spectra calculated with QDOAS according to Chance and Spurr [38]
Polynomial degree Order 5Order 5Order 5Order 5
Intensity offset ConstantConstantOrder 1Order 1
Wavelength calibrationBased on a high resolution solar reference spectrum (SAO2010 solar spectra) [39]
Solar I0-correction [40].
Table 2. Parameters for the Doppler wind lidar.
Technical IndexParameters
Wavelength1.5 um
Temporal resolution1 min
Spatial resolution14 m (vertical)
Wind speed Measurement range0–75 m/s
Detection height30~3000 m
Wind speed accuracyLess than 0.1 m/s
Wind direction accuracyLess than 3°
Publisher’s Note: MDPI stays neutral with regard to jurisdictional claims in published maps and institutional affiliations.