Article

A Comparison of the Different Stages of Dust Events over Beijing in March 2021: The Effects of the Vertical Structure on Near-Surface Particle Concentration

1
State Key Laboratory of Atmospheric Boundary Layer Physics and Atmospheric Chemistry, Institute of Atmospheric Physics, Chinese Academy of Sciences, Beijing 100029, China
2
College of Earth and Planetary Sciences, University of Chinese Academy of Sciences, Beijing 100049, China
3
Center for Excellence in Regional Atmospheric Environment, Institute of Urban Environment, Chinese Academy of Sciences, Xiamen 361021, China
4
Key Laboratory of Meteorological Disaster, Nanjing University of Information Science & Technology, Nanjing 210044, China
5
Dunhuang Gobi Desert Research Station, Key Laboratory of Desert and Desertification, Northwest Institute of Eco-Environment and Resources, Chinese Academy of Sciences, Lanzhou 730000, China
6
Group of Alpine Paleoecology and Human Adaptation, State Key Laboratory of Tibetan Plateau Earth System, Resources and Environment, Institute of Tibetan Plateau Research, Chinese Academy of Sciences, Beijing 100101, China
7
State Key Laboratory of Numerical Modeling for Atmospheric Sciences and Geophysical Fluid Dynamics (LASG), Institute of Atmospheric Physics, Chinese Academy of Sciences, Beijing 100029, China
*
Author to whom correspondence should be addressed.
Remote Sens. 2021, 13(18), 3580; https://doi.org/10.3390/rs13183580
Submission received: 2 August 2021 / Revised: 1 September 2021 / Accepted: 5 September 2021 / Published: 8 September 2021
(This article belongs to the Special Issue Optical and Laser Remote Sensing of Atmospheric Composition)

Abstract

:
Mineral dust is of great importance to climate change, air quality, and human health. In this study, multisource data, including the reanalysis data and remote sensing data, were used to compare the three dust events that occurred in the March of 2021 over Beijing and reveal the effects of atmospheric vertical structure on near-surface dust concentration. The combined effect of the Mongolian cyclone and a wide persistent cold-front induced two events (E1: from March 15 to 16 and E3: from March 28 to 29). E1 was more intense, more extensive, and longer-lasting than E3 due to the combination of the stronger Mongolian cyclone, slower high/cold surface pressure, and the low-level jet. However, under the appropriate configurations of temperature and pressure fields between high and low altitudes, weak updrafts were still induced and could elevate dust up to 850 hPa, as occurred during E2 on March 22 and 23. The dust emission was inferior to E1 and E3, which contributes to the low dust concentration near the surface in E2. On the other hand, the downdraft strength directly affected both the vertical distribution of dust and the concentration of surface particles. There was a strong temporal consistency between the occurrence of the downdraft and the dust touchdown. In E1, the continuous strong downdraft caused the maximum dust concentration to be above 4000 μg/m3 at around 200 m. In contrast, the maximum height of the dust mass concentration in E3 occurred at about 800 m due to the transient downdraft, which weakened its effect on surface visibility. Besides, the weak vertical motion in E2 caused most of the dust to become suspended in the air. Overall, the large dust emission resulted from active updrafts in the source region, and the lengthy strong downdrafts led to the ultrahigh particle concentration near the surface.

1. Introduction

Mineral dust is a key component of the Earth system. By absorbing and scattering the solar and terrestrial radiation, dust aerosols alter the radiation balance and energy budget of the Earth directly, thus affecting climate change [1,2,3,4]. In turn, the lifetime and transportation of dust particles are largely controlled by climate circulation [5,6,7]. Consequently, the direct feedback between dust particles and the climate system may amplify climate change [8,9]. Additionally, dust aerosols can also interact with the climate system by acting as cloud condensation nuclei [10,11] and modifying the snow albedo once deposited on the snow [12], indirectly increasing the estimation uncertainty of radiative forcing. In fact, the net effect of the dust aerosols being cooled or heated largely depends on the vertical distribution of dust in the atmosphere [13,14,15]. Furthermore, the delivery of trace elements even makes the dust play an important role in the biogeochemical cycle and carbon cycle [16,17]. On the other hand, the dust particles greatly reduce the atmospheric visibility [18,19] and aggravate the local air pollution [20,21] when settling near the Earth’s surface. Thus, the impact of dust on human health is becoming a major public issue. Exposure to the dusty air facilitates the appearance of chronic lung disease, increases mortality from cardiovascular and respiratory diseases, and even increases the risk of pregnancy [22,23].
To date, current horizontal dust distribution can be enhanced using passive satellite remote sensing data (e.g., from MODIS and MISR). The continuous observation of dust density provided by the scientific experimental satellite FY-4A also gives an alternative approach [24]. The observation of vertical dust distribution mainly relies on space-based lidar, such as Cloud-Aerosol Lidar with Orthogonal Polarization (CALIOP) [25,26] and ground-based lidar [27,28]. Based on the active lidar, many experimental algorithms have been developed for profiling the vertical distribution of dust properties. By assuming the irregularly shaped forms of dust to be spheroidal particles, the Lidar/Radiometer Inversion Code (LIRIC) [29,30] and the Generalized Aerosol Retrieval from Radiometer and Lidar Combined Data (GARRLiC) [31] combined the AERONET retrieval products and ground-based lidar signal to capture the optical and microphysical properties of dust. However, significant uncertainties were introduced by the dust shape model [30]. The alternative approach, polarization-lidar photometer networking (POLIPHON) method, was proposed only depending on the particle depolarization, an indicator of the particle irregular shape, to separate dust from spherical aerosols [32,33]. Mamouri and Ansmann [34] developed the algorithm by an additional step for the separation of fine and coarse dust and verified the applicability of the extended POLIPHON by the sun/sky photometer.
Although there has been a marked decrease in the frequency of dust storms over the past 20 years [35,36,37], northern China has still been disturbed by dust events occasionally. The formation of dust storms requires the dynamic factors of strong winds and thermal instability and a dust source. The traditional conceptual model demonstrates the significance of vertical movement in dust storms [38,39]. In this model, dust rises to the troposphere in the source region, where a circulation field transports it before it is entrained downward into the boundary layer. Beijing, located in the north of North China Plain, lies downwind of the Taklimakan Desert and Gobi Desert, which are the two major dust source regions of East Asia [40,41,42]. Due to its subhumid warm temperate continental monsoon climate, there is little precipitation and strong wind in the early spring of Beijing. Therefore, dust storms can often impact Beijing and degrade the air quality seriously [43,44,45].
In the late March of 2021, three pure dust events of differing intensities occurred in Beijing, among which the dust storm that occurred on March 15 was the most extensive and widespread of the past decade. As mentioned above, the dust near the ground has a great impact on climate, air quality, and human health, and the vertical structure of the atmosphere is of great importance to the occurrence of dust events. Besides, the dust density is classified according to the atmospheric visibility, which is closely related to near-surface dust concentration. Therefore, in this study, multisource data, including the reanalysis data and remote sensing data, were used to compare the three dust events, in order to reveal how the vertical structure of the atmosphere affects the dust concentration near the surface. The circulation related to the three-stage evolution of a dust event is reproduced (i.e., dust emission, long-range transport, and outbreak), conducive to the analysis from each stage. Different dust profiles are also presented based on ground-based polarization lidar, which can reflect the vertical structure in different dust events directly.

2. Multisource Data

2.1. Polarization Lidar

The dust outbreak of March 2021 was monitored continuously by a dual-wavelength aerosol lidar set up on the roof of a 28 m high building in the tower of the Institute of Atmospheric Physics at the Chinese Academy of Sciences (39°58′35″N, 116°22′41″E). The system provides continuous monitoring of the atmospheric environment at 15 min intervals and a height resolution of 30 m under different weather conditions [46,47]. The detailed parameters are presented in Table 1. The dual-polarization 532 nm receiver makes the depolarization ratio possible. If the lidar ratio is given, the extinction and backscatter coefficients are obtainable with the Fernald method [48]. Considering the atmosphere during the study period was dominated by dust aerosols, we determined the lidar ratio to be a constant of 50 sr in this paper, which is the typical value for the lidar ratio of dust, not only from Asia but also from the Sahara Desert [49,50]. Before the retrievals, the raw lidar signal was corrected by background subtraction, geometrical factor correction, and range square correction. The Rayleigh signal profile in the middle to upper troposphere, obtained from the U.S. Standard Atmosphere model, was used to calibrate the measured 532 nm signal. Besides, we focused on the lidar signal above 150 m in order to avoid the effect of incomplete overlap in our study.
Particle depolarization ratios of 0.3–0.35 have often been observed in field experiments involving dust from East Asia [51,52] and other regions [53,54], although the value of anthropogenic aerosols is lower at less than 0.1–0.2 [49,55]. Due to the considerable difference between dust and spherical aerosols in the particle depolarization ratio, the available depolarization ratio at 532 nm of the polarization lidar facilitates the quantification of dust profiles, which is also the principle of POLIPHON. The details about one-step POLIPHON are described by Mamouri and Ansmann [34]. In this paper, the thresholds of dust and spherical aerosols are 0.35 and 0.05, respectively, according to the characteristic of Asian dust over Beijing [56].

2.2. Reanalysis Datasets

The large-scale circulation data from the European Centre for Medium-Range Weather Forecast (ECMWF) Reanalysis v5 (ERA5) were used to study regional atmospheric circulations during the dust events. This study combined the pressure field at sea level and the geopotential height field at 500 hPa to describe the horizontal circulation. It used divergence and vertical velocity data at 27 levels from 1000–100 hPa for the vertical condition. The ERA5 reanalysis data, with an hourly temporal resolution and a spatial resolution of 0.25° × 0.25°, are available from the Copernicus Climate Change Service climate data store (https://cds.climate.copernicus.eu, accessed on 20 April 2021).

2.3. Trajectory Model

The Hybrid Single-Particle Lagrangian Integrated Trajectory Model (HYSPLIT) (available online at https://www.ready.noaa.gov/index.php, accessed on 18 April 2021) is a comprehensive modeling system for calculating and analyzing the transport and diffusion trajectories of air pollutants. The model was operated using meteorological data from the Global Data Assimilation System. In this study, the dust source region and transport path were tracked using the HYSPLIT model.

2.4. FY-4A Satellite

The full disk data of the dust detection (DSD) level-2 product used in this paper was provided by the FY-4A satellite from the China National Meteorological Satellite Center (http://www.nsmc.org.cn, accessed on 25 May 2021). It characterizes dust density at spatial and temporal resolutions of 4 km and 1 h. The quality control of dust intensity (IDDI-BK) was conducted using the dust fraction (DST). Only the IDDI-BK data with a DST value higher than 10 were valid [57].

2.5. Pollutant Data

Nationwide hourly surface particulate matter (PM10) data were provided by the China National Environmental Monitoring Center (http://www.cnemc.cn/, accessed on 12 April 2021). The Beijing Municipal Ecological and Environmental Monitoring Center (http://www.bjmemc.com.cn/, accessed on 12 April 2021) provided hourly PM2.5 and PM10 air quality data from its observation site in Beijing (39°48′N, 116°28′E).

3. Results and Discussion

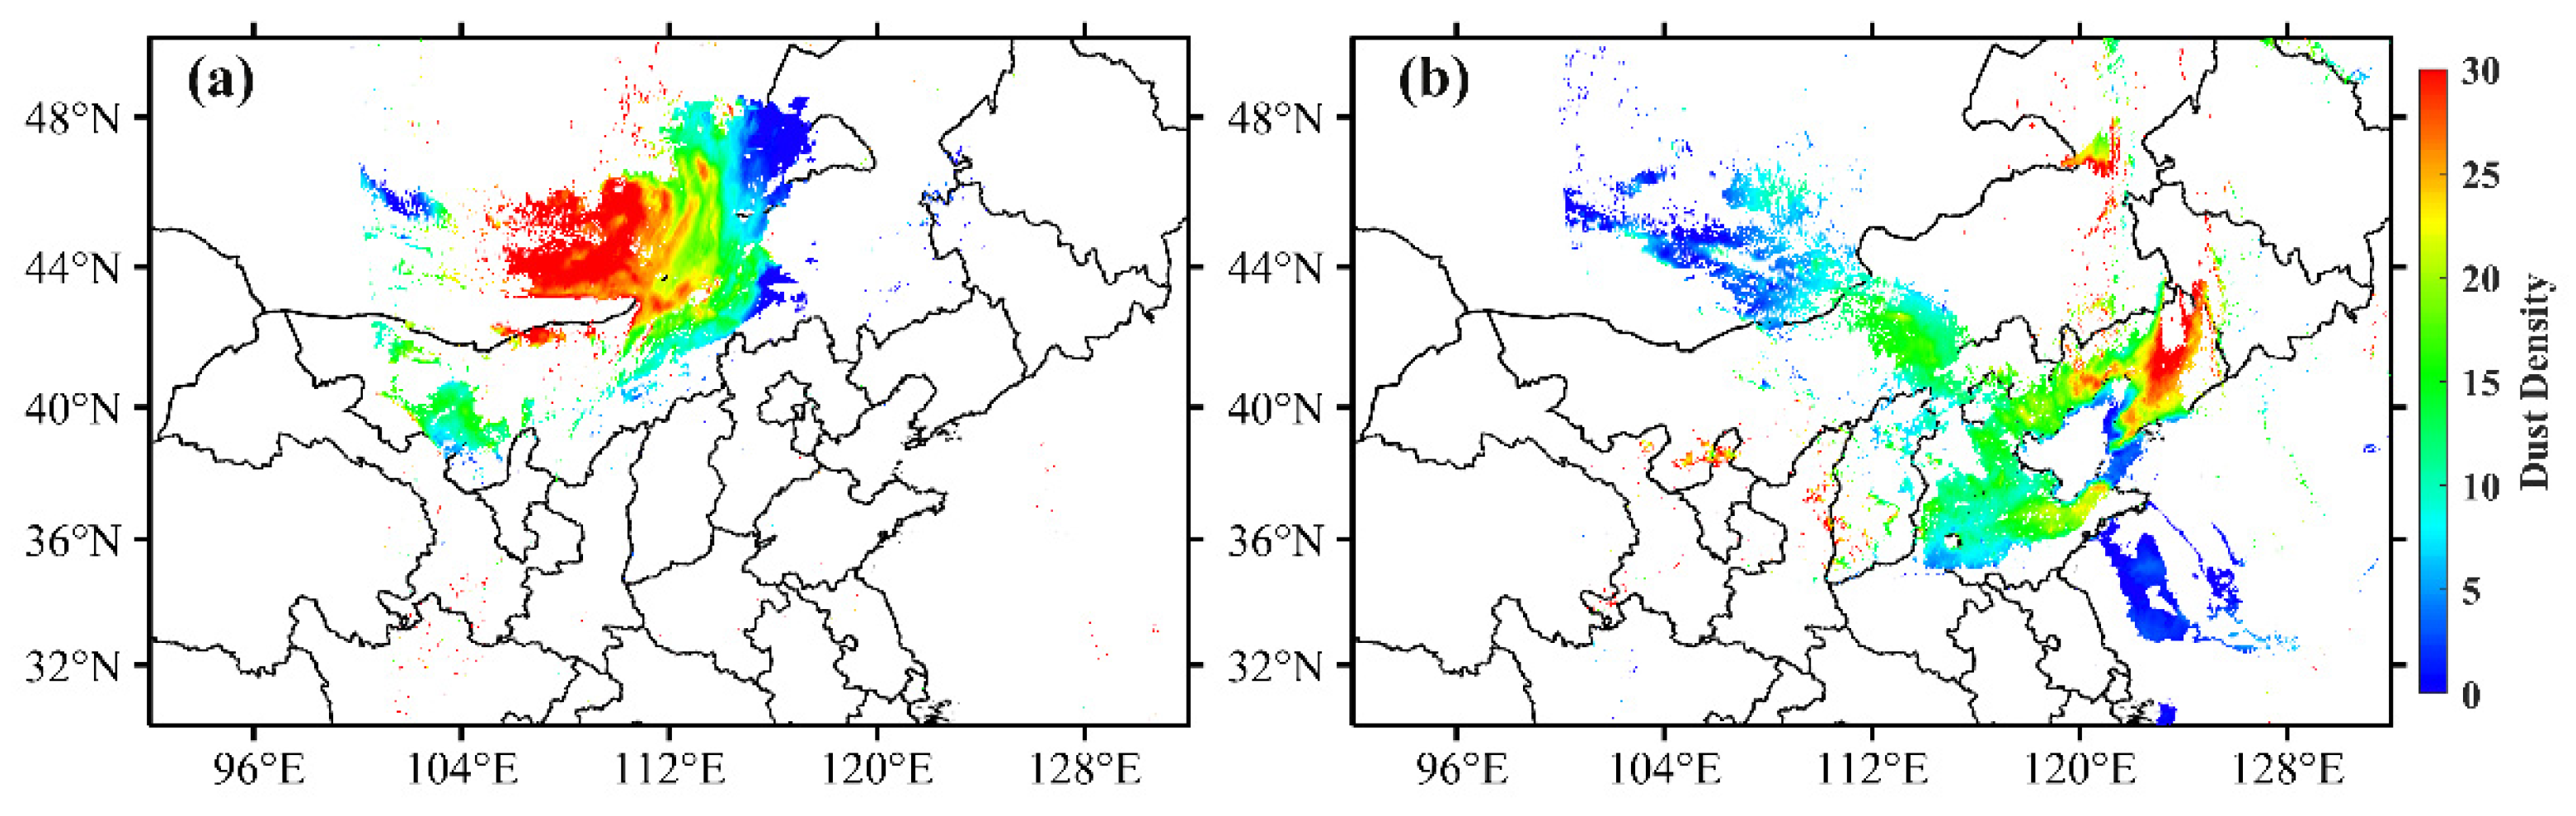
3.1. Overview of Dust Events

In March of 2021, three dust events of differing intensities were captured. Figure 1a–c shows the coverage of influence by the dust events. The dust storm on March 15 mainly affected northern China and also impacted the central and eastern cities in the provinces of Henan and Shandong. The weak-intensity dust event on March 22 only involved the Beijing–Tianjin–Hebei region. As shown in Figure 1c, the area affected by the dust on March 28 was less extensive than that on March 15, but the impact of the dust was still significant. An overview of the surface pollutants over Beijing is presented in Figure 1d, as the city was affected continuously by dust. Two strong dust storms are evident (E1: from March 15 to 16 and E3: from March 28 to 29), along with a minor floating dust event (E2: from March 22 to 23). The events were characterized by a ratio of PM2.5 to PM10 being less than 0.25. Statistically, E1 was the largest and most widespread dust storm over the past decade, which lasted for over 12 h in Beijing with the maximum hourly PM10 of 8916 μg/m3. Both E1 and E3 were followed by a decreasing–increasing trend, which indicated the clean-up and backflow stages. Subsequently, the increasing ratio of PM2.5 to PM10 signaled the end of the dust event and the dominance of PM2.5. During E2 (the floating dust event), the PM10 concentration remained close to 300 μg/m3.
According to the traditional conceptual model, a complete dust process in a non-dust-source region is divisible into three distinct stages: dust emission, long-range transport, and outbreak. The following sections present a detailed comparative analysis of the three dust events in horizontal and vertical directions based on multisource data. This plane-to-point analysis reveals the effects of vertical dust distribution on near-surface particle concentration.

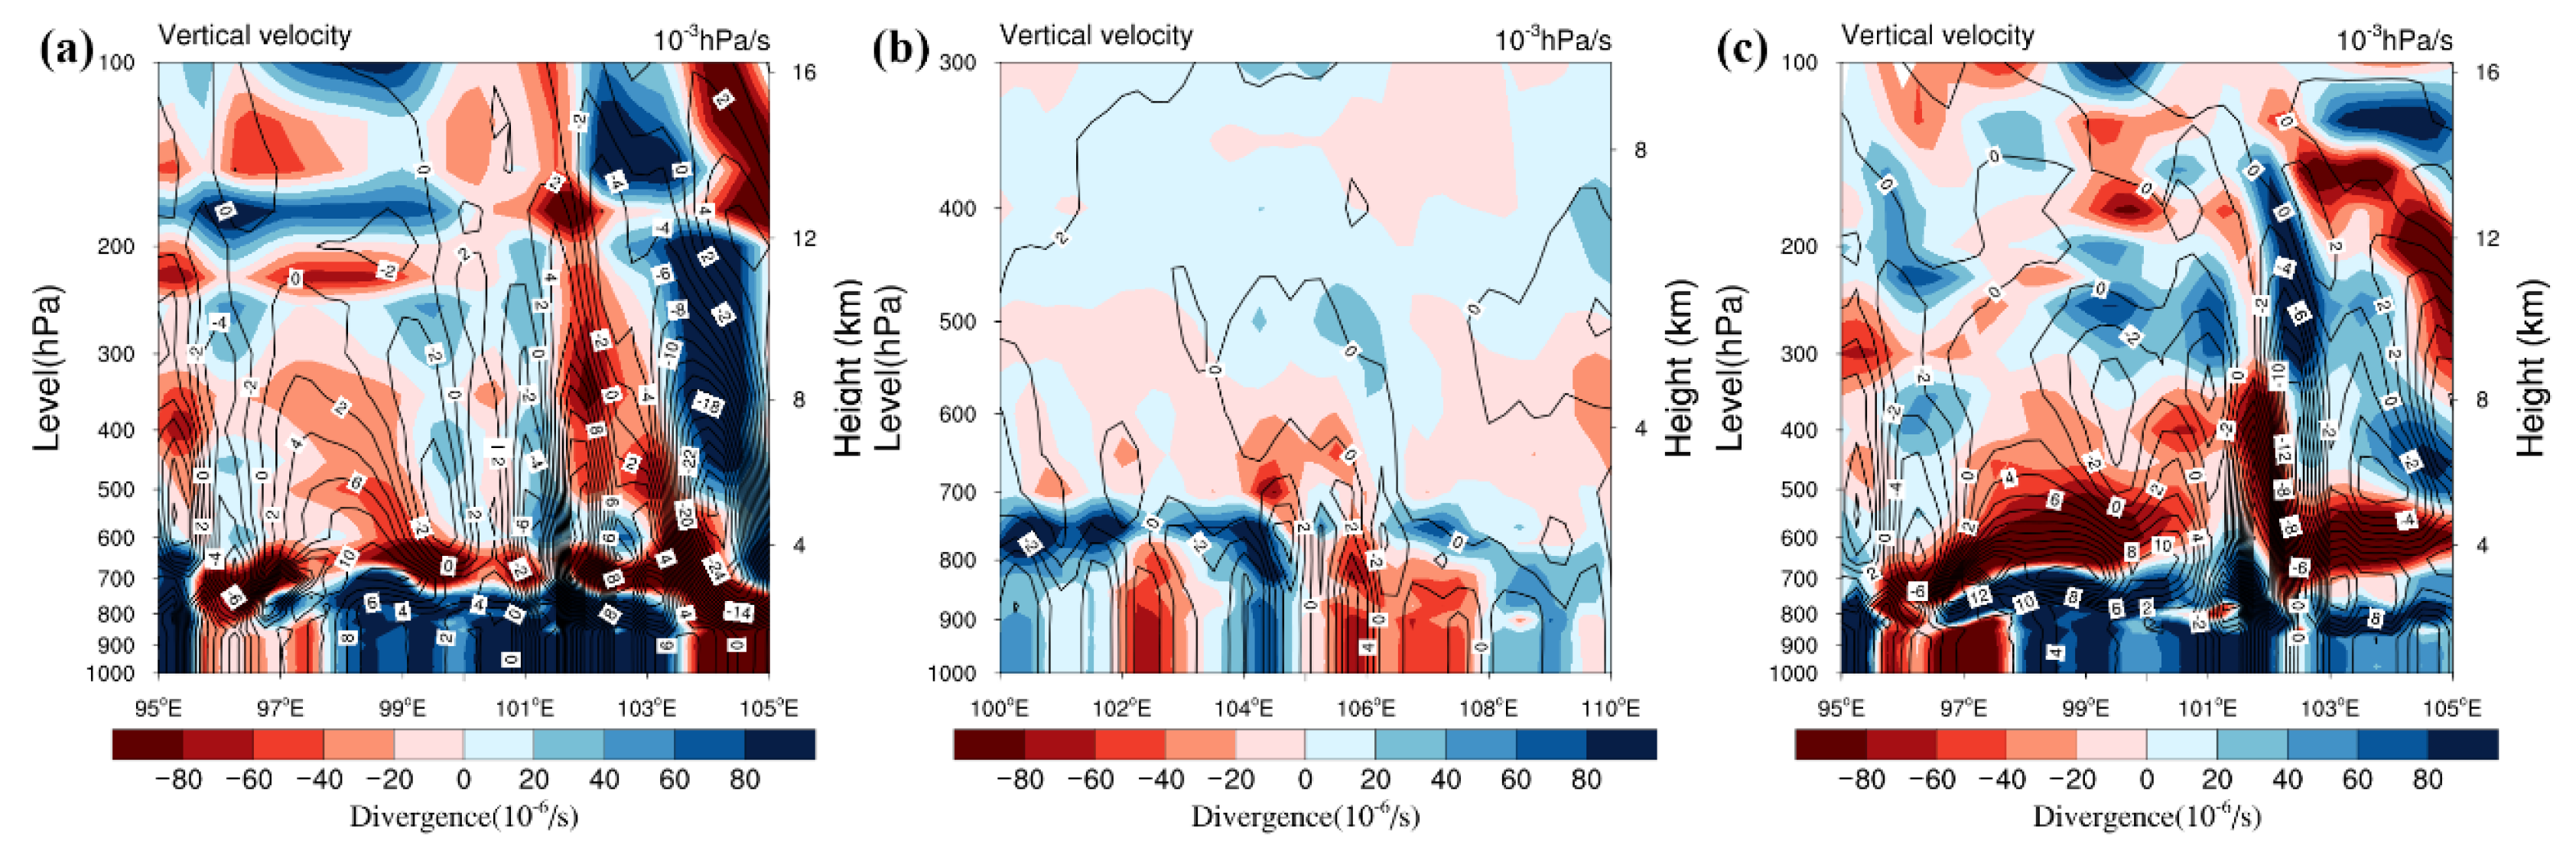
3.2. Dust Emission Stage

The two major systems that influence dust events in northern China are the Mongolian cyclone and cold fronts [58]. Figure 2 clearly shows that the Mongolian cyclone was located in Mongolia at 500 hPa on March 14 (E1) and March 27 (E3), although the cyclone’s central intensity and influence were stronger in E1. In the outer area of the cyclone, the wind speed reached 40 m/s, while a straight westerly flow dominated most of northern China. Figure 3a shows that these conditions corresponded well to the dust density distribution on March 27, and there was good consistency between the center of the cyclone and the dust intensity. At sea level, the low-pressure center occurred near northeast China on March 14 and 27, where there was a cold front. The dense isobars and the large pressure gradient before and after the cold front produced gale conditions. According to Lei and Wang [59], cold-front-induced dust storms are characterized by rapid and strong dust emissions. Conducive to dust emission was the confluence of warm and cold air, which rendered the lower atmosphere unstable. However, in the E3 event, the temperature difference between the cold and warm air was less significant than in E1. According to Table 2, which quantitatively gives the maximum wind speed of the dust emission stage, the smaller maximum horizontal wind speed in E3 was reasonable. Besides, as shown in Figure 2b, E2 had no typical synoptic system of dust emission unlike the strong dust storms. However, the configuration of the temperature and pressure fields between the high and low air still made the horizontal wind speed as high as 30.5 m/s in the emission stage of E2.
Generally, vertical motions are closely related to the amount of dust in the source region. Figure 4 presents the typical distribution of the zonal divergence and vertical velocity profiles in the three dust events. The clear trend of divergence–convergence–divergence from the ground to the upper air with the convergence center uplifting in the longitudinal direction is evident in Figure 4a,c. This pattern was beneficial to the formation of alternating downdrafts and updrafts, which resulted in multiple secondary circulations that further accelerated the formation of the surface gale. However, there was still some difference between the two events. As shown in Table 2, the maximum value of vertical wind speed in E1 was above 50 × 10−3 hPa/s, greater than E3. Furthermore, near the surface at 45°N, the strong convergence lasted longer in E1. Therefore, a larger amount of dust emission in E1 was predictable. Additionally, there was a much less intense momentum exchange in the vertical direction of E2, and the updraft extended only to about 800 hPa. Consequently, the stronger the updraft, the more dust particles can be carried into the atmosphere and transported downwind, which indicates the significant influence of the vertical dynamic condition in the dust source on the near-surface dust concentration downwind.

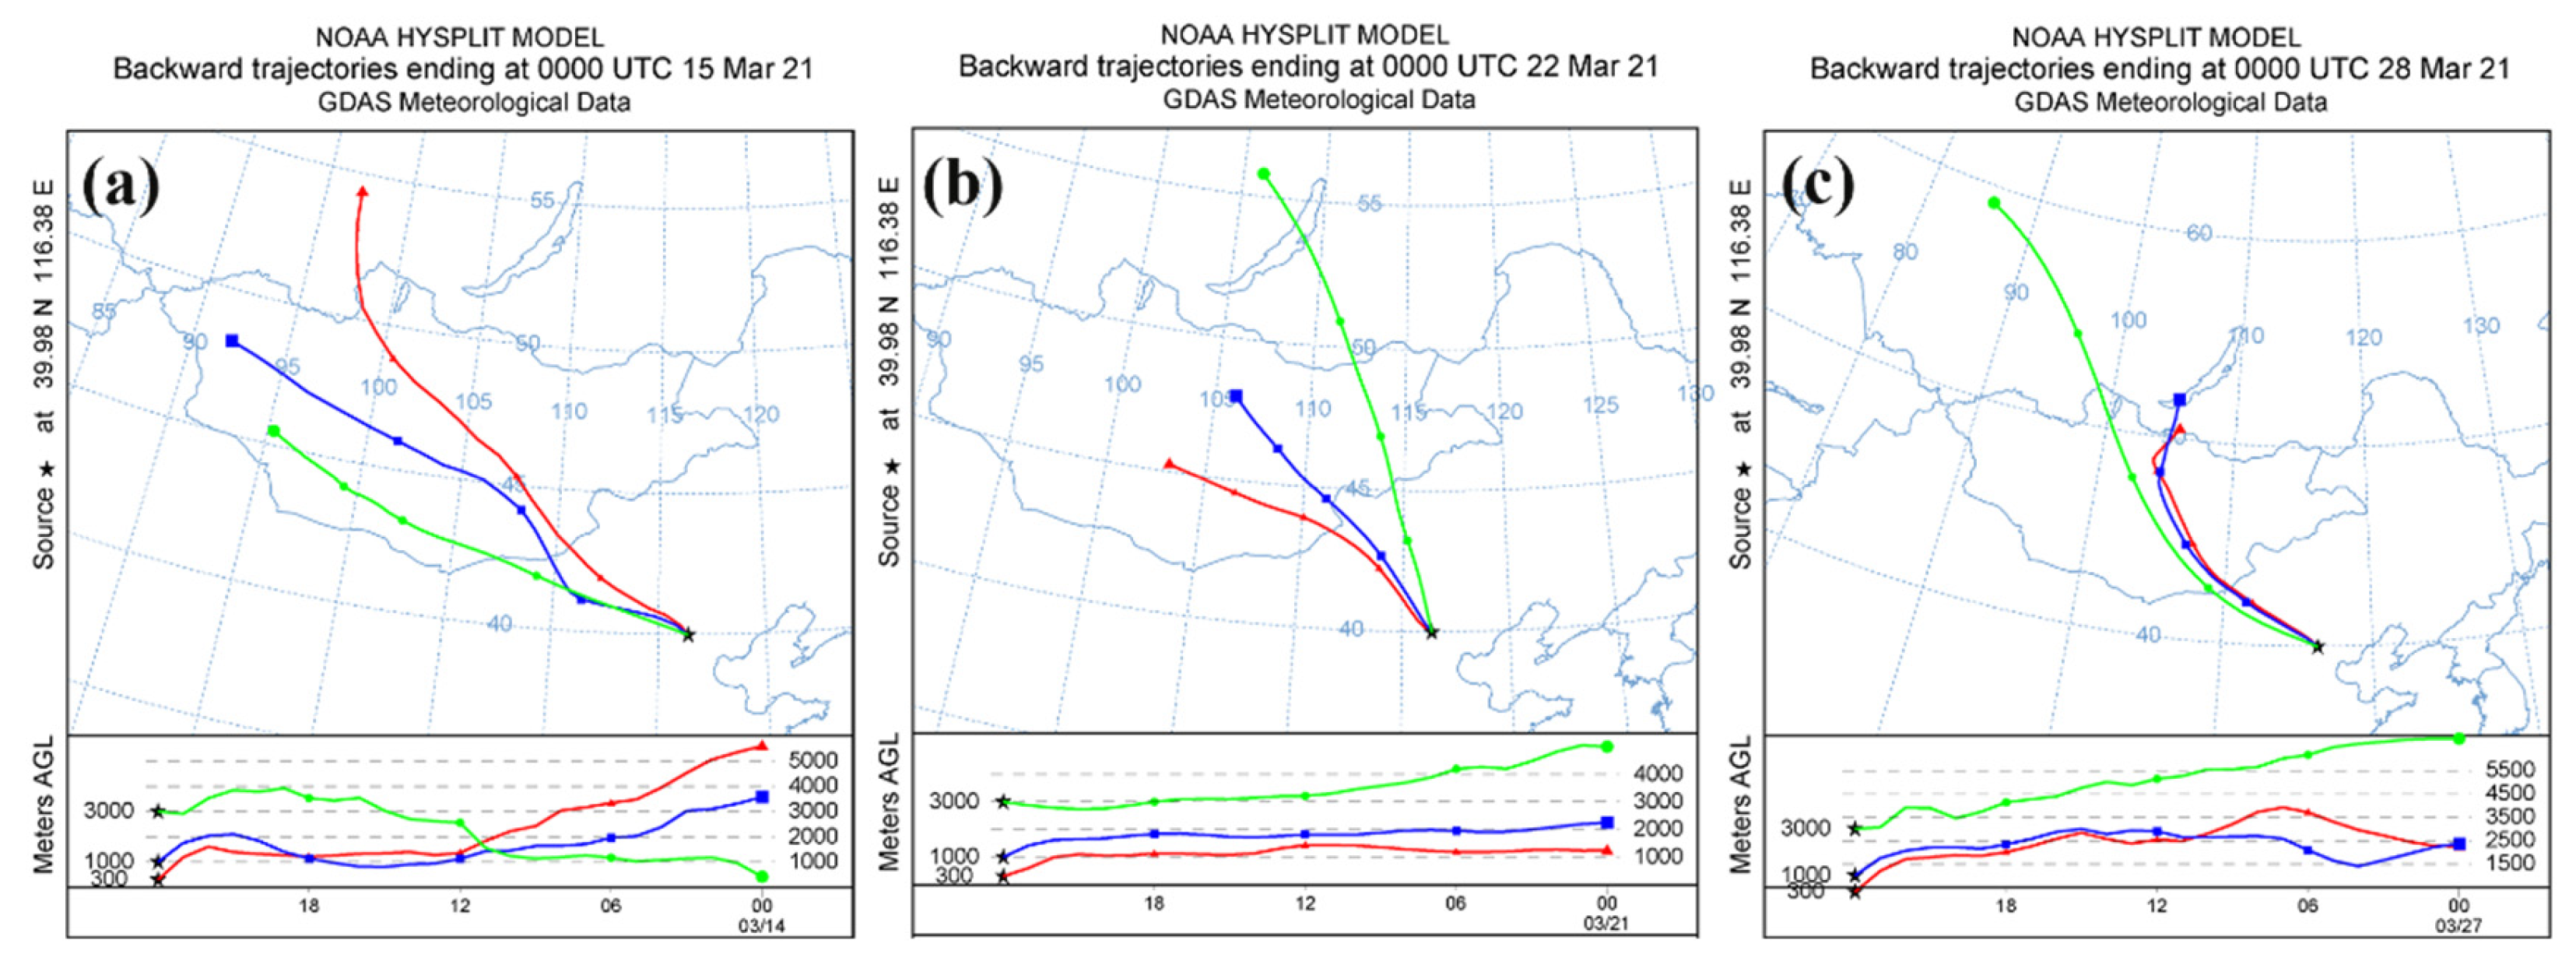
3.3. Long-Range Transport Stage

According to the 24 h backward trajectories in Figure 5, all three dust events originated in Mongolia at different altitudes and passed over the Gobi Desert, which corresponds to the dust product of the FY-4A satellite (Figure 3b). Over time, the center of the dust intensity moved in a southeasterly trajectory. Additionally, the trace data from different altitudes indicated that horizontal advection was the main transport mechanism for the dust in E2, and little vertical exchange occurred. However, the vertical movement was essential for the development of this dust event. As described in Section 3.2, the updraft in both E1 and E3 could reach 500 hPa, whereas it could only reach 850 hPa in E2. Figure 6 illustrates the distribution of geopotential height (500 hPa on March 15 and 28 and 850 hPa on March 21), indicating dust pathways. During E1 and E3, a strong northwesterly airflow dominated the Beijing–Tianjin–Hebei region; here, the center of the Mongolian cyclone at 500 hPa moved toward northeast China, and the denser isobars at 500 hPa in E1 were conducive to the long-range dust transportation. However, limited by the weak vertical movement of the system, the dust was only carried to 850 hPa, where the 850 hPa northwesterly wind transported it in E2.

3.4. Dust Outbreak Stage

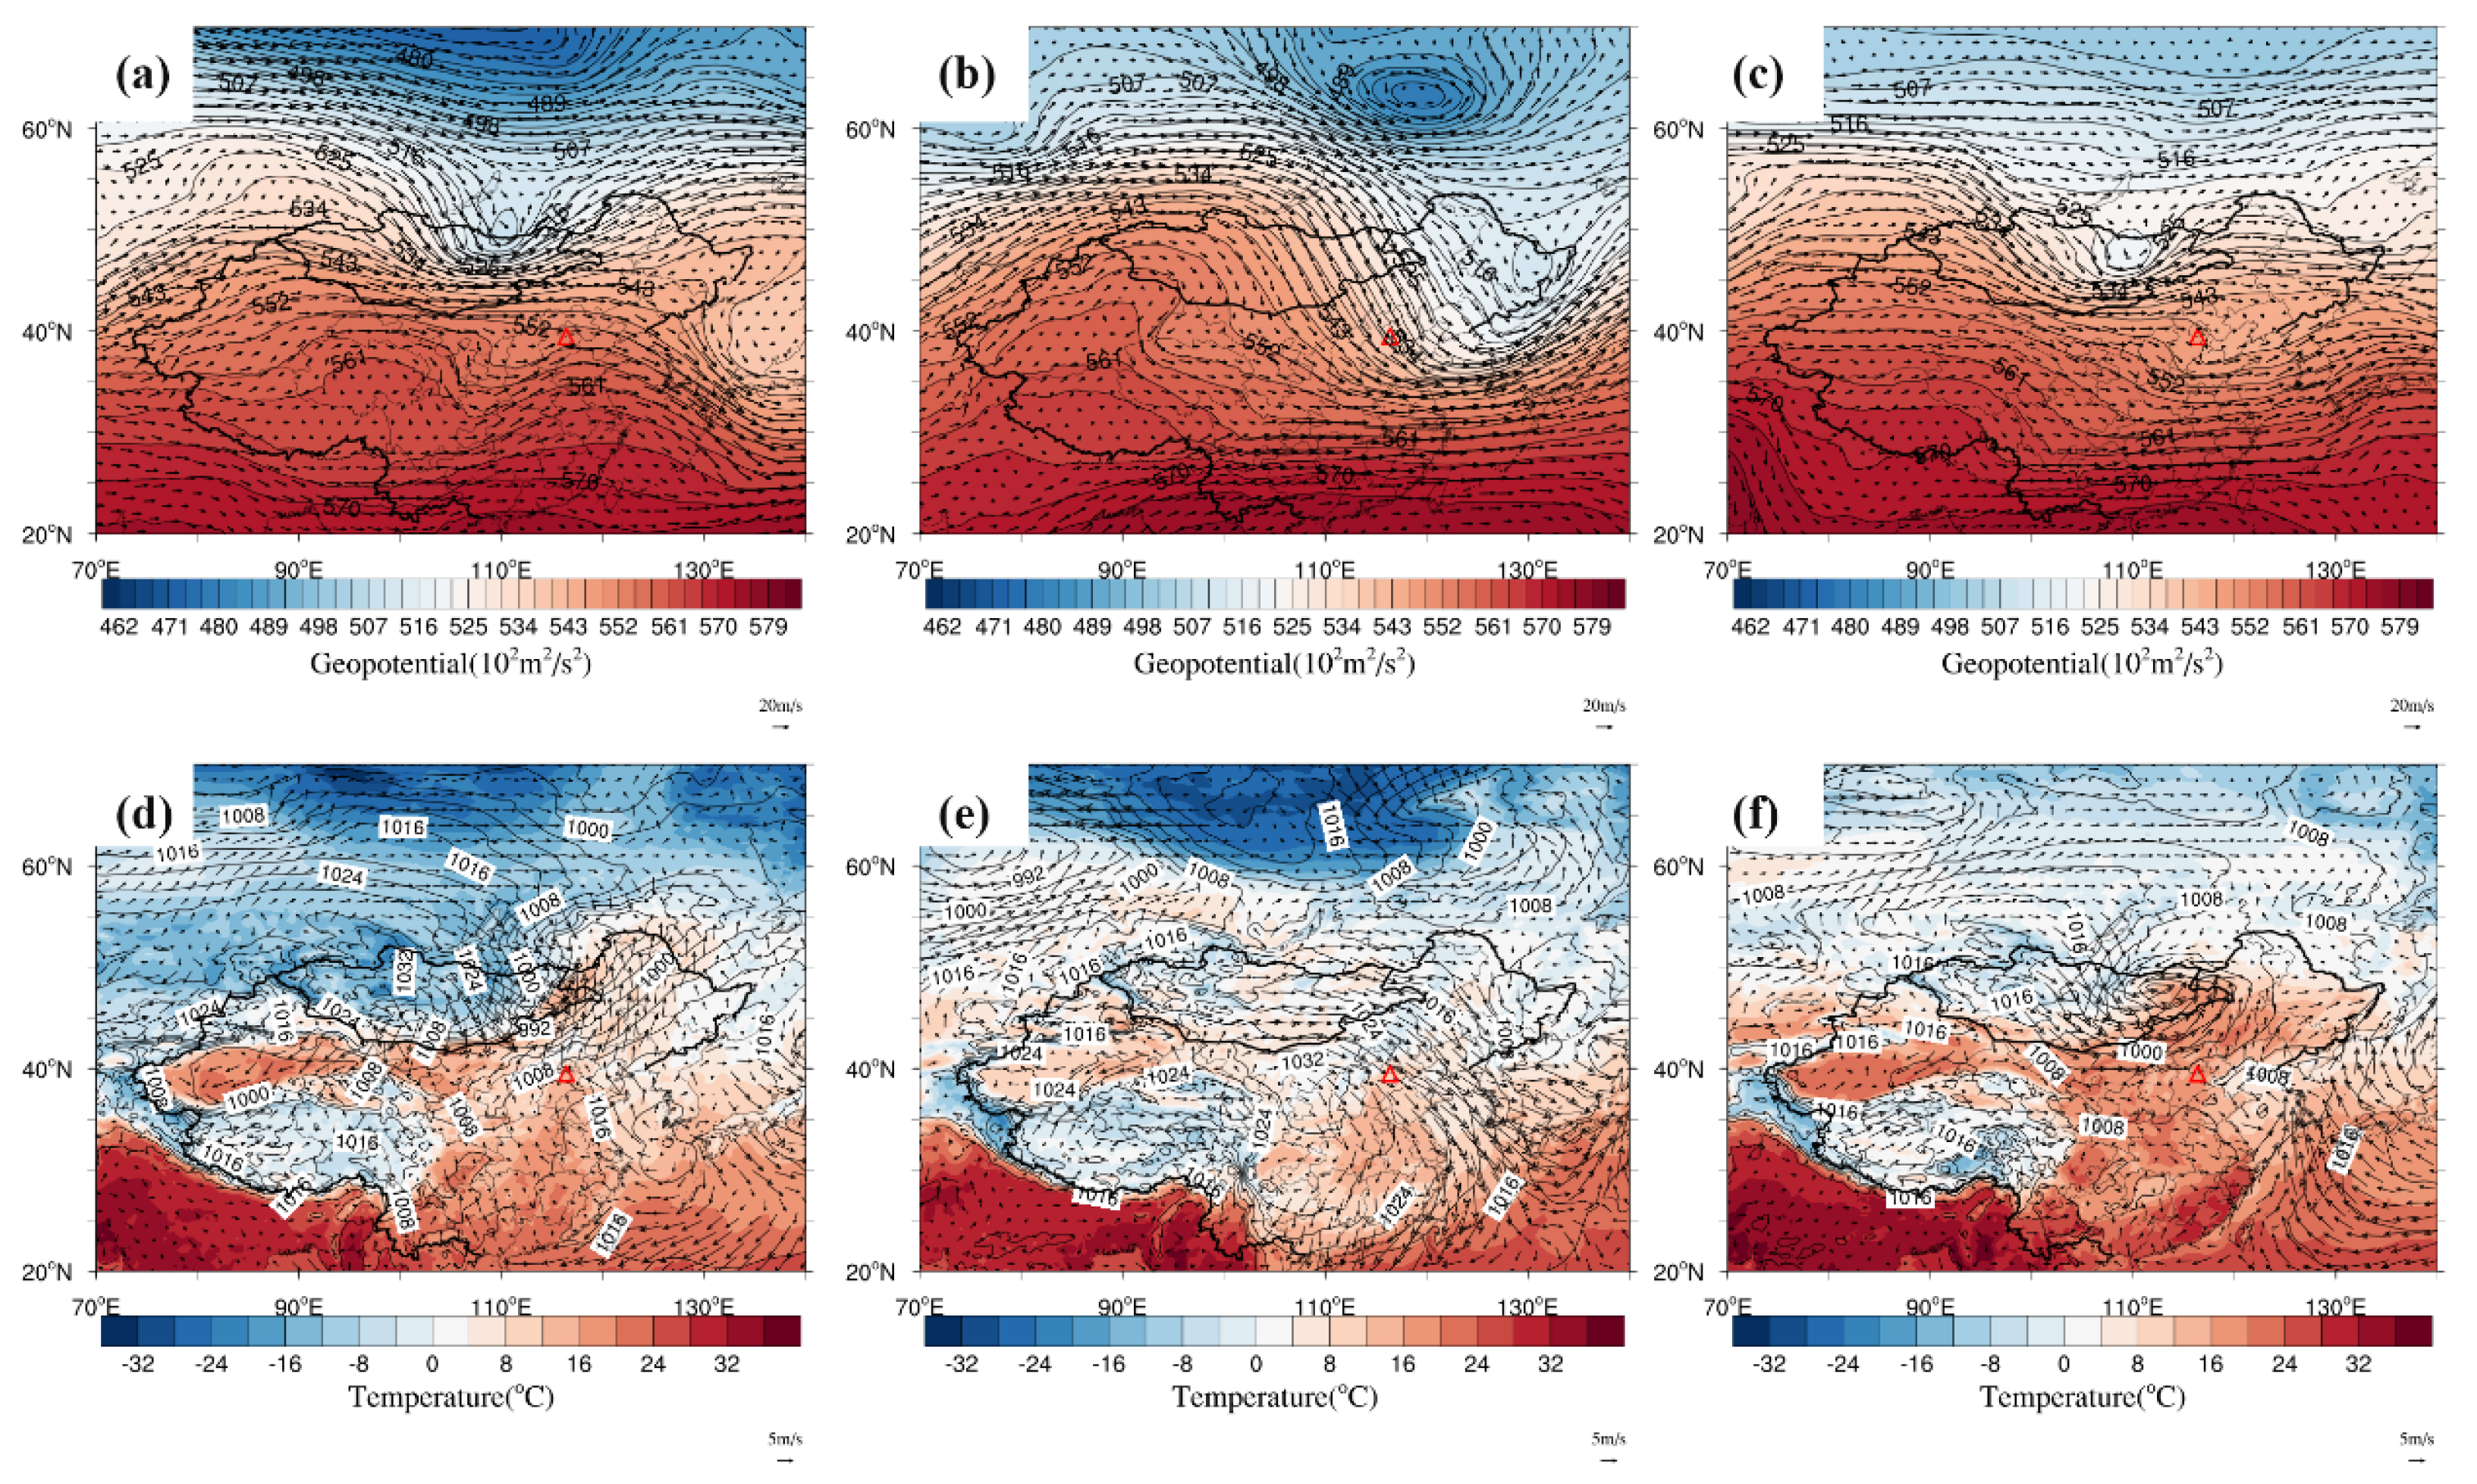
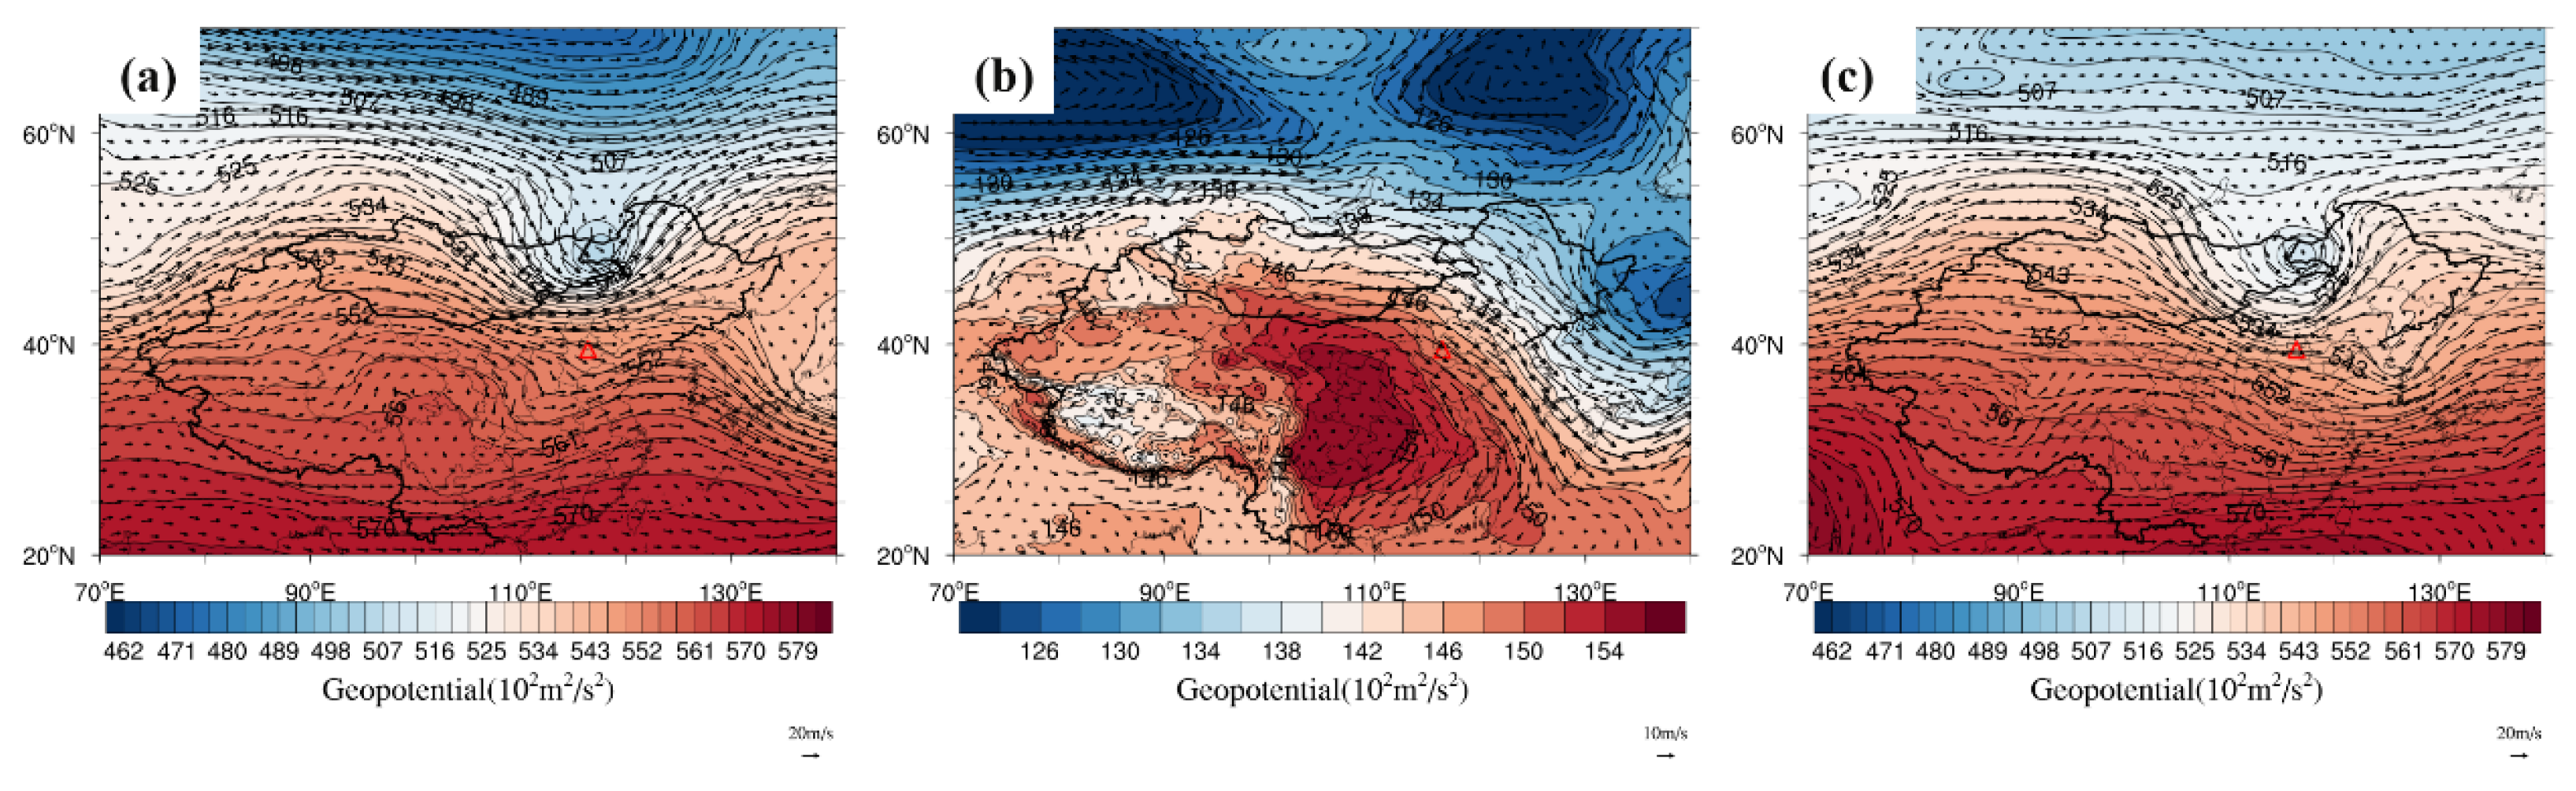
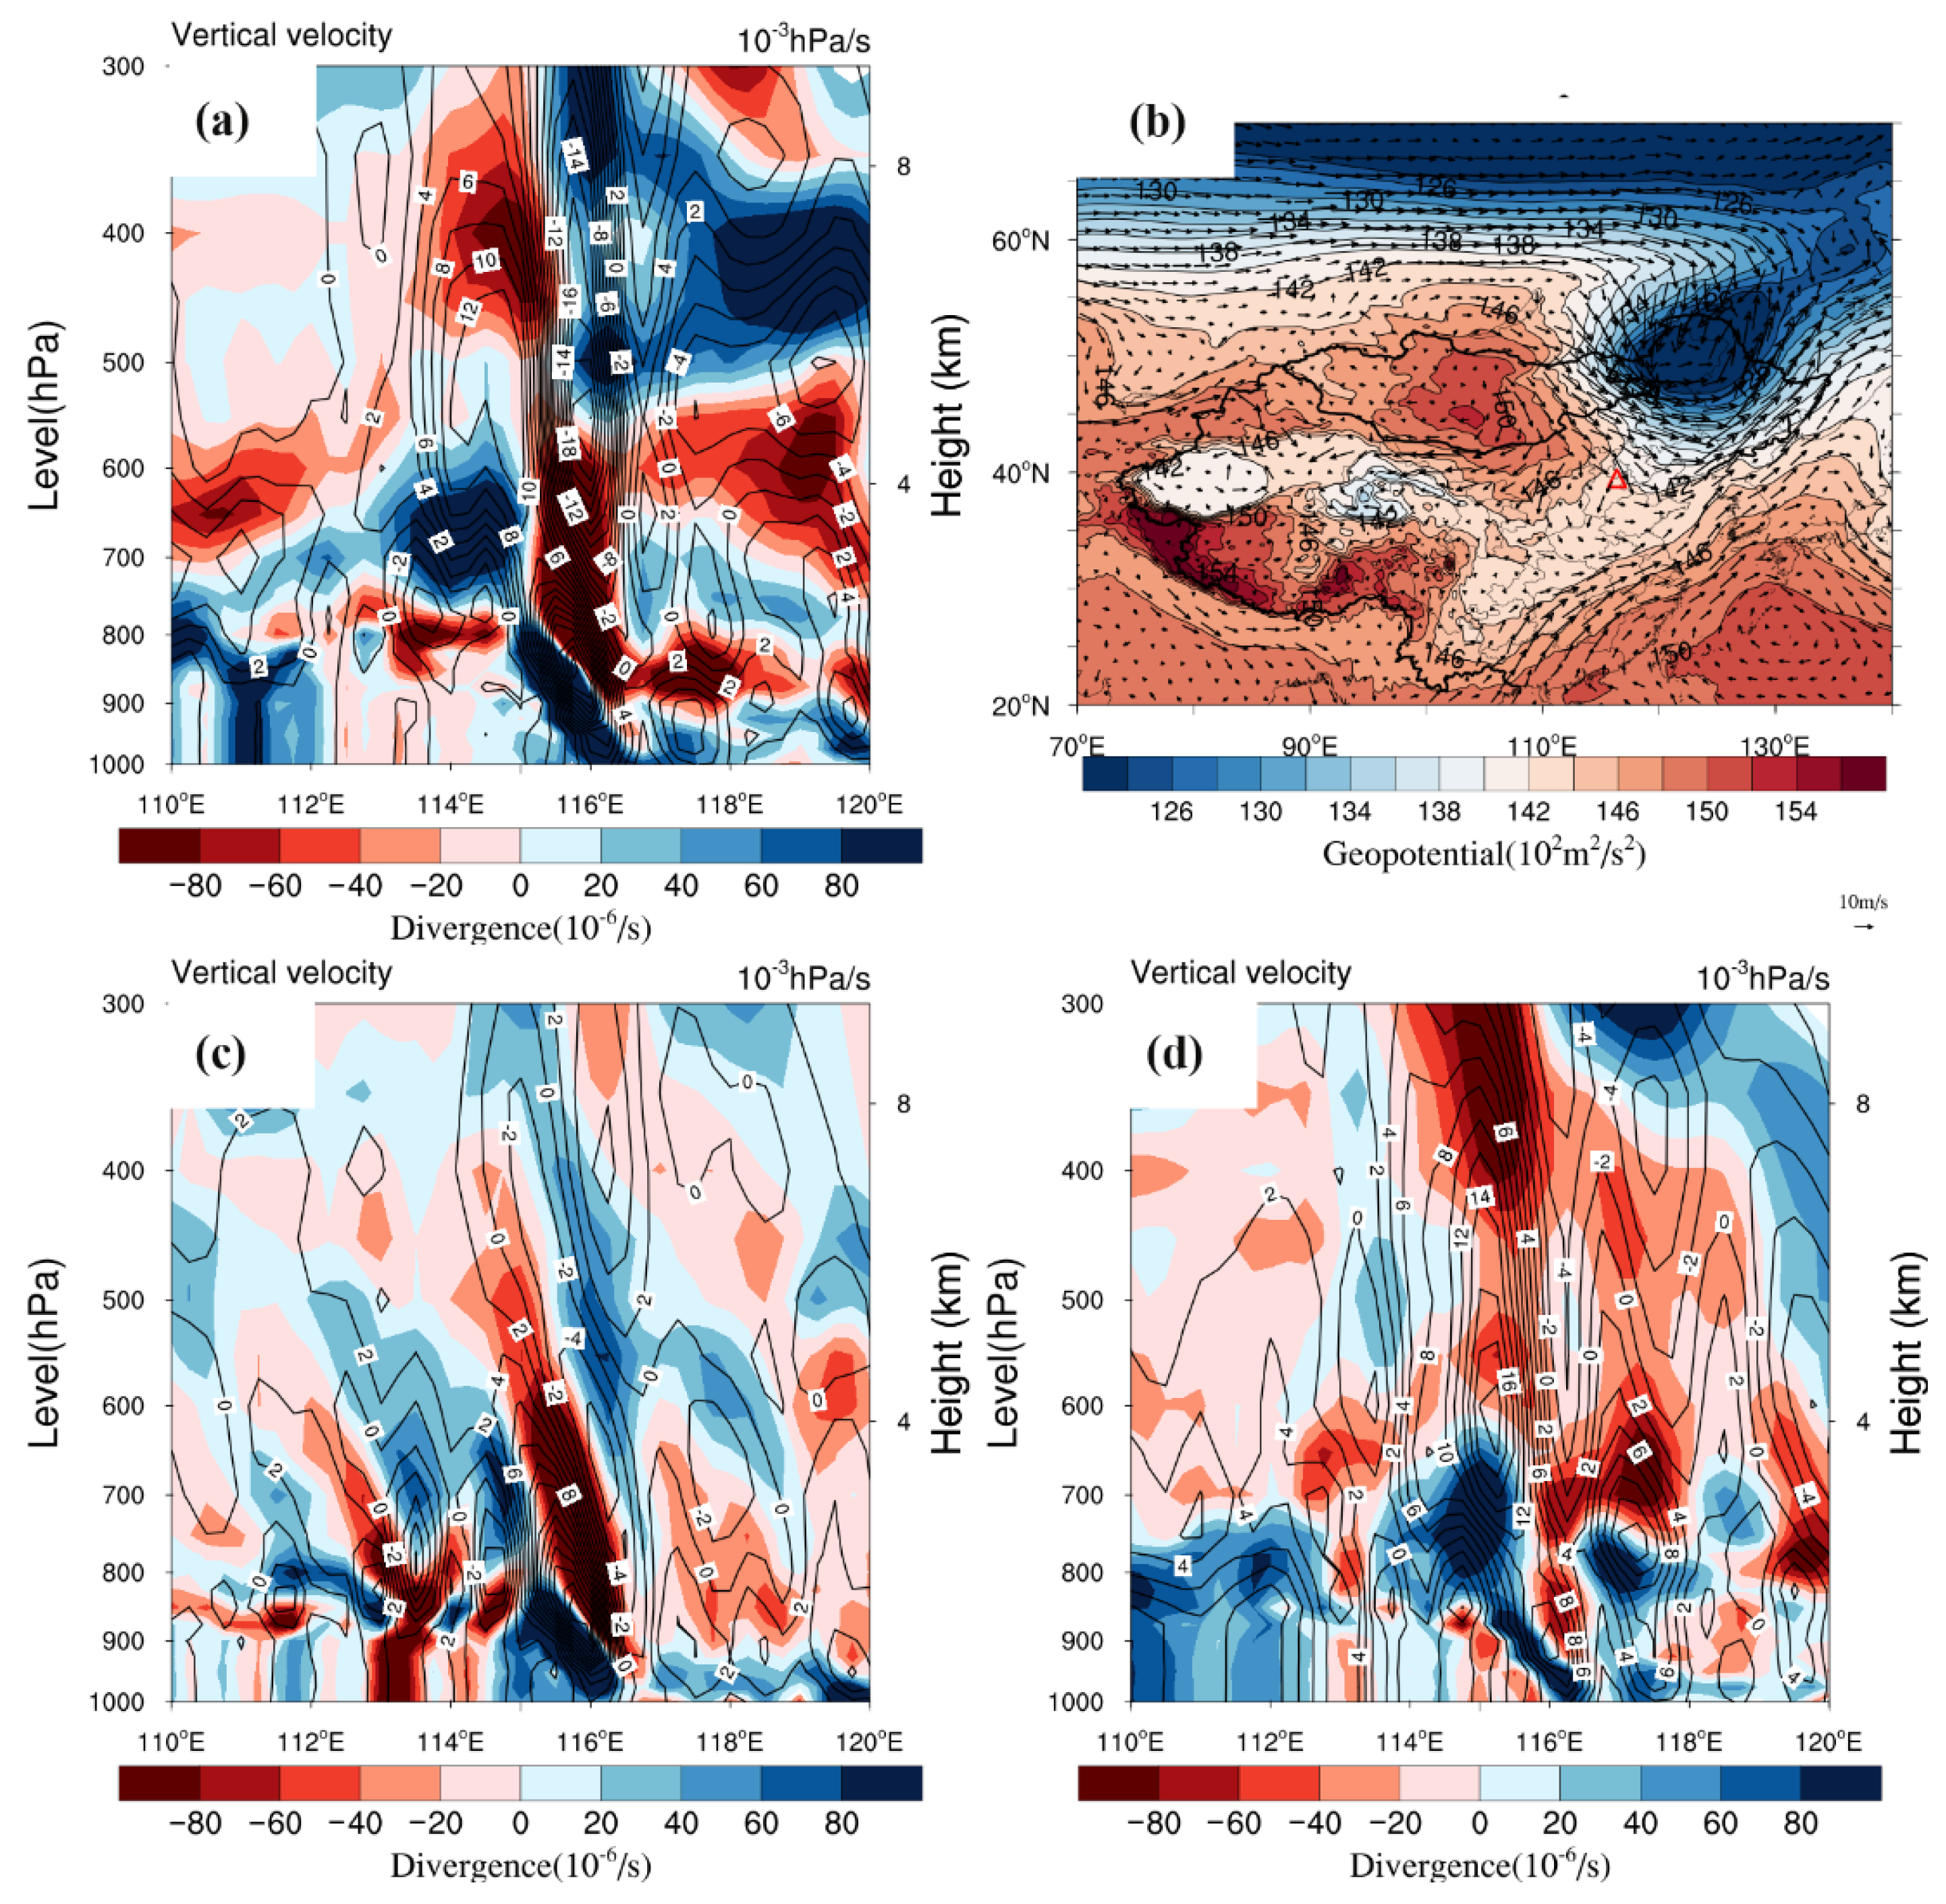
3.4.1. Regional Circulation Situation

Under the domination of the downdraft, the dust transported to northern China was entrained to the lower atmosphere. Figure 7 presents the typical downdraft situation of the dust events. It can be seen clearly that there was a strong downdraft center over 40°N, 116°E. As Figure 7a shows, at 10:00 (LT) on March 15, when the surface PM10 concentration peaked, the downdraft peaked at 28 × 10−3 hPa/s at 850 hPa in E1. This was consistent with the presence of the low-level jet at 850 hPa (Figure 7b). The positive shear vorticity region in the left front of the low-level jet was conducive to convective activities [60]. The strong downdraft, with the maximum of 28.4 × 10⁻³ hPa/s and the long duration reaching 16 h (Table 2), in E1 was attributable to the divergence–convergence–divergence trend in the vertical direction. Under such conditions, the stability of the atmospheric state promoted the endurance of the dust storm. In contrast, Figure 7d shows the vertical situation at 12:00 (LT) on March 28, when the surface PM10 concentration comes to a peak. The maximum downward speed was only 14 × 10−3 hPa/s, and the strong downdraft only lasted for 6 h. The shallower and moderate downdraft in E2, which is obvious in Figure 7c, prevented the complete delivery of the transported dust to the surface.
The moving speed of the synoptic systems, i.e., Mongolian cyclone and high/cold surface pressure, determined the duration of the dust outbreak, which corresponds with the conclusion of Lei and Wang [59] that dust storms triggered by the Mongolian cyclone last the longest. In both E1 and E3, the Mongolian cyclone persisted over northeast China for over 24 h, leading to the continuous control of the northwesterly airflow in the Beijing–Tianjin–Hebei region (Figures S2 and S3). Under such conditions, the larger amount of dust from Mongolia, as discussed in Section 3.2, promoted the continuation of E1. However, the strong wind was also instrumental in dust removal, resulting in rapid decreases in near-surface PM10 concentration (as in E3). Due to the weaker suppression of the Mongolian cyclone in E3, as shown in Figure S3, the cold air circulated by the high/cold surface pressure reached northern China earlier. Conversely, the slower movement of the stronger Mongolian cyclone in E1 hindered the movement of the high/cold surface pressure to a certain extent.

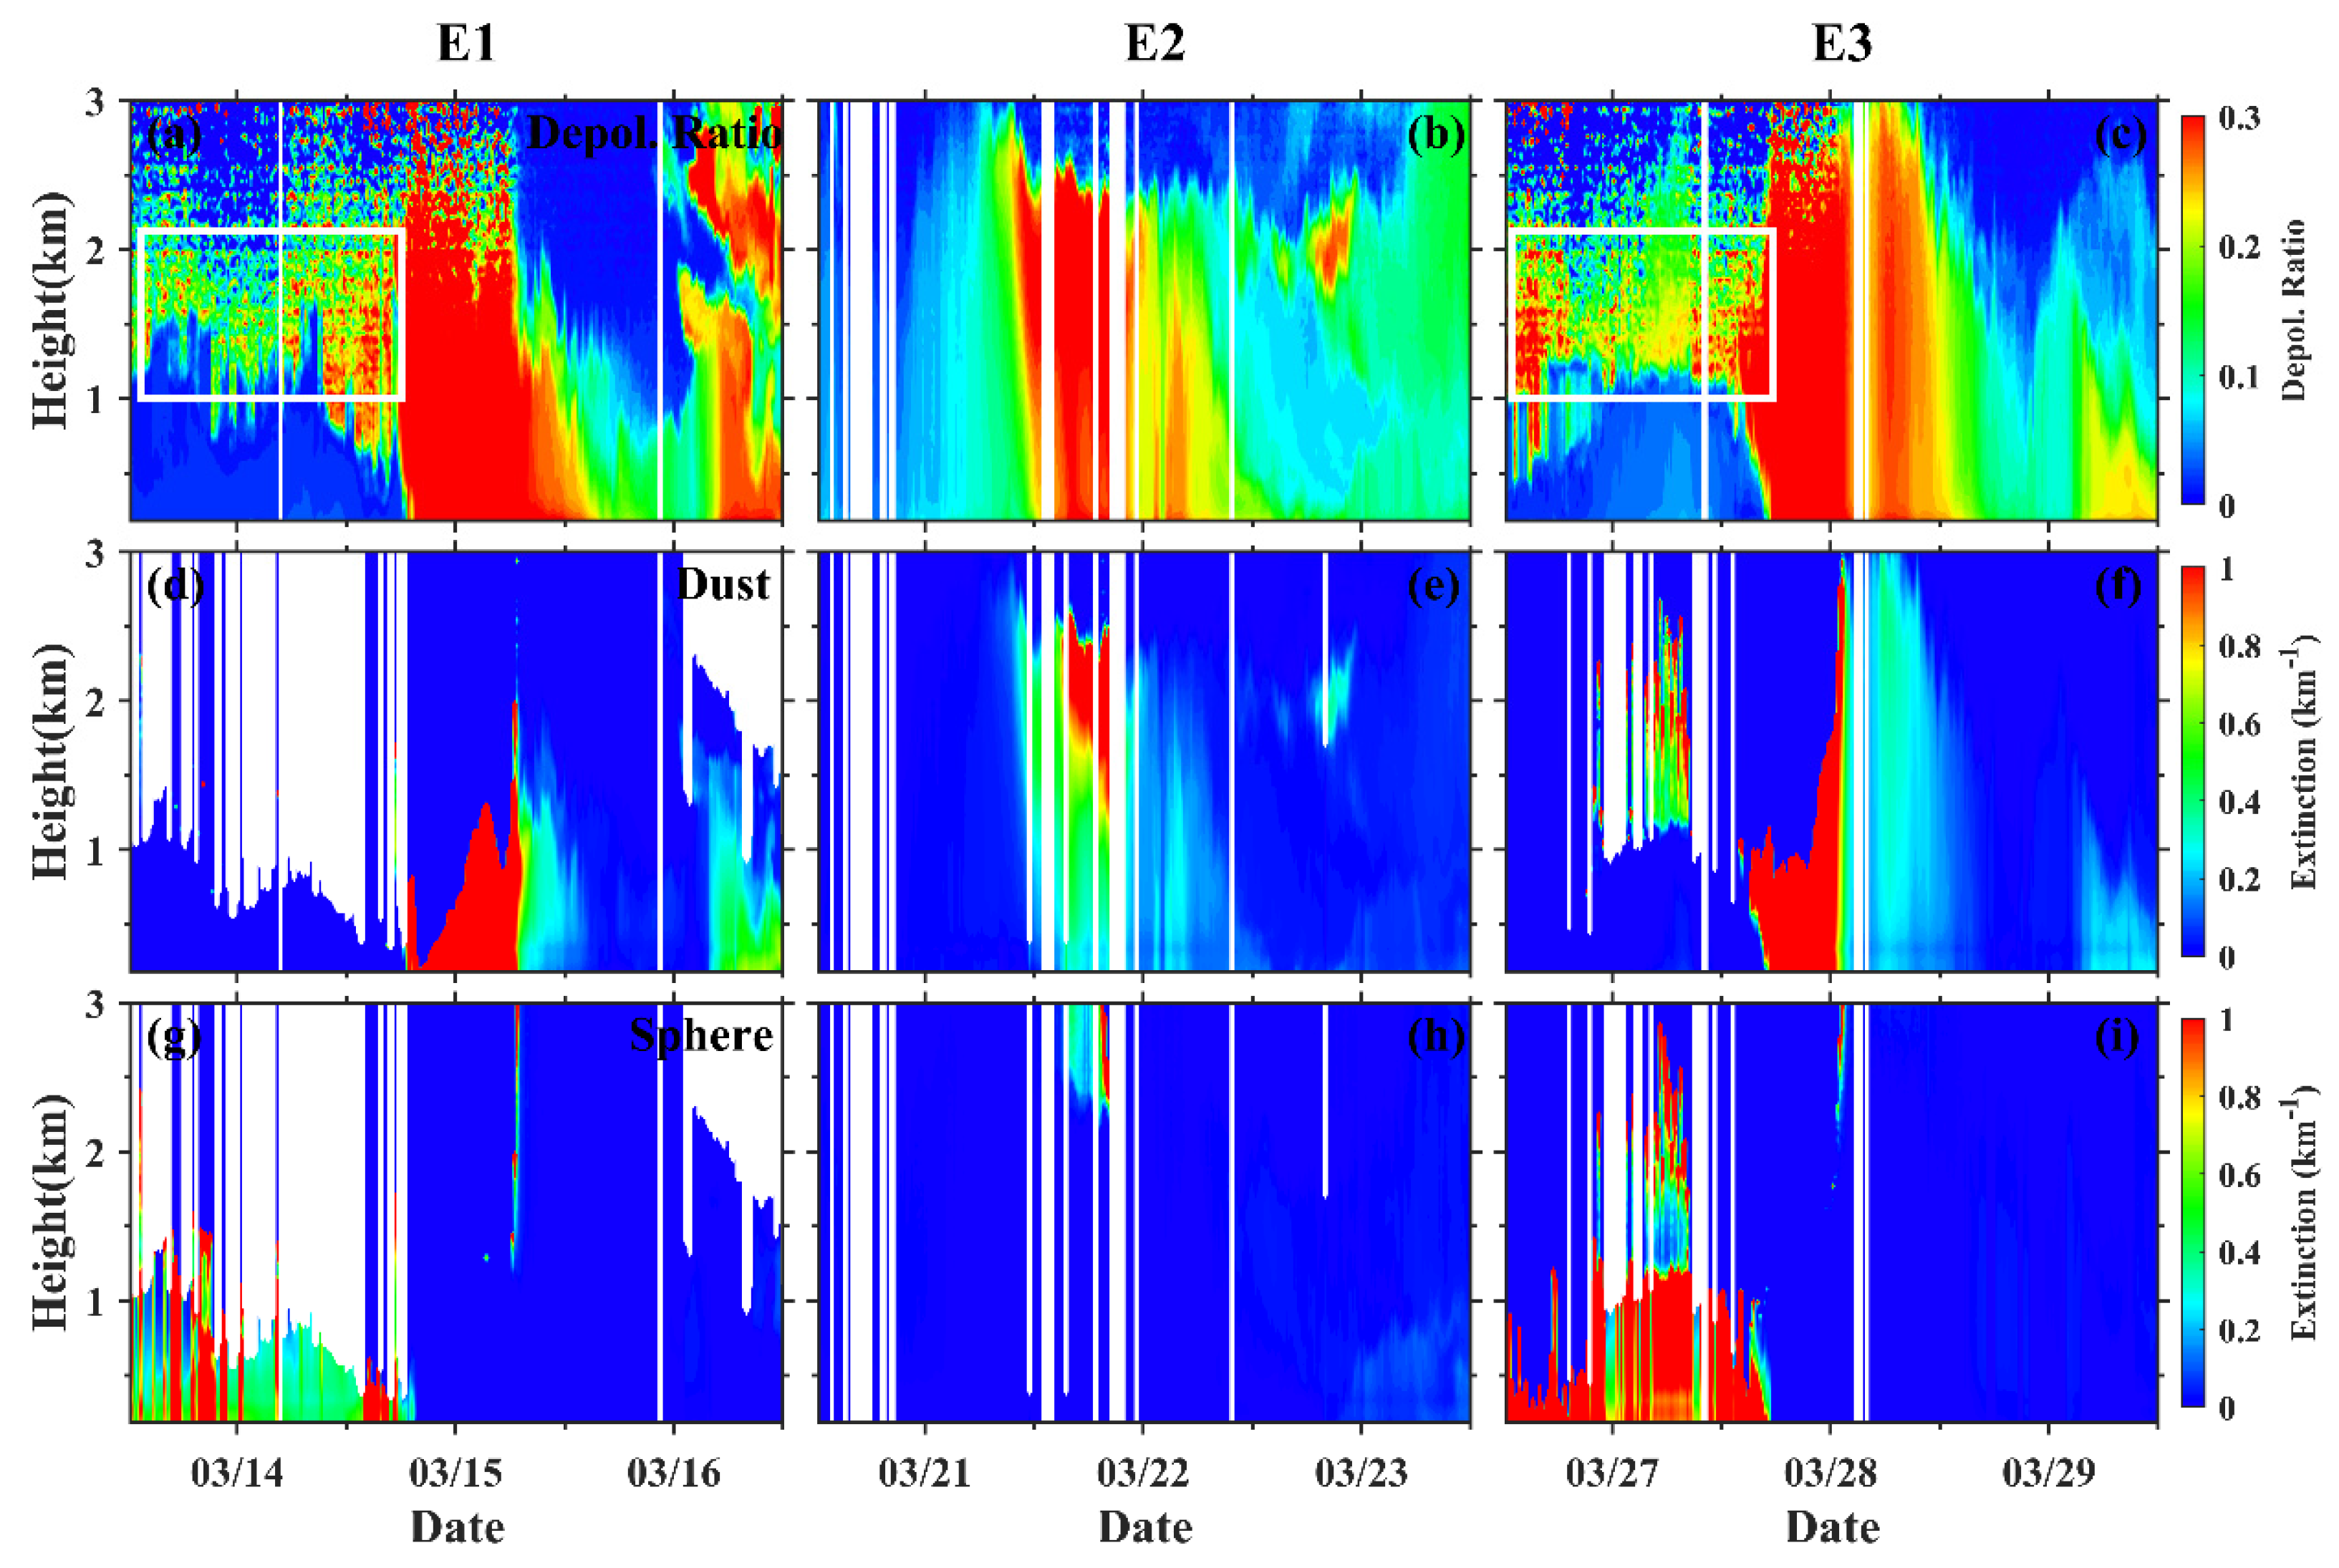
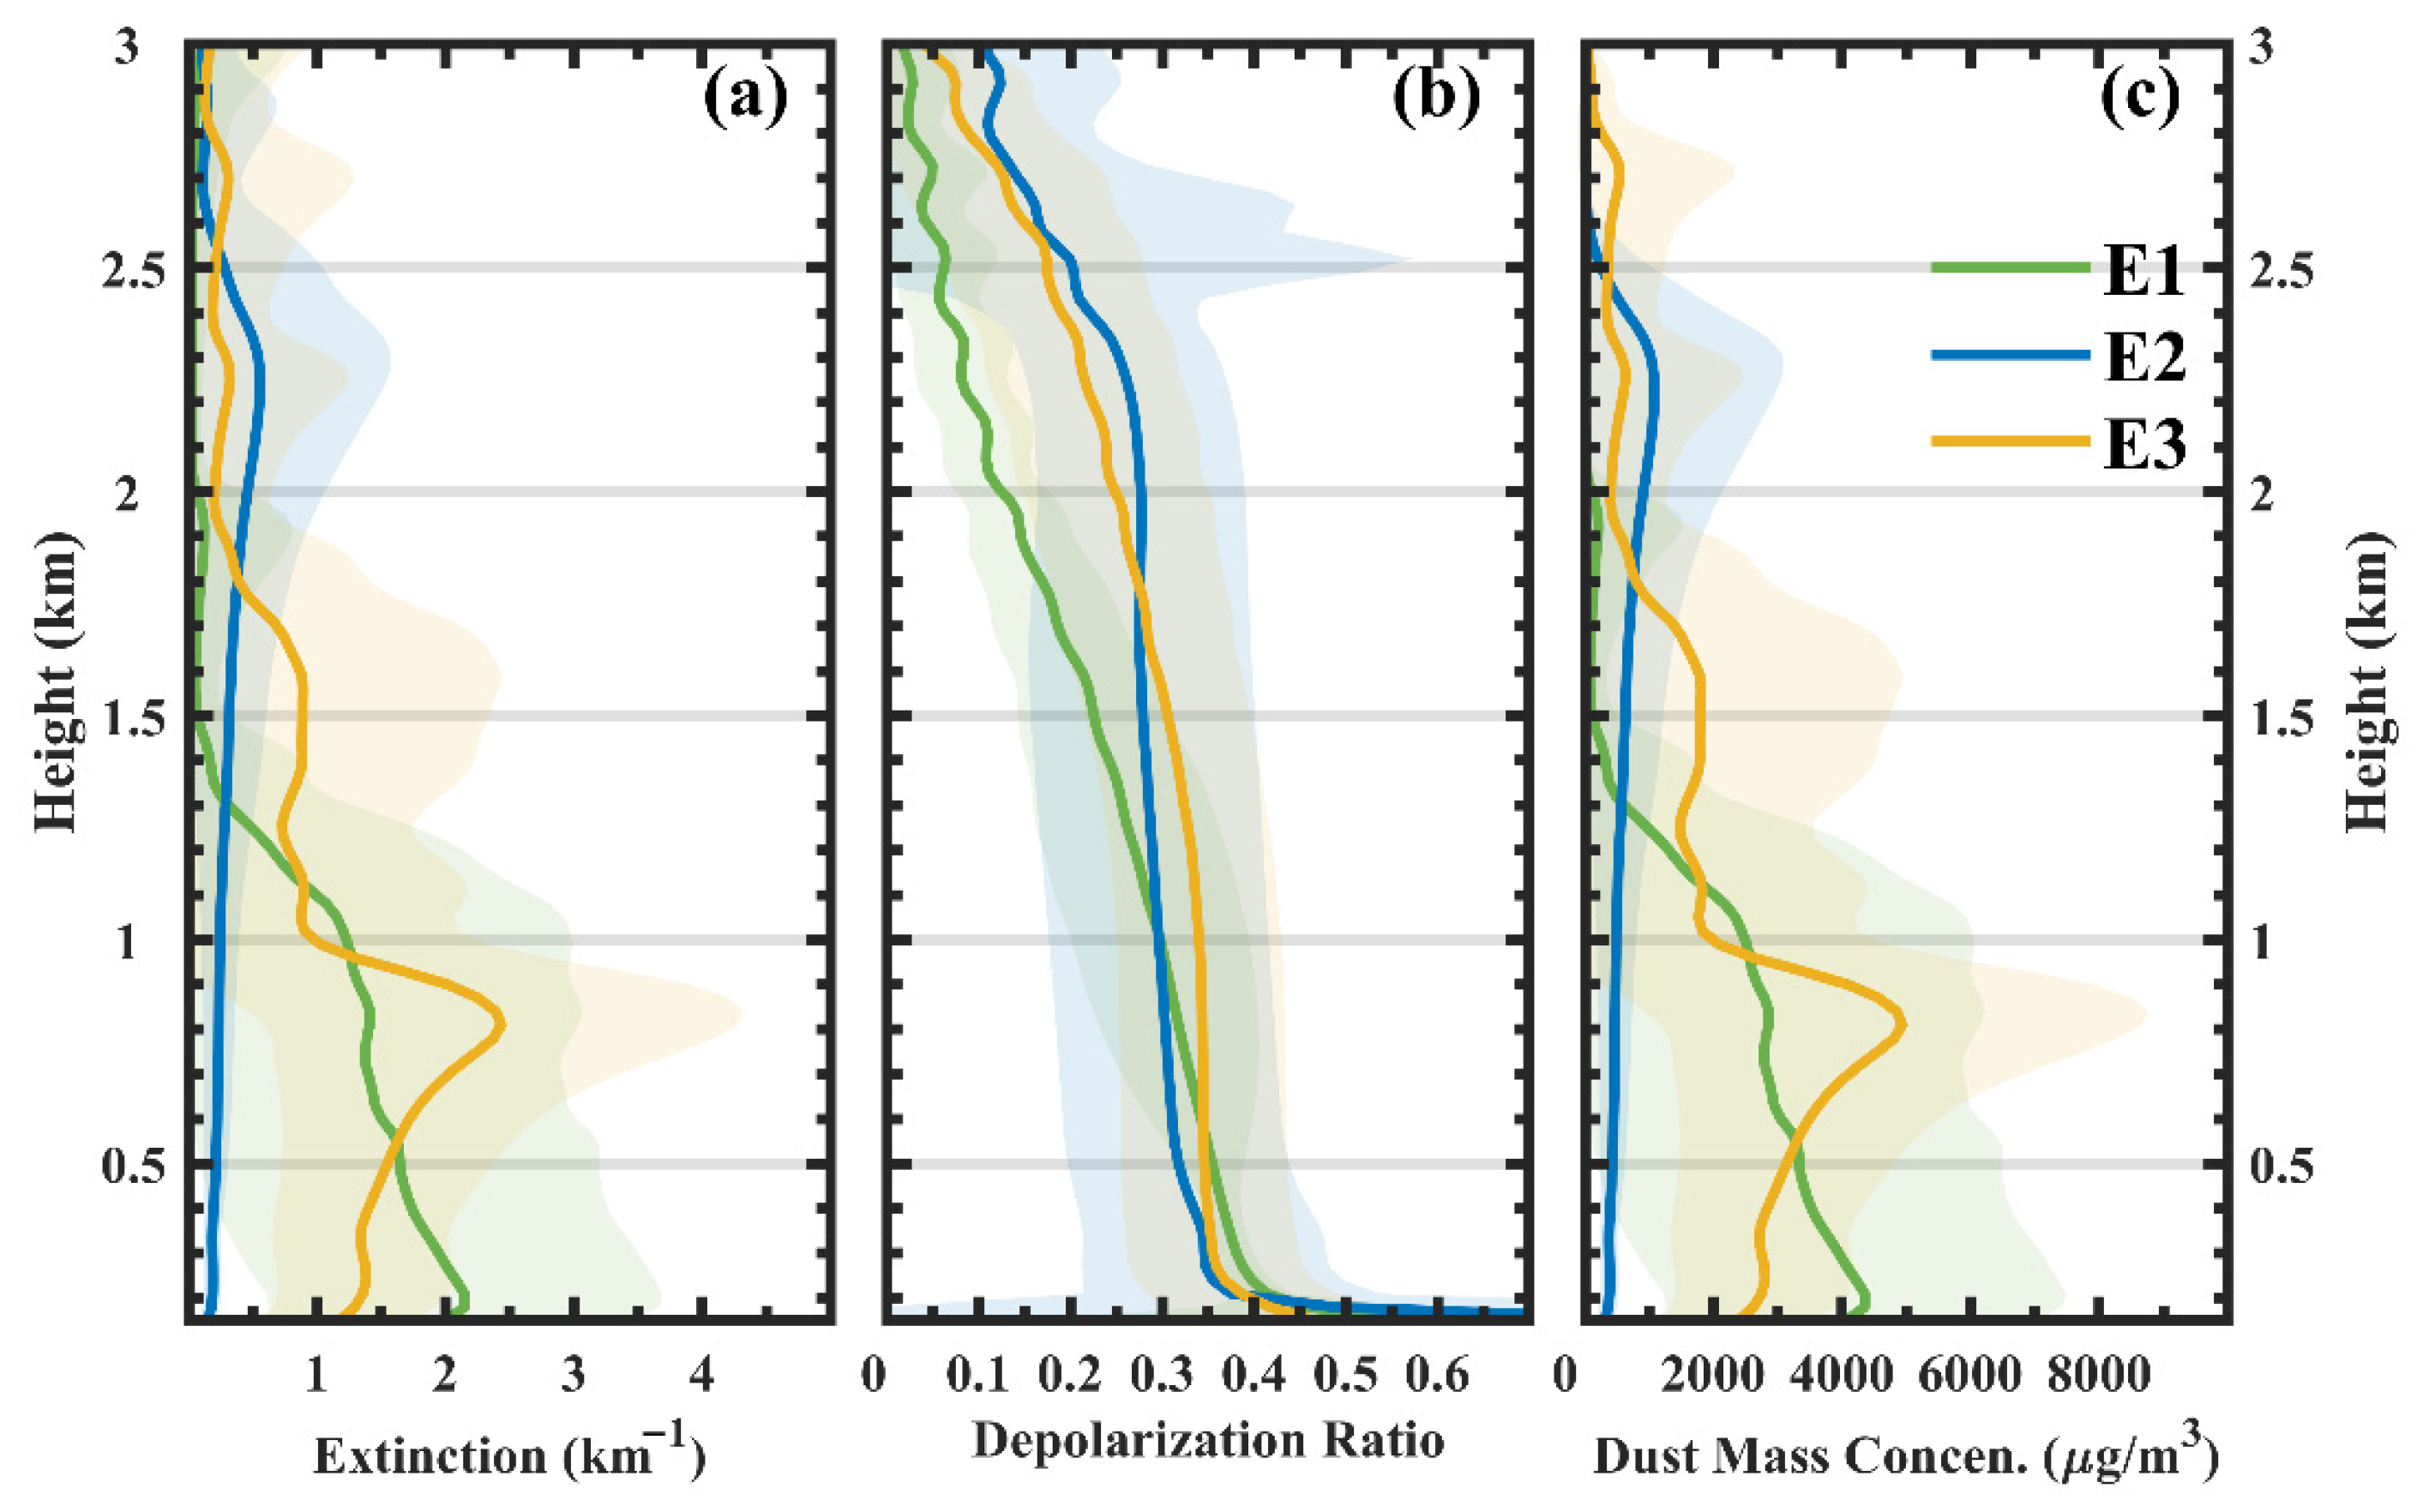
3.4.2. Lidar Continuous Observation

POLIPHON, referred to in Section 2.1, was applied to the polarization lidar data to study the vertical distribution of dust aerosols during the outbreak stage over Beijing. A cloud screening scheme was operated in advance with reference to Shimizu et al. [52]. Figure 8 reveals that, before the dust outbreaks of E1 and E3, the depolarization ratios above 1 km were close to 0.3 (as in the white box in Figure 8a), indicating the airborne dust. Unfortunately, due to cloud interference, the statistics for March 14 do not include data above 1 km; however, on March 27, the airborne dust was obvious, which reflected the long-distance transport mechanism before the dust outbreak.
As described in Section 3.4.1, the dust events commenced once the airborne dust reached the ground. There was high temporal consistency between the downdraft occurrence and dust touchdown. Clearly, in March of 2021, three pure dust events occurred over Beijing. The circumstances dominated by spherical aerosols agreed well with the conditions under which the ratio of PM2.5 to PM10 (Figure 1d) was greater than 0.75, which confirmed the applicability of the depolarization ratio in dust identification. The backflow process occurred to differing degrees during all three dust events and was closely related to the change in wind direction.
Figure 9c presents the profiles of dust mass concentration. The mass concentration was obtained from the dust extinction coefficients using an extinction-to-mass conversion factor of 0.78 ± 0.14 × 10⁻¹² Mm and a dust density of 2.6 g/cm3 [61]. The conversion factor used in this study was obtained from AERONET, as described in detail in the Supplementary Materials. Limited by the incomplete overlap zone, the dust mass concentration at 150 m was used to compare with the surface PM10 concentration, in order to verify the effectiveness of the conversion factor. The comparison is presented in Figure 10. Generally speaking, the dust concentration from lidar was in good agreement with the surface observation, and the correlation coefficient of the two was about 0.8. Significantly, the results from lidar corresponded to the PM10 concentration well when the dust broke out, and lidar was good at picking up the peaks of dust concentration. However, there was still an overestimation with the normalized mean bias of 0.76, which is an index to measure the degree of deviation [62]. Actually, the mismatch of target height is the primary error. Since the dust was transported from top to bottom, a higher dust concentration at 150 m is normal when there is uneven mixing in the boundary layer. In strong dust storms, a large amount of dust is transported to the surface by a strong downdraft, reducing the difference between ground and low level.
It can be determined from Figure 9 that there was a significant difference in the vertical distribution of the dust, which reflects the average state and the standard deviation of the dust outbreak stage during different events. As described in Section 3.4.1, the continuous and high-intensity downdraft in E1 produced a maximum dust concentration at about 200 m. Almost no dust aerosols were recorded above 1.5 km, while the transient downdraft in E3 caused a dust mass concentration at a maximum height of about 800 m. The higher depolarization ratio of E3 above 600 m also confirmed the dust in the upper atmosphere. Although with a higher maximum value, the average near-surface dust mass concentration in E1 was almost double that of E3. In E1, the downdraft was powerful enough to transport the dust to the ground, whereas the weaker and transient descending movement suspended the dust aloft in E3, weakening its effect on surface visibility. The weak vertical motion of the E2 event acted on the airborne dust to produce a maximum concentration of only 1000 μg/m3 (due to the lower dust emissions, as analyzed in Section 3.2). In E1, E2, and E3, the near-surface average dust mass concentration was about 4000, 300, and 2400 μg/m3, respectively. These values correspond well with the surface observations of particle concentration, which confirms the effectiveness of lidar in monitoring dust events. Consequently, it is evident that the strength of the downdraft directly influences the dust concentration on the ground. It should be noted that, in all three events, the maximum depolarization ratio occurred near the ground, which was attributable to the easier sedimentation of irregular-shaped large particles.

4. Conclusions

Mineral dust is of great importance to climate change, air quality, and human health. The near-surface dust mass concentration directly determines the intensity of the dust event to some extent, because its rating is divided according to the ground visibility. In this study, multisource data, including the reanalysis data and remote sensing data, were used to compare the three dust events that occurred in the March of 2021 over Beijing. The plane-to-point analysis reveals the effects of the atmospheric vertical structure on near-surface dust concentration.
In E1 and E3, the eastward movement of the Mongolian cyclone coupled with high/cold surface pressure caused significant amounts of dust in the source region to be lifted and transported to northern China via a northwesterly airflow at different altitudes before being carried back to the ground by a downdraft. The stronger Mongolian cyclone, the slower high/cold surface pressure, and the occurrence of the low-level jet made E1 more intense, more extensive, and longer-lasting than E3. Additionally, the appropriate configuration of the temperature and pressure fields at high and low altitudes can also generate an airborne dust process, as in E2. However, the dust emission of E2 was inferior to E1 and E3 due to its close relationship with the vertical dynamic conditions in the source region, which contributed to the low dust concentration near the surface in E2 to some degree.
Under the domination of the downdraft, the dust transported to northern China was entrained to the boundary layer. At this point, the strength of the downdraft directly affected the amount of dust reaching the ground. In E1, the maximum dust concentration was recorded at about 200 m due to the continuous and high-intensity downdraft. Almost no dust aerosols were recorded above 1.5 km; however, the maximum height of the dust mass concentration in E3 occurred at about 800 m due to the transient downdraft. Although E3 demonstrated a higher maximum value, the average near-surface dust mass concentration in E1 was almost double that in E3. The transient subsidence movement weakened its effect on surface visibility.
Overall, the large dust emission resulted from active updrafts in the source region, and the lengthy strong downdrafts led to the ultrahigh particle concentration near the surface. Additionally, this study confirmed the effectiveness of using lidar to monitor dust storms. There was high temporal consistency between the occurrence of downdrafts and the touchdown of dust according to vertical circulations and lidar observations. In fact, focusing solely on surface dust is not conducive to a comprehensive understanding of dust storms; the consideration of movements in the vertical direction is still of great significance.

Supplementary Materials

The following are available online at https://www.mdpi.com/article/10.3390/rs13183580/s1, Text S1: The description of the conversion factor calculation over Beijing; Figure S1: Relationship between AOD and total volume concentration. The conversion factor cd, correlation coefficient, and effective sample size are also presented. Each point denotes a pair of values for the pure dust moment; Figure S2: The eastward movement of Mongolian cyclone at 500 hPa and high/cold surface pressure on March 15, 2021; Figure S3: Same as Figure S2 but on March 28, 2021.

Author Contributions

T.Y. and F.W. designed the whole structure of this work. F.W. analyzed the data and wrote the manuscript. T.Y., J.C. and B.L. data curation. J.L., S.L., B.J. and S.C. validation and Z.W. helped polish the manuscript. All authors have read and agreed to the published version of the manuscript.

Funding

This research was supported by the Strategic Priority Research Program of the Chinese Academy of Sciences (Grant No. XDA19040203), The author Ting Yang gratefully acknowledges the Program of the Youth Innovation Promotion Association (CAS). the National High Technology Research and Development Program of China (No. 2019YFC214802), and the Young Talent Project of the Center for Excellence in Regional Atmospheric Environment, CAS (CERAE201803).

Institutional Review Board Statement

Not applicable.

Informed Consent Statement

Not applicable.

Data Availability Statement

The data will be shared by the authors upon reasonable request.

Acknowledgments

We would like to acknowledge the support from the Strategic Priority Research Program of the Chinese Academy of Sciences (Grant No. XDA19040203), the National High Technology Research and Development Program of China (No. 2019YFC214802), and the Young Talent Project of the Center for Excellence in Regional Atmospheric Environment, CAS (CERAE201803). The author Ting Yang gratefully acknowledges the Program of the Youth Innovation Promotion Association (CAS).

Conflicts of Interest

The authors declare no conflict of interest.

References

  1. Colarco, P.R.; Nowottnick, E.P.; Randles, C.A.; Yi, B.Q.; Yang, P.; Kim, K.M.; Smith, J.A.; Bardeen, C.G. Impact of radiatively interactive dust aerosols in the NASA GEOS-5 climate model: Sensitivity to dust particle shape and refractive index. J. Geophys. Res. Atmos. 2014, 119, 753–786. [Google Scholar] [CrossRef]
  2. Quijano, A.L.; Sokolik, I.N.; Toon, O.B. Radiative heating rates and direct radiative forcing by mineral dust in cloudy atmospheric conditions. J. Geophys. Res. Atmos. 2000, 105, 12207–12219. [Google Scholar] [CrossRef] [Green Version]
  3. Huang, J.; Wang, T.; Wang, W.; Li, Z.; Yan, H. Climate effects of dust aerosols over East Asian arid and semiarid regions. J. Geophys. Res. Atmos. 2014, 119, 11398–11416. [Google Scholar] [CrossRef]
  4. Chaibou, A.A.S.; Ma, X.Y.; Sha, T. Dust radiative forcing and its impact on surface energy budget over West Africa. Sci. Rep. 2020, 10, 18. [Google Scholar] [CrossRef] [PubMed]
  5. Hara, Y.; Uno, I.; Wang, Z.F. Long-term variation of Asian dust and related climate factors. Atmos. Environ. 2006, 40, 6730–6740. [Google Scholar] [CrossRef]
  6. Modarres, R. Dust storm frequency change in relation to climate drivers. Int. J. Climatol. 2021, 41, E187–E199. [Google Scholar] [CrossRef]
  7. Lin, C.Y.; Sheng, Y.F.; Chen, W.N.; Wang, Z.; Kuo, C.H.; Chen, W.C.; Yang, T. The impact of channel effect on Asian dust transport dynamics: A case in southeastern Asia. Atmos. Chem. Phys. 2012, 12, 271–285. [Google Scholar] [CrossRef] [Green Version]
  8. Kok, J.F.; Ward, D.S.; Mahowald, N.M.; Evan, A.T. Global and regional importance of the direct dust-climate feedback. Nat. Commun. 2018, 9, 241. [Google Scholar] [CrossRef]
  9. Albani, S.; Mahowald, N.M. Paleodust Insights into Dust Impacts on Climate. J. Clim. 2019, 32, 7897–7913. [Google Scholar] [CrossRef] [Green Version]
  10. Yin, Y.; Wurzler, S.; Levin, Z.; Reisin, T.G. Interactions of mineral dust particles and clouds: Effects on precipitation and cloud optical properties. J. Geophys. Res. Atmos. 2002, 107, 14. [Google Scholar] [CrossRef] [Green Version]
  11. Cziczo, D.J.; Froyd, K.D.; Hoose, C.; Jensen, E.J.; Diao, M.H.; Zondlo, M.A.; Smith, J.B.; Twohy, C.H.; Murphy, D.M. Clarifying the Dominant Sources and Mechanisms of Cirrus Cloud Formation. Science 2013, 340, 1320–1324. [Google Scholar] [CrossRef] [Green Version]
  12. He, C.L.; Liou, K.N.; Takano, Y.; Chen, F.; Barlage, M. Enhanced Snow Absorption and Albedo Reduction by Dust-Snow Internal Mixing: Modeling and Parameterization. J. Adv. Model. Earth Syst. 2019, 11, 3755–3776. [Google Scholar] [CrossRef] [Green Version]
  13. Arimoto, R. Eolian dust and climate: Relationships to sources, tropospheric chemistry, transport and deposition. Earth Sci. Rev. 2001, 54, 29–42. [Google Scholar] [CrossRef]
  14. Zhang, L.; Li, Q.B.; Gu, Y.; Liou, K.N.; Meland, B. Dust vertical profile impact on global radiative forcing estimation using a coupled chemical-transport-radiative-transfer model. Atmos. Chem. Phys. 2013, 13, 7097–7114. [Google Scholar] [CrossRef] [Green Version]
  15. Meloni, D.; di Sarra, A.; Di Iorio, T.; Fiocco, G. Influence of the vertical profile of Saharan dust on the visible direct radiative forcing. J. Quant. Spectrosc. Radiat. Transf. 2005, 93, 397–413. [Google Scholar] [CrossRef]
  16. Mahowald, N.M.; Scanza, R.; Brahney, J.; Goodale, C.L.; Hess, P.G.; Moore, J.K.; Neff, J. Aerosol Deposition Impacts on Land and Ocean Carbon Cycles. Curr. Clim. Chang. Rep. 2017, 3, 16–31. [Google Scholar] [CrossRef] [Green Version]
  17. Jickells, T.D.; An, Z.S.; Andersen, K.K.; Baker, A.R.; Bergametti, G.; Brooks, N.; Cao, J.J.; Boyd, P.W.; Duce, R.A.; Hunter, K.A.; et al. Global Iron Connections Between Desert Dust, Ocean Biogeochemistry, and Climate. Science 2005, 308, 67–71. [Google Scholar] [CrossRef] [PubMed] [Green Version]
  18. Zeng, L.; Miao, Q.; Gao, Q.; Gao, W.; Xiang, L. Influence of Dust Events on Atmospheric Environmental Quality and Solar Radiation in Beijing. Res. Environ. Sci. 2011, 24, 433–439. [Google Scholar]
  19. Kim, H.S.; Chung, Y.S. On the sandstorms and associated airborne dustfall episodes observed at Cheongwon in Korea in 2005. Air Qual. Atmos. Health 2010, 3, 83–94. [Google Scholar] [CrossRef] [PubMed] [Green Version]
  20. Flores, R.M.; Kaya, N.; Eser, O.; Saltan, S. The effect of mineral dust transport on PM10 concentrations and physical properties in Istanbul during 2007–2014. Atmos. Res. 2017, 197, 342–355. [Google Scholar] [CrossRef]
  21. Gobbi, G.P.; Angelini, F.; Barnaba, F.; Costabile, F.; Baldasano, J.M.; Basart, S.; Sozzi, R.; Bolignano, A. Changes in particulate matter physical properties during Saharan advections over Rome (Italy): A four-year study, 2001–2004. Atmos. Chem. Phys. 2013, 13, 7395–7404. [Google Scholar] [CrossRef] [Green Version]
  22. Meng, Z.; Lu, B. Dust events as a risk factor for daily hospitalization for respiratory and cardiovascular diseases in Minqin, China. Atmos. Environ. 2007, 41, 7048–7058. [Google Scholar] [CrossRef]
  23. Aghababaeian, H.; Ostadtaghizadeh, A.; Ardalan, A.; Asgary, A.; Akbary, M.; Yekaninejad, M.S.; Stephens, C. Global Health Impacts of Dust Storms: A Systematic Review. Environ. Health Insights 2021, 15, 11786302211018390. [Google Scholar] [CrossRef]
  24. Zhang, P.; Lu, Q.; Hu, X.; Gu, S.; Yang, L.; Min, M.; Chen, L.; Xu, N.; Sun, L.; Bai, W.; et al. Latest Progress of the Chinese Meteorological Satellite Program and Core Data Processing Technologies. Adv. Atmos. Sci. 2019, 36, 1027–1045. [Google Scholar] [CrossRef]
  25. Di Pierro, M.; Jaegle, L.; Anderson, T.L. Satellite observations of aerosol transport from East Asia to the Arctic: Three case studies. Atmos. Chem. Phys. 2011, 11, 2225–2243. [Google Scholar] [CrossRef] [Green Version]
  26. Chaibou, A.A.S.; Ma, X.Y.; Kumar, K.R.; Jia, H.L.; Tang, Y.G.; Sha, T. Evaluation of dust extinction and vertical profiles simulated by WRF-Chem with CALIPSO and AERONET over North Africa. J. Atmos. Sol. Terr. Phys. 2020, 199, 12. [Google Scholar] [CrossRef]
  27. Huang, Z.; Huang, J.; Bi, J.; Wang, G.; Wang, W.; Fu, Q.; Li, Z.; Tsay, S.-C.; Shi, J. Dust aerosol vertical structure measurements using three MPL lidars during 2008 China-US joint dust field experiment. J. Geophys. Res. Atmos. 2010, 115, D00K15. [Google Scholar] [CrossRef] [Green Version]
  28. Mamouri, R.E.; Ansmann, A.; Nisantzi, A.; Solomos, S.; Kallos, G.; Hadjimitsis, D.G. Extreme dust storm over the eastern Mediterranean in September 2015: Satellite, lidar, and surface observations in the Cyprus region. Atmos. Chem. Phys. 2016, 16, 13711–13724. [Google Scholar] [CrossRef] [Green Version]
  29. Chaikovsky, A.; Dubovik, O.; Holben, B.; Bril, A.; Goloub, P.; Tanre, D.; Pappalardo, G.; Wandinger, U.; Chaikovskaya, L.; Denisov, S.; et al. Lidar-Radiometer Inversion Code (LIRIC) for the retrieval of vertical aerosol properties from combined lidar/radiometer data: Development and distribution in EARLINET. Atmos. Meas. Tech. 2016, 9, 1181–1205. [Google Scholar] [CrossRef] [Green Version]
  30. Wagner, J.; Ansmann, A.; Wandinger, U.; Seifert, P.; Schwarz, A.; Tesche, M.; Chaikovsky, A.; Dubovik, O. Evaluation of the Lidar/Radiometer Inversion Code (LIRIC) to determine microphysical properties of volcanic and desert dust. Atmos. Meas. Tech. 2013, 6, 1707–1724. [Google Scholar] [CrossRef] [Green Version]
  31. Lopatin, A.; Dubovik, O.; Chaikovsky, A.; Goloub, P.; Lapyonok, T.; Tanre, D.; Litvinov, P. Enhancement of aerosol characterization using synergy of lidar and sun-photometer coincident observations: The GARRLiC algorithm. Atmos. Meas. Tech. 2013, 6, 2065–2088. [Google Scholar] [CrossRef] [Green Version]
  32. Tesche, M.; Ansmann, A.; Mueller, D.; Althausen, D.; Engelmann, R.; Freudenthaler, V.; Gross, S. Vertically resolved separation of dust and smoke over Cape Verde using multiwavelength Raman and polarization lidars during Saharan Mineral Dust Experiment 2008. J. Geophys. Res. Atmos. 2009, 114. [Google Scholar] [CrossRef]
  33. Ansmann, A.; Seifert, P.; Tesche, M.; Wandinger, U. Profiling of fine and coarse particle mass: Case studies of Saharan dust and Eyjafjallajokull/Grimsvotn volcanic plumes. Atmos. Chem. Phys. 2012, 12, 9399–9415. [Google Scholar] [CrossRef] [Green Version]
  34. Mamouri, R.E.; Ansmann, A. Fine and coarse dust separation with polarization lidar. Atmos. Meas. Tech. 2014, 7, 3717–3735. [Google Scholar] [CrossRef] [Green Version]
  35. Feng, K. Spatial and temporal evolution characteristics of days of disastrous dust weather in China from 1961 to 2017. J. Arid. Land Resour. Environ. 2020, 34, 116–123. [Google Scholar]
  36. Guan, Q.; Sun, X.; Yang, J.; Pan, B.; Zhao, S.; Wang, L. Dust Storms in Northern China: Long-Term Spatiotemporal Characteristics and Climate Controls. J. Clim. 2017, 30, 6683–6700. [Google Scholar] [CrossRef]
  37. Yang Jie, Z.T.; Xugeng, C.; Zhihua, R.; Qing, H.; Chenghao, T.; Yan, Z.; Congzhen, Z.; Zhaoye, W. Interannual variations and trends of sandstorm days averaged in the northern region of China from 2000 to 2019. J. Environ. Sci. 2021, 41, 2966–2975. [Google Scholar] [CrossRef]
  38. Karyampudi, V.M.; Palm, S.P.; Reagen, J.A.; Fang, H.; Grant, W.B.; Hoff, R.M.; Moulin, C.; Pierce, H.F.; Torres, O.; Browell, E.V.; et al. Validation of the Saharan dust plume conceptual model using lidar, Meteosat, and ECMWF data. Bull. Amer. Meteorol. Soc. 1999, 80, 1045–1075. [Google Scholar] [CrossRef] [Green Version]
  39. Wei, W.; Pi, D.; Yan, P.; Xiao, L.; Zhang, W.; Chen, T.; Luo, B.; Ding, J.; Li, J. Study on a typical dust pollution process in North China in spring in 2017. Acta Sci. Circumstantiae 2018, 38, 1699–1707. [Google Scholar]
  40. Chen, S.; Zhao, C.; Qian, Y.; Leung, L.R.; Huang, J.; Huang, Z.; Bi, J.; Zhang, W.; Shi, J.; Yang, L.; et al. Regional modeling of dust mass balance and radiative forcing over East Asia using WRF-Chem. Aeolian Res. 2014, 15, 15–30. [Google Scholar] [CrossRef]
  41. Zhang, X.Y.; Gong, S.L.; Zhao, T.L.; Arimoto, R.; Wang, Y.Q.; Zhou, Z.J. Sources of Asian dust and role of climate change versus desertification in Asian dust emission. Geophys. Res. Lett. 2003, 30, 2272. [Google Scholar] [CrossRef] [Green Version]
  42. Zhang, X.Y.; Arimoto, R.; An, Z.S. Dust emission from Chinese desert sources linked to variations in atmospheric circulation. J. Geophys. Res. Atmos. 1997, 102, 28041–28047. [Google Scholar] [CrossRef]
  43. Lachatre, M.; Foret, G.; Laurent, B.; Siour, G.; Cuesta, J.; Dufour, G.; Meng, F.; Tang, W.; Zhang, Q.; Beekmann, M. Air Quality Degradation by Mineral Dust over Beijing, Chengdu and Shanghai Chinese Megacities. Atmosphere 2020, 11, 708. [Google Scholar] [CrossRef]
  44. Lyu, Y.; Qu, Z.; Liu, L.; Guo, L.; Yang, Y.; Hu, X.; Xiong, Y.; Zhang, G.; Zhao, M.; Liang, B.; et al. Characterization of dustfall in rural and urban sites during three dust storms in northern China, 2010. Aeolian Res. 2017, 28, 29–37. [Google Scholar] [CrossRef]
  45. Zheng, S.; Singh, R.P. Aerosol and Meteorological Parameters Associated with the Intense Dust Event of 15 April 2015 over Beijing, China. Remote. Sens. 2018, 10, 957. [Google Scholar] [CrossRef] [Green Version]
  46. Sugimoto, N.; Matsui, I.; Shimizu, A.; Uno, I.; Asai, K.; Endoh, T.; Nakajima, T. Observation of dust and anthropogenic aerosol plumes in the Northwest Pacific with a two-wavelength polarization lidar on board the research vessel Mirai. Geophys. Res. Lett. 2002, 29, 1901. [Google Scholar] [CrossRef] [Green Version]
  47. Yang, T.; Wang, Z.; Zhang, B.; Wang, X.; Wang, W.; Gbauidi, A.; Gong, Y. Evaluation of the effect of air pollution control during the Beijing 2008 Olympic Games using Lidar data. Chin. Sci. Bull. 2010, 55, 1311–1316. [Google Scholar] [CrossRef]
  48. Fernald, F.G. Analysis of atmospheric lidar observations: Some comments. Appl. Opt. 1984, 23, 652–653. [Google Scholar] [CrossRef]
  49. Burton, S.P.; Ferrare, R.A.; Hostetler, C.A.; Hair, J.W.; Rogers, R.R.; Obland, M.D.; Butler, C.F.; Cook, A.L.; Harper, D.B.; Froyd, K.D. Aerosol classification using airborne High Spectral Resolution Lidar measurements–methodology and examples. Atmos. Meas. Tech. 2012, 5, 73–98. [Google Scholar] [CrossRef] [Green Version]
  50. Murayama, T.; Muller, D.; Wada, K.; Shimizu, A.; Sekiguchi, M.; Tsukamoto, T. Characterization of Asian dust and Siberian smoke with multiwavelength Raman lidar over Tokyo, Japan in spring 2003. Geophys. Res. Lett. 2004, 31. [Google Scholar] [CrossRef] [Green Version]
  51. Hofer, J.; Ansmann, A.; Althausen, D.; Engelmann, R.; Baars, H.; Fomba, K.W.; Wandinger, U.; Abdullaev, S.F.; Makhmudov, A.N. Optical properties of Central Asian aerosol relevant for spaceborne lidar applications and aerosol typing at 355 and 532 nm. Atmos. Chem. Phys. 2020, 20, 9265–9280. [Google Scholar] [CrossRef]
  52. Shimizu, A.; Sugimoto, N.; Matsui, I.; Arao, K.; Uno, I.; Murayama, T.; Kagawa, N.; Aoki, K.; Uchiyama, A.; Yamazaki, A. Continuous observations of Asian dust and other aerosols by polarization lidars in China and Japan during ACE-Asia. J. Geophys. Res. Atmos. 2004, 109, D19S17. [Google Scholar] [CrossRef]
  53. Mamouri, R.E.; Ansmann, A.; Nisantzi, A.; Kokkalis, P.; Schwarz, A.; Hadjimitsis, D. Low Arabian dust extinction-to-backscatter ratio. Geophys. Res. Lett. 2013, 40, 4762–4766. [Google Scholar] [CrossRef]
  54. Burton, S.P.; Hair, J.W.; Kahnert, M.; Ferrare, R.A.; Hostetler, C.A.; Cook, A.L.; Harper, D.B.; Berkoff, T.A.; Seaman, S.T.; Collins, J.E.; et al. Observations of the spectral dependence of linear particle depolarization ratio of aerosols using NASA Langley airborne High Spectral Resolution Lidar. Atmos. Chem. Phys. 2015, 15, 13453–13473. [Google Scholar] [CrossRef] [Green Version]
  55. Sugimoto, N.; Nishizawa, T.; Shimizu, A.; Matsui, I.; Kobayashi, H. Detection of internally mixed Asian dust with air pollution aerosols using a polarization optical particle counter and a polarization-sensitive two-wavelength lidar. J. Quant. Spectrosc. Radiat. Transf. 2015, 150, 107–113. [Google Scholar] [CrossRef]
  56. Sugimoto, N.; Uno, I.; Nishikawa, M.; Shimizu, A.; Matsui, I.; Dong, X.H.; Chen, Y.; Quan, H. Record heavy Asian dust in Beijing in 2002: Observations and model analysis of recent events. Geophys. Res. Lett. 2003, 30, 16–1834. [Google Scholar] [CrossRef]
  57. Wu, S.; Ma, X. Analysis of dust vertical and horizontal distribution during dust events in northwest China based on FY-4A,MODIS and CALIPSO satellite data. Acta Sci. Circumstantiae 2020, 40, 2892–2901. [Google Scholar]
  58. Sun, J.; Zhao, L. Numerical simulation of two East Asian dust storms in spring 2006. Earth Surf. Process. Landforms 2008, 33, 1892–1911. [Google Scholar] [CrossRef]
  59. Lei, H.; Wang, J.X.L. Observed characteristics of dust storm events over the western United States using meteorological, satellite, and air quality measurements. Atmos. Chem. Phys. 2014, 14, 7847–7857. [Google Scholar] [CrossRef] [Green Version]
  60. Stensrud, D.J. Importance of low-level jets to climate: A review. J. Clim. 1996, 9, 1698–1711. [Google Scholar] [CrossRef]
  61. Van Beelen, A.J.; Roelofs, G.J.H.; Hasekamp, O.P.; Henzing, J.S.; Rockmann, T. Estimation of aerosol water and chemical composition from AERONET Sun-sky radiometer measurements at Cabauw, the Netherlands. Atmos. Chem. Phys. 2014, 14, 5969–5987. [Google Scholar] [CrossRef] [Green Version]
  62. Wang, F.; Yang, T.; Wang, Z.; Chen, X.; Wang, H.; Guo, J. A comprehensive evaluation of planetary boundary layer height retrieval techniques using lidar data under different pollution scenarios. Atmos. Res. 2021, 253, 105483. [Google Scholar] [CrossRef]
Figure 1. The distribution of PM10 concentration at (a) 12:00 (LT) on March 15, (b) 12:00 (LT) on March 22, and (c) 08:00 (LT) on March 28. (d) Time series of pollutant data from March 14 to March 31, 2021, including PM2.5 and PM10. The gray bars represent the ratio of PM2.5 to PM10.
Remotesensing 13 03580 g001
Figure 2. Distribution of geopotential height (solid line) and horizontal wind speed (arrow) at 500 hPa at (a) 20:00 (LT) on March 14 (E1), (b) 13:00 (LT) on March 21 (E2), and (c) 14:00 (LT) on March 27 (E3), 2021. Temperature (contour plot), pressure (solid line), and horizontal wind speed (arrow) at sea level at (d) 20:00 (LT) on March 14, (e) 13:00 (LT) on March 21, and (f) 14:00 (LT) on March 27, 2021. The red triangle in the figure represents the study site.
Remotesensing 13 03580 g002
Figure 3. Distribution of dust density from FY-4A at (a) 15:00 (LT) on March 27 and (b) 14:00 (LT) on March 28. The color describes the relative quantification of dust density.
Remotesensing 13 03580 g003
Figure 4. Zonal vertical profile of divergence and vertical velocity above sea level (a) along 45°N at 15:00 (LT) on March 14 (E1), (b) along 43°N at 13:00 (LT) on March 21 (E2), and (c) along 45°N at 08:00 (LT) on March 27 (E3), 2021.
Remotesensing 13 03580 g004
Figure 5. The 24 h backward trajectories starting from Beijing at 0000 UTC on (a) March 15 2021, (b) March 22 2021, and (c) March 28 2021 at 300, 1000, and 3000 m using the HYSPLIT model.
Remotesensing 13 03580 g005
Figure 6. Distribution of geopotential height (solid line) and horizontal wind speed (arrow) (a) at 500 hPa at 05:00 (LT) on March 15, (b) at 850 hPa at 20:00 (LT) on March 21, and (c) at 500 hPa at 05:00 (LT) on March 28, 2021.
Remotesensing 13 03580 g006
Figure 7. Zonal vertical profile of divergence and vertical velocity above sea level along 40°N at (a) 10:00 (LT) on March 15 (E1), (c) 06:00 (LT) on March 22 (E2), and (d) 12:00 (LT) on March 28 (E3), 2021. (b) The distribution of geopotential height (solid line) and horizontal wind speed (arrow) at 10:00 (LT) on March 15 at 850 hPa.
Remotesensing 13 03580 g007
Figure 8. Time series of lidar measurements above the ground level of (ac) particle depolarization ratio, (df) separated dust extinction (km−1), and (gi) separated spherical aerosol extinction for March 14–16 (a,d,g), March 21–23 (b,e,h), and March 27–29 (c,f,i) over Beijing.
Remotesensing 13 03580 g008
Figure 9. The average vertical profile above the ground level of (a) extinction coefficient at 532 nm, (b) depolarization ratio at 532 nm, and (c) dust mass concentration retrieved from lidar in the outbreak stage of E1 (from 08:00 to 20:00 on March 15), E2 (from 00:00 on March 22 to 00:00 on March 23) and E3 (from 07:00 to 14:00 on March 28). Different colors represent the different events. The shadows with different colors represent the standard deviation of extinction, depolarization ratio, and dust mass concentration in the dust outbreak event. Note that the times mentioned above are all given in local time.
Remotesensing 13 03580 g009
Figure 10. The time series of PM10 concentration at the surface and the dust concentration derived from lidar at 150 m from 14 March to 31 March 2021. The correlation coefficient and the normalized mean bias are also marked.
Remotesensing 13 03580 g010
Table 1. Specifications of the polarization lidar.
LaserFlashlamp Pumped ND:YAG Laser
Output power532 nm30 mJ/pulse
1064 nm20 mJ/pulse
TelescopeSchmidt Cassegrain
Repetition rate10 Hz
Diameter20 cm
Field of view1 mrad
DetectorPhotomultiplier tubes (532 nm dual polarization)
Table 2. The maximum value of wind speed and vertical divergence in dust emission and outbreak stage of different dust events and the duration time of the strong downdrafts1 over 40°N, 116°E. The negative vertical velocity represents updraft and the negative divergence represents convergence in the table.
Dust EmissionDust Outbreak
E1E2E3E1E2E3
Wind Speed 1Horizontal 250.830.543.433.721.134.5
Vertical 3−50.5−29.8−37.128.424.528.7
Vertical Divergence 4−54.1−31.0−46.929.528.426.7
Duration Time (h)---1686
1 Airflow with the center vertical wind speed greater than 20 × 10−3 hPa/s is considered as a strong downdraft. 2 The unit of wind speed: m/s. 3 The unit of wind speed: 10−3 hPa/s. 4 The unit of vertical divergence: 10−5/s.
Publisher’s Note: MDPI stays neutral with regard to jurisdictional claims in published maps and institutional affiliations.

