Abstract
As an important fraction of light-absorbing particles, black carbon (BC) has a significant warming effect, despite accounting for a small proportion of total aerosols. A comprehensive investigation was conducted on the characteristics of atmospheric aerosols and BC particles over Wuhan, China. Mass concentration, optical properties, and radiative forcing of total aerosols and BC were estimated using multi-source observation data. Results showed that the BC concentration monthly mean varied from 2.19 to 5.33 μg m−3. The BC aerosol optical depth (AOD) maximum monthly mean (0.026) occurred in winter, whereas the maximum total AOD (1.75) occurred in summer. Under polluted-air conditions, both aerosol radiative forcing (ARF) and BC radiative forcing (BCRF) at the bottom of the atmosphere (BOA) were strongest in summer, with values of −83.01 and −11.22 W m−2, respectively. In summer, ARF at BOA on polluted-air days was more than two-fold that on clean-air days. In addition, compared with clean-air days, BCRF at BOA on polluted-air days was increased by 76% and 73% in summer and winter, respectively. The results indicate an important influence of particulate air pollution on ARF and BCRF. Furthermore, the average contribution of BCRF to ARF was 13.8%, even though the proportion of BC in PM2.5 was only 5.1%.
1. Introduction
The main driving force of the Earth system is radiative forcing [1]. The temperature and circulation of the Earth’s atmosphere and surface are largely regulated by the amount of radiation the Earth receives from the Sun [2]. Therefore, a detailed and quantitative knowledge of the Earth’s radiation field is crucial to understand and predict the evolution of the components of the Earth system. In turn, this demands an accurate, yet increasingly complex and comprehensive, account of the relevant processes in the climate system. Atmospheric aerosols, which play a crucial role in global and regional climate change, significantly modulate the radiation budget of the Earth–atmosphere system through their direct and indirect effects on solar radiation [3,4]. Intergovernmental Panel on Climate Change (IPCC) [5] reported that the quantification of the total radiative forcing is fraught with uncertainties, which are dominated by aerosol properties, particularly those relating to aerosol single scattering albedo (SSA) and aerosol optical depth (AOD) [6]. Black carbon (BC), often called ‘‘soot’’ by the combustion research community, is usually formed under conditions in which insufficient oxygen is present for complete oxidation of carbonaceous fuel to carbon dioxide (CO2) [7]. As the most important light-absorbing component in the atmospheric aerosols, BC aerosols have been considered the second largest contributor to global warming after CO2 [8,9,10,11]. In addition, with the development of air pollution, BC damages air quality and atmospheric visibility [12,13], and can even change weather conditions, leading to extreme weather [14,15,16]. Furthermore, the adverse effects of BC on human health cannot be ignored because it is easy for harmful substances to absorb BC particulate matters into the human body [17,18]. Therefore, it is becoming increasingly difficult to ignore the influence of BC, and the research of BC has received considerable critical attention.
The temporal and spatial distribution characteristics of the BC load have long been a popular topic among researchers. Numerous studies focused on the BC mass concentration characteristics in different regions of China, such as Hongkong, Xiamen, Shenzhen, the Qinghai-Tibetan Plateau, and Beijing [19,20,21,22,23]. For example, the annual average surface radiative forcing estimated in the southeastern Tibet Plateau was −19.9 W m−2 for the full aerosol population and −3.9 W m−2 for a BC-only scenario [24]. Wang, et al. [25] reported that BC aerosols over the North China Plain in winter led to a cooling effect of −13.6 W m−2 at the Earth’s surface and contributed 86% of the forcing caused by total aerosols in the atmosphere. These studies suggest that, although BC accounts for a small fraction of total aerosol load, it makes a significant contribution to atmospheric aerosol forcing due to its strong radiative absorption nature. However, despite advances in understanding the climate effects of aerosols and BC over the past few decades, significant uncertainties remain due to inadequate knowledge of the complex spatial-temporal variability in aerosol properties and limited measurements of aerosol parameters [6,26,27,28,29]. In particular, it is extremely difficult to quantify BC-related properties in low concentrations [30]. Therefore, monitoring of total aerosols and BC across various parts of a country is important to assess the radiative effects on a regional and a global scale. In addition, because model success in one region or season does not apply to all regions and seasons, long-term measurements are required in many regions to assess the efficacy of the carbon emission inventory and transport model output.
Economic development and the accompanying increasing demand for energy have caused a dramatic increase in aerosol emissions, particularly in a small number of rapidly growing countries such as China [31,32]. Due to its massive consumption of fossil fuel, China accounts for the largest share of global BC emissions and half of Asian emissions [7,33], which has an important impact on air quality and regional climate change [34,35,36,37,38,39]. As a megalopolis in Central China, Wuhan shows unique characteristics in terms of its geological location and synoptic characteristics. It is located on the banks of the Yangtze and Han Rivers, and has numerous lakes. The large amount of vapor evaporating from rivers and lakes leads to high-humidity conditions [40,41]. In addition, severe air pollution events have been frequently reported in recent years, especially in winter [42]. Under these high-humidity conditions, intense photochemical reactions and gas-to-particle conversions of the primary pollutants from vehicle and industrial exhausts occur, in addition to the strong hygroscopic growth of the resulting aerosols, thus leading to changes in the shape, size, and components of the aerosol particles, and unique aerosol optical and radiative characteristics, during air pollution episodes [43,44,45]. Significant progress has been made to understand aerosol optical properties and aerosol radiative forcing (ARF), and surface BC concentration, over Wuhan [42,46]. However, scholars have focused on the diurnal variations or case analysis of these factors over Wuhan. Moreover, the variation in aerosol absorption under different particulate pollution conditions is poorly understood, although it has a major impacts on the aerosol radiative effect, as reported by Guan, et al. [47]. Therefore, there remains a lack of analysis of the seasonal changes considering particulate air pollution conditions. This uncertainty impairs the quantitative evaluation of future climate adaptation and mitigation pathways. More complete knowledge of total aerosols and BC will help enhance the ability to accurately assess radiative forcing and improve the understanding of the role of different megacities in the regional climate, thus providing a high-confidence scientific reference for policymakers to develop a better reduction strategy.
In this study, four year continuous comprehensive measurements from the CIMEL sun–sky radiometer (CE-318) and Aethalometer (AE-31) were utilized from 2013–2016 over Wuhan, China. Based on the atmospheric aerosol parameters retrieved by CE-318 and the optical parameters of BC retrieved using the Optical Properties of Aerosols and Clouds (OPAC) package, ARF and BC radiative forcing (BCRF) in the shortwave region were estimated through the Santa Barbara DISORT Atmospheric Radiative Transfer (SBDART) model. The remainder of this paper is organized as follows: in Section 2, the main data and methods are described; in Section 3, the seasonal optical properties and associated radiative forcing of total aerosols and BC over Wuhan are analyzed; conclusions are finally presented in Section 4.
2. Materials and Methods
2.1. Data
The main observation data were obtained from CE-318 and AE-31 instruments, which were installed on the roof of the State Key Laboratory of Information Engineering in Surveying, Mapping, and Remote Sensing (114°21′ E, 30°32′ N) in Wuhan University, Wuhan, China. The CE-318 takes direct Sun measurements with a 1.2° full field of view at 340, 380, 440, 500, 675, 870, 940, 1020, and 1640 nm, and measures sky radiance in the almucantar and principal planes geometries, at 440, 675, 870, and 1020 nm [48]. To ensure its accuracy, it is calibrated annually from the China Meteorological Administration Aerosol Remote Sensing Network [49]. In the AE-31 instrument, BC mass concentration is calculated following the assumption that the light attenuation increases only because of light absorption due to BC accumulating on the filter [50,51]. According to the change in light attenuation, the AE-31 measures the mass concentration of BC in real time at seven spectral channels from 370 to 950 nm [52]. To obtain reliable data, abnormal values (i.e., absolute values that were three-fold greater than the hourly average) and values marked as a dead point by the instrument were eliminated. The BC data was subsequently averaged to a time resolution of 1 day in order to be aligned with other data. The atmospheric boundary layer height (BLH) used in this study was acquired from the European Centre for Medium-Range Weather Forecasts (ECMWF, https://www.ecmwf.int/, accessed on 15 November 2020) ERA5 dataset [53]. In addition, the vertical distribution of atmospheric aerosols, characterized by extinction coefficients at 532 nm from Cloud-Aerosol Lidar with Orthogonal Polarization (CALIOP) Version 4.20_Level 2–5 km aerosol profile products [54,55], was used to calculated ARF.
Note that the above data were matched with PM2.5 (particulate matter with aerodynamic diameter less than 2.5 μm) data. The daily average mass concentrations of PM2.5 observed at the monitoring site of East Lake Liyuan (30°34′ N, 114°22′ E; the nearest to the location of CE-318 and AE-31) were obtained from the China National Environmental Monitoring Centre (http://www.cnemc.cn/, accessed on 15 November 2020). In order to compare the aerosol properties and their radiative effects under different particulate pollution conditions, we divided the particulate pollution conditions according to PM2.5 mass concentration. The period with a mass concentration of PM2.5 in the range of 0−75 μg m−3 was defined as the condition of clean air, and the period with a value greater than 75 μg m−3 was defined as the condition of polluted air. The threshold of 75 μg m−3 is based on the ambient air quality standards of China [56].
2.2. Retrieval of Aerosol Parameters
For atmospheric aerosols, their optical and microphysical properties were retrieved from CE-318 after cloud detection and screening with the algorithm proposed by Smirnov, et al. [57]. Based on the direct solar observations and sky radiance at 440, 675, 870, and 1020 nm, SSA, asymmetry factor (AF), and volume size distribution (VSD) were calculated according to the method proposed by Dubovik and King [58]. The estimated uncertainty of SSA related to the aerosol load and type is between 0.03 and 0.07, and the uncertainty for VSD is less than 10% in the particle size range of 0.1 to 0.7 μm [58,59]. The Ångström exponent (α) was computed from AOD at 440 and 870 nm in accordance with the relationship of AOD and wavelength () [60]. Further details about the instrument characteristics and aerosol retrievals are given elsewhere [61]. The absorbing aerosol optical depth (AAOD) can characterize the contribution of absorbing aerosols to total atmospheric aerosols, and was estimated following Equation (1):
The optical parameters of BC aerosols were calculated from OPAC with BC number concentration (unit: 1 particle cm−3) and BLH (unit: km) as inputs. OPAC is an aerosol and cloud optical properties software package composed of a dataset and a FORTRAN program [50]. The built-in dataset contains microphysical properties and optical properties of cloud and aerosol components under different humidity conditions. The FORTRAN program not only allows users to extract data from this dataset, but also to estimate the optical properties of user-defined mixtures [62,63]. In this study, we defined a new aerosol type by setting the number concentration of the soot component and the corresponding height profile. The number concentration of soot provided as an input into OPAC was scaled appropriately from the measured BC mass concentration. The vertical distribution of the soot component is described by means of exponential profiles. More details are given by [50].
For the components other than BC, their AOD was calculated by subtracting BC AOD from the total AOD, and the corresponding SSA () and AF () were acquired following Equations (2) and (3), respectively [64]:
2.3. Calculation of Aerosol Radiative Forcing
Because atmospheric aerosols affect the Earth’s energy balance primarily through scattering and absorption of shortwave radiation, the radiative effect of total aerosols and BC were estimated in the shortwave (280–2800 nm) using the Discrete Ordinates Radiative Transfer Code (DISORT), implemented in the SBDART model [2,65]. The SBDART model contains 6 standard atmospheric profiles, 5 basic surface types, 4 standard aerosol types, and vertical distribution models of aerosols, which offer users default values for input parameters; however, users can also specify real values of these parameters. In this study, in addition to the optical parameters (such as AOD, SSA, AF, and α) of atmospheric aerosols and BC, the input to the SBDART model includes total water and ozone column content obtained from the Level 3 data of the Atmospheric Infrared Sounder (AIRS) onboard the satellite Aqua [66], surface albedo obtained from Moderate Resolution Imaging Spectroradiometer (MODIS) 16 day product (MCD43C3) [67], and atmospheric aerosol extinction profiles at 532 nm from CALIOP. As shown in Figure 1, the aerosol extinction coefficients below 3 km increased significantly with decreasing altitude as aerosols are concentrated near the surface. In addition, the maximum coefficients (0.28–0.50 km−1) were observed at the lowest detectable altitude in all seasons. Particularly during polluted-air days in winter, the average value of the extinction coefficients was around 0.50 km−1 below 500 m.
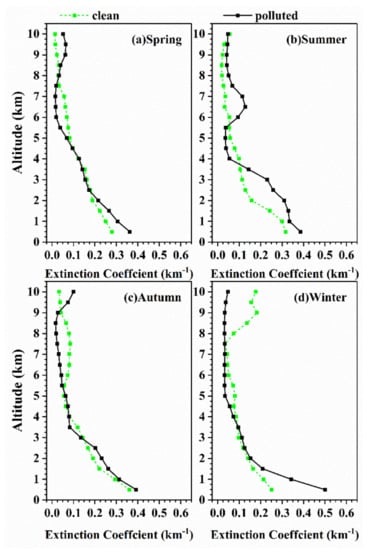
Figure 1.
Multi-year seasonal mean vertical profiles of extinction coefficient in (a) spring; (b) summer; (c) autumn; (d) winter over Wuhan, China from 2013 to 2016 under different particulate air pollution conditions.
The main outputs of the simulations were downward and upward fluxes at the top of the atmosphere (TOA) and at the bottom of the atmosphere (BOA). The ARF, denoted as , is defined as the difference between the net solar radiation balance in the presence of aerosol () and without aerosols () [68]. The formulas are as follows:
where and indicate upward and downward solar radiation, respectively. In a similar manner, BCRF (expressed as ), can be calculated by Equation (8) [64]:
Based on Equations (6) and (8), ARF and BCRF at the TOA and at the BOA were calculated. Thereafter, ARF (BCRF) in the atmosphere (ATM) was acquired by subtracting the ARF (BCRF) at TOA and BOA.
Because the solar zenith angle has an influence on the incident radiation, the scattering phase function of aerosols, and the calculation of radiation effects [1,65,69,70], it was limited to 60° ± 5° [8].
3. Results and Discussion
3.1. Aerosol Optical and Microphysical Properties
3.1.1. Mass Concentration and AOD of BC
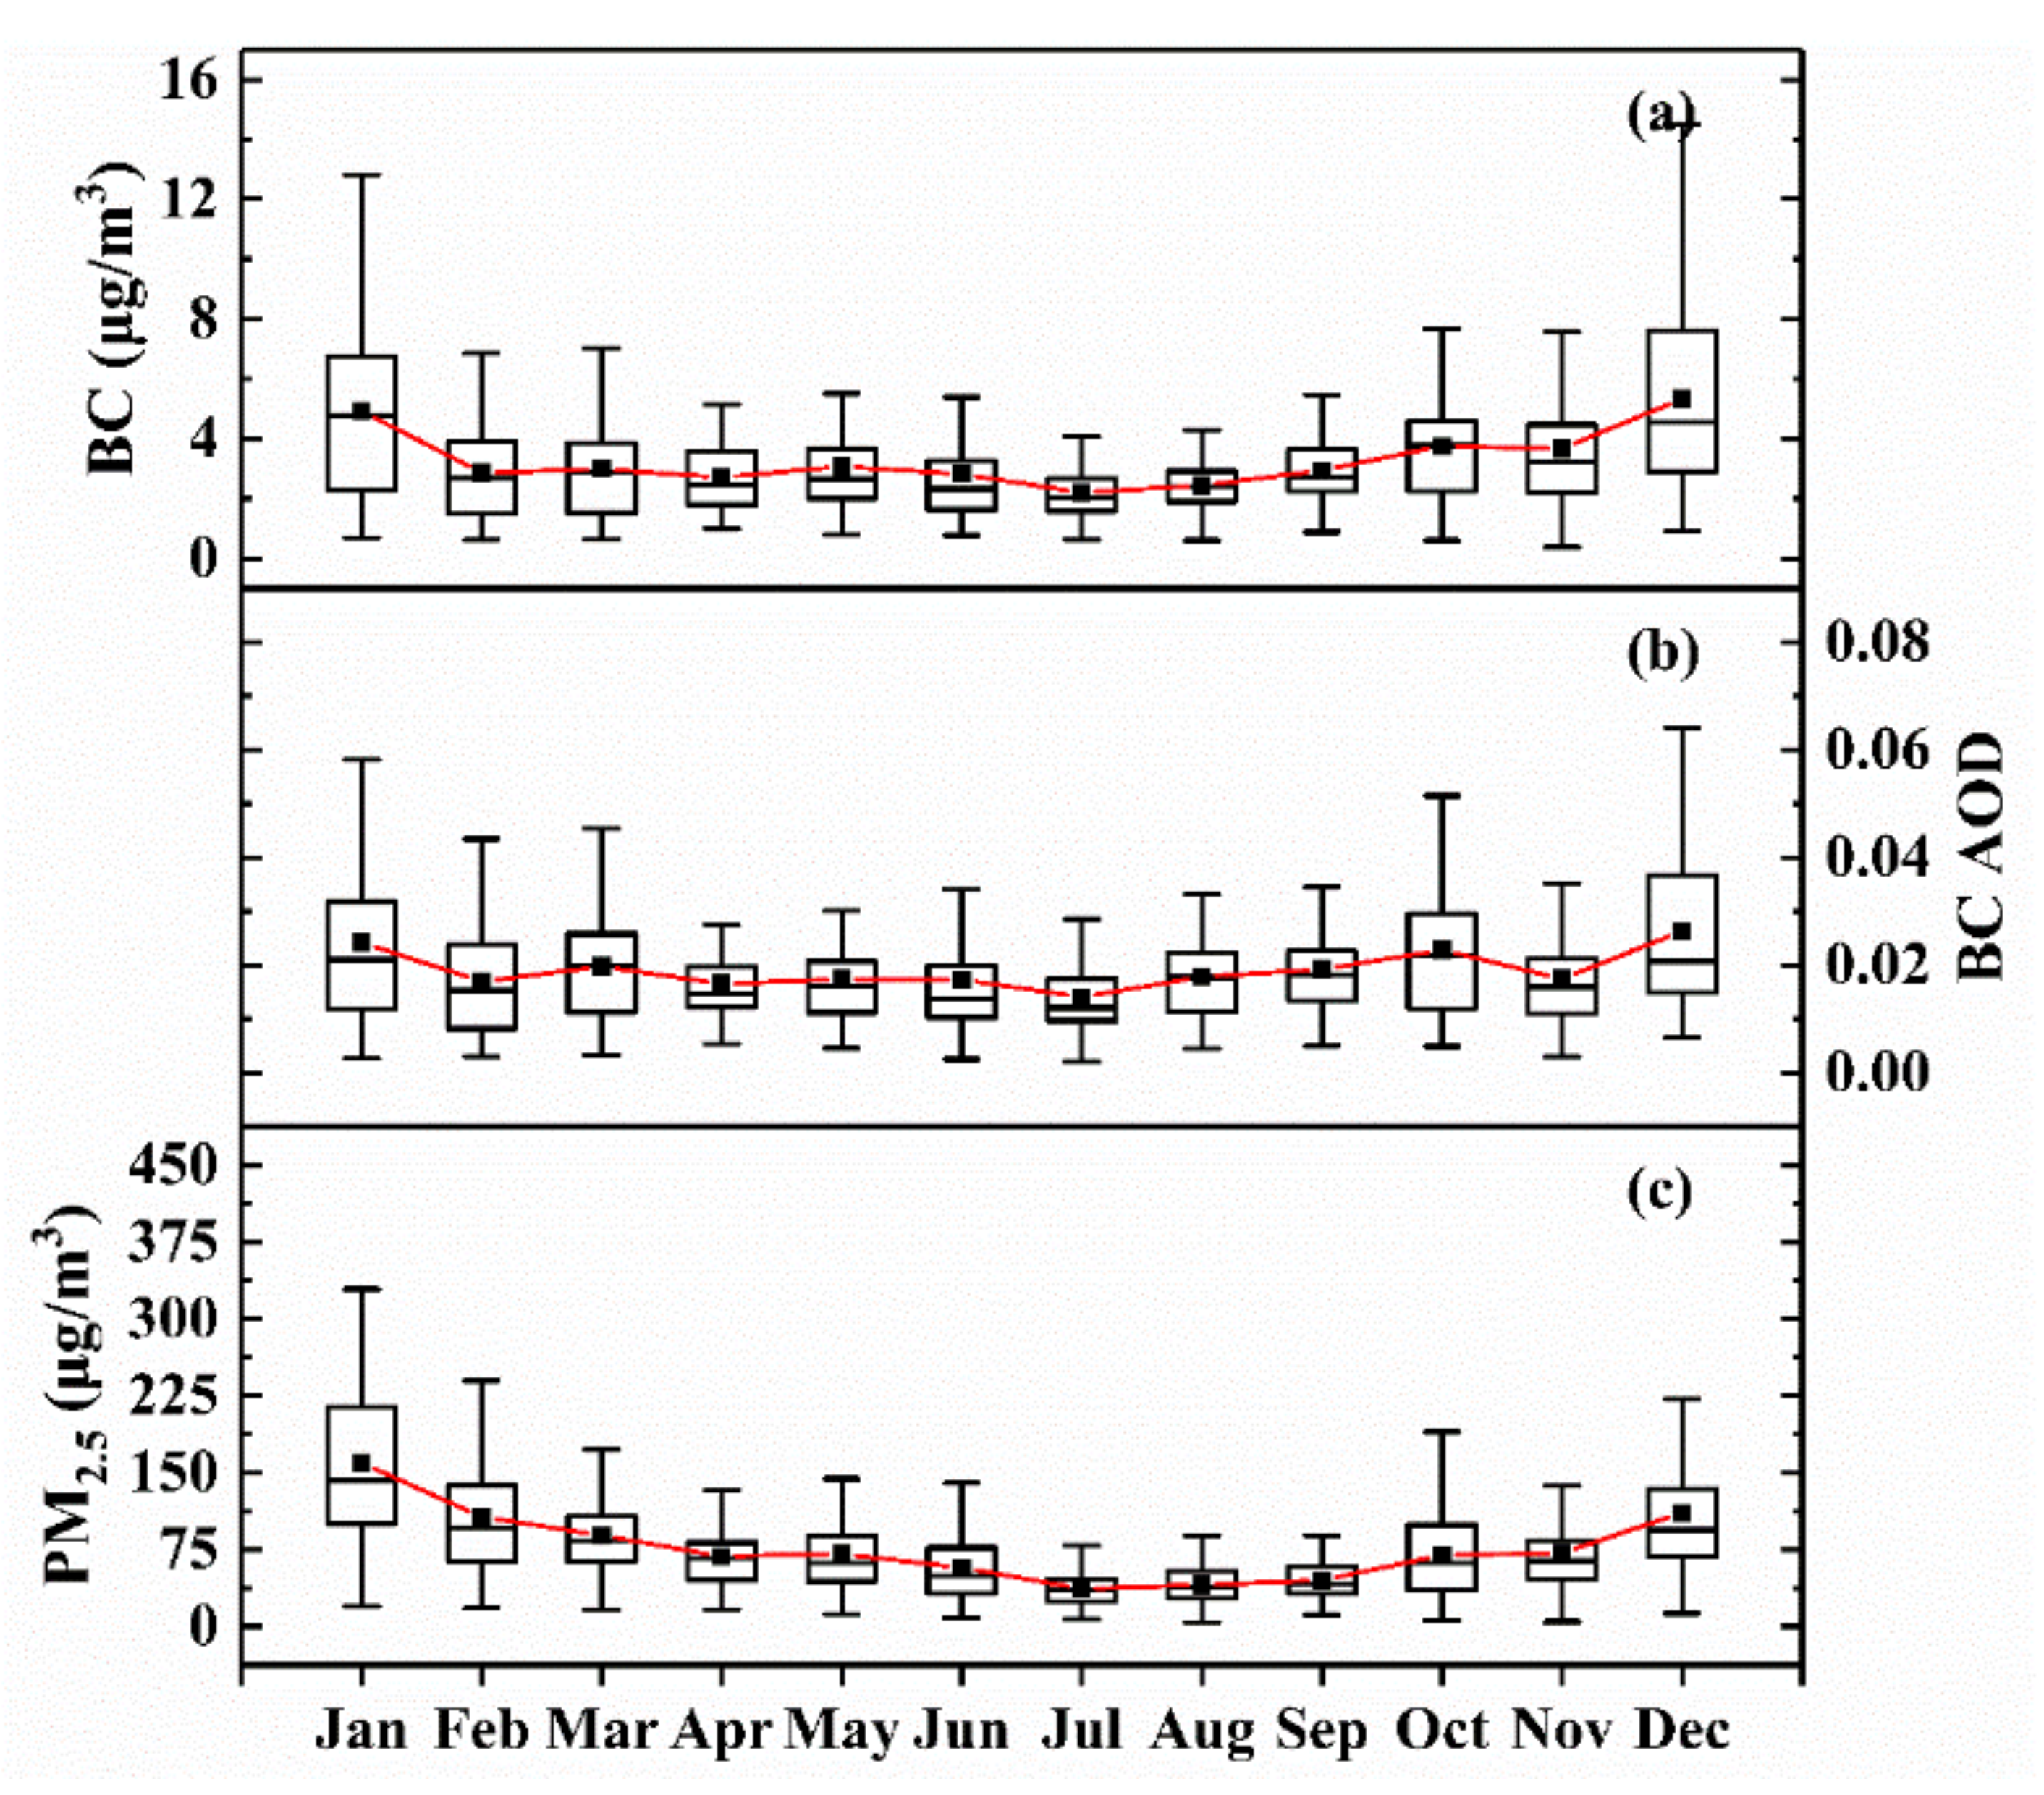
Temporal variations in BC mass concentration, BC AOD, and PM2.5 mass concentration over Wuhan from 2013 to 2016 are illustrated in Figure 2, showing similar monthly change patterns. The values of BC concentration and BC AOD slightly decreased from January to February, and fluctuated gently from February to July, and then gradually increased until December. The maximum of BC mass concentration and BC AOD occurred in December (5.33 ± 3.11 μg m−3 and 0.026 ± 0.015, respectively), and the minimum occurred in July (2.19 ± 0.93 μg m−3 and 0.014 ± 0.007, respectively). Therefore, the PM2.5 mass concentration in July was the smallest, with a value of 36.92 ± 17.35 μg m−3, and the maximum of PM2.5 mass concentration (159.61 ± 62.94 μg m−3) was observed in the winter month (January). The seasonal variation of BC mass concentration over Wuhan was similar to those over other cities in China (such as Xi’an, Xiamen, and Xuzhou); that is, its values were higher in spring and winter, and lower in summer and autumn [21,71,72]. The monthly changes in BC are mainly influenced by local emissions. According to the China Statistical Yearbook, the main source of energy production and consumption in China is coal. The high rates of usage of coal are primarily responsible for high BC emissions [69,70]. In winter, as heating activities increase, coal burning increases, leading to a dramatic increase in fine-mode anthropogenic aerosols such as BC. In addition, stable atmospheric conditions in winter have an influence on BC [71]. The temperature and BLH in winter is low, and atmospheric convection activity is not vigorous, which is not conducive to the dispersion of air pollutants, thus promoting the accumulation of aerosols on the surface and maintaining their concentration at a high level. Moreover, Wuhan is located in the subtropical monsoon climate zone, with frequent rainfall in summer [72,73], which may reduce the BC concentration [74].
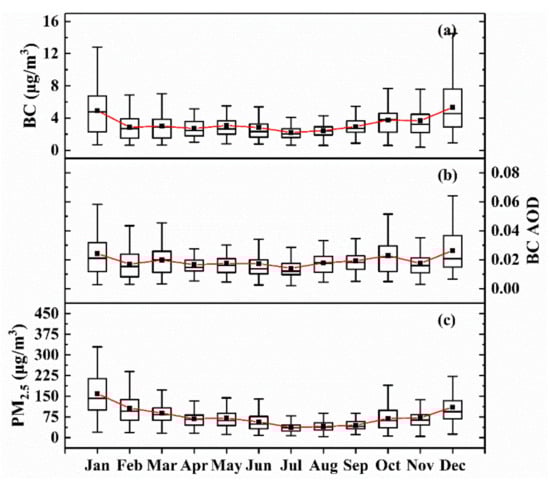
Figure 2.
Monthly variation of (a) BC mass concentration; (b) BC AOD; (c) PM2.5 mass concentration over Wuhan from 2013 to 2016. The red lines are the connection of the monthly averages over the years, and the vertical bars correspond to one standard deviation from the mean.
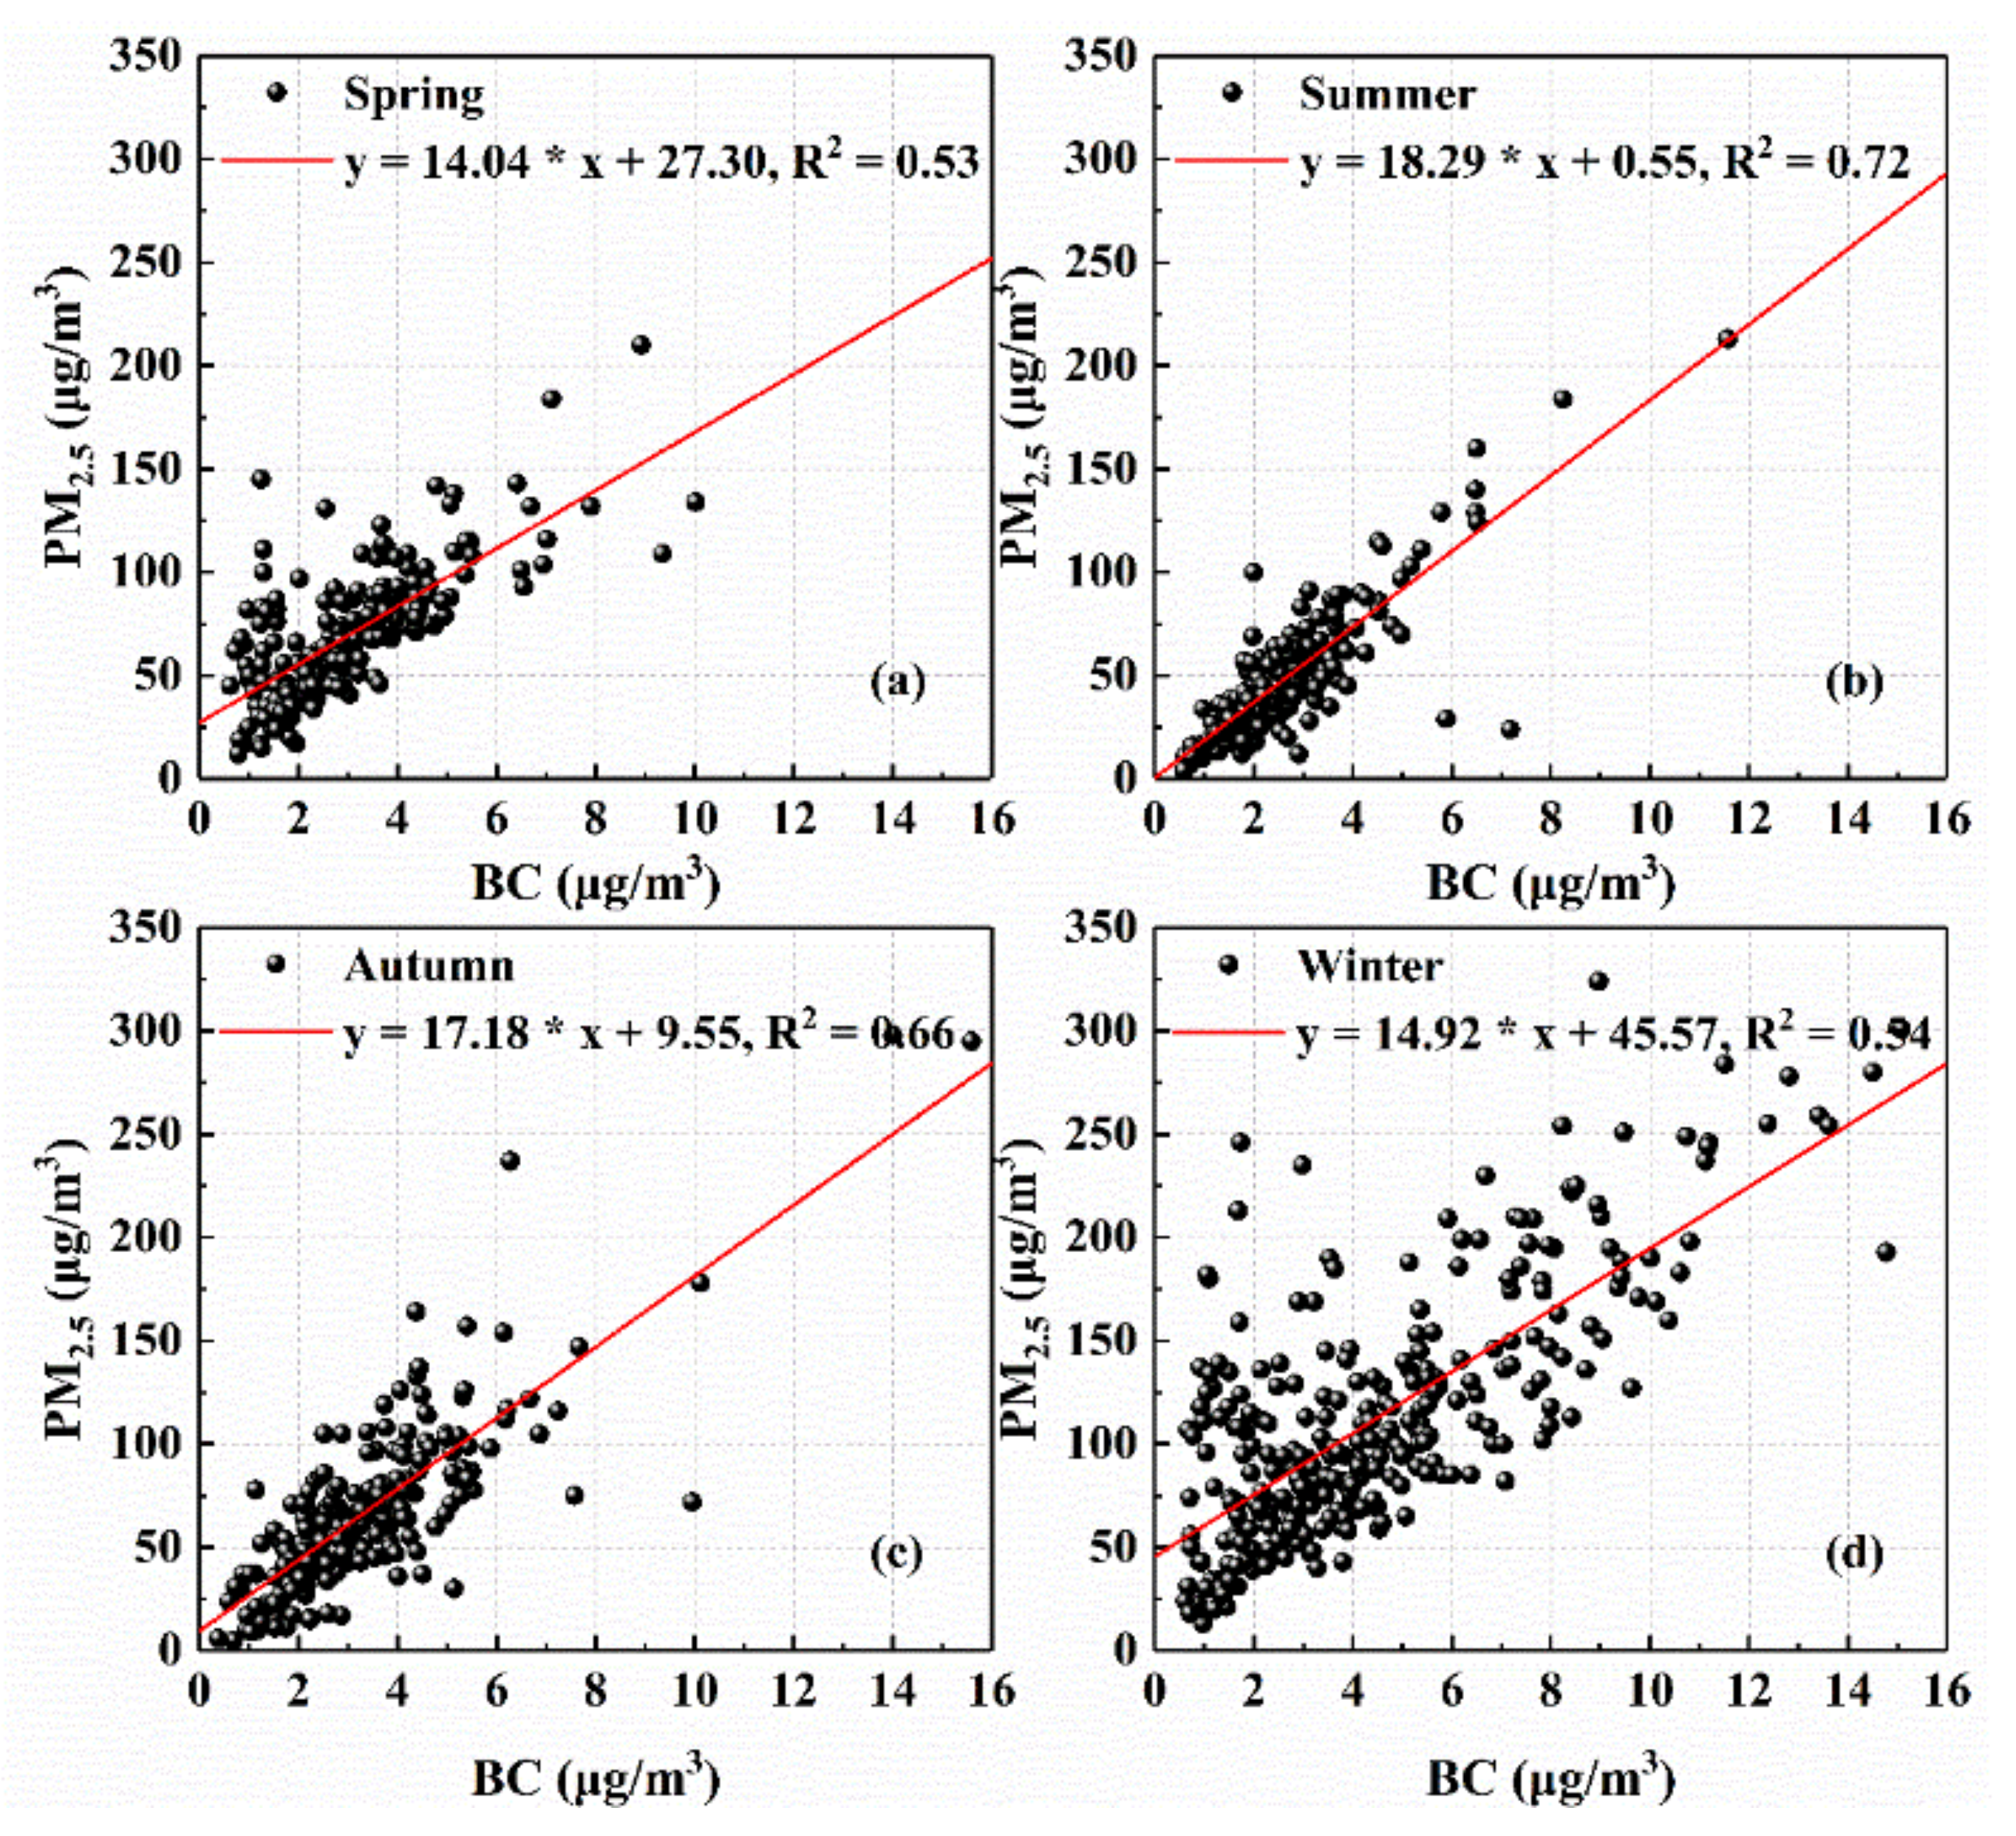
As shown in Figure 2, the multi-year monthly changes in the concentration of BC and PM2.5 had similar trends, so we explored the correlation between BC and PM2.5 in different seasons. Figure 3 describes the dependence of daily PM2.5 on BC mass concentration over Wuhan. The smallest R2 (0.53) was observed in spring whereas the largest R2 (0.72) appeared in summer. The high correlation between PM2.5 and BC indicates that the increase in PM2.5 was accompanied by the increase in BC; that is, the contribution of BC to PM2.5 was stable, with a mean fraction of 5.1%. In addition, it is worth noting that the scattered points in the areas with high PM2.5 and low BC values in Figure 3a,d caused the low R2 in spring and winter, revealing a dramatic change in the proportion of particles other than BC. This result may be related to the long-range transport of dust in spring and the water-soluble non-absorbing fine-mode particles in winter [75,76,77].
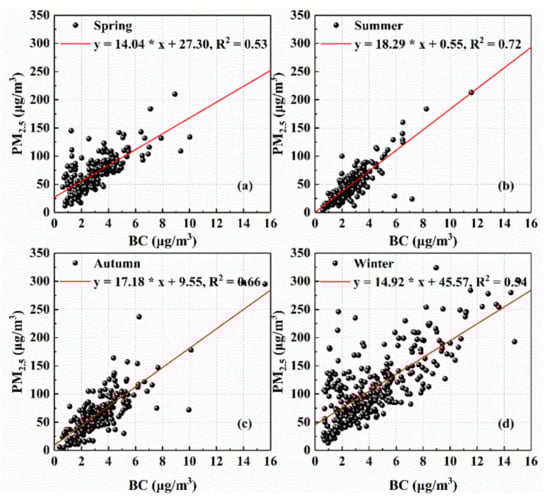
Figure 3.
Relationship between the mass concentration of BC and PM2.5 in (a) spring; (b) summer; (c) autumn; (d) winter over Wuhan from 2013 to 2016. The red lines in the plots represent the linear fitting.
3.1.2. Optical and Microphysical Properties of Total Aerosols
The multi-year seasonal mean of the total atmospheric aerosol optical properties is shown in Figure 4. During clean-air periods, AOD values in spring, summer and autumn were similar and the lowest value (0.49 ± 0.27) was observed in winter. During polluted-air periods, the maximum of AOD (1.75 ± 0.20) occurred in summer whereas the minimum (1.01 ± 0.43) occurred in autumn. The enhancement in the aerosol extinction effect, reflected by the increase in AOD, is attributed to the changes in the absorption and scattering characteristics caused by factors such as aerosol load and size.
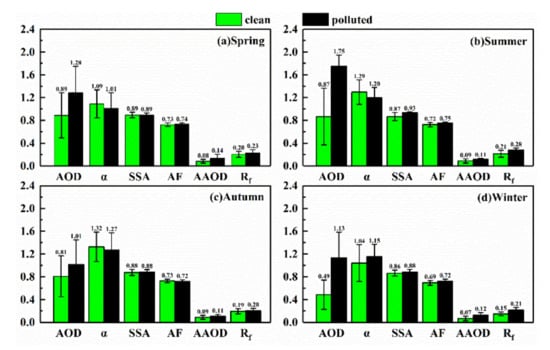
Figure 4.
Multi-year seasonal mean of aerosol optical properties in (a) spring; (b) summer; (c) autumn; (d) winter over Wuhan, China from 2013 to 2016. All parameters shown in this figure are at 440 nm except for α. The digital labels indicate the average values of aerosol optical parameters, and the vertical bars correspond to one standard deviation from the mean.
SSA refers to the ratio of scattered radiation to the total radiation (also called “attenuation”, that is, the sum of scattering and absorption), and AF reflects the ratio of forward scattering, with a value ranging from −1 to 1. For fine-mode particles, generally the larger the particle, the larger the AF value, which means more forward scattering. In spring and autumn, the values of SSA and AF were similar under the two conditions. However, in summer and winter, the values of SSA changed significantly. The SSA rose from 0.87 to 0.93 in summer, and from 0.86 to 0.88 in winter. The AF gently changed from 0.72 to 0.75 in summer and from 0.69 to 0.72 in winter. The rise in SSA implies that the ratio of scattered radiation increased; that is, the ratio of absorbing and non-absorbing aerosol particles changed significantly under polluted-air conditions. In addition, the result of AF reveals that the size of fine-mode particles may increase in summer and winter.
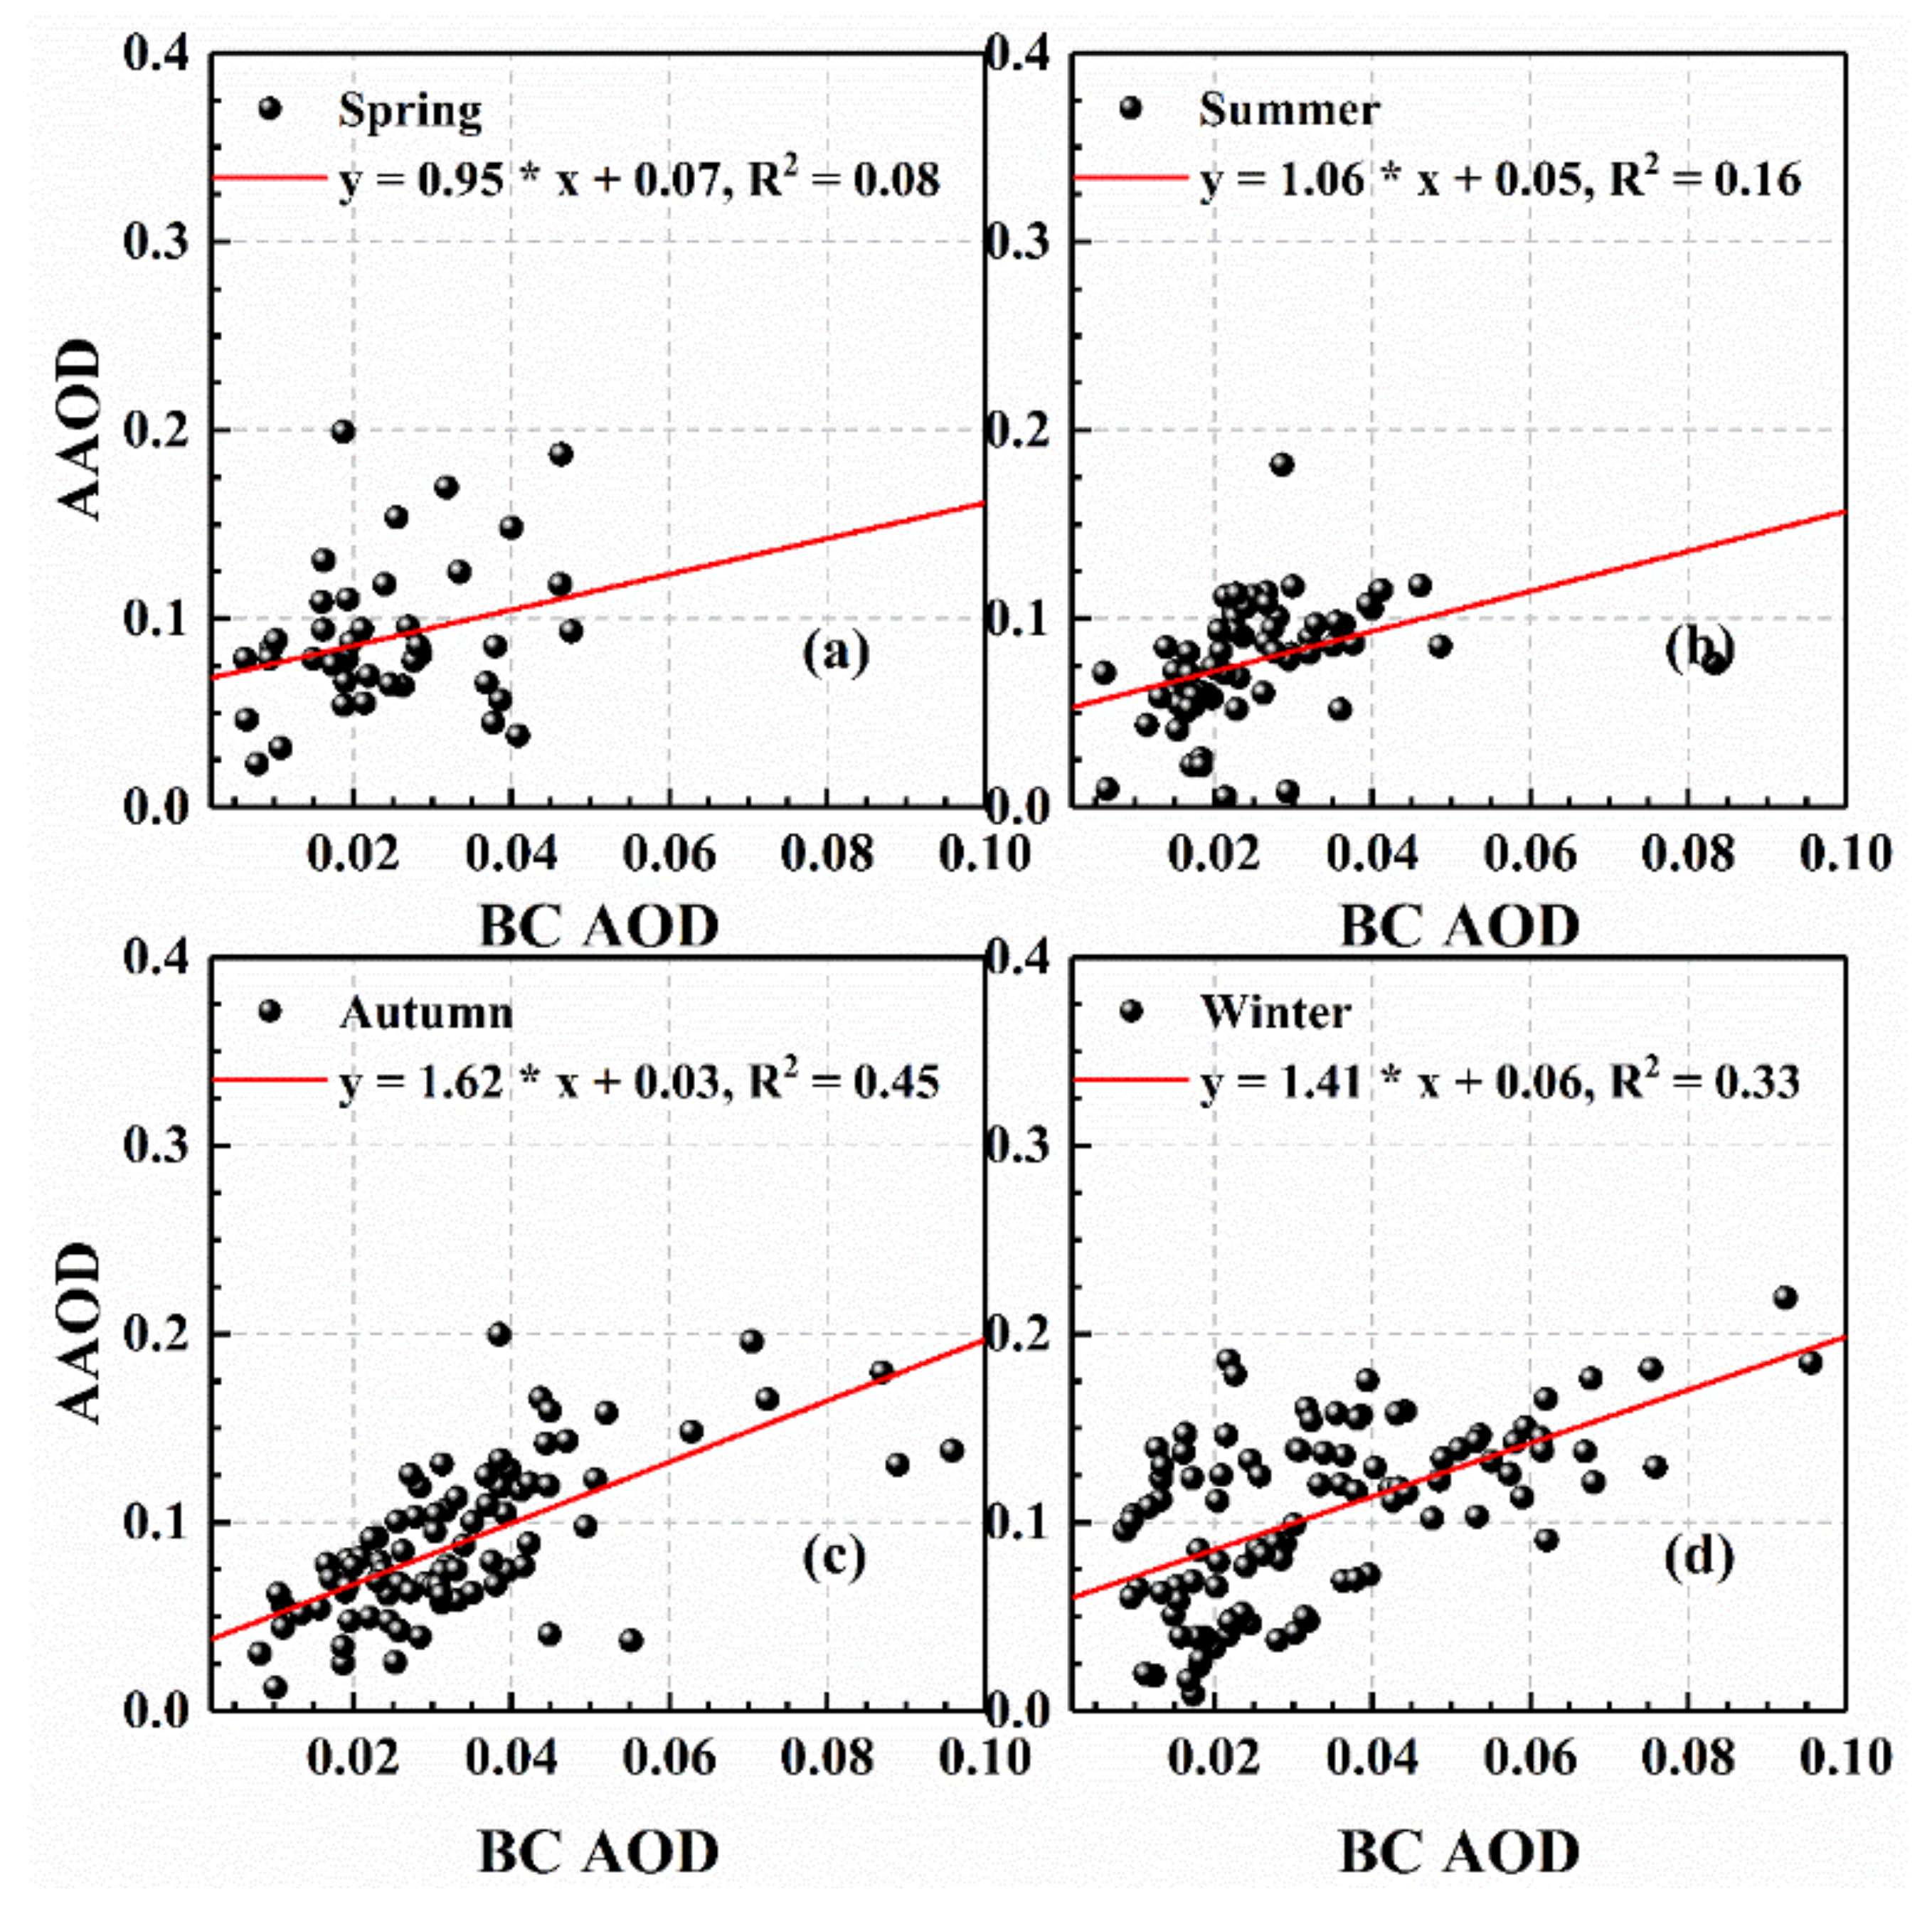
However, AAOD values during polluted-air periods were higher than those during clean-air periods in all seasons, despite the increase in the proportion of scattered radiation in summer and winter. In particular, the average AAOD values in winter over Wuhan were greater than 0.10, whereas the results measured in other regions of China, such as Hangzhou, Shanghai, and Guangzhou, were relatively smaller (AAOD ~0.05 in winter) [78,79]. This may be attributed to the high load of absorbing aerosol particles (such as BC and other organic carbon) in Wuhan, which originate from automobile exhaust emissions, industrial production, and the burning of crops such as straw [80,81]. In addition, the increase in these particles will promote air pollution over Wuhan. Therefore, the relationship between AAOD and BC AOD was studied, as shown in Figure 5. The results reveal that the correlation between the two was relatively stronger in autumn and winter than that in spring and summer, with R2 reaching 0.45 and 0.33, respectively. Moreover, although BC accounted for a small proportion of PM2.5, the multi-year seasonal average proportion of BC AOD in AAOD was greater than 22% in all seasons, with a mean value of 25.8%. Compared with winter, the values of AAOD in summer also increased obviously, from 0.08 to 0.14, but the corresponding R2 between BC AOD and AAOD was lower. Dust transported from the northwest region to Wuhan may cause this result, because dust with iron and organic carbon components displays significant absorption at shortwave region [82,83]. In addition, BC transported from surrounding regions at a relatively high altitude is difficult to measure accurately using the Aethalometer in summer [41].
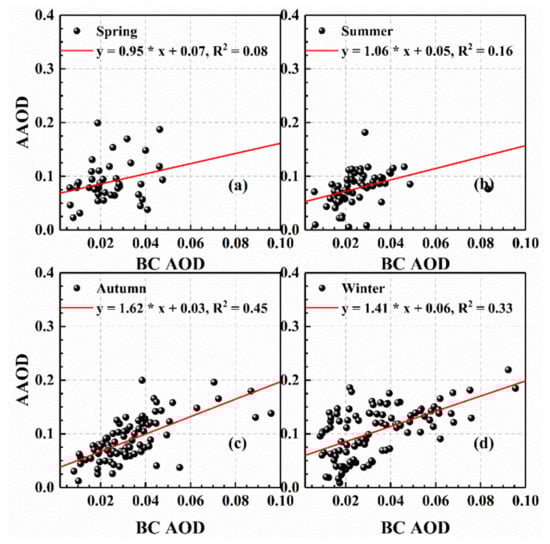
Figure 5.
Dependence of AAOD on BC AOD in (a) spring; (b) summer; (c) autumn; (d) winter over Wuhan, China from 2013 to 2016. The red lines in the plots are the linear fitting.
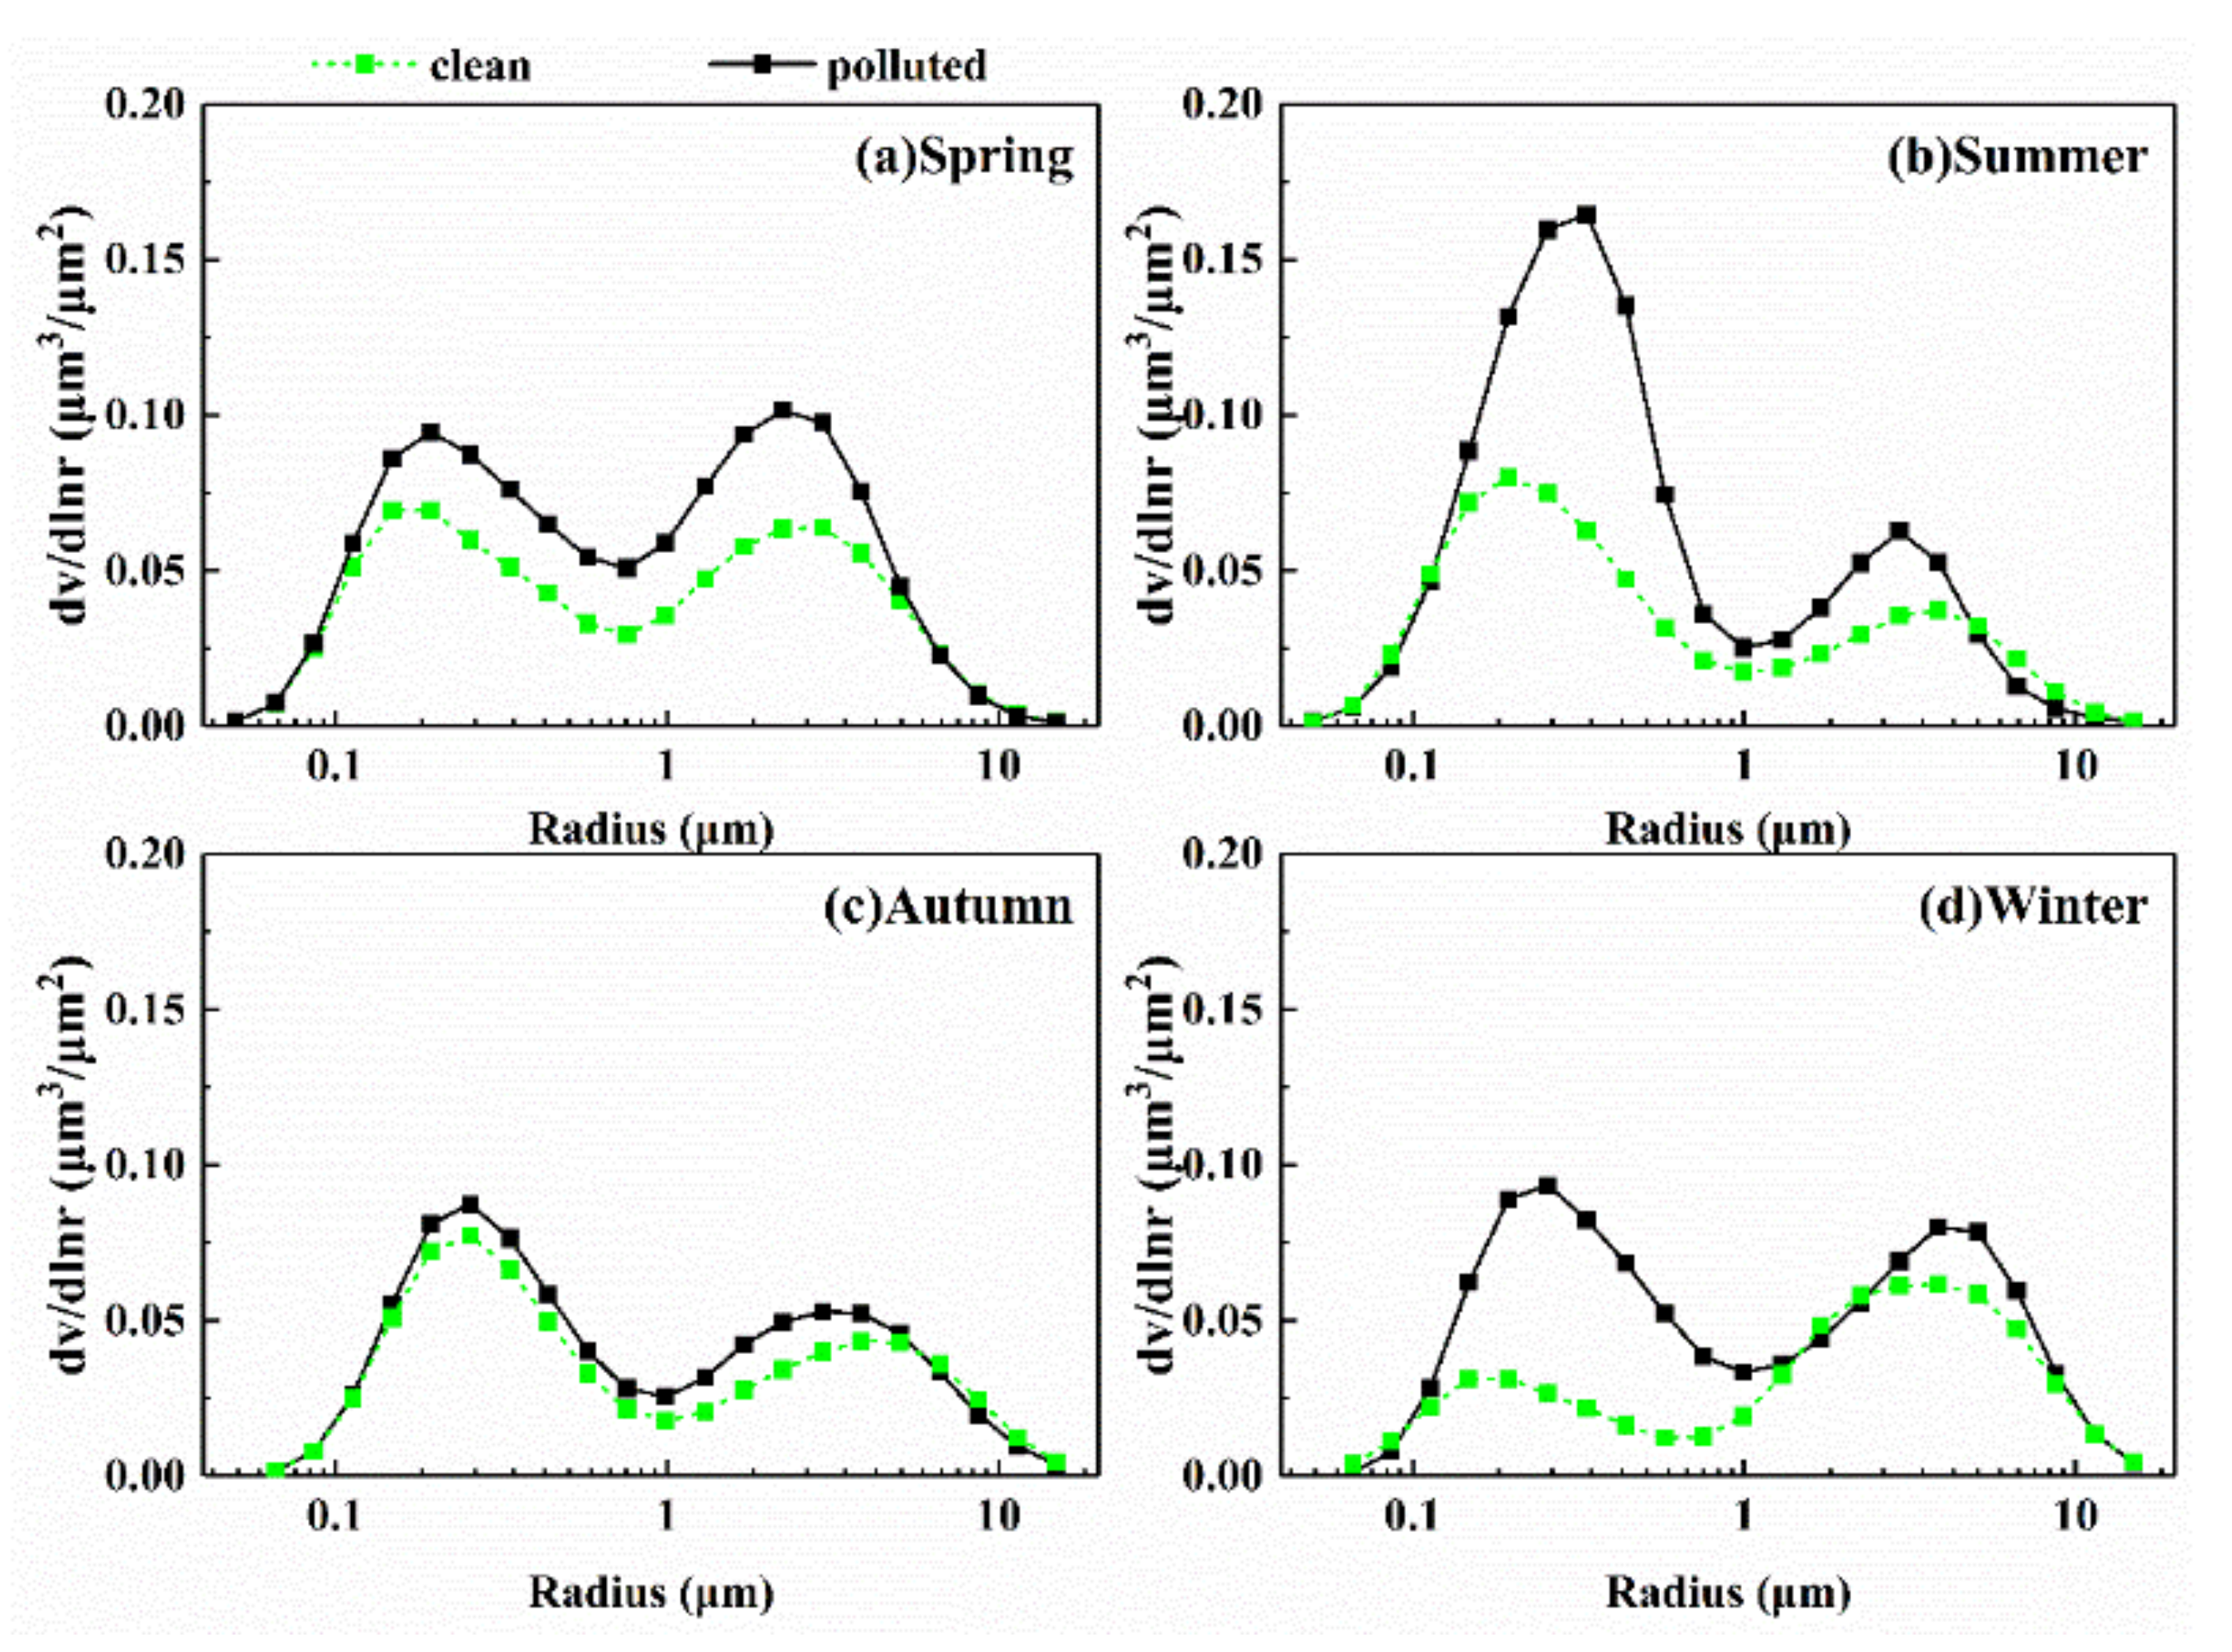
The optical properties of aerosols strongly depend on VSD, which is closely related to α, the fine-mode fraction (FMF) [84,85]. To determine the change in aerosol particle size under different particulate pollution conditions, the multi-year seasonal mean VSD was investigated. Figure 6 shows the seasonal-mean changes in VSD under different particulate air pollution conditions in Wuhan, revealing a bimodal size distribution dependent on multiple factors such as growth of large particles by condensation of the gas-phase reaction, mixing of two air masses, and meteorological parameters [86]. In comparison with clean-air days, on polluted-air days, the peak of fine/coarse-mode particles in different seasons increased to different degrees. Among these, the variations in the peak of fine/coarse-mode particles in spring were small and in autumn were almost negligible. However, the characteristics of VSD on polluted-air days changed significantly in summer and winter, especially for fine-mode particles, which explains the change in AF. In summer, due to the high humidity caused by abundant rain and high temperature, leading to fine-mode aerosol hygroscopic growth and secondary aerosol generation [40], the peak of fine-mode particles increased sharply to 0.165 μm3 μm−2 and the corresponding volume geometric radius changed from 0.194 to 0.335 μm. In winter, the dominant particles changed from coarse mode to fine mode, and the peak of fine-mode particles increased nearly two-fold, reaching 0.093 μm3 μm−2, indicating an influence of the anthropogenic aerosols. It is worth mentioning that fine-mode aerosol particles with a large size would have strong extinction effects on solar radiation, leading to a high AOD value (Figure 4b,d).
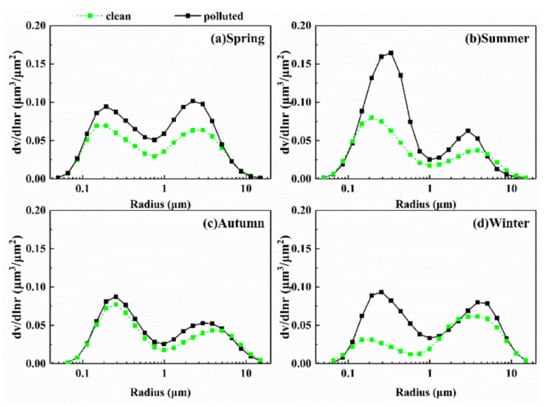
Figure 6.
Multi-year seasonal mean of the volume size distribution (VSD) in (a) spring; (b) summer; (c) autumn; (d) winter over Wuhan, China under different particulate air pollution conditions from 2013 to 2016.
In terms of α, its values under polluted-air conditions are generally larger than those under clean-air conditions, such as the variation in α in winter (Figure 4d). However, in comparison with clean-air conditions, the α values under polluted-air conditions decreased in spring, summer, and autumn. One of the reasons for the abnormal change in α may be the variation in fine-mode particle size [40]: in spring and autumn, the change in Rf (which represents the median radius of fine-mode particles) shows that the size of the fine-mode particles increased, although the magnitude was not obvious; in summer, high temperature and humidity over Wuhan caused the size of fine-mode particles to increase sharply.
3.2. Aerosol Radiative Forcing
3.2.1. Radiative Effects of Total Atmospheric Aerosols
As described in Section 2.3, ARF and BCRF at TOA, ATM, and BOA were calculated through the SBDART model. Their seasonal average results under different particulate air pollution conditions are depicted in Figure 7. Negative radiative forcing indicates a cooling effect caused by aerosols; on the contrary, positive radiative forcing means a heating effect. Overall, total atmospheric aerosols have a heating effect on ATM and cooling effects on BOA and TOA, as shown in Figure 7a.
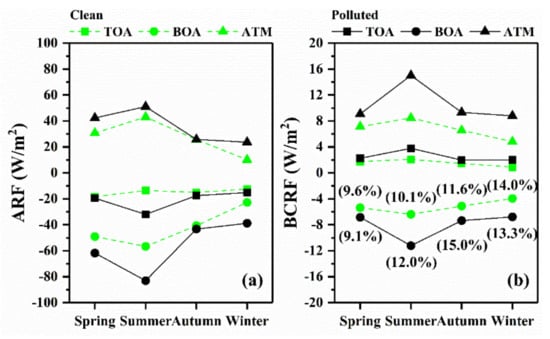
Figure 7.
Multi-year seasonal mean of (a) ARF; (b) BCRF at TOA, BOA, and ATM in Wuhan, China from 2013 to 2016. The values in parentheses indicate the proportion of BCRF in the corresponding ARF at BOA.
Under the two air conditions, ARF at BOA and ATM show a strong seasonal variation, that is, strongest in summer, followed by spring and autumn, and the weakest in winter, which mainly depends on the incident solar radiation and the aerosol load. During clean-air periods, the values of ARF at TOA, BOA, and ATM varied from −18.36 to −12.50, −56.61 to −22.70, and 10.20 to 43.07 W m−2, respectively. During polluted-air periods, the values of ARF at TOA, BOA, and ATM varied from −31.96 to −15.18, −83.01 to −38.82, and 23.63 to 51.06 W m−2, respectively. The seasonal mean values and variation of ARF at BOA in Wuhan were similar to those observed in urban Nanjing [87], whereas relatively lower values and weaker seasonal variation of ARF at BOA were observed in urban Beijing, which is attributed to different driver factors of ARF [77,88]. In terms of the influence of different air conditions, the difference between ARF at TOA/BOA on clean-air days and on polluted-air days was the greatest in summer. The values of ARF at TOA/BOA in summer under polluted-air conditions were more than two-fold those under clean-air conditions. In addition, in spring, the values of ARF at BOA on polluted-air days were about one-quarter stronger than those on clean-air days, and in winter they increased by 71%. The results reveal the significant effect of air pollution on the ARF at BOA, which is consistent with the previous research [40,77].
3.2.2. Radiative Effects of BC
As a typical absorbing aerosol, BC aerosols cause a negative radiative forcing at BOA and a positive radiative forcing at TOA and ATM, as shown in Figure 7b. Similar to the seasonal pattern of ARF, on clean-air days, the absolute values of BCRF at TOA, BOA, and ATM were highest in summer, followed by spring and autumn, and the lowest in winter. During clean-air periods, the values of BCRF at TOA, BOA, and ATM changed from 0.90 to 2.09 W m−2, −6.38 to −3.92 W m−2 and 4.82 to 8.47 W m−2, respectively. On polluted-air days, BCRF at TOA, BOA, and ATM show a weak seasonal variation pattern. During polluted-air periods, the highest BCRF values at TOA, BOA, and ATM were 3.80 W m−2 ( + 1.71 W m−2, where means the difference between BCRF on polluted-air days and clean-air days), −11.22 W m−2 ( − 4.84 W m−2), and 15.02 W m−2 ( + 6.55 W m−2), respectively. Similarly, the strongest BCRF in summer is associated with the strongest incident solar radiation in this season. The numerical labels in parentheses in Figure 7b represent the percentage contribution of BCRF at BOA to ARF at BOA in the corresponding period (namely, the same season and air condition). Although the proportion of BC in PM2.5 was only 5.1%, the average contribution of BCRF to ARF was as high as 13.8%, showing a significant contribution of BC on ARF.
In terms of the impact of different air conditions on radiative forcing, degrees of enhancement in BCRF varied with different seasons. Compared with the contribution fraction of BCRF at BOA under clean-air conditions, the contribution fraction under polluted-air conditions increased from 10.1% to 12.0% and 11.6% to 15.0% in summer and autumn, respectively, indicating that the contribution of BC to the total atmospheric aerosols increased because of air pollution. In addition, in comparison with the BCRF at BOA on clean-air days, the BCRF at BOA on polluted-air days increased by 76% and 73% in summer and winter, respectively. The enhancement in BCRF at BOA associated with air pollution was considerably greater than that estimated in urban Beijing (~18%) [89]. The high ratios in summer may be attributed to the change in the mixing state of BC, which is associated with fine-mode aerosol hygroscopic growth and secondary aerosol generation [89,90]. The particle mixing state plays a vital role in the aerosol radiative effect, especially for the mixing of anthropogenic pollution (such as BC) over East Asia [91]. The addition of non-BC materials to BC particles may enhance the light absorption of particles by 50% to 60% [92]. The high ratios in winter may be due to the high BC mass concentration and the interaction between aerosols and the planetary boundary layer. Ding, et al. [14] reported that the increase in absorbing aerosol (such as carbonaceous aerosols) can promote the occurrence of air pollution in China by depressing the development of the boundary layer.
4. Conclusions
In this study, the multi-year seasonal analysis of concentration, optical, and microphysical properties of total atmospheric aerosols and BC was conducted based on CE-318 and AE-31 observations and the OPAC model. To increase the knowledge about the properties of aerosols over Wuhan, China, and reduce the uncertainty in assessing the climate effects of BC, the radiative forcing due to atmospheric aerosols (total aerosol fraction) and the percentage contribution solely due to BC in total forcing, estimated by SBDART, were also investigated under different particulate pollution conditions. Thus, the quantitative evaluation results of total aerosols and BC in this study are helpful in quantifying the aerosol climatic effects over this region and comparing the climate responses due to different agents, both for policy decisions concerning mitigation and adaptation, and for the scientific understanding of the relative importance of the forcing agents.
The multi-year monthly mean BC concentration and BC AOD varied from 2.19 to 5.33 μg m−3 and 0.014 to 0.026, respectively, and PM2.5 concentration changed from 36.92 to 159.61 μg m−3. The results show that the monthly variations in BC and PM2.5 had a strong consistency, with the smallest R2 (0.53) in spring and the largest R2 (0.72) in summer. The values of AOD under polluted-air conditions were higher than those under clean-air conditions in all seasons, especially in summer, with a value of 1.75. The SSA increased from 0.87 to 0.93 and 0.86 to 0.88 in summer and winter, indicating that the ratio of absorbing and non-absorbing aerosol particles changed significantly. Furthermore, the AF changed from 0.72 to 0.75 and 0.69 to 0.72 in summer and winter. In addition, the VSD characteristics of fine-mode particles on polluted-air days changed dramatically in summer and winter. In particular, in summer, the peak of fine-mode particles increased sharply to 0.165 μm3 μm−2 and the corresponding volume geometric radius changed from 0.194 to 0.335 μm.
Under polluted-air conditions, ARF at BOA and ATM were strongest in summer, with values of −83.01 and 51.06 W m−2, respectively, and the weakest in winter, with values of −38.82 and 23.63 W m−2, respectively. This result mainly depends on the incident solar radiation and the aerosol load. The differences between ARF at TOA/BOA on polluted-air days and on clean-air days show the important influence of air condition on ARF, especially in summer. Under polluted-air conditions, the BCRF at BOA and ATM changed from −11.22 to −6.78 W m−2 and 8.80 to 15.02 W m−2, respectively. Although the proportion of BC in PM2.5 was small (~5.1%), the average fraction of BCRF to ARF reached 13.8%, showing a significant contribution of BCRF on ARF. In addition, compared with clean-air days, the BCRF at BOA on polluted-air days increased by 76% and 73% in summer and winter.
Author Contributions
Conceptualization, Y.M., R.F. and S.J.; methodology, Y.M. and S.J.; software, R.F.; validation, R.F.; formal analysis, R.F.; investigation, R.F.; resources, Y.M., R.F. and S.J.; data curation, R.F., Y.Z. and H.L.; writing—original draft preparation, R.F.; writing—review and editing, Y.M., R.F., S.J., X.M. and M.Z.; supervision, Y.M., S.J., X.M. and W.G.; project administration, R.F., B.L. and Y.S.; funding acquisition, Y.M., M.Z. and W.G. All authors have read and agreed to the published version of the manuscript.
Funding
This research was funded by the National Key R&D Program of China (Grant No. 2018YFB0504500), the National Natural Science Foundation of China (No. 41875038, No. 42071348, and No. 41905032), and the Open Research Fund of State Key Laboratory of Information Engineering in Surveying, Mapping and Remote Sensing, Wuhan University (Grant No. 19R03).
Data Availability Statement
The data presented in this study are available on request from the corresponding author.
Acknowledgments
We are grateful to the China National Environmental Monitoring Center, the NOAA ’s National Climatic Data Center, and the CALIPSO research team for their useful data. Finally, we thank all anonymous reviewers for their constructive comments.
Conflicts of Interest
The authors declare no conflict of interest.
References
- Ramaswamy, V.; Collins, W.; Haywood, J.; Lean, J.; Mahowald, N.; Myhre, G.; Naik, V.; Shine, K.P.; Soden, B.; Stenchikov, G.; et al. Radiative Forcing of Climate: The Historical Evolution of the Radiative Forcing Concept, the Forcing Agents and their Quantification, and Applications. Meteorol. Monogr. 2019, 59, 14.1–14.101. [Google Scholar] [CrossRef]
- Ricchiazzi, P.; Yang, S.; Gautier, C.; Sowle, D. SBDART: A Research and Teaching Software Tool for Plane-Parallel Radiative Transfer in the Earth’s Atmosphere. Bull. Am. Meteorol. Soc. 1998, 79, 2101–2114. [Google Scholar] [CrossRef] [Green Version]
- Albrecht, B.A. Aerosols, Cloud Microphysics, and Fractional Cloudiness. Science 1989, 245, 1227–1230. [Google Scholar] [CrossRef] [PubMed]
- Charlson, R.J.; Schwartz, S.E.; Hales, J.M.; Cess, R.D.; Coakley, J.A.; Hansen, J.E.; Hofmann, D.J. Climate Forcing by Anthropogenic Aerosols. Science 1992, 255, 423–430. [Google Scholar] [CrossRef]
- IPCC. Climate Change 2014: Synthesis Report. Contribution of Working Groups I, II and III to the Fifth Assessment Report of the Intergovernmental Panel on Climate Change; IPCC: Geneva, Switzerland, 2014; p. 151. [Google Scholar]
- Boucher, O.; Randall, D.; Artaxo, P.; Bretherton, C.; Feingold, G.; Forster, P.; Kerminen, V.M.; Kondo, Y.; Liao, H.; Lohmann, U.; et al. Climate Change 2013: The Physical Science Basis. Contribution of Working Group II of the Fifth Assessment Report of the Intergovernmental Panel on Climate Change; Cambridge University Press: Cambridge, UK; New York, NY, USA, 2013. [Google Scholar]
- Bond, T.; Streets, D.; Yarber, K.F.; Nelson, S.M.; Woo, J.; Klimont, Z. A technology-based global inventory of black and organic carbon emissions from combustion. J. Geophys. Res. Space Phys. 2004, 109, D14. [Google Scholar] [CrossRef] [Green Version]
- Haywood, J.; Boucher, O. Estimates of the direct and indirect radiative forcing due to tropospheric aerosols: A review. Rev. Geophys. 2000, 38, 513–543. [Google Scholar] [CrossRef]
- Jacobson, M.Z. Strong radiative heating due to the mixing state of black carbon in atmospheric aerosols. Nature 2001, 409, 695–697. [Google Scholar] [CrossRef] [PubMed]
- Bond, T.C.; Doherty, S.J.; Fahey, D.W.; Forster, P.M.; Berntsen, T.; DeAngelo, B.J.; Flanner, M.G.; Ghan, S.; Kaercher, B.; Koch, D.; et al. Bounding the role of black carbon in the climate system: A scientific assessment. J. Geophys. Res. Atmos. 2013, 118, 5380–5552. [Google Scholar] [CrossRef]
- Ramanathan, V.; Carmichael, G. Global and regional climate changes due to black carbon. Nat. Geosci. 2008, 1, 221–227. [Google Scholar] [CrossRef]
- Bastien, L.A.J.; McDonald, B.C.; Brown, N.J.; Harley, R.A. High-Resolution Mapping of Sources Contributing to Urban Air Pollution Using Adjoint Sensitivity Analysis: Benzene and Diesel Black Carbon. Environ. Sci. Technol. 2015, 49, 7276–7284. [Google Scholar] [CrossRef]
- Deng, J.; Zhang, Y.; Hong, Y.-W.; Xu, L.; Chen, Y.; Du, W.; Chen, J. Optical properties of PM2.5 and the impacts of chemical compositions in the coastal city Xiamen in China. Sci. Total Environ. 2016, 557–558, 665–675. [Google Scholar] [CrossRef]
- Ding, A.; Huang, X.; Nie, W.; Sun, J.N.; Kerminen, V.; Petäjä, T.; Su, H.; Cheng, Y.; Yang, X.; Wang, M.H.; et al. Enhanced haze pollution by black carbon in megacities in China. Geophys. Res. Lett. 2016, 43, 2873–2879. [Google Scholar] [CrossRef]
- Fan, J.; Rosenfeld, D.; Yang, Y.; Zhao, C.; Leung, L.R.; Li, Z. Substantial contribution of anthropogenic air pollution to catastrophic floods in Southwest China. Geophys. Res. Lett. 2015, 42, 6066–6075. [Google Scholar] [CrossRef]
- Peng, J.; Hu, M.; Guo, S.; Du, Z.; Zheng, J.; Shang, D.; Zamora, M.L.; Zeng, L.; Shao, M.; Wu, Y.-S.; et al. Markedly enhanced absorption and direct radiative forcing of black carbon under polluted urban environments. Proc. Natl. Acad. Sci. USA 2016, 113, 4266–4271. [Google Scholar] [CrossRef] [PubMed] [Green Version]
- Janssen, N.A.; Hoek, G.; Simic-Lawson, M.; Fischer, P.; Van Bree, L.; ten Brink, H.; Keuken, M.; Atkinson, R.W.; Anderson, H.R.; Brunekreef, B.; et al. Black Carbon as an Additional Indicator of the Adverse Health Effects of Airborne Particles Compared with PM10 and PM2.5. Environ. Health Perspect. 2011, 119, 1691–1699. [Google Scholar] [CrossRef] [PubMed] [Green Version]
- Zhao, J.; Liu, Y.; Shan, M.; Liang, S.; Cui, C.; Chen, L.; Gao, S.; Mao, J.; Zhang, H.; Sun, Y.; et al. Characteristics, potential regional sources and health risk of black carbon based on ground observation and MERRA-2 reanalysis data in a coastal city, China. Atmos. Res. 2021, 256, 105563. [Google Scholar] [CrossRef]
- Huang, X.-F.; Sun, T.-L.; Zeng, L.-W.; Yu, G.-H.; Luan, S.-J. Black carbon aerosol characterization in a coastal city in South China using a single particle soot photometer. Atmos. Environ. 2012, 51, 21–28. [Google Scholar] [CrossRef]
- Wang, Q.Y.; Huang, R.-J.; Cao, J.J.; Tie, X.X.; Ni, H.Y.; Zhou, Y.Q.; Han, Y.M.; Hu, T.F.; Zhu, C.S.; Feng, T.; et al. Black carbon aerosol in winter northeastern Qinghai–Tibetan Plateau, China: The source, mixing state and optical property. Atmos. Chem. Phys. 2015, 15, 13059–13069. [Google Scholar] [CrossRef] [Green Version]
- Deng, J.; Zhao, W.; Wu, L.; Hu, W.; Ren, L.; Wang, X.; Fu, P. Black carbon in Xiamen, China: Temporal variations, transport pathways and impacts of synoptic circulation. Chemosphere 2020, 241, 125133. [Google Scholar] [CrossRef]
- Xia, Y.; Wu, Y.; Huang, R.-J.; Xia, X.; Tang, J.; Wang, M.; Li, J.; Wang, C.; Zhou, C.; Zhang, R. Variation in black carbon concentration and aerosol optical properties in Beijing: Role of emission control and meteorological transport variability. Chemosphere 2020, 254, 126849. [Google Scholar] [CrossRef] [PubMed]
- Cheng, Y.; Lee, S.-C.; Ho, K.F.; Wang, Y.Q.; Cao, J.J.; Chow, J.C.; Watson, J. Black carbon measurement in a coastal area of south China. J. Geophys. Res. Space Phys. 2006, 111. [Google Scholar] [CrossRef] [Green Version]
- Zhao, Z.; Wang, Q.; Xu, B.; Shen, Z.; Huang, R.; Zhu, C.; Su, X.; Zhao, S.; Long, X.; Liu, S.; et al. Black carbon aerosol and its radiative impact at a high-altitude remote site on the southeastern Tibet Plateau. J. Geophys. Res. Atmos. 2017, 122, 5515–5530. [Google Scholar] [CrossRef]
- Wang, Q.; Li, L.; Zhou, J.; Ye, J.; Dai, W.; Liu, H.; Zhang, Y.; Zhang, R.; Tian, J.; Chen, Y.; et al. Measurement report: Source and mixing state of black carbon aerosol in the North China Plain: Implications for radiative effect. Atmos. Chem. Phys. 2020, 20, 15427–15442. [Google Scholar] [CrossRef]
- Gong, X.; Zhang, C.; Chen, H.; Nizkorodov, S.A.; Chen, J.; Yang, X. Size distribution and mixing state of black carbon particles during a heavy air pollution episode in Shanghai. Atmos. Chem. Phys. 2016, 16, 5399–5411. [Google Scholar] [CrossRef] [Green Version]
- Smirnov, A.; Holben, B.N.; Slutsker, I.; Giles, D.; McClain, C.R.; Eck, T.F.; Sakerin, S.M.; Macke, A.; Croot, P.; Zibordi, G.; et al. Maritime Aerosol Network as a component of Aerosol Robotic Network. J. Geophys. Res. Space Phys. 2009, 114. [Google Scholar] [CrossRef] [Green Version]
- Moosmüller, H.; Chakrabarty, R.; Arnott, W. Aerosol light absorption and its measurement: A review. J. Quant. Spectrosc. Radiat. Transf. 2009, 110, 844–878. [Google Scholar] [CrossRef]
- Springston, S.R.; Sedlacek, A.J. Noise Characteristics of an Instrumental Particle Absorbance Technique. Aerosol Sci. Technol. 2007, 41, 1110–1116. [Google Scholar] [CrossRef]
- Lee, J. Performance Test of MicroAeth® AE51 at Concentrations Lower than 2 μg/m3 in Indoor Laboratory. Appl. Sci. 2019, 9, 2766. [Google Scholar] [CrossRef] [Green Version]
- Che, H.; Zhang, X.-Y.; Xia, X.; Goloub, P.; Holben, B.; Zhao, H.; Wang, Y.; Wang, H.; Blarel, L.; Damiri, B.; et al. Ground-based aerosol climatology of China: Aerosol optical depths from the China Aerosol Remote Sensing Network (CARSNET) 2002–2013. Atmos. Chem. Phys. 2015, 15, 7619–7652. [Google Scholar] [CrossRef] [Green Version]
- Sun, T.; Che, H.; Qi, B.; Wang, Y.; Dong, Y.; Xia, X.; Wang, H.; Gui, K.; Zheng, Y.; Zhao, H.; et al. Characterization of vertical distribution and radiative forcing of ambient aerosol over the Yangtze River Delta during 2013–2015. Sci. Total Environ. 2019, 650, 1846–1857. [Google Scholar] [CrossRef]
- Li, M.; Zhang, Q.; Kurokawa, J.-I.; Woo, J.-H.; He, K.; Lu, Z.; Ohara, T.; Song, Y.; Streets, D.G.; Carmichael, G.R.; et al. MIX: A mosaic Asian anthropogenic emission inventory under the international collaboration framework of the MICS-Asia and HTAP. Atmos. Chem. Phys. 2017, 17, 935–963. [Google Scholar] [CrossRef] [Green Version]
- Yunfeng, L.; Daren, L.; Xiuji, Z.; Weiliang, L.; Qing, H. Characteristics of the spatial distribution and yearly variation of aerosol optical depth over China in last 30 years. J. Geophys. Res. Space Phys. 2001, 106, 14501–14513. [Google Scholar] [CrossRef]
- Li, Z.; Gu, X.; Wang, L.; Li, D.; Xie, Y.; Li, K.; Dubovik, O.; Schuster, G.; Goloub, P.; Zhang, Y.; et al. Aerosol physical and chemical properties retrieved from ground-based remote sensing measurements during heavy haze days in Beijing winter. Atmos. Chem. Phys. 2013, 13, 10171–10183. [Google Scholar] [CrossRef] [Green Version]
- Yang, X.; Zhao, C.; Zhou, L.; Li, Z.; Cribb, M.; Yang, S. Wintertime cooling and a potential connection with transported aerosols in Hong Kong during recent decades. Atmos. Res. 2018, 211, 52–61. [Google Scholar] [CrossRef]
- Tao, M.; Chen, L.; Wang, Z.; Ma, P.; Tao, J.; Jia, S. A study of urban pollution and haze clouds over northern China during the dusty season based on satellite and surface observations. Atmos. Environ. 2014, 82, 183–192. [Google Scholar] [CrossRef]
- Zhang, R.; Jing, J.; Tao, J.; Hsu, S.-C.; Wang, G.; Cao, J.; Lee, C.S.L.; Zhu, L.; Chen, Z.; Zhao, Y.; et al. Chemical characterization and source apportionment of PM2.5 in Beijing: Seasonal perspective. Atmos. Chem. Phys. 2014, 14, 175. [Google Scholar] [CrossRef] [Green Version]
- Ma, X.; Zhang, H.; Han, G.; Mao, F.; Xu, H.; Shi, T.; Hu, H.; Sun, T.; Gong, W. A Regional Spatiotemporal Downscaling Method for CO₂ Columns. IEEE Trans. Geosci. Remote Sens. 2021, 1–10. [Google Scholar] [CrossRef]
- Zhang, M.; Ma, Y.; Gong, W.; Wang, L.; Xia, X.; Che, H.; Hu, B.; Liu, B. Aerosol radiative effect in UV, VIS, NIR, and SW spectra under haze and high-humidity urban conditions. Atmos. Environ. 2017, 166, 9–21. [Google Scholar] [CrossRef]
- Jin, S.; Ma, Y.; Zhang, M.; Gong, W.; Lei, L.; Ma, X. Comparation of aerosol optical properties and associated radiative effects of air pollution events between summer and winter: A case study in January and July 2014 over Wuhan, Central China. Atmos. Environ. 2019, 218, 117004. [Google Scholar] [CrossRef]
- Cheng, H.; Gong, W.; Wang, Z.; Zhang, F.; Wang, X.; Lv, X.; Liu, J.; Fu, X.; Zhang, G. Ionic composition of submicron particles (PM1.0) during the long-lasting haze period in January 2013 in Wuhan, central China. J. Environ. Sci. 2014, 26, 810–817. [Google Scholar] [CrossRef]
- Xiong, Y.; Zhou, J.; Schauer, J.J.; Yu, W.; Hu, Y. Seasonal and spatial differences in source contributions to PM2.5 in Wuhan, China. Sci. Total Environ. 2017, 577, 155–165. [Google Scholar] [CrossRef]
- Kong, S.; Wen, B.; Chen, K.; Yin, Y.; Li, L.; Li, Q.; Yuan, L.; Li, X.; Sun, X. Ion chemistry for atmospheric size-segregated aerosol and depositions at an offshore site of Yangtze River Delta region, China. Atmos. Res. 2014, 147–148, 205–226. [Google Scholar] [CrossRef]
- Zhang, F.; Cheng, H.; Wang, Z.; Lv, X. Characteristics of Water-soluble Ions in PM_(2.5) During Haze and Non-haze Periods in Autumn in Wuhan. China Powder Sci. Technol. 2013, 138, 2392–2397. [Google Scholar] [CrossRef]
- Ma, Y.; Zhang, M.; Jin, S.; Gong, W.; Chen, N.; Chen, Z.; Jin, Y.; Shi, Y. Long-Term Investigation of Aerosol Optical and Radiative Characteristics in a Typical Megacity of Central China During Winter Haze Periods. J. Geophys. Res. Atmos. 2019, 124, 12093–12106. [Google Scholar] [CrossRef]
- Guan, X.; Wang, M.; Du, T.; Tian, P.; Zhang, N.; Shi, J.; Chang, Y.; Zhang, L.; Zhang, M.; Song, X.; et al. Wintertime aerosol optical properties in Lanzhou, Northwest China: Emphasis on the rapid increase of aerosol absorption under high particulate pollution. Atmos. Environ. 2021, 246, 118081. [Google Scholar] [CrossRef]
- Holben, B.; Eck, T.; Slutsker, I.; Tanré, D.; Buis, J.; Setzer, A.; Vermote, E.; Reagan, J.; Kaufman, Y.; Nakajima, T.; et al. AERONET—A Federated Instrument Network and Data Archive for Aerosol Characterization. Remote Sens. Environ. 1998, 66, 1–16. [Google Scholar] [CrossRef]
- Che, H.; Zhang, X.-Y.; Chen, H.; Damiri, B.; Goloub, P.; Li, Z.; Zhang, X.; Wei, Y.; Zhou, H.; Dong, F.; et al. Instrument calibration and aerosol optical depth validation of the China Aerosol Remote Sensing Network. J. Geophys. Res. Atmos. 2009, 114. [Google Scholar] [CrossRef]
- Hess, M.; Koepke, P.; Schult, I. Optical Properties of Aerosols and Clouds: The Software Package OPAC. Bull. Am. Meteorol. Soc. 1998, 79, 831–844. [Google Scholar] [CrossRef]
- Weingartner, E.; Saathoff, H.; Schnaiter, M.; Streit, N.; Bitnar, B.; Baltensperger, U. Absorption of light by soot particles: Determination of the absorption coefficient by means of aethalometers. J. Aerosol Sci. 2003, 34, 1445–1463. [Google Scholar] [CrossRef]
- Lyamani, H.; Olmo, F.; Alados-Arboledas, L.; Reyes, F.J.O. Light scattering and absorption properties of aerosol particles in the urban environment of Granada, Spain. Atmos. Environ. 2008, 42, 2630–2642. [Google Scholar] [CrossRef]
- Hersbach, H.; Bell, B.; Berrisford, P.; Hirahara, S.; Horanyi, A.; Muñoz-Sabater, J.; Nicolas, J.; Peubey, C.; Radu, R.; Schepers, D.; et al. The ERA5 global reanalysis. Q. J. R. Meteorol. Soc. 2020, 146, 1999–2049. [Google Scholar] [CrossRef]
- Winker, D.M.; Vaughan, M.A.; Omar, A.; Hu, Y.; Powell, K.A.; Liu, Z.; Hunt, W.H.; Young, S. Overview of the CALIPSO Mission and CALIOP Data Processing Algorithms. J. Atmos. Ocean. Technol. 2009, 26, 2310–2323. [Google Scholar] [CrossRef]
- Winker, D.M.; Tackett, J.L.; Getzewich, B.J.; Liu, Z.; Vaughan, M.A.; Rogers, R.R. The global 3-D distribution of tropospheric aerosols as characterized by CALIOP. Atmos. Chem. Phys. 2013, 13, 3345–3361. [Google Scholar] [CrossRef] [Green Version]
- Ministry of Environmental Protection. Ambient Air Quality Standards; GB 3095−2012; 2012. Available online: https://www.transportpolicy.net/standard/china-air-quality-standards/ (accessed on 15 November 2020).
- Smirnov, A.; Holben, B.; Eck, T.; Dubovik, O.; Slutsker, I. Cloud-Screening and Quality Control Algorithms for the AERONET Database. Remote Sens. Environ. 2000, 73, 337–349. [Google Scholar] [CrossRef]
- Dubovik, O.; King, M.D. A Flexible Inversion Algorithm for Retrieval of Aerosol Optical Properties from Sun and Sky Radiance Measurements. J. Geophys. Res. Atmos. 2000, 105, 20673. [Google Scholar] [CrossRef] [Green Version]
- Dubovik, O.; Holben, B.; Eck, T.F.; Smirnov, A.; Kaufman, Y.J.; King, M.D.; Tanré, D.; Slutsker, I. Variability of Absorption and Optical Properties of Key Aerosol Types Observed in Worldwide Locations. J. Atmos. Sci. 2002, 59, 590–608. [Google Scholar] [CrossRef]
- Eck, T.F.; Holben, B.N.; Reid, J.S.; Dubovik, O.; Smirnov, A.; O’Neill, N.T.; Slutsker, I.; Kinne, S. Wavelength Dependence of the Optical Depth of Biomass Burning, Urban, and Desert Dust Aerosols. J. Geophys. Res. Atmos. 1999, 104, 31333–31349. [Google Scholar] [CrossRef]
- Estellés, V.; Campanelli, M.; Smyth, T.J.; Utrillas, M.P.; Martínez-Lozano, J.A. Evaluation of the new ESR network software for the retrieval of direct sun products from CIMEL CE318 and PREDE POM01 sun-sky radiometers. Atmos. Chem. Phys. 2012, 12, 11619–11630. [Google Scholar] [CrossRef] [Green Version]
- Bibi, S.; Alam, K.; Chishtie, F.; Bibi, H.; Rahman, S. Observations of black carbon aerosols characteristics over an urban environment: Radiative forcing and related implications. Sci. Total Environ. 2017, 603-604, 319–329. [Google Scholar] [CrossRef]
- Koepke, P.; Gasteiger, J.; Hess, M. Technical Note: Optical properties of desert aerosol with non-spherical mineral particles: Data incorporated to OPAC. Atmos. Chem. Phys. 2015, 15, 5947–5956. [Google Scholar] [CrossRef] [Green Version]
- Zhang, M.; Fan, R.; Ma, Y.; Gong, W.; Shi, Y. Atmospheric aerosol and black carbon optical properties and associated radiative forcing under haze conditions. J. Quant. Spectrosc. Radiat. Transf. 2021, 259, 107390. [Google Scholar] [CrossRef]
- Stamnes, K.; Tsay, S.; Istvan, L. DISORT, a General-Purpose Fortran Program for Discrete-Ordinate-Method Radiative Transfer in Scattering and Emitting Layered Media: Documentation of Methodology. 2000. Available online: http://web.gps.caltech.edu/~vijay/Papers/RT%20Models/DISORT%20Report.pdf (accessed on 15 November 2020).
- Susskind, J.; Blaisdell, J.M.; Iredell, L. Improved methodology for surface and atmospheric soundings, error estimates, and quality control procedures: The atmospheric infrared sounder science team version-6 retrieval algorithm. J. Appl. Remote Sens. 2014, 8, 084994. [Google Scholar] [CrossRef]
- Moody, E.; King, M.; Platnick, S.; Schaaf, C.; Gao, F. Spatially complete global spectral surface albedos: Value-added datasets derived from Terra MODIS land products. IEEE Trans. Geosci. Remote Sens. 2005, 43, 144–158. [Google Scholar] [CrossRef]
- García, O.E.; Díaz, J.P.; Expósito, F.J.; Díaz, A.M.; Dubovik, O.; Derimian, Y.; Dubuisson, P.; Roger, J.-C. Shortwave radiative forcing and efficiency of key aerosol types using AERONET data. Atmos. Chem. Phys. 2012, 12, 5129–5145. [Google Scholar] [CrossRef] [Green Version]
- Streets, D.G.; Gupta, S.; Waldhoff, S.T.; Wang, M.Q.; Bond, T.C.; Bo, Y. Black carbon emissions in China. Atmos. Environ. 2001, 35, 4281–4296. [Google Scholar] [CrossRef]
- Cao, G.; Zhang, X.-Y.; Zheng, F. Inventory of black carbon and organic carbon emissions from China. Atmos. Environ. 2006, 40, 6516–6527. [Google Scholar] [CrossRef]
- Jing, A.; Zhu, B.; Wang, H.; Yu, X.; An, J.; Kang, H. Source apportionment of black carbon in different seasons in the northern suburb of Nanjing, China. Atmos. Environ. 2019, 201, 190–200. [Google Scholar] [CrossRef]
- Wang, L.; Gong, W.; Li, C.; Lin, A.; Hu, B.; Ma, Y. Measurement and estimation of photosynthetically active radiation from 1961 to 2011 in Central China. Appl. Energy 2013, 111, 1010–1017. [Google Scholar] [CrossRef]
- Yuan, W.; Yu, R.; Chen, H.; Li, J.; Zhang, M. Subseasonal Characteristics of Diurnal Variation in Summer Monsoon Rainfall over Central Eastern China. J. Clim. 2010, 23, 6684–6695. [Google Scholar] [CrossRef]
- Chen, W.; Wang, Z.; Zhao, H.; Qin, K. A novel way to calculate shortwave black carbon direct radiative effect. Sci. Total Environ. 2021, 756, 142961. [Google Scholar] [CrossRef] [PubMed]
- Wu, Y.; Zhu, J.; Che, H.; Xia, X.; Zhang, R. Column-integrated aerosol optical properties and direct radiative forcing based on sun photometer measurements at a semi-arid rural site in Northeast China. Atmos. Res. 2015, 157, 56–65. [Google Scholar] [CrossRef]
- Lyu, X.-P.; Wang, Z.-W.; Cheng, H.-R.; Zhang, F.; Zhang, G.; Wang, X.; Ling, Z.-H.; Wang, N. Chemical characteristics of submicron particulates (PM1.0) in Wuhan, Central China. Atmos. Res. 2015, 161–162, 169–178. [Google Scholar] [CrossRef]
- Zhang, M.; Jin, S.; Ma, Y.; Fan, R.; Wang, L.; Gong, W.; Liu, B. Haze events at different levels in winters: A comprehensive study of meteorological factors, Aerosol characteristics and direct radiative forcing in megacities of north and central China. Atmos. Environ. 2021, 245, 118056. [Google Scholar] [CrossRef]
- Che, H.; Qi, B.; Zhao, H.; Xia, X.; Eck, T.F.; Goloub, P.; Dubovik, O.; Estelles, V.; Cuevas-Agulló, E.; Blarel, L.; et al. Aerosol optical properties and direct radiative forcing based on measurements from the China Aerosol Remote Sensing Network (CARSNET) in eastern China. Atmos. Chem. Phys. 2018, 18, 405–425. [Google Scholar] [CrossRef] [Green Version]
- Li, Z.Q.; Xu, H.; Li, K.T.; Li, D.H.; Xie, Y.S.; Li, L.; Zhang, Y.; Gu, X.F.; Zhao, W.; Tian, Q.J.; et al. Comprehensive Study of Optical, Physical, Chemical, and Radiative Properties of Total Columnar Atmospheric Aerosols over China: An Overview of Sun–Sky Radiometer Observation Network (SONET) Measurements. Bull. Am. Meteorol. Soc. 2018, 99, 739–755. [Google Scholar] [CrossRef]
- Novakov, T.; Hegg, D.A.; Hobbs, P.V. Airborne measurements of carbonaceous aerosols on the East Coast of the United States. J. Geophys. Res. Space Phys. 1997, 102, 30023–30030. [Google Scholar] [CrossRef]
- Menon, S.; Hansen, J.; Nazarenko, L.; Luo, Y. Climate Effects of Black Carbon Aerosols in China and India. Science 2002, 297, 2250–2253. [Google Scholar] [CrossRef] [PubMed] [Green Version]
- Sokolik, I.N.; Toon, O.B. Incorporation of mineralogical composition into models of the radiative properties of mineral aerosol from UV to IR wavelengths. J. Geophys. Res. Atmos. 1999, 104, 9423–9444. [Google Scholar] [CrossRef]
- Feng, Y.; Ramanathan, V.; Kotamarthi, V.R. Brown carbon: A significant atmospheric absorber of solar radiation? Atmos. Chem. Phys. 2013, 13, 8607–8621. [Google Scholar] [CrossRef] [Green Version]
- Eck, T.F.; Holben, B.N.; Sinyuk, A.; Pinker, R.; Goloub, P.; Chen, H.; Chatenet, B.; Li, Z.; Singh, R.P.; Tripathi, S.N.; et al. Climatological aspects of the optical properties of fine/coarse mode aerosol mixtures. J. Geophys. Res. Atmos. 2010, 115. [Google Scholar] [CrossRef] [Green Version]
- Sinha, P.R.; Kaskaoutis, D.G.; Manchanda, R.K.; Sreenivasan, S. Characteristics of aerosols over Hyderabad in southern Peninsular India: Synergy in the classification techniques. Ann. Geophys. 2012, 30, 1393–1410. [Google Scholar] [CrossRef] [Green Version]
- Hoppel, W.A.; Fitzgerald, J.W.; Larson, R.E. Aerosol size distributions in air masses advecting off the east coast of the United States. J. Geophys. Res. Atmos. 1985, 90, 2365–2379. [Google Scholar] [CrossRef]
- Zhuang, B.; Wang, T.; Li, S.; Liu, J.; Talbot, R.; Mao, H.; Yang, X.; Fu, C.; Yin, C.; Zhu, J.; et al. Optical properties and radiative forcing of urban aerosols in Nanjing, China. Atmos. Environ. 2014, 83, 43–52. [Google Scholar] [CrossRef] [Green Version]
- Yu, X.; Lü, R.; Liu, C.; Yuan, L.; Shao, Y.; Zhu, B.; Lei, L. Seasonal variation of columnar aerosol optical properties and radiative forcing over Beijing, China. Atmos. Environ. 2017, 166, 340–350. [Google Scholar] [CrossRef]
- Zhang, Y.; Zhang, Q.; Cheng, Y.; Su, H.; Li, H.; Li, M.; Zhang, X.; Ding, A.; He, K. Amplification of light absorption of black carbon associated with air pollution. Atmos. Chem. Phys. 2018, 18, 9879–9896. [Google Scholar] [CrossRef] [Green Version]
- Xu, X.; Zhao, W.; Qian, X.; Wang, S.; Fang, B.; Zhang, Q.; Zhang, W.; Venables, D.S.; Chen, W.; Huang, Y.; et al. The influence of photochemical aging on light absorption of atmospheric black carbon and aerosol single-scattering albedo. Atmos. Chem. Phys. 2018, 18, 16829–16844. [Google Scholar] [CrossRef] [Green Version]
- Tian, P.; Zhang, L.; Ma, J.; Tang, K.; Xu, L.; Wang, Y.; Cao, X.; Liang, J.; Ji, Y.; Jiang, J.H.; et al. Radiative absorption enhancement of dust mixed with anthropogenic pollution over East Asia. Atmos. Chem. Phys. 2018, 18, 7815–7825. [Google Scholar] [CrossRef] [Green Version]
- Liu, D.; Whitehead, J.; Alfarra, R.; Reyes-Villegas, E.; Spracklen, D.V.; Reddington, C.; Kong, S.; Williams, P.; Ting, Y.-C.; Haslett, S.; et al. Black-carbon absorption enhancement in the atmosphere determined by particle mixing state. Nat. Geosci. 2017, 10, 184–188. [Google Scholar] [CrossRef]


Publisher’s Note: MDPI stays neutral with regard to jurisdictional claims in published maps and institutional affiliations. |
© 2021 by the authors. Licensee MDPI, Basel, Switzerland. This article is an open access article distributed under the terms and conditions of the Creative Commons Attribution (CC BY) license (https://creativecommons.org/licenses/by/4.0/).